
Submitted:
12 January 2026
Posted:
15 January 2026
You are already at the latest version
Abstract
Background: The limited aqueous solubility of basic drugs poses significant challenges for oral bioavailability, necessitating a different formulation approach. This study utilizes acidic or non-ionic polymers (its aqueous solution close to acidic-neutral pH) to stabilize a basic drug via drug-polymer interaction. Due to acid-base super solubilization effects, amorphous solid dispersions (ASDs) have good recrystallization inhibition, and improved dissolution and stability. Methods: To prepare nimodipine, a model drug, solid dispersion, spray–drying and melt–quenching techniques were used with carriers like HPC, HPMCAS, HPMCP, and PVP K25 polymers. Drug-polymer miscibility or interaction was carefully evaluated with different modeling to reduce processing temperature and inhibit recrystallization. Results: Based on preparation methods, there were two ASD types: one with a small particle size and low bulk density (spray–drying) and the other with big particle size and high bulk density, prepared at a low temperature to minimize degradation (melt–quenching). The solid–state analysis revealed a low glass transition temperature (Tg), suggesting amorphous forms. The surface morphology of nimodipine and its solid dispersions demonstrated a uniform and consistent system. Nimodipine with HPMCP via spray–drying (NIM.CP.SM) exhibited the highest drug release (89.51%) in phosphate buffer (pH 6.0) after 2 h without recrystallization. The in vivo pharmacokinetic profiles demonstrated a 33–fold increase in Cmax and a 15–fold increase in AUC0–∞ with NIM.CP.SM. Conclusions: These findings suggest that an HPMCP–based polymer combined with spray–drying technique produces a thermodynamically and physico-chemically stable ASD with enhanced in vitro and in vivo drug release.
Keywords:
amorphous solid dispersions
; spray–drying
; melt–quenching
; bioavailability
; drug-polymer interaction
; thermodynamic stability
Introduction
Amorphous solid dispersion (ASD) can be a promising strategy for addressing the persistent challenge of poor aqueous solubility by dispersing drugs in carrier polymers [1]. This approach is effective for enhancing the solubility, dissolution, and bioavailability of poorly water-soluble drugs, particularly those classified as BCS Class II or IV. The amorphous form lacks an ordered crystalline lattice, resulting in higher energy and wettability than that of the crystalline form. The polymer carrier plays a critical role by stabilizing the amorphous drug, preventing recrystallization during storage and in the gastrointestinal tract, and maintaining drug supersaturation, which enhances absorption [2,3]. Several manufacturing strategies are used for preparing ASDs; however, spray–drying and melt–quenching methods are one of the feasible strategies, utilizing high shear and elevated temperatures to produce molecularly dispersed drug–polymer systems [4].
In the spray–drying method, the drug–polymer solution is atomized into fine droplets within a heated chamber, with rapid evaporation producing uniform particles [5]. In the melt–quenching method, carrier polymers are melted below their degradation temperature, followed by drug addition to the molten mass, thoroughly mixed, and rapidly cooled [6]. Drug loading is also crucial for distributing drug-polymers, drug release kinetics, and thermal stability during long-term storage [7]. Using DSC thermograms, the screening of drug loading can be evaluated, with the higher drug content exhibiting sharper endothermic peaks than the lower drug loading [8]. Consequently, selecting an appropriate polymer is important for enhancing solubility and preventing undesirable drug precipitation and phase separation.
In this study, we investigated the ASD of nimodipine (NIM), a drug used to prevent and treat ischemic neurologic disorders and subarachnoid hemorrhage caused by ruptured blood vessels in the brain. NIM belongs to BCS Class II and can permeate cell membranes easily. Its dissolution is the rate-limiting step for systemic absorption [9]. Owing to its poor aqueous solubility (0.012 µ/mL) and high lipophilicity (log P 3.41), NIM exhibits low bioavailability following oral administration [10,11]. The carrier polymers hydroxypropyl methylcellulose acetate succinate (HPMCAS) and hydroxypropyl methylcellulose phthalate (HPMCP) stabilize the amorphous state more effectively than the hydroxypropyl cellulose (HPC) and polyvinylpyrrolidone (PVP K25) [12]. These cellulosic polymers interact with the drug by forming hydrogen bonds, thereby reducing molecular mobility. Additionally, this polymer stabilizes the amorphous state by inhibiting crystal growth and slowing phase separation. The optimized drug–polymer ratio was selected based on physicochemical properties and drug release performances [13,14]. Studies investigating the comparative manufacturing approach and the effect of various polymers on the preparation of NIM solid dispersions are limited and hence this study focuses on preparing a stable NIM solid dispersion to achieve enhanced solubility.
This study aims to investigate the potential of various polymers and manufacturing approaches on the release profile and crystallization of NIM solid dispersions together with in vitro and in vivo performance. Firstly, it is necessary to identify the polymer that best prevents recrystallization of solid dispersion. There are various polymers available commercially and challenges arise in achieving uniform distribution, compatibility, and stronger intermolecular interactions between the drug and polymers. Secondly, it is to understand the effect of preparation methods on drug–polymer miscibility, solubility, particle size of dispersions, and molecular distribution. The physical stability of solid dispersions is important to maintain amorphous form and it is also important to identify suitable preparation methods. The acidic dissolution media could promote recrystallization and inhibit supersaturation during the in vitro drug release. Hence, in vitro drug release was performed in different pH. Furthermore, solid-state characterization, drug–polymer interaction, solubility, glass transition temperature (Tg), bioanalytical method development, and in vivo pharmacokinetic evaluations were performed as well.
2. Materials and Methods
2.1. Materials
Nimodipine (MW 418.8 g/mol) was purchased from Lusochimica S.p.A (Lomagna, LC, Italy). HPC (LS–11 grade, MW 140,000 g/mol), HPMCAS (M grade, MW 18,000 g/mol), and HPMCP (HP–50 grade, MW 78,000 g/mol) were provided by Shin–Etsu Chemical Co., Ltd. (Tokyo, Japan). PVP (K25 grade, MW 28,000 to 35,000 g/mol) was supplied from BASF (Ludwigshafen, Germany). Formic acid and lovastatin were purchased from Sigma–Aldrich (St. Louis, MO, USA). HPLC–grade water and methanol (MeOH), alongside acetone and dichloromethane were purchased from J.T. Baker® (Phillipsburg, NJ, USA). All other reagents were of analytical grade and used as received.
2.2. Drug–Polymer Miscibility
The drug–polymer miscibility is well understood in polymer science where each polymer component is amorphous in a stable state. The major complexity around the miscibility of ASD is that the amorphous drug is usually meta-stable and tends to recrystallize. Therefore, the composition of a system in equilibrium with regard to recrystallization would be the solubility of the crystalline drug in the polymer [15]. The miscibility in the ASD is associated with a meta-stable equilibrium and requires the drug to stay in super-cooled liquid state without recrystallization within the experimental time frame. It is measured mainly using thermal analysis (DSC for Tg), microscopy (AFM and SEM), and spectroscopy (NMR, FTIR, and Raman) to assess phase behavior and interactions in solid dispersions. Typical methods would Hansen solubility parameter, Gordon–Taylor equation, Flory−Huggins interaction parameters ( and melting point depression [16].
Hansen solubility parameter predictions were utilized to estimate drug–polymer (D/P) miscibility using the van Krevelen and Hoftyzer group contribution method [17]. Hansen solubility parameters (δ) utilized the group contribution method in drug–polymer systems based on different chemical fragments and their contribution to molecular forces and molar volume. Three primary Hansen parameters were calculated for each molecule: (i) dispersion forces (, (ii) dipolar intermolecular forces (, and hydrogen bonding energy ( The total Hansen solubility parameter ( was calculated by combining these parameters, as shown in equation (1).
These forces were determined using equation (2), where represents the dispersion forces, denotes the polar forces, is the hydrogen bond energy, and represents the group contribution to molar volume.
Gordon–Taylor equation (3) predicted the miscibility of drug in polymers theoretically based on the shift in the melting endotherm, Tg values, and weight fractions of the individual components. In this equation, is the glass transition temperature of the drug, and are the weight fractions of the component (drug and polymer), and is a constant calculated using the Simha–Boyer rule based on the true densities of the drug and polymer [18]. The true densities of the components were determined using a helium gas displacement pycnometer (Accupyc 1330, Micromeritics, Norcross, GA, USA).
Flory–Huggins interaction parameter ( was used to evaluate drug–polymer miscibility and solubility based on thermodynamic principles. The parameters ( for drug–polymer systems were determined from the difference between the solubility parameters of the drugs and polymers, calculated using equation (3). In contrast, represents the melting temperature of the solid dispersion, is the melting temperature of the drug, denotes the heat of fusion of the drug, is the volume ratio of polymer to drug, and and are the volume fractions of the drug and polymer [19].
2.3. Sample Preparation
Samples including physical mixtures were prepared using trituration, spray–drying, and melt–quenching methods. The physical mixtures of drug–polymer was prepared using a mortar and pestle. The components were manually triturated for 5 min, and the final blend was passed through a sieve (Sieve No. 40). Drug-to-polymer ratios were of 1:1, 1:2, 1:3, and 1:4, and the resulting samples were stored in airtight Eppendorf tubes until further analysis [20,21].
Another method was spray–drying with a Mini Spray Dryer (Buchi Corp., Newcastle, DE, USA). NIM (0.25 g) and each polymer (0.75 g) were dissolved in a 1:1 (v/v) mixture of acetone and dichloromethane at a solid content of 10%. The spray-drying was conducted under nitrogen gas at a flow rate of 700 L/h, with an aspirator setting of 35 m3/h and a feed rate of 3 mL/min [22]. The other method was melt–quenching. Each polymer (0.75 g) was melted at approximately 180 °C on a hotplate stirrer (MSH–20A; Daihan Scientific Co. Ltd., Wonju, Korea), and NIM (0.25 g) was added to the molten polymer. Following thorough mixing, the hot liquid dispersion was immediately transferred to a refrigerator (DF8510; IlShin BioBase Co. Ltd., Dongducheon, Korea) at a temperature of –30 °C for 2 h and then vacuum–dried at room temperature overnight (Isotemp® 280A, Fisher Scientific, MO, USA) to remove residual solvent [23]. The particle size of the solid dispersion was reduced using a ball mill (Pulverisette 23, Fritsch GmbH., Idar–Oberstein, Germany) to achieve samples with size range of 180−250 µm.
The optimized drug-to-polymer ratio (1:3) was chosen for the preparation of solid dispersions, as no detectable recrystallization was observed during analysis of the individual drug–polymer systems. This ratio was determined using DSC, where the mixtures at different ratios were heated to 200 °C at a scan rate of 10 °C/min. The absence of sharp melting endothermic events suggested that ratios at or below 1:3 did not exhibit detectable crystallization.
2.4. Thermodynamic Properties
The drug and ASDs were analyzed using a differential scanning calorimetry, DSC Q2000 (TA Instrument, New Castle, DE, USA). Approximately 2 mg of sample was placed in a Tzero aluminum pan crimped with a pierced lid and scanned over a temperature range of 20−200 °C at a heating rate of 10 °C/min, while purged with nitrogen gas at 50 mL/min. An empty Tzero aluminum pan with a pierced lid was used as the reference. The instrument was calibrated using indium as a standard [24,25]. Thermodynamic parameters, including To (onset temperature), Tg (glass transition temperature), Tm (melting temperature), and Te (endset temperature), were determined using TA Universal Analysis 2000 software (Version 4.5A, TA Instruments, New Castle, DE, USA).
2.5. Spectroscopic Measurement
The possible drug–polymer interactions were investigated using a Fourier–transform infrared (FTIR) spectrometer (Nicolet iS5, Thermo–Fisher Scientific, Waltham, MA, USA) [26]. The samples were crushed before analysis, and a small quantity of each sample was placed at the center of the diamond ATR crystal. A stainless–steel pressure bar was positioned over the sample and tightened with a screw to ensure optimal contact with the powder. The IR spectra of all ASDs were recorded with an average of 64 scans over a spectral range of 4000–500 cm−1 with a resolution of 4 cm−1. The most suitable polymers were identified based on the presence, shift, or disappearance of characteristic peaks in the ASDs [27].
2.6. Water Content with Thermogravimetric Analysis
The percentage moisture content of each sample was determined using a thermogravimetric analyzer (TGA; Pyris TGA N–1000, Scinco, Korea). Approximately 5 mg of the sample was accurately weighed and placed into an aluminum pan, which was heated from 20−200 °C at a constant rate of 10 °C/min. The weight loss during the heating process was recorded and analyzed to quantify the moisture content in the sample [28].
2.7. Crystalline Properties
The crystalline properties of ASDs were analyzed using an X–ray diffractometer (Ultima IV, Rigaku Corp., Tokyo, Japan) with a scintillation counter detector and Cu–Kα radiation (λ = 1.5409 Å) operated at 40 kV and 30 mA. Approximately 1 mg of each sample was placed on a zero-background (0–BG) sample holder. Data were obtained at a scanning speed of 3°/min over an angular range 5 to 45° (2θ) with a step size of 0.02° [29]. Crystallinity was calculated by dividing the area of the crystalline peak by the total area of the powder X–ray diffractometry (PXRD) spectrum using OriginPro 9.0 (OriginLab Corporation, Northampton, MA, USA) [30,31].
2.8. Scanning Electron Microscope (SEM)
The surface morphology of NIM and its corresponding solid dispersions was examined using a field emission scanning electron microscope (Clara LMH, Tescan, Brno, Czech Republic) operated at 15 kV and equipped with an Everhart–Thornley (ETH) detector. Each sample was mounted on an aluminum stub using double–sided adhesive carbon tape. Prior to imaging, samples were sputter–coated with a thin layer of gold for approximately 40 s under vacuum in an argon atmosphere to enhance the conductivity and image resolution [32].
2.9. Solubility
The saturation solubility was evaluated across a pH range of 3.0−6.8. Subsequently, 2 mL of each pH solution was transferred into an individual vial, and an excess amount of drug (approximately 5 mg) was gradually added and vortexed until no further dissolution occurred. All vials were shaken for 48 h at 75 rpm and 37 °C using a multi–mixer (SLRM–N1.5, Seongnam, Gyeonggi, Korea) and subsequently left undisturbed for 6 h to reach equilibrium. The suspensions were centrifuged at 13,000 rpm for 30 min (Centrifuge 5420, Eppendorf AG, Hamburg, Germany) to separate undissolved drug. The supernatant was collected, diluted with the corresponding buffer, and the drug concentration was quantified using a UV–Vis spectrophotometer at 238 nm [33].
2.10. In Vitro Dissolution
The drug release profiles or dissolution were evaluated using a USP Apparatus II dissolution tester (Varian 705, Cary, NC, USA). A reference sample containing 10 mg of NIM and a solid dispersion equivalent to 10 mg were dispersed in 700 mL of phosphate buffer (pH 5.0, 6.0, and 6.8) maintained at 37 ± 0.5 °C with a stirring speed of 75 rpm. At predetermined time intervals (5, 10, 15, 30, 45, 60, 90, and 120 min), 2 mL aliquots were withdrawn and filtered through a 0.45 μm membrane to remove undissolved particles. The absorbance of filtrate was measured at 238 nm using a UV–Vis spectrophotometer (Optizen, Seoul, Korea), and the percentage of drug release was calculated using linear regression equations derived from calibration curves prepared in the respective release media [34,35].
The in vitro release profiles of the drug and its solid dispersion were evaluated using percentage dissolution efficiency (DE) and mean dissolution time (MDT). Mathematical modeling of the release profiles was performed using DD solver software. Model parameters were determined, and the best-fit model was selected by comparing the correlation coefficient (R²), model selection criteria (MSC), and Akaike information criterion (AIC). The experiment was conducted under three pH conditions (5.0, 6.0, and 6.8) to simulate the gastrointestinal tract [31].
2.11. In Vivo Pharmacokinetics
The in vivo pharmacokinetic studies of NIM, physical mixture, and solid dispersion were conducted in male Sprague–Dawley rats housed at 23 ± 2 °C, 50 ± 5% relative humidity, under a 12 h dark/light cycle. The study protocol was approved by the Institutional Animal Care and Use Committee (IACUC) of Mokpo National University, Republic of Korea (Approval no. MNU–IACUC–2025–015). Sixteen 2–month–old rats (average weight 260.54 ± 25.00 g) were divided into four groups. The rats were fed a standard diet with free access to drinking water. All rats were fasted for 12 h before the experiment, with free access to drinking water. Group 1 received an oral gavage of control NIM (60 mg/kg body weight), whereas Group 2, Group 3 and Group 4 received an oral gavage of the respective physical mixture, NIM.CP.SM, and NIM.CP.HM (240 mg/kg body weight) using a feeding needle or tube.
Approximately 250 µL blood was collected from the oculi chorioideae vein at pre-dose and at 0.25, 0.5, 2.5, 3, 4, 8, 12, and 24 h post–administration. Blood samples were collected using polyethylene tubes, immediately transferred into the sodium heparin Eppendorf tubes and centrifuged at 10,000×g for 10 min. The resulting plasma was carefully separated and stored at −70 °C until further analysis [36,37]. Pharmacokinetic parameters included peak plasma concentration (Cmax), time to peak concentration (Tmax), area under the plasma concentration (AUC) vs. time curve from dosing to the last quantifiable concentration (AUC0–24), AUC from 0 h to infinity (AUC0–∞), and terminal half–life (t1/2).
2.12. Statistical Analysis
Experiments were performed in triplicate and reported as mean ± standard deviation (SD). Statistical analysis was performed using Microsoft Excel (Microsoft Corporation, Malvern, PA, USA), with the DDSolver Add-In program. Mean comparisons were conducted using Student’s t-test. p-value < 0.05 was considered statistically significant.
3. Results and Discussion
3.1. Drug–Polymer Miscibility
Before designing ASD, it may require information on the miscibility of the drug within the polymeric matrix and the thermodynamic miscibility of NIM with various polymers was investigated by calculating the Hansen solubility parameter using the van Krevelen and Hoftyzer group contribution method. In this method, a drug and a polymer are considered miscible if their solubility parameter differs by less than 7 MPa0.5, or if both compounds have similar values. In contrast, a system is immiscible if exceeds 10 MPa0.5. The estimated solubility parameters of NIM, HPC, HPMCAS, HPMCP, and PVP K25 calculated using the Hansen group contribution theory (Table 1). NIM with HPC, HPMCAS, HPMCP, and PVP K25 showed values ranging from 0.22–3.23 MPa0.5, below the 7 MPa0.5 threshold, suggesting favorable miscibility.
Moreover, the drug was physically mixed with various polymer ratios, and the resulting thermograms were evaluated. The observations might suggest that the crystalline drug dissolves into the polymer at low drug loading ratios (Figure 1). The endothermic peak of the drug in all the physical mixtures broadened and shifted to lower temperatures with decreasing drug concentration. The melting point (Tm) was not observed at a D/P ratio < 1:3. Therefore, a D/P ratio of 1:3 was selected for ASD preparation. This was supported by Flory–Huggins analysis using the melting–mixing method and melting point depression (Figure 1S). The model ( used equation (4) to determine drug–polymer solubility parameters. This equation indicates that corresponds to unfavorable drug–polymer interaction. Conversely, indicates stronger favorable interactions at the micro level. However, the interaction values for NIM with HPC, HPMCAS, HPMCP, and PVP K25 (Table 2) are below 0.5/M, indicating miscibility between the drug and polymers.
On the other hand, incomplete miscibility may lead to the formation of concentrated drug domains, resulting in recrystallization and phase separation. The Gordon–Taylor equation suggests that a binary mixture of drug–polymer exhibits a single Tg that ranges between the Tg of the polymer and melting point of the drug (Table 3). The calculated Tg with the equation was similar to the experimental Tg values.
3.2. Thermodynamic Evaluation
DSC was used to determine the physical properties of NIM and to investigate potential drug–polymer interactions in ASDs prepared by spray–drying and melt–quenching. Figure 1 shows the DSC thermograms of NIM and its solid dispersions with HPC, HPMCAS, HPMCP, and PVP, prepared using the spray–drying method. NIM exhibited a sharp endothermic peak at 124.92 °C, confirming its crystalline property [37]. Figure 1a shows the thermograms of NIM.HP.SM, NIM.AS.SM, NIM.CP.SM, and NIM.PK.SM, suggesting that the drug was solubilized in the polymer and converted to the amorphous state. Figure 1b illustrates the NIM thermogram and its solid dispersion prepared using the melt–quenching method. The thermograms of NIM.HP.HM, NIM.AS.HM, and NIM.CP.HM showed no melting peaks, indicating that the drug was miscible with the polymers. However, NIM.PK.HM thermogram exhibited peak broadening due to the highly hygroscopic nature of PVP K25, where the drug gets trapped into its polymer matrix (amorphous state) without melting and remain thermodynamically stable at a lower humidity [38]. The thermogram revealed a single Tg for each solid dispersion, located below the Tm of NIM and Tg of polymers, suggesting that spray– drying produced homogeneous and uniform solid dispersion [39]. Additionally, the DSC thermogram showed no notable change in peaks or thermodynamic events (Table 4).
3.3. Spectroscopic Evaluation
The potential drug–polymer interactions within ASD were investigated using FTIR spectroscopy. The IR spectra were properly labeled (Figure 2a,b). The IR spectra of crystalline NIM showed an N–H stretching vibration at 3293 cm−1, confirming the presence of hydrogen bonding associated with the pyridine ring and carboxylic acid groups. Conversely, the N–H stretching vibration was absent in the spectra of NIM.AS.SM, NIM.CP.SM, NIM.PK.SM, NIM.AS.HM, NIM.CP.HM, and NIM.PK.HM solid dispersions. This suggests that the N–H bonds are involved in inter-molecular hydrogen bonding with the polymer matrix. The aromatic and aliphatic C–H stretching vibration at 2981 cm−1 was attributed to NIM. The IR spectra of the solid dispersion (NIM.HP.SM, NIM.CP.SM, NIM.PK.SM, NIM.AS.HM, NIM.HP.HM, NIM.CP.HM, and NIM.PK.HM) showed broader peaks shifted to lower wavenumbers. The slight shift in specific vibrational bands across the solid dispersions confirms crystalline lattice disruption and molecular dispersion induced by the polymer. The carbonyl C=O stretching band of NIM appeared at 1691 cm−1. The FTIR spectra of NIM.HP.SM, NIM.AS.SM, NIM.CP.SM, NIM.AS.HM, NIM.HP.HM, NIM.CP.HM, and solid dispersion showed a shift to higher wavenumbers, whereas NIM.PK.SM, NIM.PK.HM exhibited a more intense peak. The C=C bending vibration of the aromatic ring and nitro groups was observed in the 1550–1710 cm−1. Other functional groups, including CH3 bending, nitro groups and substituents, showed vibration in the 1344–1118 cm−1 (Table 5).
In the FTIR spectra of solid dispersion, these vibration bands appeared at similar region but with narrower and lower intensity [40]. The drug–polymer interactions and molecular mobility in the dispersion system slightly shifted specific intensities compared to the NIM spectrum. A few FTIR spectra showed peak shifting due to crystalline structure disruption and electrostatic effects of the polymer. Additionally, no significant changes were observed in the spectra of the solid dispersion compared to NIM.
3.4. Effect of Water Content on Stability
Water content can affect Tg of ASD as it can play a role similar to plasticizers, increase molecular mobility, promote recrystallization, and cause phase separation [38]. The moisture may affect hydrogen bonds and hence drug-polymer interactions. The presence of moisture in solid dispersions was confirmed by TGA, which may significantly influence the recrystallization of the amorphous form. Figure 3a and Figure 3b shows the TGA profiles of ASDs prepared by spray–drying and melt–quenching, respectively. NIM exhibited a major weight loss of ~0.98% at ~175 °C, attributed to thermal decomposition. The TGA curve of NIM.HP.SM showed two events: 73 °C (4.86%) from surface-absorbed water loss, and 83 °C (0.48%) from thermal degradation. TGA curve for NIM.AS.SM showed three events: 70 °C (2.02%) for oxidation, 100 °C (0.34%) for heat-induced decomposition, and 180 °C (0.06%) indicating complete degradation. TGA curve for NIM.CP.SM revealed two events: 95 °C (2.01%) and 135 °C (0.35%) suggesting moisture and residual solvent loss [41]. TGA curve for NIM.PK.SM revealed two events: 100 °C (10%) from surface moisture, and 180 °C (1.63%) from thermal degradation. TGA curve for NIM.HP.HM revealed mass loss at 80 °C (1.66%) from surface moisture. TGA curve for NIM.AS.HM showed a mass loss at ~ 170 °C (0.19%) from oxidation and decomposition. TGA curve for NIM.CP.HM showed a mass loss at 180 °C (2.84%) from moisture and residual solvent. TGA curve for NIM.PK.HM showed a mass loss at 80 °C (6.14%) from surface moisture. Overall, spray-drying and melt-quenching were effective for ASDs preparation. Polymer selection significantly influenced thermal stability. ASD containing PVP K25 and HPC showed higher mass loss, indicating lower stability compared to HPMCAS and HPMCP. PVP K25 showed the highest moisture-related mass loss due to its hygroscopic nature. In contrast, HPMAS and HPMCP provided superior moisture protection due to their hydrophobicity and formation of moisture-resistant surface layers [22].
3.5. Evaluation of crystallinity
The PXRD Spectrum of NIM exhibits multiple sharp diffraction peaks at specific 2θ angle suggesting its crystalline nature and lattice arrangement. Figure 4a,b shows the PXRD patterns of NIM and its solid dispersions prepared by spray–drying and melt–quenching. NIM exhibited characteristic peaks at 2θ angles (6.38, 12.78, 15.3, 17.32, 19.64, 20.24, 20.58, 22.12, 23.48, 24.88, 26.20, 27.12, 28.78, 30.24, 30.68, 32.08, 33.06, 36.3, 37.27, 38.62, 39.68, 41.52, and 43.36), confirming its highly crystalline nature [42]. The diffraction pattern of ASDs showed diffuse halo peaks and no characteristic NIM peaks, confirming conversion to the amorphous state within the polymer matrix. However, NIM.HP.SM and NIM.HP.HM diffractogram showed distinctive peaks compared to other solid dispersions, likely due to the hygroscopicity of HPC inducing recrystallization [39]. Similarly, solid dispersion of NIM with HPMCAS and HPMCP was confirmed as amorphous, consistent with DSC results. Crystallinity was calculated as the ratio of the individual peak area of the entire curve [43]. All prepared ASDs exhibited crystallinity below 30%, confirming their amorphous nature. Spray-dried ASDs of NIM with HPMCAS and HMPCP showed crystallinity below 15%, suggesting superior molecular-level dispersion of the drug within the polymer [44].
3.6. Scanning Electron Microscope (SEM)
The surface morphology of ASDs was examined by SEM. Figure 5a–5i show ASD prepared by spray-drying and melt-quenching methods. NIM showed large crystalline agglomerates with defined shapes and sizes. SEM images confirmed the disappearance of the original crystalline drug particles and the formation of a homogenous amorphous system. Both methods effectively transformed the crystalline drug into an amorphous form, with slight differences in shape due to polymer properties. SEM images of Figure 5d (NIM.CP.SM) and Figure 5h (NIM.CP.HM) show comparatively smaller particles, which facilitate drug dissolution in the release medium. Spray–drying produced smaller HPMCP solid dispersions, supporting polymer selection to maintain the amorphous and bio-available form.
3.7. Solubility
NIM saturation solubility and its solid dispersions were determined across pH 3.0–6.8 to evaluate drug release under physiological conditions. The standard calibration curve (2.5–12.50 µg/mL) showed excellent linearity (R2 ≈ 0.9995), with a limit of quantification of 0.296 µg/mL and a limit of detection of 0.0976 µg/mL. Figure 6 shows the pH-dependent solubility of NIM and its solid dispersions, with a marked increase at phosphate buffer pH 6.0. At lower pH (3.0–5.0), the drug showed limited solubility, indicating poor release under acidic conditions. In contrast, solubility increased significantly at pH 6.0, suggesting that this pH provides favorable conditions for drug release. The improved solubility at pH 6.0 was observed in solid dispersion, attributed to HPMCP, a pH-dependent polymer insoluble in acidic environment. In other words, HPMCP protects the drug in acidic environments and facilitates its release at weak basic conditions. These findings suggest that NIM solid dispersion with HPMCP effectively improves solubility at pH 6.0, potentially supporting controlled drug release and improved bioavailability.
3.8. In Vitro Dissolution
The in vitro dissolution testing was performed for pure NIM as a reference and solid dispersions across different pH (pH 5.0, 6.0, and 6.8). Figure 7 shows the in vitro release profiles of the solid dispersion prepared by the spray–drying method. At phosphate buffer pH 5.0, 6.0, and 6.8, the NIM.CP.SM formulation exhibited high drug release of 53.07%, 89.50%, and 56.27%, respectively, after 120 min, consistent with the performance of the HPMCP-based system. The drug release rate was the highest for the HPMCP-based solid dispersions, followed by HPMCAS, PVP K25, and HPC (HPMCP > HPMCAS > PVP K25 > HPC). Figure 8 illustrates the in vitro release profiles of the solid dispersion prepared using the melt-quenching method. This method did not result in the release of the desired drug amount from the solid dispersion. The NIM.CP.HM formulation exhibited high drug release of 63.39%, 66.24%, and 65.80% with the HPMCP polymer in respective phosphate buffer at pH 5.0, 6.0, and 6.8, after 120 min. This release profile indicated that spray–drying method produced a more consistent solid dispersion with HPMCP than the melt-quenching method. Overall, the NIM.CP.SM showed the drug release at pH 6.0, as HPMCP limits drug release under acidic conditions and enhances solubility near neutral pH (6.8).
In addition, bulk density data revealed that ASD prepared by spray–drying (0.23, 0.14, 0.13 and 0.16 g/mL with HP, AS, CP and PK, respectively) had lower bulk density than the melt–quenching (0.24, 0.15, 0.15 and 0.20 g/mL with HP, AS, CP and PK, respectively). The lower density solid dispersion might give higher capillary channel by wicking, wetting, and penetration mechanisms, therefore rapid in vitro drug release might be observed [45].
The release kinetics of NIM and its solid dispersions prepared with HPMCP, HPMCAS, HPC, and PVP using spray–drying (SM) and melt–quenching (HM) methods were comparatively evaluated in phosphate buffer media at pH 5.0, 6.0, and 6.8. Table S1 and S2 summarize the results of the in vitro release profiles. The release data were fitted to the Korsmeyer–Peppas (KP) model, showing that the NIM.CP.SM formulation exhibited the highest kKP value (98.12) at pH 6.0. Pure NIM showed negligible dissolution under all tested conditions. In contrast, HPMCP-based ASDs exhibited a pronounced and superior enhancement of drug release. Specifically, the NIM.CP.SM (spray dried) was the top performer, achieving the highest overall DE (0.901) at pH 6.0, while the NIM.CP.HM (melt–quenching) formulation showed robust performance. These findings identify HPMCP as the optimal carrier and confirm the presence of the spring–parachute effect.
3.9. In Vivo Pharmacokinetics
The in vivo pharmacokinetic study was conducted to evaluate the oral bioavailability of NIM, the physical mixture, and the solid dispersions. The method validation showed acceptable reliability, with Table S3 summarizing the inter-day and intra-day precision and accuracy values. Linearity was confirmed using a correlation coefficient (R2) of 0.994. Figure 9 illustrates the plasma drug concentration–time profiles of NIM, the physical mixture, NIM.CP.SM and NIM.CP.HP following intragastric administration to Sprague–Dawley rats. Table 6 summarizes the pharmacokinetic parameters associated with these outcomes. The time to reach maximum plasma concentration (Tmax) for NIM, the physical mixture, the NIM.CP.SM, and the NIM.CP.HP was 3.13 ± 3.01 h, 1.0 ± 0.41 h, 0.25 ± 0.12 h, and 0.31 ± 0.13 h, respectively. The maximum plasma concentration (Cmax) for NIM, the physical mixture, the NIM.CP.SM, and NIM.CP.HM was 74.93 ± 10.23 ng/mL, 73.62 ± 75.95 ng/mL, 2480.80 ± 1629.26 ng/mL, and 777.56 ± 1448.63 ng/mL, respectively. The AUC0–t of NIM.CP.SM was 4672.92 ± 3395.65 ng⋅h/mL, significantly higher than that of NIM (332.50 ± 120.21 ng⋅h/mL), indicating significantly improved systemic exposure.
The physical mixture could not release the NIM at gastric pH and in the small intestine because the components were not uniformly mixed at the molecular level. Consequently, NIM likely underwent recrystallization and could not maintain supersaturation. In contrast, NIM.CP.SM exhibited a 33-fold increase in Cmax (2480.80 ng/mL) and a 15-fold increase in AUC0–t compared to NIM, indicating that the solid dispersion significantly enhanced systemic exposure after oral administration (p-value < 0.05). Although NIM.CP.HM exhibited improved bioavailability compared to NIM, its pharmacokinetic performance was inferior to that of NIM.CP.SM. This finding confirms that the spray-drying method is more effective than melt-quenching for preparing HPMCP-based solid dispersions. The superior performance of NIM.CP.SM may be attributed to its smaller particle size, uniform drug distribution, and stronger intermolecular interactions between NIM and HPMCP, enhancing stability and preventing recrystallization. Therefore, the in vivo release profile demonstrated that the spray-dried HPMCP-based solid dispersion-maintained supersaturation, prevented recrystallization in gastrointestinal fluids, and significantly enhanced the oral bioavailability of NIM.
4. Conclusion
In this study, solid dispersions of NIM were prepared with HPC, HPMCAS, HPMCP, and PVP K25 as carriers using spray-drying and melt-quenching methods. The DSC thermograms showed the presence of Tg in all prepared ASDs, confirming their amorphous state. Drug–polymer compatibility and interactions were evaluated using FTIR spectroscopy, and the results showed no significant peak shifts in the spectra of the solid dispersions. The crystallinity in the ASDs was evaluated using PXRD, revealing no significant diffraction peaks, thereby confirming their amorphous nature. The in vitro and in vivo drug release profiles showed rapid, complete drug release from NIM.CP.SM suggesting complete dispersion. Supersaturation without recrystallization was maintained for 120 min in the release medium (phosphate buffer, pH 6.0). A significant improvement in drug release was observed for NIM.CP.SM compared to NIM as a reference. Furthermore, the findings suggest that HPMCP is a promising carrier and spray-drying method is a feasible method for achieving the amorphous form and enhancing in vitro drug release and bioavailability.
Supplementary Materials
The following supporting information can be downloaded at the website of this paper posted on Preprints.org, Table S1: In vivo dissolution kinetic parameters of nimodipine and its solid dispersions prepared using the spray-drying method in phosphate buffer at different pH values; Table S2: In vivo dissolution kinetic parameters of nimodipine and its solid dispersions prepared using the melt-quenching method in phosphate buffer at different pH values; Table S3: Accuracy and precision parameters for analytical method validation of the nimodipine assay; Figure S1: Flory–Huggins extrapolation using the melting–mixing method for nimodipine–polymer systems: (a) NIM–HPC, (c) NIM–HPMCAS, (e) NIM–HPMCP, and (g) NIM–PVP K25. Parameters used include melting point, drug fraction, enthalpy of fusion, and annealing temperature. Flory–Huggins extrapolation using the MPD method for (b) NIM–HPC, (d) NIM–HPMCAS, (f) NIM–HPMCP, and (h) NIM–PVP K25, respectively, using onset, offset, and midpoint melting temperatures.
Author Contributions
H.P.B.: Conceptualization, Methodology, Data curation, Writing−original draft; K.H.K.: Methodology, Data curation; M.C.: Methodology, Investigation; K.-T.K.: Methodology, Data curation; M.K.: Methodology, Investigation; H.-Y.C.: Methodology, Data curation; R.M.: Data curation, Visualization, and editing; H.-K.H.: Data curation, Formal analysis; S.H.J.: Conceptualization, Methodology, Supervision, Funding acquisition, Writing−review and editing. All authors have read and agreed to the published version of the manuscript.
Funding
This research was supported by the Technology Innovation Program (RS-2024-00438659, Development of new materials for stabilizing formulations for freeze-drying nucleic acid therapeutics) funded by the Ministry of Trade, Industry and Energy (MOTIE, Korea) and the Yonsei University Research Fund of 2025 (2025-22-0161).
Informed Consent Statement
Not applicable, as this study did not involve human participants.
Data Availability Statement
All the data used in the discussion are included in the manuscript.
Conflicts of Interest
The authors declare that they have no known competing financial interests or personal relationships that can influence the present work.
References
- Bhujbal, S.V.; Mitra, B.; Jain, U.; Gong, Y.; Agrawal, A.; Karki, S.; Taylor, L.S.; Kumar, S.; Zhou, Q.T. Pharmaceutical amorphous solid dispersion: A review of manufacturing strategies. Acta Pharm. Sin. B 2021, 11, 2505–2536. [Google Scholar] [CrossRef]
- Pandi, P.; Bulusu, R.; Kommineni, N.; Khan, W.; Singh, M. Amorphous solid dispersions: An update for preparation, characterization, mechanism on bioavailability, stability, regulatory considerations and marketed products. Int. J. Pharm. 2020, 586, 119560. [Google Scholar] [CrossRef]
- Tambe, S.; Jain, D.; Meruva, S.K.; Rongala, G.; Juluri, A.; Nihalani, G.; Mamidi, H.K.; Nukala, P.K.; Bolla, P.K. Recent advances in amorphous solid dispersions: preformulation, formulation strategies, technological advancements and characterization. Pharmaceutics 2022, 14, 2203. [Google Scholar] [CrossRef]
- Martynek, D.; Ridvan, L.; Sivén, M.; Šoóš, M. Stability and recrystallization of amorphous solid dispersions prepared by hot-melt extrusion and spray drying. Int. J. Pharm. 2025, 125331. [Google Scholar] [CrossRef] [PubMed]
- Singh, A.; Van den Mooter, G. Spray drying formulation of amorphous solid dispersions. Adv. Drug Deliv. Rev. 2016, 100, 27–50. [Google Scholar] [CrossRef] [PubMed]
- Han, J.; Tang, M.; Yang, Y.; Sun, W.; Yue, Z.; Zhang, Y.; Zhu, Y.; Liu, X.; Wang, J. Amorphous solid dispersions: Stability mechanism, design strategy and key production technique of hot melt extrusion. Int. J. Pharm. 2023, 646, 123490. [Google Scholar] [CrossRef] [PubMed]
- Mamidi, H.; Palekar, S.; Patel, H.; Nukala, P.K.; Patel, K. Formulation strategies for the development of high drug-loaded amorphous solid dispersions. Drug Discov. Today 2023, 28, 103806. [Google Scholar] [CrossRef]
- Hempel, N.-J.; Brede, K.; Olesen, N.E.; Genina, N.; Knopp, M.M.; Löbmann, K. A fast and reliable DSC-based method to determine the monomolecular loading capacity of drugs with good glass-forming ability in mesoporous silica. Int. J. Pharm. 2018, 544, 153–157. [Google Scholar] [CrossRef]
- Kong, H.; Yu, F.; Liu, Y.; Yang, Y.; Li, M.; Cheng, X.; Hu, X.; Tang, X.; Li, Z.; Mei, X. Development and evaluation of high bioavailable sustained-release nimodipine tablets prepared with monolithic osmotic pump technology. Curr. Drug Deliv. 2018, 15, 44–51. [Google Scholar] [CrossRef]
- Chalikwar, S.S.; Belgamwar, V.S.; Talele, V.R.; Surana, S.J.; Patil, M.U. Formulation and evaluation of nimodipine-loaded solid lipid nanoparticles delivered via lymphatic transport system. Colloids Surf. B. Biointerfaces 2012, 97, 109–116. [Google Scholar] [CrossRef]
- Prajapat, M.D.; Patel, N.J.; Bariya, A.; Patel, S.S.; Butani, S.B. Formulation and evaluation of self-emulsifying drug delivery system for nimodipine, a BCS class II drug. J. Drug Deliv. Sci. Technol. 2017, 39, 59–68. [Google Scholar] [CrossRef]
- Bhatta, H.P.; Han, H.-K.; Maharjan, R.; Jeong, S.H. Recent techniques to improve amorphous dispersion performance with quality design, physicochemical monitoring, molecular simulation, and machine learning. Pharmaceutics 2025, 17, 1249. [Google Scholar] [CrossRef]
- Van Duong, T.; Van den Mooter, G. The role of the carrier in the formulation of pharmaceutical solid dispersions. Part II: Amorphous carriers. Expert Opin. Drug Deliv. 2016, 13, 1681–1694. [Google Scholar] [CrossRef]
- Zhang, J.; Guo, M.; Luo, M.; Cai, T. Advances in the development of amorphous solid dispersions: the role of polymeric carriers. Asian J. Pharm. Sci. 2023, 18, 100834. [Google Scholar] [CrossRef]
- Qian, F.; Huang, J.; Hussain, M.A. Drug–polymer solubility and miscibility: stability consideration and practical challenges in amorphous solid dispersion development. J. Pharm. Sci. 2010, 99, 2941–2947. [Google Scholar] [CrossRef] [PubMed]
- Larsen, B.S.; Meiland, P.; Tzdaka, E.; Tho, I.; Rades, T. A unifying approach to drug-in-polymer solubility prediction: Streamlining experimental workflow and analysis. Eur. J. Pharm. Biopharm. 2024, 203, 114478. [Google Scholar] [CrossRef] [PubMed]
- Van Krevelen, D.W.; Te Nijenhuis, K. Properties of polymers: Their correlation with chemical structure; their numerical estimation and prediction from additive group contributions; Elsevier: 2009.
- Simões, M.F.; Pereira, A.; Cardoso, S.; Cadonau, S.; Werner, K.; Pinto, R.M.; Simões, S. Five-stage approach for a systematic screening and development of etravirine amorphous solid dispersions by hot-melt extrusion. Mol. Pharm. 2019, 17, 554–568. [Google Scholar] [CrossRef]
- Verma, S.; Rudraraju, V.S. A systematic approach to design and prepare solid dispersions of poorly water-soluble drug. AAPS PharmSciTech 2014, 15, 641–657. [Google Scholar] [CrossRef]
- Kim, U.-I.; Maharjan, R.; Han, H.-K.; Kim, K.; Jeong, S.H. Formulation development of basroparib as a first-in-class tankyrase inhibitor using a microprecipitated bulk powder approach. J. Pharm. Investig. 2025, 1–11. [Google Scholar] [CrossRef]
- Meiland, P.; Larsen, B.S.; Knopp, M.M.; Tho, I.; Rades, T. A new method to determine drug-polymer solubility through enthalpy of melting and mixing. Int. J. Pharm. 2022, 629, 122391. [Google Scholar] [CrossRef] [PubMed]
- Nguyen, H.T.; Van Duong, T.; Taylor, L.S. Impact of gastric pH variations on the release of amorphous solid dispersion formulations containing a weakly basic drug and enteric polymers. Mol. Pharm. 2023, 20, 1681–1695. [Google Scholar] [CrossRef]
- Yuan, X.; Sperger, D.; Munson, E.J. Investigating miscibility and molecular mobility of nifedipine-PVP amorphous solid dispersions using solid-state NMR spectroscopy. Mol. Pharm. 2014, 11, 329–337. [Google Scholar] [CrossRef] [PubMed]
- Kolisnyk, T.; Mohylyuk, V.; Fil, N.; Bickerstaff, E.; Li, S.; Jones, D.S.; Andrews, G.P. High drug-loaded amorphous solid dispersions of a poor glass forming drug: The impact of polymer type and cooling rate on amorphous drug behaviour. Int. J. Pharm. 2025, 670, 125095. [Google Scholar] [CrossRef]
- Knopp, M.M.; Olesen, N.E.; Holm, P.; Langguth, P.; Holm, R.; Rades, T. Influence of polymer molecular weight on drug-polymer solubility: A comparison between experimentally determined solubility in PVP and prediction derived from solubility in monomer. J. Pharm. Sci. 2015, 104, 2905–2912. [Google Scholar] [CrossRef]
- Mustafa, W.W.; Fletcher, J.; Khoder, M.; Alany, R.G. Solid dispersions of gefitinib prepared by spray drying with improved mucoadhesive and drug dissolution properties. AAPS PharmSciTech 2022, 23, 48. [Google Scholar] [CrossRef]
- Jia, X.; Chen, J.; Cheng, H.; Pan, X.; Ke, Y.; Fu, T.; Qiao, H.; Cui, X.; Li, W.; Zou, L. Use of surfactant-based amorphous solid dispersions for BDDCS class II drugs to enhance oral bioavailability: A case report of resveratrol. Int. J. Pharm. 2023, 641, 123059. [Google Scholar] [CrossRef]
- Zhang, C.; van de Weert, M.; Bjerregaard, S.; Rantanen, J.; Yang, M. Leucine as a moisture-protective excipient in spray-dried protein/trehalose formulation. J. Pharm. Sci. 2024, 113, 2764–2774. [Google Scholar] [CrossRef] [PubMed]
- Maharjan, R.; Park, H.E.; Kim, K.H.; Chaudhary, M.; Kim, K.-T.; Kim, M.; Cho, H.-Y.; Jeong, S.H. Cocrystallization of ezetimibe with organic acids: Stoichiometric optimization for improved solubility and bioavailability. Pharmaceutics 2025, 17, 1399. [Google Scholar] [CrossRef] [PubMed]
- Tanaka, R.; Hattori, Y.; Horie, Y.; Kamada, H.; Nagato, T.; Otsuka, M. Characterization of amorphous solid dispersion of pharmaceutical compound with pH-dependent solubility prepared by continuous-spray granulator. Pharmaceutics 2019, 11, 159. [Google Scholar] [CrossRef]
- Maharjan, R.; Lee, J.C.; Kim, N.A.; Jeong, S.H. Preparation of seeded granules to improve mechanical properties and various drug loading for pharmaceutical application. Powder Technol. 2021, 392, 650–660. [Google Scholar] [CrossRef]
- Yoon, S.-J.; Bak, J.; Yoo, B. Effect of fluidized-bed agglomeration with sugar binders on physical, crystallinity, thermal, and pasting properties of native potato starch. Food Sci. Biotechnol. 2024, 33, 3463–3471. [Google Scholar] [CrossRef]
- Butreddy, A.; Sarabu, S.; Almutairi, M.; Ajjarapu, S.; Kolimi, P.; Bandari, S.; Repka, M.A. Hot-melt extruded hydroxypropyl methylcellulose acetate succinate based amorphous solid dispersions: Impact of polymeric combinations on supersaturation kinetics and dissolution performance. Int. J. Pharm. 2022, 615, 121471. [Google Scholar] [CrossRef]
- Liu, G.; Gong, L.; Zhang, J.; Wu, Z.; Deng, H.; Deng, S. Development of nimesulide amorphous solid dispersions via supercritical anti-solvent process for dissolution enhancement. Eur. J. Pharm. Sci. 2020, 152, 105457. [Google Scholar] [CrossRef]
- Rathod, N.; Borkhataria, C.; Manek, R.; Patel, V.; Patel, N.; Patel, K.; Paun, J.; Sakhiya, D. Study on the correlation between nimodipine (BCS Class II) solubility, dissolution improvement, and brain tissue concentration through cocrystallization. J. Pharm. Innov. 2023, 18, 2235–2248. [Google Scholar] [CrossRef]
- Liu, W.; Wang, X.; Chen, R.; Zhang, K.; Li, Y.; Li, Y.; Si, D.; Gong, J.; Yin, D.; Wang, Y. Effect of age on the pharmacokinetics of polymorphic nimodipine in rats after oral administration. Acta Pharm. Sin. B 2016, 6, 468–474. [Google Scholar] [CrossRef]
- Zhang, Q.; Zhao, Y.; Zhao, Y.; Ding, Z.; Fan, Z.; Zhang, H.; Liu, M.; Wang, Z.; Han, J. Effect of HPMCAS on recrystallization inhibition of nimodipine solid dispersions prepared by hot-melt extrusion and dissolution enhancement of nimodipine tablets. Colloids Surf. B. Biointerfaces 2018, 172, 118–126. [Google Scholar] [CrossRef]
- Lehmkemper, K.; Kyeremateng, S.O.; Heinzerling, O.; Degenhardt, M.; Sadowski, G. Impact of Polymer Type and Relative Humidity on the Long-Term Physical Stability of Amorphous Solid Dispersions. Mol. Pharm. 2017, 14, 4374–4386. [Google Scholar] [CrossRef] [PubMed]
- Raje, V.; Lu, I.; Keir, R.S.; Serajuddin, A.T. Development of indomethacin amorphous solid dispersion by applying acid-base supersolubilization (ABS) principle to enhance solubility and enable low-temperature hot melt extrusion. Int. J. Pharm. 2025, 126405. [Google Scholar] [CrossRef] [PubMed]
- Calvo, N.L.; Balzaretti, N.M.; Antonio, M.; Kaufman, T.S.; Maggio, R.M. Chemometrics-assisted study of the interconversion between the crystalline forms of nimodipine. J. Pharm. Biomed. Anal. 2018, 158, 461–470. [Google Scholar] [CrossRef] [PubMed]
- Zhou, W.; Han, M.; Zhang, H.; Zhang, T.; Tian, H.; Yang, T.; Liu, T. Effect of PVP and HPMC on production of indomethacin amorphous nanoparticles: experiments and molecular dynamics simulations. Drug. Dev. Ind. Pharm. 2025, 51, 622–633. [Google Scholar] [CrossRef]
- Docoslis, A.; Huszarik, K.L.; Papageorgiou, G.Z.; Bikiaris, D.; Stergiou, A.; Georgarakis, E. Characterization of the distribution, polymorphism, and stability of nimodipine in its solid dispersions in polyethylene glycol by micro-Raman spectroscopy and powder X-ray diffraction. AAPS J. 2007, 9, 43. [Google Scholar] [CrossRef] [PubMed]
- Albadarin, A.B.; Potter, C.B.; Davis, M.T.; Iqbal, J.; Korde, S.; Pagire, S.; Paradkar, A.; Walker, G. Development of stability-enhanced ternary solid dispersions via combinations of HPMCP and Soluplus® processed by hot melt extrusion. Int. J. Pharm. 2017, 532, 603–611. [Google Scholar] [CrossRef] [PubMed]
- S’ari, M.; Blade, H.; Cosgrove, S.; Drummond-Brydson, R.; Hondow, N.; Hughes, L.P.; Brown, A. Characterization of amorphous solid dispersions and identification of low levels of crystallinity by transmission electron microscopy. Mol. Pharm. 2021, 18, 1905–1919. [Google Scholar] [CrossRef] [PubMed]
- Li, Y.; Mann, A.K.P.; Zhang, D.; Yang, Z. Processing Impact on In Vitro and In Vivo Performance of Solid Dispersions—A Comparison between Hot-Melt Extrusion and Spray Drying. Pharmaceutics 2021, 13, 1307. [Google Scholar] [CrossRef]
Figure 1.
DSC thermograms of physical mixture of NIM with HP (a), AS (b), CP (c), and PK (d) at different ratio (1:1, 1:2, 1:3, and 1:4). The drug endothermic peak gradually decreases in intensity, broadens, and shifts with increasing polymer content, suggesting enhanced drug solubility within the polymer matrix. DSC thermogram of solid dispersion prepared using (e) spray–drying method and (f) melt–quenching method. The complete absence of crystalline melting peaks in all prepared ASDs confirms the conversion of crystalline state to amorphous state.
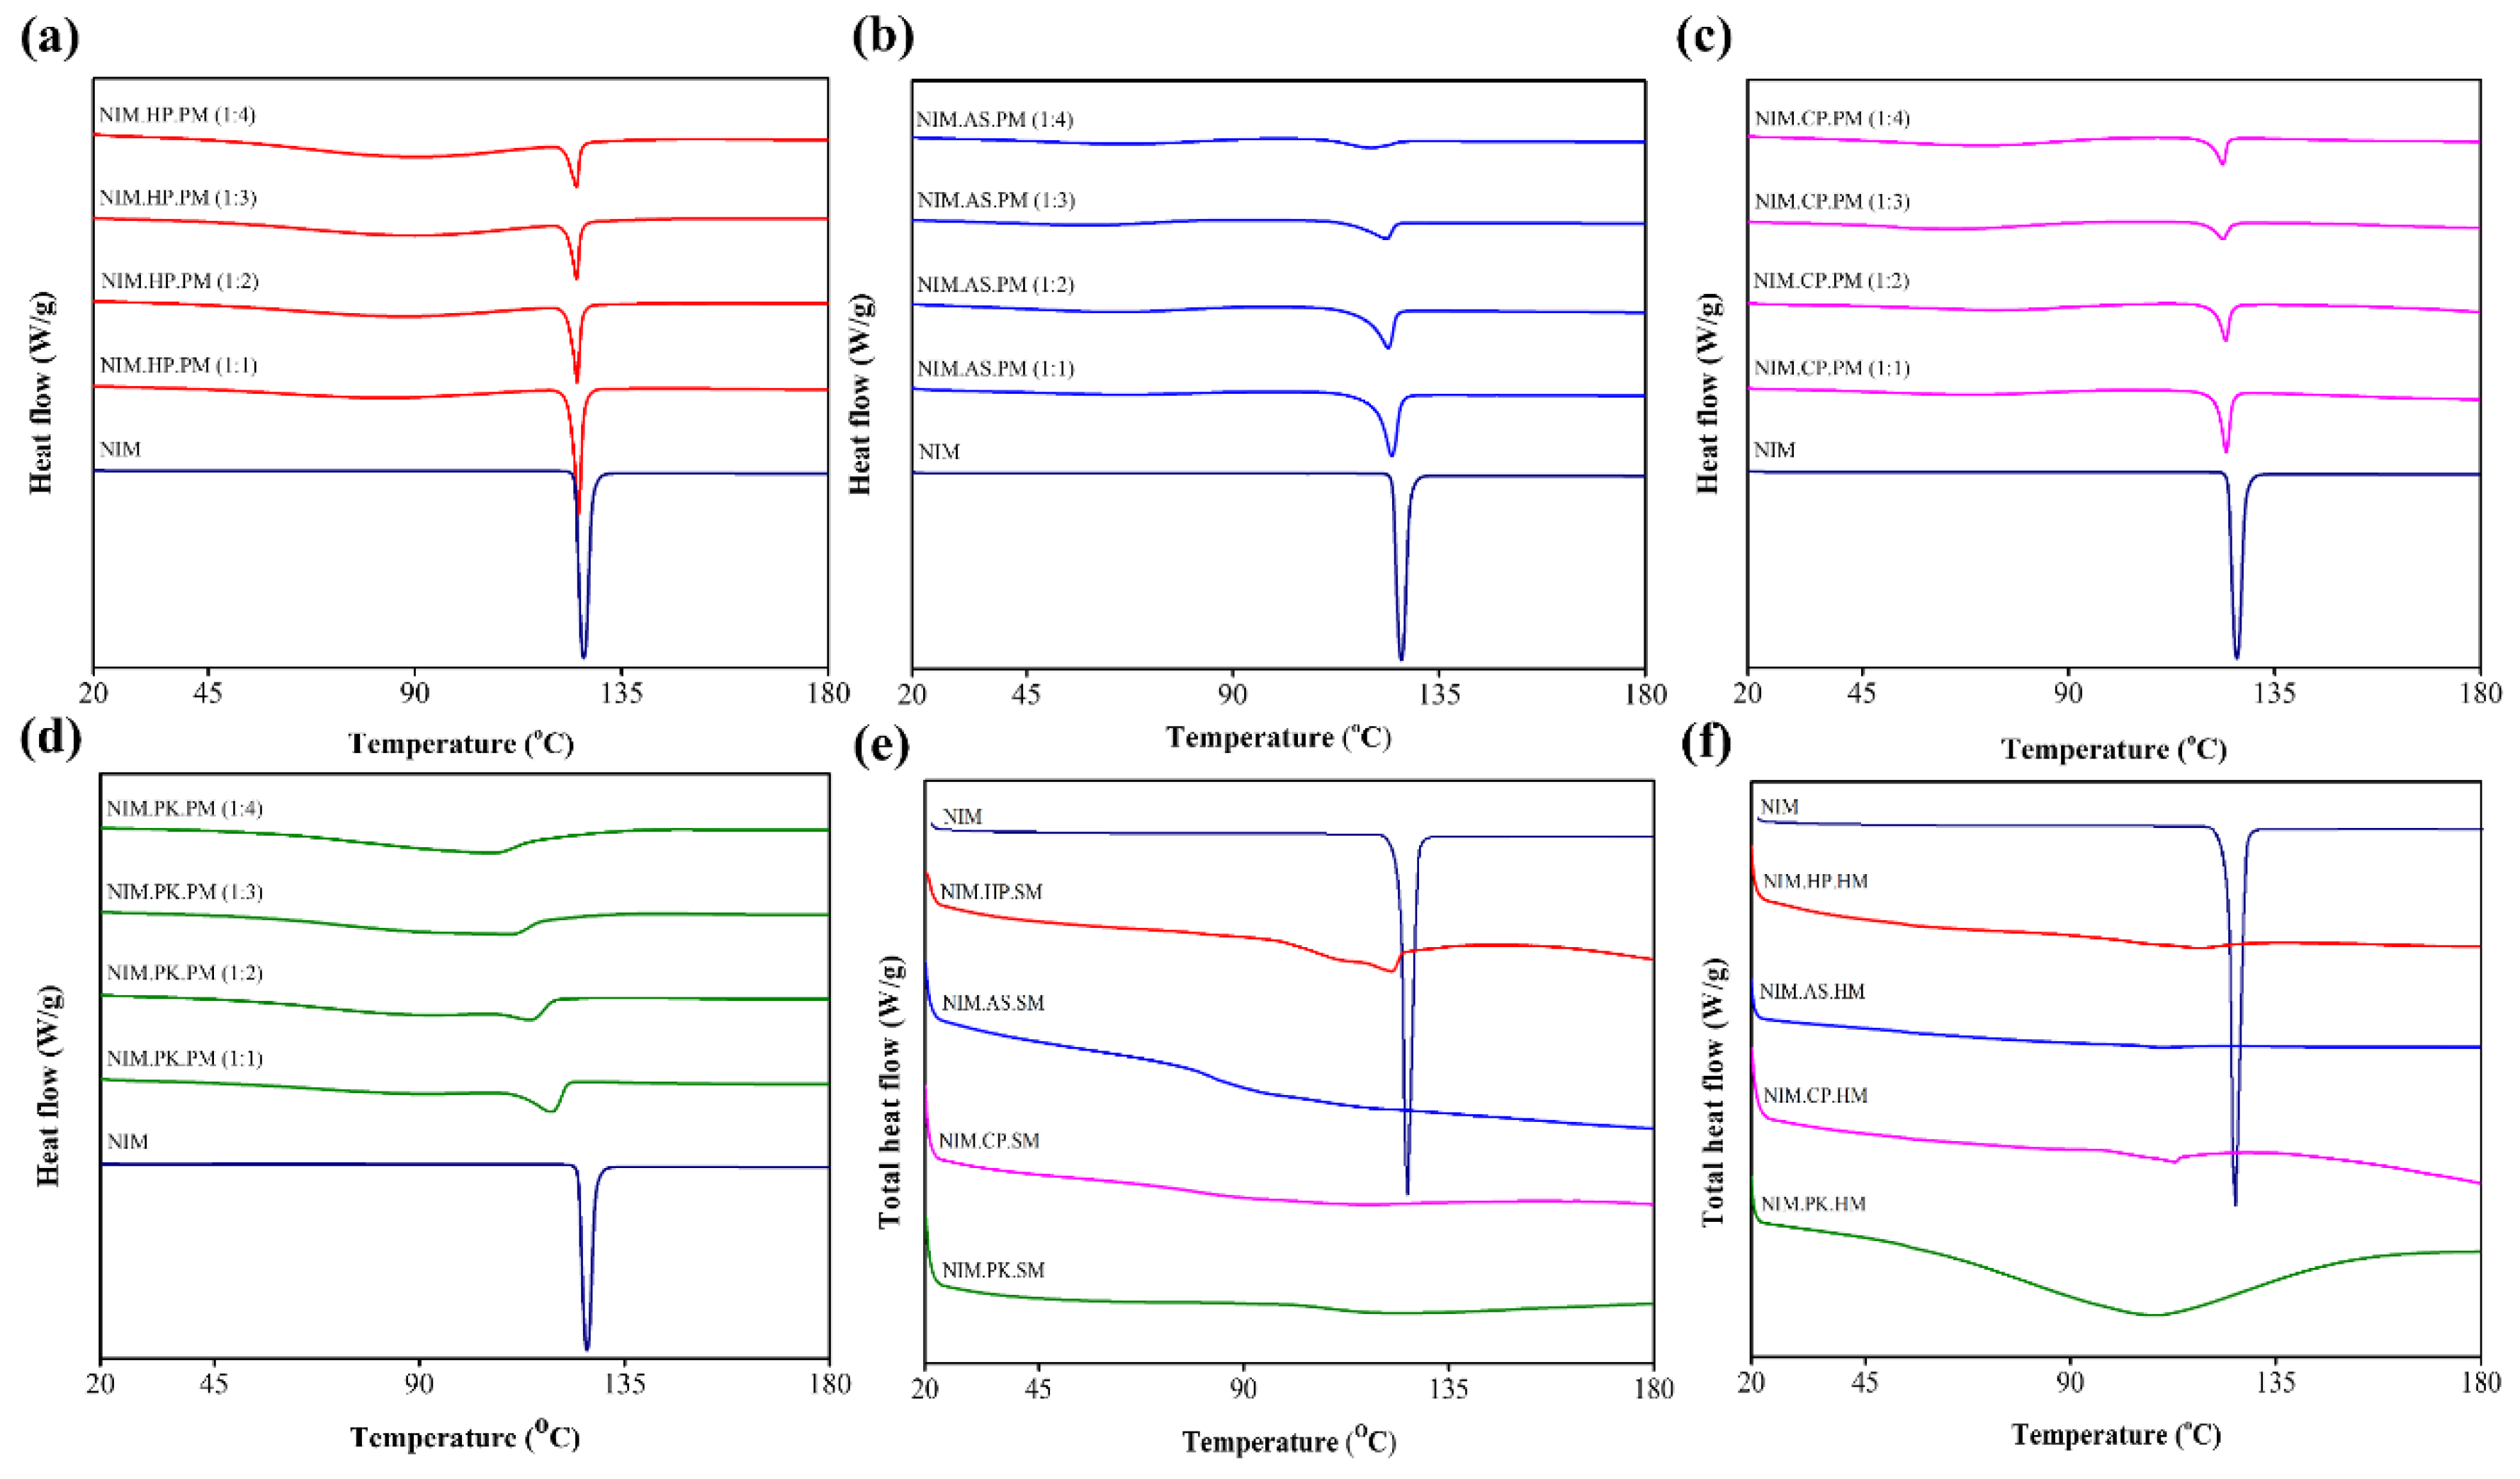
Figure 2.
Schematic representation of FTIR spectra for NIM and its solid dispersions prepared via (a) spray–drying and (b) melt–quenching methods. The shaded regions indicate the presence of identical chemical functional groups and intermolecular interactions, including N−H stretching, C−H stretching, C=C bending and C−H bending, within the solid dispersions. Dotted lines represent the most prominent interaction (carbonyl stretching) sites between NIM and polymers.
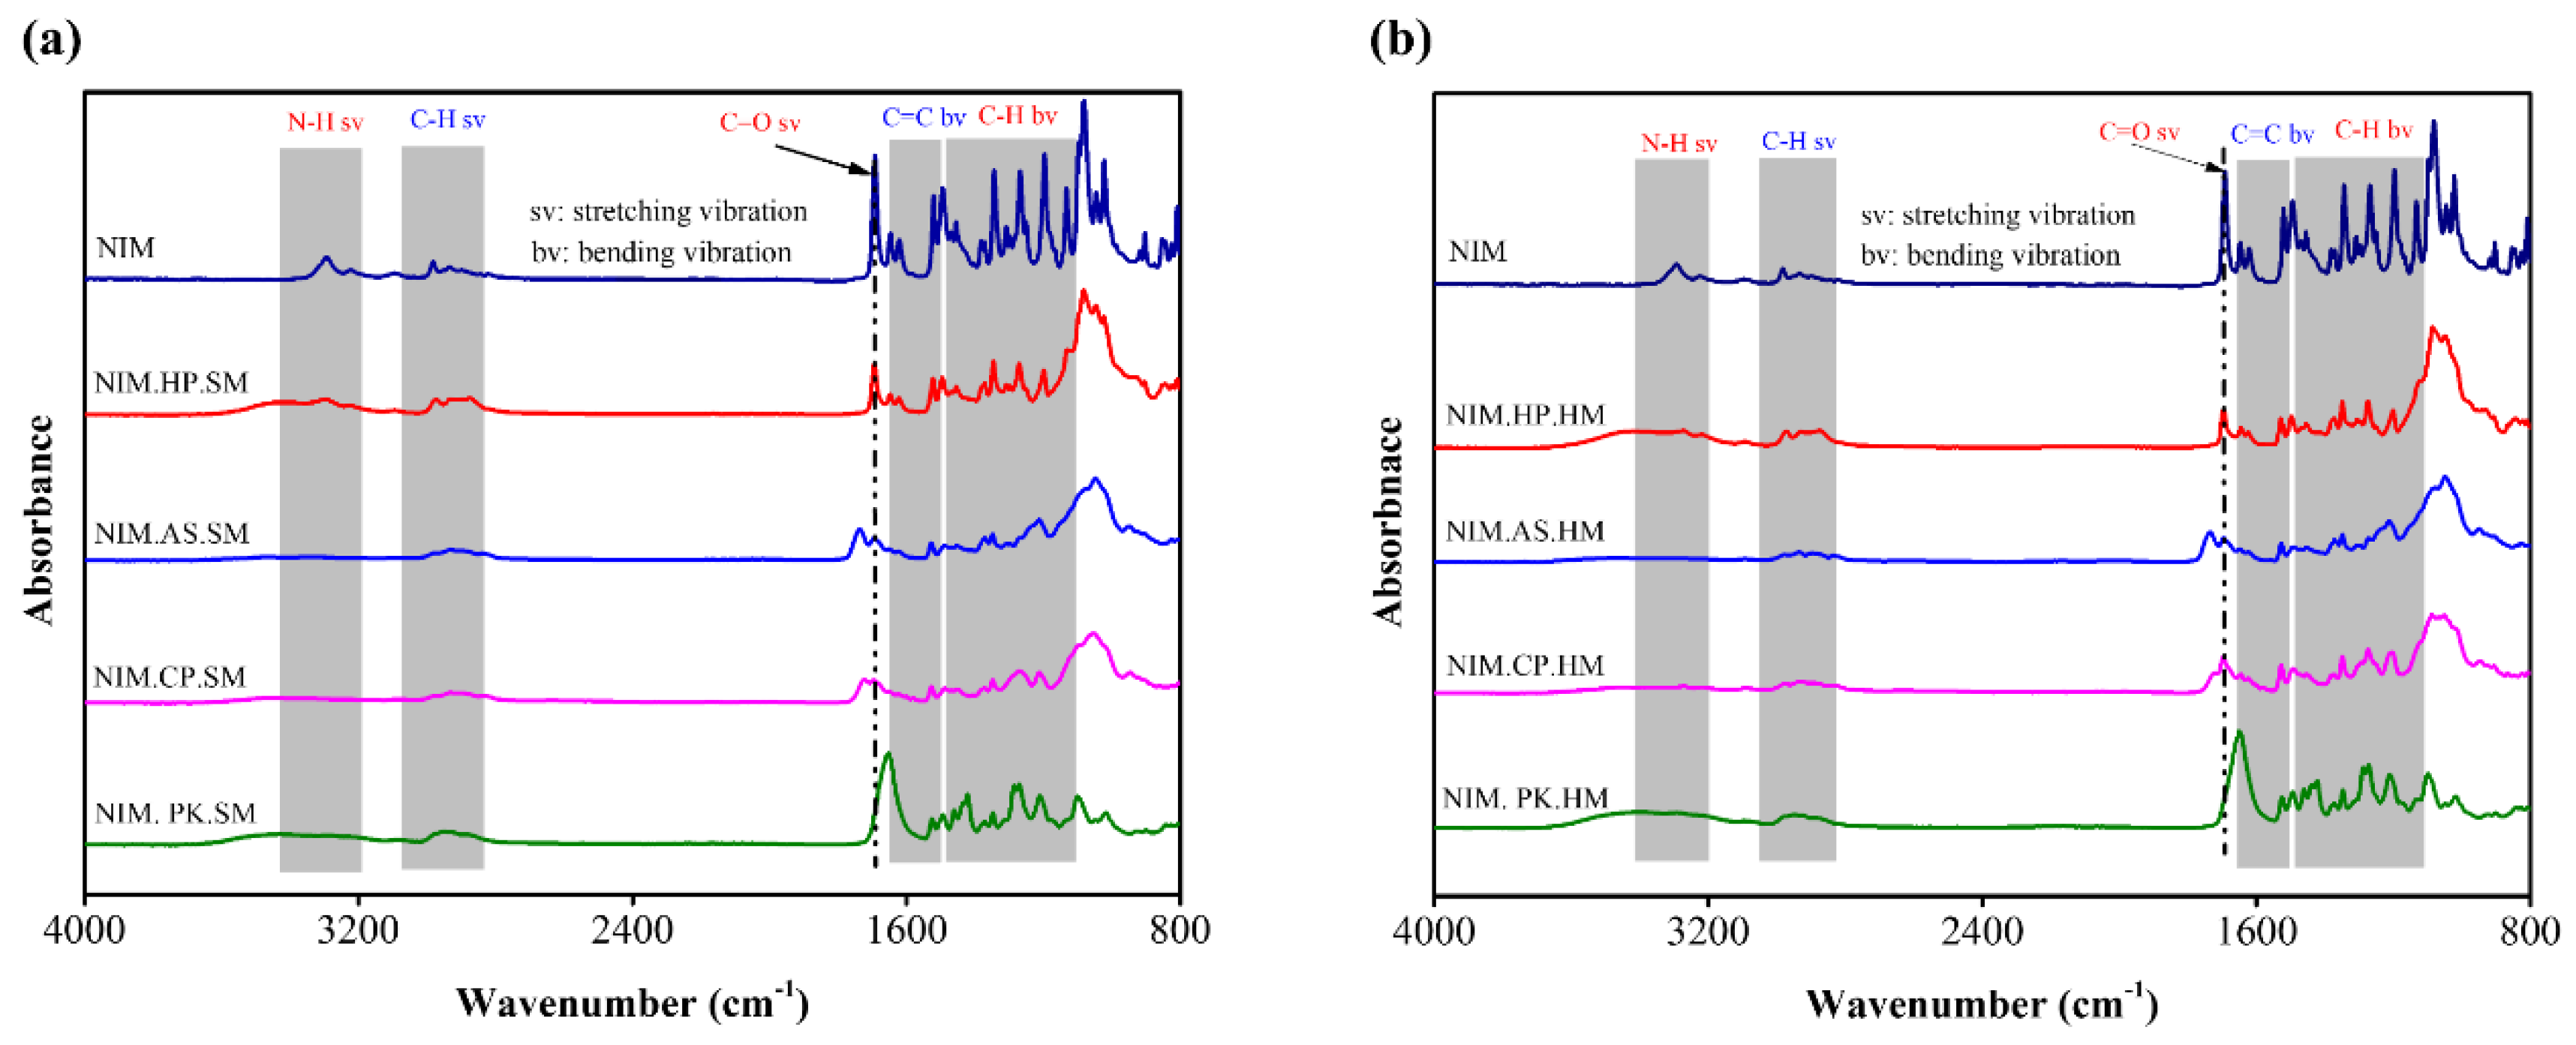
Figure 3.
TGA thermograms of crystalline NIM and its corresponding solid dispersions prepared by (a) spray–drying and (b) melt–quenching methods. The thermogram illustrates the percent weight loss as a function of temperature from 25 °C to 200 °C. NIM (in dark blue) remains thermally stable and free of moisture. In contrast, the NIM.PK (in green) shows significant weight loss due to evaporation of moisture and residual solvent held by that specific polymer.
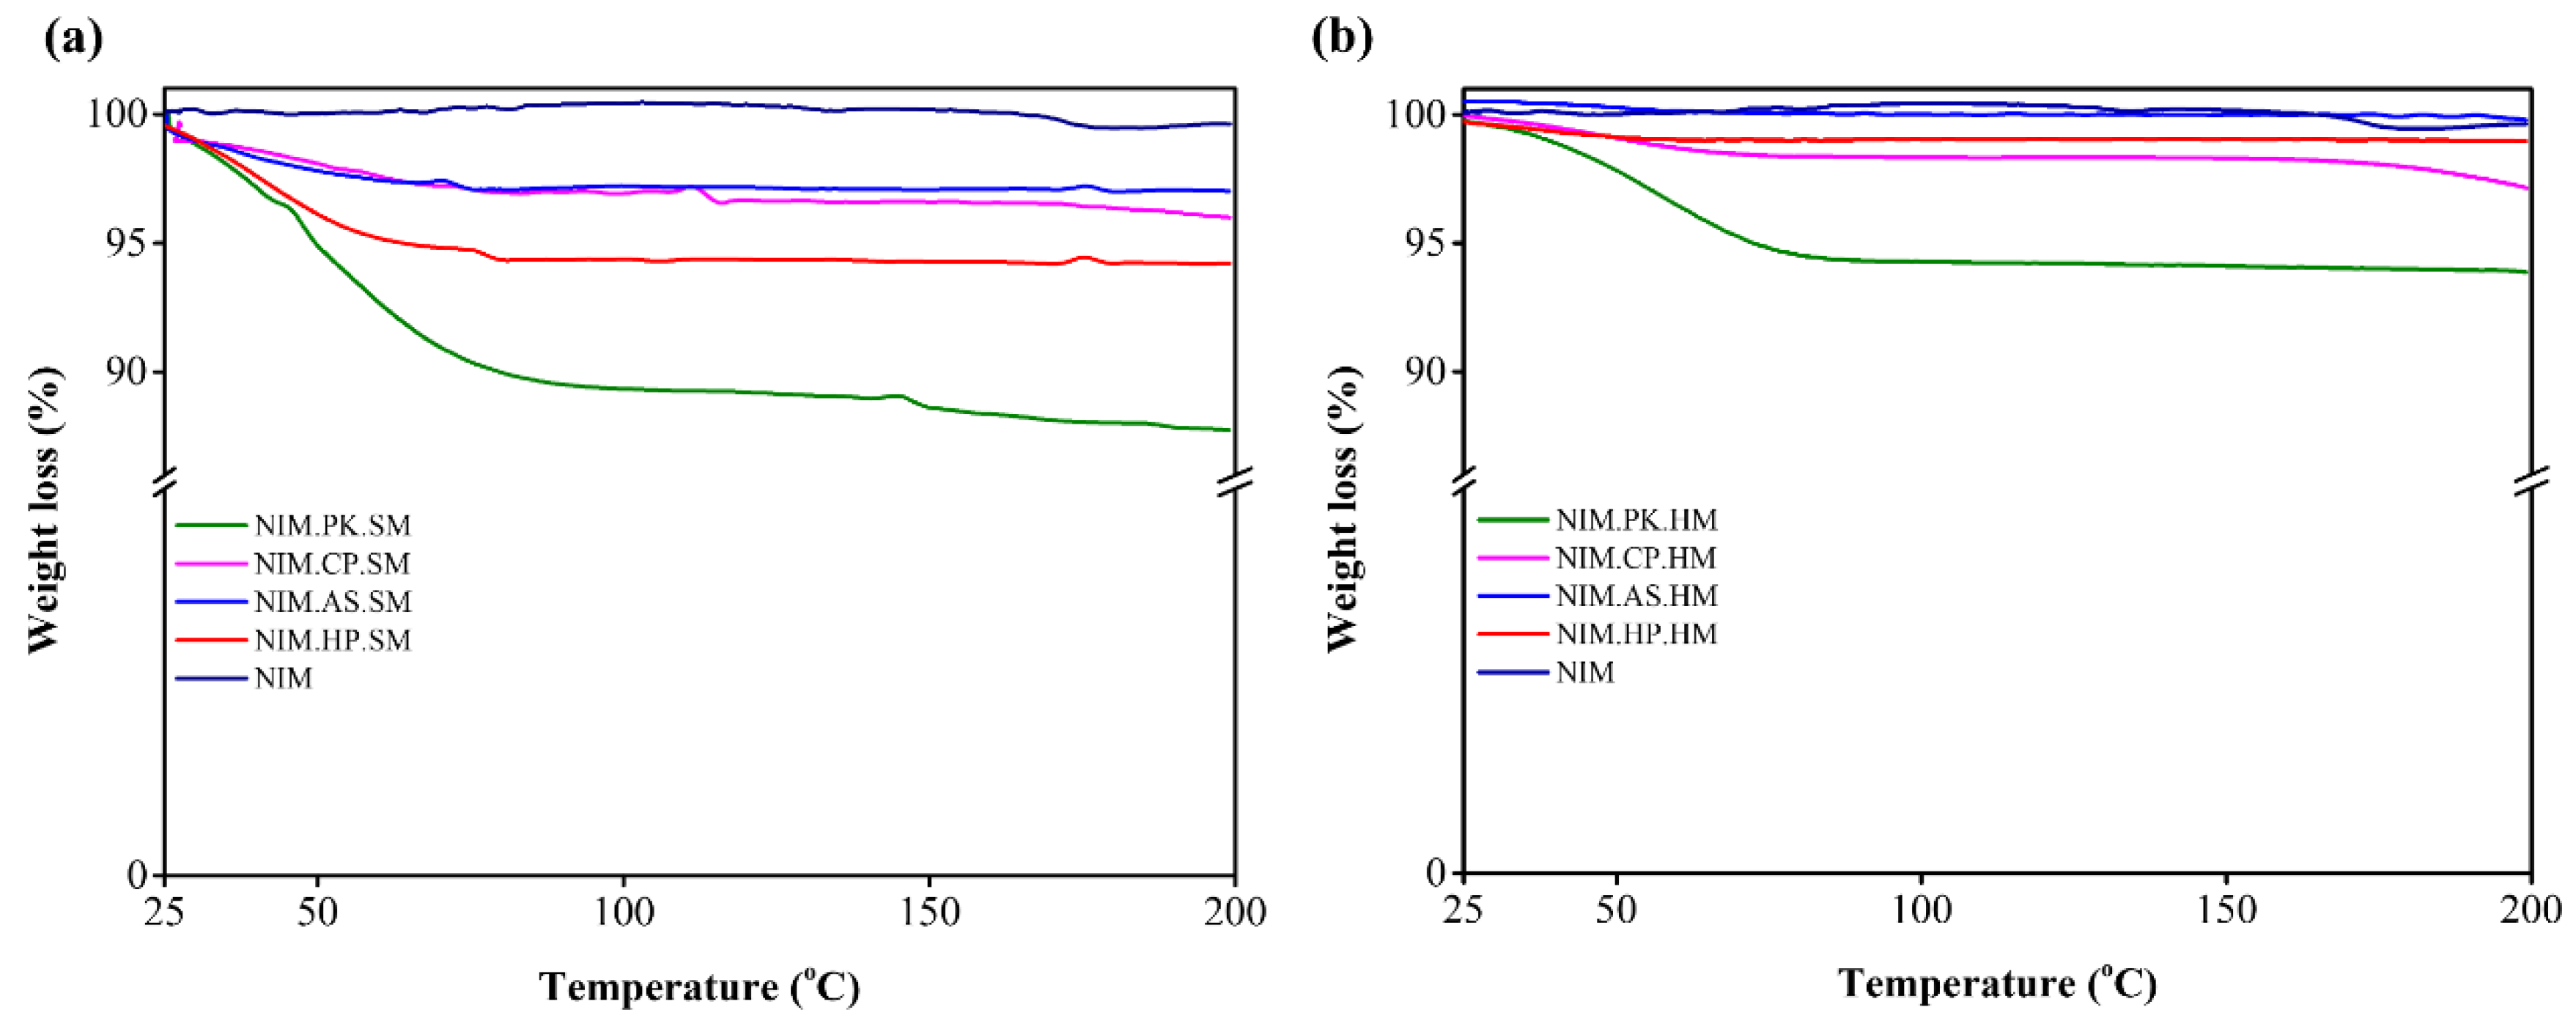
Figure 4.
PXRD patterns of NIM and its corresponding solid dispersions prepared by (a) spray–drying and (b) melt–quenching methods. The top diffractogram, corresponding to crystalline NIM, exhibits multiple sharp diffraction peaks. In contrast, all prepared ASD show broad, diffuse halo peaks with the complete absence of characteristic NIM peaks, indicating that crystalline NIM is fully solubilized within the polymers to form a uniformly distributed amorphous dispersion.
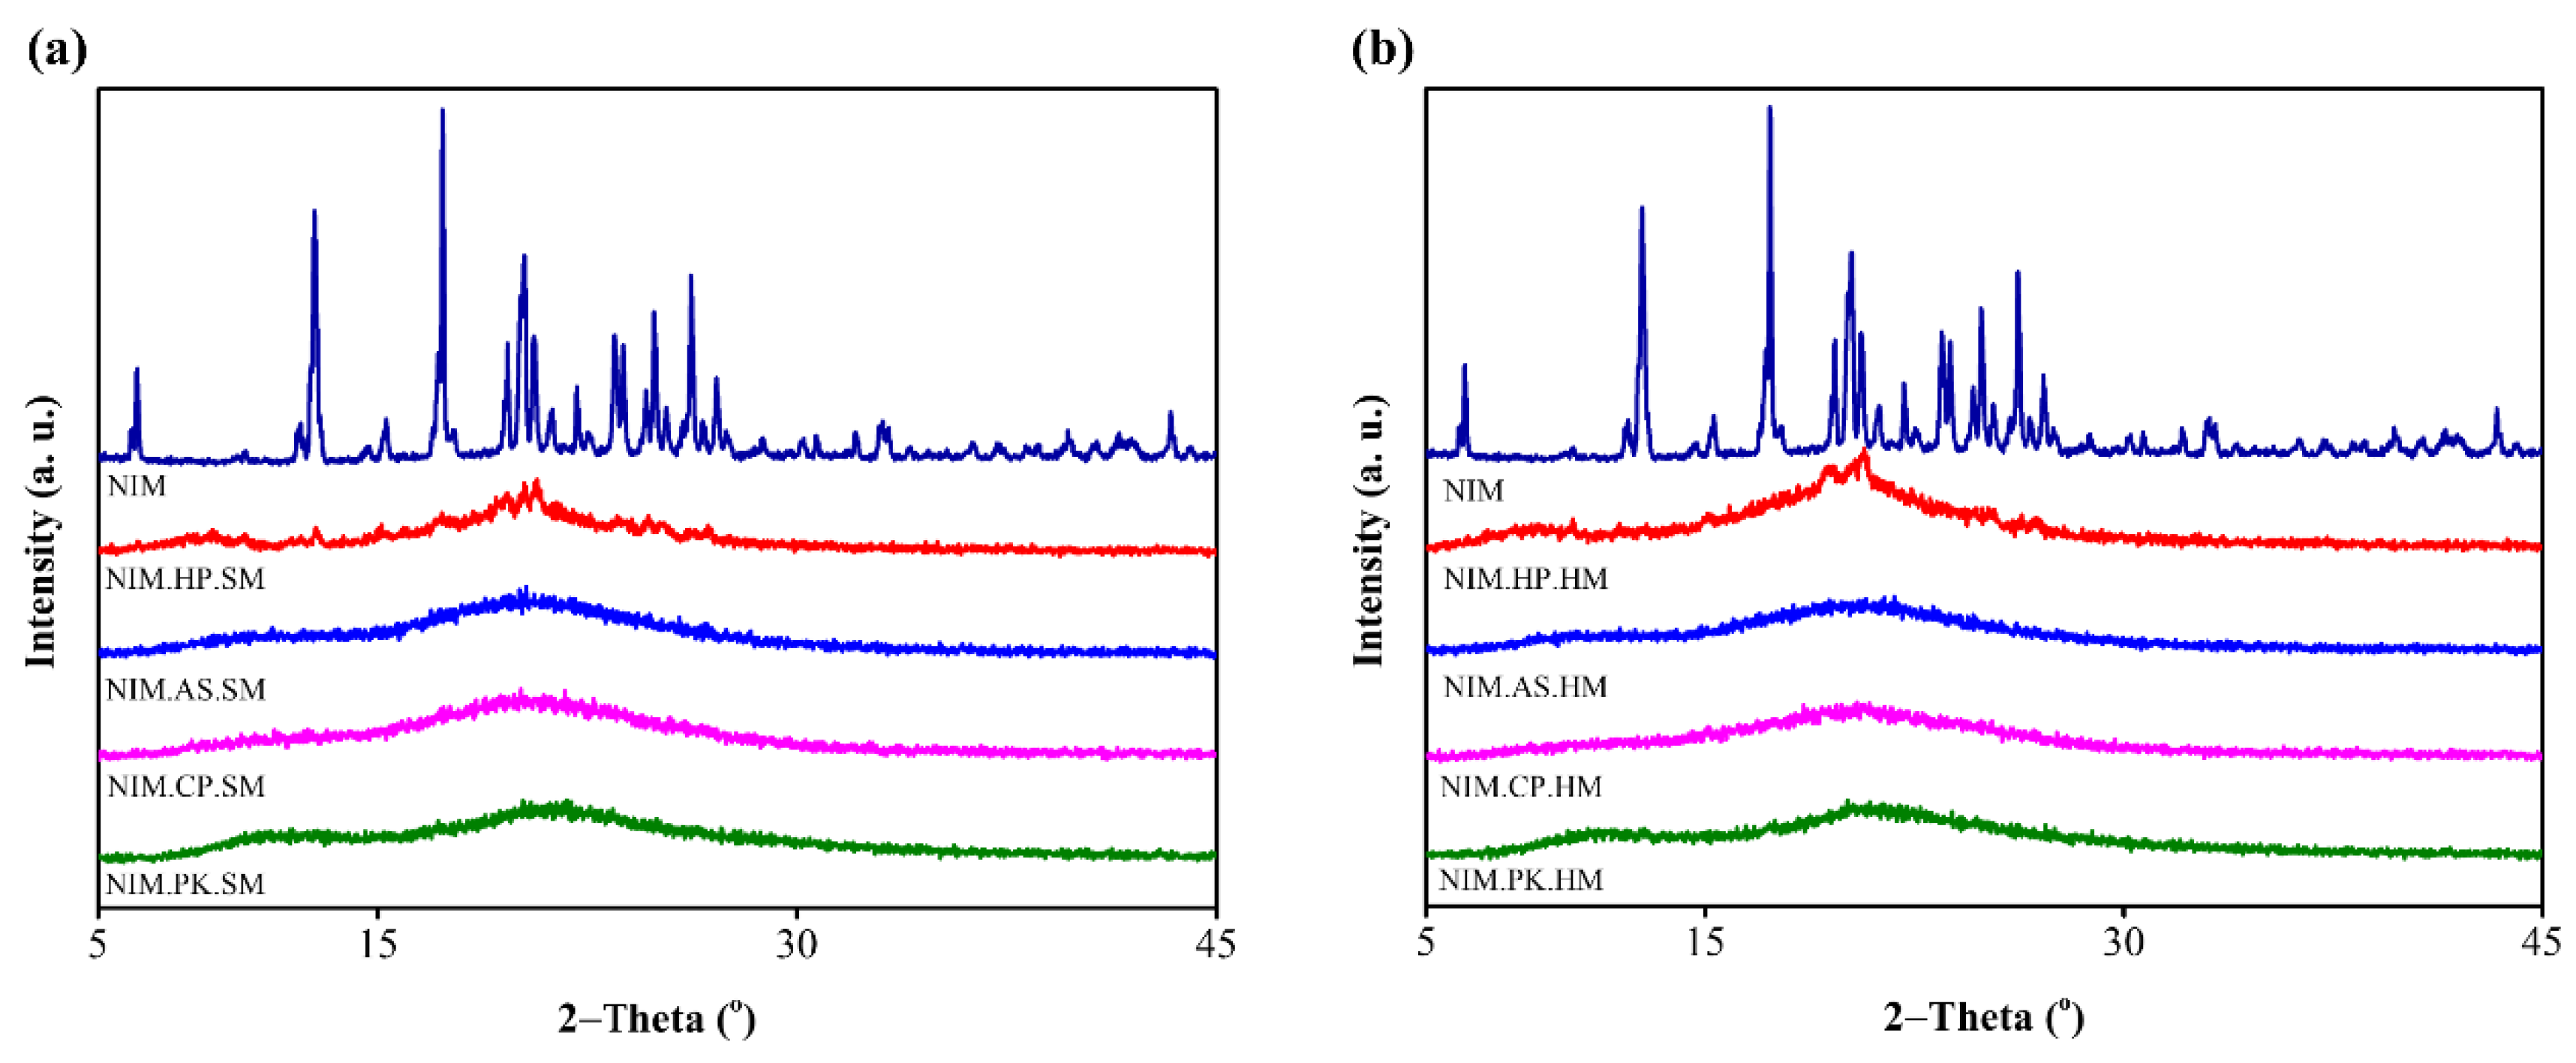
Figure 5.
SEM images of NIM and its solid dispersions at 5,000× magnification: (a) nimodipine, (b) NIM.HP.SM, (c) NIM.AS.SM, (d) NIM.CP.SM, (e) NIM.PK.SM, (f) NIM.HP.HM, (g) NIM.AS.HM, (h) NIM.CP.HM, and (i) NIM.PK.HM. SM and HM represent solid dispersions prepared using the spray–drying and melt–quenching methods, respectively.
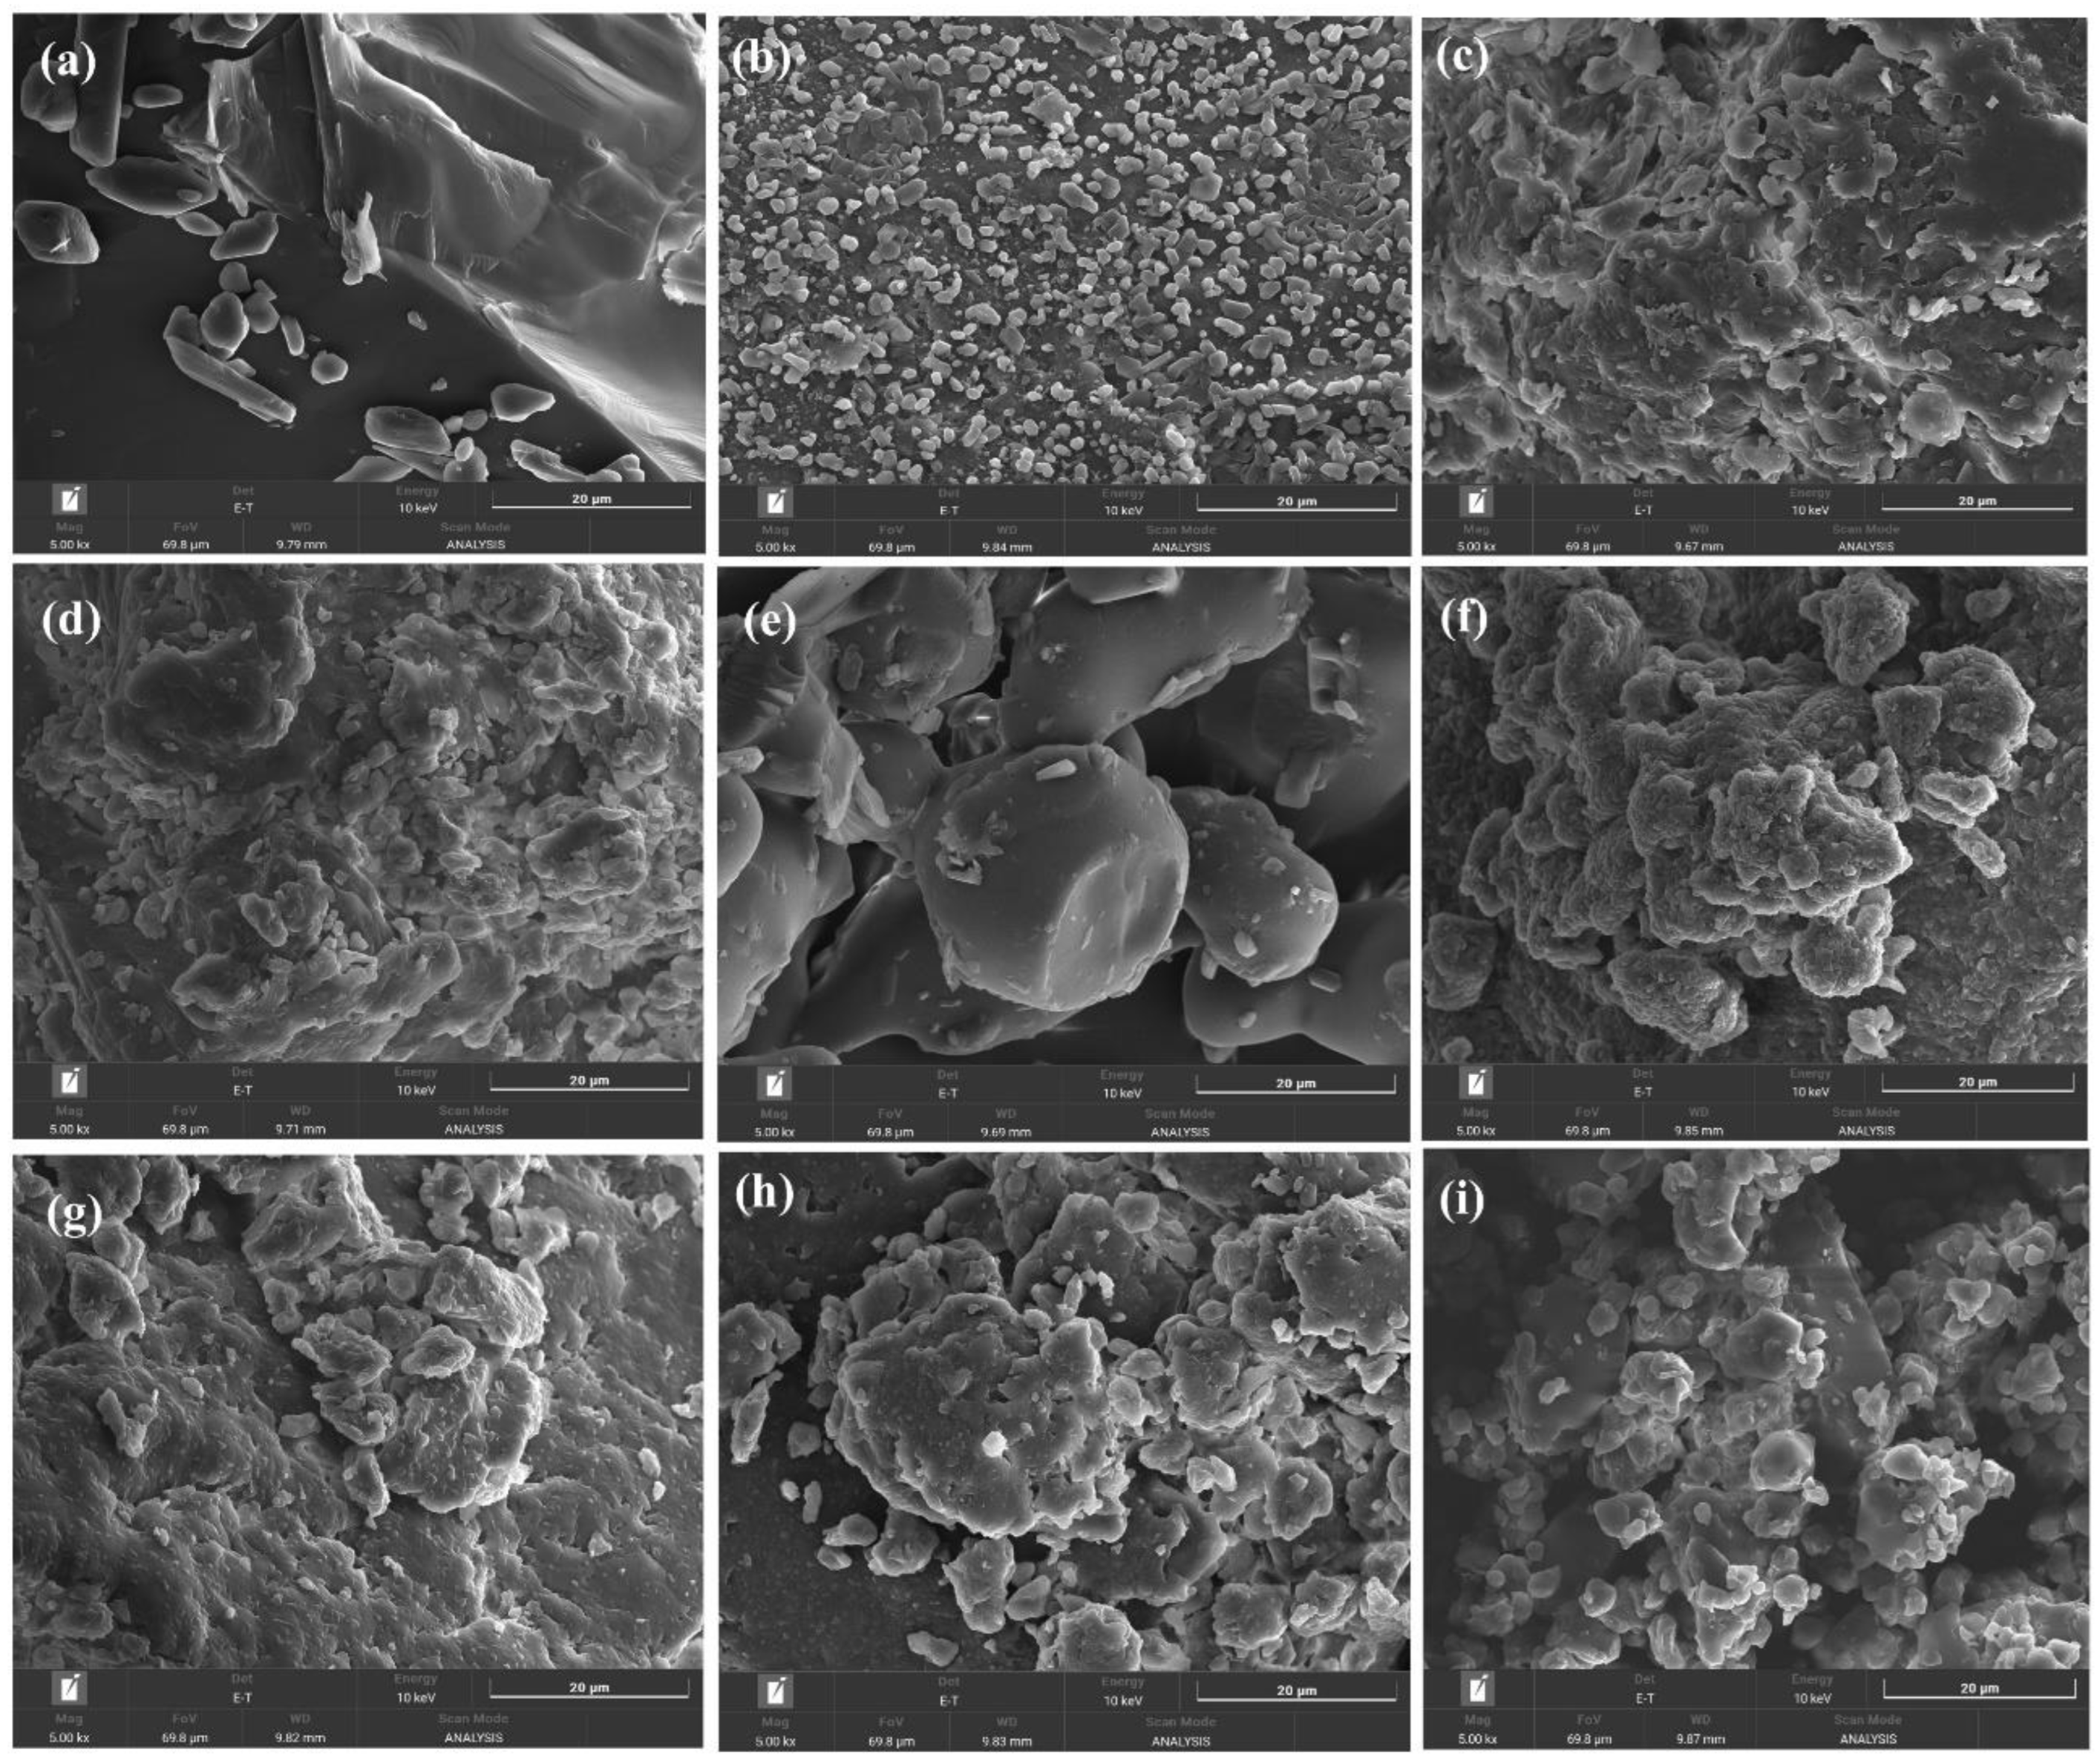
Figure 6.
Comparative solubility profiles of pure NIM and its solid dispersions in buffer solutions in pH ranges of 3.0–6.8. The data shows a significant increase in solubility for the HPMCP-based formulation in phosphate buffer at pH 6.0.
Figure 6.
Comparative solubility profiles of pure NIM and its solid dispersions in buffer solutions in pH ranges of 3.0–6.8. The data shows a significant increase in solubility for the HPMCP-based formulation in phosphate buffer at pH 6.0.
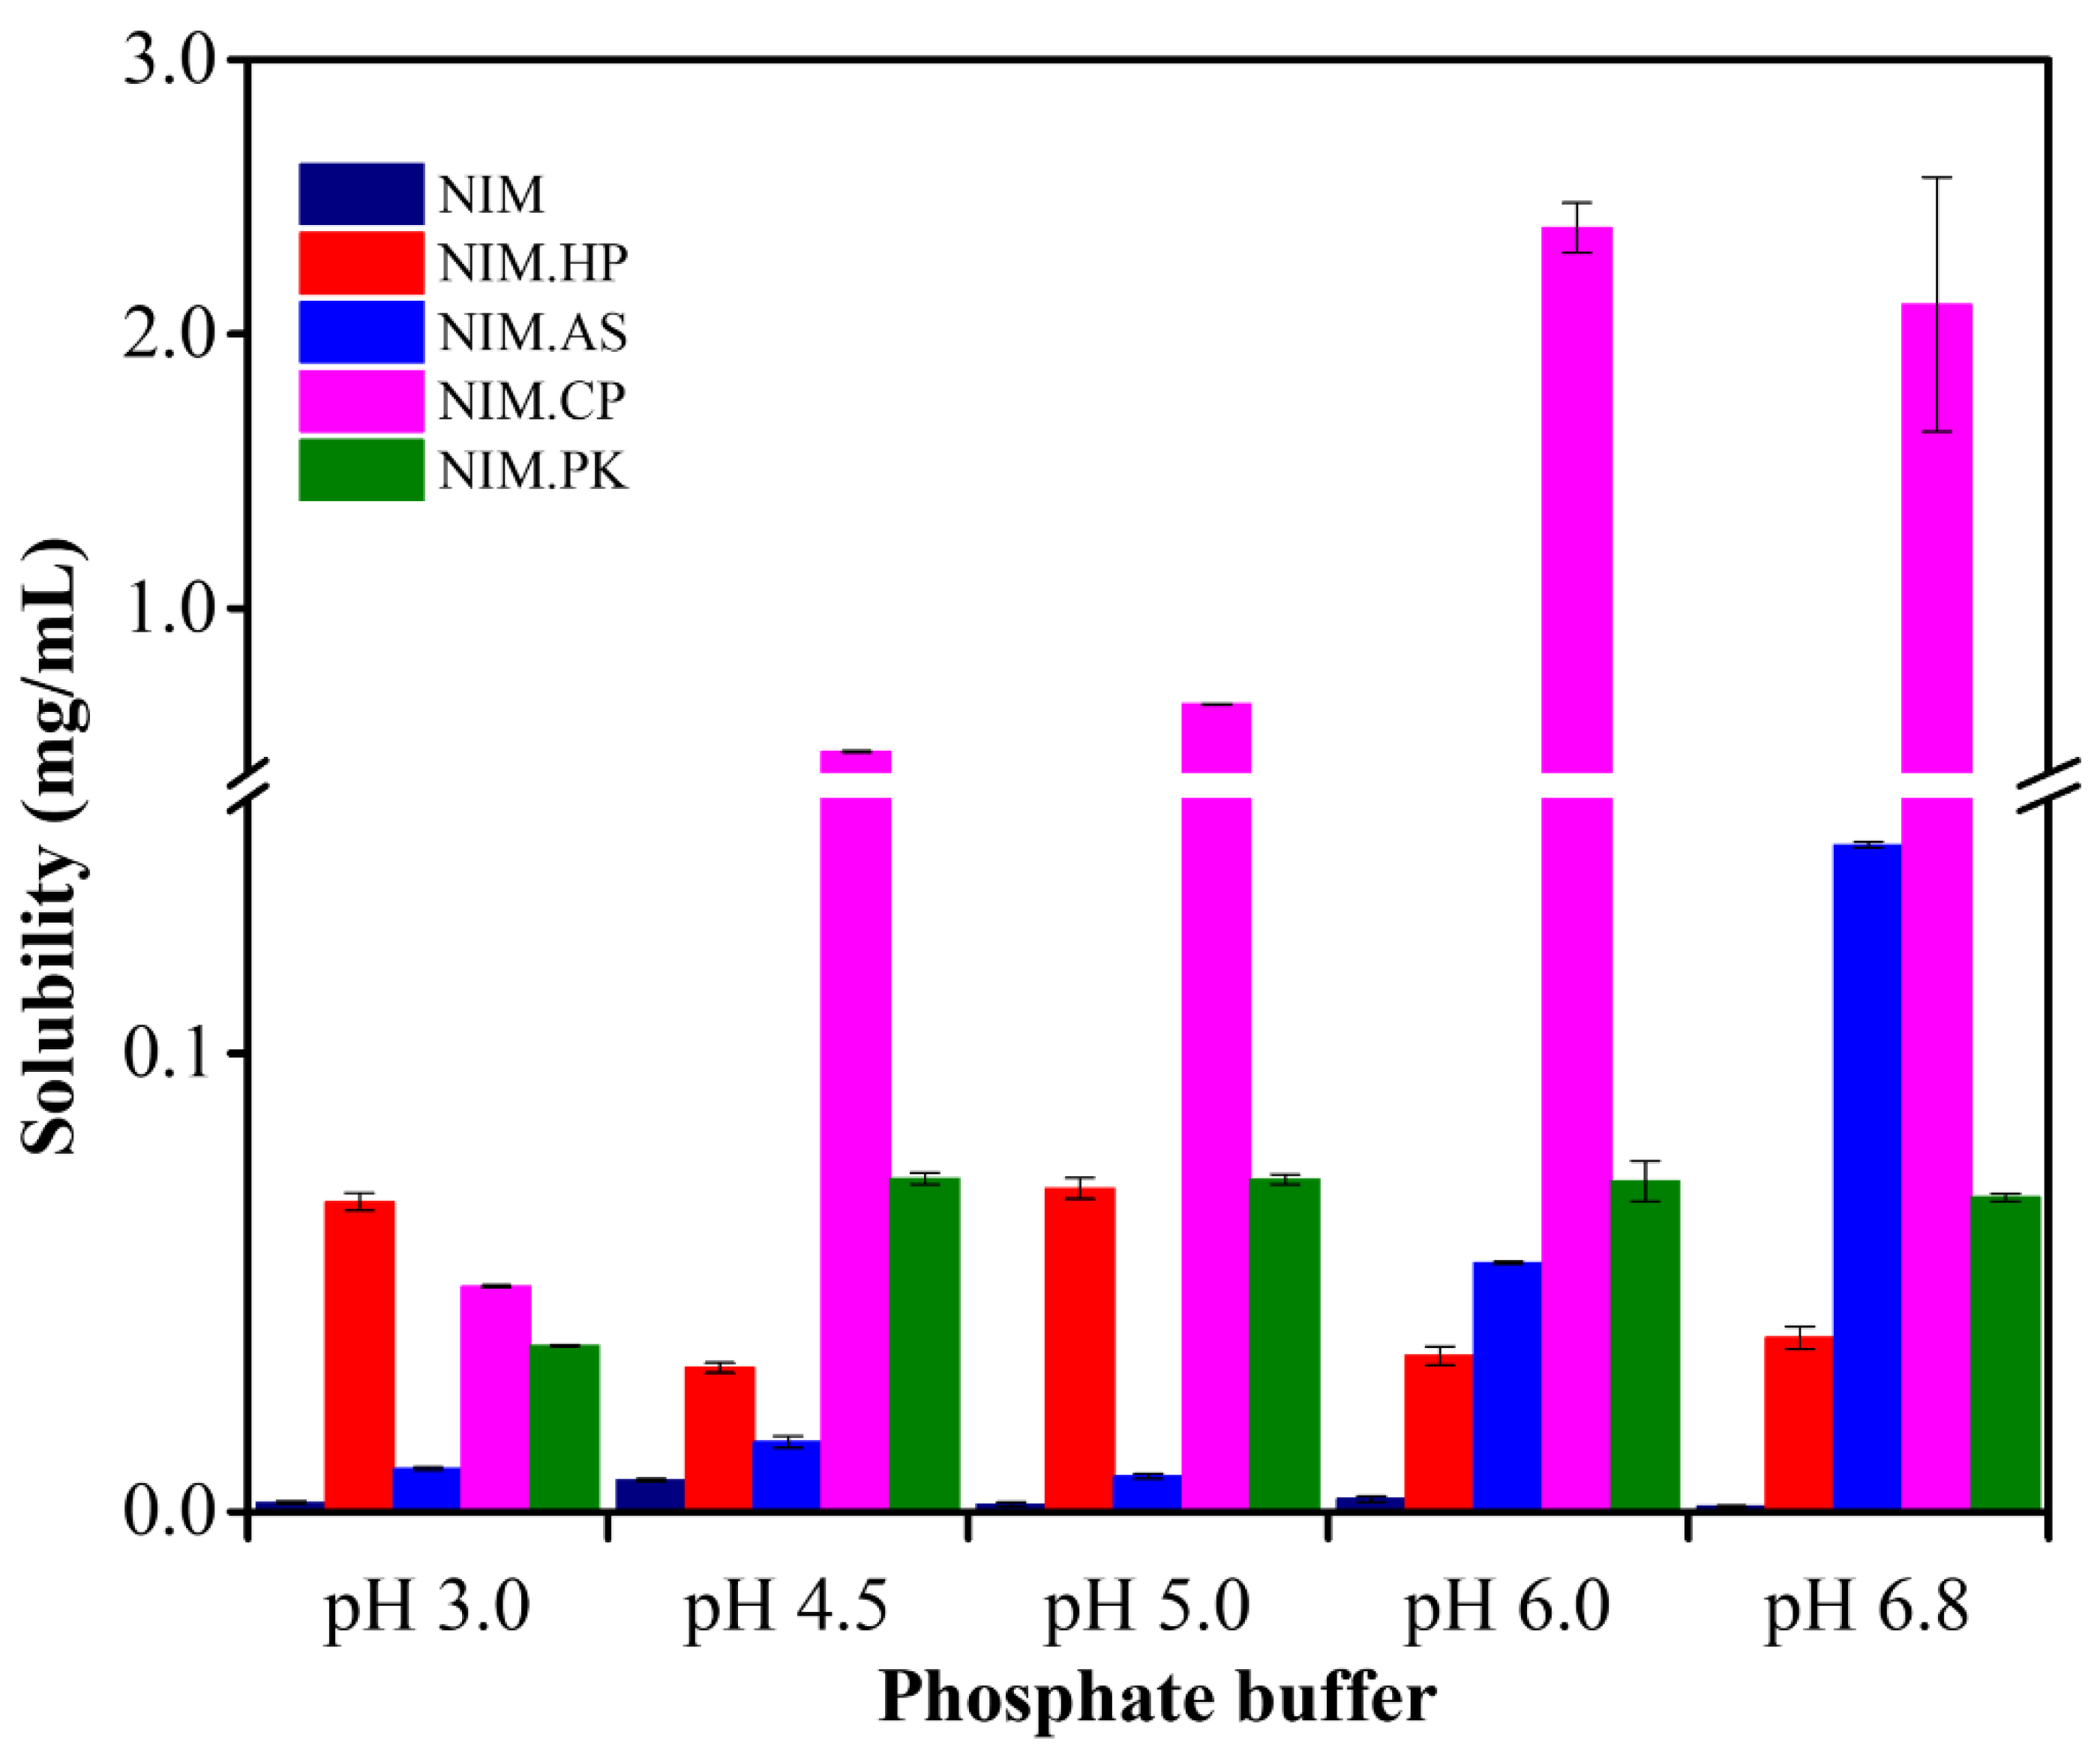
Figure 7.
Comparative in vitro release profiles of NIM and its ASDs prepared using the spray-drying method. The release profile shows the percentage of drug released over a 120-min period in phosphate buffer at (a) pH 5.0, (b) pH 6.0, and (c) pH 6.8. Under all conditions, crystalline NIM (in black), used as the reference, exhibited negligible drug release. In contrast, NIM.CP.SM (in pink) consistently demonstrated rapid and extensive drug release, indicating enhanced dissolution performance achieved with HPMCP and the spray-drying technique.
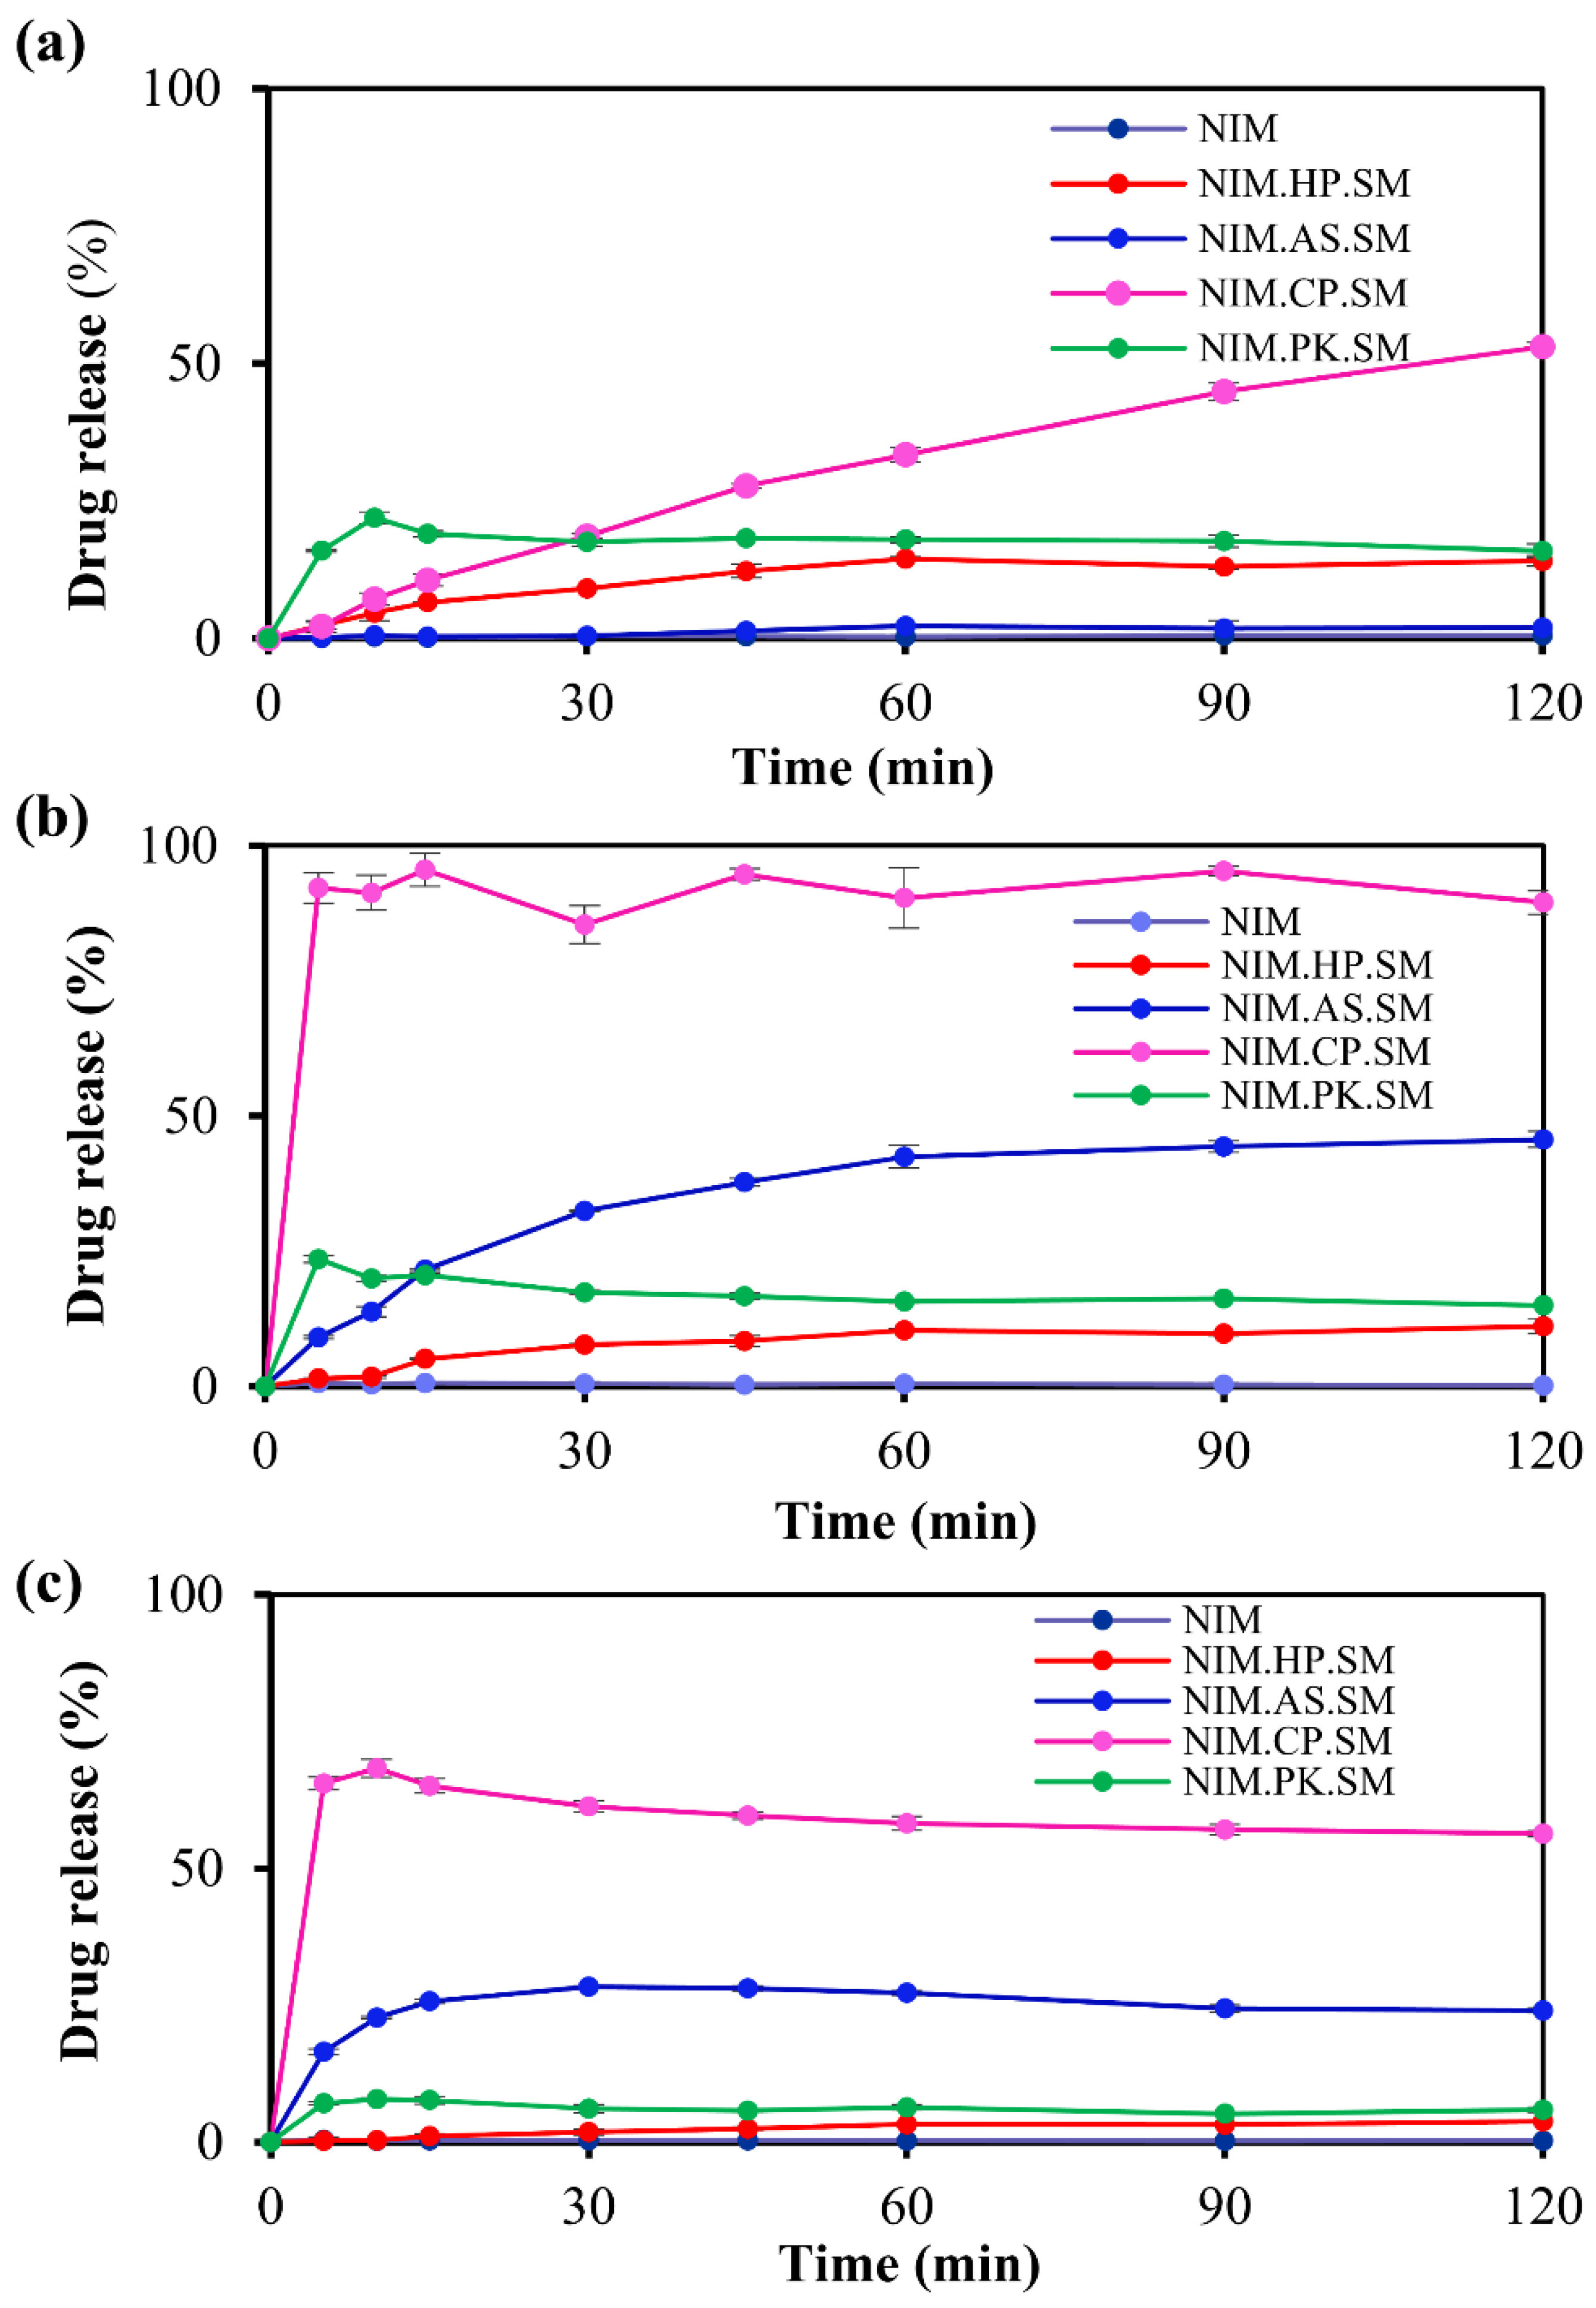
Figure 8.
Comparative in vitro drug release profiles of NIM and its ASDs prepared using the melt-quenching method. The release profile shows the percentage of drug released over a 120-min period in phosphate buffer at (a) pH 5.0, (b) pH 6.0, and (c) pH 6.8. Under all conditions, crystalline NIM (in black), used as a reference, exhibited negligible drug release. In contrast, NIM.CP.HM (in pink) shows the highest overall drug release, with maximum release observed in the pH 6.0 buffer.
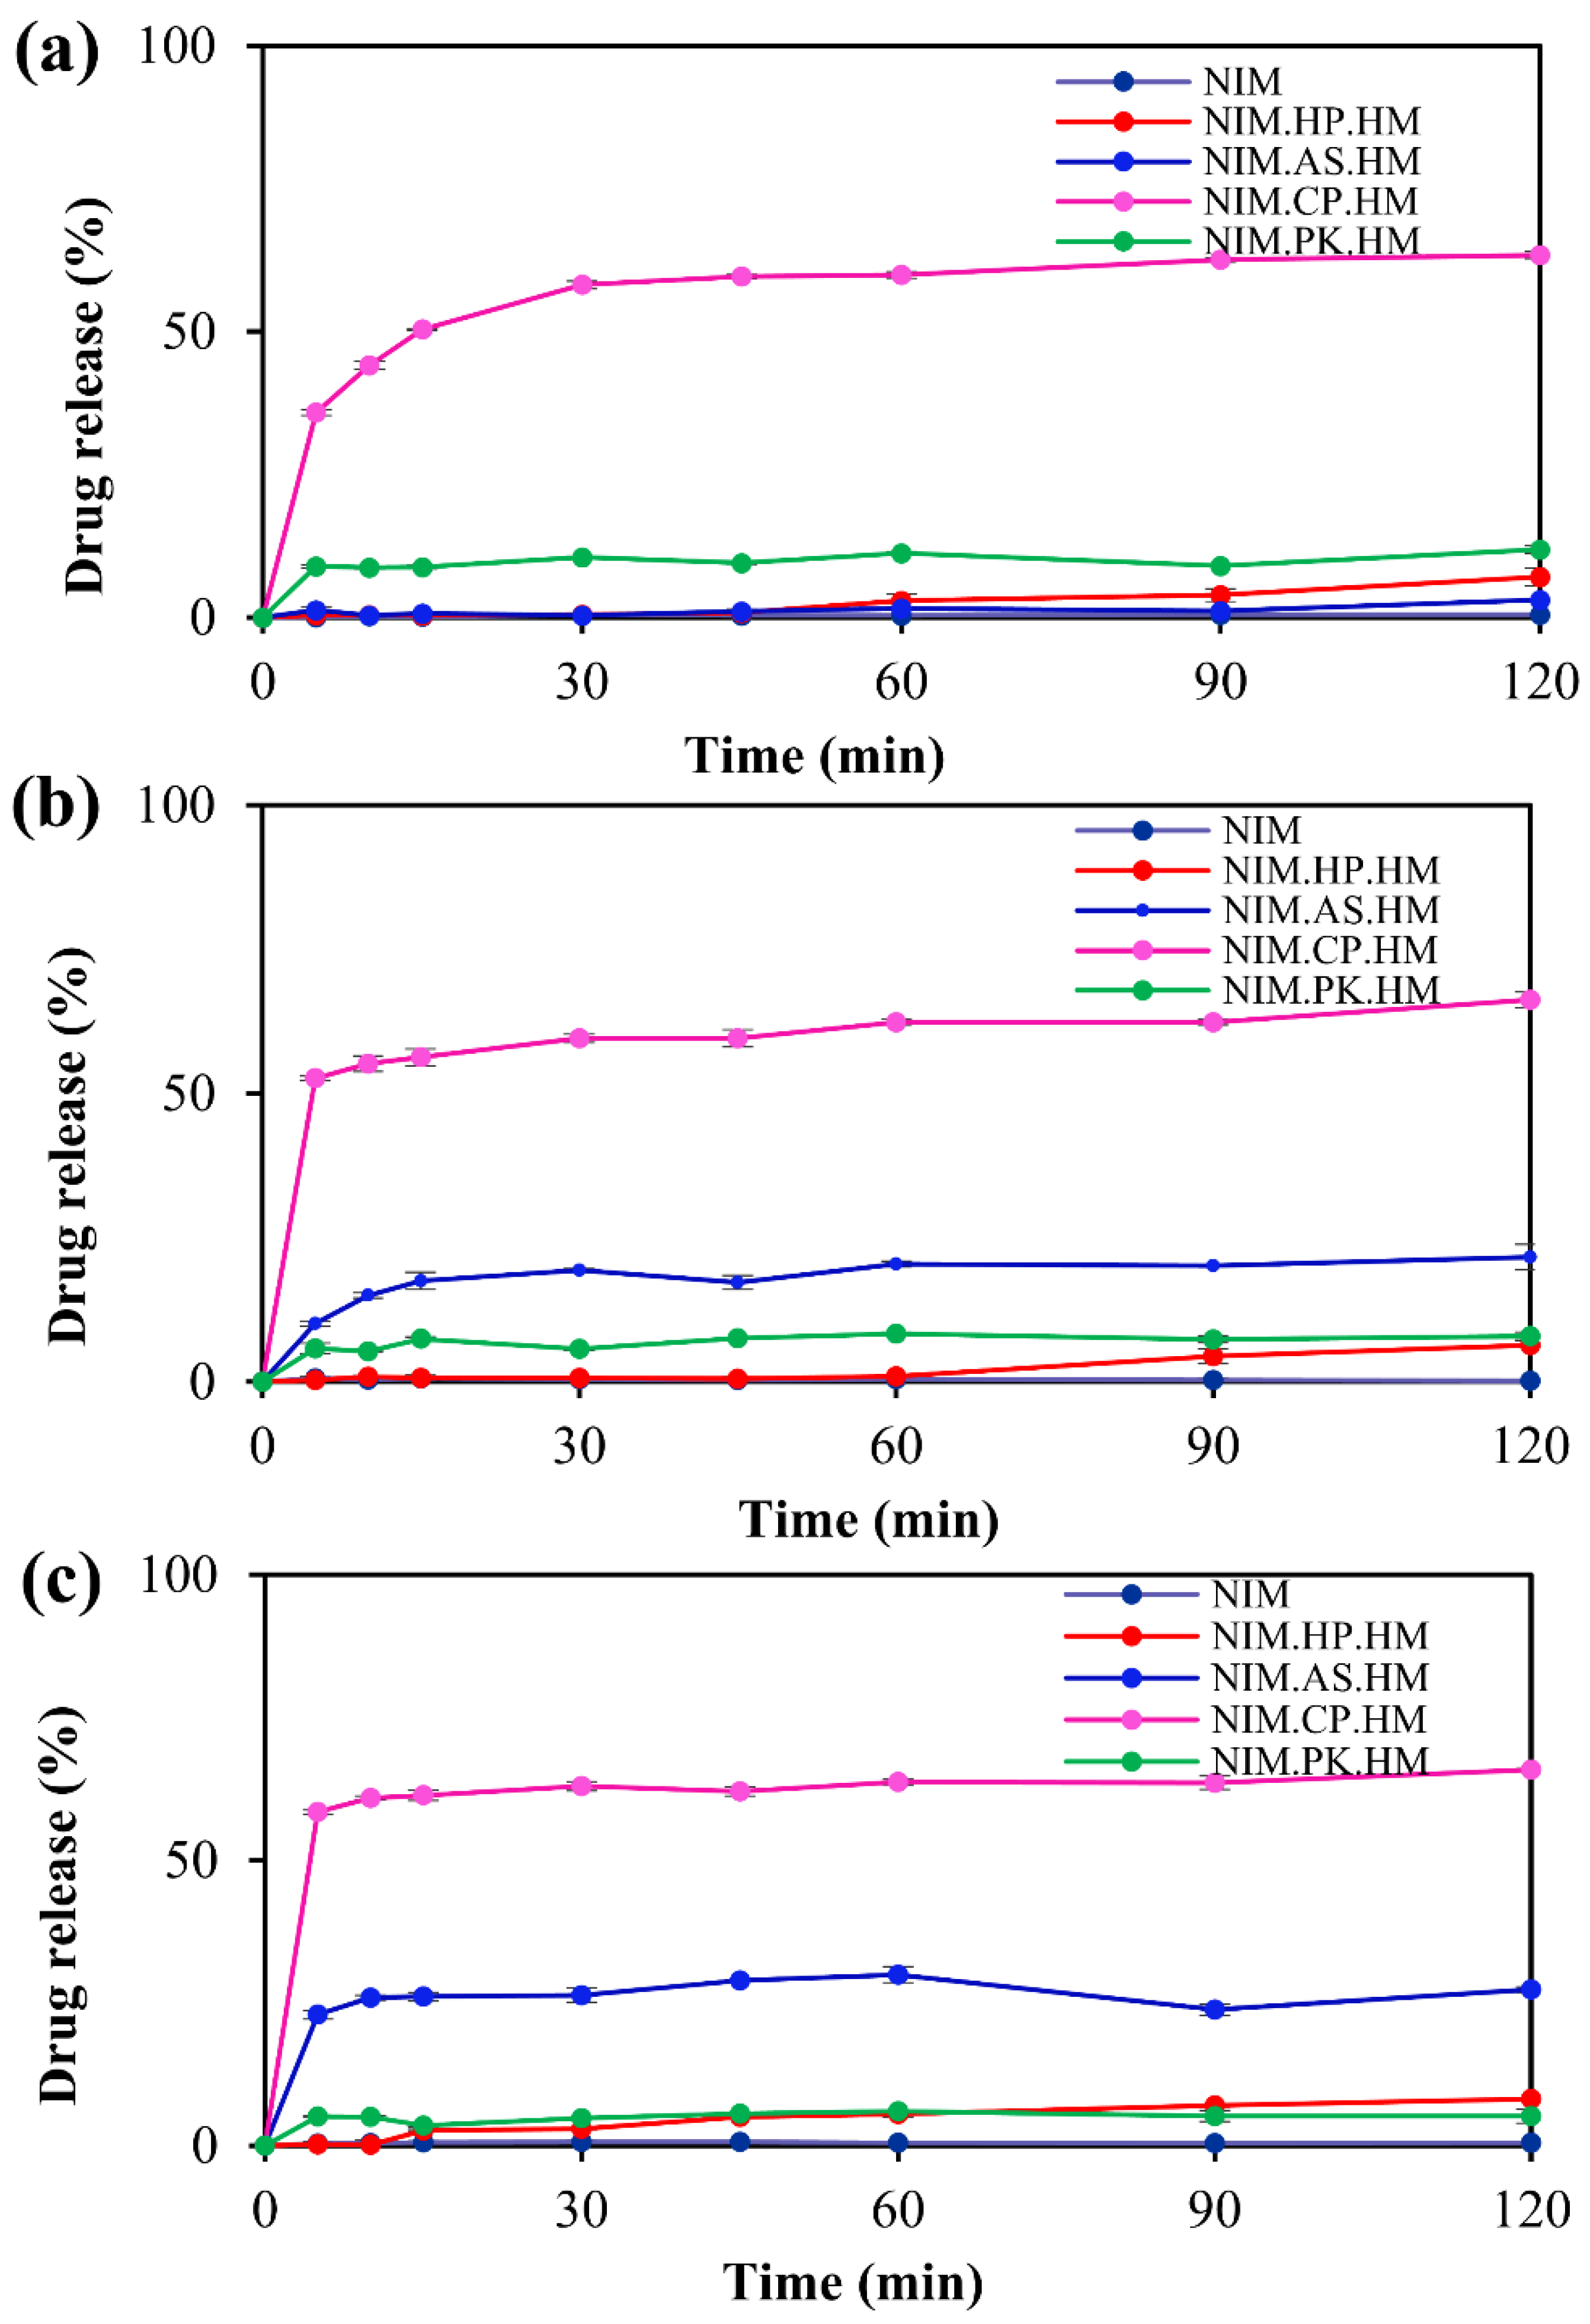
Figure 9.
Comparative in vivo plasma drug concentration–time profiles of NIM, the physical mixture, NIM.CP.SM (spray–drying), and NIM.CP.HM (melt–quenching) following oral administration in rats. The profiles show plasma drug concentration (ng/mL) vs. time (h) over a 15-h period. NIM and the physical mixture showed the lowest systemic exposure and remained near the quantification limit throughout the experiment, confirming the poor oral bioavailability of crystalline NIM. In contrast, NIM.CP.SM exhibited higher bioavailability and reached Cmax within 1–2 h (Tmax), indicating rapid in vivo absorption and an immediate-release behavior characteristic of solid dispersion. NIM.CP.HM showed enhanced drug release, but to a lesser extent than NIM.CP.SM.
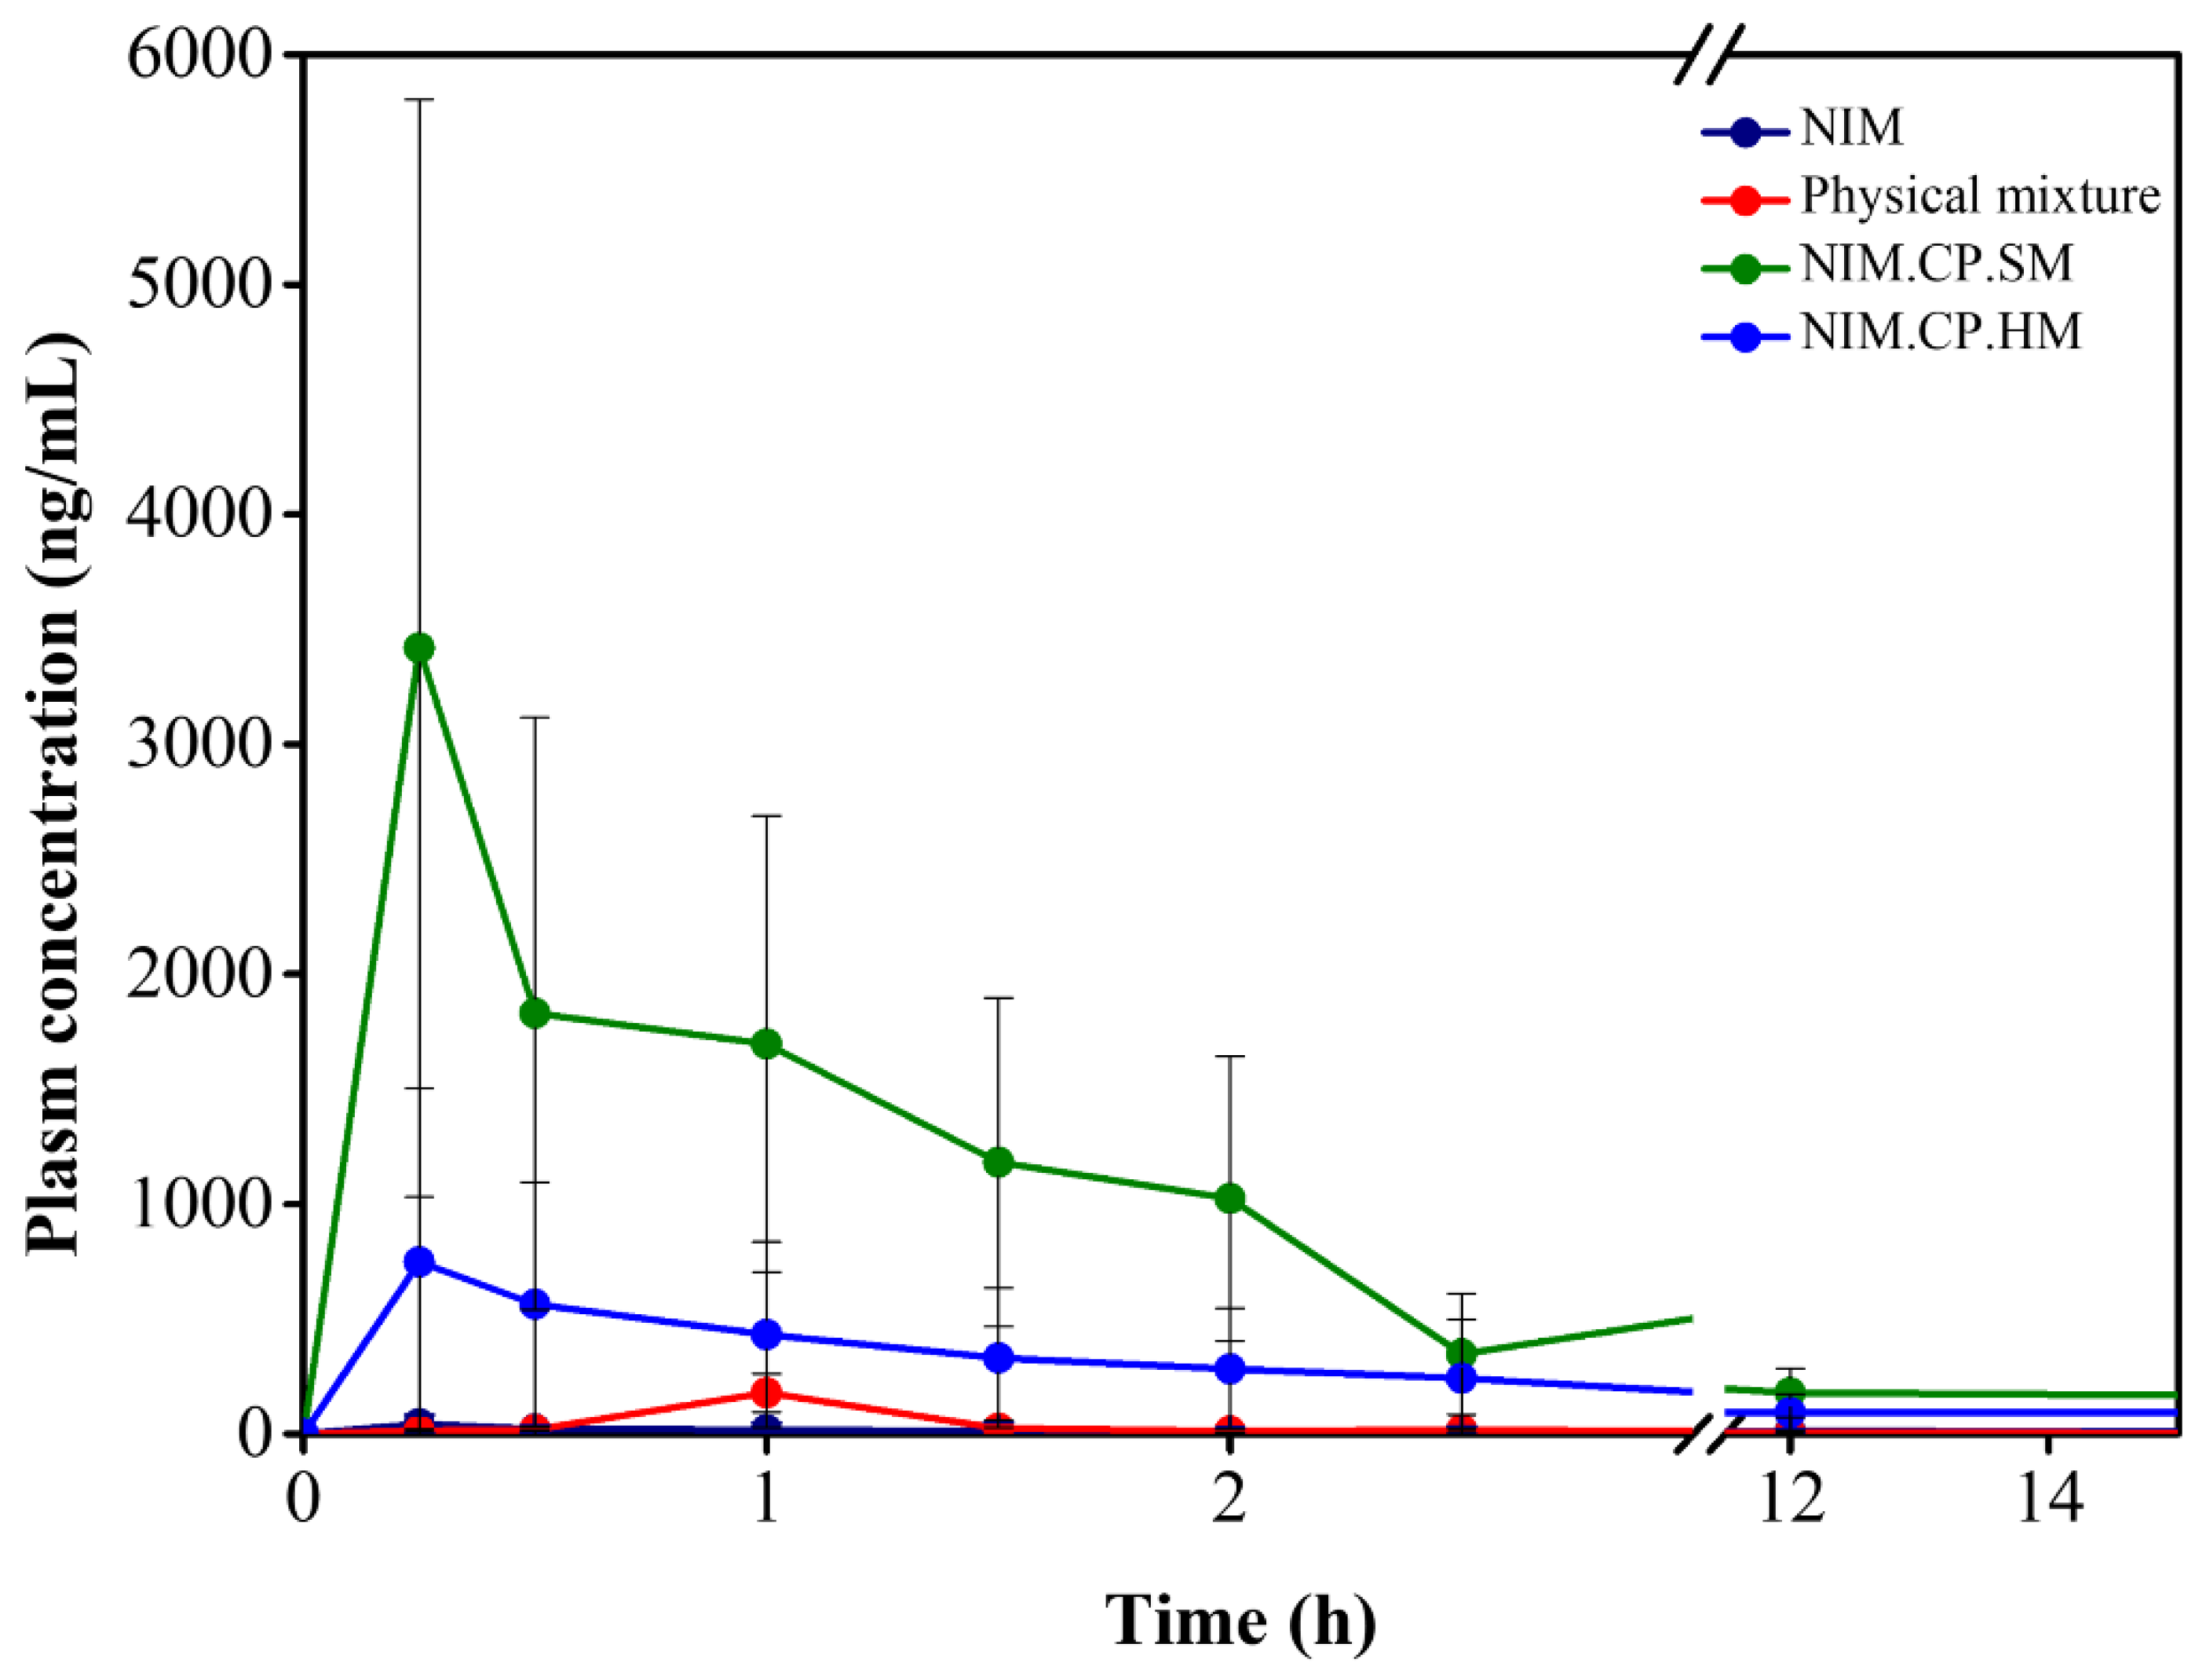

Table 1.
Tg of the solid dispersion system estimated using the Gordon–Taylor equation, suggesting close agreement between the predicted Tg values and experimental data determined using DSC.
Table 1.
Tg of the solid dispersion system estimated using the Gordon–Taylor equation, suggesting close agreement between the predicted Tg values and experimental data determined using DSC.
| Mixture | w1 | Tg1 (K) | w2 | Tg2 (K) | w1×Tg1 | w2×Tg2 | w1×Tg1+k∙w2×Tg2 | w1 + k∙w2 | Tg mix (K) | Tg mix (°C) |
|---|---|---|---|---|---|---|---|---|---|---|
| NIM.HP.PM | 0.25 | 398.15 | 0.75 | 381.15 | 99.54 | 285.86 | 385.4 | 1.07 | 360.19 | 87.037 |
| NIM.AS.PM | 0.25 | 398.15 | 0.75 | 393.15 | 99.54 | 294.86 | 394.4 | 1.09 | 361.83 | 88.685 |
| NIM.CP.PM | 0.25 | 398.15 | 0.75 | 406.15 | 99.54 | 304.61 | 404.15 | 1.09 | 370.78 | 97.630 |
| NIM.PK.PM | 0.25 | 398.15 | 0.75 | 383.15 | 99.54 | 287.36 | 386.9 | 1.08 | 358.24 | 85.091 |
NIM, nimodipine; PM, physical mixture; HP, hydroxypropyl cellulose (HPC); AS, hydroxypropyl methylcellulose acetate succinate (HPMCAS); CP, hydroxypropyl methylcellulose phthalate (HPMCP); and PK, polyvinylpyrrolidone K25 (PVP K25); Tg1, predicted glass transition temperature of the mixture (drug); Tg2, glass transition temperature of the second component (polymer); w1, weight fraction of the first component (drug); w2, weight fraction of the second component (polymer); and K, Gordon-Taylor constant.
Table 2.
Thermodynamic parameters used to calculate the Flory–Huggins interaction parameter (χ) for drug–polymer solid dispersions, including temperature, enthalpy, and volume fraction values for nimodipine with HPC, HPMCAS, HPMCP, and PVP K25.
Table 2.
Thermodynamic parameters used to calculate the Flory–Huggins interaction parameter (χ) for drug–polymer solid dispersions, including temperature, enthalpy, and volume fraction values for nimodipine with HPC, HPMCAS, HPMCP, and PVP K25.
| ASDs | R |
|
|
|
|
||||||||||
|---|---|---|---|---|---|---|---|---|---|---|---|---|---|---|---|
| NIM.HP.SM | 0.011 | 0.008 | 8.314 | 90.48 | 0.092 | 0.25 | 1.333 | –0.333 | 0.75 | –0.602 | –1.636294 36112 |
0.5625 | –0.1503 55342 |
0.0986 68505 |
0.0353 64656 |
| NIM.AS.SM | 0.011 | 0.008 | 8.314 | 90.48 | 0.092 | 0.25 | 1.333 | –0.333 | 0.75 | –0.602 | –1.636294 36112 |
0.5625 | –0.1503 55342 |
0.0986 68505 |
0.0332 00883 |
| NIM.CP.SM | 0.010 | 0.008 | 8.314 | 90.48 | 0.092 | 0.25 | 1.333 | –0.333 | 0.75 | –0.602 | –1.636294 36112 |
0.5625 | –0.1503 55342 |
0.0986 68505 |
0.0227 30379 |
| NIM.PK.SM | 0.012 | 0.008 | 8.314 | 90.48 | 0.092 | 0.25 | 1.333 | –0.333 | 0.75 | –0.602 | –1.636294 36112 |
0.5625 | –0.1503 55342 |
0.0986 68505 |
0.038 02794 |
NIM, nimodipine; SM, spray dry; HP, hydroxypropyl cellulose (HPC); AS, hydroxypropyl methylcellulose acetate succinate (HPMCAS); CP, hydroxypropyl methylcellulose phthalate (HPMCP); and PK, polyvinylpyrrolidone K25 (PVP K25); Tmix, melting temperature of the solid dispersion; Tpure, melting temperature of the drug; , fusion of the drug; m, volume ratio of polymer to drug; , volume fractions of the drug; and , volume fractions of the polymer.
Table 3.
Estimated solubility parameters and Flory–Huggins interaction parameters for nimodipine–polymer systems.
Table 3.
Estimated solubility parameters and Flory–Huggins interaction parameters for nimodipine–polymer systems.
| Drug/polymer | Hansen solubility parameter (MPa0.5) |
∆ (MPa 0.5) (polymer–drug) |
|---|---|---|
| NIM | 21.89 | – |
| HPC LS–21 | 22.11 | 0.22 |
| HPMCAS MG | 23.62 | 1.73 |
| HPMCP HP–50 | 25.10 | 3.21 |
| PVP K–25 | 25.12 | 3.23 |
NIM, nimodipine; HP LS-21, hydroxypropyl cellulose (HPC); HPMCAS MG, hydroxypropyl methylcellulose acetate succinate (HPMCAS); HPMCP HP–50, hydroxypropyl methylcellulose phthalate (HPMCP); and PVP K–25, polyvinylpyrrolidone K25 (PVP K25).
Table 4.
Physical state characterization of nimodipine and solid dispersions prepared using spray–drying and melt–quenching methods, as determined from DSC thermograms.
Table 4.
Physical state characterization of nimodipine and solid dispersions prepared using spray–drying and melt–quenching methods, as determined from DSC thermograms.
| Solid dispersions | Thermodynamic events (°C) | ||
|---|---|---|---|
| Onset | Tg/Tm | Endset | |
| NIM | – | 124.92 | – |
| NIM.HP.SM | 100.67 | 104.20 | 109.29 |
| NIM.AS.SM | 81.92 | 83.35 | 88.51 |
| NIM.CP.SM | 84.96 | 86.35 | 95.10 |
| NIM.PK.SM | 104.13 | 109.17 | 115.61 |
| NIM.HP.HM | 102.55 | 104.09 | 105.09 |
| NIM.AS.HM | 104.91 | 107.02 | 108.83 |
| NIM.CP.HM | 101.79 | 110.13 | 112.83 |
| NIM.PK.HM | 73.95 | 75.42 | 94.53 |
NIM, nimodipine; HP, hydroxypropyl cellulose (HPC); AS, hydroxypropyl methylcellulose acetate succinate (HPMCAS); CP, hydroxypropyl methylcellulose phthalate (HPMCP); PK, polyvinylpyrrolidone K25 (PVP K25); SM, spray-dried; HM, hot-melt (melt-quenched); DSC, differential scanning calorimetry; Tg, transition glass temperature; and Tm, melting temperature.
Table 5.
Selected functional groups observed in the IR spectra of nimodipine and its solid dispersion systems.
Table 5.
Selected functional groups observed in the IR spectra of nimodipine and its solid dispersion systems.
| Functional group | NIM (cm−1) |
NIM.HP.SM (cm−1) |
NIM.AS.SM (cm−1) |
NIM.CP.SM (cm−1) |
NIM.PK.SM (cm−1) |
NIM.HP.HM (cm−1) |
NIM.AS.HM (cm−1) |
NIM.CP.HM (cm−1) |
NIM.PK.HM (cm−1) |
|---|---|---|---|---|---|---|---|---|---|
| N–H | 3292 | – | – | – | – | – | – | – | – |
| C–H | 2983 | 2970 | 2955 | 2935 | 2938 | 2971 | 2980 | 2978 | 2982 |
| C=O | 1691 | 1694 | 1737 | 1725 | 1653 | 1696 | 1735 | 1697 | 1650 |
| C=C | 1647 | 1649 | 1694 | 1696 | 1522 | 1644 | 1696 | 1644 | 1526 |
| CH3 | 1345 | 1348 | 1347 | 1351 | 1350 | 1349 | 1351 | 1349 | 1347 |
NIM, nimodipine; HP, hydroxypropyl cellulose (HPC); AS, hydroxypropyl methylcellulose acetate succinate (HPMCAS); CP, hydroxypropyl methylcellulose phthalate (HPMCP); PK, polyvinylpyrrolidone K25 (PVP K25); SM, spray-dried; HM, hot-melt (melt-quenched); FTIR, Fourier-transform infrared spectroscopy.
Table 6.
In vivo pharmacokinetic parameters of nimodipine, physical mixture, and ASDs after oral administration, as prepared by the spray-drying and melt-quenching methods.
Table 6.
In vivo pharmacokinetic parameters of nimodipine, physical mixture, and ASDs after oral administration, as prepared by the spray-drying and melt-quenching methods.
| Group | Solid dispersions | Half life (h) |
Tmax (h) |
Cmax (ng/mL) |
AUC0–24 (ng∙h/mL) |
AUC0–∞ (ng∙h/mL)) |
|---|---|---|---|---|---|---|
| 1 | Nimodipine | 15.50 ± 6.12 | 3.13 ± 3.01 | 74.93 ± 10.23 | 332.50 ± 120.21 | 428.10 ± 325.61 |
| 2 | Physical mixture | 7.47 ± 3.56 | 1.00 ± 0.41 | 73.62 ± 75.95 | 174.75 ± 50.65 | 218.08 ± 150.12 |
| 3 | NIM.CP.SM | 16.09 ± 15.03 | 0.25 ± 0.12 | 2480.80 ± 1629.26 | 4672.92 ± 3395.65 | 6545.04 ± 531.65 |
| 4 | NIM.CP.HM | 30.32 ± 33.40 | 0.31 ± 0.13 | 777.56 ± 1448.63 | 2546.46 ± 651.58 | 7128.17 ± 4760.26 |
Tmax, time to reach maximum plasma concentration; Cmax, maximum plasma concentration; AUC₀–₂₄, area under the plasma concentration–time curve from 0 h to 24 h; AUC₀–∞, area under the curve from 0 to infinity; NIM.CP.SM, nimodipine–HPMCP solid dispersion prepared using the spray–drying method; NIM.CP.HM, nimodipine–HPMCP solid dispersion prepared using the melt–quenching method.
Disclaimer/Publisher’s Note: The statements, opinions and data contained in all publications are solely those of the individual author(s) and contributor(s) and not of MDPI and/or the editor(s). MDPI and/or the editor(s) disclaim responsibility for any injury to people or property resulting from any ideas, methods, instructions or products referred to in the content. |
© 2026 by the authors. Licensee MDPI, Basel, Switzerland. This article is an open access article distributed under the terms and conditions of the Creative Commons Attribution (CC BY) license (http://creativecommons.org/licenses/by/4.0/).
Copyright: This open access article is published under a Creative Commons CC BY 4.0 license, which permit the free download, distribution, and reuse, provided that the author and preprint are cited in any reuse.


