Submitted:
13 January 2026
Posted:
15 January 2026
You are already at the latest version
Abstract
Beak and feather disease virus (BFDV, species Circovirus parrot) is the causative agent of psittacine beak and feather disease (PBFD), characterised primary by death of nestlings, feather loss and presumed immunosuppression in parrots worldwide. BFDV shows marked genetic heterogeneity, particularly in the open reading frame 2 (ORF2) encoding the capsid protein (Cap), but the impact of this diversity on antibody recognition has not been systematically assessed. In this study, we used seven recombinant Cap proteins derived from ORF2 variants selected to reflect the diversity of BFDV strains circulating in psittacine birds. N-terminally truncated, codon-optimised cap gene constructs were expressed in Escherichia coli and tested by semi-quantitative Western blot and indirect ELISA using sera from eight naturally infected, BFDV PCR-positive psittacine birds. Both assays revealed clear antigen-serum dependent differences in reactivity, with several sera failing to produce detectable signals against some Cap variants under the conditions used. These findings provide experimental evidence that amino-acid variation in Cap can be associated with distinct antibody binding patterns in naturally infected birds. The observed heterogeneity in antigen recognition has direct implications for natural infections with BFDV, for the design and interpretation of BFDV serological assays and should be considered in future development of Cap-based vaccines.
Keywords:
antigen variation
; beak and feather disease virus
; circovirus
; ELISA
; genetic variation
; parrot
; psittacine beak and feather disease recombinant capsid protein
; serology
; Western blot
1. Introduction
Psittacine beak and feather disease (PBFD) is a highly contagious and often severe disease of psittacine birds worldwide. Its causative agent is beak and feather disease virus (BFDV; species Circovirus parrot) which is classified within the genus Circovirus in the family Circoviridae. It is a small, non-enveloped virus with a single-stranded, circular DNA genome [1,2].
BFDV is a globally distributed pathogen that occurs at considerable prevalences in both wild species and birds kept in human care on multiple continents; a recent meta-analysis estimated a pooled global prevalence of 16.3% with an upward trend over time [3,4]. It poses a particular threat to small populations and endangered species, where even moderate prevalence can have disproportionate demographic effects [5,6]. Infection has been documented in at least 78 psittacine species and all parrot species are considered susceptible to BFDV [7,8].
Clinically, affected birds may show apathy, progressive feather dystrophy and feather loss or brittle and overgrown beaks depending on their age and species [1,9]. Different clinical courses are recognised including peracute, acute and chronic forms, as well as asymptomatic and subclinical forms that are of particular importance for virus maintenance and spread [10,11]. Acute disease with sudden death is most frequently reported in juveniles and nestlings [10], whereas older individuals may survive for years and might be affected by secondary infections as a consequence of assumed BFDV-associated immunosuppression [12,13]. Subclinical and latent BFDV infections appear to be common in both wild and captive psittacine populations, with virus detectable in clinically unremarkable birds and persisting in tissues for months to years, indicating long-term and potentially lifelong infection in at least some individuals, that can play an important role in virus shedding and spread [14,15,16,17].
BFDV is highly stable in the environment and can be transmitted via faeces, feather dust and crop secretions [18,19] and there is evidence of vertical (egg-associated) transmission [20]. Since there is no cure for PBFD and no vaccine is commercially available, early detection of infected birds and separation from susceptible stocks are key elements of PBFD control [21,22].
At the molecular level, the approximately 2.0kb circular genome of BFDV contains two major ambisense open reading frames (ORF1 and ORF2) with well-characterised functions: ORF1 encodes the replication-associated protein (Rep) and ORF2 encodes the capsid protein (Cap), which assembles into a T=1 icosahedral capsid composed of 60 identical subunits [23,24,25]. The Cap protein constitutes the major structural antigen of the virion, plays an important role in virus attachment and cell entry, and elicits virus-specific antibody responses in infected birds [26,27,28] Consequently, recombinant Cap has been used as an antigen in serological assays and has also been evaluated as a subunit vaccine candidate in experimental vaccination and challenge studies [27,28,29,30].
An important characteristic of BFDV is its marked genetic diversity. Numerous genetically distinct strains have been described, forming several virus clades and subclades in recent phylogenetic analyses [4,31]. This diversity arises from a combination of point mutations, insertions/deletions within the genome and frequent recombination events [24,32]. There is growing evidence that some lineages show host association or host specificity [4,24,32,33]. Both the rep and cap genes are subject to genetic variation, but variability is particularly pronounced in the Cap-encoding ORF2, while the ORF1 is comparatively more conserved [34]. Cap sequence heterogeneity is evident at both the nucleotide and amino acid levels [34] suggesting that it may influence antigenic structure and epitope presentation as well as the development of a protective immunity. These characteristics also have important implications for the molecular and, most likely, the serological diagnosis of BFDV infection.
Accurate diagnosis of BFDV infection is central to any control programme, as reliable identification of infected birds is essential for implementing effective protective and biosecurity measures. Viral culture is not yet available for psittacine circoviruses, so BFDV detection relies mainly on polymerase chain reaction (PCR)-based assays, which are widely used and mostly target the rep gene [35,36,37]. However, when used on live birds, PCR can only identify those that are actively shedding viral DNA in the sampled material (typically feathers, cloacal swabs and/or blood) at the time of sampling. Asymptomatically infected carrier birds that are not shedding virus, or shed virus only intermittently at low levels, may therefore test negative and remain undetected, thereby posing a continued risk to presumably BFDV-free flocks [15]. Furthermore, due to the high mutation rate of BFDV, there is always a risk of mutations occurring in critical 3’ ends of the PCR primer region, resulting in a failure of primer binding and thus a failure to detect the virus (false negative results).
Serological methods for detecting BFDV-specific antibodies, such as haemagglutination inhibition (HI) or enzyme-linked immunosorbent assays (ELISAs), can help to better assess the infection status of individual animals and monitor populations, but are at present not widely available. Only a limited number of scientific publications have described such assays [28,38,39] and none have addressed how the genetic diversity in different BFDV strains or subtypes influences the formation of specific antibodies in psittacine hosts or antibody detection in diagnostic tests. This antigenic variability raises the question of whether strain-specific differences in Cap affect antibody binding, or whether a general cross-reactive immunity exists for divergent BFDV strains. This is not only relevant for the design and interpretation of serological assays in diagnostic settings but also for conceptualising potential vaccines and for improving our understanding of natural host defence mechanisms and disease pathogenesis. However, there is currently a lack of empirical data on how Cap variation affects antibody binding to different BFDV strains.
The research hypothesis for this study was that differences in antigenicity between genetically distinct BFDV variants influence antibody recognition in serological assays. We expressed a panel of recombinant Cap proteins representing genetically diverse BFDV strains and compared their serological reactivity with their underlying genetic diversity.
2. Materials and Methods
2.1. Ethical Statements
All samples used in this study complied with institutional and national guidelines for animal welfare. The study was approved by the Ethics Committee of the Veterinary Faculty, Ludwig-Maximilians-Universitaet Muenchen (262-09-03-2021). Psittacine samples used in this work consisted exclusively of surplus material remaining from routine diagnostic procedures, which had been stored at -20°C in the laboratory.
2.2. Primer Design, Cap Gene Amplification
DNA solutions obtained from clinical samples of pet birds that had tested positive for BFDV in routine diagnostics by PCR targeting the rep gene [35,40] were used in this study. Based on DNA sequence alignments of a representative number of BFDV strains included in the NCBI GenBank database (https://www.ncbi.nlm.nih.gov/genbank/), specific primers were designed to amplify the complete cap open reading frame (ORF2) of BFDV: forward primer cap 5´-CACCATGTGGGGCACCTCYAAC-3´, reverse primer cap 5`-CGAAAAGSTATTTGYYGTYTGAGTCTTTA-3` (degenerate positions according to IUPAC nucleotide ambiguity code). PCR amplification of ORF2 was performed using a high-fidelity DNA polymerase (SuperFi DNA polymerase, Thermo Fisher Scientific, Darmstadt, Germany) according to the manufacturer’s instructions. Reactions were run in a thermal cycler under the following conditions: initial denaturation at 95°C for 5min, followed by 35 cycles of 95°C for 30s, 60°C for 30s and 72°C for 60s, and a final extension step at 72°C for 7min.
Cap amplicons obtained from various BFDV-positive samples were gel-purified and subjected to Sanger sequencing (Eurofins Genomics, Ebersberg, Germany) in both directions. Consensus sequences were assembled and edited, then aligned using MUSCLE in MEGA version 11 [41] and compared to BFDV ORF2 sequences from the NCBI GenBank nucleotide database. Seven cap amplicons covering the genetic range of current BFDV strains [42] were selected for protein expression. Nucleotide sequences, which are available on the NCBI GenBank database under the accession numbers PX789812-PX789818, were aligned using MUSCLE in MEGA11. The best-fit nucleotide substitution model was selected in MEGA11 using the Bayesian Information Criterion (BIC). Phylogenetic inference was performed using Maximum-likelihood under the TN93+G model (gamma-distributed rate heterogeneity, k = 5 discrete categories). Node support was assessed by bootstrap analysis with 1000 replicates. Sites containing gaps and missing data were treated using partial deletion with a site coverage cutoff of 95%.
Pairwise distances were calculated using the p-distance method with uniform rates among sites. Sites containing gaps and missing data were eliminated by complete deletion. Pairwise percent identity was derived as (1 − p-distance) × 100.
2.3. Plasmid Construction, Cloning, Expression and Purification of Recombinant Cap Protein
Recombinant expression of full-length BFDV Cap has previously been reported to be troubled by solubility and aggregation issues, which can be improved by truncation of the sequence and codon optimisation [28,43]. For recombinant protein expression, full-length cap sequences were truncated by 30 amino acids at the N-terminus and then codon-optimised for expression in Escherichia coli (GeneArt, Thermo Fisher scientific, Regensburg, Germany). The resulting synthetic gene DNA was then used for cloning and expression.
Codon-optimised, N-terminally truncated cap gene DNA were cloned into the pET100/D-TOPO expression vector (GeneArt, Thermo Fisher Scientific) to result in N-terminally His-tagged Cap proteins. The plasmids were transformed into Escherichia coli Rosetta 2 (DE3) cells and plated onto LB agar containing ampicillin (100µg/mL). After overnight incubation at 37°C colonies were screened by PCR, and the PCR products of the expected size were Sanger-sequenced using forward and reverse primers within the vector to verify cap sequences and orientation of the insert. Single confirmed colonies were used to inoculate LB broth containing ampicillin and cultured overnight at 37°C with shaking.
Pre-warmed LB broth (250mL) supplemented with ampicillin was inoculated with 11mL of the overnight culture and incubated at 37°C with shaking until an optical density at 600nm () of 0.5-0.6 was reached. Protein expression was induced by adding isopropyl-β-D-thiogalactopyranoside (IPTG) to a final concentration of 1mM, and cultures were incubated for a further 8h at 27°C with shaking. Cells were harvested by centrifugation (2200 x g, 20min, 4°C) and the resulting pellets were stored at -20°C until further processing.
Cell pellets were resuspended in lysis buffer (375mM NaCl, 48mM potassium phosphate, 10mM imidazole, 5% (v/v) glycerol, 0.5% (v/v) Triton X-100, pH 7.8) and lysed on ice by sonication. The lysates were clarified by centrifugation (13,000 x g, 10min, 4°C) to separate soluble and insoluble fractions. His-tagged Cap proteins were purified from the soluble fraction using Ni-NTA affinity chromatography (HisPur™ Ni-NTA spin columns, Thermo Fisher Scientific) following the manufacturer’s protocol. All equilibration, wash and elution buffers contained 10% (v/v) glycerol to stabilise the protein. Eluted Cap proteins were stored at -20°C.
2.4. SDS-PAGE, Protein Staining, Western Blot Analysis, Protein Assay, Electron Microscopy
Sodium dodecyl sulfate polyacrylamide gel electrophoresis (SDS–PAGE) was performed on all purified recombinant Cap proteins. Gels were stained with PageBlue™ protein staining solution (Thermo Fisher Scientific) to assess purity. For Western blotting, proteins were transferred onto nitrocellulose membranes using a standard protocol. Membranes were incubated overnight at 4°C with a rabbit polyclonal anti-His tag antibody (Thermo Fisher Scientific; 1:1000 in PBST containing 2% (w/v) skimmed milk powder). After washing with PBST, membranes were incubated for 30min at room temperature with an HRP-conjugated anti-rabbit IgG secondary antibody (SIGMA-Aldrich, Steinheim, Germany; 1:2000 in PBST with 2% (w/v) skimmed milk). Bound antibodies were visualised using an enhanced chemiluminescence (ECL) substrate (Amersham ECL prime, Cytiva, Marlborough, USA) according to the manufacturer’s instructions, and signals were recorded with a digital chemiluminescence imaging system (Celvin® S, biostep GmbH, Burkhardtsdorf, Germany).
Protein concentrations in elution fractions of all recombinant Cap preparations were determined by colorimetric protein assay (Bio-Rad, Feldkirchen, Germany) using bovine serum albumin (BSA) as the calibration standard, following a standard protocol.
The elution fractions containing recombinant Cap were additionally examined by negative-stain transmission electron microscopy (TEM) according to standard procedures to assess the formation of virus-like particles (VLPs).
2.5. Serum Samples
Further analyses were performed using sera from pet psittacine birds that had been confirmed as BFDV-PCR-positive by the Ypelaar and/or Ogawa assay [35,36]. All sera represented residual material from routine diagnostic investigations. They had been collected between 2020 and 2024 and had been stored at -20°C until analysis. Following a preliminary antibody screening using recombinant protein Cap 7, eight sera from different BFDV PCR-positive psittacine species were selected based on the availability of sufficient residual volume for both Western blot and ELISA, including repeat testing and to cover a broad range of psittacine species. In cases where the exact bird species was not known, the origin of the serum is described as “parrot”.
Sera originated from a Grey parrot (Psittacus sp., collection year 2024, serum 1), a galah (Eolophus roseicapilla, 2020, serum 2), a macaw (Ara hybrid, 2021, serum 3), a plain parakeet (Brotogeris tirica, 2021, serum 4), an Alexandrine parakeet (Psittacula eupatria, 2022, serum 5), an unspecified parrot (2020, serum 6), a cockatiel (Nymphicus hollandicus, 2024, serum 7) and another unspecified parrot (2020, serum 8). The eight birds had been naturally infected at some point in the past, but the exact time was unknown. Antibody titres at the time of sampling were unknown.
2.6. Semi-Quantitative Western Blot Analysis
For each recombinant Cap protein, polyacrylamide gel electrophoresis (PAGE) was performed on mini gels (100mm x 100mm) with a total protein load of 2.5µg per 3mm gel width. Nitrocellulose strips measuring 3mm in width (with an equivalent protein load of 2.5µg per strip) were prepared by means of blotting.
A set of seven strips, each containing one of the seven recombinant Cap proteins, was incubated in parallel for each serum sample. In each experiment, an additional strip was included as a positive control and incubated with anti-His tag antibody.
After blocking with 2% (w/v) skimmed milk powder in PBS for 1h at room temperature, strips were incubated overnight at 4°C with psittacine serum diluted 1:250 in blocking buffer. Strips were washed three times for 5min each with PBS containing 0.05% Tween-20 (PBST) and then incubated with gentle agitation for 30min at room temperature with an unconjugated goat anti-bird IgG (heavy and light chain) antibody (Bethyl Laboratories, Montgomery, USA, 1:200 in PBST with 2% milk) as the secondary antibody. After a further three washes in PBST, bound goat antibodies were detected using an HRP-conjugated anti-goat IgG antibody (whole molecule, Sigma-Aldrich, 1:7500 in PBST with 2% milk) for 30min at room temperature with gentle agitation. Following the final wash, strips were developed using an enhanced chemiluminescence (ECL) substrate according to the manufacturer’s instructions, (Amersham ECL prime, Cytiva) and signals were recorded with a digital chemiluminescence imaging system (Celvin® S, biostep GmbH). Exposure settings were kept constant within each blot, and no automatic background correction was applied; the resulting raw images were used for subsequent analysis. Band intensities were quantified using ImageJ version 1.54 [44]. For each band, the mean grey value was measured within a standardised rectangular region of interest (ROI) of identical size, and a local background ROI adjacent to the band was subtracted. For each serum sample, the mean background-corrected band intensity across all Cap variants on a given blot was calculated, and the signal for each individual Cap variant was expressed as a ratio to this serum-specific geometric mean intensity.
2.7. Enzyme-Linked Immunosorbent Assay
To determine the optimal ELISA conditions, a checkerboard titration was performed in advance of the further steps (protein concentrations 2, 4, 6, 8, 10µg/ml), serum concentrations (1:100, 1:500; 1:1000, 1:5000, 1:10000, 1:50,000, 1:100,000). High-binding 96-well ELISA plates (PolySorb, Thermo Fisher Scientific) were coated overnight in carbonate–bicarbonate coating buffer (0.05M, pH 9.6) at 4°C with recombinant Cap protein at a concentration of 6µg/mL in coating buffer. Plates were then washed three times with PBS containing 0.05% Tween-20 (PBST) and blocked with 4% (w/v) skimmed milk powder in PBST for 1h at 37°C. Each of the seven serum samples was diluted 1:500 in Tris-buffered saline containing 0.05% Tween-20 (TBST) and added to antigen-coated wells in duplicate, followed by incubation for 1h at 37°C. After three washes with PBST, bound antibodies were detected using an HRP-conjugated goat anti-bird IgG (heavy and light chain) antibody (Bethyl Laboratories, 1:10,000 in TBST) for 1h at 37°C. Plates were washed again, and colour was developed with tetramethylbenzidine substrate for 10min at room temperature in the dark. The reaction was stopped by adding 1M H₂SO₄, and absorbance was measured at 450nm (reference 630nm) using a microplate reader (Dynaread, Dynex technologies, Brno, Czech Republic). Antigen-free control wells (coated with coating buffer only) and internal negative control sera were included on each plate.
ELISAs were performed with each reaction in duplicate and in three independent assays. Duplicate absorbance values were averaged per run. For each antigen on each plate, the cut-off was defined as the mean OD of negative control sera + 3×SD (n = 6 wells derived from 3 negative sera). Consistency across runs was summarised as non-reactive (0/3), equivocal/sporadic (1/3-2/3), or reactive (3/3). For each run and antigen, background-corrected absorbance values (ΔOD) were calculated by subtracting the mean of negative sera from each measurement. To visualise relative antigen recognition patterns, ΔOD values were converted to proportional contributions by dividing each antigen-specific ΔOD by the sum of ΔOD across all seven antigens for the respective serum (total = 100%).
2.8. Comparison of Western Blot and ELISA
Because Western blot densitometry and ELISA absorbance values differ in scale and background behaviour, results were normalised and visualised using assay-specific approaches to facilitate comparison of relative antigen recognition patterns within each assay; direct quantitative comparisons between assays were not inferred.
To assess concordance between ELISA and Western blot reactivity across the seven recombinant Cap antigens, serum-specific Spearman rank correlations were calculated using Microsoft Excel (Microsoft, Redmond, USA). For each of the eight PCR-positive sera, antigen reactivity was quantified as ELISA signal intensity (background-corrected absorbance; mean of technical replicates as described above) and Western blot signal intensity (background-corrected densitometry values/mean grey values obtained in ImageJ). The seven antigens were ranked within each serum separately for ELISA and Western blot. Because several sera produced largely similar signals across multiple antigens (i.e., limited dynamic range and frequent ties), we report ρ primarily as a descriptive measure of agreement rather than as a definitive statistical test.
3. Results
3.1. Characterisation of BFDV Cap Gene Sequences
Maximum-likelihood phylogenetic analysis of seven ORF2 sequences generated in this study together with selected reference sequences from GenBank [42], confirmed that the BFDV variants included in this study cover a broad range of the BFDV diversity (Figure 1). Across all sequences included in the analysis, pairwise ORF2 nucleotide sequence identity ranged from 83-97% (median 88%), and pairwise amino acid identity ranged from 79-98% (median 85%). Within the seven study sequences (cap 1-cap 7), pairwise nucleotide identity ranged from 85-97% (median 87%), and pairwise amino acid identity ranged from 82-96% (median 85%). These relationships are visualised as a split triangular heatmap, with nucleotide identities shown in the lower left triangle and amino acid identities in the upper right triangle (Figure 2).
3.2. Expression, Purification and Characterisation of Recombinant Cap Proteins
All seven N-terminally truncated Cap proteins were expressed in E. coli as soluble His-tagged proteins and purified by Ni-NTA affinity chromatography as shown in Figure 3 for Cap 7 as an example. In the PageBlue-stained SDS-PAGE, a distinct band at approximately 27kDa was absent or faint in the non-induced soluble fraction, became prominent after induction, and was strongly enriched in the elution fraction after Ni-NTA affinity chromatography for each recombinant protein (Figure 3a). Protein identity was confirmed by anti-His Western blotting, showing specific signals at the expected molecular weight in the Ni-NTA eluates (Figure 3b). Negative-stain TEM of truncated Cap proteins revealed heterogeneous particulate structures, including VLP-like assemblies and larger pleomorphic particles/aggregates (Figure 4).
3.3. Semi-Quantitative Western Blot Reactivity of Sera from BFDV-Positive Birds
Sera from eight BFDV PCR-positive psittacines representing a broad range of species showed pronounced individual differences in Western blot reactivity across the panel of seven recombinant Cap variants (Figure 5, Figure 6, mean grey values are provided in Supplementary Table S1). The pattern of relative band intensities (normalised to the geometric mean across all Cap variants) illustrated that several sera produced no visible band against some proteins under the applied exposure settings (sera 1, 4 and 5). Accordingly, using a single-antigen Western blot would have reduced sensitivity for some sera under the applied conditions. In addition, the signal intensity exhibited high variability; the Cap variant yielding the strongest signal differed between sera, whereas reactivity to other variants was weak or absent (Figure 6).
3.4. ELISA Reactivity Across Recombinant Cap Variants
The antigen-specific ELISA was performed in three independent assays (each in duplicates for the sera-antigen combinations). Raw absorbance values varied between runs, including differences in background signal, indicating inter-assay variation in absolute signal intensity. We aimed to compare relative signal profiles, not absolute OD values across plates analogous to the Western blot, to enable comparison of serum-specific antigen recognition patterns across experiments. Signals were background-corrected on a plate- and antigen-specific basis using representative negative sera and were subsequently expressed as proportional contributions of each Cap variant to the total ELISA signal per serum (Figure 6, OD values shown in Supplementary Table S2).
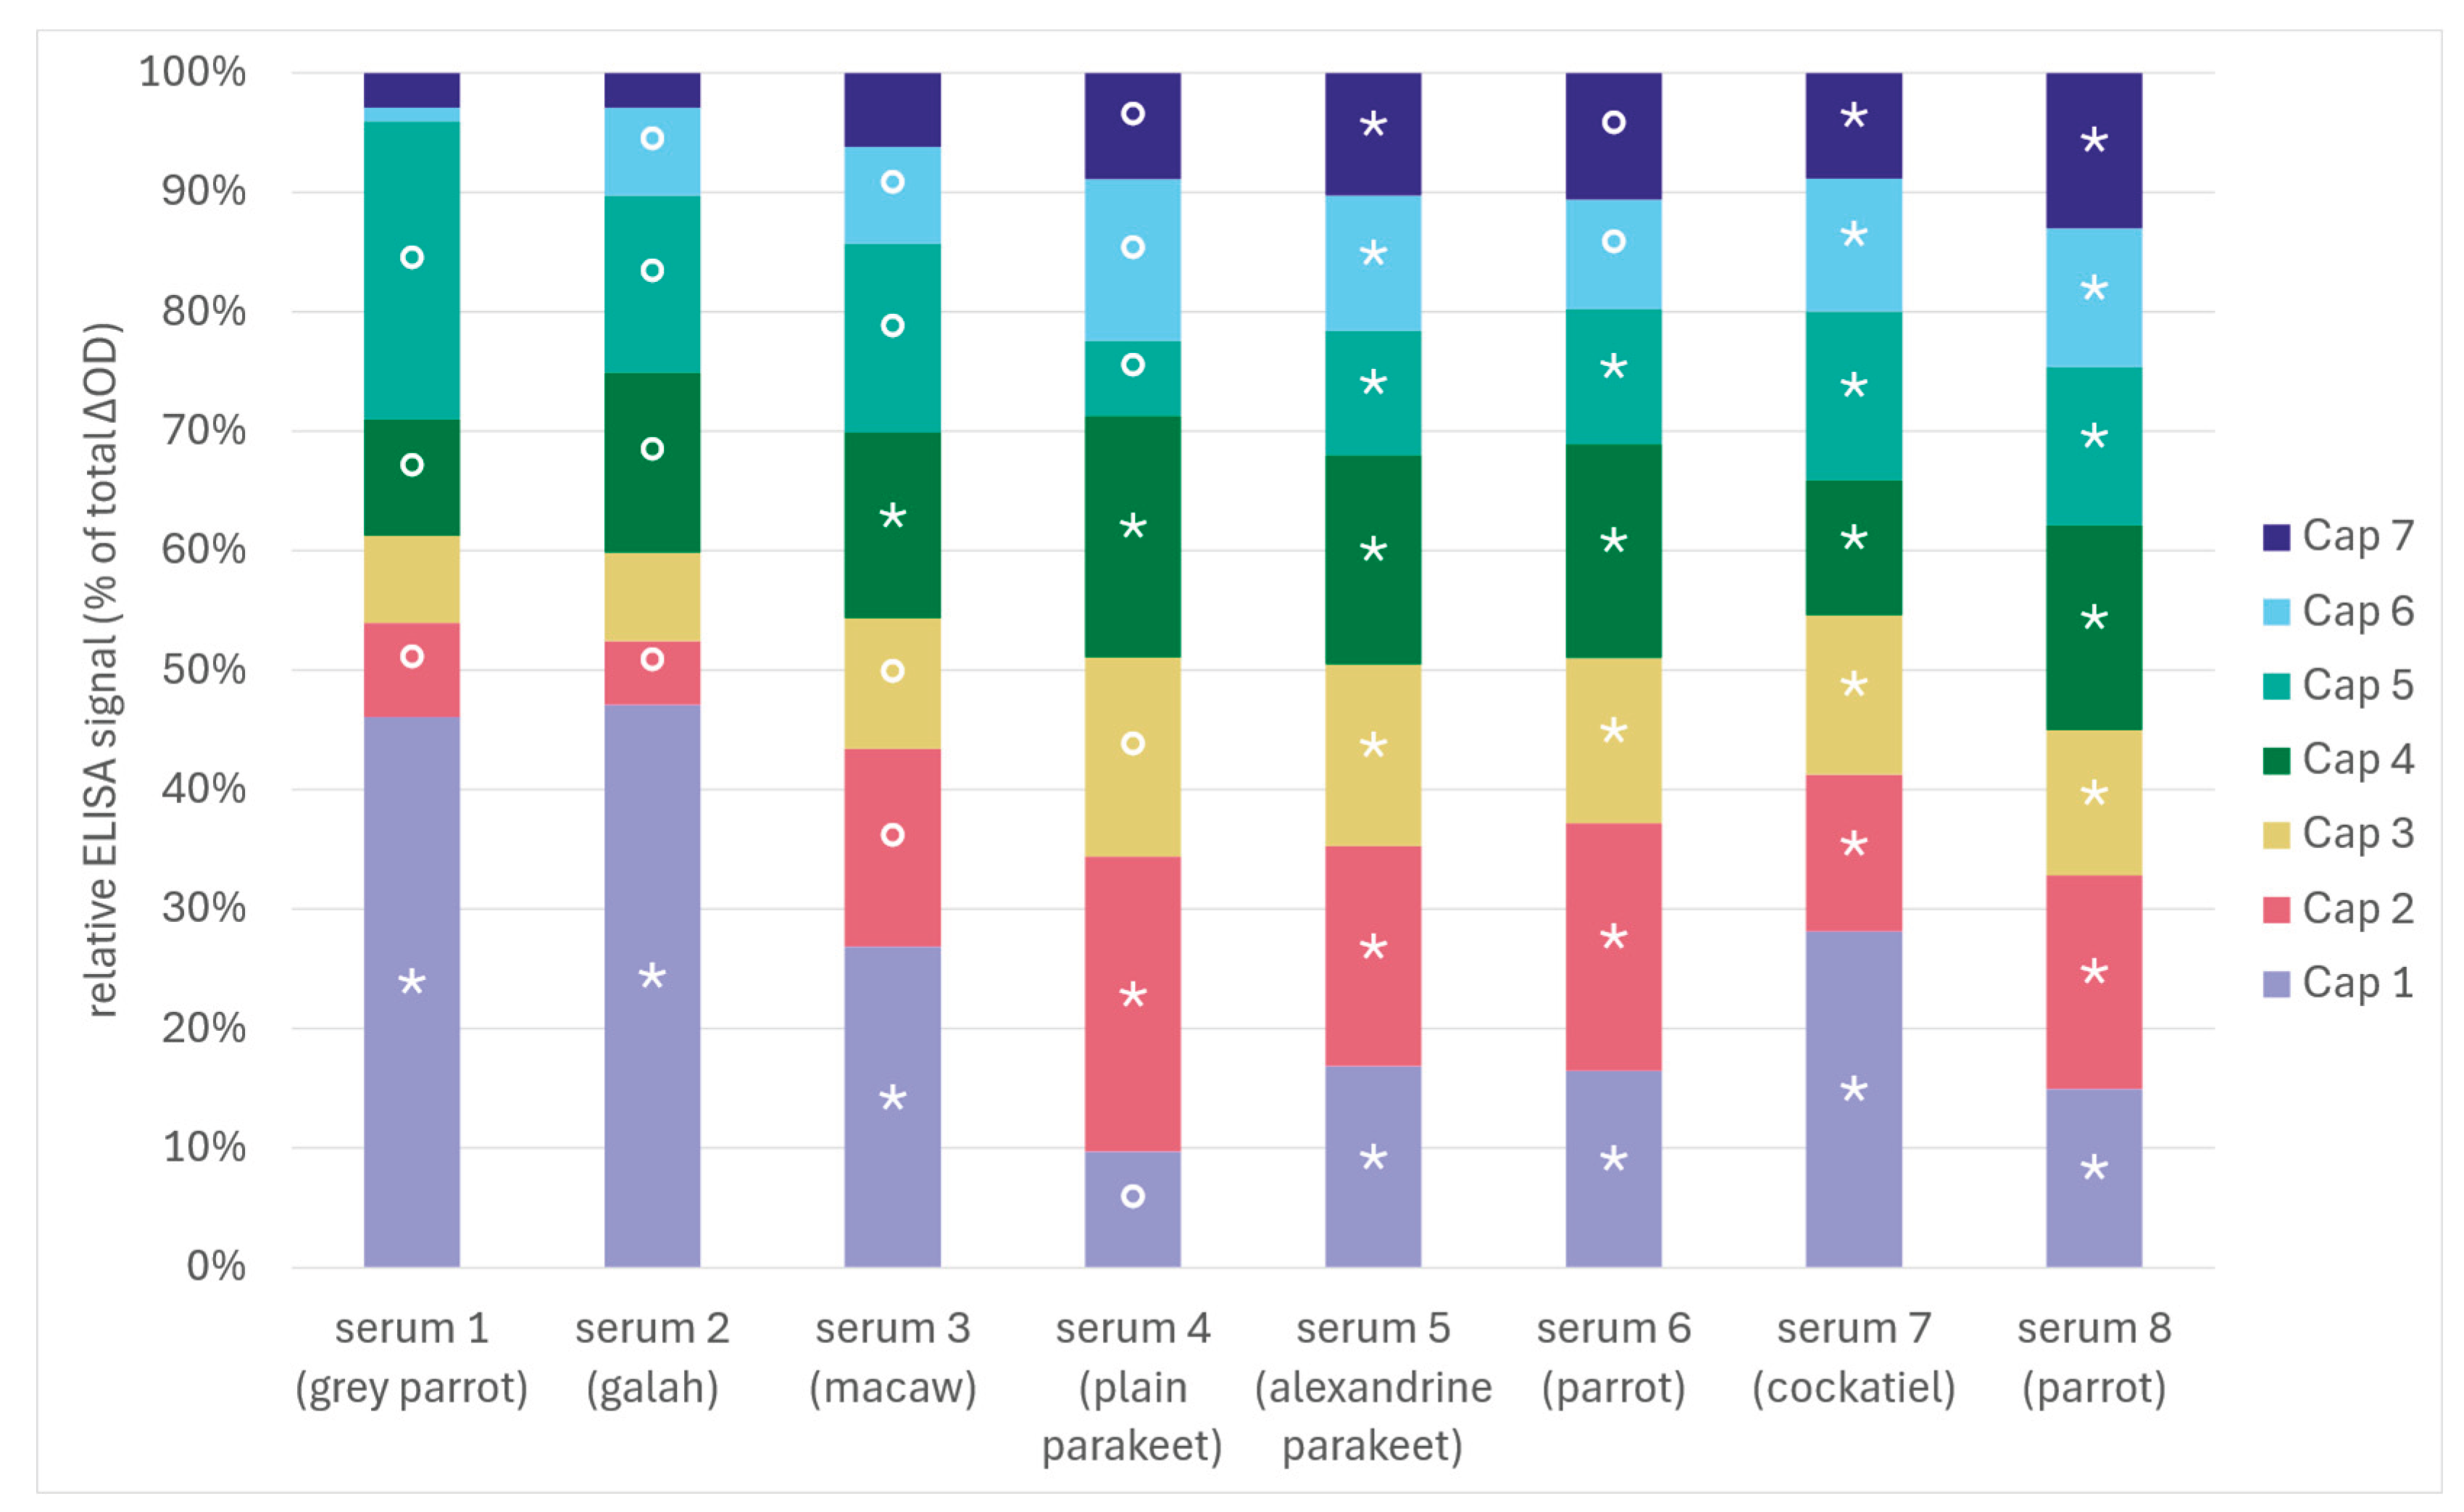
Several serum-antigen combinations remained at or below the antigen-specific cut-off (cut-off determined as mean of three negative sera + 3xSD), demonstrating that individual sera did not react detectably with all Cap variants under the conditions used. Conversely, sera typically showed pronounced differences in the distribution of their ELISA signal across the Cap panel, with some sera exhibiting a strong contribution from only a few variants whereas others displayed a more even pattern (Figure 7). To account for variability near the cut-off across the three independent runs, serum-antigen combinations were categorised as reactive if they exceeded the cut-off in all three runs (3/3; *), as equivocal/sporadic if reactive in only one or two out of three runs (1/3-2/3; °), and as non-reactive if never exceeding the cut-off (0/3; no symbol) in order to avoid errors in evaluation that may be occasioned by proximity to the cut-off. As demonstrated in Figure 7, there is a considerable variation in signal intensity, contingent on the specific antigen and serum combination.
3.5. Comparison of Antigen Recognition Patterns Between Western Blot and ELISA
Across the eight sera, agreement between ELISA and Western blot reactivity patterns varied substantially. Serum-specific Spearman rank correlations between antigen rankings in ELISA and Western blot ranged from ρ = −0.43 to ρ = +0.64 (Supplementary Table S3), indicating that some sera showed moderate concordance (antigens ranked higher in ELISA reactivity also tended to rank higher in Western blot), whereas others displayed weak or even inverse ranking patterns. Small differences in measured signal resulted in changes in rank order, which can disproportionately affect Spearman’s ρ given the small number of antigens (n = 7). Overall, these findings support incomplete concordance between both serological readouts and suggest that, depending on the serum, ELISA and Western blot may capture partially different aspects of antibody binding to recombinant Cap variants (e.g., differences in epitope presentation and assay format), with the greatest instability occurring when signal strengths cluster within a narrow range.
Across the full dataset, only two Cap variants (Cap 5 and Cap 7) produced a detectable band in the Western blot for all eight sera. In the ELISA, no individual Cap variant was reactive in all sera under the applied cut-off criteria. Conversely, five sera (2, 3, 6, 7 and 8) showed reactivity against all seven Cap variants in the Western blot, whereas four sera (5, 6, 7 and 8) were reactive against all seven Cap variants in the ELISA. When the Cap panel was considered collectively, all sera showed anti-Cap reactivity to at least one variant. However, when individual Cap variants were evaluated separately, reactivity was incomplete and strongly dependent on the specific serum-antigen combination. Accordingly, under the conditions applied here, reliance on a single recombinant Cap antigen would be expected to reduce assay sensitivity and increase the likelihood of false-negative serological classifications, particularly for low-reactive or borderline samples.
4. Discussion
In this study, we evaluated the serological reactivity of psittacine sera against a panel of seven recombinant antigens representing genetically diverse BFDV capsid variants using ELISA and Western blot. To our knowledge, this is the first systematic BFDV study to assess a panel of recombinant Cap variants against multiple sera in parallel, providing a comparative view of antigen-serum specific reactivity and diversity.
The seven recombinant Cap proteins were tested against sera of eight BFDV PCR-positive psittacines which had been kept as pet birds and tested in routine diagnostics revealing natural BFDV infections. We observed clear antigen-serum dependent differences in seroreactivity across the panel. These findings confirm our research hypothesis that sequence variation in ORF2 can translate into differences in epitope composition and/or presentation of the capsid protein, thereby shaping antibody binding profiles. The marked differences in reactivity among the seven antigens suggest that antibody binding is not uniformly conserved across genetically diverse capsid variants. A plausible explanation is variation in the availability and conformation of epitopes between variants; even limited amino-acid differences within key epitopes may disproportionately affect binding. These differences in antibody binding between Cap variants may have important implications for immune responses during natural infection and for the performance of Cap-based vaccines. Moreover, they are directly relevant to the analytical sensitivity and reliability of serological diagnostic procedures.
In selecting Cap variants for this panel, we aimed to capture the diversity of BFDV strains by including both closely related and more divergent ORF2 sequences. Sequence selection was guided by a GenBank reference set largely derived from rep-centred analyses published in 2018 [42]. Our phylogenetic analyses indicate that the seven study sequences fall within and span the range of BFDV ORF2 diversity described in that dataset, although they cannot be assumed to represent all currently circulating variants. The primary objective of the present study was therefore to sample this range and to position our recombinant Cap variants within it for subsequent serological comparison.
For circoviruses, a threshold of 80% genome-wide nucleotide identity has been proposed as a species demarcation criterion, but there is no officially accepted ICTV scheme for defining genotypes or subtypes within BFDV. Several studies have attempted to structure this diversity more finely, proposing strain and subtype thresholds or phylogenetic clades and sub-clades [4,31,32] and reporting clusters that are partly host- or region-associated [4,31,45]. These efforts illustrate that BFDV is genetically diverse enough to warrant more detailed classification, but they have not yet converged on a unified nomenclature. Within our dataset, pairwise ORF2 identities fell as low as ~83% at the nucleotide level, with even greater divergence at the amino-acid level, placing the variants in a range where distinct strain or subtype categories would be plausible under previously suggested criteria. Sequence divergence does not necessarily translate into a linear change in seroreactivity, but genetic diversity provides a coherent framework for interpreting the heterogeneous antibody binding patterns observed in this study.
Comparable, although somewhat more homogeneous, pairwise ORF2 identities have been reported for porcine circovirus type 2 (PCV2, species Circovirus porcine2) genotypes. In a dataset comprising PCV2a, PCV2b and PCV2d isolates, ORF2 nucleotide and amino-acid identities across all sequences ranged from 89.7-100% and 88.5-100%, respectively, whereas pairwise identities within individual genotypes were substantially higher, typically around 95-100% [46,47]. These values overlap with those observed for our BFDV ORF2 panel, which shows even more sequence diversity. Together with ORF2-based genotyping frameworks for PCV2, this suggests that a similarly standardised intra-species classification scheme could also be beneficial for BFDV, particularly if it were explicitly linked to antigenic properties of different Cap variants rather than relying solely on sequence-based thresholds.
For PCV2 the serological consequences of capsid variation have been characterised in considerably more detail. Epitope-mapping studies using PCV1/PCV2 chimeras and site-directed mutants have shown that even single amino-acid substitutions in exposed regions of Cap can abrogate binding of neutralising monoclonal antibodies and alter virus neutralisation patterns [48,49]. Cross-neutralisation and vaccine studies further demonstrate that PCV2 genotypes differ antigenically and that Cap antigens derived from certain genotypes (e.g., PCV2d) provide broader heterologous protection than others [50,51]. In contrast, for BFDV only limited evidence exists for antigenically distinct isolates [27,52], and systematic analyses linking defined Cap sequence variation to antibody binding profiles or protection were largely lacking, a gap that the present study addressed.
In our study, comparison of ELISA and Western blot results revealed partial concordance but also systematic discordances, particularly for serum samples with antibody binding levels close to the decision thresholds. This is biologically plausible given the different epitope landscapes interrogated by each method. Western blotting is performed under denaturing conditions and predominantly detects antibodies to linear epitopes after denaturation, whereas ELISA may preserve or create conformational epitopes depending on folding and coating conditions, and conformational epitopes may mask or modify access to linear epitopes [53]. The divergent outcomes observed between assays are therefore readily explained by their differing format and analytical characteristics. In addition, background signal and non-specific binding represent a major limitation in immunoassays and directly affect discrimination around the cut-off. We applied local background correction and plate-specific cut-offs to reduce systematic bias, yet several sera produced broadly similar signal intensities across multiple antigens in one or both assays. Under these conditions, small measurement differences can substantially alter rank order, leading to variable Spearman correlation coefficients and borderline classifications. Both tests, however, revealed differences in antigen-binding patterns among the sera included in our study thus confirming our research hypothesis.
Earlier serological work using haemagglutination (HA) and haemagglutination inhibition (HI) assays largely failed to identify distinct BFDV serotypes. In cross-reactivity experiments with multiple isolates and high-titre sera from different psittacine species, no consistent evidence for antigenically discrete serotypes was found and broad HI cross-reactivity was reported [37,54]. However, a subsequent study on cockatiels described a BFDV isolate that was not inhibited by all high-titre sera tested and was interpreted as antigenically distinct from previously characterised viruses, potentially representing a separate serotype [27,52]. Taken together, these data suggested substantial antigenic homology among many BFDV strains while leaving open the possibility that more divergent variants may differ antigenically and form antigenic subgroups. Our data provide experimental evidence that amino-acid variation in Cap can be associated with clearly distinguishable antibody binding profiles across BFDV variants. They support the view that antigenic subgroups exist within BFDV, even if they are not yet formally defined as serotypes. These findings refine our understanding of natural BFDV infections and inform hypotheses on immunity and infection dynamics in BFDV-infected birds, while also being directly relevant to the design of vaccines and serological diagnostic assays.
The genetic and serological diversity documented here has implications for our understanding of the dynamics of natural BFDV infections. Mixed infections with multiple BFDV variants in individual birds have been documented [40,55]. Incomplete or absent cross-protection is a plausible explanation for secondary infections with more distant strains, but no controlled in vivo data are currently available to confirm or refute this. Furthermore, presumed immunosuppression due to a pre-existing BFDV infection must also be considered in this context.
A limited number of experimental vaccination studies in psittacines has been published so far. They have used inactivated whole virus or a single recombinant Cap antigen and have typically challenged birds with the same or a closely related virus isolate [29,39,56]. A range of Cap- and VLP-based BFDV vaccine candidates have been shown to induce seroconversion and robust antibody responses in experimental settings. However, available challenge studies indicated that protection was incomplete, with vaccination primarily reducing clinical disease and virus shedding rather than preventing infection altogether [29,56]. For several newer VLP formulations, protective efficacy has not yet been assessed in controlled challenge experiments, and data on the duration of immunity and on cross-protection against genetically divergent BFDV variants remain very limited [57,58]. Genetic relationships between vaccine antigens and challenge viruses were not reported in detail, and potential effects of sequence mismatches on vaccine efficacy have not been systematically addressed. Consequently, there are currently no robust data to define the degree of sequence divergence in Cap that can be tolerated before vaccine-induced protection is compromised. In addition, when protein-based vaccines are used, the effects of post-translational modifications, which differ in various protein expression systems, must be considered. At present, in the absence of a licensed BFDV vaccine, prevention of spread relies on the identification of infected birds and their separation from uninfected individuals or flocks. Reliable diagnostics and high analytical sensitivity are therefore central to disease control. Our study was not designed as a formal test validation, and the sample size is too small to establish assay performance parameters. Rather, it was adapted to examine how genetically diverse Cap variants interact with different sera. Within this framework and as mentioned above, in both assays some serum-antigen pairs remained at or below the antigen-specific cut-off, so that a single recombinant Cap antigen would have failed to identify sera of certain PCR-positive birds as reactive under the conditions used. In most published BFDV serological assays, a single recombinant Cap is used as antigen [28,29,59] which is, according to our results, associated with a risk of false-negative serological classifications. Our data argue against relying on a single recombinant Cap antigen when broad strain coverage is desired and instead support a multi-antigen selection strategy or, alternatively, the identification of a central antigen with broad coverage of different BFDV strains. As suggested for other viruses, e.g. highly pathogenic avian influenza virus H5 [60], it may be possible to identify a Cap antigen located centrally within the BFDV antigenic space and to use it for both vaccination and diagnostics. Antigenic mapping could be a useful tool for such future investigations. Multi-antigen strategies can be used, where panels of antigens are combined to increase detection range and could be applied to BFDV to relieve antigen-specific blind spots. In our limited dataset, combinations of Cap variants would have been sufficient to detect all eight sera as reactive, while a single antigen would not. Given the exploratory nature of our study and the small number of sera used, such combinations can only be regarded as illustrative rather than prescriptive. Nevertheless, they highlight that antigen selection can have a major impact on apparent sensitivity, and that rationally designed antigen panels might improve the robustness of BFDV serology under field conditions.
Expression of large amounts of purified Cap has previously been reported to be troubled by insolubility and aggregation, with improved yields obtained using truncated and codon-optimised constructs [28,61]. Consistent with this, initial attempts to express full-length Cap in our system resulted in solubility issues, so we used N-terminally truncated, codon-optimised Cap variants lacking 30 amino acids. This strategy yielded high amounts of soluble recombinant protein. In line with reports from other small icosahedral viruses, where N-terminal truncations can shift the assembly towards alternative T-numbers and particle sizes [62,63], negative-stain transmission electron microscopy in our study revealed VLP-like structures that were markedly larger (approximately 45–85nm) and frequently aggregated, rather than forming a homogeneous population of particles in the size range expected for native circoviruses (~15–20nm). These considerations support the interpretation that the particles observed in this study represent aberrantly assembled or aggregated VLP populations. Such deviations have been described for misfolded or partially assembled viral capsid proteins in other systems [64,65]. Nevertheless, the recombinant Cap variants produced robust signals with both anti-His antibodies and field sera, indicating that they retained relevant epitopes for antibody binding despite their altered appearance.
Limitations
Several limitations of the present study should be considered. First, the number of sera and Cap variants was limited, and all sera were derived from PCR-positive birds with unknown infection histories and immune status, which constrains generalisability. Despite the small sample size and the unknown clinical background of the birds, we still observed broad differences between Cap variants and were thus able to confirm our research hypothesis.
Second, only truncated cap constructs were examined, and misfolding or aberrant assembly may have altered the relative contribution of conformational and linear epitopes. Furthermore, an expression system in E. coli was used, as expression systems for recombinant Cap in avian cells and routine virus cultivation for BFDV have not yet been commercially established. Despite the favourable outcomes observed in protein yield, protein staining, Western blot and ELISA experiments, the results must be interpreted with caution in terms of natural immunity.
Third, we did not assess functional antibody activities such as virus neutralisation or in vivo protection, so our observations relate to binding reactivity rather than protective immunity. The impact of these findings on vaccination strategies and cross-protectivity must be demonstrated in future challenge trials.
Conclusions
The present data demonstrate that BFDV Cap diversity is reflected in heterogeneous antibody binding in both Western blot and ELISA formats and underline the need to consider viral diversity explicitly in the design of serological assays and future vaccines. They also offer a framework for future studies linking natural infection dynamics and pathogenesis to antigenic diversity of BFDV in psittacine hosts.
Supplementary Materials
The following supporting information can be downloaded at the website of this paper posted on Preprints.org.
Author Contributions
Conceptualization, E.K. and M.R.; methodology, E.K. and M.R.; investigation, E.K.; data curation, E.K.; writing—original draft preparation, E.K.; writing—review and editing, E.K. and M.R.; supervision, M.R. All authors have read and agreed to the published version of the manuscript.
Funding
This research received no external funding.
Institutional Review Board Statement
The study followed institutional and national standards for the care and use of animals. It was approved by the Ethics Committee of the Veterinary Faculty, LMU Munch (262-09-03-2021).
Data Availability Statement
The nucleotide sequences of the full cap genes obtained from the seven BFDV strains in this study are available on the NCBI GenBank database (https://www.ncbi.nlm.nih.gov/genbank/) under the accession numbers PX789812-PX789818. All other data generated or analyzed during this study are included in this article or are available from the corresponding author on reasonable request.
Acknowledgments
We thank Dana Härtner, Miriam Schiller and Johannes Stadler for their excellent technical assistance. We also thank Kim Giessler and Sonja Böhmer, Bavarian Health and Food Safety Authority, Oberschleissheim, for their support with electron microscopy.
Conflicts of Interest
The authors declare no conflicts of interest.
References
- Ritchie, B.W.; Niagro, F.D.; Lukert, P.D.; Steffens, W.L.; Latimer, K.S. Characterization of a new virus from cockatoos with psittacine beak and feather disease. Virology 1989, 171, 83–88. [Google Scholar] [CrossRef] [PubMed]
- International Committee on Taxonomy of Viruses (ICTV). Genus: Circovirus. Available online: https://ictv.global/report/chapter/circoviridae/circoviridae/circovirus (accessed on 6 December 2025).
- Zhang, X.; Liu, H.; Shi, J.; Zhou, H.; Lin, X.; Zhang, H.; Zhang, T. A Meta-Analysis of Global Prevalence of Psittacine Beak and Feather Disease Virus Infection and Associated Risk Factors. Animals (Basel) 2025, 15, 1473. [Google Scholar] [CrossRef] [PubMed]
- Varsani, A.; Regnard, G.L.; Bragg, R.; Hitzeroth, I.I.; Rybicki, E.P. Global genetic diversity and geographical and host-species distribution of beak and feather disease virus isolates. J. Gen. Virol. 2011, 92, 752–767. [Google Scholar] [CrossRef]
- Raidal, S.R.; Sarker, S.; Peters, A. Review of psittacine beak and feather disease and its effect on Australian endangered species. Aust. Vet. J. 2015, 93, 466–470. [Google Scholar] [CrossRef]
- Das, S.; Smith, K.; Sarker, S.; Peters, A.; Adriaanse, K.; Eden, P.; Ghorashi, S.A.; Forwood, J.K.; Raidal, S.R. Repeat spillover of beak and feather disease virus into an endangered parrot highlights the risk associated with endemic pathogen loss in endangered species. J. Wildl. Dis. 2020, 56, 896–906. [Google Scholar] [CrossRef]
- Fogell, D.J.; Martin, R.O.; Groombridge, J.J. Beak and feather disease virus in wild and captive parrots: an analysis of geographic and taxonomic distribution and methodological trends. Arch. Virol. 2016, 161, 2059–2074. [Google Scholar] [CrossRef]
- Morinha, F.; Carrete, M.; Tella, J.L.; Blanco, G. High Prevalence of Novel Beak and Feather Disease Virus in Sympatric Invasive Parakeets Introduced to Spain From Asia and South America. Diversity 2020, 12, 192. [Google Scholar] [CrossRef]
- Pass, D.A.; Perry, R.A. The pathology of psittacine beak and feather disease. Aust. Vet. J. 1984, 61, 69–74. [Google Scholar] [CrossRef]
- Doneley, R.J.T. Acute beak and feather disease in juvenile African Grey parrots—an uncommon presentation of a common disease. Aust. Vet. J. 2003, 81, 206–207. [Google Scholar] [CrossRef]
- Robino, P.; Grego, E.; Rossi, G.; Bert, E.; Tramuta, C.; Stella, M.C.; Bertoni, P.; Nebbia, P. Molecular analysis and associated pathology of beak and feather disease virus isolated in Italy from young Congo African grey parrots (Psittacus erithacus) with an “atypical peracute form” of the disease. Avian Pathol. 2014, 43, 333–344. [Google Scholar] [CrossRef] [PubMed]
- Todd, D. Circoviruses: immunosuppressive threats to avian species: a review. Avian Pathol. 2000, 29, 373–394. [Google Scholar] [CrossRef]
- Latimer, K.S.; Rakich, P.M.; Kircher, I.M.; Ritchie, B.W.; Niagro, F.D.; Steffens, W.L.; Lukert, P.D. Extracutaneous viral inclusions in psittacine beak and feather disease. J. Vet. Diagn. Invest. 1990, 2, 204–207. [Google Scholar] [CrossRef]
- Martens, J.M.; Stokes, H.S.; Eastwood, J.R.; Raidal, S.R.; Peters, A.; Berg, M.L.; Walder, K.; Magrath, M.J.L.; Bennett, A.T.D. Persistence of beak and feather disease virus (BFDV) infection in wild Crimson Rosellas (Platycercus elegans). Emu 2019, 119, 402–406. [Google Scholar] [CrossRef]
- Martens, J.M.; Stokes, H.S.; Berg, M.L.; Walder, K.; Bennett, A.T.D. Seasonal fluctuation of beak and feather disease virus (BFDV) infection in wild Crimson Rosellas (Platycercus elegans). Sci. Rep. 2020, 10, 7894. [Google Scholar] [CrossRef]
- Blanch-Lázaro, B.; Ribot, R.F.H.; Berg, M.L.; Alexandersen, S.; Bennett, A.T.D. Ability to detect antibodies to beak and feather disease virus in blood on filter paper decreases with duration of storage. PeerJ 2021, 9, 12642. [Google Scholar] [CrossRef] [PubMed]
- Ahaduzzaman, M.; Nath, C.; Hossain, M.S. Evidence of circulation of beak and feather disease virus in captive psittacine and non-psittacine birds in Bangladesh. Arch. Virol. 2022, 2567–2575. [Google Scholar] [CrossRef] [PubMed]
- Ritchie, B.W.; Niagro, F.D.; Latimer, K.S.; Steffens, W.L.; Pesti, D.; Ancona, J.; Lukert, P.D. Routes and prevalence of shedding of psittacine beak and feather disease virus. Am. J. Vet. Res. 1991, 52, 1804–1809. [Google Scholar] [CrossRef] [PubMed]
- Martens, J.M.; Stokes, H.S.; Berg, M.L.; Walder, K.; Raidal, S.R.; Magrath, M.J.L.; Bennett, A.T.D. A non-invasive method to assess environmental contamination with avian pathogens: beak and feather disease virus (BFDV) detection in nest boxes. PeerJ 2020, 8, 9211. [Google Scholar] [CrossRef]
- Rahaus, M.; Desloges, N.; Probst, S.; Loebbert, B.; Lantermann, W.; Wolff, M.H. Detection of beak and feather disease virus DNA in embryonated eggs of psittacine birds. Vet. Med. 2008, 53, 53–58. [Google Scholar] [CrossRef]
- Morales, A.; Sibrián, X.; Porras, F.D. Survey of Beak and Feather Disease Virus (BFDV) in Guatemalan Neotropical Psittacine Birds. J. Avian Med. Surg. 2021, 35, 325–332. [Google Scholar] [CrossRef]
- Australian Government Department of Environment and Heritage. Hygiene Protocols for the Prevention and Control of Diseases (Particularly Beak and Feather Disease) in Australian Birds. Available online: https://www.dcceew.gov.au/sites/default/files/documents/hygiene-protocols-all.pdf (accessed on 8 December 2025).
- Sarker, S.; Terrón, M.C.; Khandokar, Y.; Aragão, D.; Hardy, J.M.; Radjainia, M.; Jiménez-Zaragoza, M.; de Pablo, P.J.; Coulibaly, F.; Luque, D.; et al. Structural insights into the assembly and regulation of distinct viral capsid complexes. Nat Commun 2016, 7, 13014. [Google Scholar] [CrossRef]
- Bassami, M.R.; Ypelaar, I.; Berryman, D.; Wilcox, G.E.; Raidal, S.R. Genetic diversity of beak and feather disease virus detected in psittacine species in Australia. Virology 2001, 279, 392–400. [Google Scholar] [CrossRef]
- Sarker, S.; Das, S.; Helbig, K.; Raidal, S.R. Identification of Beak and Feather Disease Virus in an Unusual Novel Host (Merops ornatus) Using Nested PCR. Genome Announc. 2016, 4, 01376. [Google Scholar] [CrossRef] [PubMed]
- Nath, B.K.; Das, S.; Roby, J.A.; Sarker, S.; Luque, D.; Raidal, S.R.; Forwood, J.K. Structural Perspectives of Beak and Feather Disease Virus and Porcine Circovirus Proteins. Viral Immunol. 2021, 34, 49–59. [Google Scholar] [CrossRef] [PubMed]
- Shearer, P.L.; Bonne, N.; Clark, P.; Sharp, M.; Raidal, S.R. Development and applications of a monoclonal antibody to a recombinant beak and feather disease virus (BFDV) capsid protein. J. Virol. Methods 2008, 147, 206–212. [Google Scholar] [CrossRef]
- Johne, R.; Raue, R.; Grund, C.; Kaleta, E.F.; Müller, H. Recombinant expression of a truncated capsid protein of beak and feather disease virus and its application in serological tests. Avian Pathol. 2004, 33, 328–336. [Google Scholar] [CrossRef]
- Bonne, N.; Shearer, P.; Sharp, M.; Clark, P.; Raidal, S. Assessment of recombinant beak and feather disease virus capsid protein as a vaccine for psittacine beak and feather disease. J. Gen. Virol. 2009, 90, 640–647. [Google Scholar] [CrossRef]
- Ndlovu, B.; van Zyl, A.R.; Verwoerd, D.; Rybicki, E.P.; Hitzeroth, I.I. Immunogenicity of DNA, mRNA and Subunit Vaccines Against Beak and Feather Disease Virus. Vaccines (Basel) 2025, 13, 762. [Google Scholar] [CrossRef]
- Shah, P.T.; Wang, J.; Liu, Y.; Hussain, B.; Ma, Z.-H.; Wu, C.; Xing, L. The phylogenetic and phylogeographic landscape of the beak and feather disease virus, 1996-2022. Infect. Genet. Evol. 2023, 112, 105442. [Google Scholar] [CrossRef] [PubMed]
- Julian, L.; Piasecki, T.; Chrząstek, K.; Walters, M.; Muhire, B.; Harkins, G.W.; Martin, D.P.; Varsani, A. Extensive recombination detected among beak and feather disease virus isolates from breeding facilities in Poland. J. Gen. Virol. 2013, 94, 1086–1095. [Google Scholar] [CrossRef]
- de Kloet, E.; de Kloet, S.R. Analysis of the beak and feather disease viral genome indicates the existence of several genotypes which have a complex psittacine host specificity. Arch. Virol. 2004, 149, 2393–2412. [Google Scholar] [CrossRef]
- Dolatyabi, Sara; Peighambari, Seyed Mostafa; Razmyar, Jamshid. Molecular detection and analysis of beak and feather disease viruses in Iran. Front. Vet. Sci. 2022, 9, 1053886. [Google Scholar] [CrossRef]
- Ypelaar, I.; Bassami, M.; Wilcox, G.; Raidal, S. A universal polymerase chain reaction for the detection of psittacine beak and feather disease virus. Vet. Microbiol. 1999, 68, 141–148. [Google Scholar] [CrossRef] [PubMed]
- Ogawa, H.; Yamaguchi, T.; Fukushi, H. Duplex shuttle PCR for differential diagnosis of budgerigar fledgling disease and psittacine beak and feather disease. Microbiol. Immunol. 2005, 49, 227–237. [Google Scholar] [CrossRef] [PubMed]
- Raidal, S.R.; Bonne, N.J.; Stewart, M.; Shearer, P. Standardised diagnostic tests for beak and feather disease virus (BFDV). 2008. Available online: https://www.environment.gov.au/system/files/resources/d51f18c3-459e-4f9f-884a-5aa3642ece4d/files/49540.pdf (accessed on 4 November 2020).
- Raidal, S.R.; Sabine, M.; Cross, G.M. Laboratory diagnosis of psittacine beak and feather disease by haemagglutination and haemagglutination inhibition. Aust. Vet. J. 1993, 70, 133–137. [Google Scholar] [CrossRef]
- Shearer, P.L.; Sharp, M.; Bonne, N.; Clark, P.; Raidal, S.R. A blocking ELISA for the detection of antibodies to psittacine beak and feather disease virus (BFDV). J. Virol. Methods 2009, 158, 136–140. [Google Scholar] [CrossRef]
- Ogawa, H.; Chahota, R.; Ohya, K.; Yamaguchi, T.; Fukushi, H. Relatedness between host species and genotype of beak and feather disease virus suggesting possible interspecies cross infection during bird trade. J. Vet. Med. Sci. 2013, 75, 503–507. [Google Scholar] [CrossRef] [PubMed]
- Tamura, K.; Stecher, G.; Kumar, S. MEGA11: Molecular Evolutionary Genetics Analysis Version 11. Mol Biol Evol 2021, 38, 3022–3027. [Google Scholar] [CrossRef]
- Löbel, C.A. Circovirusinfektionen bei Wellensittichen. Dissertation thesis, Ludwig-Maximilians-Universitaet Muenchen, Munich, Germany, 2018. [Google Scholar]
- Regnard, G.L.; Rybicki, E.P.; Hitzeroth, I.I. Recombinant expression of beak and feather disease virus capsid protein and assembly of virus-like particles in Nicotiana benthamiana. Virol. J. 2017, 14, 174. [Google Scholar] [CrossRef]
- Schneider, C.A.; Rasband, W.S.; Eliceiri, K.W. NIH Image to ImageJ: 25 years of image analysis. Nat. Methods 2012, 9, 671–675. [Google Scholar] [CrossRef]
- Heath, L.; Martin, D.P.; Warburton, L.; Perrin, M.; Horsfield, W.; Kingsley, C.; Rybicki, E.P.; Williamson, A.-L. Evidence of unique genotypes of beak and feather disease virus in southern Africa. J. Virol. 2004, 78, 9277–9284. [Google Scholar] [CrossRef]
- Shen, M.; Zhang, S.; Mao, Y.; Wang, C.; Gao, P.; Li, N.; Jiang, Y.; Liu, D.; Wang, T.; Jia, B.; et al. Effect of Duck Interferon-A and an Anti-Cap Protein Polyclonal Antibody Against Duck Circovirus. Microb. Pathog. 2023, 182, 106235. [Google Scholar] [CrossRef]
- Wei, R.; Xie, J.; Theuns, S.; Nauwynck, H.J. Changes on the viral capsid surface during the evolution of porcine circovirus type 2 (PCV2) from 2009 till 2018 may lead to a better receptor binding. Virus Evol. 2019, 5, vez026. [Google Scholar] [CrossRef]
- Lekcharoensuk, P.; Morozov, I.; Paul, P.S.; Thangthumniyom, N.; Wajjawalku, W.; Meng, X.J. Epitope mapping of the major capsid protein of type 2 porcine circovirus (PCV2) by using chimeric PCV1 and PCV2. J. Virol. 2004, 78, 8135–8145. [Google Scholar] [CrossRef] [PubMed]
- Shang, S.-B.; Jin, Y.-L.; Jiang, X.; Zhou, J.-Y.; Zhang, X.; Xing, G.; He, J.L.; Yan, Y. Fine mapping of antigenic epitopes on capsid proteins of porcine circovirus, and antigenic phenotype of porcine circovirus type 2. Mol. Immunol. 2009, 46, 327–334. [Google Scholar] [CrossRef] [PubMed]
- Kang, S.-J.; Bae, S.-M.; Lee, H.-J.; Jeong, Y.-J.; Lee, M.-A.; You, S.-H.; Lee, H.-S.; Hyun, B.-H.; Lee, N.; Cha, S.-H. Porcine Circovirus (PCV) Genotype 2d-Based Virus-like Particles (VLPs) Induced Broad Cross-Neutralizing Antibodies against Diverse Genotypes and Provided Protection in Dual-Challenge Infection of a PCV2d Virus and a Type 1 Porcine Reproductive and Respiratory Syndrome Virus (PRRSV). Pathogens 2021, 10, 1145. [Google Scholar] [CrossRef]
- Kang, S.-J.; Kang, H.; You, S.-H.; Lee, H.J.; Lee, N.; Hyun, B.-H.; Cha, S.-H. Genetic diversity and different cross-neutralization capability of porcine circovirus type 2 isolates recently circulating in South Korea. BMC Vet. Res. 2020, 16, 334. [Google Scholar] [CrossRef]
- Shearer, P.L.; Bonne, N.; Clark, P.; Sharp, M.; Raidal, S.R. Beak and feather disease virus infection in cockatiels (Nymphicus hollandicus). Avian Pathol. 2008, 37, 75–81. [Google Scholar] [CrossRef]
- Forsström, B.; Axnäs, B.B.; Rockberg, J.; Danielsson, H.; Bohlin, A.; Uhlen, M. Dissecting antibodies with regards to linear and conformational epitopes. PLoS One 2015, 10, 0121673. [Google Scholar] [CrossRef]
- Khalesi, B.; Bonne, N.; Stewart, M.; Sharp, M.; Raidal, S. A comparison of haemagglutination, haemagglutination inhibition and PCR for the detection of psittacine beak and feather disease virus infection and a comparison of isolates obtained from loriids. J. Gen. Virol. 2005, 86, 3039–3046. [Google Scholar] [CrossRef]
- Sarker, S.; Ghorashi, S.A.; Forwood, J.K.; Bent, S.J.; Peters, A.; Raidal, S.R. Phylogeny of beak and feather disease virus in cockatoos demonstrates host generalism and multiple-variant infections within Psittaciformes. Virology 2014, 460-461, 72–82. [Google Scholar] [CrossRef]
- Regnard, G.L. Development of a potential challenge model and plant-produced vaccine candidate for beak and feather disease virus. Dissertation thesis, University of Cape Town, Cape Town, South Africa, 2015. [Google Scholar]
- Mulondo, G.; Buyse, M.L.R.; Labuschagne, K.; Jarvis, D.; van Zyl, A.; Rybicki, E.P.; Hitzeroth, I.I.; Mbewana, S. Production and immunogenicity of a plant-produced beak and feather disease virus vaccine in Japanese quails. Arch Virol 2025, 170, 163. [Google Scholar] [CrossRef]
- Das, T.; Nath, B.K.; Dhar, P.K.; Peters, A.; Forwood, J.K.; Raidal, S.R.; Das, S. Safety and immunogenicity of a novel psittacine beak and feather disease vaccine and optimisation of a thermostable spray-dried formulation. Vaccine 2026, 69, 127989. [Google Scholar] [CrossRef] [PubMed]
- Ho, C.-F.; Huang, S.-W.; Chan, K.-W.; Wu, J.-S.; Chang, S.-P.; Wang, C.-Y. Development of an antigen-capture ELISA for beak and feather disease virus. Arch Virol 2018, 163, 145–151. [Google Scholar] [CrossRef]
- Kok, A.; Wilks, S.H.; Tureli, S.; James, S.L.; Bestebroer, T.M.; Burke, D.F.; Funk, M.; van der Vliet, S.; Spronken, M.I.; Rijnink, W.F.; et al. A vaccine central in A(H5) influenza antigenic space confers broad immunity. Nature 2025, 647, 1005–1013. [Google Scholar] [CrossRef]
- Regnard, G.L.; Boyes, R.S.; Martin, R.O.; Hitzeroth, I.I.; Rybicki, E.P. Beak and feather disease virus: correlation between viral load and clinical signs in wild Cape parrots (Poicepahlus robustus) in South Africa. Arch Virol 2015, 160, 339–344. [Google Scholar] [CrossRef]
- Mo, X.; Li, X.; Yin, B.; Deng, J.; Tian, K.; Yuan, A. Structural roles of PCV2 capsid protein N-terminus in PCV2 particle assembly and identification of PCV2 type-specific neutralizing epitope. PLoS Pathog 2019, 15, 1007562. [Google Scholar] [CrossRef]
- Yang, C.; Pan, H.; Wei, M.; Zhang, X.; Wang, N.; Gu, Y.; Du, H.; Zhang, J.; Li, S.; Xia, N. Hepatitis E virus capsid protein assembles in 4M urea in the presence of salts. Protein Sci. 2013, 22, 314–326. [Google Scholar] [CrossRef] [PubMed]
- Mejía-Méndez, J.L.; Vazquez-Duhalt, R.; Hernández, L.R.; Sánchez-Arreola, E.; Bach, H. Virus-like Particles: Fundamentals and Biomedical Applications. Int. J. Mol. Sci. 2022, 23. [Google Scholar] [CrossRef] [PubMed]
- Bhat, T.; Cao, A.; Yin, J. Virus-like Particles: Measures and Biological Functions. Viruses 2022, 14, 383. [Google Scholar] [CrossRef]
Figure 1.
Maximum-likelihood tree based on a MUSCLE alignment of BFDV ORF2 nucleotide sequences (735bp), including seven sequences generated in this study (cap 1-7, marked with a green rhomb, GenBank accession numbers in brackets) and 11 representative GenBank sequences selected to reflect the genetic diversity of current BFDV strains (as described by Löbel [42]).
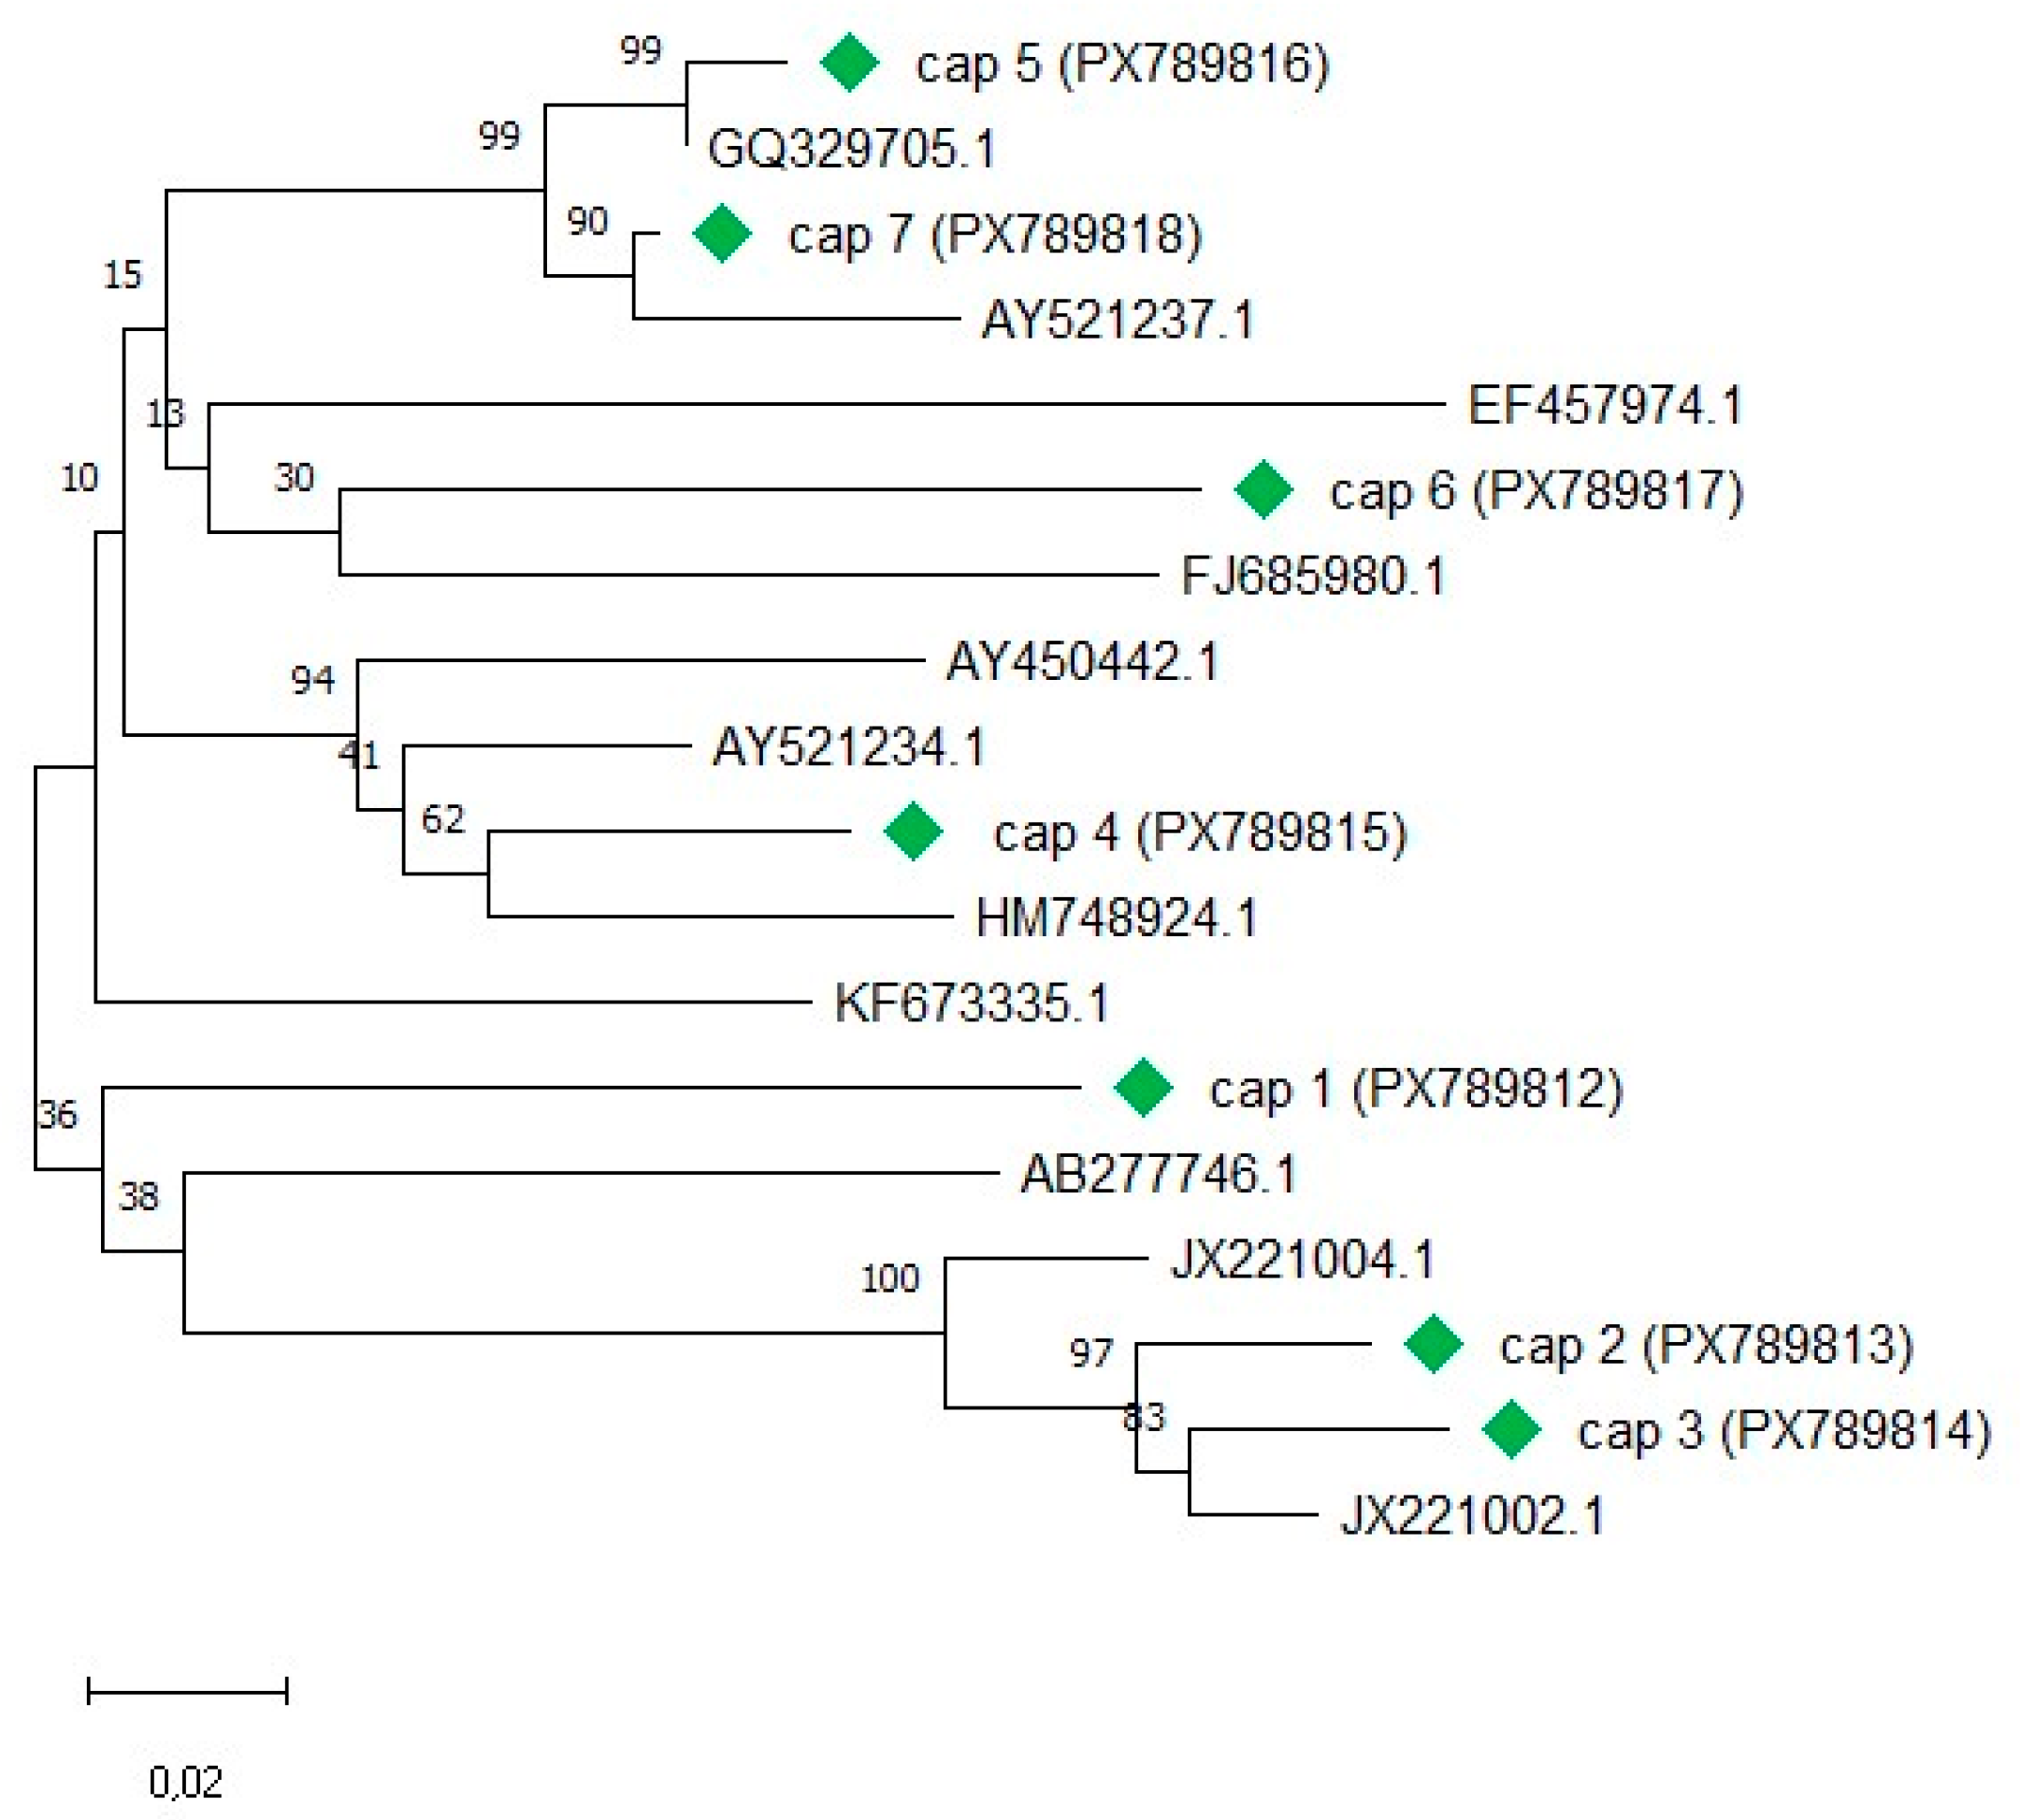
Figure 2.
Split pairwise identity matrix of seven BFDV complete ORF2 sequences. The lower left triangle shows nucleotide percent identity, and the upper right triangle shows amino acid percent identity (both derived from MUSCLE alignments; % identity calculated as (1 − p-distance) × 100).
Figure 2.
Split pairwise identity matrix of seven BFDV complete ORF2 sequences. The lower left triangle shows nucleotide percent identity, and the upper right triangle shows amino acid percent identity (both derived from MUSCLE alignments; % identity calculated as (1 − p-distance) × 100).
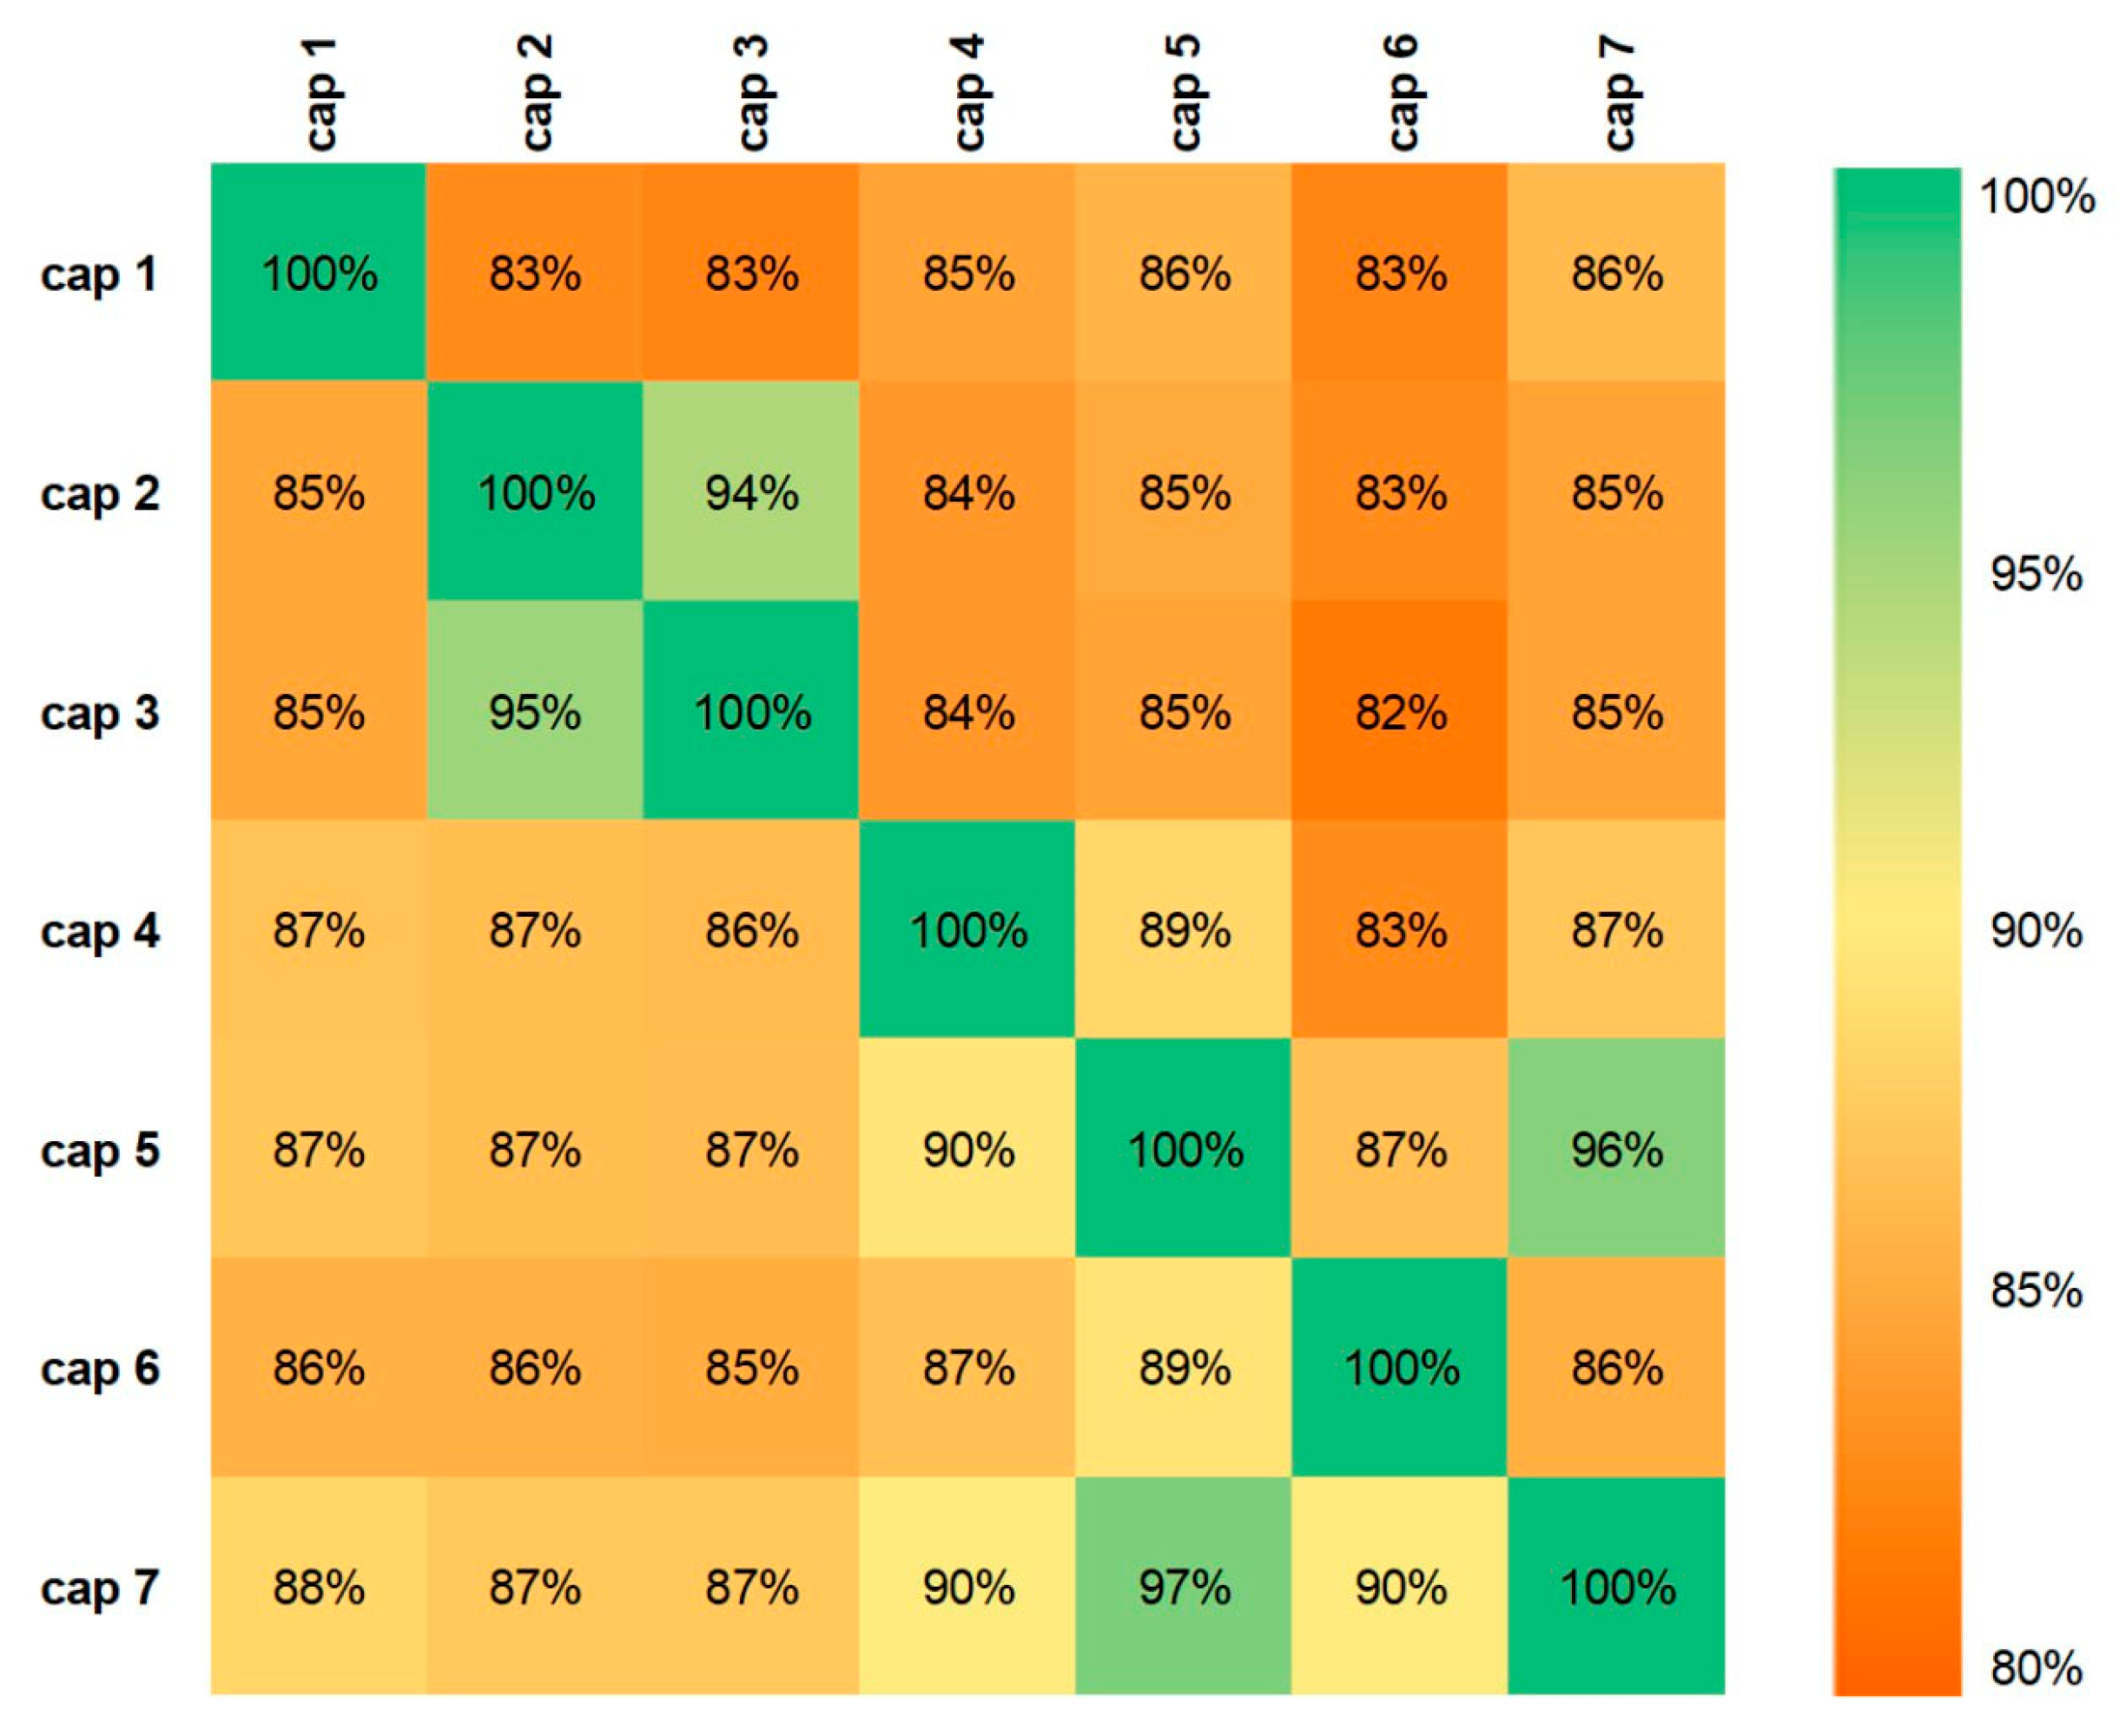
Figure 3.
Expression and purification of recombinant Cap protein.(a) SDS–PAGE, gel stained with PageBlue™: lane M, molecular weight marker; lane 1, soluble protein from non-induced E. coli; lane 2, soluble protein from induced E. coli; lane 3, Ni-NTA–purified BFDV Cap protein (elution fraction 2); (b) Western blot probed with an anti-His tag antibody: lane M, molecular weight marker; lane 1, soluble protein from non-induced E. coli; lane 2, soluble protein from induced E. coli; lane 3, Ni-NTA–purified BFDV Cap protein (elution fraction 2).
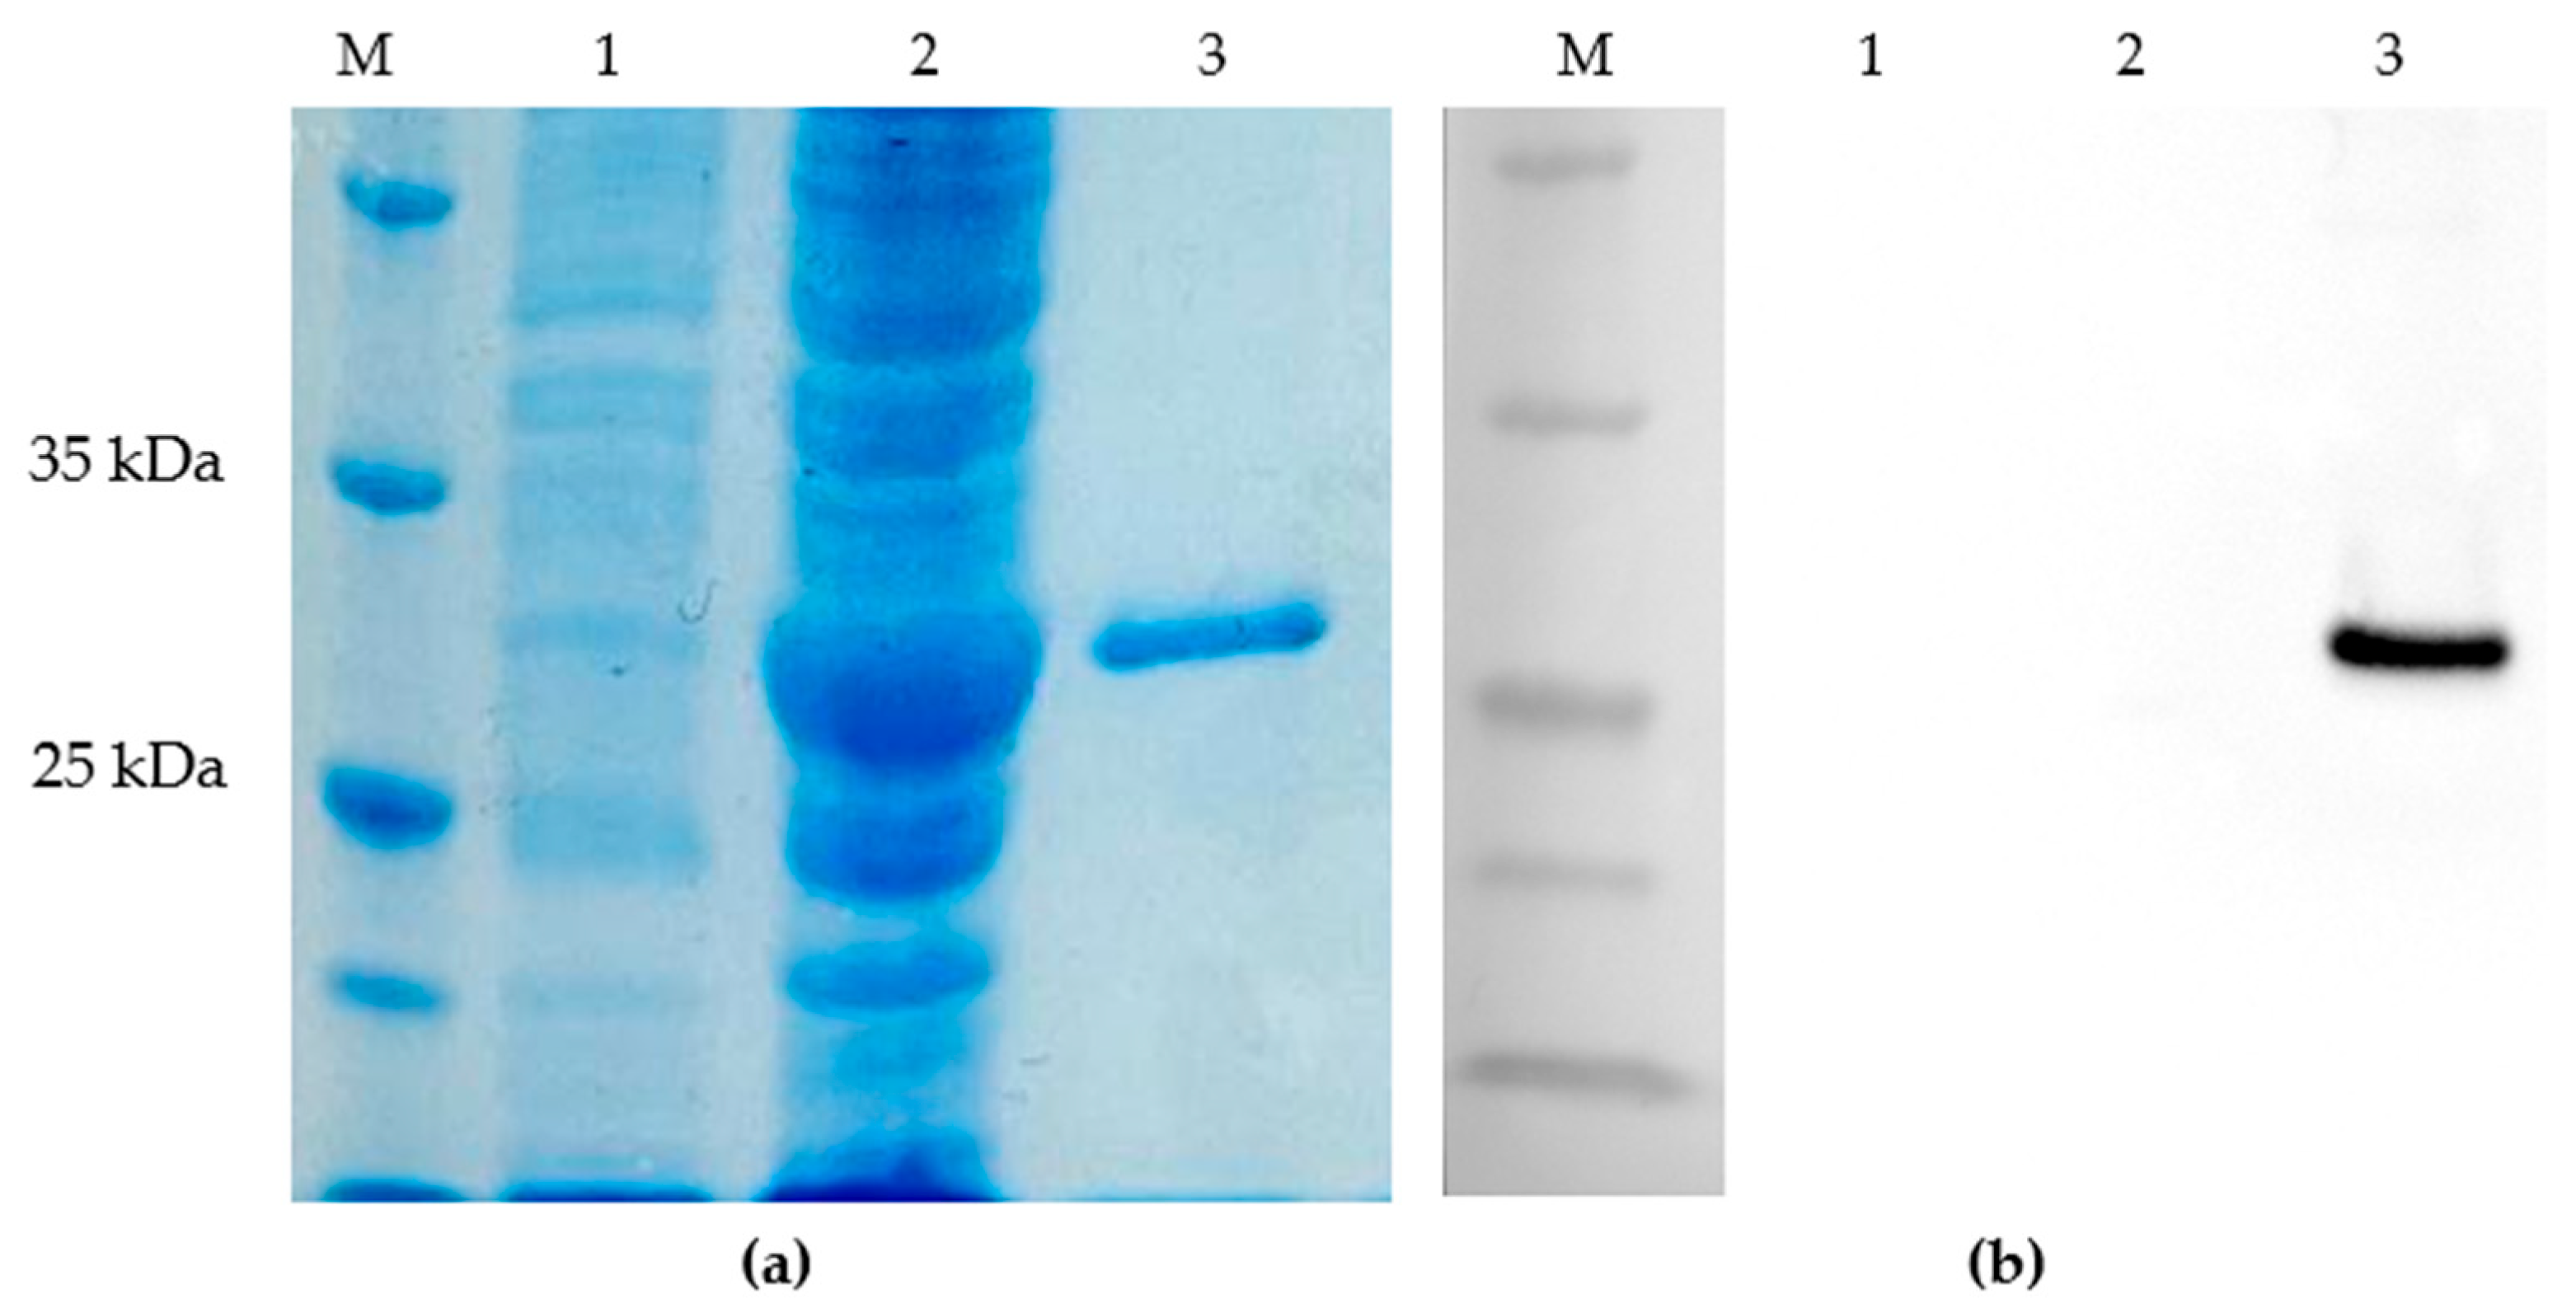
Figure 4.
Negative-stain transmission electron microscopy of recombinant BFDV Cap virus-like particles (VLPs). A heterogeneous particle population with diameters of approximately 45–85nm is visible.
Figure 4.
Negative-stain transmission electron microscopy of recombinant BFDV Cap virus-like particles (VLPs). A heterogeneous particle population with diameters of approximately 45–85nm is visible.
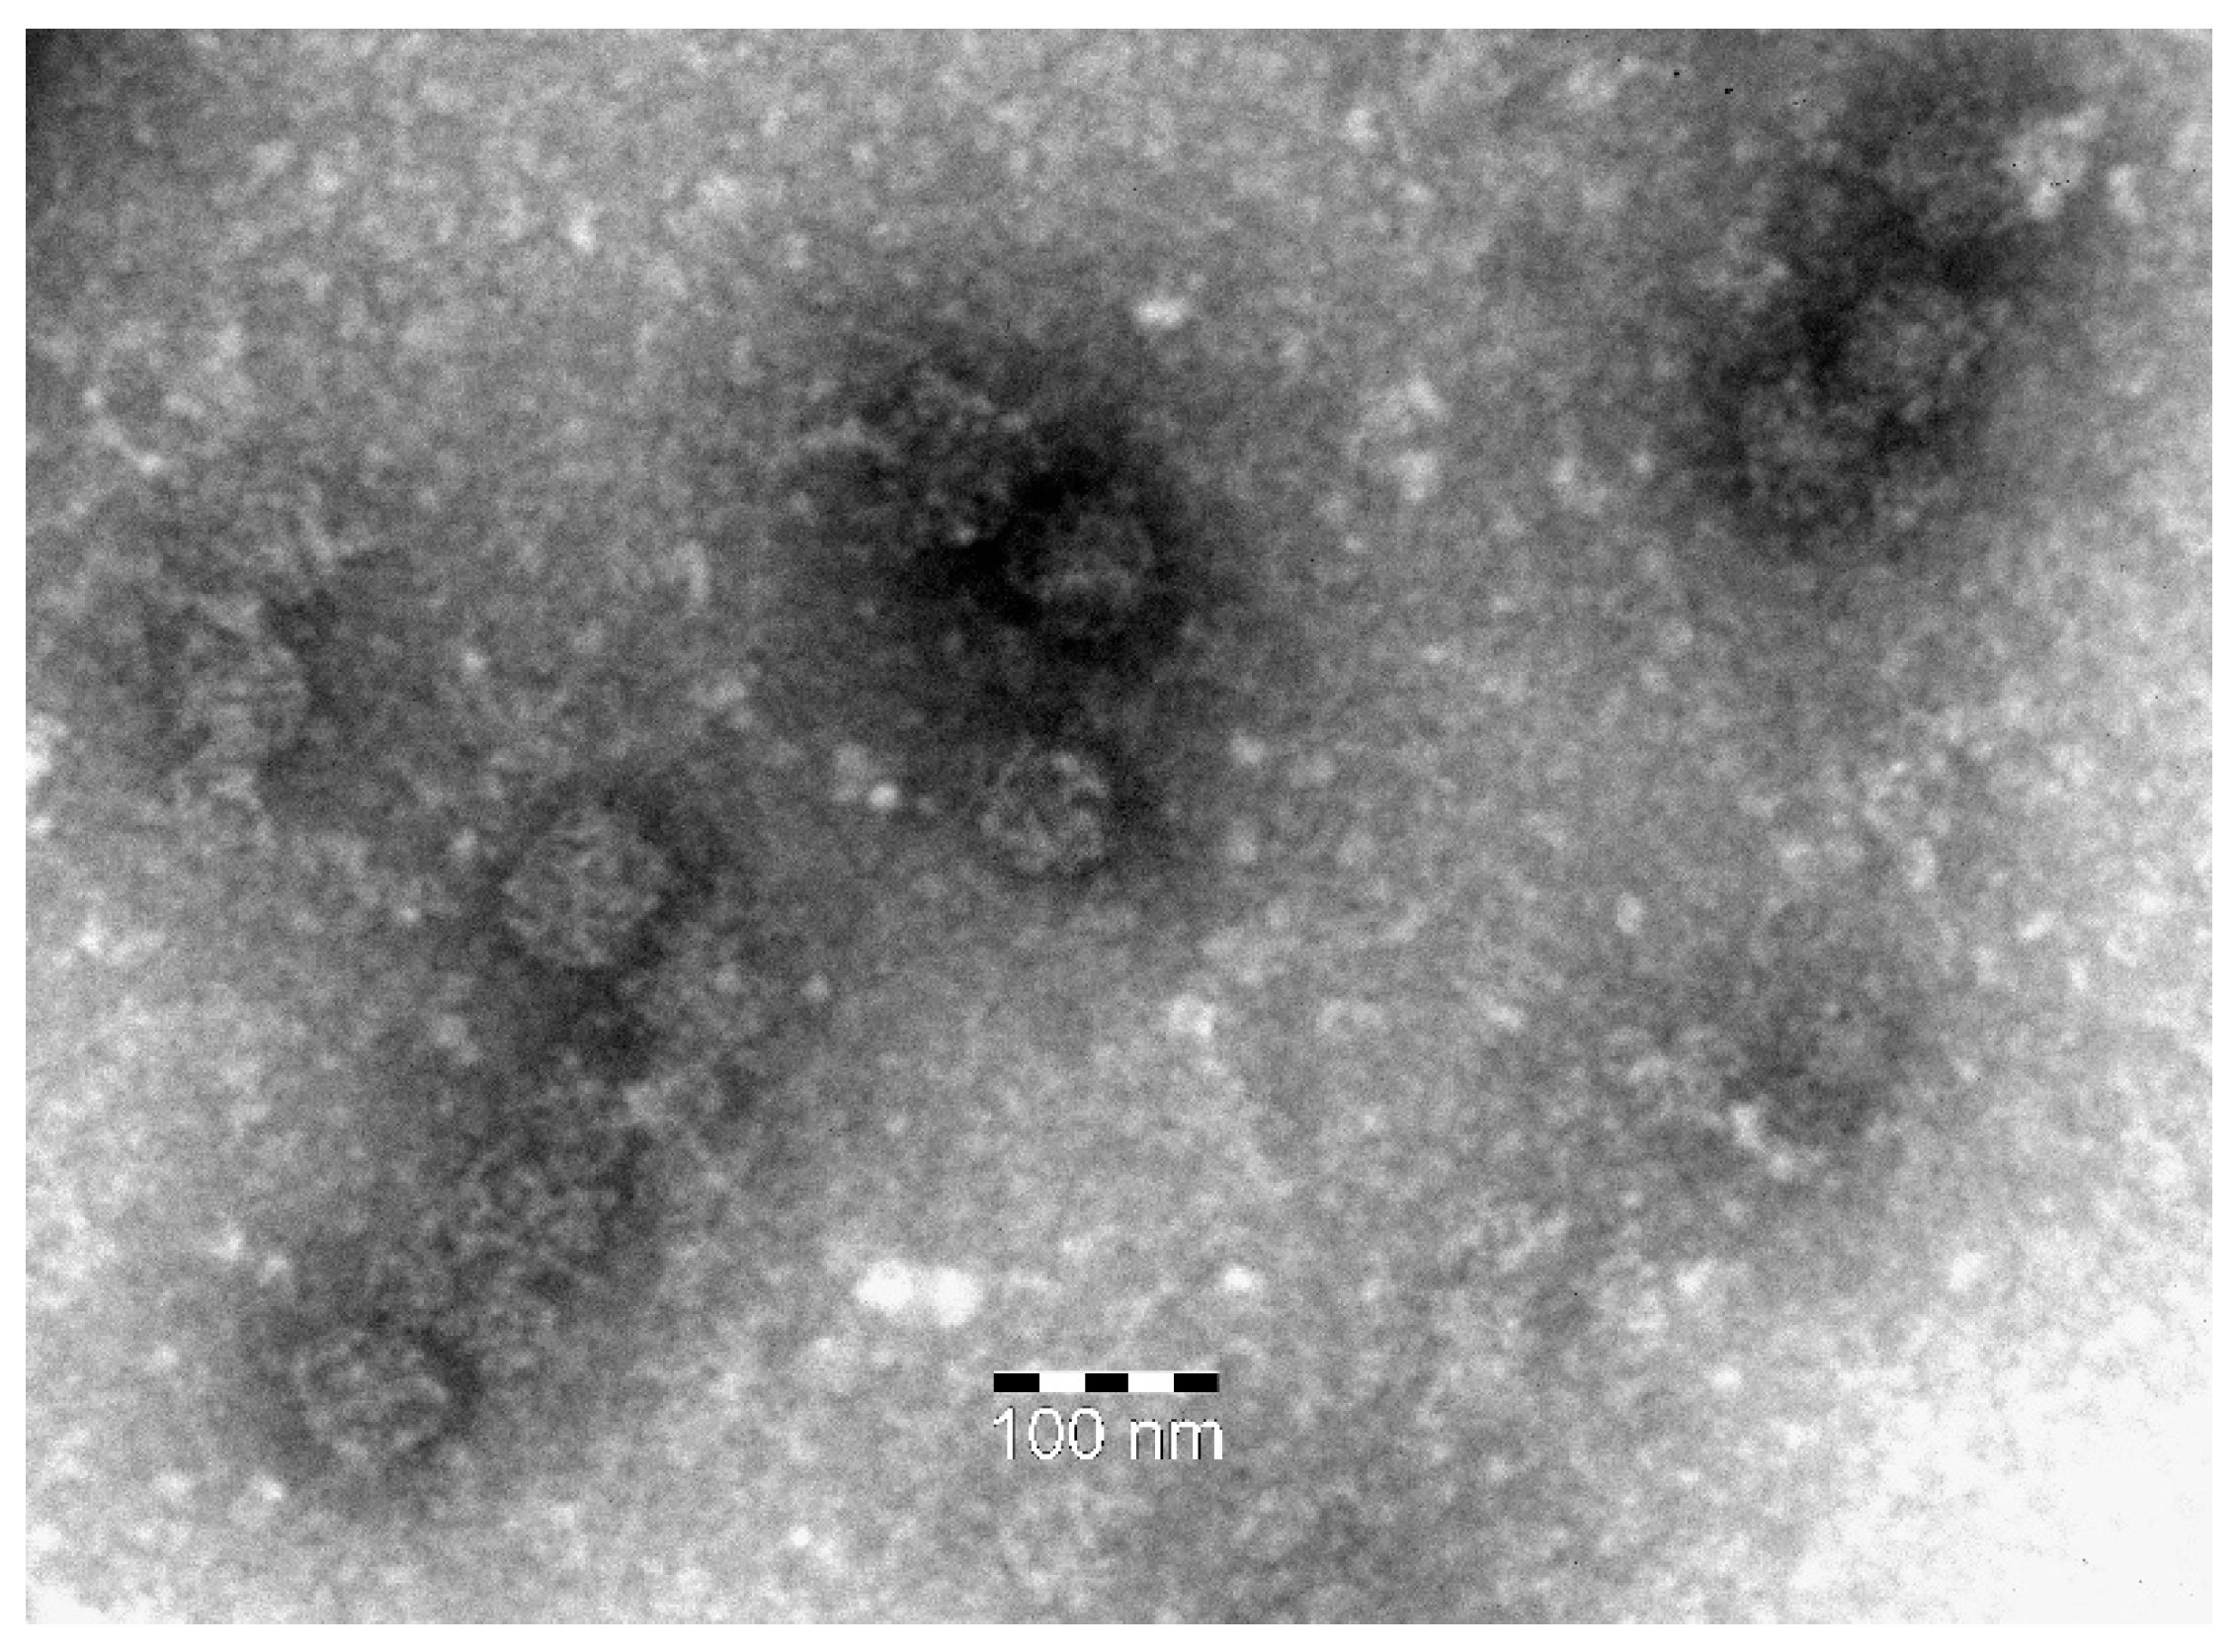
Figure 5.
Recombinant Cap proteins Cap 1-Cap 7 (lanes 1-7) were separated by SDS-PAGE, transferred to nitrocellulose and incubated with serum from a BFDV PCR-positive hybrid macaw (serum 3, diluted 1:250), followed by goat anti-bird IgG (1:200) and HRP-conjugated anti-goat IgG (1:7500). Signals were developed using an enhanced chemiluminescence (ECL) substrate. Lane 8 shows a positive control strip containing Cap 3 probed with an anti-His-tag antibody.
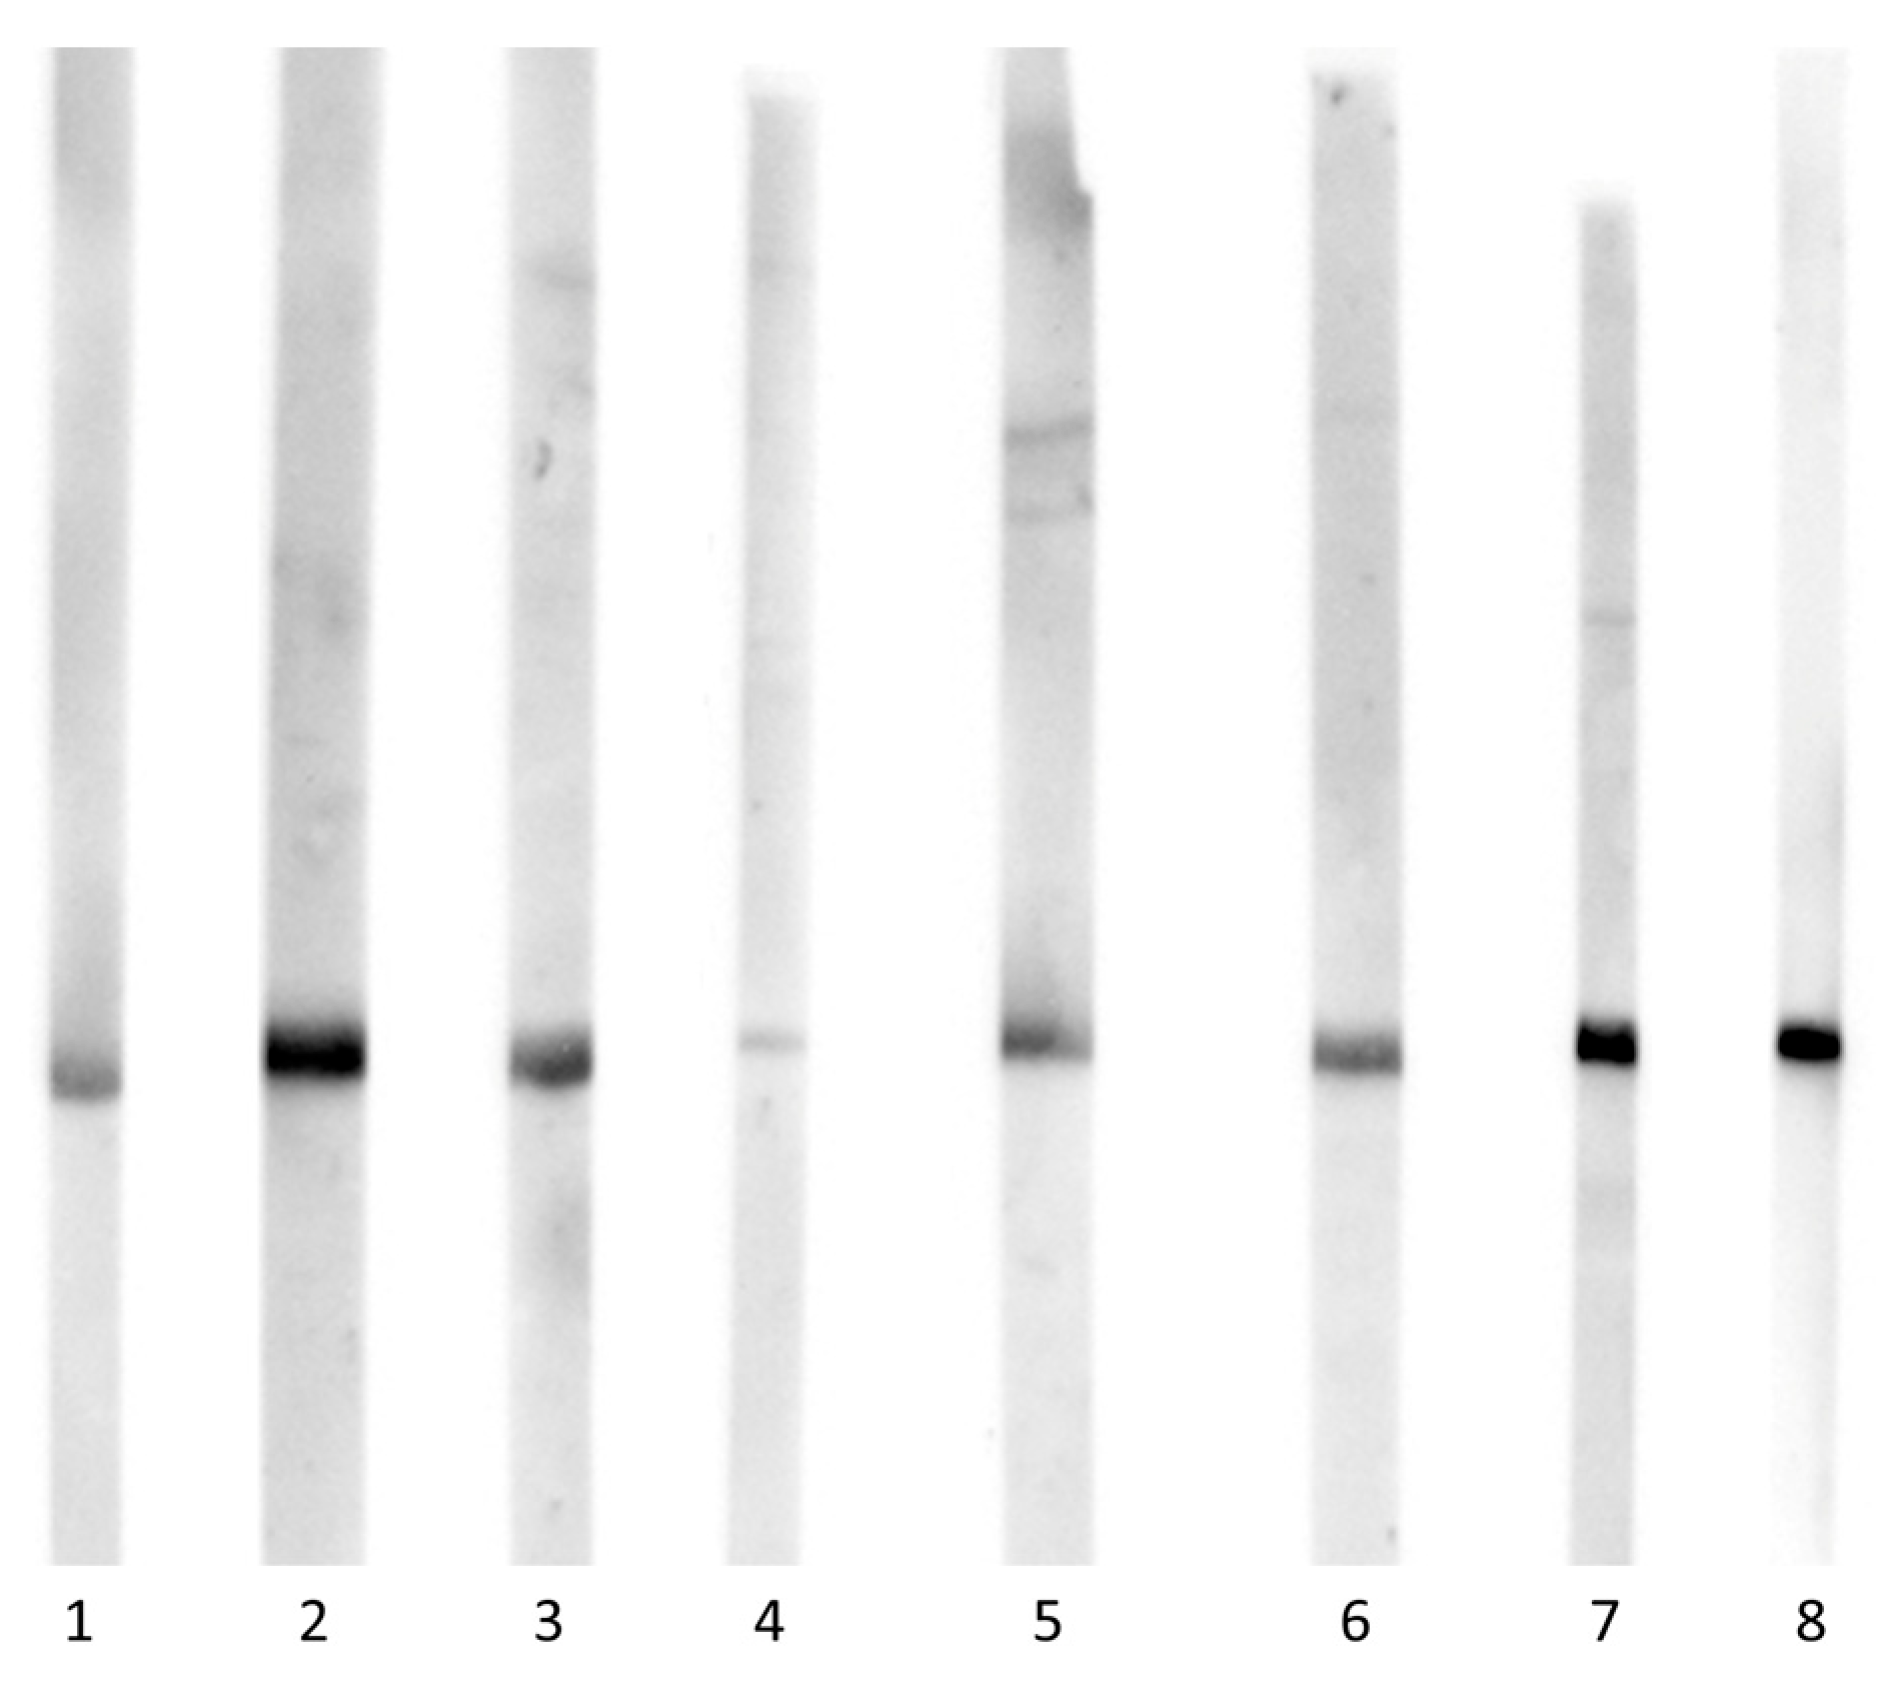
Figure 6.
Stacked bar chart summarising Western blot reactivity of eight sera against seven recombinant BFDV Cap variants (Cap 1-Cap 7). Each bar represents one serum sample; coloured segments indicate the relative signal contribution of each Cap variant. Sera originated from an Grey parrot (Psittacus sp., serum 1), galah (Eolophus roseicapillus, serum 2), macaw (Ara hybrid, serum 3), plain parakeet (Brotogeris tirica, serum 4), Alexandrine parakeet (Psittacula eupatria, serum 5), two psittacine parrots of unspecified species (sera 6 and 8) and a cockatiel (Nymphicus hollandicus, serum 7). For each serum, background corrected band intensities were quantified by densitometry and normalised to the geometric mean signal across all Cap proteins (geometric mean = 1), and the plotted values represent the resulting relative (proportional) signal intensities per protein.
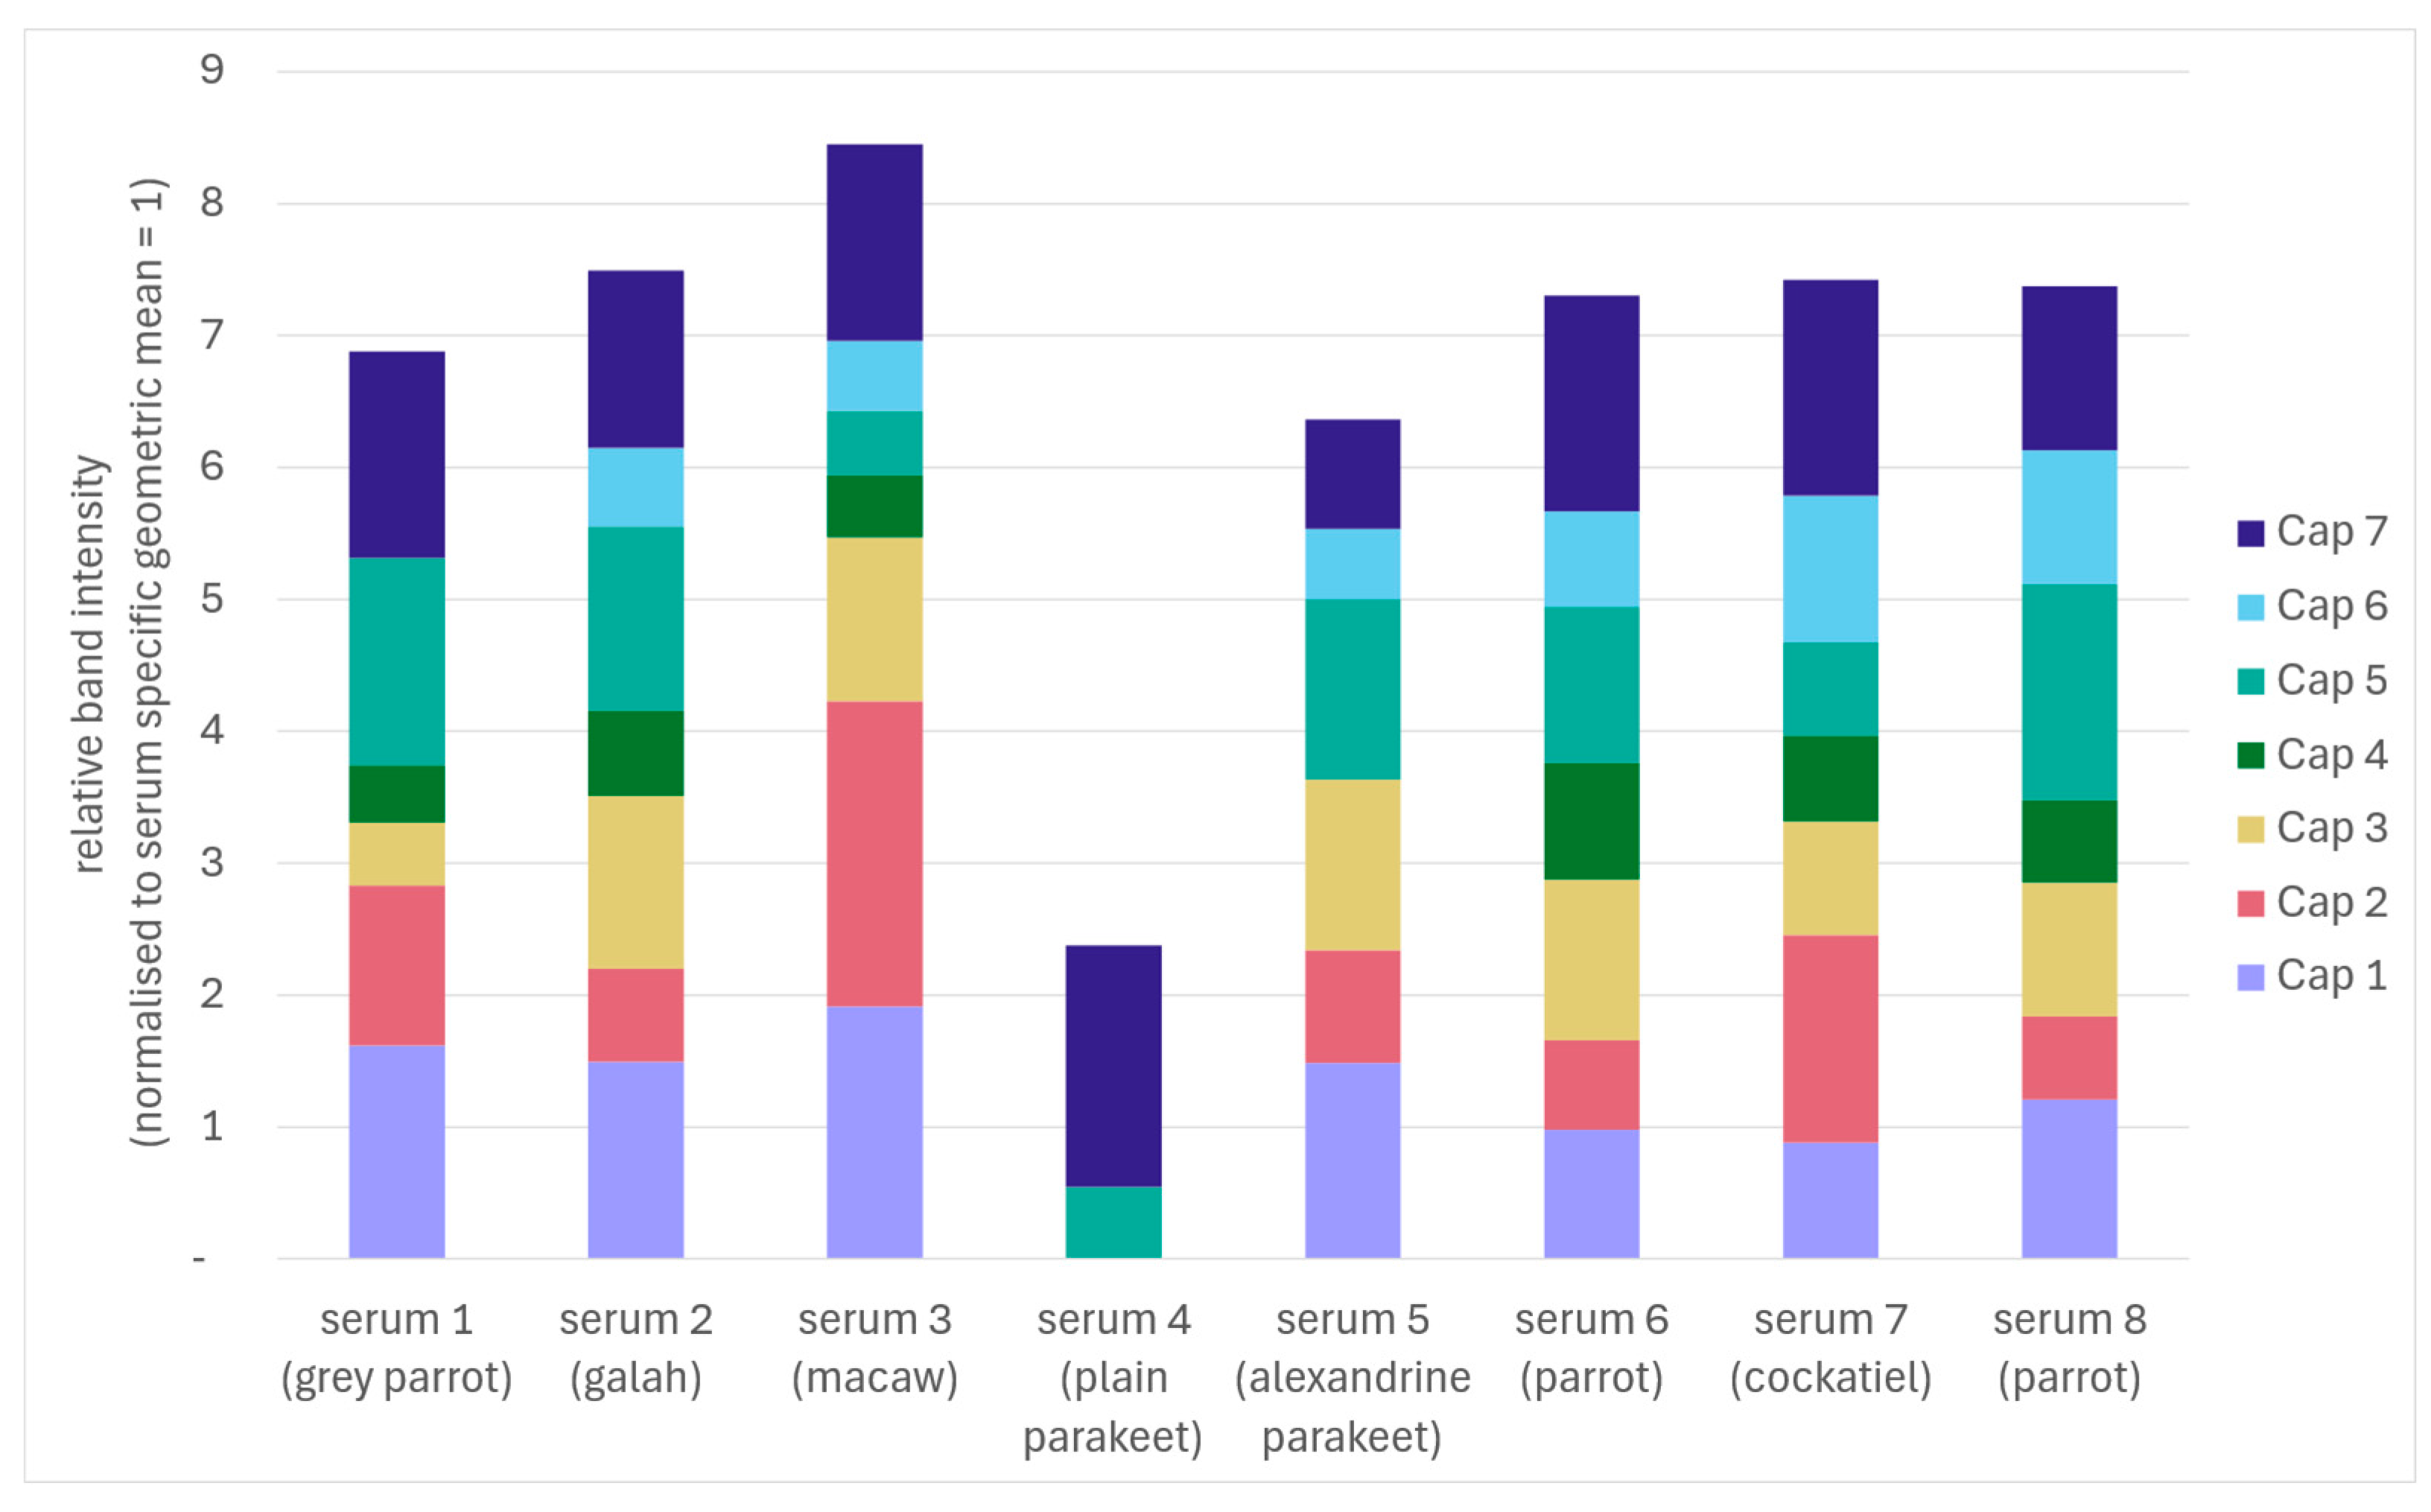
Figure 7.
Normalised ELISA reactivity profiles of eight sera (origin as in figure 5) across seven recombinant Cap variants displayed as proportional signal contributions based on background-corrected absorbance values (ΔOD; negative-serum mean subtracted on a plate- and antigen-specific basis, reactivities of individual sera against the seven Cap proteins summarized to total 100%). Asterisks (*) indicate serum-antigen combinations classified as reactive (≥ antigen-specific cut-off in 3/3 independent runs). Open circles (°) indicate equivocal/sporadic reactivity (≥ cut-off in 1/3 or 2/3 runs), whereas combinations ≥ cut-off in 0/3 runs were considered non-reactive (no symbol). Cut-offs were defined per antigen and plate as the mean of negative sera + 3×SD. Segment height reflects proportional contribution within a serum and is therefore not directly comparable to the cut-off classification, which is based on antigen-specific raw signals.
Disclaimer/Publisher’s Note: The statements, opinions and data contained in all publications are solely those of the individual author(s) and contributor(s) and not of MDPI and/or the editor(s). MDPI and/or the editor(s) disclaim responsibility for any injury to people or property resulting from any ideas, methods, instructions or products referred to in the content. |
© 2026 by the authors. Licensee MDPI, Basel, Switzerland. This article is an open access article distributed under the terms and conditions of the Creative Commons Attribution (CC BY) license (http://creativecommons.org/licenses/by/4.0/).
Copyright: This open access article is published under a Creative Commons CC BY 4.0 license, which permit the free download, distribution, and reuse, provided that the author and preprint are cited in any reuse.


