
Submitted:
13 January 2026
Posted:
14 January 2026
You are already at the latest version
Abstract
Background: A significant proportion of patients with inflammatory bowel disease (IBD) treated with ustekinumab (UST) or vedolizumab (VDZ) experience an absence or loss of response with conventional treatment regimens. Available evidence on the intensification of these agents is limited. Aims: Main: To evaluate the frequency of intensification of UST and VDZ, the most frequent type of intensification, and its effectiveness, durability and safety. Secondary: Analyze predictors of response.Methods: Single-centre, retrospective, observational study including 101 patients with IBD who received UST and/or VDZ in an intensified regimen from its approval until June 2022. Efficacy was assessed at weeks 16 and 52 after intensification. Clinical response was considered to be a decrease of ≥3 points in clinical indices; and clinical remission as disappearance of symptoms. Results: Inten-sified treatment was given to 48.95% and 77.36% of patients on UST and VDZ, respective-ly. At 16 weeks, the rate of clinical response and remission for UST was 64.3% and 35.7%, respectively; and 46.3% and 20% for VDZ. At week 52 after UST intensification, 60% achieved a clinical response (43% remission); and 46.3% (31.7% remission) responded with VDZ. The likelihood of maintenance of intensified treatment was 79% for UST and 61% for VDZ (median follow-up 21 and 16 months, respectively). The use of corticoster-oids/ immunosuppressants was associated with a lack of response to short-term UST in-tensification (p=0.02). Conclusion: The frequency of intensification of UST and VDZ in real clinical practice is high. Short-term results of such strategy are acceptable and long-lasting, especially regarding UST.
Keywords:
inflammatory bowel disease
; Crohn disease
; ulcerative colitis
; ustekinumab
; vedolizumab
; intensification
; optimization
1. Introduction
Over twenty years ago, biological anti-TNF agents (tumour necrosis factor-αinhibitors) revolutionized the management of inflammatory bowel disease (IBD). Despite this, up to one third of patients fail to respond initially to these agents (primary failure), and 30-50% of responder patients experience loss of secondary response, whilst others develop adverse events. [1] The main causes of loss of response to anti-TNF agents are subtherapeutic concentrations of the drug and/or the presence of antibodies against the drug. [2] Options in these cases include increasing the dose, shortening the interval of administration and/or adding a concomitant immunosuppressive drug to recover the response and avoid treatment cessation. [3] For patients with primary failure and those in whom the response cannot be recovered consideration should be given to a change in the therapeutic target.
The appearance of new biological agents, such as ustekinumab and vedolizumab, directed against other targets has widened the therapeutic arsenal for IBD, enabling the response to be recovered in patients who fail to respond to anti-TNF agents. Both treatments are indicated for patients with moderate-to-severe Crohn disease (CD) or ulcerative colitis (UC) with an inadequate response, loss of response, intolerance or contraindications to conventional therapy or anti-TNF agents. [4,5]
Ustekinumab (UST) is a human IgG1 monoclonal antibody directed at subunit p40 of interleukins (IL) 12 and 23. Induction treatment consists of a single intravenous dose adjusted to patient weight (6 mg/kg) followed by a first subcutaneous dose of 90 mg at 8 weeks. Maintenance therapy is given with subcutaneous UST 90 mg each 8 or 12 weeks, according to medical criteria. [4] Vedolizumab (VDZ) is a monoclonal antibody that binds specifically to the alfa-4 beta-7 integrin, selectively inhibiting leukocyte migration to the bowel. [6] The recommended treatment regimen is 300 mg VDZ administered by intravenous infusion at 0, 2 and 6 weeks, and thereafter each 8 weeks. [5]
Despite being much less immunogenic than anti-TNF agents, [7] patients may often have an inadequate response or experience a loss of response with standard maintenance doses. However, evidence from real clinical practice concerning the relative frequency and efficacy-safety of dose intensification of these two biological drugs is limited.
This study aims to analyze the relative frequency of dose intensification in patients treated with VDZ and UST, the most common type of intensification used for each agent and the effectiveness, durability and safety of the intensified treatment. Secondary objetives include analyzing predictive factors of short-term response to intensification.
2. Materials and Methods
Study Design and Patient Inclusion
This observational, retrospective single-centre study included patients older than 18 years of age with IBD (CD or UC) who started an intensified regimen of VDZ or UST at the Regional University Hospital of Malaga from the time of approval of these drugs by the regulatory agencies up to June 2024. UST/VDZ intensification was considered to be administration of the drug during an interval inferior to that approved in the technical data sheet (<8 weeks). Patients were excluded if their intensification data were unavailable as this occurred when their computerised medical history could not be accessed, as were patients in whom a combined biological response could not be assessed and patients who were lost to follow-up.
Data Collection
The study data were obtained from the database provided by the Pharmacy Unit of the Regional University Hospital of Malaga. This database included all patients with IBD receiving biological treatment. From this list we identified those patients who had received treatment with UST and/or VDZ and who later underwent an intensified regimen, recording the variables of interest from the electronic charts.
Variables
Demographic variables recorded included age, sex and smoking habit; variables related with the IBD included time of evolution, type, localization and pattern, presence of perianal disease and associated extra-intestinal manifestations, history of IBD-associated surgery, clinical indexes (Harvey-Bradshaw and partial Mayo) and biological data [C-reactive protein (CRP) and faecal calprotectin (FC)] prior to intensification. Treatment-related variables included previous biological treatment, type of UST or VDZ intensification, need for prior drug intensification, time to intensification (months), concomitant use immunosuppressive drugs or steroids during the intensification, combined clinical and biological response and remission at 16 weeks and one year, durability of the treatment after intensification (months), adverse effects after intensification and need for medical rescue therapy or surgery in the event of intensification failure.
The clinical activity of the disease was assessed with the Harvey-Bradshaw Index (HBI) for CD (Annex 1) and the partial Mayo index (PMI) for UC (Annex 2). A clinical response was considered to be a reduction of ≥3 points on the HBI or MPI, and clinical remission was considered to be disappearance of disease symptoms (HBI ≤4 points for CD and defecation frequency ≤3 stools daily with no blood for UC). A combined biological response was defined as a 50% reduction in the figures of CRP and FC after treatment intensification; and combined biological remission as a FC<250 mcg/g and CRP<5 mg/L.
Data Analysis
The variables collected were coded, added to an EXCEL database and later analysed with the Statistical Program for Social Sciences (SPSS Statistics Version 29, IBM Corp., Armonk, New York, United States).
The Kolmogorov-Smirnov and Shapiro-Wilk tests were used to determine whether the variables followed a normal distribution. Continuous variables were described by their median and interquartile range if they followed a non-parametric distribution and by the mean and standard deviation in the case of a parametric distribution. Categorical variables were described as an absolute number and total percentage.
Qualitative variables were analysed with Chi-square or Fisher’s exact tests (if the percentage of expected values lower than 5 was greater than 20%). Quantitative variables were analysed in two independent groups with the Student t test for two independent samples (in the event of a parametric distribution), or the Mann-Whitney U test (if the distribution was non-parametric). The durability of the drug was evaluated by Kaplan-Meier survival analysis. Statistical significance was set at p<0.05.
3. Results
From a total of 186 patients who received treatment with UST and/or VDZ at our centre during the study period, 101 (54.3%) underwent an intensified regimen.
Characteristics of the Patients Treated with UST
UST was given to 143 patients: 1 (0.7%) with 90 mg each 12 weeks, 72 (50.35%) with 90 mg each 8 weeks and 70 (48.95%) with an intensified regimen. The baseline characteristics of the patients who underwent intensified treatment with UST are shown in Table 1.
Types of UST Intensification
Of the 70 patients on treatment with intensified UST, 17 (24.29%) were with UST 90 mg each 6 weeks, 45 (64.29%) with 90 mg each 4 weeks, 5 (7.14%) had received reinduction iv and later maintenance with 90 mg each 4 weeks, 2 (2.86%) were with 90 mg each 3 weeks and 1 (1.42%) was on maintenance treatment with UST iv monthly.
Effectiveness of Intensified UST Treatment
In the short term (week 16 after intensification), 45/70 patients (64.3%) achieved a clinical response, of whom 25/70 (35.7%) achieved clinical remission. A combined biological response and remission was seen in 23/70 patients (32.8%) and 16/70 (22.8%), respectively (Figure 1).
A In the long term (week 52 after intensification), 50/70 patients (71.4%) continued with intensified UST: 42/70 patients (60%) achieved a clinical response, of whom 30/70 (43%) achieved clinical remission. The frequencies of combined biological response and remission were 18/70 patients (25.7%) and 13/70 (18.6%), respectively (Figure 1).
Factors Predicting Response After UST Intensification
We analyzed possible factors predicting a clinical response at 16 weeks after intensification (Table 2). The concomitant use of steroids/immunosuppressants was significantly associated with a lower rate of clinical response (p=0.02).
Durability of Intensified UST Treatment
After intensification, UST treatment was withdrawn in 16 patients (22.85%). In just one case was this withdrawal due to an adverse event, with withdrawal in the other patients due to absence of a response or a partial response to intensification. These 16 patients required other rescue therapy: 6 patients received VDZ, 4 anti-TNF, 2 tofacitinib and 4 required surgery. In addition, 7 patients (10%) required a new intensification with UST and 1 patient received dual treatment (UST+VDZ). The likelihood of continuing intensified treatment at 21 months (median follow-up) was 79%.
Safety of Intensified UST Treatment
Adverse events occurred in 11/70 patients (15.7%) on intensified UST treatment. The most usual adverse event was coronavirus (COVID-19) in 8 patients, although in no patient was this severe nor did any patient require hospitalization. One patient experienced paradoxical palmoplantar psoriasis that necessitated treatment cessation.
Characteristics of the Patients Treated with VDZ
VDZ was given to 53 patients: 12 (22.64%) with VDZ 300 mg each 8 weeks and 41 (77.36%) with an intensified regimen. The baseline characteristics of the patients treated with intensified VDZ are shown in Table 3.
Types of VDZ Intensification
Of the 41 patients treated with intensified VDZ, 3 (7.3%) were with 300 mg each 6 weeks and 38 (92.7%) with 300 mg each 4 weeks.
Effectiveness of Intensified VDZ Treatment
In the short term (week 16 after intensification) a clinical response was achieved in 19/41 patients (46.3%), of whom 8/41 (20%) achieved clinical remission; 8/41 patients (20%) and 4/41 (10%) achieved a combined biological response and remission, respectively (Figure 2).
In the long term (week 52 after intensification) a clinical response was achieved in 19/41 patients (46.3%), of whom 13/41 (31.7%) achieved clinical remission. A combined biological response and remission was achieved in 11/41 patients (26.8%) and 6/41 (14.6%), respectively (Figure 2)
Factors Predicting a Response to VDZ Intensification
No factor was associated with a short-term clinical response (Table 4).
Durability of Intensified VDZ Treatment
After intensification, 28/41 (68.3%) patients required other rescue therapy: in almost all the patients it was necessary to withdraw VDZ due to lack of response or partial response (except for one patient in whom it was stopped due to adverse events). Among these patients, 16 received UST, 5 tofacitinib, 2 anti-TNF, 1 tiopurine, 1 dual treatment, and 3 required surgery. The likelihood of continuing intensified treatment at 16 months (median follow-up) was 61%.
Safety of Intensified VDZ Treatment
Adverse events were recorded in 5/41 patients (12.2%), all infectious. One patient presented repeated colitis due to Clostridium difficile that required cessation of VDZ treatment.
Comparison Between the Groups (UST vs VDZ)
Table 5 shows a comparison of the baseline characteristics between the UST and VDZ patients. The only significant difference between the two treatment groups was the age, with the patients receiving treatment with UST being younger (p = 0.03).
4. Discussion
This single-centre observational study evaluated the frequency of dose intensification, as well as the effectiveness, durability and safety of intensified treatment with UST and VDZ in patients with CD and UC and a lack or loss of response with the standard maintenance regimen.
Almost half the patients in our centre who were being treated with UST received an intensified regimen. This frequency of intensification is greater than that reported in a systematic review by Meserve (20%) [8] and in other observational studies assessing UST intensification in patients with CD; Derikx et al. reported a frequency of intensification of 33.7%, [9] and Olmedo et al. 33%. [10] In the multicentre SUSTAIN study evaluating the long-term effectiveness and safety of UST in patients with CD, 21.6% (100/464) of the patients received intensified therapy over a median follow-up of 15.5 months. [11] Other studies report a similar frequency of intensification as us; 51.7% in the work of Dalal et al. that evaluated the effectiveness of UST intensification each 4 and each 6 weeks in patients with CD, [12] and 42.6% in another study by Dalal et al. evaluating UST intensification in patients with UC. [13] Derikx et al. noted that intensification was associated with the prior use of anti-TNF and VDZ and the concomitant use of steroids at the start of UST treatment. [9] However, revising the baseline characteristics of the patients included in these studies shows the figures for the prior use of anti-TNF or VDZ appear to be similar.
Concerning the short-term effectiveness of intensification, our results are similar to those reported elsewhere. Dalal et al. achieved a clinical response in 67.5% of UC patients at week 12-16 after intensification. [13] Kopylov et al. examined different UST intensification strategies in patients with CD, finding that 38% of the patients reached clinical remission at 16 weeks after intensification, although the results concerning a clinical response were slightly lower than ours (51%). [14] Fumery et al. evaluated the effectiveness of UST 90 mg each 4 weeks in CD patients, finding that 61% of the patients achieved a clinical response and 31% clinical remission in the short term (median 2.4 months after intensification). [15] Two studies specifically assessed the effectiveness of reinduction with i.v. UST in patients with CD. A multicentre Spanish study involving 53 patients (54% already on intensified UST treatment each 4 or 6 weeks) reported frequencies of clinical response or remission at 16 weeks after reinduction of 52.8% and 43.3%, respectively. [16] Another study, by Sedano et al., in which all the patients (n=15) had presented a partial response or loss of response to UST intensification each 4 weeks, noted that 78.6% achieved a clinical response (57.1% remission) after a median of 14.9 weeks following reinduction. [17]
Considering the short-term combined biological response/remission, our results are better than those in the study by Olmedo et al., who reported a frequency of combined biological response and remission at 16 weeks of 23.1% and 16.5%, respectively. [10]
Our long-term results concerning clinical response/remission are similar to those reported in the study by Dalal et al., in which a clinical response was achieved at one year after intensification in 60.5% of the patients with CD treated with UST each 4 weeks and in 58.6% of the patients treated with UST each 6 weeks. [12] Our results also agree with those of Kopylov et al., where, after a median follow-up of 26 weeks, 52% and 41.8% of the patients obtained clinical response and remission, respectively. [14] Our results are better than those in the study by Ollech et al., who evaluated the efficacy of UST each 4 weeks in 110 patients with CD followed for a median of 9 months, and of whom only 42% achieved a clinical response and 28% clinical remission. [18]
The only factor significantly associated in our study with the short-term absence of a clinical response was the concomitant use steroids/immunosuppressants (p=0.02). This association was probably due to the fact that they are commonly used concomitantly with biological treatment in patients with more severe IBD or with a torpid evolution. The association between steroid treatment and a lack of short-term clinical response was also seen by Olmedo et al., who in fact found other associations, such as perianal disease, a high HBI and the prior use of ≥3 biological agents. [10] Dalal et al. found that perianal disease, a high HBI and the concomitant use of opioids during intensification were associated with failure to achieve remission. [12] Another article by Dalal et al. reported an association between prior intestinal resection and a high HBI with the lack of steroid-free clinical response at 2 years. [19]
UST was suspended in 22.85% of our patients, with a 79% likelihood of continuing intensified treatment at 21 months. Dalal et al. evaluated long-term (24 months) UST intensification and found similar results: UST-intensified treatment was withdrawn in 19.5% of CD patients and 30% of UC patients. [19] Similarly, Ollech et al. withdrew intensified treatment in 20.9% of patients. [18] Treatment durability at our centre was better than that reported by Fumery et al. in CD patients on treatment with UST 90 mg each 4 weeks, for whom the likelihood of continuing treatment was 81% at 6 months and 51% at 12 months; [15] and similar to that in the study by Olmedo et al., where the likelihood of continuing treatment was 81% at 16 months. [10] However, the persistence of treatment is not always indicative of its efficacy, as treatment is sometimes continued given the absence of other therapeutic options.
The rate of adverse events in our patients was 15.7% with intensified UST treatment. Fumery et al. reported a similar figure (12%). [15] However, our rate was greater than that found elsewhere: 9% in the study by Derikx et al.,9 7.7% in that of Kopylov et al.,14 5% in that of Dalal et al. [13] and 4.3% in the study by Olmedo et al. [10] This variability could be due to possible under-reporting of adverse events (in particular mild events), a bias associated with retrospective studies.
Concerning VDZ treatment, 77.36% of our patients received an intensified regimen, the vast majority at 300 mg each 4 weeks iv (92.7%). Our intensification figures are much higher than those reported in other studies evaluating the effectiveness of VDZ intensification in patients with IBD. Samaan et al. reported a 27% rate of intensification, [20] although they only considered VDZ intensification each 4 weeks. The abstract of Shivashankar et al. describes an intensification rate of 17.88%. [21] Williet et al. presented intensification figures more similar to ours: 63.8% of the patients required VDZ intensification each 4 weeks, [22] although this result may be influenced by the fact that all the patients in the mentioned study had previously failed with two anti-TNF drugs. In our cohort, 65.9% of the patients had received prior treatment with anti-TNF agents (over half with 2 anti-TNF).
Almost half the patients in our study (46.3%) achieved a clinical response, with 20% achieving remission in the short-term (16 weeks). Samaan et al. reported that 40% of patients with IBD who presented activity before intensification achieved a response and 10% clinical remission at 12 weeks after VDZ intensification each 4 weeks. [20] Outtier et al., who evaluated the efficacy of VDZ intensification each 4 weeks in 59 IBD patients with loss of secondary response, found that 54% achieved a clinical response at week 8. [23] In addition, they noted that serum VDZ levels were significantly higher in the patients who achieved a clinical and biological response. A multicentre American study by Shmidt et al. assessed the management of loss of response to VDZ in patients with IBD. They concluded that after a median follow-up of 24 weeks a clinical response was seen in 49% of the patients (18% achieved remission) after VDZ intensification (each 4 or 6 weeks). [24] A systematic review and meta-analysis directed by Peyrin-Biroulet that included 10 studies (8 real-life studies and 2 randomised phase 3 trials) evaluating the loss of secondary response to VDZ found a pooled efficacy of intensification of 53.8%. [6] Another more recent systematic review that included 10 real-life studies found rates of response and clinical remission of 49.6% and 37.7%, respectively, after VDZ intensification in IBD patients who failed to respond or presented loss of response to standard maintenance treatment. [25] The clinical response found in the study by Shivashankar et al. was much higher than that mentioned so far: 81.4% of the patients with loss of response to VDZ recovered a response at week 14 after intensification. [21]
In our patients, 20% achieved a combined biological response in the short term (10% achieved biological remission). Outtier et al. [23] reported a biological response of 37% at week 8,23 although they only considered the CRP figures.
The GEMINI 1 and 2 clinical trials evaluated the efficacy of VDZ treatment in patients with UC and CD, respectively. Those patients who achieved a response to VDZ in the induction phase were randomly assigned to receive VDZ each 8 weeks, each 4 weeks or placebo during the maintenance phase. Among the patients with UC (GEMINI 1), 44.8% of those who received VDZ each 4 weeks were in clinical remission at week 52. [26] In the GEMINI 2 study, 36.4% of the patients with CD on treatment with intensified VDZ achieved remission. [27] Our results over the long term in real life are inferior, with a rate of clinical remission of 31.7% one year after intensification.
We found no factor associated with a short-term clinical response, possibly due to the small sample size. Samaan et al. found that the response at week 24 was significantly associated with low baseline CRP levels and with the response at week 12. [20]
After intensification, VDZ treatment was stopped in over half the patients (68.3%). The likelihood of maintaining intensified treatment at 16 months (median follow-up) was 61%. We have been unable to find any other study that evaluated these characteristics.
Adverse events were reported in 12.2% of the patients, in one of whom VDZ treatment had to be stopped due to repeated Clostridium infections. These results are higher than those in the study by Shivashankar et al., who reported adverse events in 2/27 patients (7.4%) with intensified VDZ. [21] The highest rate of adverse events was found in a study assessing the long-term safety of VDZ (62 patients with IBD treated with VDZ ≥52 weeks), with 3 adverse events among the 14 patients (21.4%) who were on intensified treatment. [28]
Our study presents certain limitations. Firstly, its retrospective design makes it susceptible to errors in the variables obtained and implies a risk of bias. Additionally, various different intensification strategies were studied, possibly resulting in non-homogenous results. Moreover, in many patients the intensification was given early, so we cannot rule out that some may have improved with the standard regimen. Our results concerning clinical response and remission are based on the HBI and the MPI, which are subjective scores that can vary between observers and that have mostly had to be calculated from the data recorded in the clinical history. In addition, we did not evaluate endoscopic activity, which is the most objective marker of response/remission. A proportion of patients were receiving concomitant medication during intensification, and we do not know whether this could have influenced the response. Concerning safety, the fact that the study was retrospective may have resulted in under-reporting of mild adverse events that resolved without the need to attend a specialist. The time of data collection and the number of patients studied may have been insufficient to detect significant associations. Given the absence of associations between the study variables and the clinical response at week 16, no multivariate analysis was performed.
One of the strong points in our study is that we were able to obtain the intensification data of two biological agents much used in our medium, for both CD and UC, in an important series of patients, thereby increasing available evidence concerning the real-life efficacy and safety of these treatments.
5. Conclusions
Intensification of treatment with UST and VDZ in patients with IBD is a common strategy in real clinical practice in our setting. It has acceptable efficacy and safety and lasting results, particular concerning UST. As the availability of new molecules for treatment of IBD could change this strategy, new studies are needed to assess this situation in a new setting.
Author Contributions
A.I.M.B. and M.B.G. has carried out the database creation, data analysis and writing of the paper. R.O.M. and M.J.P. were responsible for the research question, design, revision and supervision of the manuscript. All authors are part of the Inflammatory Bowel Disease unit of the centre and have contributed with their experience in the management of disease and interpretation of the data. All authors have read and agreed to the published version of the manuscript.
Funding
This research received no external funding.
Informed Consent Statement
As this was a retrospective observational study, no informed consent form was required from the patients included in the study.
Data Availability Statement
Date are contained within the article.
Conflicts of Interest
The authors declare no conflicts of interest.
Institutional Review Board Statement
This study was conducted in accordance with the recom mendations of the Declaration of Helsinki and was approved by the Hospital’s Research Ethics Committee (approval code: SICEIA-2025-000122; date of approval on 14 January 2025).
Abbreviations
| IBD Inflammatory Bowel Disease UST Ustekinumab VDZ vedolizumab CD Crohn disease UC Ulcerative colitis CRP C-reactive protein FC faecal calprotectin HBI Harvey-Bradshaw Index PMI Partial Mayo index |
Appendix A
Appendix A.1

Table A1.
Harvey-Bradshaw Index [29]. Score: <6 mild; 6-12 moderate; >12 severe
Table A1.
Harvey-Bradshaw Index [29]. Score: <6 mild; 6-12 moderate; >12 severe
| VARIABLES | POINTS |
|
General well-being |
0 -Very well 1 -Slightly below par 2 -Poor 3 -Very poor 4 -Terrible |
| Abdominal pain | 0 -None 1 -Mild 2 -Moderate 3 -Severe |
| Number of liquid stools per day | N points |
| Abdominal mass | 0 - None 1 -Dubious 2 -Definite 3 - Definite and tender |
|
Complications |
1 - Arthralgia 1 - Uveitis 1 - Erythema nodosum 1 - Aphthous ulcers 1 - Pyoderma gangrenosum 1 - Anal fistula 1 - Other fistulas 1 - Abscess |
Table A2.
Partial Mayo index [30]. Score: 2-4 mild; 5-6 moderate; 7-9 severe
Table A2.
Partial Mayo index [30]. Score: 2-4 mild; 5-6 moderate; 7-9 severe
| VARIABLES | POINTS |
| Number of stools per day | 0- Normal 1- 1-2 stools more than normal 2- 3-4 stools more than normal 3 - >4 stools more than normal |
| Rectal bleeding | 0 - None 1- Streaks of blood in < half the stools 2 - Visible blood mixed with stools in most stools 3 - Bleeding without stools |
|
Medical assessment |
0- Normal 1– Mild disease 2– Moderate disease 3 – Severe disease |
References
- Atreya, R.; Neurath, M.F. Mechanisms of molecular resistance and predictors of response to biological therapy in inflammatory bowel disease. Lancet Gastroenterol Hepatol. 2018, 3, 790–802. [Google Scholar] [CrossRef] [PubMed]
- Shmidt, E.; Kochhar, G.; Hartke, J.; et al. Predictors and Management of Loss of Response to Vedolizumab in Inflammatory Bowel Disease. Inflamm Bowel Dis. 2018, 24, 2461–2467. [Google Scholar] [CrossRef] [PubMed] [PubMed Central]
- Roda, G.; Jharap, B.; Neeraj, N.; Colombel, J.F. Loss of Response to Anti-TNFs: Definition. Epidemiology. and Management. Clin Transl Gastroenterol. 2016, 7, e135. [Google Scholar] [CrossRef] [PubMed] [PubMed Central]
- European Medicines Agency. Stelara (ustekinumab). Summary of product characteristics. 2013. Consulted june 24. 2024. https://www.ema.europa.eu/en/documents/product-information/stelara-epar- product-information_en.pdf.
- European Medicines Agency. Entyvio (vedolizumab). Summary of product characteristics. 2014. Consulted June 24. 2024. https://www.ema.europa.eu/en/documents/product-information/entyvio-epar- product-information_en.pd.
- Peyrin-Biroulet, L.; Danese, S.; Argollo, M.; et al. Loss of Response to Vedolizumab and Ability of Dose Intensification to Restore Response in Patients With Crohn's Disease or Ulcerative Colitis: A Systematic Review and Meta-analysis. Clin Gastroenterol Hepatol. 2019, 17, 838–846.e2. [Google Scholar] [CrossRef] [PubMed]
- Vermeire, S.; Gils, A.; Accossato, P.; et al. Immunogenicity of biologics in inflammatory bowel disease. Therap Adv Gastroenterol. 2018, 11, 1756283X17750355. [Google Scholar] [CrossRef] [PubMed] [PubMed Central]
- Meserve, J.; Ma, C.; Dulai, P.S.; et al. Effectiveness of Reinduction and/or Dose Escalation of Ustekinumab in Crohn's Disease: A Systematic Review and Meta- analysis. Clin Gastroenterol Hepatol. 2022, 20, 2728–2740.e1. [Google Scholar] [CrossRef] [PubMed] [PubMed Central]
- Derikx, L.A.A.P.; Plevris, N.; Su, S.; et al. Rates. predictive factors and effectiveness of ustekinumab intensification to 4- or 6-weekly intervals in Crohn's disease. Dig Liver Dis. 2023, 55, 1034–1041. [Google Scholar] [CrossRef] [PubMed]
- Olmedo Martín, R.V.; Vázquez Morón, J.M.; Martín Rodríguez, M.D.M.; et al. Effectiveness and safety of ustekinumab dose escalation in Crohn's disease: a multicenter observational study. Rev Esp Enferm Dig 2023. [Google Scholar] [CrossRef] [PubMed]
- Chaparro, M.; Baston-Rey, I.; Fernández-Salgado, E.; et al. Long-Term Real-World Effectiveness and Safety of Ustekinumab in Crohn's Disease Patients: The SUSTAIN Study. Inflamm Bowel Dis. 2022, 28, 1725–1736. [Google Scholar] [CrossRef] [PubMed] [PubMed Central]
- Dalal, R.S.; Njie, C.; Marcus, J.; et al. Predictors of Ustekinumab Failure in Crohn's Disease After Dose Intensification. Inflamm Bowel Dis. 2021, 27, 1294–1301. [Google Scholar] [CrossRef] [PubMed] [PubMed Central]
- Dalal, R.S.; Esckilsen, S.; Barnes, E.L.; et al. Predictors and Outcomes of Ustekinumab Dose Intensification in Ulcerative Colitis: A Multicenter Cohort Study. Clin Gastroenterol Hepatol. 2022, 20, 2399–2401.e4. [Google Scholar] [CrossRef] [PubMed] [PubMed Central]
- Kopylov, U.; Hanzel, J.; Liefferinckx, C.; et al. Effectiveness of ustekinumab dose escalation in Crohn's disease patients with insufficient response to standard-dose subcutaneous maintenance therapy. Aliment Pharmacol Ther. 2020, 52, 135–142. [Google Scholar] [CrossRef] [PubMed]
- Fumery, M.; Peyrin-Biroulet, L.; Nancey, S.; et al. Effectiveness And Safety Of Ustekinumab Intensification At 90 Mg Every Four Weeks In Crohn's Disease: A Multicenter Study. J Crohns Colitis. 2020, jjaa177. [Google Scholar] [CrossRef] [PubMed]
- Bermejo, F.; Jiménez, L.; Algaba, A.; et al. Re-induction With Intravenous Ustekinumab in Patients With Crohn's Disease and a Loss of Response to This Therapy. Inflamm Bowel Dis. 2022, 28, 41–47. [Google Scholar] [CrossRef] [PubMed]
- Sedano, R.; Guizzetti, L.; McDonald, C.; Jairath, V. Intravenous Ustekinumab Reinduction Is Effective in Prior Biologic Failure Crohn's Disease Patients Already on Every-4-Week Dosing. Clin Gastroenterol Hepatol. 2021, 19, 1497–1498.e1. [Google Scholar] [CrossRef] [PubMed]
- Ollech, J.E.; Normatov, I.; Peleg, N.; et al. Effectiveness of Ustekinumab Dose Escalation in Patients With Crohn's Disease. Clin Gastroenterol Hepatol. 2021, 19, 104–110. [Google Scholar] [CrossRef] [PubMed] [PubMed Central]
- Dalal, R.S.; Pruce, J.C.; Allegretti, J.R. Long-Term Outcomes After Ustekinumab Dose Intensification for Inflammatory Bowel Diseases. Inflamm Bowel Dis. 2023, 29, 830–833. [Google Scholar] [CrossRef] [PubMed] [PubMed Central]
- Samaan, M.A.; Birdi, S.; Morales, M.S.; et al. Effectiveness of vedolizumab dose intensification to achieve inflammatory bowel disease control in cases of suboptimal response. Frontline Gastroenterol. 2019, 11, 188–193. [Google Scholar] [CrossRef] [PubMed] [PubMed Central]
- Shivashankar, R.; Mendoza Ladd, A.; Grace, R.; et al. Effect of vedolizumab dose escalation on recapturing response in patients with inflammatory bowel disease. Gastroenterology 2017, 152, S77. [Google Scholar] [CrossRef]
- Williet, N.; Boschetti, G.; Fovet, M.; et al. Association Between Low Trough Levels of Vedolizumab During Induction Therapy for Inflammatory Bowel Diseases and Need for Additional Doses Within 6 Months. Clin Gastroenterol Hepatol. 2017, 15, 1750–1757.e3. [Google Scholar] [CrossRef] [PubMed]
- Outtier, A.; Wauters, L.; Rahier, J.F.; et al. Effect of vedolizumab dose intensification on serum drug concentrations and regain of response in inflammatory bowel disease patients with secondary loss of response. GastroHep 2021, 3, 63–71. [Google Scholar] [CrossRef]
- Shmidt, E.; Kochhar, G.; Hartke, J.; et al. Predictors and Management of Loss of Response to Vedolizumab in Inflammatory Bowel Disease. Inflamm Bowel Dis. 2018, 24, 2461–2467. [Google Scholar] [CrossRef] [PubMed] [PubMed Central]
- Patel, D.; Martin, S.; Luo, M.; et al. Real-World Effectiveness of Vedolizumab Dose Escalation in Patients With Inflammatory Bowel Disease: A Systematic Literature Review. Crohns Colitis 360 2022, 4, otac020. [Google Scholar] [CrossRef] [PubMed] [PubMed Central]
- Feagan, B.G.; Rutgeerts, P.; Sands, B.E.; et al. Vedolizumab as induction and maintenance therapy for ulcerative colitis. N Engl J Med. 2013, 369, 699–710. [Google Scholar] [CrossRef] [PubMed]
- Sandborn, W.J.; Feagan, B.G.; Rutgeerts, P.; et al. Vedolizumab as induction and maintenance therapy for Crohn´s disease. N Engl J Med. 2013, 369, 711–721. [Google Scholar] [CrossRef] [PubMed]
- Ritter, T.; Fourment, C.; Van Anglen, L.; et al. Long-term safety analysis of vedolizumab for treatment of Crohn’s disease and ulcerative colitis. Am J Gastroenterol. 2017, 112(ACG Annual Meeting Abstracts Supplement 2017), S399–S400. [Google Scholar]
- Harvey, R.F.; Bradshaw, J.M. A simple index of Crohn´s-disease activity. Lancet 1980, 1, 514. [Google Scholar] [CrossRef] [PubMed]
- D´Haens, G.; Sandborn, W.J.; Feagan, B.G.; et al. A review of activity indices and efficacy end points for clinical trials of medical therapy in adults with ulcerative colitis. Gastroenterology 2007, 132, 763–86. [Google Scholar] [CrossRef] [PubMed]
Figure 1.
Biological response and biological remission at week 16 and week 52 after uste kinumab intensification.
Figure 1.
Biological response and biological remission at week 16 and week 52 after uste kinumab intensification.
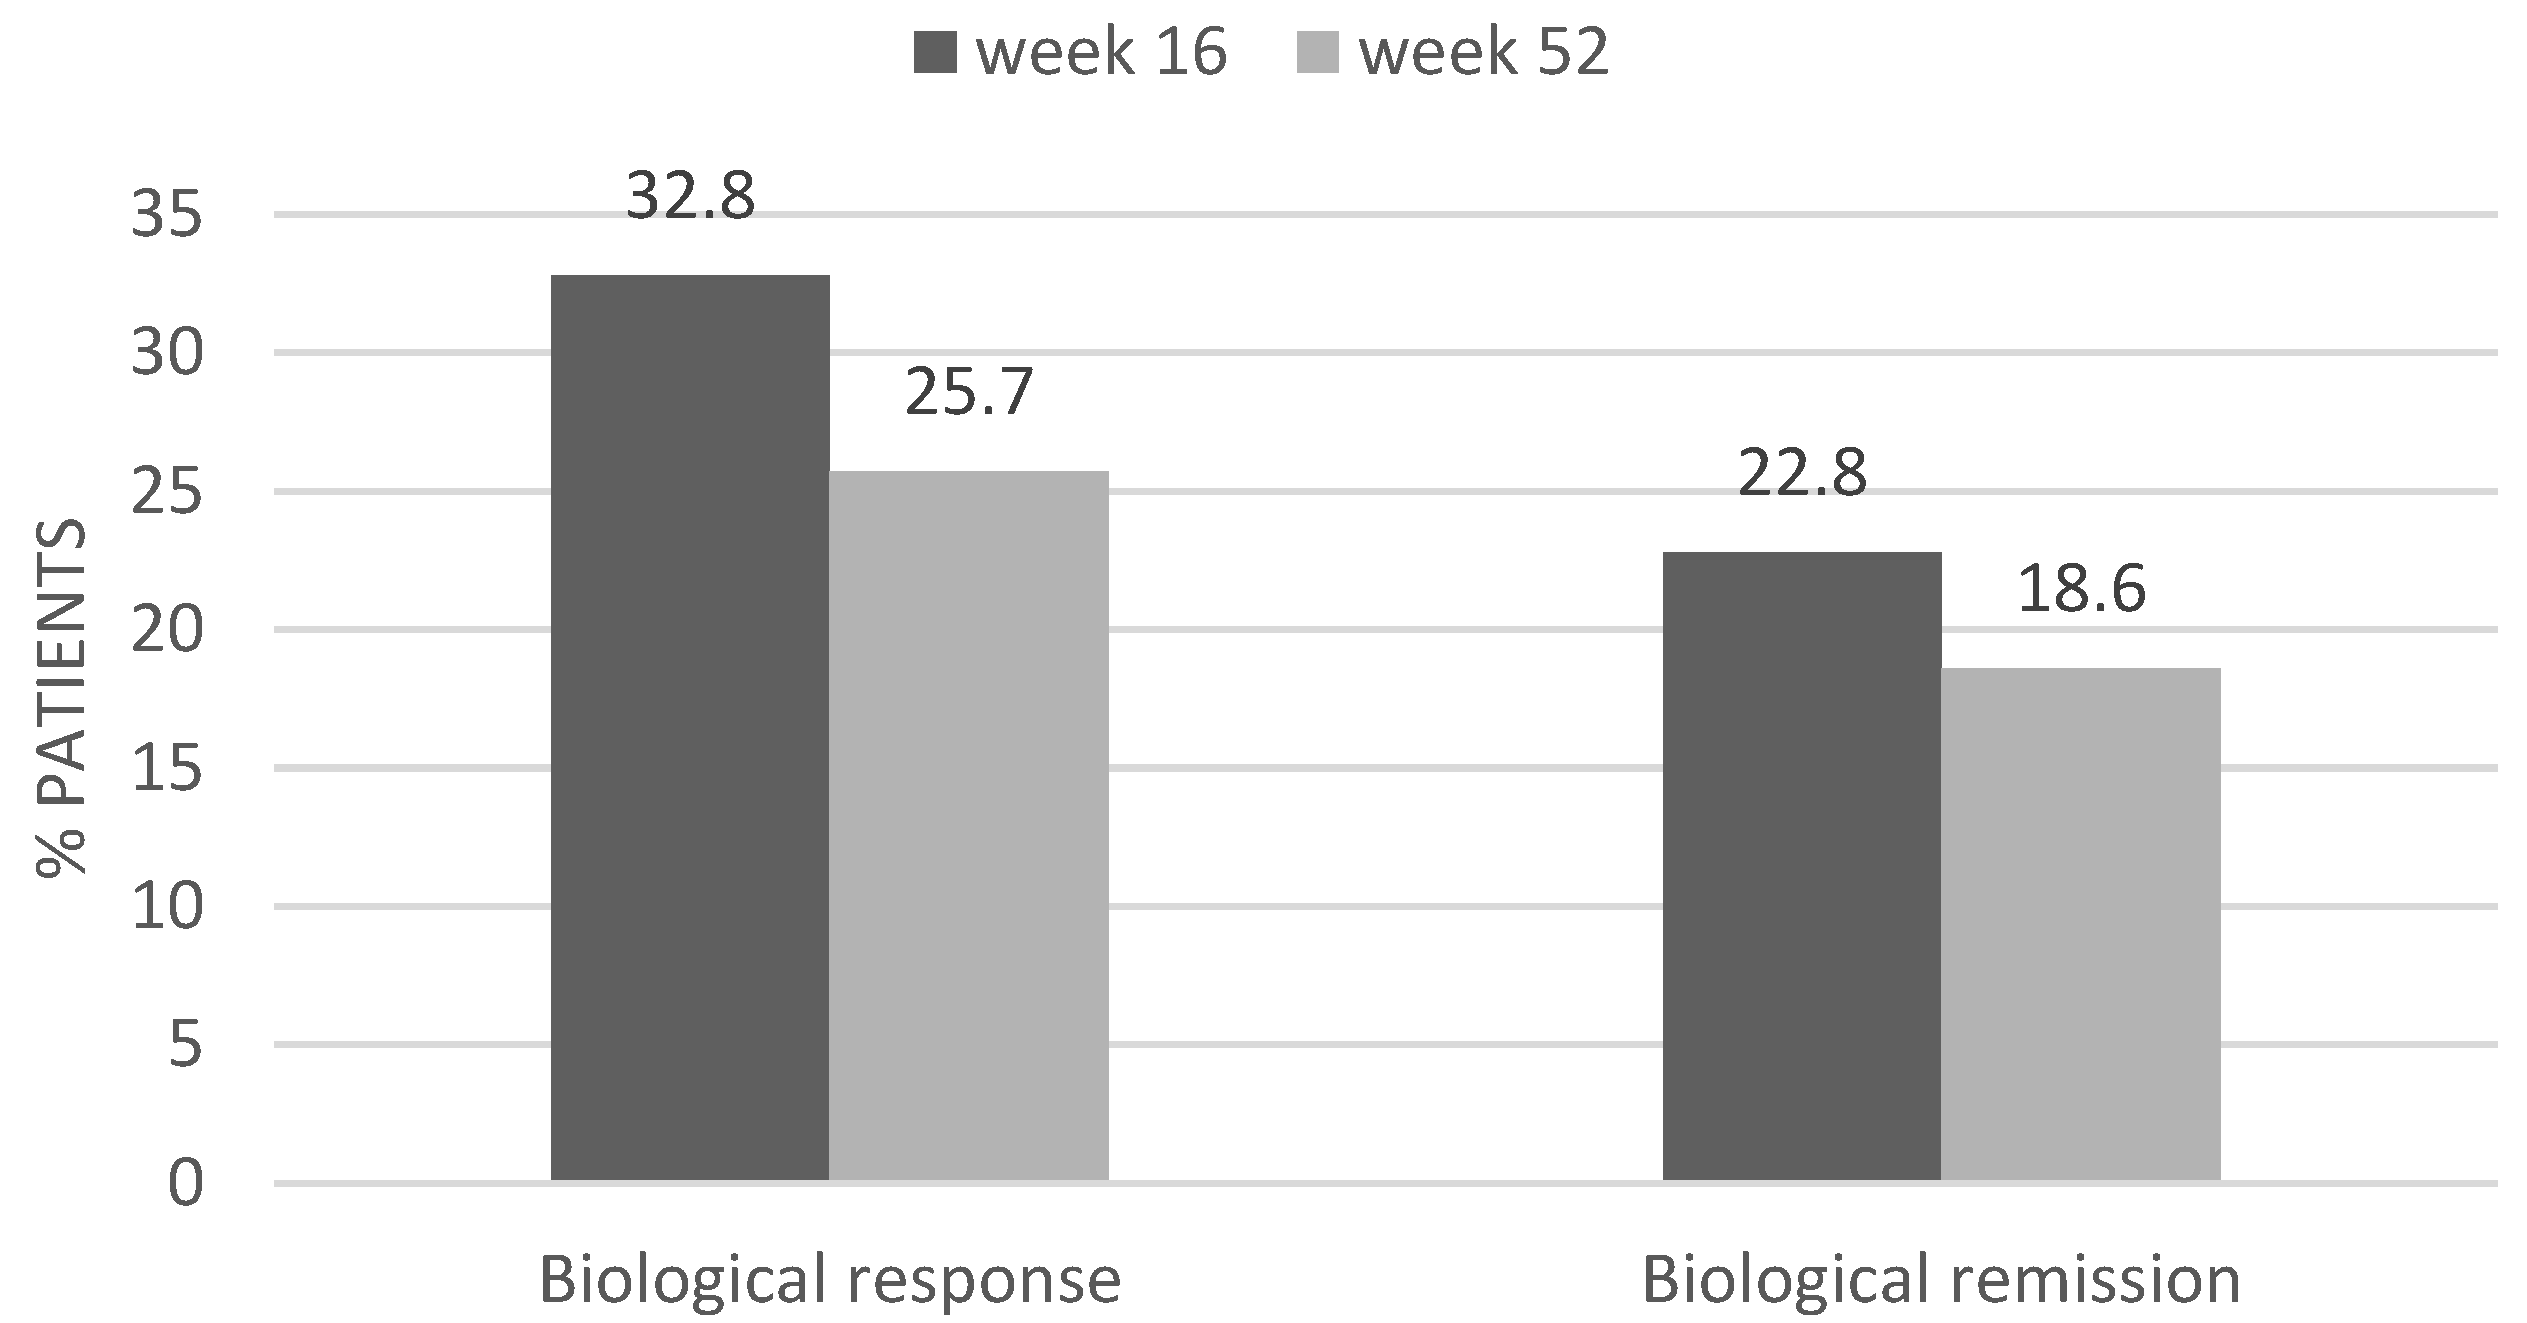
Figure 2.
Biological response and biologial remission at week 16 and week 52 after vedolizumab intensification.
Figure 2.
Biological response and biologial remission at week 16 and week 52 after vedolizumab intensification.
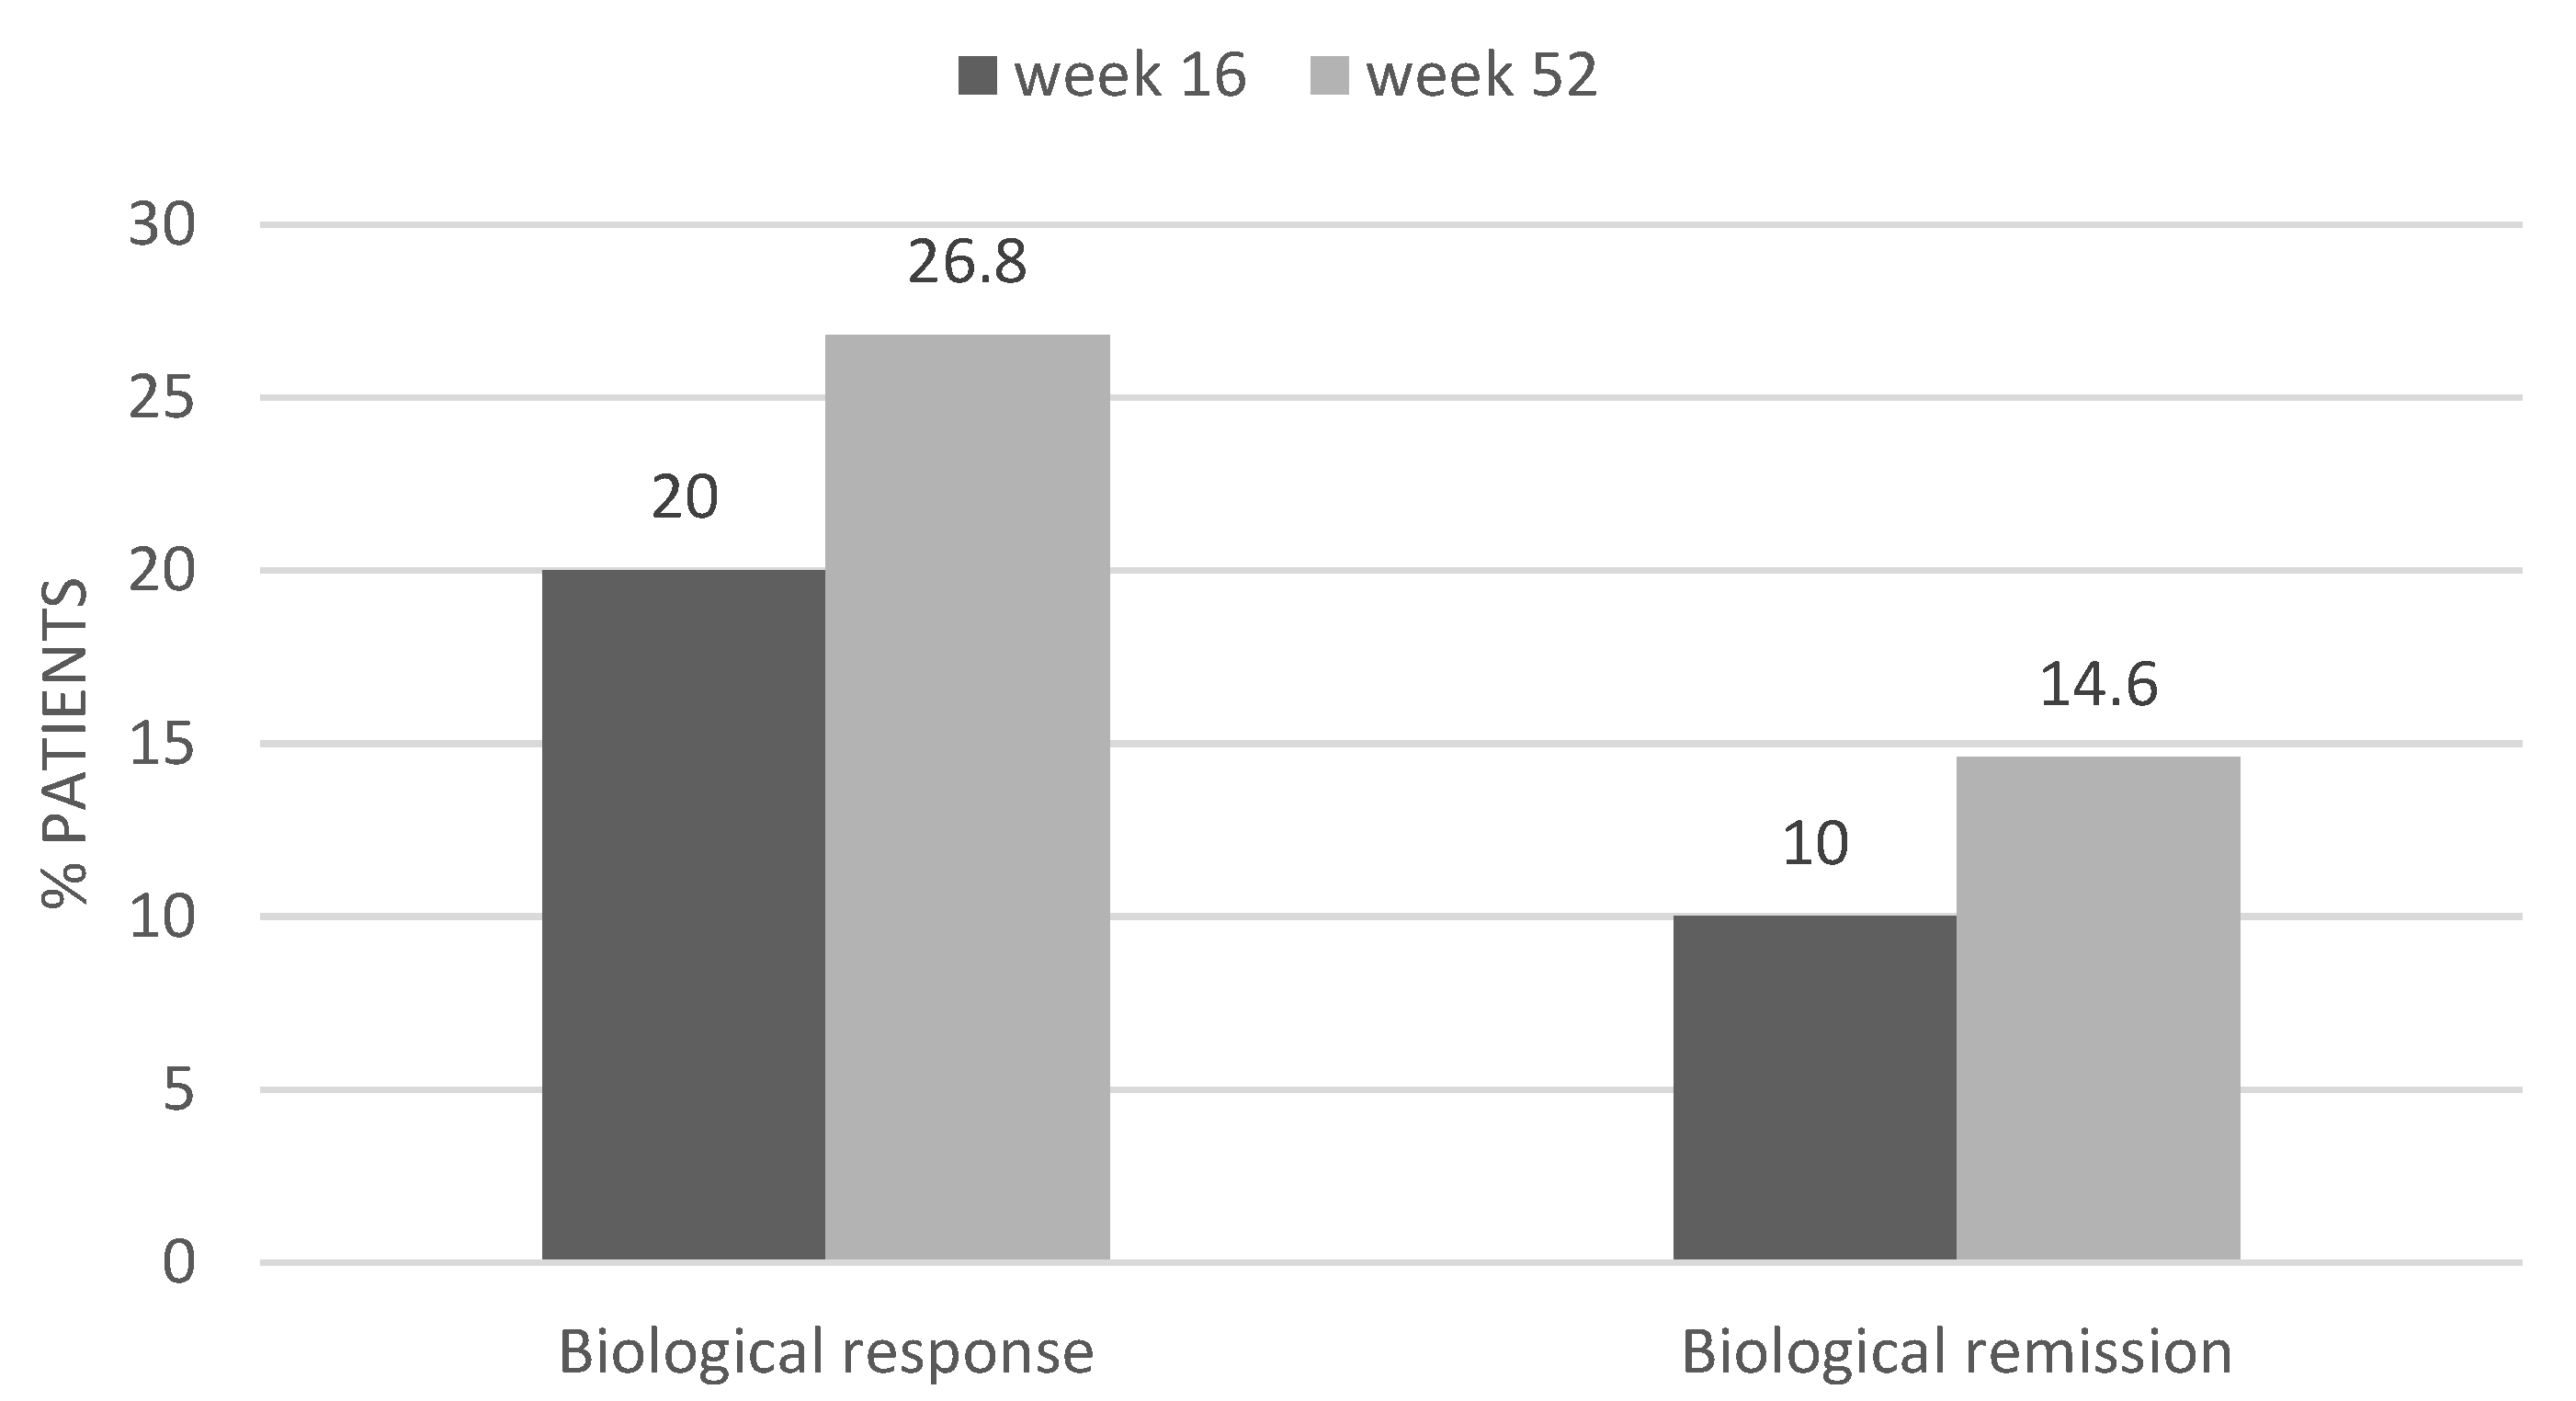
Table 1.
Baseline characteristics of the patients who received intensified treatment with ustekinumab (n=70).
Table 1.
Baseline characteristics of the patients who received intensified treatment with ustekinumab (n=70).
| Age (years) mean (s) | 47.1 (16) |
| Sex n (%) Female Male |
36 (51.4%) 34 (48.6%) |
| Smoking n (%) Smoker Ex-smoker Non-smoker |
14 (20%) 13 (18.6%) 43 (61.4%) |
| Type of IBD n (%) Ulcerative colitis Crohn disease |
14 (20%) 56 (80%) |
| Time of evolution IBD (years) median (IR) |
11 (9) |
| Localization UC n (%) E1: proctitis E2: left colitis E3: pancolitis |
1 (7.1%) 6 (42.9%) 7 (50%) |
| Localization CD n (%) L1: ileum L2: colon L3: ileocolonic L4: extense |
28 (50%) 5 (8.9%) 17 (30.4%) 6 (10.7%) |
| Behaviour CD n (%) B1: inflammatory B2: stenosing B3: fistulizing |
27 (48.2%) 17 (30.4%) 12 (21.4%) |
| Associated perianal disease n (%) | 17 (24,3%) |
| Extraintestinal manifestations n (%) | 14 (20%) |
| Prior surgery related with the IBD n (%) | 23 (32.9%) |
| Prior anti-TNF treatment n (%) | 62 (88.6%) |
| Type of prior anti-TNF n (%) Infliximab Adalimumab Both |
25 (40.3%) 12 (19.4%) 25 (40.3%) |
| Prior vedolizumab n (%) | 10 (14.3%) |
| Prior intensification of UST n (%) | 14 (20%) |
| Time to intensification (months) median (IR) |
6 (9) |
| Partial Mayo pre-intensification n (%) 2-4: mild 5-6: moderate 7-9: severe |
6 (42.85%) 6 (42.85%) 2 (14.3%) |
| HBI pre-intensification n (%) <6: mild 6-12: moderate >12: severe |
33 (58.9%) 21 (37.5%) 2 (3.6%) |
| CRP pre-intensification (mg/l) median (IR) |
15 (27) |
| Calprotectin pre-intensification (mcg/g) median (IR) |
905 (799) |
| Use of immunosuppressants/steroids during intensification n (%) |
17 (24,3%) |
Table 2.
Predictor of clinical response at week 16 after ustekinumab intensification.
| Clinical response week 16 | |||
| Variable | Yes n= 45 (64.3%) |
No n=25 (35.7%) |
P value |
| Age at diagnosis median (IR) |
26 (29) | 36.5 (25) | 0.98 |
|
Sex n (%) Male Female |
19 (42.2%) 26 (57.8%) |
15 (60%) 10 (40%) |
0.154 |
| Smoking n (%) Smoker Non-smoker Ex-smoker |
9 (20%) 29 (64.4%) 7 (15.6%) |
5 (20%) 14 (56%) 6 (24%) |
0.669 |
| Time of evolution IBD median (IR) |
11 (11) | 9 (9) | 0.863 |
| Type of IBD n (%) Ulcerative colitis Crohn disease |
8 (17.8%) 37 (82.2%) |
6 (24%) 19 (76%) |
0.533 |
| Localization UC n (%) E1: proctitis E2: left colitis E3: pancolitis |
0 (0%) 4 (50%) 4 (50%) |
1 (16.7%) 2 (33.3%) 3 (50%) |
0.767 |
| Localization CD n (%) L1: ileum L2: colon L3: ileocolonic L4: extense |
20 (54.1%) 3 (8.1%) 13 (35.1%) 1 (2.7%) |
8 (42.1%) 2 (10.5%) 4 (21.1%) 5 (26.3%) |
0.053 |
| Behaviour CD n (%) Inflammatory Stenosing Fistulizing |
16 (43.2%) 11 (29.7%) 10 (27%) |
11 (57.9%) 6 (31.6%) 2 (10.5%) |
0.338 |
| Perianal disease n (%) |
10 (22.2%) | 7 (28%) | 0.589 |
| Extraintestinal manifestations n (%) | 9 (20%) | 5 (20%) | 1 |
| Prior surgery n (%) | 16 (35.6%) | 7 (28%) | 0.519 |
| Prior anti-TNF treatment n (%) |
39 (86.7%) | 23 (92%) | 0.7 |
| Prior VDZ treatment n (%) | 6 (13.3%) | 4 (16%) | 0.737 |
| CRP before intensification median (IR) |
16 (33) | 14.5 (21) | 0.705 |
| FC before intensification median (IR) |
884.5 (752) |
905 (1321) |
0.733 |
| Type of intensification n (%) 90mg/6w sc 90mg/4w sc 90mg/3w sc Reinduction iv + 90mg/4w sc Maintenance iv |
12 (26.7%) 30 (66.7%) 0 (0%) 3 (6.7%) 0 (0%) |
5 (20%) 15 (60%) 2 (8%) 2 (8%) 1 (4%) |
0.237 |
| Prior UST intensification n (%) |
6 (13.3%) |
8 (32%) | 0.061 |
| Concomitant use of immunosuppressants/steroids n (%) |
7 (15.6%) | 10 (40%) | 0.022* |
Table 3.
Baseline characteristics of the patients with intensified vedolizumab (n=41).
| Age (years) mean (s) | 54.05 (16.77) |
|
Sex n (%) Female Male |
26 (63.4%) 15 (36.6%) |
|
Smoking n (%) Smoker Ex-smoker Non-smoker |
4 (9.8%) 5 (12.2%) 32 (78%) |
|
Type of IBD n (%) Ulcerative colitis Crohn disease |
24 (58.5%) 17 (41.5%) |
|
Time of evolution IBD (years) median (IR) |
10 (11) |
|
Localization UC n (%) E1: proctitis E2: left colitis E3: pancolitis |
2 (8.3%) 8 (33.3%) 14 (58.3%) |
|
Localization CD n (%) L1: ileum L2: colon L3: ileocolonic |
7 (41.2%) 4 (23.5%) 6 (35.3%) |
|
Behaviour CD n (%) B1: inflammatory B2: stenosing B3: fistulizing |
11 (64.7%) 4 (23.5%) 2 (11.8%) |
| Associated perianal disease n (%) | 5 (12.2%) |
| Extraintestinal manifestations n (%) | 6 (14.6%) |
| Prior surgery related with the IBD n (%) | 4 (9.8%) |
| Prior anti-TNF treatment n (%) | 27 (65.9%) |
|
Type of prior anti-TNF n (%) Infliximab Adalimumab Infliximab and Adalimumab Infliximab and Golimumab |
9 (33.3%) 3 (11.1%) 14 (51.9%) 1 (3.7%) |
| Prior ustekinumab n (%) | 4 (9.8%) |
| Prior intensification of VDZ n (%) | 2 (4.9%) |
|
Time to intensification (months) median (IR) |
3 (12) |
|
Partial Mayo pre-intensification n (%) 2-4: mild 5-6: moderate 7-9: severe |
18 (75%) 3 (12.5%) 3 (12.5%) |
|
HBI pre-intensification n (%) <6: mild 6-12: moderate >12: severe |
11 (64.8%) 5 (29.4%) 1 (5.9%) |
|
CRP pre-intensification (mg/l) median (IR) |
13 (85) |
|
Calprotectin pre-intensification (mcg/g) median (IR) |
772 (1113) |
|
Use of immunosuppressants/steroids during intensification n (%) |
21 (51.2%) |
Table 4.
Predictors of a clinical response at week 16 after vedolizumab intensification.
| Clinical response week 16 | |||
| Variable | Yes n= 19 (46.3%) |
No n= 22 (53.7%) |
P value |
| Age at diagnosis median (IR) |
46 (41) | 37.5 (30) | 0.927 |
|
Sex n (%) Male Female |
6 (31.6%) 13 (68.4%) |
9 (40.9%) 13 (59.1%) |
0.536 |
| Smoking n (%) Smoker Non-smoker Ex-smoker |
1 (5.3%) 15 (78.9%) 3 (15.8%) |
3 (13.6%) 17 (77.3%) 2 (9.1%) |
0.647 |
| Time of evolution IBD median (IR) |
10 (10) | 11 (12) | 0.332 |
| Type of IBD n (%) Ulcerative colitis Crohn disease |
12 (63.2%) 7 (36.8%) |
12 (54.5%) 10 (45.5%) |
0.752 |
| Localization UC n (%) E1: proctitis E2: left colitis E3: pancolitis |
1 (8.3%) 3 (25%) 8 (66.7%) |
1 (8.3%) 5 (41.7%) 6 (50%) |
0.822 |
| Localization CD n (%) L1: ileum L2: colon L3: ileocolonic |
3 (42.9%) 2 (28.6%) 2 (28.6%) |
4 (40%) 2 (20%) 4 (40%) |
1 |
| Behaviour CD n (%) Inflammatory Stenosing Fistulizing |
5 (71.4%) 2 (28.6%) 0 (0%) |
6 (60%) 2 (20%) 2 (20%) |
0.606 |
| Perianal disease n (%) |
2 (10.5%) | 3 (13.6%) | 1 |
| Extraintestinal manifestations n (%) | 2 (10.5%) | 4 (18.2%) | 0.668 |
| Prior surgery n (%) | 1 (5.3%) | 3 (13.6%) | 0.61 |
| Prior anti-TNF treatment n (%) |
12 (63.2%) | 15 (68.2%) | 0.735 |
| Prior UST treatment n (%) | 3 (15.8%) | 1 (4.5%) | 0.321 |
| CRP before intensification median (IR) |
12.5 (30) | 101 (114) | 0.197 |
| FC before intensification median (IR) |
763.5 (618) | 901 (1335) | 0.28 |
| Type of intensification n (%) 300mg/6w iv 300mg/4w iv |
1 (5.3%) 18 (94.7%) |
2 (9.1%) 20 (90.9%) |
1 |
| Prior VDZ intensification n (%) |
2 (10.5%) | 0 (0%) | 0.209 |
| Concomitant use of immunosuppressants/steroids n (%) |
8 (42.1%) | 13 (59.1%) | 0.278 |
Table 5.
Comparison of the baseline characteristics between the UST and VDZ patients before intensification (UST vs VDZ).
Table 5.
Comparison of the baseline characteristics between the UST and VDZ patients before intensification (UST vs VDZ).
| Variable |
Intensification UST N = 70 |
Intensification VDZ N = 41 |
P value |
| Age (years) mean (SD) | 47.1 (16) | 54 (16.7) | 0.03* |
|
Sex n (%) Male Female |
34 (48.6%) 36 (51.4%) |
15 (36.6%) 26 (63.4%) |
0.22 |
|
Smoking n (%) Smoker Never smoker Ex-smoker |
14 (20%) 43 (61.4%) 13 (18.6%) |
4 (9.8%) 32 (78%) 5 (12.2%) |
0.185 |
| Time of evolution years median (IR) | 6 (9) | 3 (12) | 0.17 |
| FC pre-intensification mcg/g median (IR) | 905 (799) | 772 (1113) | 0.993 |
|
CRP pre-intensification mg/dl median (IR) |
15 (27) | 13 (85) | 0.645 |
Disclaimer/Publisher’s Note: The statements, opinions and data contained in all publications are solely those of the individual author(s) and contributor(s) and not of MDPI and/or the editor(s). MDPI and/or the editor(s) disclaim responsibility for any injury to people or property resulting from any ideas, methods, instructions or products referred to in the content. |
© 2026 by the authors. Licensee MDPI, Basel, Switzerland. This article is an open access article distributed under the terms and conditions of the Creative Commons Attribution (CC BY) license (http://creativecommons.org/licenses/by/4.0/).
Copyright: This open access article is published under a Creative Commons CC BY 4.0 license, which permit the free download, distribution, and reuse, provided that the author and preprint are cited in any reuse.


