Submitted:
13 January 2026
Posted:
14 January 2026
You are already at the latest version
Abstract
The rapid advancement of deep learning technologies has markedly influenced numerous sectors, particularly agriculture. This survey paper presents an exhaustive review of contemporary trends, challenges, and future perspectives in the application of deep learning to agricultural tasks. By meticulously analyzing 95 research papers published in 2020, this review categorizes studies based on application areas, deep learning methodologies, data sources, targeted crops, and utilized frameworks. The findings highlight the predominance of Convolutional Neural Networks (CNNs) and Recurrent Neural Networks (RNNs), with Keras and TensorFlow emerging as the most frequently employed frameworks. Primary data sources include camera and satellite imagery. Key applications explored encompass plant disease detection, weather forecasting, crop yield prediction, and plant classification. Additionally, the paper underscores performance metrics and model accuracies, with disease detection models frequently surpassing 95% accuracy. Challenges such as data availability, model generalization, and computational costs are critically examined, alongside potential future directions for integrating emerging technologies to enhance agricultural productivity and sustainability. This survey aims to provide researchers and practitioners with a comprehensive understanding of the landscape of deep learning applications in agriculture, highlighting areas ripe for future research.
Keywords:
deep learning
; agriculture
; crop management
; disease detection
; yield prediction
Introduction
Agriculture, a cornerstone of human civilization, is undergoing a significant transformation driven by technological advancements. Among these innovations, deep learning—a subset of artificial intelligence—has emerged as a powerful tool with the potential to revolutionize agricultural practices. By leveraging deep learning techniques, it is possible to address critical challenges in agriculture, such as crop disease detection, yield prediction, and environmental monitoring, thereby enhancing productivity and sustainability. This survey paper aims to provide a comprehensive review of the current state of deep learning applications in agriculture. By analyzing 95 research papers published in 2020, we categorize and examine the methodologies, data sources, target crops, and frameworks employed in these studies. The paper also highlights the predominant use of Convolutional Neural Networks (CNNs) and Recurrent Neural Networks Acknowledgements (RNNs), as well as popular frameworks like Keras and TensorFlow. In addition to discussing key findings and performance metrics, we identify ongoing challenges and propose future research directions to further integrate deep learning technologies into agricultural practices. Through this survey, we aim to offer valuable insights for researchers and practitioners, guiding them in understanding the landscape and potential of deep learning in agriculture
The authors of the paper are [1] Roope Näsi, Eija Honkavaara, Päivi Lyytikäinen-Saarenmaa, Minna Blomqvist, Paula Litkey, Teemu Hakala, Niko Viljanen, Tuula Kantola, Topi Tanhuanpää, and Markus Holopainen. The paper was published in the Remote Sensing journal in 2015.
Methods Used:
UAV-Based Photogrammetry: Aerial images were captured using an octocopter UAV equipped with a stabilized camera mount and a Fabry–Pérot Interferometer (FPI) hyperspectral camera. A consumer-grade RGB camera was also used for high spatial resolution data.
Hyperspectral Imaging: The FPI hyperspectral camera collected data in the 500–900 nm wavelength range. The number of spectral bands was reduced to 22 after smile correction and band matching.
Geometric Processing: Agisoft PhotoScan Professional software was used for image orientation and dense image matching to create three-dimensional (3D) models.
Radiometric Processing: Laboratory calibration, spectral smile correction, dark signal corrections, and radiometric block adjustment were applied to transform digital numbers (DNs) to reflectance.
Individual Tree Detection: Watershed segmentation was used to delineate individual tree crowns from the canopy height models (CHMs).
Spectral Feature Extraction: A circular window with a 1 m diameter was used to calculate tree spectra, either by averaging all pixels or by averaging the six brightest pixels within the window.
Classification: A k-nearest neighbor classifier (k-NN) was used for supervised machine learning, with field observations used as a training set. Leave-one-out cross-validation was applied to assess classifier performance.
Accuracies and Formulas:
The accuracy of detecting individual trees was 74.7%.
The overall classification accuracy for three classes (healthy, infested, and dead) was 76%, with a Cohen’s kappa coefficient of 0.60.
The overall classification accuracy for two classes (healthy and dead) was 90%, with a Cohen’s kappa coefficient of 0.80.
Formulas:
- Empirical line method for reflectance to DN transformation:
- Bidirectional reflectance factor (BRF) model:
- Normalized channel ratios (indices) for vegetation indices:
where:
- DN is the digital number of the image.
- Refl is the reflectance.
- aabs and babs are the parameters for the empirical line model.
- Rjk is the bidirectional reflectance factor of the object point.
- θi and θr are the illumination and reflected light zenith angles.
- ϕi and ϕr are the azimuth angles.
- Φ is the relative azimuth angle.
- arelj is the relative correction parameter with respect to the reference image.
- R λ1 and R λ2 are the reflectance values of two bands with wavelengths λ1 and λ2
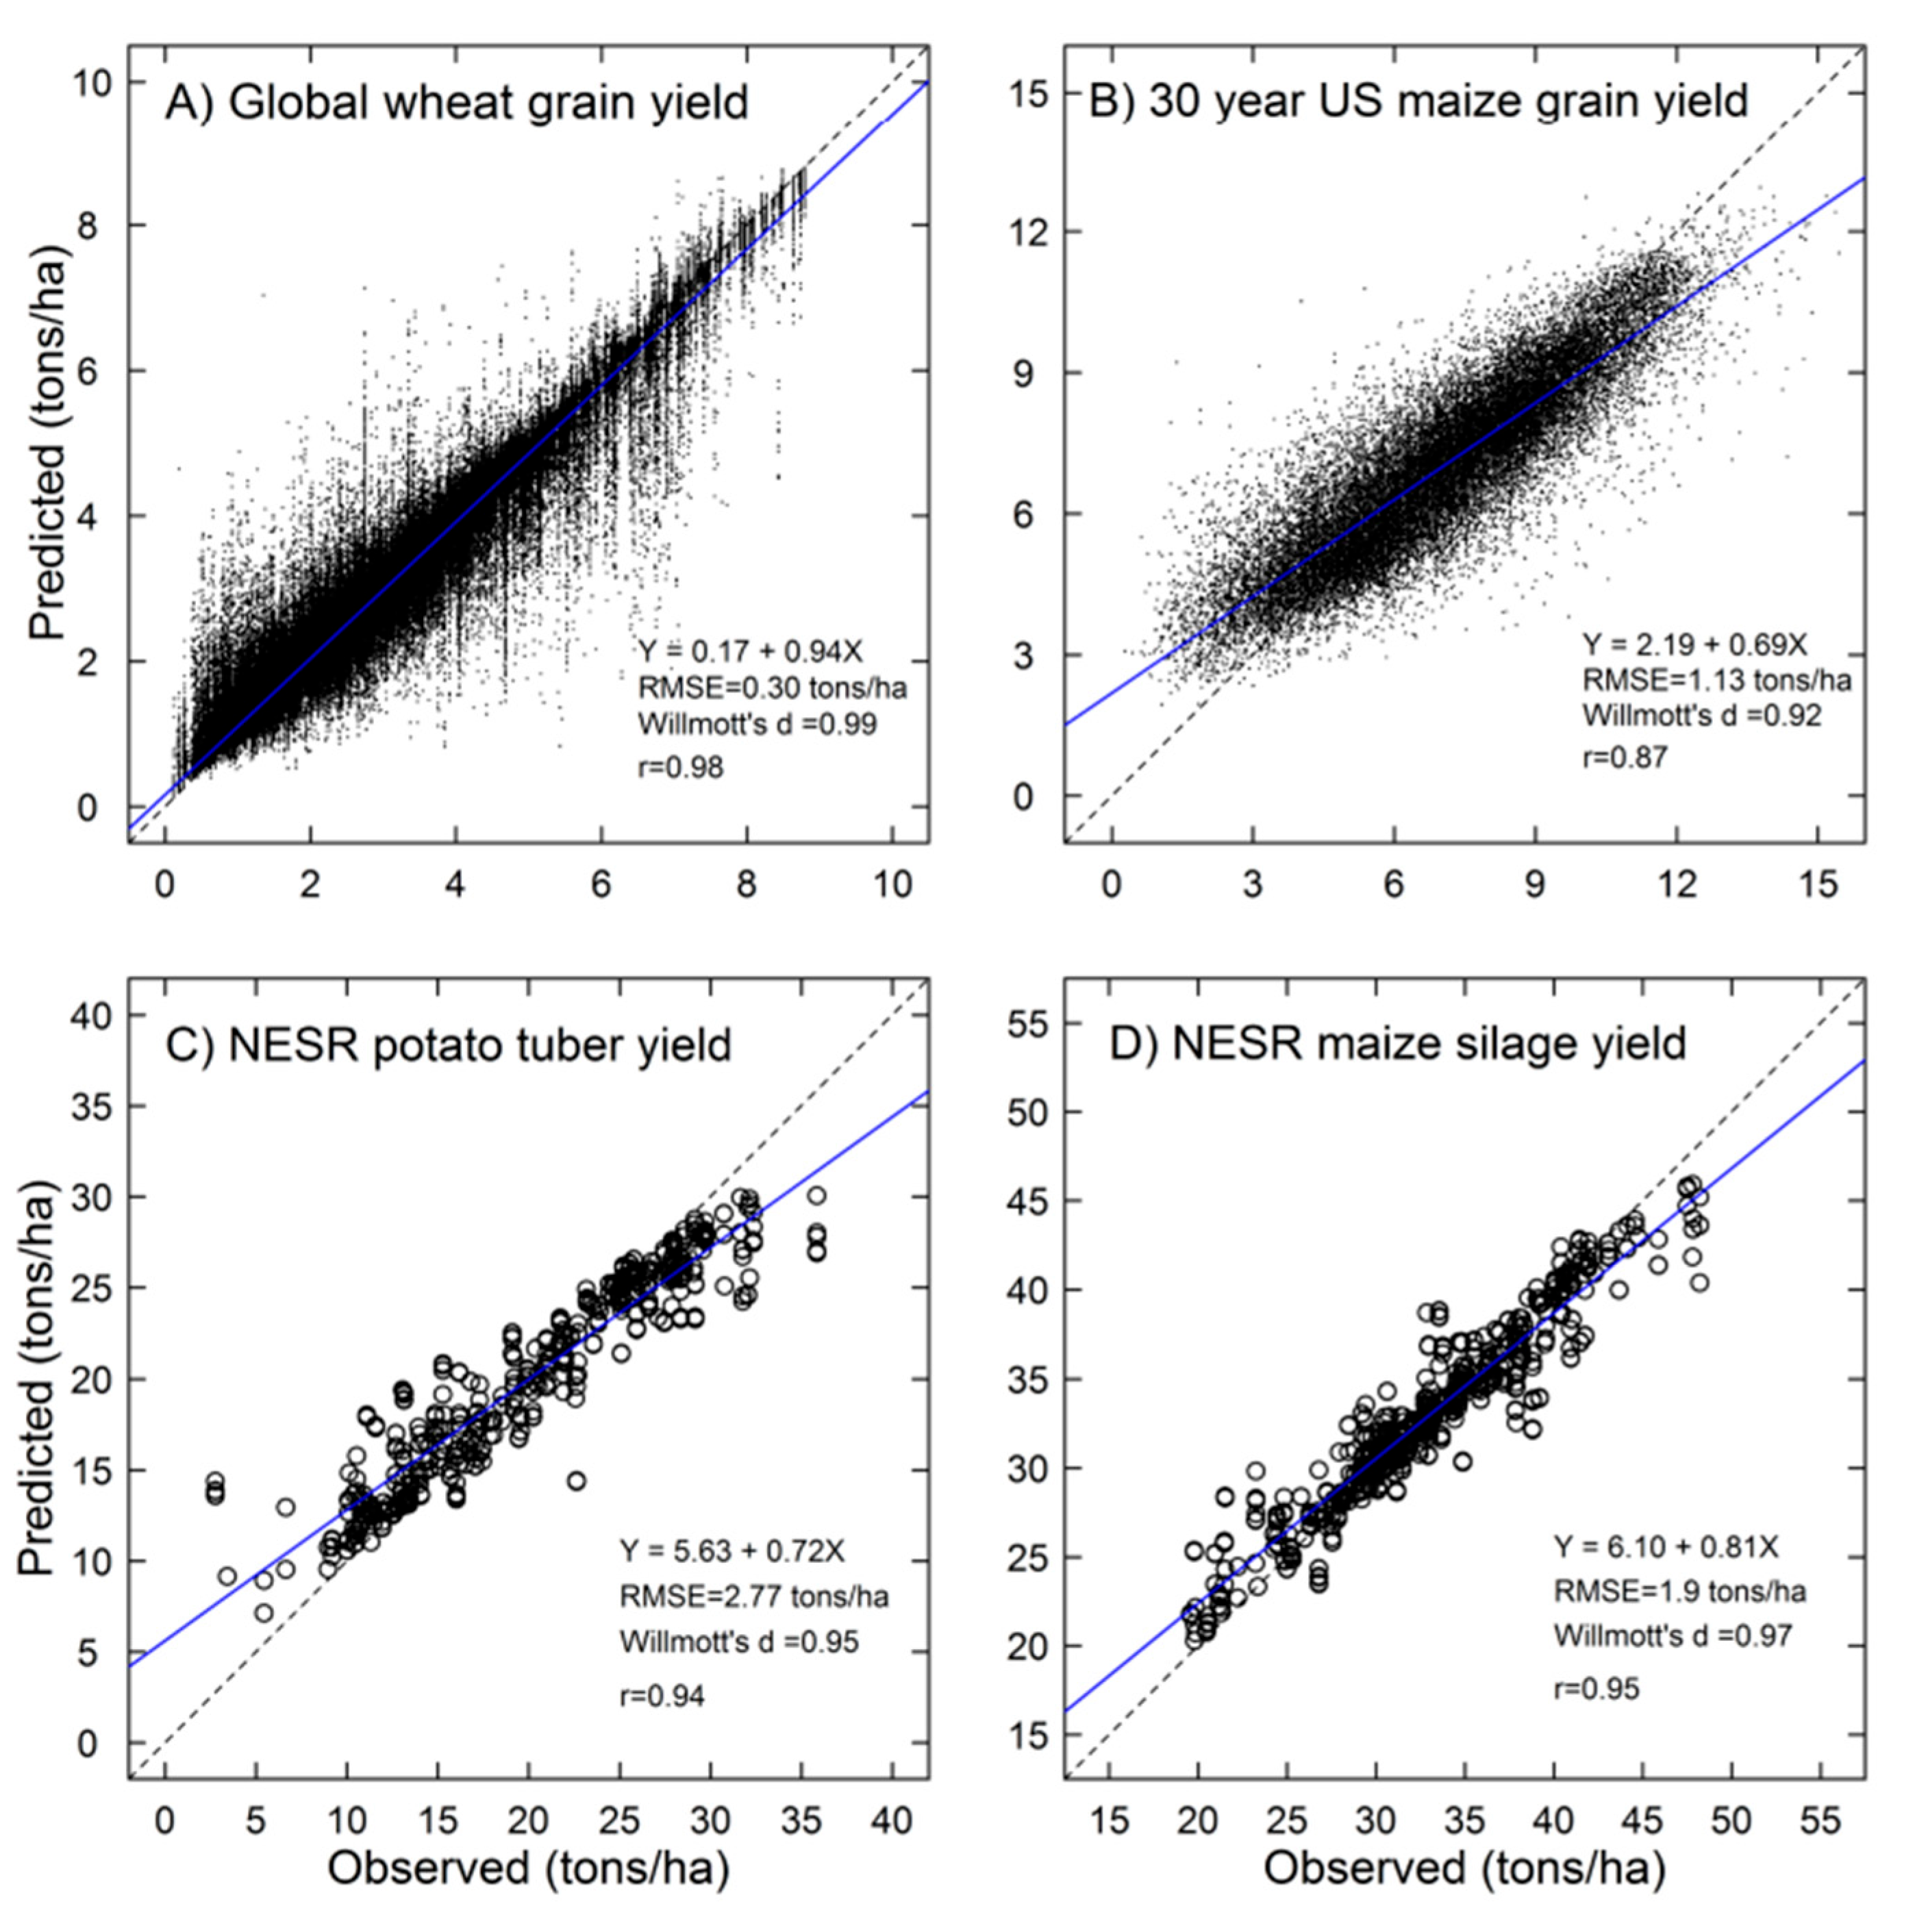
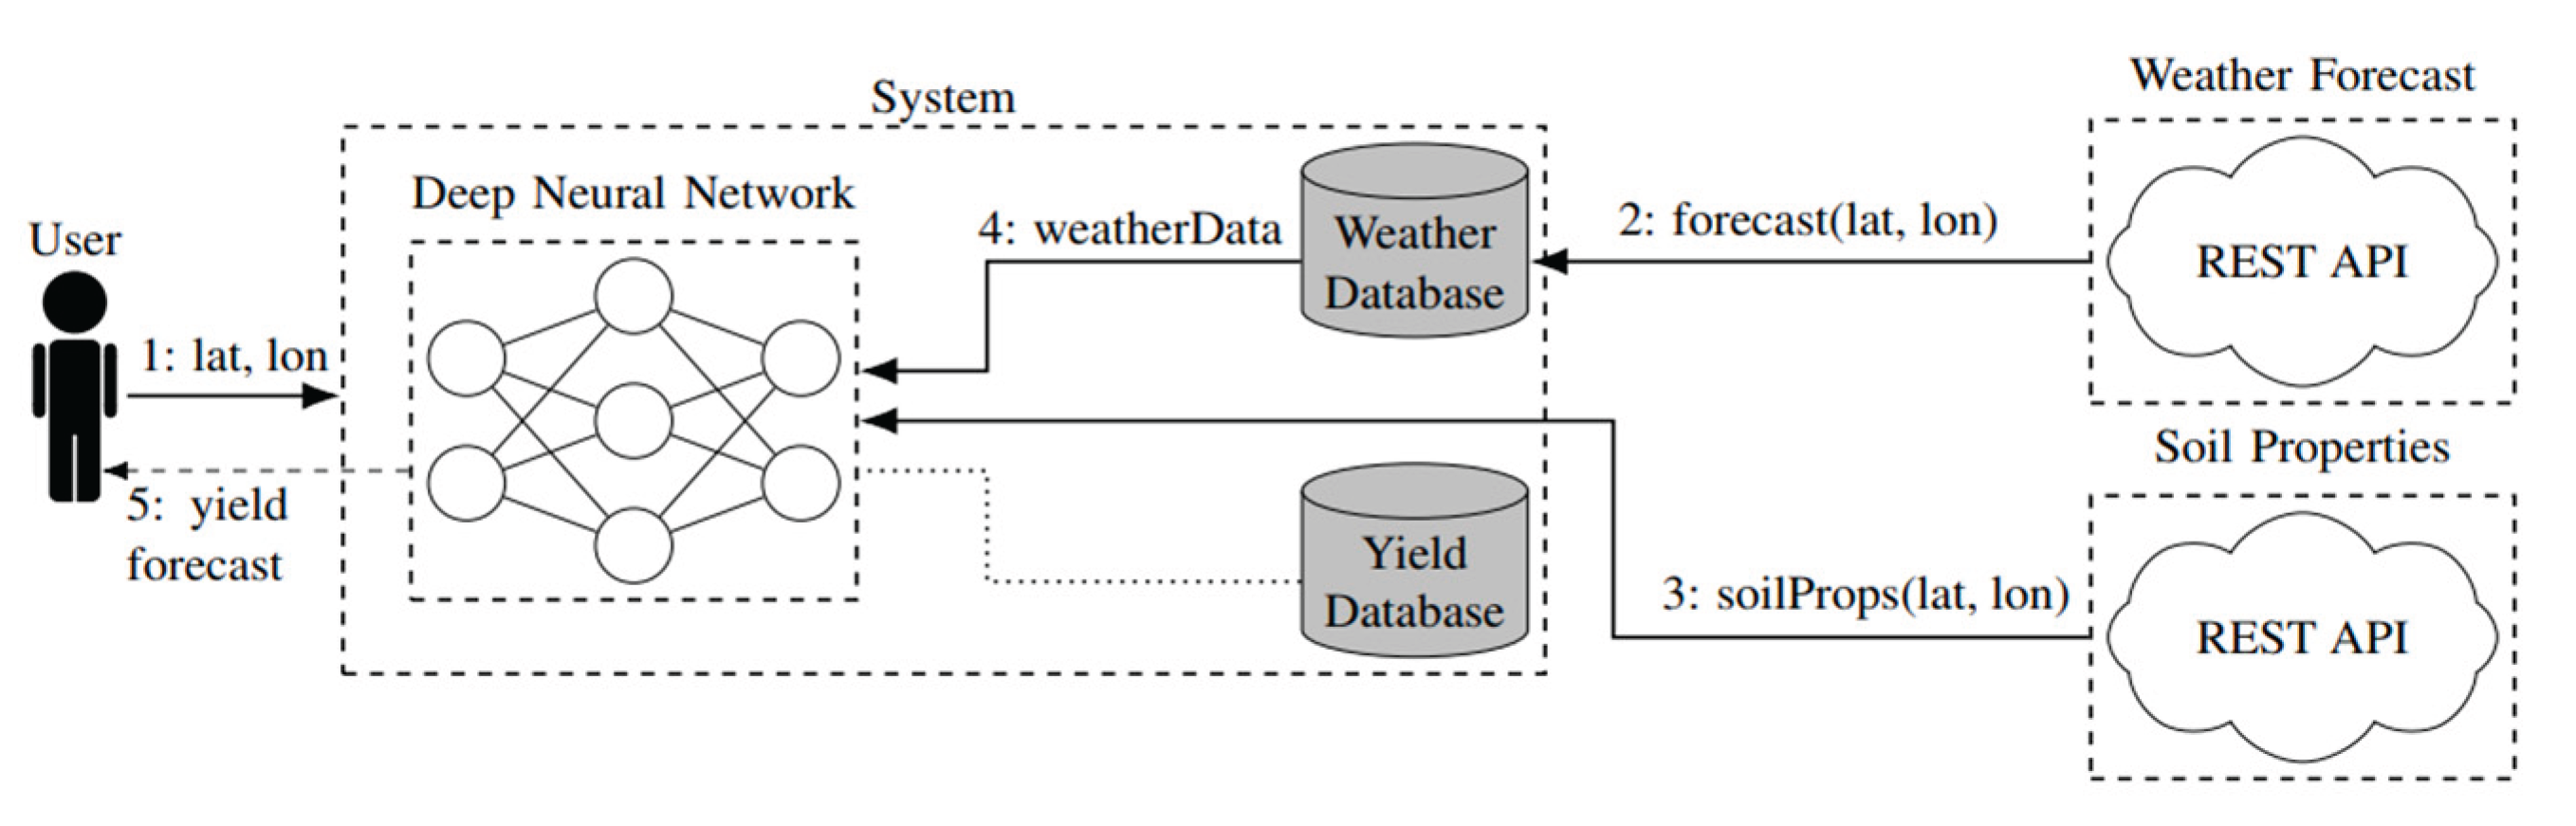
The document authored by [2] Jig HanJeong, Jonathan P. Resop, Nathaniel D. Mueller, David H. Fleisher, Yungdahm Yun, Ethan E. Butler, Dennis J. Timlin, Kyo-Moon Shim, James S. Gerber, and Vangimalla R. Reddy in 2016 presents a research article titled "Random Forests for Global and Regional Crop Yield Predictions." This study focuses on employing Random Forest (RF) models to predict crop yields, utilizing various biophysical variables such as climate, soil, photoperiod, water, and fertilization data. It compares these predictions with Multiple Linear Regression (MLR) models, evaluating model performance using root mean square error (RMSE), Nash-Sutcliffe model efficiency (EF), and Willmott’s d index of agreement.
The RF models demonstrated superior performance over MLR models across all crops and scales tested. Specifically, the RF model achieved a remarkable 96% explanation of yield variance for global wheat yield predictions, with a corresponding RMSE of 0.32 tons/ha. In contrast, the MLR model yielded a higher RMSE of 1.32 tons/ha for the same prediction. Similarly, for 30-year US maize grain yield predictions, the RF model exhibited an RMSE of 1.13 tons/ha and an EF of 0.76, whereas the MLR model resulted in a substantially higher RMSE of 4.54 tons/ha anda lower EF of 0.41.
Figure 1.
Yield Prediction Scatterplots.
Additionally, the study provides the formulas for the evaluation metrics used:

Table 1.
Variable Importance Summary.
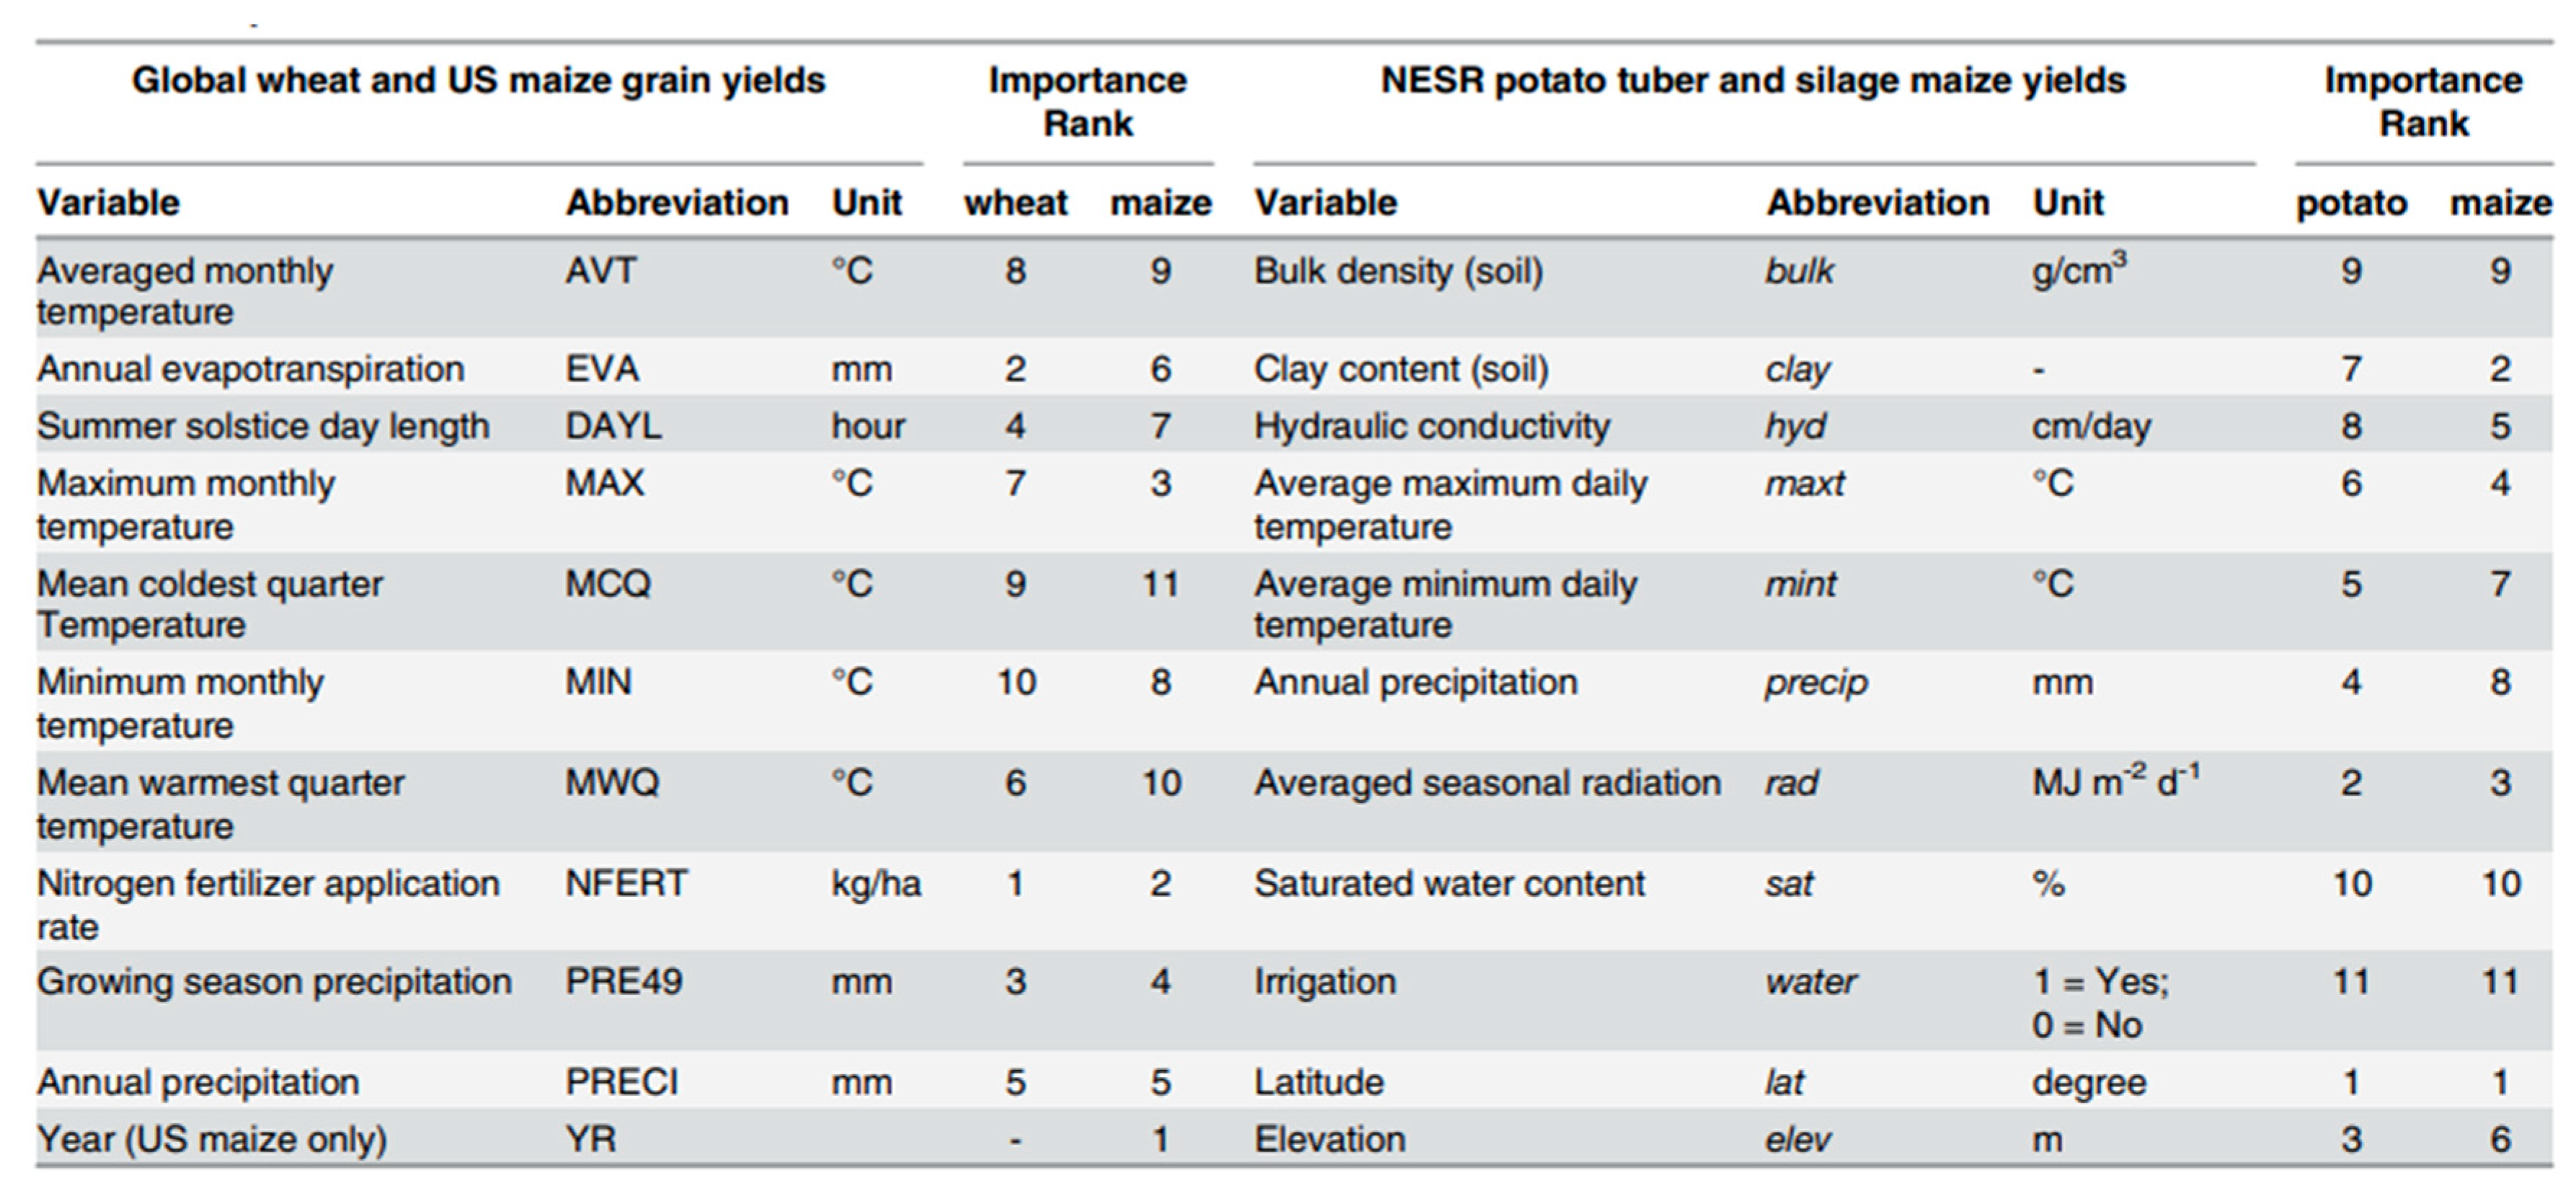
Figure 2.
DNN-Based Yield System.
The document authored by [3] Angela Lausch, Stefan Erasmi, Douglas. King, Paul Magdon, and Marco Heurich in 2017 offers a comprehensive review of remote sensing methodologies applied in understanding forest health. One of the discussed approaches is the individual tree method, which entails delineating trees, extracting parameters like height and species, and modeling biophysical attributes such as Diameter at Breast Height (DBH), volume, and biomass. This method aims to predict DBH, volume, and biomass for all delineated LiDAR trees. Additionally, the review delves into the area-based approach, a statistical method that correlates field plot measurements to LiDAR metrics, providing precision for various forest parameters including height, mean diameter, basal area, stem density, and above-ground biomass (AGB) estimations.
The review also examines the use of physical and empirical models for forest health assessment via remote sensing. Physical models conceptualize the canopy as geometric objects with known shapes and dimensions, while empirical models establish relationships between image and field data to spatially estimate biophysical attributes. The choice between these models depends on the application, with physical models preferred for global-scale quantitative modeling and empirical models for regional case studies.
Regarding accuracy, the review indicates that the individual tree approach can detect 80% to 97% of upper canopy trees and estimate various parameters like height, crown dimensions, DBH, volume, species, and health conditions. In contrast, the area-based approach offers precision rates of approximately 6% for height, 10% for mean diameter, 10% for basal area, 20% for stem density, and 12% for AGB estimations. The document also elucidates various methods and formulas employed in remote sensing for forest health assessment, encompassing spectral and spatial information analysis, regression techniques, and classification models such as kNN, CART, RF, and SVM.
Furthermore, the document discusses SAR-based empirical modeling approaches, which resemble optical data modeling, and physically-based models reliant on coherence-amplitude conversion of complex SAR signals. It discusses the significance of canopy reflectance (CR) models within radiative transfer (RT) modeling frameworks and emphasizes the importance of integrating diverse information sources for comprehensive forest health assessment.
The document provides a detailed overview of remote sensing methods and formulas crucial for understanding forest health, including individual tree and area-based approaches, spectral analysis, regression techniques, SAR-based modeling, and CR models. Additionally, it offers insights into accuracy rates and the challenges and opportunities associated with close-range remote sensing, multi-sensor approaches, and genotype-phenotype interactions in plant stress physiology, underscoring the importance of integrating in-situ and remote sensing data for robust forest health monitoring.
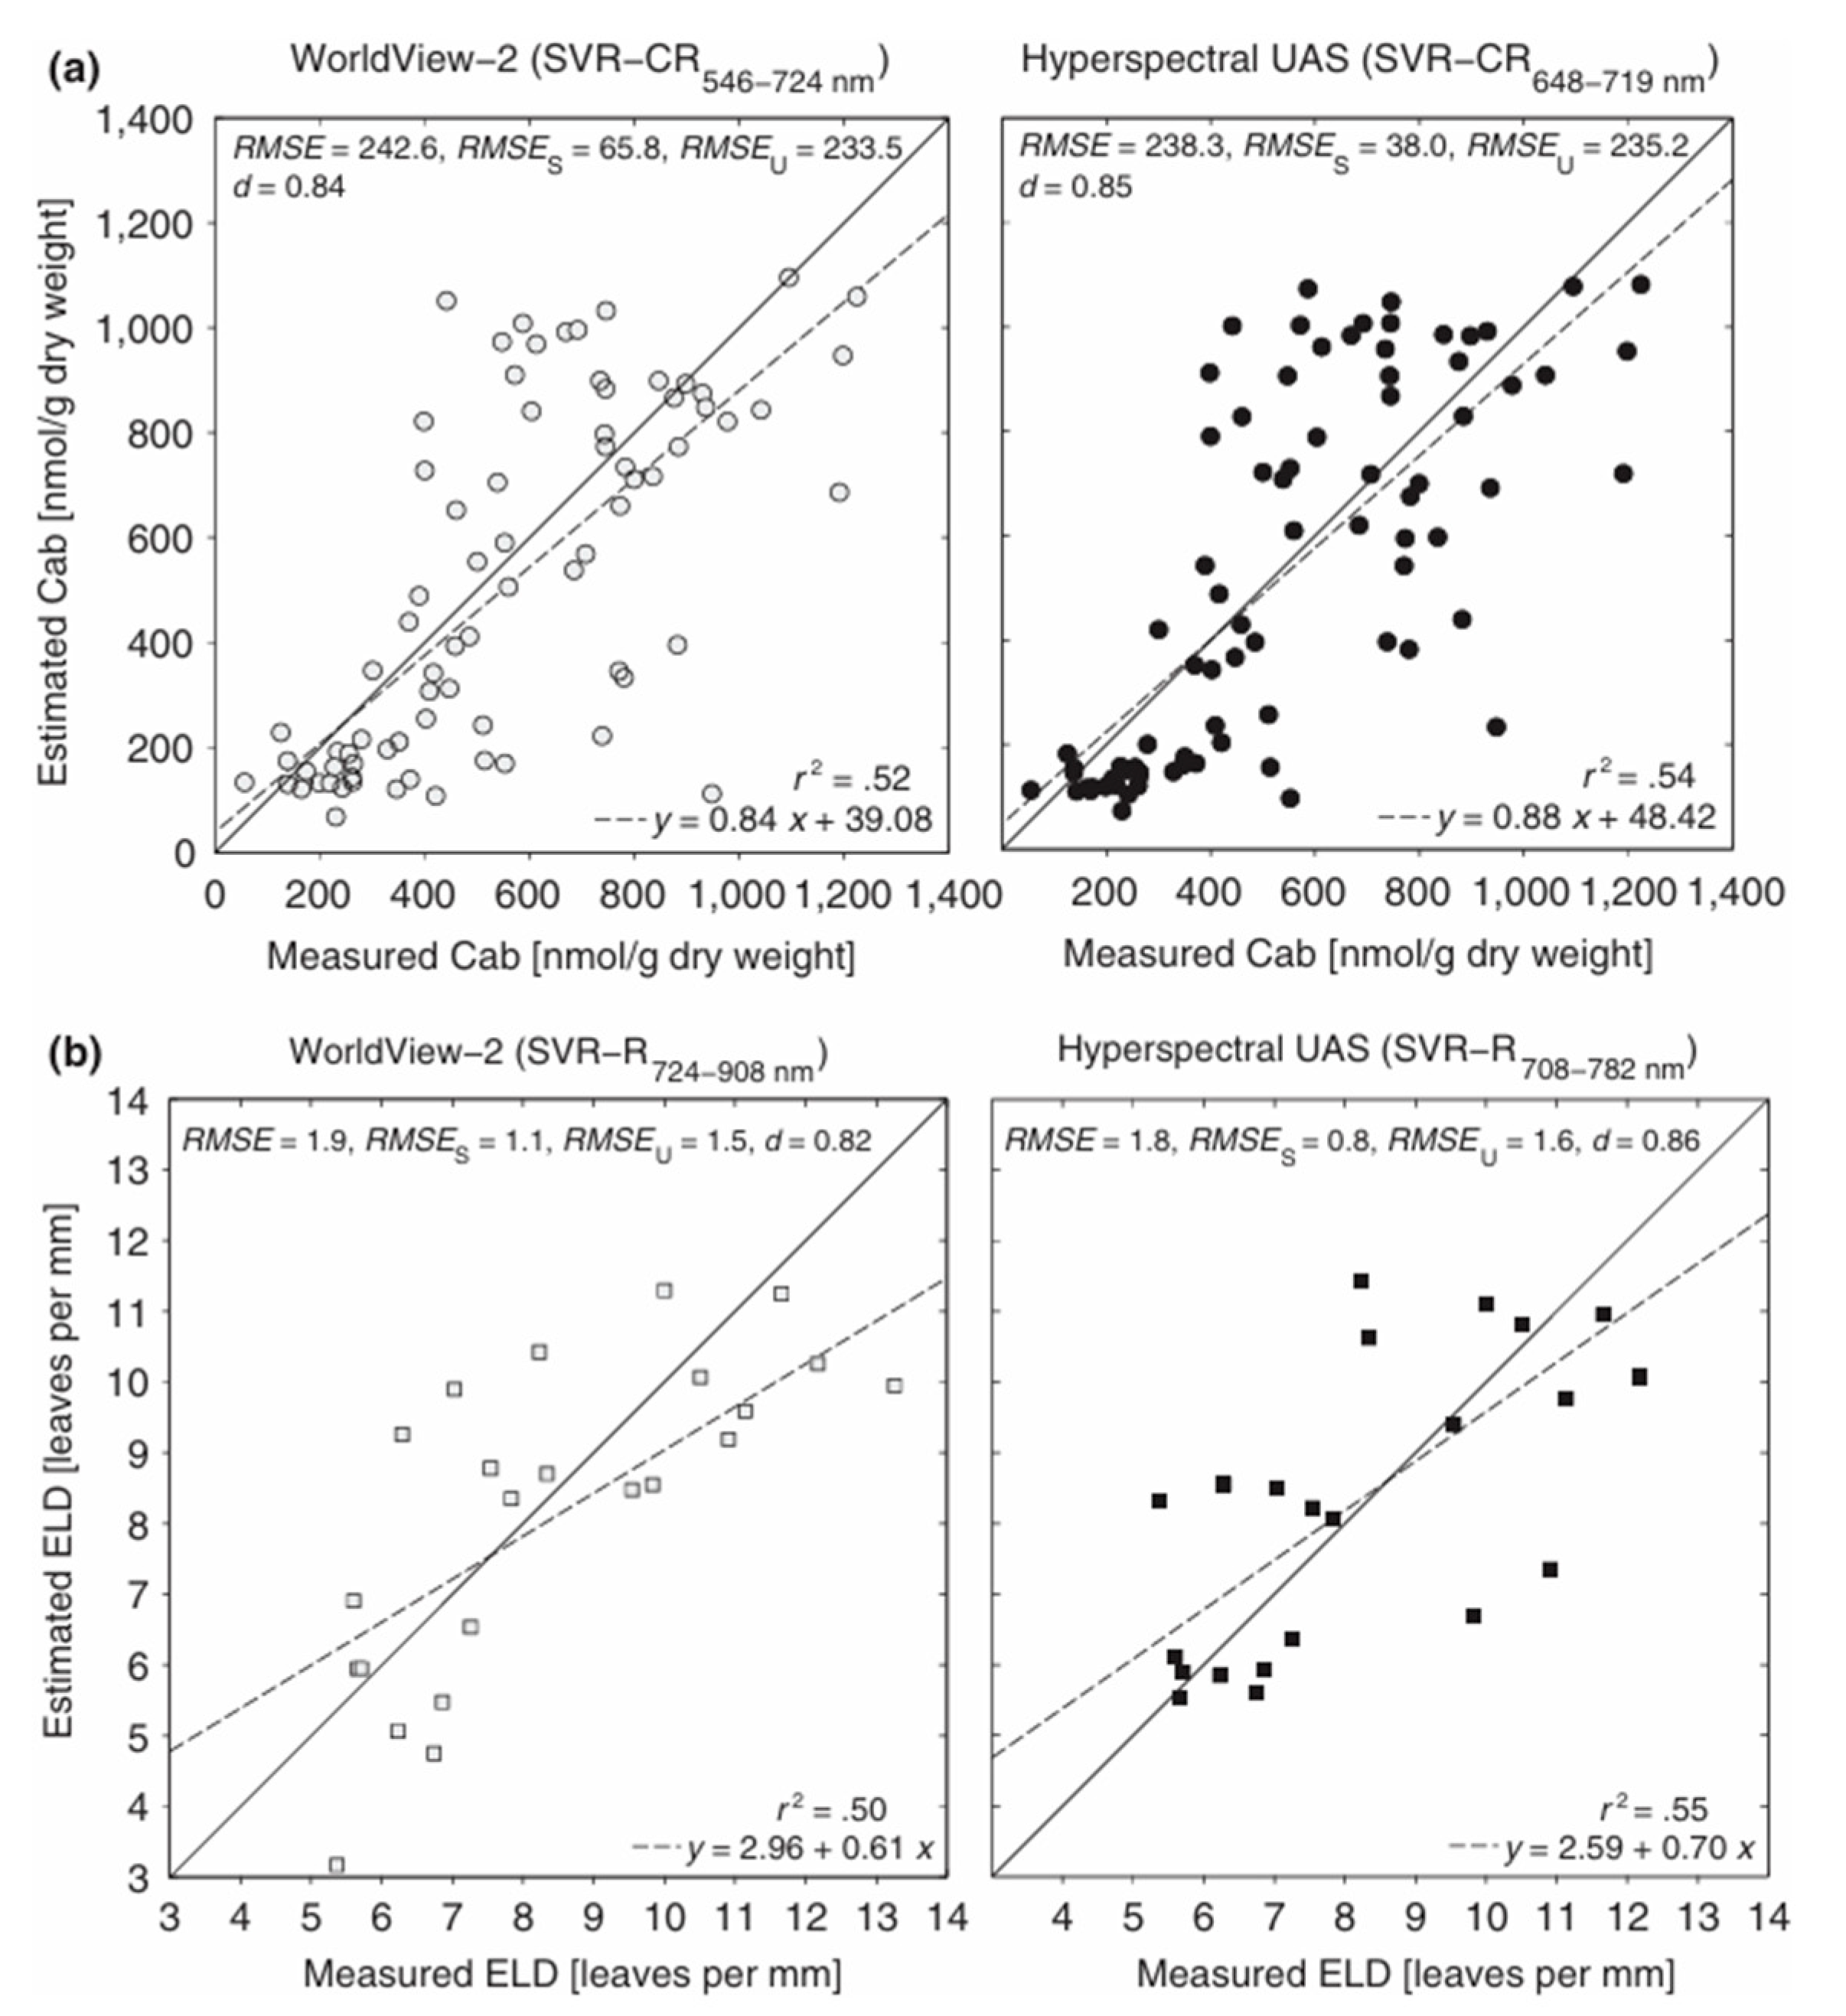
The research conducted by [4] Zbyněk Malenovský, Arko Lucieer, Diana H. King, Johanna D. Turnbull, and Sharon A. Robinson, published in 2017, explores the use of a low-altitude UAS equipped with hyperspectral imaging to capture sub-decimeter resolution images of Antarctic moss. The study utilizes machine-learning support vector regressions (SVR) to estimate moss vigor, focusing specifically on plant canopy chlorophyll content and leaf density. Additionally, the data obtained from the UAS is compared with high spatial resolution multispectral satellite data from WorldView-2.
To evaluate the accuracy of the methods used, the study employs metrics such as root mean square error (RMSE), systematic root mean square error (RMSES), unsystematic root mean square error (MSEU), and the index of agreement (d).
The findings reveal that the systematic RMSEs for chlorophyll content and leaf density are 3.5 to 6.0 and 1.3 to 2.0 times smaller, respectively, than the unsystematic errors. The median coefficient of determination (r²) for the regression between field measurements and SVR-estimated values is 0.50, with a p-value of 0.0072, indicating a statistically significant relationship.
Figure 4.
Estimation Accuracy Plots.
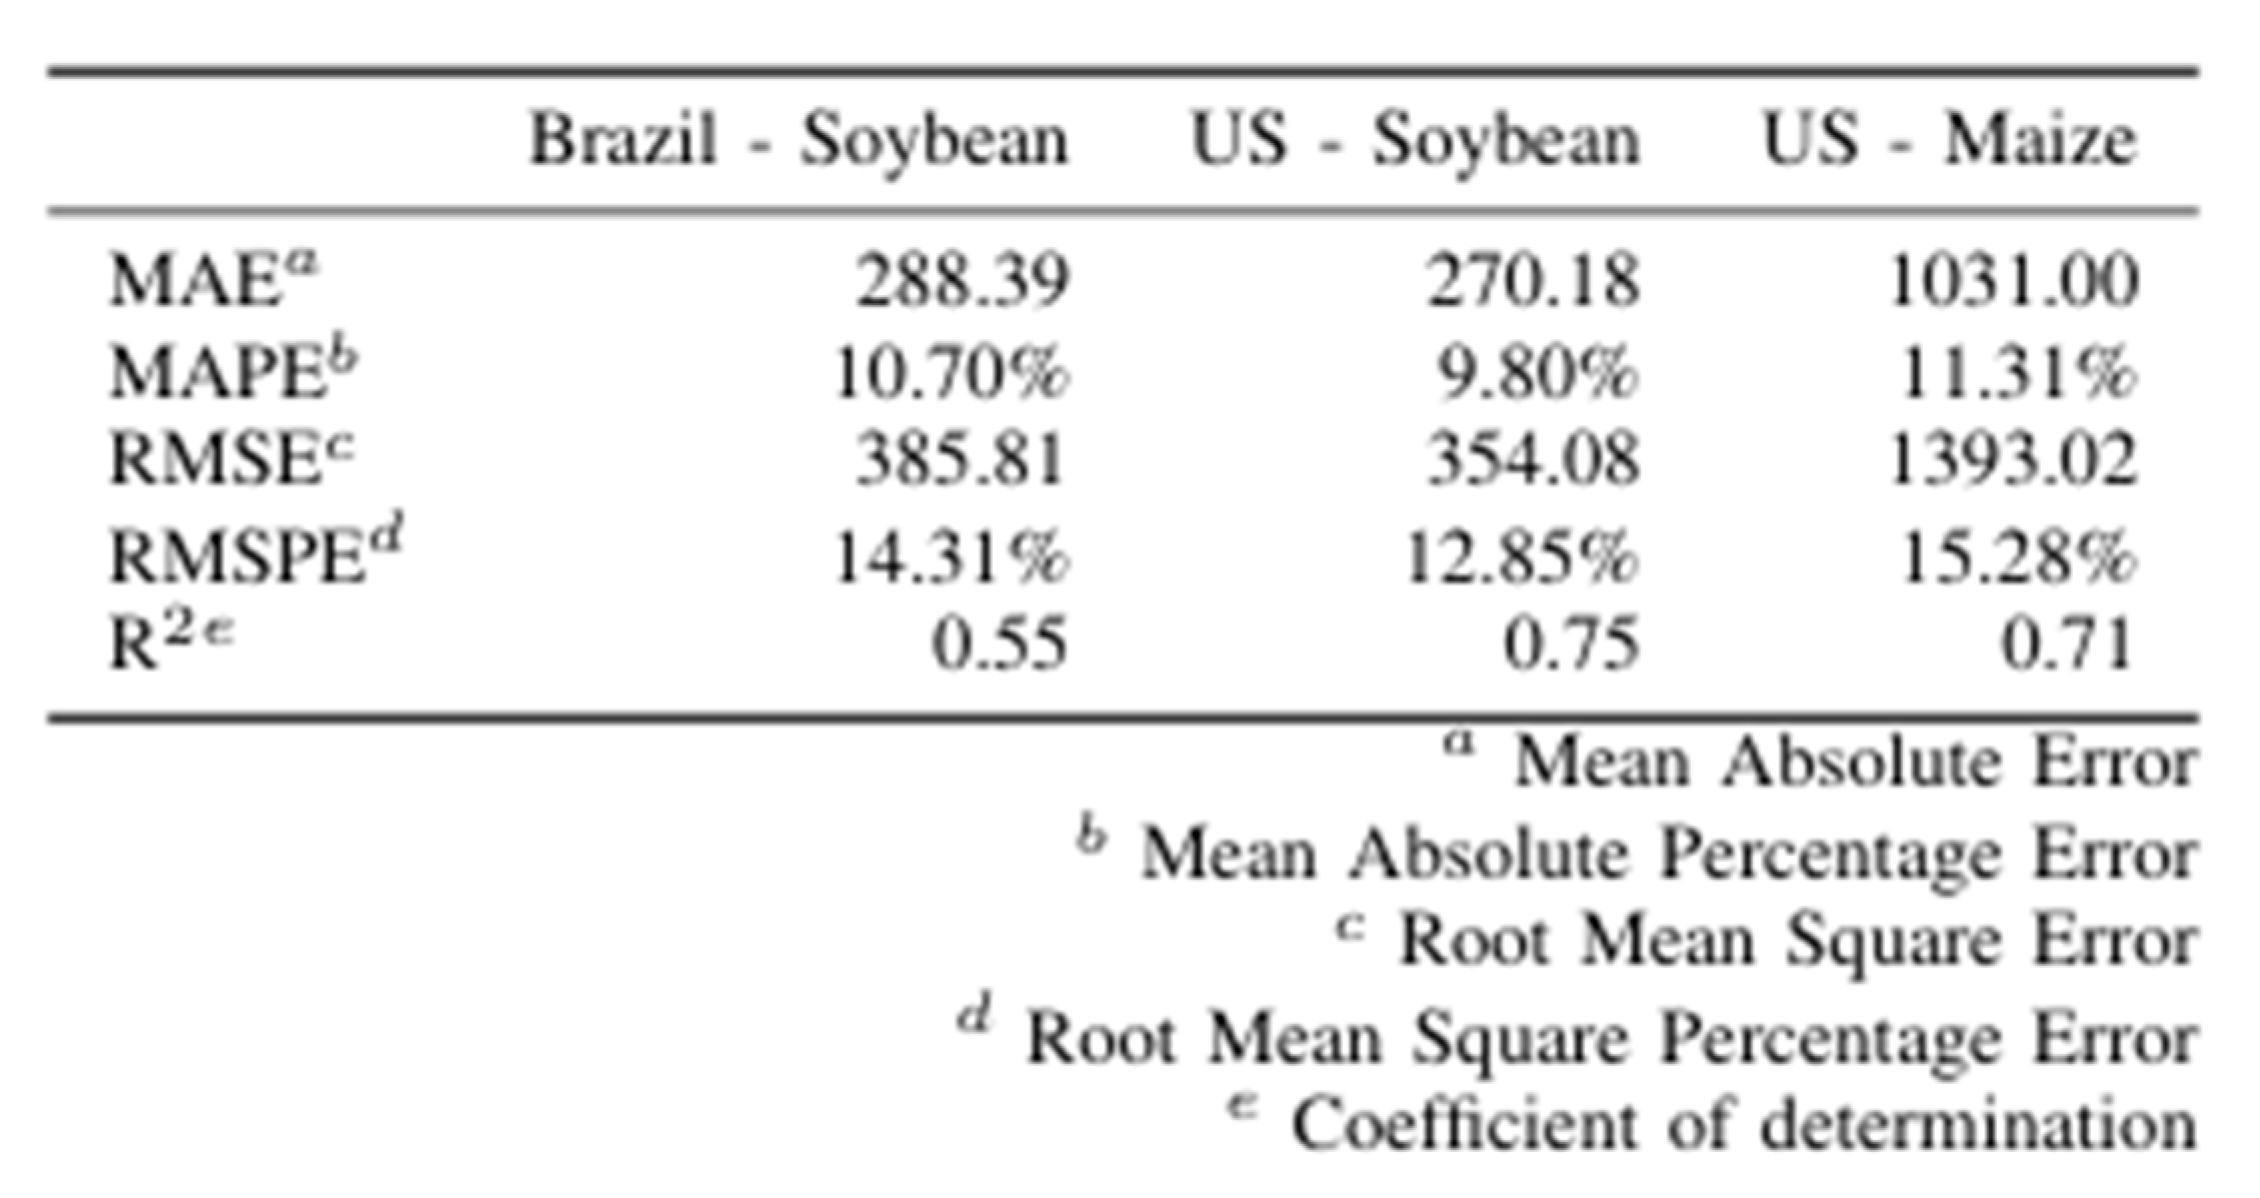
The research paper by [5] Igor Oliveira et al. (2018) introduces an innovative machine learning system for pre-season agriculture yield forecasting, emphasizing the use of recurrent neural networks (RNNs) trained with various features like precipitation, temperature, and soil properties. This system enables accurate forecasts with a seven-month lead time, eliminating the dependency on NDVI data.
The model architecture integrates fully-connected layers for static soil data and recurrent LSTM layers for dynamic meteorological data, facilitating precise yield predictions at the municipality level. The evaluation of the system’s performance highlights its effectiveness in generating accurate forecasts with reduced data requirements compared to conventional methods relying on remote sensing data.
Various metrics such as Mean Absolute Error (MAE), Mean Absolute Percentage Error (MAPE), Root Mean Square Error (RMSE), Root Mean Square Percentage Error (RMSPE), and Coefficient of Determination (R2) are employed to assess model accuracy, demonstrating competitive performance relative to existing solutions.
For the US soybean and maize models, the Mean Absolute Error (MAE) is utilized as the cost function, with scaled exponential linear units (SELUs) serving as the activation function. The SELU activation function is expressed as :
where α and λ are chosen to preserve the mean and variance of the inputs between consecutive layers.
selu(x) = λ * x if x > 0,
α * (e^x - α) if x ≤ 0,
The system’s scalability allows seamless adaptation across different regions, depending on the availability of local yield data. Reported accuracies, including MAE, MAPE, RMSE, RMSPE, and R2 for soybean yield forecasts in the US, underscore its potential impact on agricultural operations and farm management decisions.
Table 2.
Model Scores.
[6] Hasan et al published a paper in 2018 in the journal "Plant Methods," introducing a novel approach for spike detection in wheat images captured in field conditions. The study employs a Faster R-CNN (Region-based Convolutional Neural Network) methodology for spike detection, offering advancements in precision agriculture. Additionally, the authors introduce the SPIKE dataset, comprising high-quality in-field images, facilitating model training and evaluation.
The evaluation metrics utilized in the study include mean Average Precision (mAP) and detection accuracy, which are crucial for assessing model performance. The mAP quantifies precision across varying levels of recall, providing insights into the model’s robustness. The formula for mAP is:
where:
- P(ri) is the measured Precision at Recall ri
- ri is the recall level
Figure 5.
Spike Detection Pipeline.
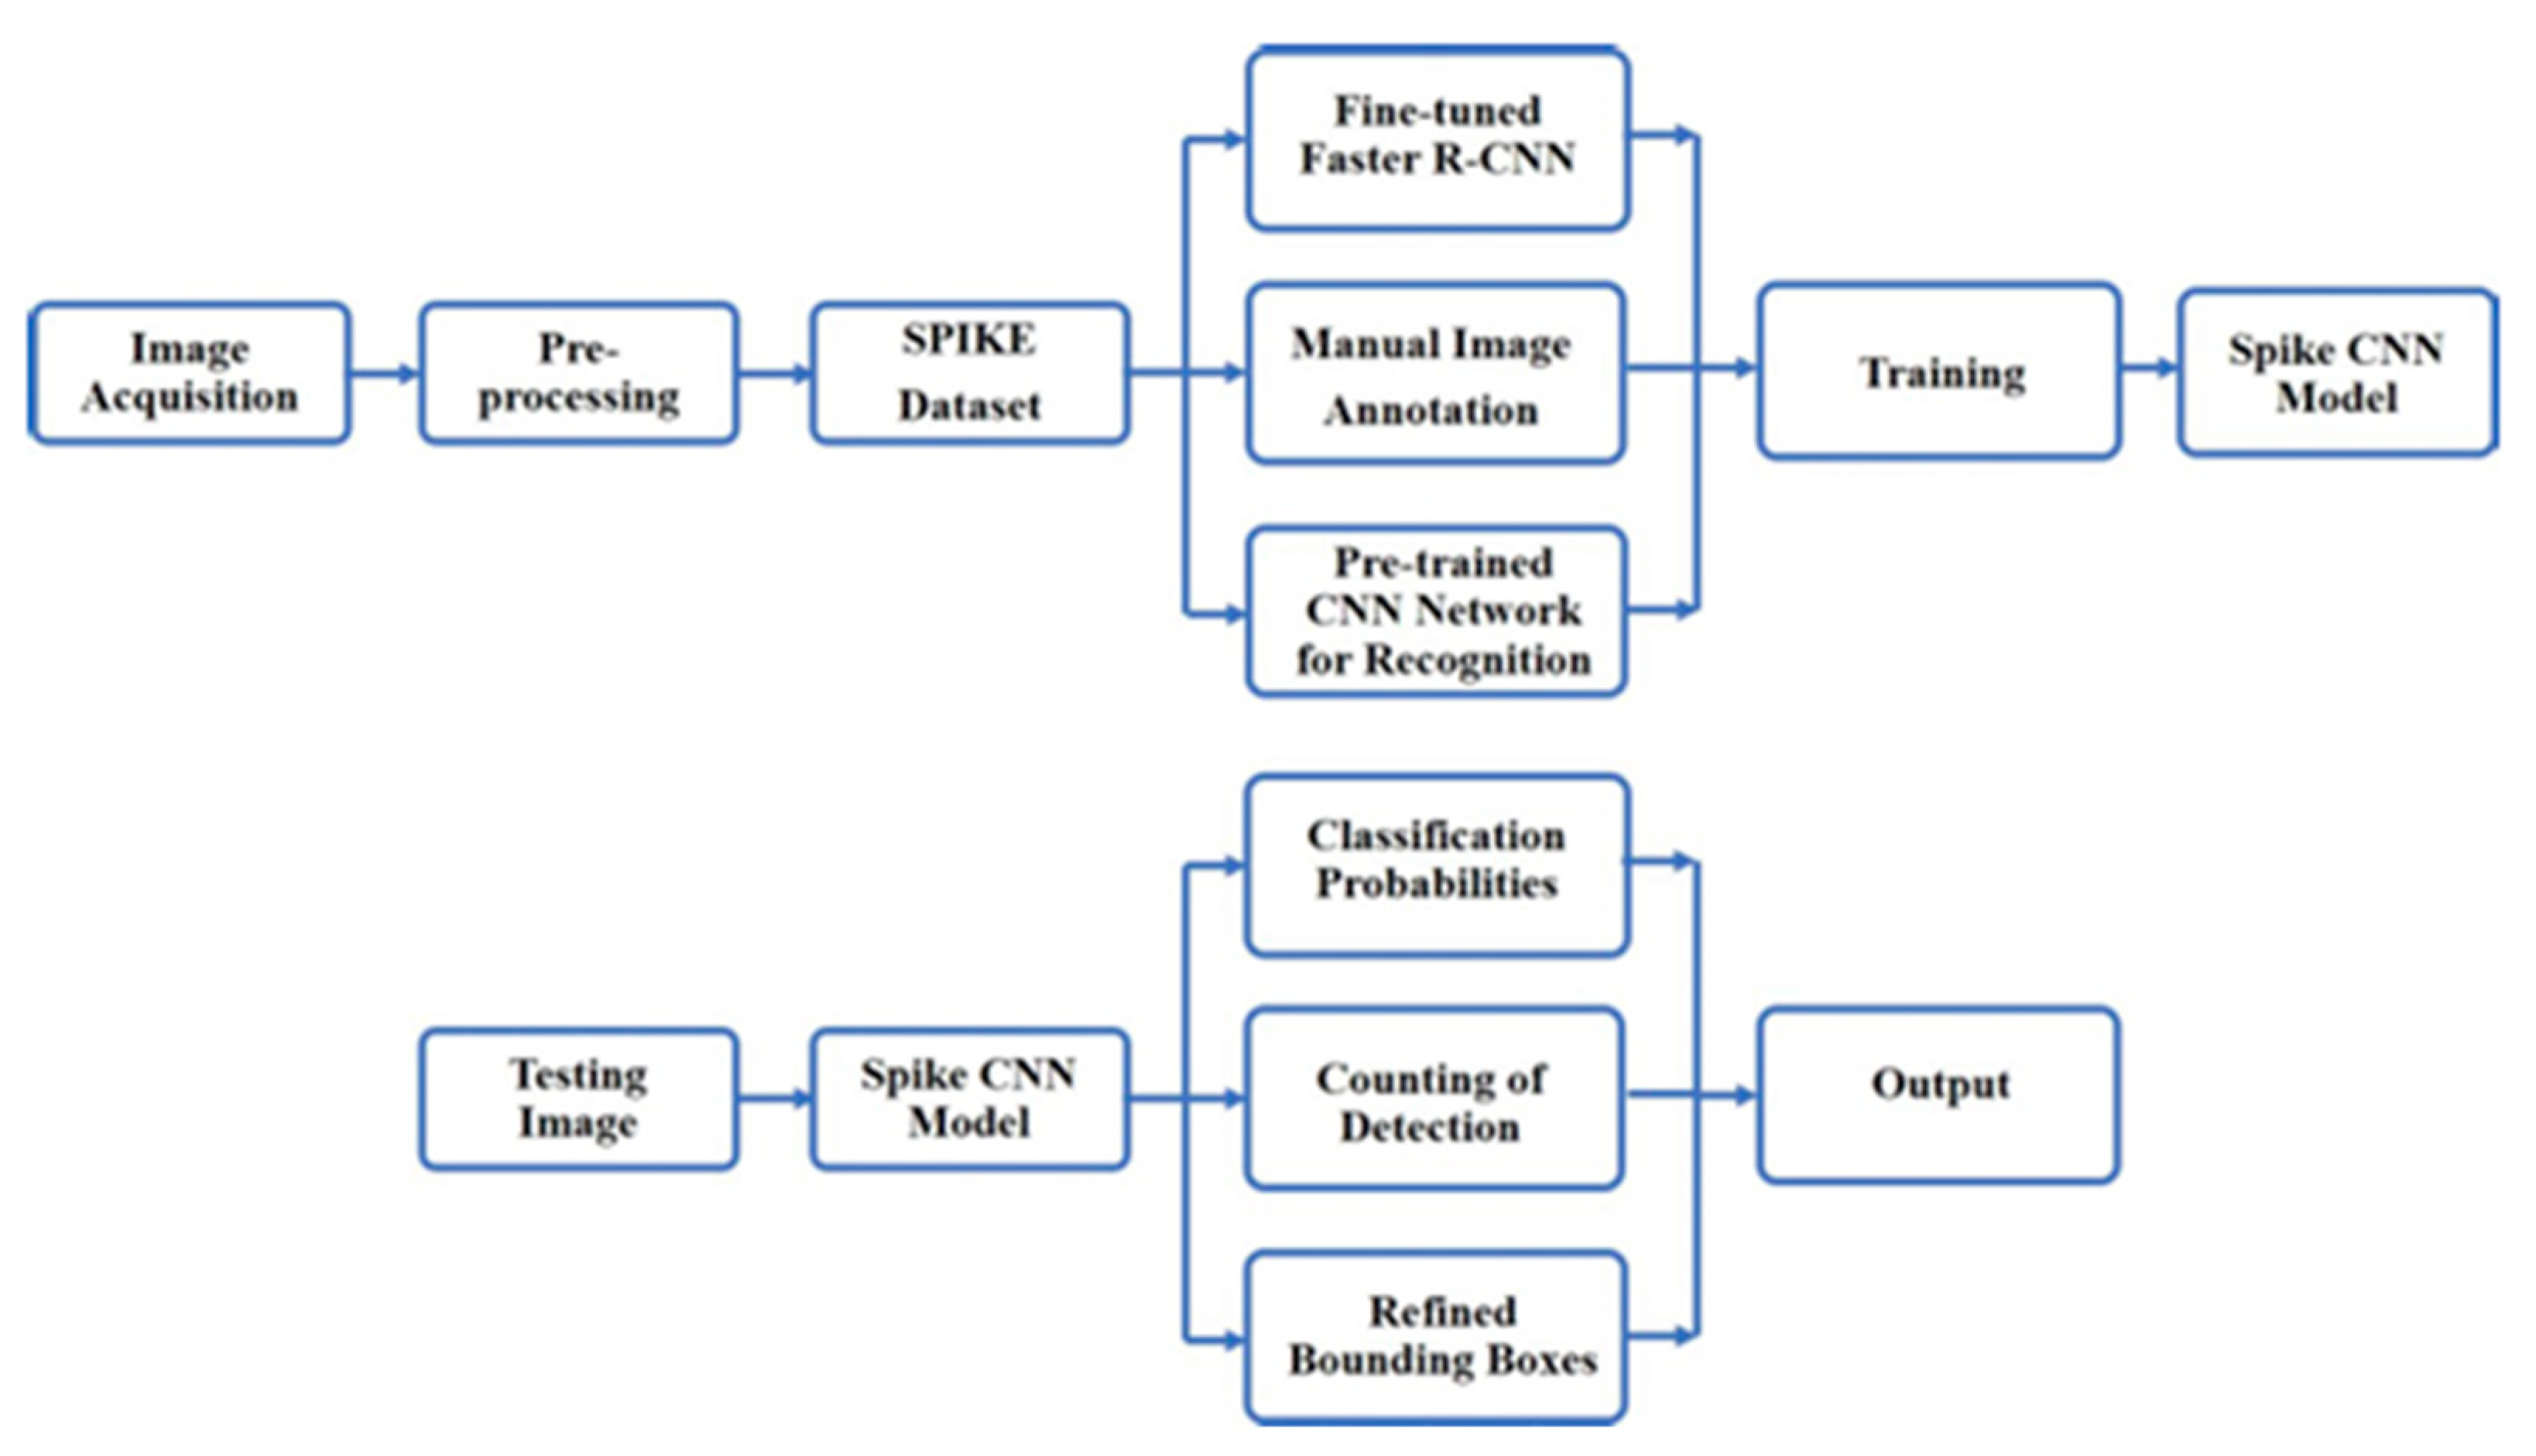
This formula enables the assessment of the model’s performance across various recall levels, offering valuable insights into its precision and reliability. On testing with 20 images, the study reports an average accuracy of 93.3% and a mAP of 0.6653.
In their 2018 publication, [7] Nanyang Zhu and colleagues present a comprehensive review of deep learning (DL) applications in smart agriculture, detailing the methods, formulas, and accuracies achieved by various studies in the field. The authors discuss three primary DL algorithms: Convolutional Neural Networks (CNNs), Recurrent Neural Networks (RNNs), and Generative Adversarial Networks (GANs), each with its own set of complex formulas integral to their functioning. These formulas are used to calculate neuron outputs, error functions, and optimization processes necessary for network training.
CNNs, renowned for their capabilities in image processing, have been applied to tasks like plant disease detection, achieving accuracies up to 96.3% after fine-tuning. Another study highlighted in the review combined CNNs with K-means feature learning for weed identification, resulting in an accuracy of 92.89%. RNNs, particularly effective for time series analysis, have been utilized for weather prediction and soil moisture estimation. One study cited an RNN model that predicted the locations of elephant herds with minimal errors, demonstrating the potential of RNNs in tracking and predicting animal behavior.
Although GANs are less commonly used in agriculture, they have shown promise in image processing applications. A GAN-based model was employed to enhance the realism of synthetic agricultural images, although specific accuracy metrics for this application were not provided.
The publication also includes a meta-analysis of DL applications in smart agriculture, revealing a significant increase in research output and highlighting the interdisciplinary nature of DL studies in agriculture. These studies span fields such as computer science, plant science, chemistry, and economics. The authors emphasize the potential of DL to transform agriculture by improving data analysis and research, ultimately facilitating the effective application of DL techniques in the field.
The document authored by [8] Max Gerhards, Martin Schlerf, Kaniska Mallick, and Thomas Udelhoven, published on May 24, 2019, examines various techniques used in the detection of crop water stress via remote sensing, with a particular focus on multi-/hyperspectral thermal infrared (TIR) remote sensing methods. These techniques include:
Temperature-Based Indices:
Temperature-based indices such as Stress Degree Day (SDD), Crop Water Stress Index (CWSI), and Water Deficit Index (WDI) are used to quantitatively estimate plant water stress by normalizing leaf temperatures to actual environmental conditions. The formulas for SDD and CWSI are as follows:
SDD:
Where Tc is the canopy temperature and Tair is air temperature
CWSI:
Where Tc is the canopy temperature, Twet is the wet reference temperature, and Tdry is the dry reference temperature.
Physically-Based Modeling of Evapotranspiration (ET):
This method provides an alternative approach for detecting plant responses to water deficit and understanding the interaction between plants and their environment under stress conditions. It involves estimating ET as a residual of the surface energy balance or through partitioning the net available energy. Although the document discusses the challenges of this method, it does not provide a specific formula.
Use of Artificial Reference Surfaces:
This technique allows for the simultaneous measurement of reference and leaf temperature, which helps to overcome the limitations of CWSI in humid climates. Challenges associated with this method include the choice of material and its handling, particularly at airborne and satellite scales.
Non-Parametric and Calibration-Free ET Estimation Approach:
The STIC model is highlighted as a method for simultaneously estimating ET, H, gA, and canopy-surface conductance from the data itself. This model addresses some of the major challenges of current thermal ET algorithms. The specific formula for this method is not provided in the document.
These methods are essential for understanding plant responses to water deficit, thereby informing irrigation management and water resource management in both ecological and agricultural contexts.
The paper authored by [9] Apollo Kaneko, Thomas Kennedy, Lantao Mei, Christina Sintek, Marshall Burke, Stefano Ermon, and David Lobell, published in 2019, delves into predicting maize yields in six African countries at the district level, utilizing deep learning methodologies applied to satellite imagery data.
The authors emphasize the critical importance of accurately predicting crop yields, particularly in regions like Africa facing persistent food security challenges. To tackle these challenges, they rely on remote sensing data, specifically satellite images from the MODIS collection, as the primary input for training deep learning models.
The study investigates the effectiveness of Long Short-Term Memory (LSTM) models and Gaussian Processing for predicting crop yields. Additionally, the authors explore transfer learning to enhance prediction accuracy in regions with limited training data. They stress the importance of incorporating temporal spatial features to improve the precision of yield predictions, providing valuable insights for enhancing agricultural monitoring and addressing food security concerns, especially in developing countries like those in Africa.
In addition to discussing methodologies, the document includes several crucial formulas used in the modeling and prediction processes:
Gaussian Process Formula:
Kernel Function Formula:
Figure 6.
LSTM Model Structure.
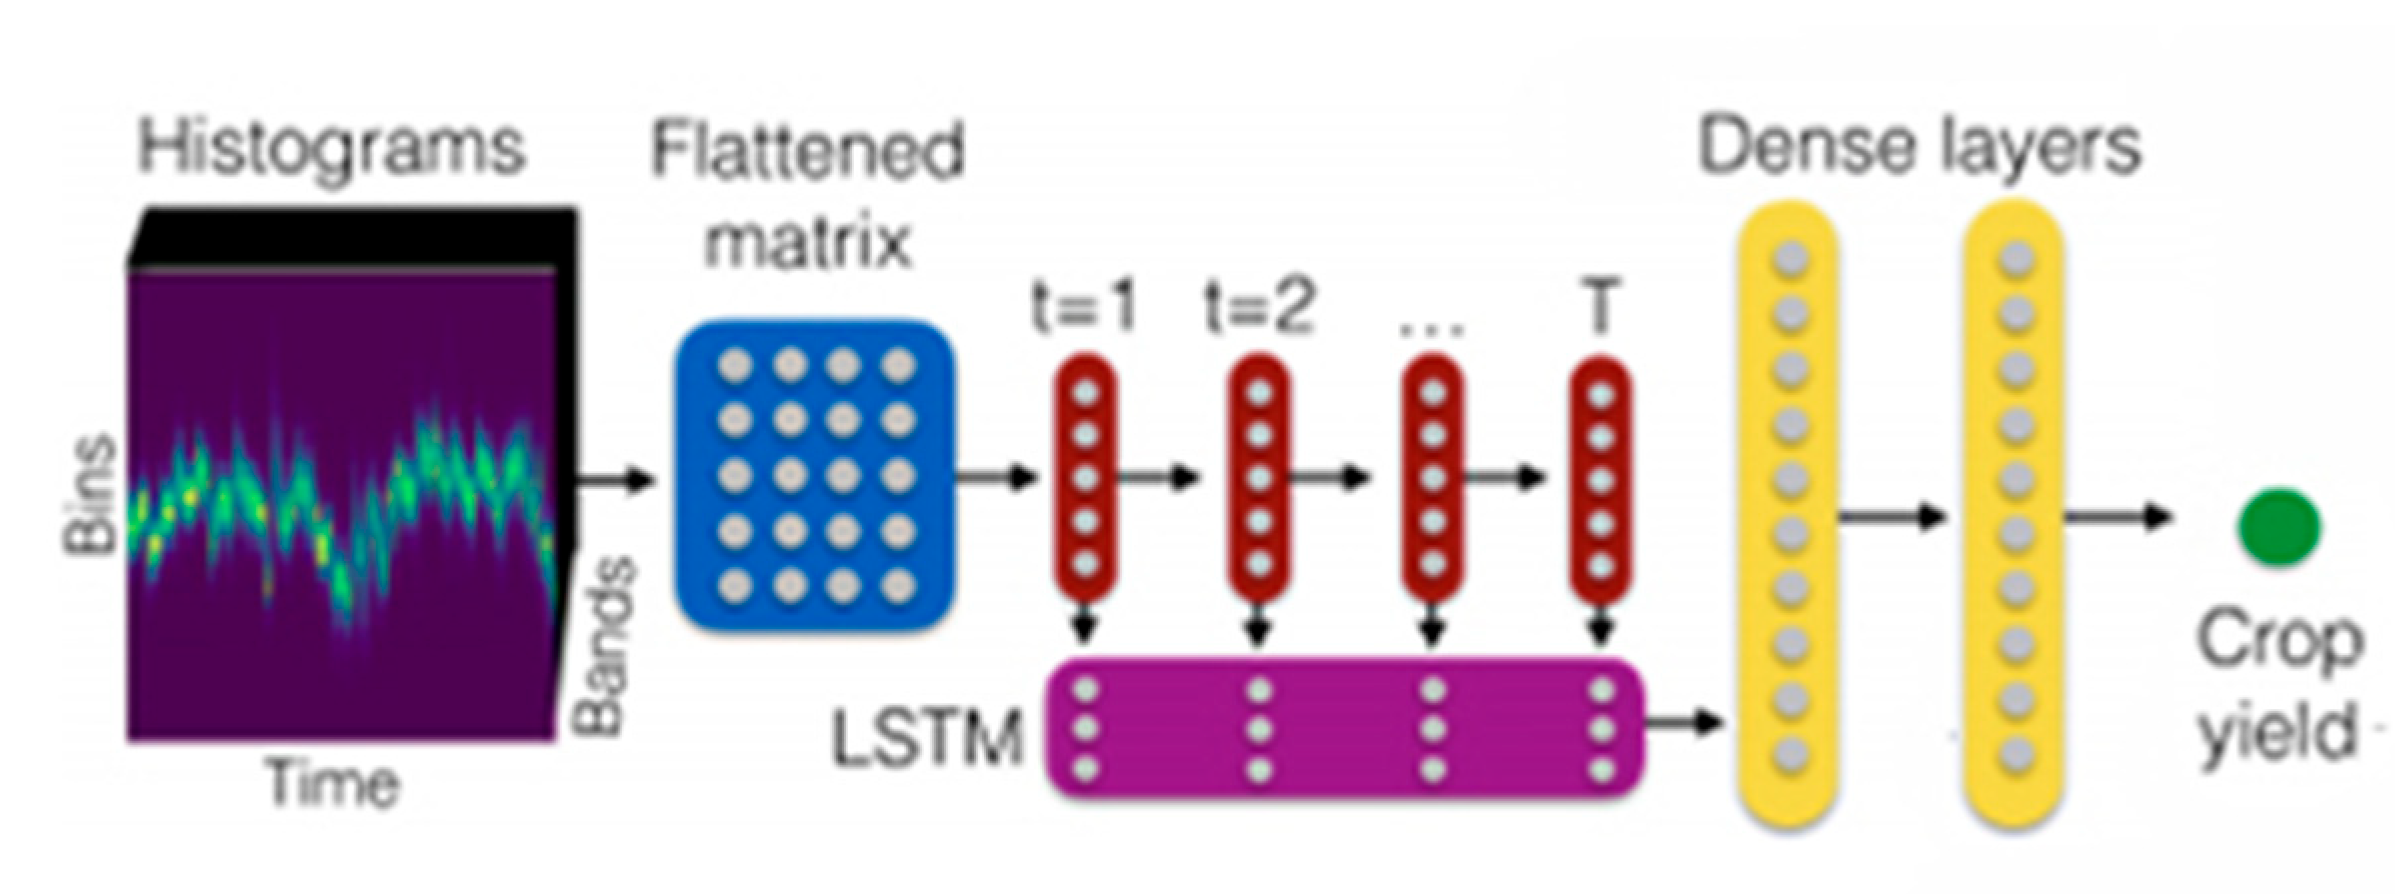
The LSTM Model Structure involves feeding a flattened 3D histogram into an LSTM network, followed by dense layers for prediction.
Regarding accuracy, the models exhibit varying levels of performance across the six African countries, with average R2 values ranging from -0.60 to 0.56. Despite this variability, the LSTM model with Gaussian Processing demonstrates competitive performance in predicting maize yields at the district level, indicating promising prospects for utilizing deep learning techniques in agricultural forecasting and addressing food security challenges in Africa.
The research paper by [10] Jie Sun, Liping Di, Ziheng Sun, Yonglin Shen, and Zulong Lai, published in the journal Sensors in 2019, introduces an innovative approach for predicting soybean yields at the county-level in the United States through the application of a deep CNN-LSTM model. The study underscores the increasing importance of remote sensing data integrated with machine learning techniques, particularly Deep Learning (DL), including Convolutional Neural Network (CNN) and Long Short-Term Memory (LSTM), in agriculture.
The proposed model is designed to predict both end-of-season and in-season soybean yields by leveraging a combination of crop growth and environmental variables, including weather data, MODIS Land Surface Temperature (LST) data, and MODIS Surface Reflectance (SR) data, with historical soybean yield data serving as labels.
Model performance is evaluated using various metrics such as Root-Mean-Squared Error (RMSE), Percent Error (PE), and R2 between observed and predicted yield values. Additionally, a feature importance analysis highlights the significance of MODIS surface reflectance in soybean yield prediction compared to other environmental features.
The formulas utilized for calculating RMSE and PE are:
The study demonstrates the effectiveness of the deep CNN-LSTM model, achieving notable accuracy with an average RMSE of 329.53 for end-of-season yield prediction and RMSE of 353.74 for early prediction on August 21st. These accuracies are comparable to end-of-season results and are obtained well ahead of the USDA issue date.
The paper authored by [11] Haowei Mu, Liang Zhou, Xuewei Dang, and Bo Yuan, published in August 2019, focuses on utilizing Convolutional Neural Networks (CNN) to extract pertinent features of winter wheat growth from multi-temporal MODIS images for yield estimation in North China. The authors applied histogram dimensionality reduction and time series fusion to generate the input layer of the CNN, designed to extract features of winter wheat growth, achieving a high correlation with statistical data (Pearson’s r of 0.82 and RMSE of 724.72 kg·hm-2). The paper also discusses the model’s robustness, spatial distribution of errors, and potential for real-time yield prediction. It suggests considering advanced algorithms for dimensionality reduction and time series smoothing in future research. This paper serves as a technical reference for estimating large-scale crop yield and highlights CNN’s potential for efficient real-time winter wheat yield prediction.
The formulas and accuracies mentioned in the paper include the use of 19 estimation indexes related to winter wheat growth from six different MODIS products. These are utilized to generate a 36×36×19 three-dimensional matrix as input for CNN samples. The achieved Pearson’s r of 0.82 and RMSE of 724.72 kg·hm-2 for winter wheat yield estimation indicate the model’s accuracy and effectiveness.
The accuracies mentioned in the document include Pearson’s r and RMSE values, indicating the correlation between estimated winter wheat yield based on time-series remote sensing images and statistical data. For North China, the Pearson’s r value is 0.82, demonstrating a strong correlation. The RMSE value of 724.72 kg·hm-2 further confirms the model’s accuracy. Additionally, the model’s robustness is verified through training different models based on the proposed neural network structure for five years, with Pearson’s r values ranging from 0.55 to 0.76 and RMSE values around 1000 kg·hm-2 for the validation set. These findings underscore the effectiveness and reliability of the CNN model for winter wheat yield estimation using remote sensing imagery.
The authors of the research paper are [12] Haipeng Xiong, Zhiguo Cao, and Hao Lu. The paper was published in the journal Plant Methods in 2019. The study introduces TasselNetv2, a context-augmented local regression network designed for in-field counting of wheat spikes. This approach integrates additional contextual information to enhance counting performance and address potential errors in the process.
The evaluation metrics used in the study are Mean Absolute Error (MAE) and Root Mean Squared Error (RMSE), essential for assessing the model’s prediction accuracy. The formulas for these metrics are:
where N denotes the number of images denotes the predicted count of the ith image, and denotes the corresponding ground-truth count. MAE measures the accuracy of counting, and RMSE measures the stability. Lower MAE and RMSE imply better counting performance.
Table 3.
TasselNet Performance Comparison.
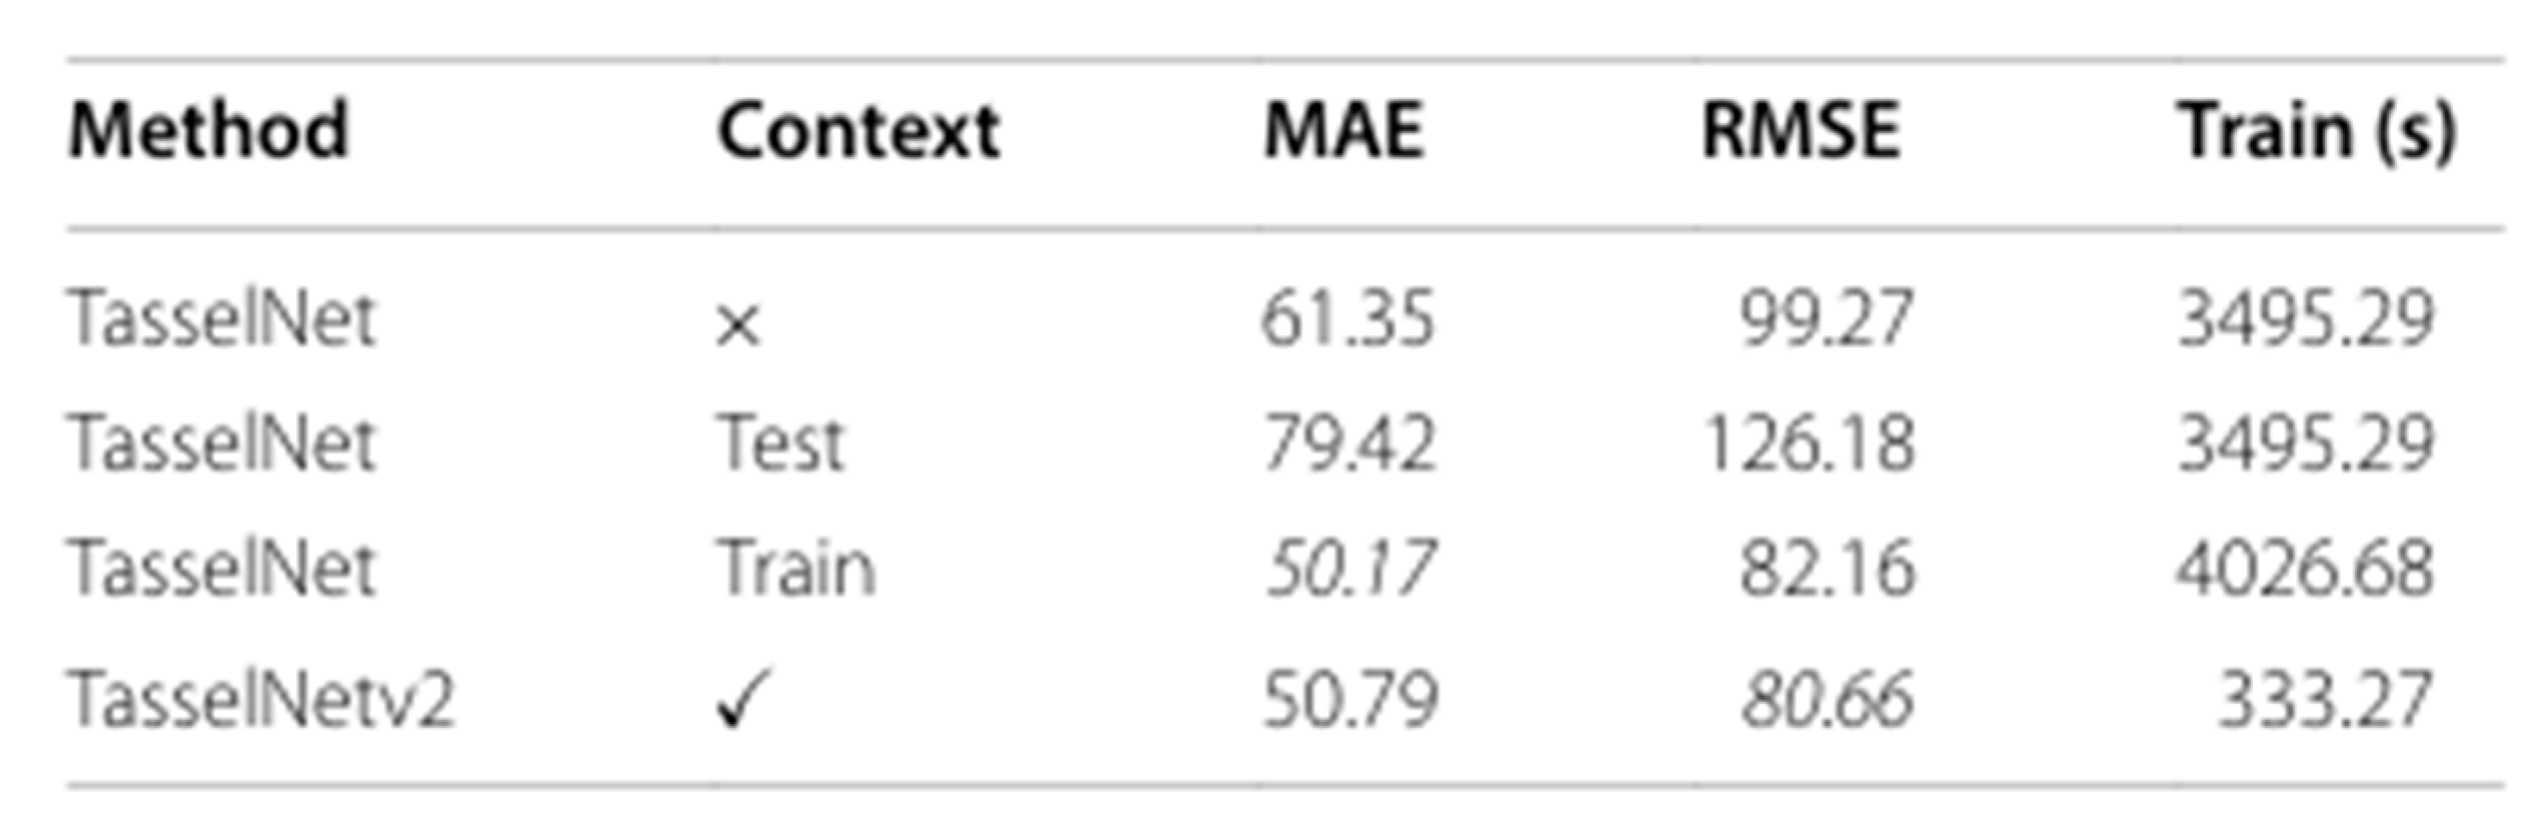
Using these metrics, the accuracy of TasselNetv2 in counting wheat spikes was evaluated. TasselNetv2 achieved a MAE of 50.79 and an RMSE of 80.66 on the test set of the Wheat Spikes Counting (WSC) dataset. These results indicate a significant reduction in counting errors compared to its predecessor, TasselNet, which had a MAE of 61.35 and an RMSE of 99.27. The lower MAE and RMSE values for TasselNetv2 demonstrate its improved accuracy in counting wheat spikes.
The research, authored by [13] Pouria Sadeghi-Tehran, Nicolas Virlet, Eva M. Ampe, Piet Reyns, and Malcolm J. Hawkesford, was published on September 26, 2019. It introduces DeepCount, a system that integrates Simple Linear Iterative Clustering (SLIC) for image segmentation and Deep Convolutional Neural Networks (CNN) for the semantic segmentation of wheat spikes in field images.
This system works by first segmenting images into superpixels using SLIC. It then extracts relevant canopy features and processes these features through a CNN for classification. DeepCount is designed to be efficient enough for real-time wheat spike counting, which is a significant improvement over traditional, labor-intensive manual counting methods.
The accuracy of DeepCount was assessed using manual image annotations and field measurements. The evaluation metrics included the coefficient of determination (R²), root mean squared error (RMSE), relative RMSE (rRMSE), and bias. The formulas for these metrics are:
where N is the number of images, ri represents the reference (manual) count, ei is the estimated count by the model, and rˉ is the mean of the reference counts.
The study found that DeepCount performed robustly across different growth stages and weather conditions. Compared to manual image-based counting, DeepCount achieved high correlation with R² values close to 0.94 and rRMSE around 11%. Validation against ground-based measurements showed slightly lower, but still high, accuracy, with R² values around 0.86 and rRMSE around 15%.
When compared to a handcrafted edge detection technique, DeepCount significantly outperformed it, achieving higher R² values (around 0.94 vs. 0.75) and lower rRMSE values (around 11% vs. 21%). This demonstrates DeepCount’s superior performance across various conditions tested in the study.
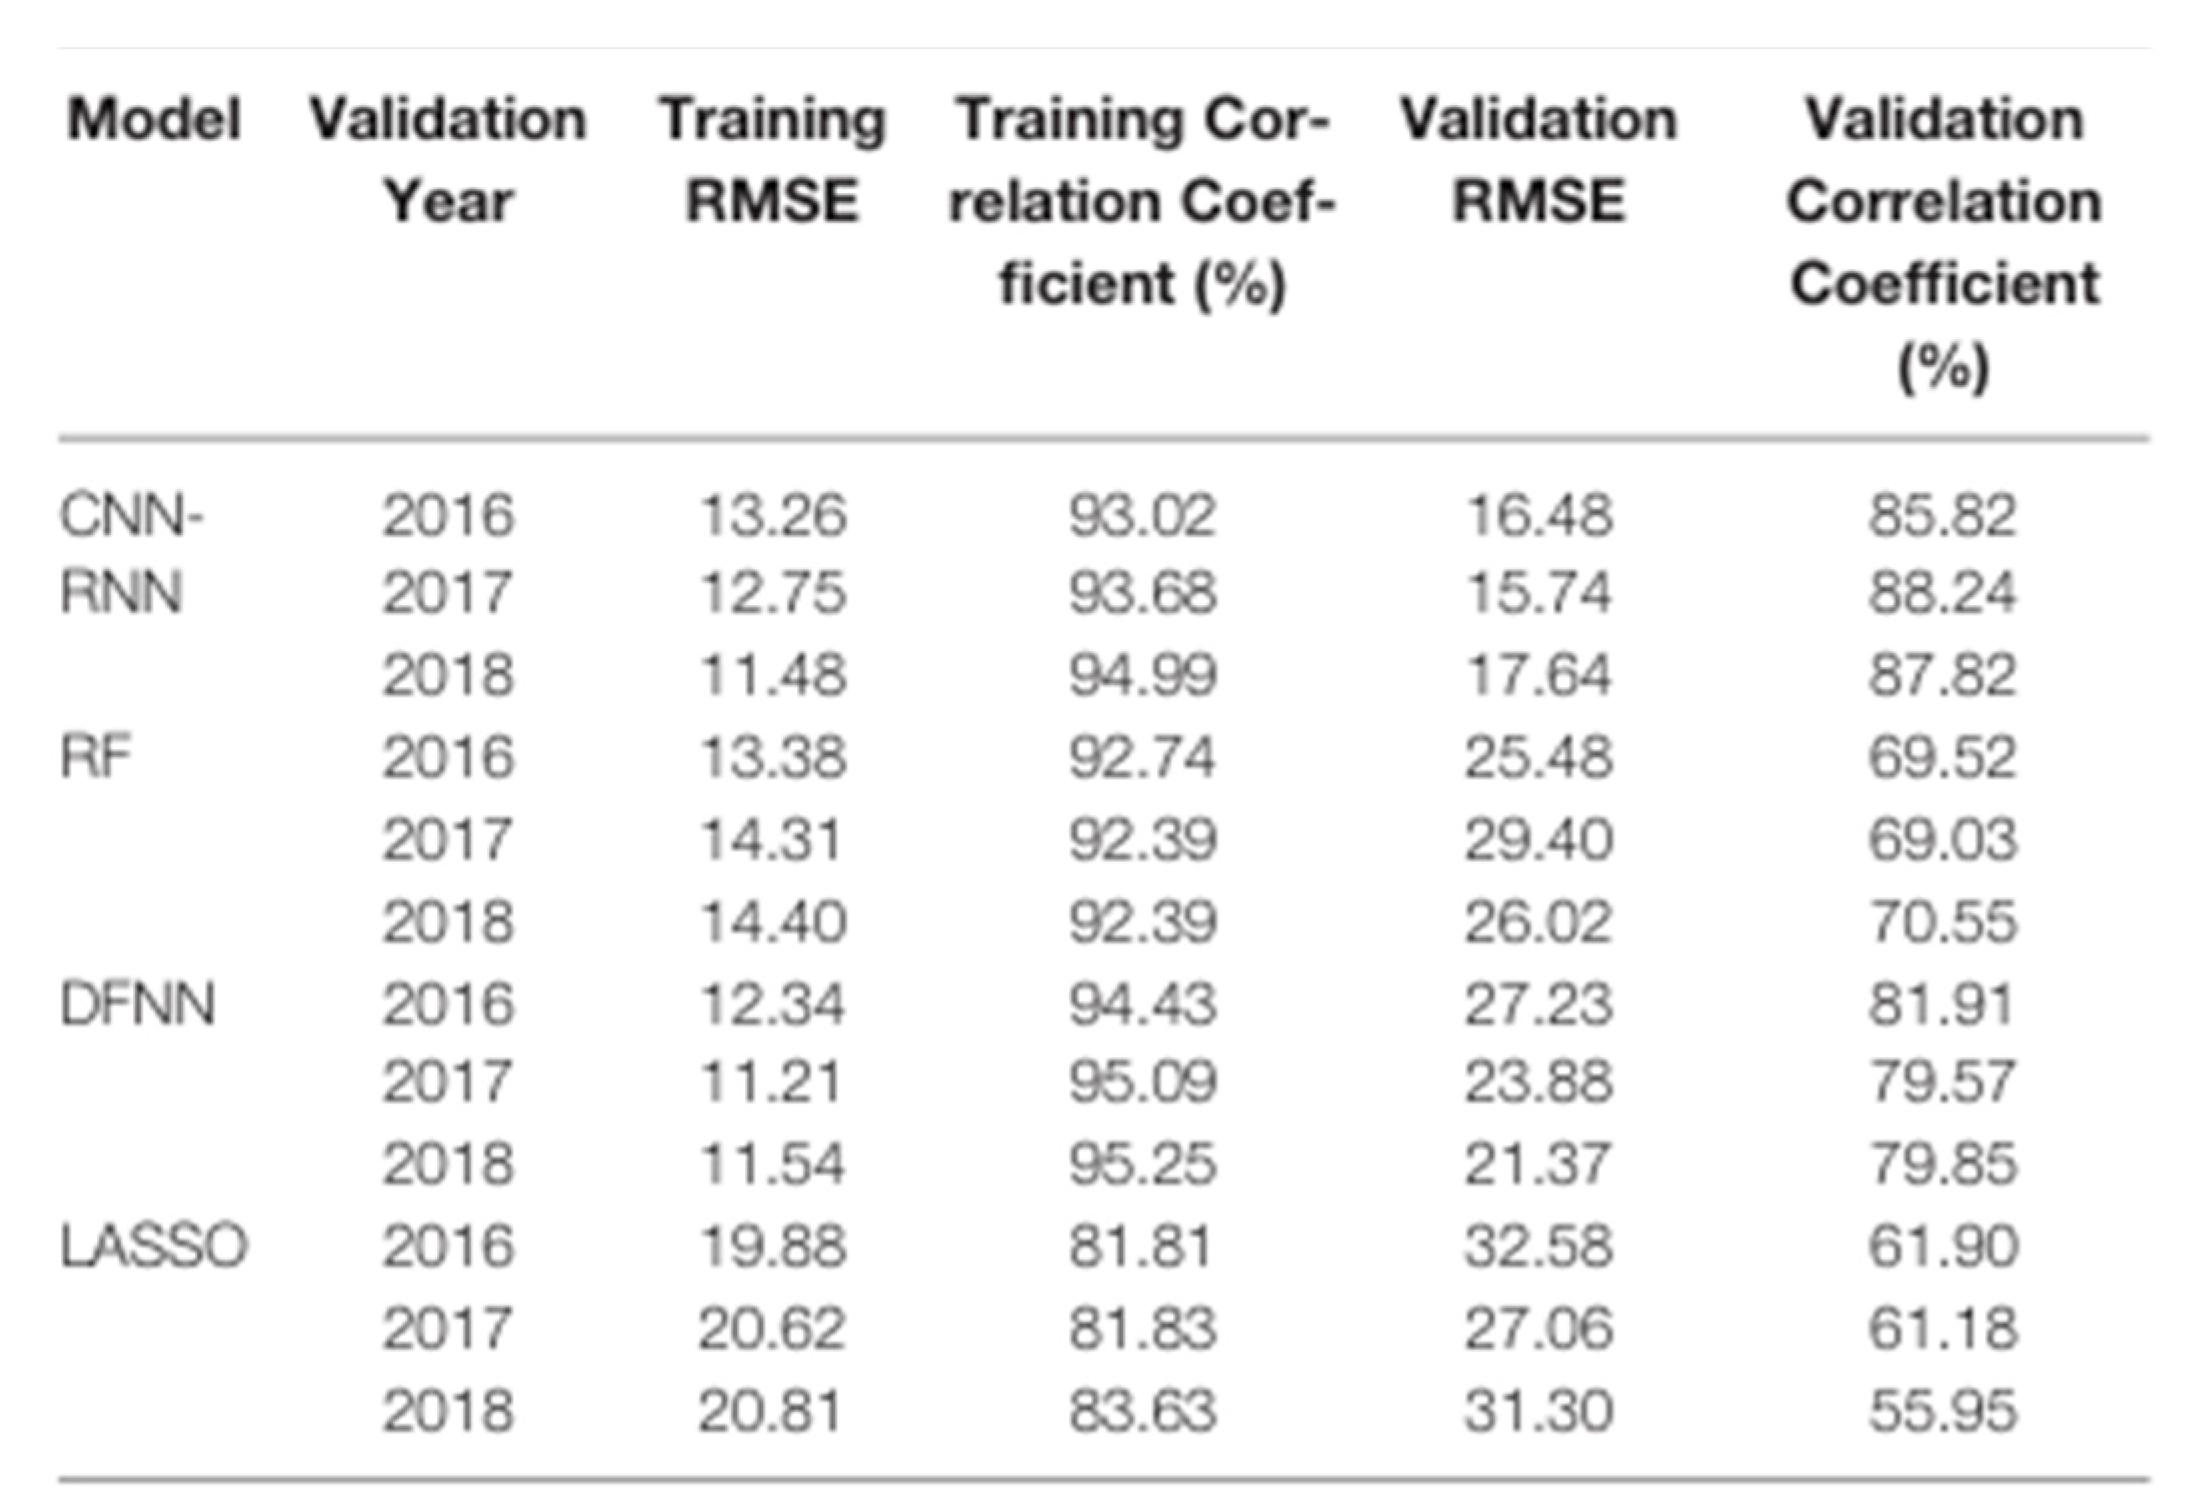
The research article published in January 2020 in the journal Frontiers in Plant Science, authored by [14] Khaki et al., introduces a novel approach to predict corn and soybean yields utilizing various machine learning models. These models encompass the CNN-RNN hybrid model, RF (Random Forest), DFNN (Deep Fully Connected Neural Network), and LASSO.
The CNN-RNN model integrates convolutional neural networks (CNNs) and recurrent neural networks (RNNs) to capture temporal dependencies in weather data and the increasing trend of crop yield over time. This model’s sensitivity to essential variables like weather, soil, and management practices enables accurate yield predictions even in unfamiliar environments.
In contrast, the RF model employs ensemble learning with 50 trees to deliver robust yield predictions. The LASSO model evaluates the linear and nonlinear effects of soil and weather data on yield prediction, providing insights into variable importance. The DFNN model, with its deep architecture and advanced techniques like batch normalization and residual learning, aims to enhance prediction accuracy.
Model evaluation involves metrics such as training and validation root-mean-square-error (RMSE) and correlation coefficient. Notably, the CNN-RNN model outperforms other models in accuracy, demonstrating superior performance in both training and validation datasets for predicting corn and soybean yields.
The authors of the paper are [15] Xinlei Wang, Jianxi Huang, Quanlong Feng, and Dongqin Yin, published in May 2020. The paper focuses on using deep learning methods to predict winter wheat yield in China’s main producing regions at the county level. The methods used include Long Short-Term Memory (LSTM) networks and Convolutional Neural Networks (CNN) to analyze multi-source data, including remote sensing and meteorological data. The study also evaluates the uncertainty of the yield prediction model using specific methods.
Table 4.
Corn yield prediction performance for year 2016, 2017, and 2018.
The evaluation metrics used include Normalized Root Mean Square Error (NRMSE), Coefficient of Determination (R²), and Mean Absolute Percentage Error (MAPE). These metrics are used to assess the accuracy of the model in predicting winter wheat yield. The formulas used include the calculation of NRMSE, R², and MAPE, which are essential for evaluating the accuracy of the model’s predictions:
Overall, the paper focuses on the development of a deep learning model for predicting winter wheat yield, the impact of different data sources on model accuracy, and the quantification of uncertainty in the yield prediction model.
The research, conducted by [16] Jose A. Fernandez-Gallego, Peter Lootens, Irene Borra-Serrano, Isabel Roldán-Ruiz, Shawn C. Kefauver, Veerle Derycke, Geert Haesaert, and Jose L. Araus, was published in The Plant Journal in 2020. It investigates the use of machine learning techniques to automatically count wheat ears from RGB images captured by an unmanned aerial vehicle (UAV). The methodology involves a pipeline with steps such as frequency filtering, segmentation, feature extraction, and classification to identify wheat ears in micro-plot images. Various classification techniques are utilized, including discriminant analysis (DA), generalized linear models (GLMs), k-nearest neighbors (kNN), naive Bayes (nB), feed-forward neural networks (NNs), support vector machine (SVM), decision trees (DTs), and random forest (RF).
The system’s accuracy was evaluated using cross-validation, demonstrating high accuracy levels for true positives (TP) and true negatives (TN) across different classifiers. The random forest (RF) classifier achieved the highest accuracy for both TP and TN on two measurement dates: June 4 (TP = 98.0%, TN = 96.9%) and June 19 (TP = 98.8%, TN = 95.8%).
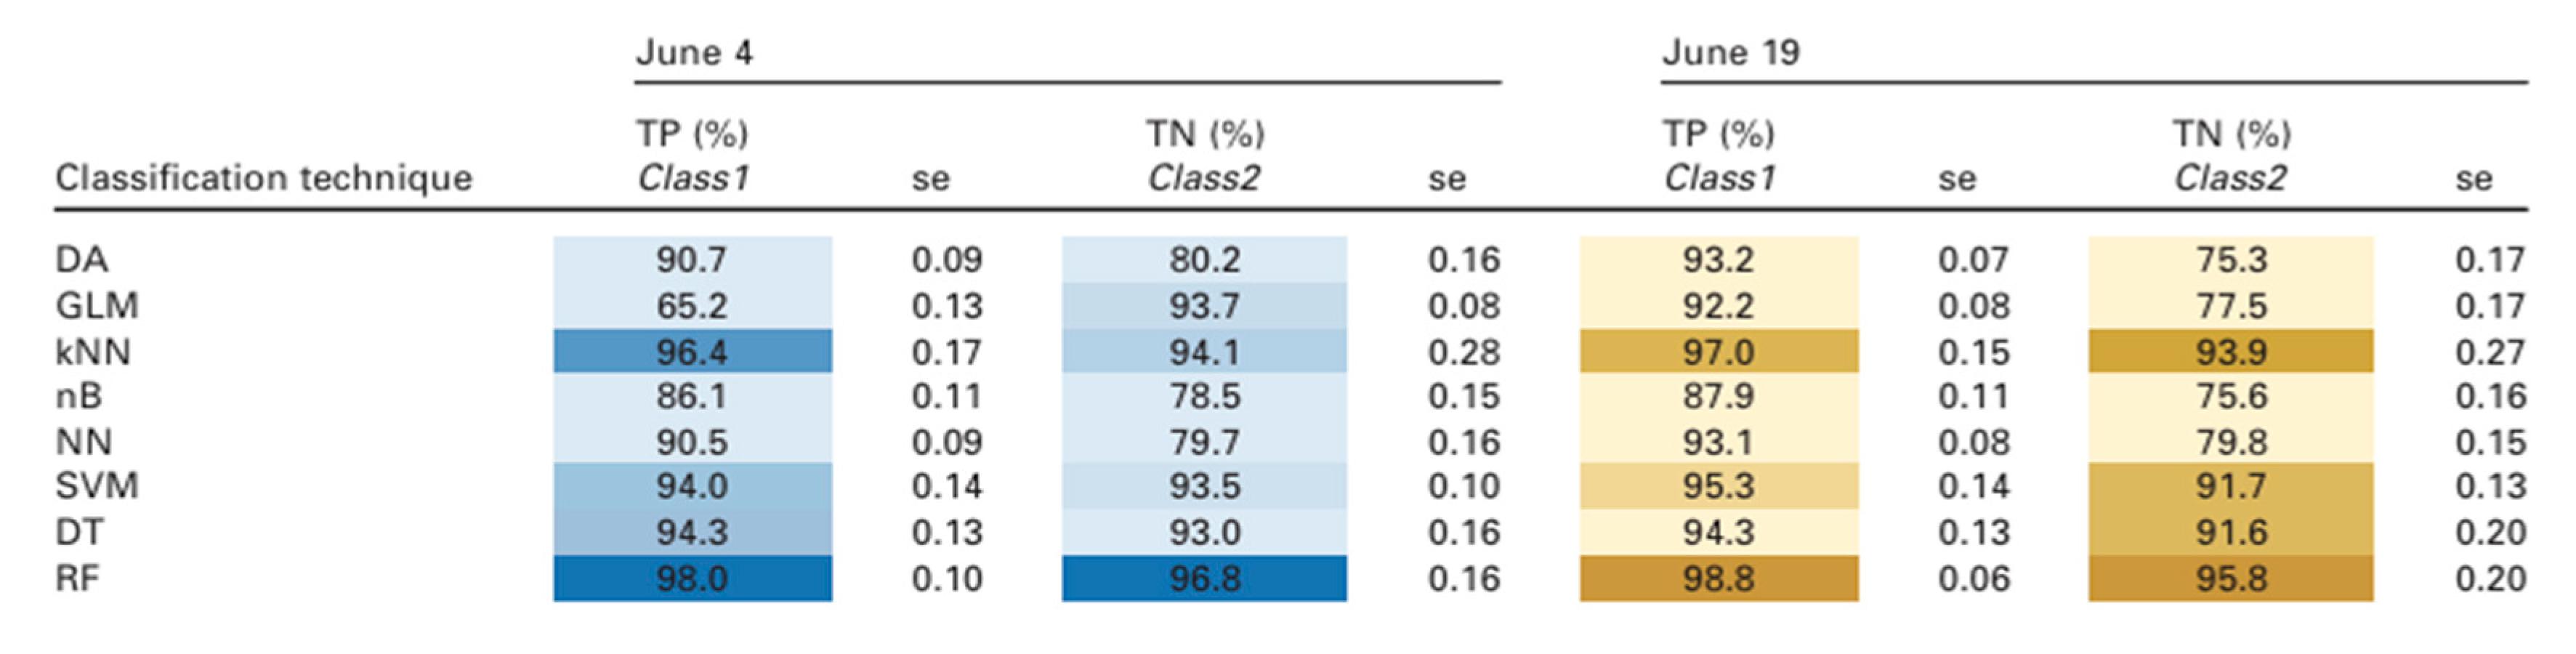
The determination coefficient (R²) was employed to assess the correlation between manual image-based counting and algorithm-based counting, as well as the relationship between ear counting and grain yield. The RF classifier attained the highest R² values for both dates (June 4, R² = 0.82; June 19, R² = 0.87), indicating a strong correlation between the manual and algorithmic counts.
Furthermore, the research discusses the correlation between automatic ear counting and grain yield, noting that it was stronger than the correlation between manual in-situ counting and grain yield, particularly for the lower nitrogen treatment. The study suggests that factors such as genotype characteristics and nitrogen treatments should be considered in models assessing grain yield.
The document by [17] K. Dokic, L. Blaskovic, and D. Mandusic presents an in-depth review of the evolving trends in the application of machine learning, neural networks, and deep learning in the field of agriculture. The authors conducted a quantitative analysis of 95 papers published in 2020, categorizing these papers based on application areas, selected deep learning methods, input data, crops discussed, and the frameworks used.
Figure 7.
Distribution of Deep learning Frameworks.
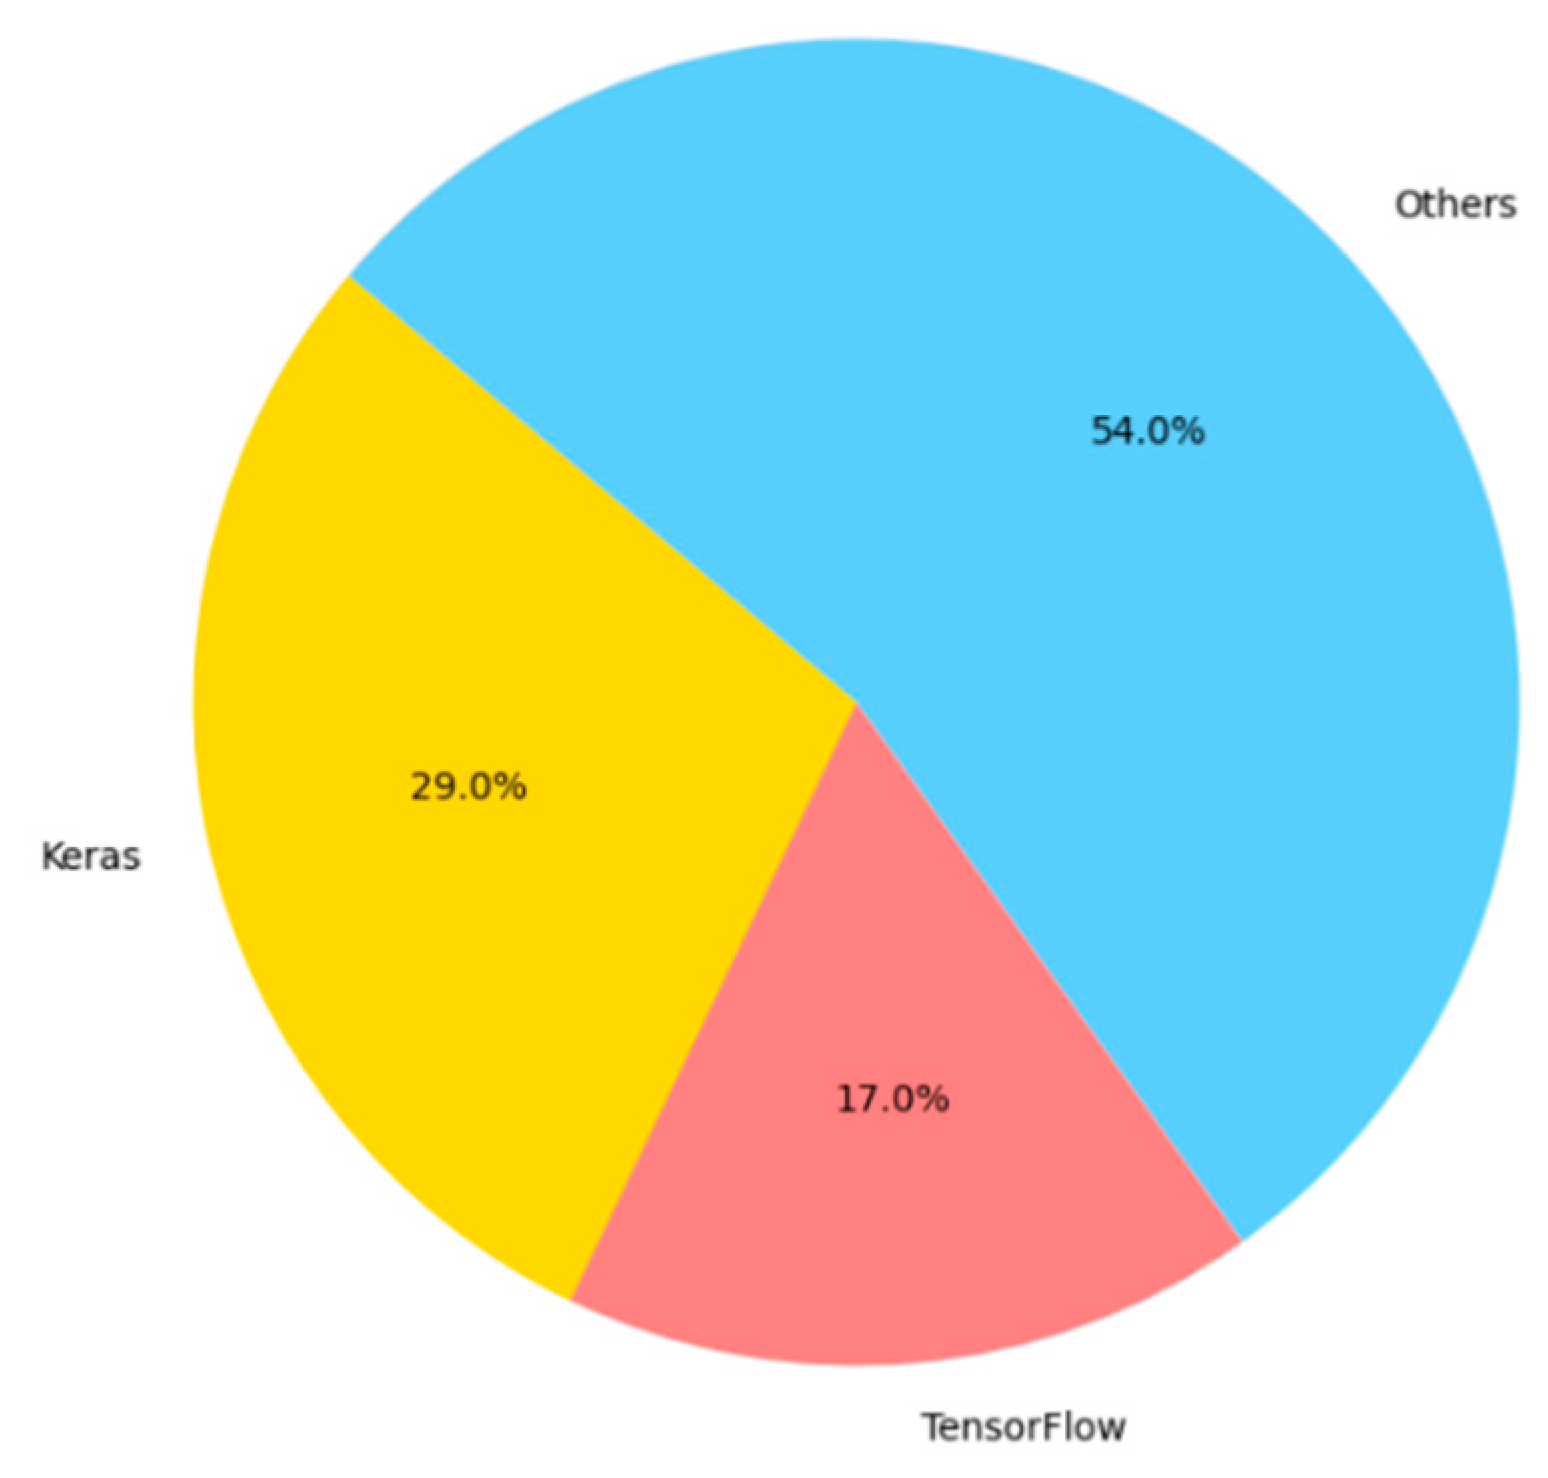
The methods analyzed in the papers include machine learning, neural networks, and deep learning techniques. Among these, convolutional neural networks (CNNs) are the most frequently employed, followed by recurrent neural networks (RNNs). The review also identifies the most commonly used frameworks in these studies, with Keras being the leading framework (used in 29% of the papers), followed by TensorFlow (17%). Additionally, the primary input data sources for deep learning methods are identified as cameras and satellite images.
While the document focuses on a quantitative review of trends and applications rather than specific performance metrics, it does not provide explicit accuracy values for the methods used in the papers. The emphasis is on reviewing the trends and categorizing the methods and frameworks rather than detailing specific accuracy metrics. If there is a need for detailed accuracy values for the methods used, further research or additional sources would be required to obtain that information.
The chapter from a publication in May 2022 by [18] Padmesh Tripathi, Nitendra Kumar, Mritunjay Rai, and Ayoub Khan discusses the integration of deep learning (DL) technologies in a range of agricultural applications, including plant disease detection, weather forecasting, crop yield prediction, plant classification, and weed identification, among others.
Deep Learning Algorithms in Agriculture:
The chapter explores a variety of deep learning algorithms, such as Convolutional Neural Networks (CNN), Recurrent Neural Networks (RNN), and Generative Adversarial Networks (GAN), and their variants like AlexNet, VGG, and LSTM. These algorithms are applied to tasks like image recognition, data classification, and predictive modeling within the agricultural sector.
Plant Disease Detection:
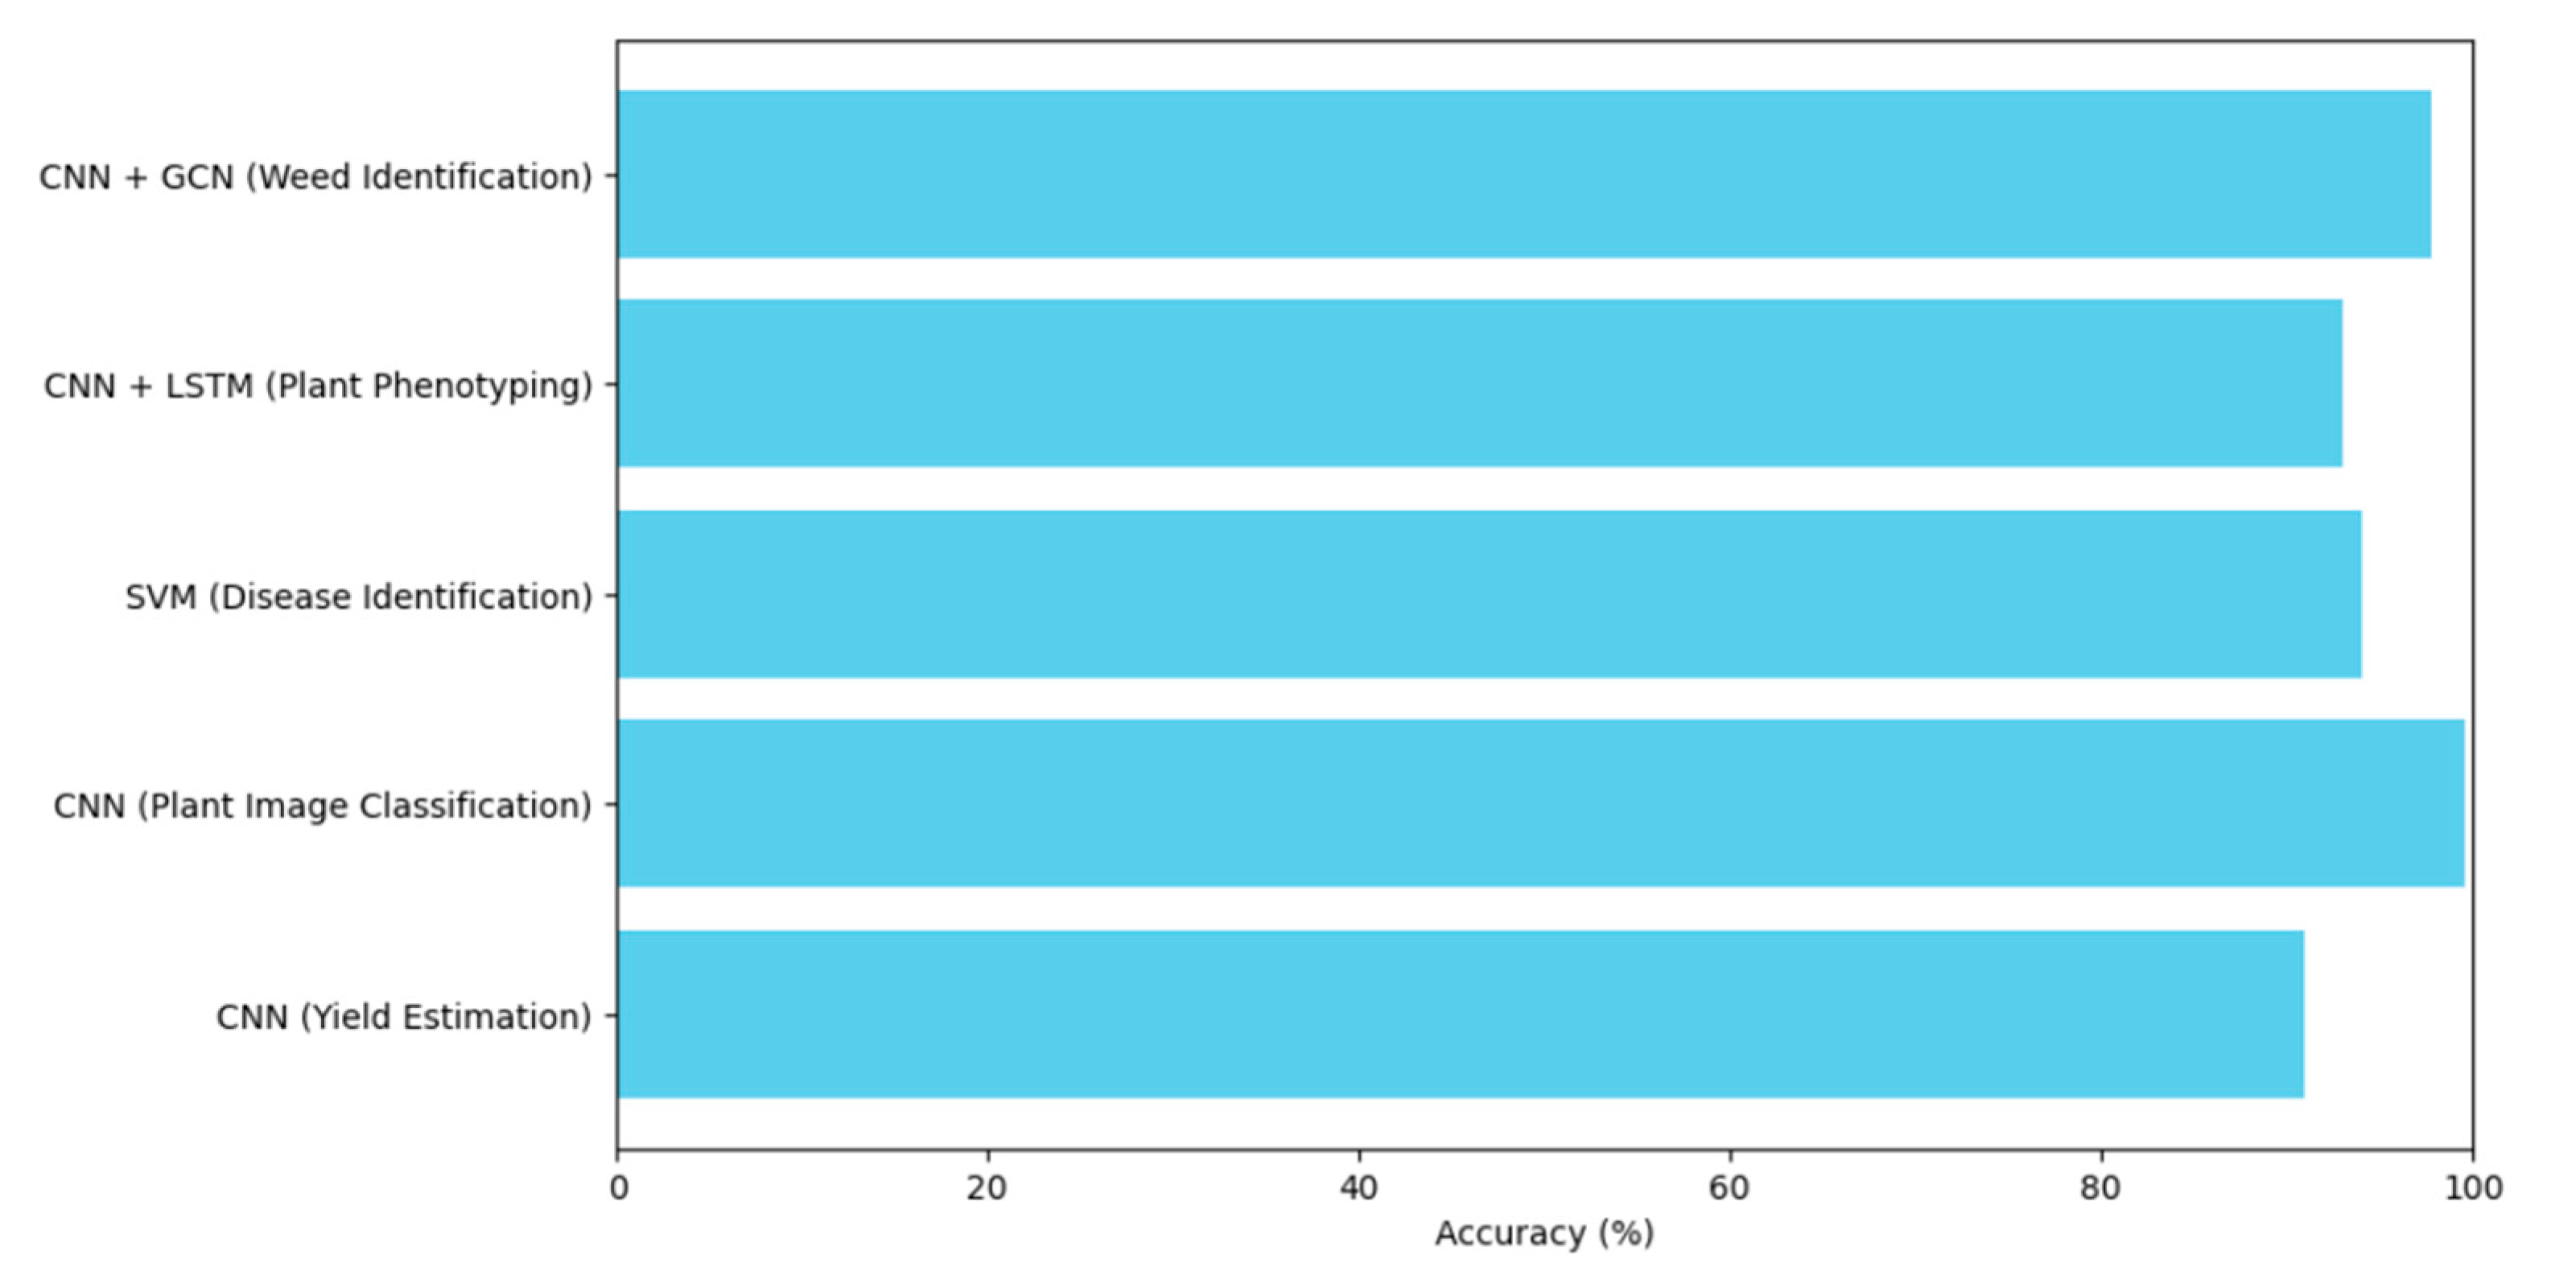
For detecting plant diseases, deep learning frameworks are highlighted for their high accuracy. For example, a VGG Net model pre-trained on ImageNet achieved an accuracy of over 91.82%. Another model that integrated Shallow VGG with Xgboost attained accuracies of 94.47%, 98.74%, and 93.91% for corn, potato, and tomato datasets, respectively.
Weather Forecasting:
In weather forecasting, the chapter discusses the use of RNN-based models such as NARXNet and LSTM, which have shown superior performance in predicting weather conditions. The LSTM model, in particular, outperformed other models in weather forecasting tasks.
Crop Yield Prediction:
For predicting crop yield, the authors describe the application of deep learning algorithms on remote sensing data, with CNN and LSTM networks achieving significant results. One approach using a deep neural network (DNN) produced a Root Mean Square Error (RMSE) of 12% of the average yield. Another model that combined CNNs and RNNs achieved a RMSE of 9% of the average yield
Plant Classification:
In plant classification, models that use ResNet18 and AlexNet with transfer learning are discussed, achieving classification accuracies of 99% and 99.9% on different datasets.
Weed Identification:
The chapter also covers methods for weed identification, combining K-means feature learning with CNN and CNN feature-based Graph Convolutional Network (GCN), which achieved accuracies of 92.89% and 97.80%, respectively.
Plant Phenotyping
A combination of CNN and LSTM was used to recognize plant phenotypes with an accuracy of 93%.
Leaf Area Index (LAI) Estimation:
For Leaf Area Index (LAI) estimation, a NARXNN-based model demonstrated effectiveness in time series LAI estimation. Another approach using multimodal data fusion and deep neural networks (DNNs) achieved a relative RMSE of 12.78% for maize LAI estimation.
Soil Moisture Estimation:
In the context of soil moisture estimation, a NARX model was compared with other methods and demonstrated stability in direct validation.
Land Classification and Land Cover Classification:
For land classification and land cover classification, deep CNN methods and LSTM models were employed, achieving accuracies of 90% and outperforming other models.
Conclusion and Future Prospects:
The authors conclude that deep learning holds substantial potential for agricultural applications and suggest that there is still much to explore using DL techniques. They propose that future approaches could include DetectNet CNN and Faster Region-based CNN for automated agricultural tasks.
While the document emphasizes the applications and results of these methods in agricultural contexts, it does not provide specific formulas for the algorithms. However, it references performance metrics such as accuracy, RMSE, and R² value for evaluating the models.
The paper authored by [19] M.A., A.A., and A.R. was published in the journal "Applied Sciences" in 2022. It presents a survey that explores the application of various deep learning techniques in agriculture. The methodologies discussed in the survey include convolutional neural networks (CNN), recurrent neural networks (RNN), and support vector machines (SVM). These techniques were evaluated using performance metrics such as accuracy, precision, the F1 score, and the root mean square error (RMSE).
Precision is defined as the fraction of relevant instances (true positives) among all instances predicted to belong to a certain class. The F1 score offers a single metric that balances precision and recall, providing a comprehensive measure of a model’s accuracy. The determination coefficient (R²) quantifies the proportion of variance in a dependent variable that can be explained by an independent variable. RMSE is a measure of the standard deviation of prediction errors in a dataset, reflecting the difference between predicted and observed values.
The document provides several examples from the reviewed literature. One study on yield estimation using a deep convolutional neural network reported an average test accuracy of 91%. Another study employing a CNN model for recognizing and classifying plant images achieved a peak accuracy of 99.58%. Additionally, a study using an SVM classifier for autonomous plant disease identification reported an accuracy of 94%.
The article by [20] Pallab Bharman et al., published in the Asian Journal of Computer Science and Information Technology in February 2022, offers a comprehensive review of deep learning (DL) applications in agriculture, particularly in the areas of yield prediction, weed detection, and disease detection. The review does not introduce specific formulas, as it surveys existing methods and models rather than proposing new algorithms. However, it does discuss the use of statistical measures such as Root Mean Square Error (RMSE), Mean Squared Error (MSE), and Mean Absolute Percentage Error (MAPE) for assessing the performance of DL models.
The authors examine a variety of DL models and algorithms, including Convolutional Neural Networks (CNNs), Recurrent Neural Networks (RNNs), Long Short-Term Memory Networks (LSTMs), and Deep Belief Networks (DBNs). They also highlight the use of pre-trained models like VGG16 and AlexNet for tasks such as crop disease detection.
The review details a wide range of performance metrics reported in different studies. In the context of yield prediction, RMSE values ranged from 8% to 12% of average yield, depending on the crop and the model used. For disease detection, accuracies frequently surpassed 95%, with some models achieving almost perfect classification rates. Weed detection models demonstrated varying levels of accuracy, with some achieving over 98% under controlled conditions. It is important to note that these performance metrics are taken from the studies reviewed by the authors and do not represent results from their own experiments.
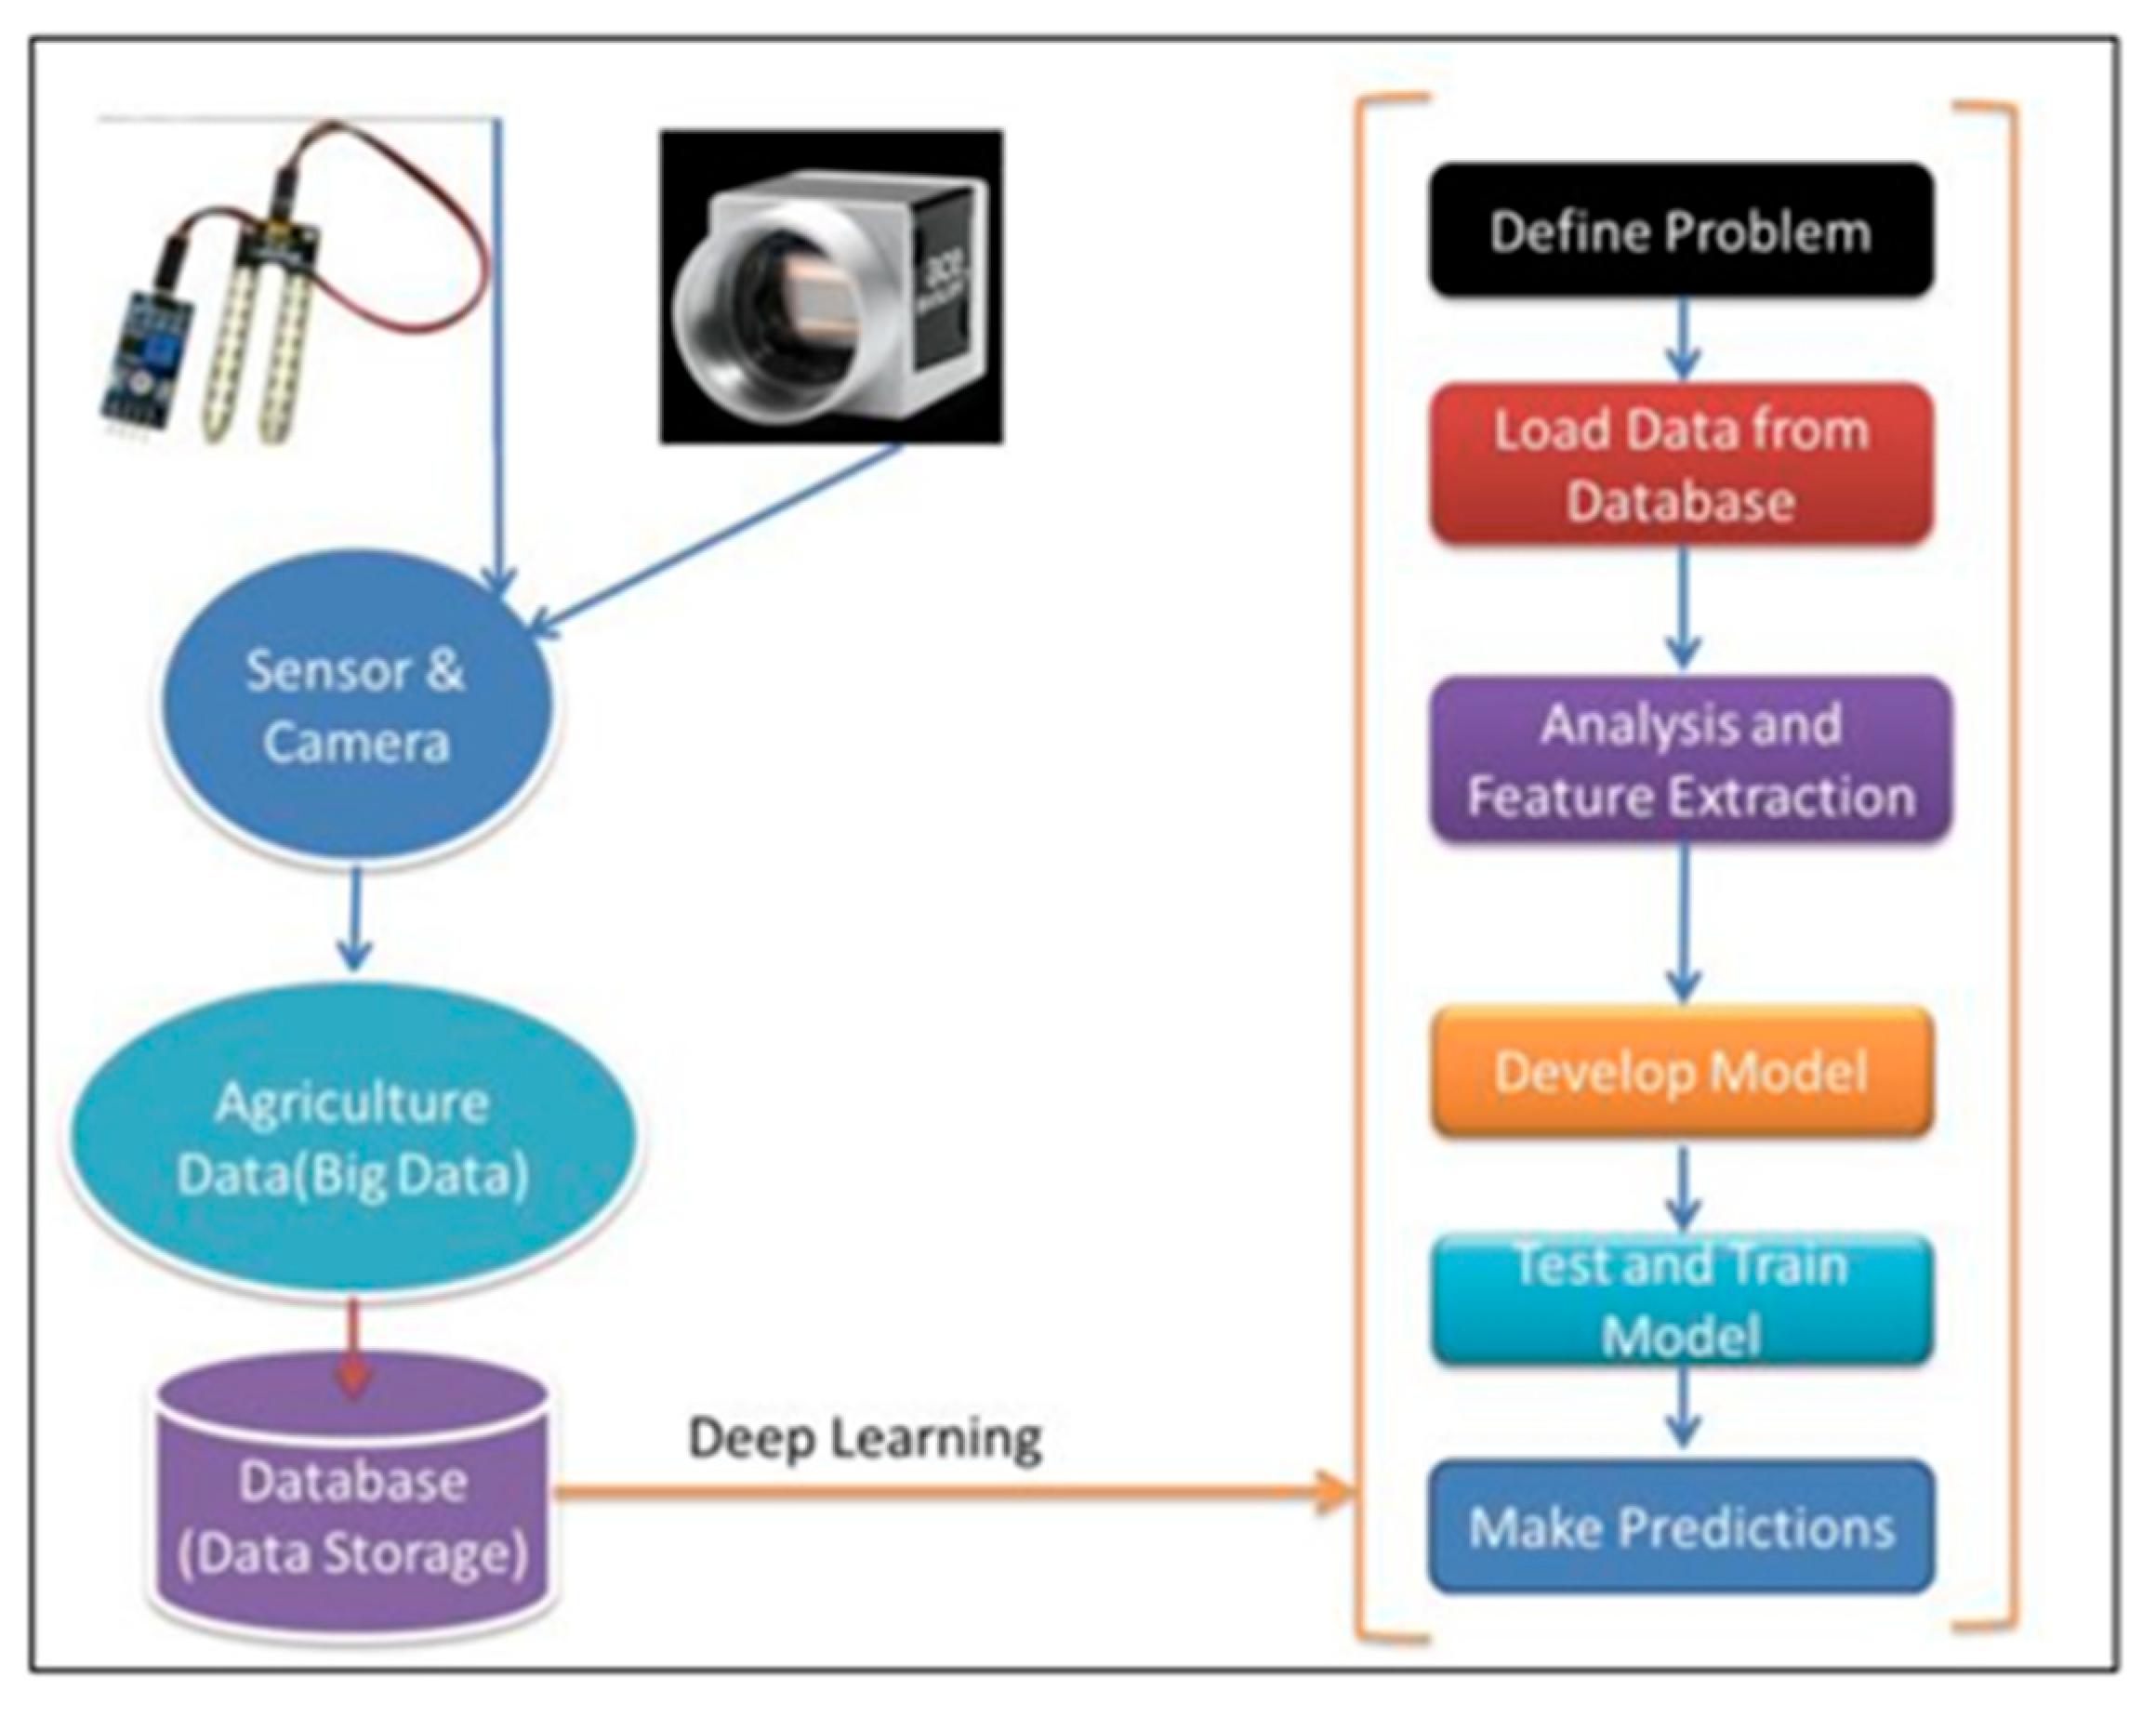
[21] Marwan Albahar's 2023 paper provides an in-depth review of deep learning (DL) applications in agriculture, focusing on fruit counting, water management, crop management, soil management, weed detection, seed classification, yield prediction, disease detection, and harvesting. The review covers studies published between 2016 and 2022, emphasizing journal articles and conference papers that are in English, fully accessible, and relevant to the research objectives. Studies published before 2016 were excluded to ensure the recency and applicability of the findings.
Figure 8.
Sensor-to-Model Pipeline.
- Fruit Counting: Faster R-CNN, Inception-ResNet, VGG-16, CNN, YOLO V3.
- Water Management: Near-infrared (NIR) spectroscopy, improved CNNs combined with decision tree analysis.
- Crop Management: ViSeed, Fast R-CNN, CNN, VGG-16.
- Soil Management: DL regression models for soil moisture.
- Weed Detection: First-order agriculture simulation with Richard's equation, SVM, CNN.
- Seed Classification: CNNs.
- Disease Detection: CNNs, other DL architectures for plant diseases.
- Yield Prediction: Machine learning and DL algorithms for predicting yields and crop readiness.
- Harvesting: YOLO and other models for fruit detection and harvesting efficiency.
The reported accuracies from the reviewed studies are as follows:
Fruit Counting: Faster R-CNN achieved an F1-score of 0.83. Inception-ResNet-v4 was used for fruit counting, though specific accuracy metrics were not detailed. VGG-16 achieved a 95% accuracy for orchard fruit detection, while a CNN model achieved an 89.29% accuracy for kiwifruit detection.
Water Management: Near-infrared (NIR) spectroscopy methods were discussed, but specific accuracy measures were not provided.
Crop Management: Various DL networks were mentioned for tasks like soybean production and sorghum plant stalk counting, but without specific accuracy metrics.
Seed Classification and Plant Disease Detection: CNNs were noted for their high accuracy, with reported accuracies ranging from 91% to 98% for different plant diseases.
Yield Prediction: Machine learning and DL algorithms were reviewed, although specific accuracy metrics were not provided.
Harvesting: The use of models like YOLO was highlighted for their effectiveness in fruit detection and harvesting.
Conclusion:
Predominance of Deep Learning Models
The survey reveals a significant dominance of Convolutional Neural Networks (CNNs) and Recurrent Neural Networks (RNNs) in agricultural applications. CNNs, known for their prowess in image recognition tasks, have been extensively employed in plant disease detection, crop classification, and yield prediction. RNNs, particularly Long Short-Term Memory (LSTM) networks, excel in sequential data analysis, making them ideal for weather forecasting and crop growth monitoring. These models' high accuracy rates underscore their potential to revolutionize agricultural practices by providing precise and reliable predictions. For instance, plant disease detection models often achieve accuracies above 95%, enabling timely interventions that can save crops from widespread damage.
Frameworks and Data Sources
Keras and TensorFlow emerge as the most popular frameworks in the studies surveyed. Their robustness, ease of use, and extensive libraries support a wide range of deep learning applications in agriculture. These frameworks' popularity indicates a trend towards more standardized and accessible tools for developing advanced agricultural models. Camera and satellite imagery are the primary data sources, highlighting the importance of remote sensing technologies in modern agriculture. These sources provide comprehensive data for monitoring crop health, predicting yields, and detecting diseases from a macro to micro level.
Applications and Performance Metrics
The surveyed studies demonstrate that deep learning models have achieved significant milestones in various agricultural applications. Plant disease detection models frequently exceed 95% accuracy, crucial for early and effective crop management. Weather forecasting models, particularly those using RNNs like LSTM, have shown superior performance, which is vital for planning agricultural activities and mitigating the impacts of adverse weather conditions. Crop yield prediction models utilizing CNNs and LSTMs also exhibit high accuracy, with some achieving a Root Mean Square Error (RMSE) as low as 9% of the average yield. These performance metrics affirm the effectiveness of deep learning in enhancing agricultural productivity and sustainability.
Figure 9.
Accuracy Comparison Across Methods.
Funding
This research received no external funding.
Data Availability
NOT APPLICABLE
Competing Interests
The authors declare no competing interests.
Ethics Approval
Not applicable.
Consent to Participate
Not applicable.
Consent to Publish
Not applicable.
Third-Party Material
NO. This manuscript contains no third-party material requiring permission
References
- Roope Näsi, Eija Honkavaara, Päivi Lyytikäinen-Saarenmaa, Minna Blomqvist, Paula Litkey, Teemu Hakala, Niko Viljanen, Tuula Kantola, Topi Tanhuanpää, and Markus Holopainen (2015)Using UAV-Based Photogrammetry and Hyperspectral Imaging for Mapping Bark Beetle Damage at Tree-Level.https://www.mdpi.com/2072-4292/7/11/15467.
- Jig HanJeong, Jonathan P. Resop, Nathaniel D. Mueller, David H. Fleisher, Yungdahm Yun, Ethan E. Butler, Dennis J. Timlin, Kyo-Moon Shim, James S. Gerber, and Vangimalla R. (2016)Random Forests for Global and Regional Crop Yield Predictions.https://journals.plos.org/plosone/article/file?id=10.1371/journal.pone.0156571&type=printable. [CrossRef]
- Angela Lausch, Stefan Erasmi, Douglas. King, Paul Magdon, and Marco Heurich (2017) Understanding Forest Health with Remote Sensing-Part II—A Review of Approaches and Data Models.https://www.mdpi.com/2072-4292/9/2/129. [CrossRef]
- Zbyněk Malenovský, Arko Lucieer, Diana H. King, Johanna D. Turnbull, and Sharon A. Robinson (2017)Unmanned aircraft system advances health mapping of fragile polar vegetation.https://besjournals.onlinelibrary.wiley.com/doi/full/10.1111/2041-210X.12833. [CrossRef]
- Igor Oliveira et al. (2018) A Scalable Machine Learning System for Pre-Season Agriculture Yield Forecast.https://ieeexplore.ieee.org/stamp/stamp.jsp?tp=&arnumber=8588750.
- Hasan et al. (2018)Detection and analysis of wheat spikes using Convolutional Neural Networks.https://plantmethods.biomedcentral.com/articles/10.1186/s13007-018-0366-8. [CrossRef]
- Nanyang Zhu and colleagues (2018)Deep learning for smart agriculture: Concepts, tools, applications, and opportunities.https://scholar.google.co.in/scholar_url?url=https://www.ijabe.org/index.php/ijabe/article/download/4475/pdf&hl=en&sa=X&ei=yixjZobeDY3A6rQPjqSPmAY&scisig=AFWwaeYdqtisz-HSmYPgFjaJSpCx&oi=scholarr.
- Max Gerhards, Martin Schlerf, Kaniska Mallick, and Thomas Udelhoven (2019)Challenges and Future Perspectives of Multi-/Hyperspectral Thermal Infrared Remote Sensing for Crop Water-Stress Detection: A Reviewhttps://www.mdpi.com/2072-4292/11/10/1240.
- Apollo Kaneko, Thomas Kennedy, Lantao Mei, Christina Sintek, Marshall Burke, Stefano Ermon, and David Lobell (2019) Deep Learning For Crop Yield Prediction in Africa.https://aiforsocialgood.github.io/icml2019/accepted/track1/pdfs/20_aisg_icml2019.pdf.
- Jie Sun, Liping Di, Ziheng Sun, Yonglin Shen, and Zulong Lai (2019) County-Level Soybean Yield Prediction Using Deep CNN-LSTM Model.https://www.ncbi.nlm.nih.gov/pmc/articles/PMC6832950/pdf/sensors-19-04363.pdf.
- Haowei Mu, Liang Zhou, Xuewei Dang, and Bo Yuan (2019) Winter Wheat Yield Estimation from Multitemporal Remote Sensing Images based on Convolutional Neural networks. https://www.researchgate.net/publication/336560099_Winter_Wheat_Yield_Estimation_from_Multitemporal_Remote_Sensing_Images_based_on_Convolutional_Neural_Networks.
- Haipeng Xiong, Zhiguo Cao, and Hao Lu (2019)TasselNetv2: in-field counting of wheat spikes with context-augmented local regression networks.https://link.springer.com/article/10.1186/s13007-019-0537-2. [CrossRef]
- Pouria Sadeghi-Tehran, Nicolas Virlet, Eva M. Ampe, Piet Reyns, and Malcolm J. Hawkesford(2019) DeepCount: In-Field Automatic Quantification of Wheat Spikes Using Simple Linear Iterative Clustering and Deep Convolutional Neural Networks.https://www.frontiersin.org/journals/plant-science/articles/10.3389/fpls.2019.01176/full. [CrossRef]
- Khaki et al.(2020) A CNN-RNN Framework for Crop Yield Prediction.https://arxiv.org/ftp/arxiv/papers/1911/1911.09045.pdf.
- Xinlei Wang, Jianxi Huang, Quanlong Feng, and Dongqin Yin (2020)Winter Wheat Yield Prediction at County Level and Uncertainty Analysis in Main Wheat-Producing Regions of China with Deep Learning Approaches. https://www.mdpi.com/2072-4292/12/11/1744. [CrossRef]
- Jose A. Fernandez-Gallego, Peter Lootens, Irene Borra-Serrano, Isabel Roldán-Ruiz, Shawn C. Kefauver, Veerle Derycke, Geert Haesaert, and Jose L. Araus (2020)Automatic wheat ear counting using machine learning based on RGB UAV imagery.https://onlinelibrary.wiley.com/doi/epdf/10.1111/tpj.14799. [CrossRef]
- K. Dokic, L. Blaskovic, and D. Mandusic (2020) From machine learning to deep learning in agriculture – the quantitative review of trends.https://iopscience.iop.org/article/10.1088/1755-1315/614/1/012138/pdf.
- Padmesh Tripathi, Nitendra Kumar, Mritunjay Rai, and Ayoub Khan(2022)Applications of Deep Learning in Agriculture.https://www.researchgate.net/publication/361878471_Applications_of_Deep_Learning_in_Agriculture.
- M.A., A.A., and A.R.(2022)Smart Agriculture Applications Using Deep Learning Technologies: A Survey.https://www.mdpi.com/2076-3417/12/12/5919. [CrossRef]
- Pallab Bharman et al.(2022) Deep Learning in Agriculture: A Review.https://www.researchgate.net/publication/359243072_Deep_Learning_in_Agriculture_A_Review.
- Marwan Albahar (2023)A Survey onDeepLearning and Its Impact on Agriculture: Challenges and Opportunities. https://www.mdpi.com/2077-0472/13/3/540. [CrossRef]
Disclaimer/Publisher’s Note: The statements, opinions and data contained in all publications are solely those of the individual author(s) and contributor(s) and not of MDPI and/or the editor(s). MDPI and/or the editor(s) disclaim responsibility for any injury to people or property resulting from any ideas, methods, instructions or products referred to in the content. |
© 2026 by the authors. Licensee MDPI, Basel, Switzerland. This article is an open access article distributed under the terms and conditions of the Creative Commons Attribution (CC BY) license (http://creativecommons.org/licenses/by/4.0/).
Copyright: This open access article is published under a Creative Commons CC BY 4.0 license, which permit the free download, distribution, and reuse, provided that the author and preprint are cited in any reuse.


