Submitted:
13 January 2026
Posted:
14 January 2026
You are already at the latest version
Abstract
Background: Killed Whole Cell Genome-Reduced Bacteria (KWC/GRB), a versatile vaccine platform, can produce very low cost, thermostable, easily manufactured vaccines expressing complex immunogens that include potent immunomodulators. This system supports iterative optimization through a Design–Build–Test–Learn (DBTL) workflow aimed at enhancing immunogenicity. We applied this approach to developing an HIV-1 gp41 Membrane-Proximal External Region (MPER) vaccine using the scaffolded MPER antigen, 3AGJ, a recombinant heterologous protein engineered to mimic MPER structures recognized by broadly neutralizing monoclonal antibodies (bNAbs). Methods: Five KWC/GRB vaccines expressing versions of 3AGJ were designed, including versions linked to immunomodulators and multimers of the immunogen. Display on the surface of the bacteria was evaluated by flow cytometry using the broadly neutralizing monoclonal antibody 2F5. Outbred HET3 mice were vaccinated intramuscularly, MPER-specific an-tibody responses were assessed by ELISA, and the ability of the vaccines to induce neutralizing antibodies determined. Neutralization was measured against tier 1 and tier 2 HIV-1 pseudoviruses. Results: All five vaccines were strongly expressed on the bacterial surface and induced clear MPER-specific antibody responses in every mouse. About 33% of the animals showed detectable HIV-1 neutralization. Conclusion: A KWC/GRB 3AGJ scaffold-MPER vaccine can induce HIV-1 neutralizing antibodies. While improvements in the responses would be needed for a clinically useful vaccine, the findings provide an initial validation of the concept. There are many strategies that can be used to enhance and extend immune responses induced by KWC/GRB vaccines that can be employed to yield improved anti-HIV immune responses.
Keywords:
autotransporter
; genome-reduced bacteria
; HIV-1 neutralization
; HIV-1 vaccine
; killed whole-cell
; MPER
; surface-antigen display
; vaccine engineering
; vaccine platform
1. Introduction
Vaccination remains an effective and economical public-health intervention, drastically reducing the global burden of infectious diseases [1,2,3]. There is an urgent need for vaccine technologies that are fast, flexible, and easy and inexpensive to produce. Current mRNA, viral-vectored, and protein-subunit platforms—although efficacious—depend on costly reagents and complex bioprocessing, and have cold-chain requirements that limit equitable access, particularly in low- and middle-income regions [4,5,6,7,8]. More economical viral-vectored vaccines may, on the other hand, have limited use for developing vaccines against many pathogens due to anti-vector immunity. An ideal vaccine platform should combine low production cost, rapid adaptability, distribution-friendliness, and scalable manufacturing while maintaining potency and safety. Despite impressive progress, most existing systems face technical challenges in targeting immunogens that are small, hydrophobic, immune-subdominant, or conformationally sensitive, hampering the development of vaccines against difficult viral targets [9,10,11,12,13,14,15,16,17]. Overcoming these barriers is essential for a widely applicable, rapidly deployable vaccine technology.
An effective HIV-1 vaccine must elicit potent humoral responses capable of neutralizing a broad range of viral strains in serum and mucosal compartments [18,19,20,21]. A fraction of chronically infected individuals develop broadly neutralizing antibodies (bNAbs), from which monoclonal bnAbs (bNMAbs) have been cloned and characterized [19,22,23,24,25]. Binding sites of those bNMAbs have been determined and revealed several vulnerable sites and states of the HIV-1 envelop glycoprotein [26,27]. An immunogen that mimics the binding site of a bNMAb can potentially engage naïve B cells and initiate the development of the bnAb lineage. A key goal of HIV vaccine design is to engineer immunogens that elicit bnMAb-like responses [28,29]. Among the conserved viral epitopes recognized by bnMAbs, the membrane-proximal external region (MPER) of gp41 is targeted by bNMAbs 2F5, 4E10, and 10E8 and others, and the fusion peptide (FP), targeted by bNMAbs VRC34.01 [23,24,30,31] and ACS202 [32]. Both MPER and FP are relatively short, linear peptide sequences that make attractive engineering targets, but their structures and physico-chemical characteristics pose challenges for immunogen design [30,33,34]. A problem for vaccine antigen design is that pathogens have evolved so as to elicit immune responses against immunodominant virion features that readily undergo mutation, while highly conserved features that are the targets of antibodies with broadly neutralizing activity, like FP and MPER tend to be immuno-subdominant [35,36,37,38].
Anti-MPER antibodies are consistently detected in sera with broad neutralizing activity and correlate with increased potency and breadth [33,34]. However, early synthetic-peptide vaccines failed, likely because isolated MPER lacked the correct tertiary structure [39,40]. Subsequent strategies such as liposomal encapsulation, nanoparticle, or scaffold-based immunogens achieved only limited neutralization breadth [29,41]. Scaffolded MPER immunogens, computationally designed to mimic native MPER immunogen bNMAb targets, can bind bNMAbs, but remain difficult to produce. Expression of MPER-scaffolded proteins in mammalian cells is inefficient and bacterial, yeast, and Pichia expression can yield insoluble aggregates and inclusion bodies, complicating purification and scaled production [42,43]. Furthermore, MPER-directed bNMAbs such as 2F5 have long, hydrophobic CDR H3 loops that interact with lipid membranes; these interactions, while dispensable for epitope recognition, are important for high-affinity binding, breadth, and neutralization potency [22,25,44]. These findings suggest that it should be helpful if MPER-targeted vaccine immunogens were presented adjacent to a lipid bilayer to mimic the immunogens that exist in intact virions.
Killed whole cell bacterial vaccines or bacterins have been used from more than 100 years. There are many currently approved KWC vaccines used both for humans and in agriculture, for example the WHO-preapproved KWC oral cholera vaccines and currently marketed KWC E. coli vaccines for bovine mastitis [45,46,47]. We developed a new vaccine platform that constitutes a contemporary, synthetic biology enabled, structural biology-informed update to the earlier KWC vaccine concept: Killed Whole-Cell Genome-Reduced Bacteria (KWC/GRB). In the KWC/GRB platform recombinant immunogens, expressed under the control of an inducible promoter, are placed on the surface of Gram-negative bacteria, along with immunomodulators. With the KWC/GRB platform we use additional strategies to enhance immunogenicity, for example expressing multimeric versions of the immunogens separated by larger linkers. Genome reduction removes nonessential surface proteins, enhancing antigen visibility. Recombinant immunogens are displayed on the bacterial outer membrane using a Gram-negative autotransporters (ATs) secretion system that export a passenger protein into the extracellular space through the pore of the AT C-terminal β-barrel domain present in the outer membrane. so that passenger protein emerges on the cell surface. Substituting native passenger with sequence encoding a vaccine antigen can yield bacteria that display ~2 × 10⁵ recombinant antigen copies per cell,[48,49,50,51,52,53,54,55]. Producing a KWC/GRB vaccine then just involves growing the GRB transformed with the expression plasmid, inducing expression of the recombinant surface-expressed immunogen and inactivation of the bacteria.
The E. coli AIDA-I AT is a monomeric autotransporter that can display a wide variety of recombinant proteins at high density and has been shown to function in genome-reduced strains [52]. By fusing engineered antigens to AIDA-I, the KWC/GRB system can place surface displayed immunogens in close proximity to a lipid bilayer—a configuration suited for epitopes like MPER, since some potent neutralizing bNMAbs interact with the lipid bilayer in addition to sites on the MPER peptide itself [56].
The first demonstration of the KWC/GRB platform was described in Maeda et al. [56]. KWC/GRB vaccines expressing either a Porcine Epidemic Diarrhea Virus (PEDV) FP or a SARS-CoV-2 FP protected pigs against clinical disease after challenge with infectious PEDV. Building on that work, Quintero et al. [57] introduced a Design–Build–Test–Learn (DBTL) workflow using the HIV-1 fusion peptide (FP) as a model antigen. In that study, FP multimerization, long, rigid α-helical linkers ([AQQASSS]×3), and short immunomodulatory sequences (PADRE, a non-cognate T-cell agonist [57,58], and a derivative of Salmonella flagellin (FLIC), a TLR-5 agonist [59,60,61,62], or the Group B streptococcus surface immunogenic protein (rSIP), a TLR-2 and -4 agonist [63]) were added to improve immunogenicity. We used multimerization to increase the amount of immunogen and because we hypothesized that providing multimeric versions of the immunogen would enable an increase in B-cell precursor B-cell receptor avidity, since the overall binding constant would be the product of the individual binding constants and multiple antigen-B-cell receptor binding events would produce multiple signal transduction events to initiate differentiation and antibody maturation. Particularly for HIV, B-cell precursors for some of the most desirable Abs appear to have very low affinity B-cell receptors for the HIV antigens. The α-helical linker also helps maintain the FP units in a more extended shape that antibodies can access. Combining several of these immunogen engineering strategies increased the ability of the immunogens to induce antibodies, as assessed by ELISA AUC values, by about 8-fold over a single FP immunogen. Unfortunately, the induced antibodies did not neutralize HIV, probably because the FP sequence was not expressed in a native conformation. However, the study established strategies that can be used to engineer KWC/GRB vaccines with substantially increased immunogenicity. If the antigen expressed using the KWC/GRB platform is stabilized in a biologically correct conformation, vaccines made using the platform should elicit a neutralizing immune response.
In this work, we used an MPER-derived scaffolded antigen, 3AGJ, designed to provide a stable structure closely resembling the binding sites of multiple bNMAbs [11]. The 3AGJ design preserves the continuous α-helical segment encompassing the epitope and embeds it within a compact framework that limits hydrophobic collapse [9,10]. Prior studies demonstrated that 3AGJ-based immunogens preserve bNMAb-recognition surfaces and are also bound by the very high affinity 10E8 class antibodies in recombinant proteins and on nanoparticles [11,64]. Making a candidate HIV vaccine by using 3AGJ in the KWC/GRB platform and the AIDA-I AT expression cassette enables the expression of the structurally rigid 3AGJ recombinant antigen on the surface of bacteria, adjacent to a membrane, and recreates the lipid bilayer-adjacent environment required for maximal MPER binding by some bNAbs.
Here we describe five different 3AGJ scaffold-derived KWC/GRB vaccine candidates All five vaccines showed high-affinity binding by the bNMAb 2F5 in flow cytometry studies, confirming proper antigen folding and exposure. Mice (n = 5 per group) immunized intramuscularly with each vaccine developed anti-MPER IgG responses detectable by ELISA, inducing the production of anti-3AGJ antibodies. Sera from at least one mouse in every group exhibited measurable ID50 neutralization against tier-1 HIV-1 pseudovirus, and several groups contained multiple animals showed neutralization across more than one pseudovirus. These outcomes provide functional evidence that the KWC/GRB platform can elicit neutralizing activity when coupled with structurally stabilized, membrane-anchored scaffolded MPER immunogens.
The findings provide a proof-of-principle for the KWC/GRB platform, showing that with the right expressed antigen, it can induce a neutralizing antibody response. The results confirm that KWC/GRB vaccines can display conformationally sensitive epitopes and induce specific antibodies that yield detectable neutralization in vivo. These initial candidate vaccines can then be used in combination with other vaccines and improved vaccination strategies to develop even more immunogenic vaccines.
2. Materials and Methods
2.1. Vaccines Design
Five vaccine candidates were designed, informed by the immunogenicity enhancement strategies we recently established [57]. All candidates encoded the HIV-1 MPER region-derived scaffold 3AGJ (gp41 residues 659–683) incorporated within the scaffold [11]. Each vaccine included an N-terminal 3DA (DADADA) motif, which improves surface display [57] and to inhibit the expressed protein from burying itself into the outer membrane lipid bilayer. To modulate immune activation, several vaccines incorporated immunomodulatory sequences, including Flagellin from Salmonella enterica (FLIC—TLR5 agonist fragment) [59,60,61,62,65], Pan DR Epitope non-cognate T-cell antigen (PADRE—universal CD4+ T-helper epitope) [57,58], Group B streptococcal surface immunogenic protein (rSIP—TLR4 antagonist) [63] and OX40L (T-cell co-stimulation) [66].
Three linker designs were used to control spatial separation between domains: L1 (GSGSGSGS) [47], L2 ((AQQASSS)ₓ3) [48], a long, rigid alpha helix structure with a length exceeding that of the typical size of B-cell receptor, and L3 ((EAAAK)4–L–(EAAAK)4) [67,68,69]. Linker L1 was used to separate adjacent immunomodulatory sequences, L2 to separate repeated 3AGJ units, and L3 to connect the immunomodulator and antigen domains. These designs were informed by our previous work [57].
2.2. 3D Structure Prediction
After developing each vaccine design, AlphaFold2 v2.3.0 [70] was used to generate predicted tertiary structures for the 3AGJ scaffold designs. For multimeric versions, the repeated 3AGJ–linker units were modeled as a single continuous polypeptide chain. Five independent AlphaFold2 runs were performed per vaccine with template search enabled. The highest-confidence model, as determined by pLDDT and pTM scores, was visualized in ChimeraX for figure generation [71,72,73]. Models were used qualitatively to guide vaccine design and assess spatial orientation of linkers and immunomodulators; no quantitative structural restraints were inferred. The AIDA-I autotransporter domain used for surface anchoring corresponded to residues Q962–F1286 from UniProt entry Q03155.
2.3. Plasmid Construction
All DNAs encoding the immunogens were commercially synthesized (Twist Bioscience, South San Francisco, CA, USA), inserted into the pRAIDA2 (GenBank accession number MW383928) expression vector and sequence verified. This plasmid includes a rhamnose-inducible promoter, a high-copy origin of replication, a kanamycin resistance gene, and an AIDA-I autotransporter cassette that enables surface display of recombinant proteins.
2.4. Bacterial Strain and Transformation
The genome-reduced Escherichia coli strain ME5125 (harboring a 29.7% genomic deletion) was obtained from Dr. Jun Kato (Tokyo Metropolitan University, Japan) through the National Bioresource Project [74,75]. The strain originates from E. coli MG1655 and was routinely cultured in LB broth or on LB agar at 37 °C. Following transformation with the pRAIDA2-based expression constructs, cultures were maintained in media supplemented with kanamycin (50 µg/mL) for plasmid selection.
To generate electrocompetent cells, ME5125 cultures were grown overnight at 37 °C, diluted 1:100 into fresh LB medium, and incubated until reaching logarithmic growth as determined by OD600 monitoring. Cells were washed sequentially ice-cold distilled water and water containing 10% glycerol, resuspended in water–10% glycerol, and electroporated with the recombinant pRAIDA2 plasmids with the MPER (3AGJ scaffold)-derived sequences using 0.1 cm cuvettes and a Gene Pulser Xcell™ (Bio-Rad) at 1.8 kV, 25 µF, 200 Ω. After electroporation, cells were recovered for 1 h at 37 °C in SOC medium, then plated on LB agar with kanamycin for colony selection.
2.5. Colony PCR Verification
To verify successful transformation, three to five kanamycin-resistant colonies from each design were screened by colony PCR. A sterile pipette tip was used to gently touch each colony, which was then transferred into 5 mL of LB broth containing kanamycin (50 µg/mL) to initiate an overnight starter culture. The same tip was subsequently dipped into a 16 µL reaction mixture prepared with Phusion Flash High-Fidelity Master Mix (Thermo Fisher Scientific) and the primer pair pRAIDA forward (5′-CAGCATATGCACATGGAACA-3′) and pRAIDA reverse (5′-CATAACTTCCGTTCTCCGGT-3′). PCR cycling conditions were: 95 °C for 2 min, followed by 35 cycles of 95 °C for 45 s, 58 °C for 45 s, and 72 °C for 1 min 20 s, with a final extension at 72 °C for 5 min. Amplicons were resolved on 1.5% agarose/TAE gels and visualized under UV illumination. Colonies yielding amplicons of the expected size were retained for subsequent expression and immunization studies. The corresponding 5 mL LB starter cultures were expanded overnight to generate the inoculum for vaccine production. In parallel, an aliquot of each verified culture was mixed 1:1 with sterile 30% glycerol (final 15%) and stored at −80 °C as a long-term master stock.
2.6. Vaccine Production
Overnight cultures were prepared in LB broth supplemented with kanamycin (50 µg/mL) and incubated at 37 °C with shaking (210 rpm). The following day, each culture was diluted 1:10 in fresh LB medium and grown until reaching an OD600 of 0.5–0.6, at which point expression was induced with 5 mM L-rhamnose for 2 h at 37 °C. Cells were then collected by centrifugation (5,000 × g, 20 min, 4 °C), resuspended in Hank’s Balanced Salt Solution (HBSS) containing 0.2% formalin, and chemically inactivated for 1 h at 37 °C with gentle agitation. Following inactivation, bacterial pellets were washed twice with 1× PBS to remove residual formalin. Final vaccine preparations were resuspended in PBS containing 20% glycerol to an OD600 of 1.0 (corresponding to approximately 8 × 10⁸ bacteria/mL), aliquoted into sterile cryovials, and stored at −80 °C until use.
2.7. Post-Inactivation Testing
Each vaccine batch was evaluated for sterility immediately following the final PBS wash. Triplicate 100-µL aliquots of each preparation were serially diluted 10-fold (100–10−4) and spread onto LB agar plates, which were incubated at 37 °C for 7 days (detection limit: 0.2 CFU mL−1). In parallel, a 1-mL sample from each batch was inoculated into 10 mL of LB broth and incubated statically at 37 °C for 14 days. No colony formation or turbidity was observed in any sample, confirming complete bacterial inactivation across all vaccine lots.
2.8. Flow Cytometry
Formalin-inactivated bacterial suspensions (5 × 10⁷ cells/mL) were blocked in PBS containing 10% fetal bovine serum (FBS) for 30 min on ice. After a wash step with PBS supplemented with 2% FBS, samples were incubated with 2 µg/mL of the anti-HIV-1 MPER monoclonal antibody 2F5 for 30 min on ice. Cells were then washed and stained with Alexa Fluor 488-conjugated goat anti-human IgG (1:600; Invitrogen) for an additional 30 min on ice. Data acquisition was performed using an Attune CytPix Flow Cytometer (Invitrogen), and analyses were conducted with FCS Express 7 software (De Novo Software). Gating was based on forward- and side-scatter profiles, and percentage binding was quantified relative to unstained bacterial controls. Experimental controls included untransformed ME5125 bacteria processed in parallel to determine background fluorescence, a PBS blank to monitor instrument baseline, an isotype control antibody to assess nonspecific binding, and a secondary-only control to measure autofluorescence. All flow cytometry experiments were conducted at the University of Virginia Flow Cytometry Core Facility.
2.9. Mouse Immunization
Outbred HET3 mice (Jackson Laboratory genetic stock; F1[CByB6F1 × B6C3F1], catalog #036603) were obtained at 6 weeks of age and acclimated for at least 7 days under specific-pathogen-free (SPF) conditions (12 h light/dark cycle, with feed and water provided ad libitum). Animals were block-allocated into five experimental groups corresponding to the five vaccine candidates, plus two control groups receiving either PBS or formalin-inactivated untransformed ME5125, with five mice per group (three females and two males). Immunizations were administered intramuscularly in the quadriceps at weeks 0 (prime), 3, 6, 9, and 12 using 5 × 10⁹ inactivated bacteria suspended in 50 µL PBS per dose. Blood samples were collected by submandibular bleed prior to the first vaccination (pre-immune, week 0) and at weeks 3, 6, 9, and 12. At week 15, terminal cardiac exsanguination was performed under deep surgical anesthesia induced by intraperitoneal injection of ketamine (100 mg/kg) and xylazine (10 mg/kg). Plasma was isolated by centrifugation (10,000 × g, 10 min) and stored at −80 °C until analysis. Mice were weighed weekly and monitored after each immunization for signs of local reactogenicity (erythema, swelling) and systemic effects (ruffled fur, lethargy). No unexpected adverse events or significant differences in behavior were observed during the study.
2.10. Enzyme-Linked Immunosorbent Assay (ELISA)
High-binding 96-well plates (Thermo Fisher) were coated overnight at 4 °C with recombinant HIV-1 MPER peptide (sequence: 656-NEQELLELDKWASLWNWFDITNWLWYIK-683; Biomatik) at a concentration of 1 µg/mL in PBS (pH 7.4). Plates were washed three times with TBST (TBS containing 0.05% Tween-20) and blocked for 1 h at room temperature with 3% BSA in TBST. Mouse plasma samples were serially diluted 1:50 to 1:102,400 in 1% BSA/TBST using a 4-fold dilution series, and each dilution was added to the plate in duplicate. After 1 h incubation at room temperature, plates were washed and bound IgG was detected using HRP-conjugated goat anti-mouse IgG (Thermo Fisher; 1:5,000) for 1 h, followed by TMB substrate development. Reactions were stopped with 1 N H2SO4, and absorbance was measured at 450 nm. Each assay included an 8-point standard curve of the 2F5 monoclonal antibody (starting at 1 µg/mL, 3-fold serial dilutions) to verify assay performance and to calculate relative antibody units (RAU) using a 4-parameter logistic regression fit. Negative controls included blank wells (no antigen), secondary-only wells, a pre-immune serum pool, and sera from mice immunized with untransformed ME5125 bacteria prepared in the same way as the vaccines.
2.11. Neutralization Assays
Neutralization assays were performed at Duke University using HIV-1 Env pseudoviruses [76] (25710-2.43, CNE55, MN.3, and X1632_S2_B10) and TZM-bl cells [77,78], following standard operating. Mouse plasma samples were heat-inactivated (56 °C, 15 min) and serially diluted in cell culture medium. The diluted plasma was incubated with pseudovirus for 1 h at 37 °C, then added to TZM-bl cells. After approximately 48 h, luciferase activity was measured. ID50 and ID80 titers were defined as the reciprocal serum dilutions at which relative luminescence units (RLUs) were reduced by 50% or 80%, respectively, compared to virus control wells after subtraction of background RLUs from cells controls. Samples that did not reach 50% inhibition within the tested dilution range were reported as ID50 < lowest dilution tested. Virus-specific assay positivity ID50 cutoffs were determined as the 90th percentile of ID50 titers of all baseline mouse plasma samples.
The HIV-1 pseudovirus panel included MN.3 (tier 1A), and the tier 2 viruses 25710-2.43, CNE55 and X1632_S2_B10. Thus, three of the four strains correspond to difficult-to-neutralize tier-2 viruses, offering a stringent and representative panel for evaluating neutralization breadth.
2.12. Statistical Analysis
All statistical analyses were performed in R v4.4.1 using the packages tidyverse, ggplot2, psych, corrplot, FactoMineR, factoextra, AER, lmtest, car, broom, and pROC. The full analysis workflow, including preprocessing, model fitting, and visualization steps, was implemented using custom R scripts developed by the authors with assistance from ChatGPT (OpenAI, GPT-5 model), and the complete annotated code is provided in Supplementary File 1. ELISA titration curves were fitted using a four-parameter logistic model to compute AUC(ELISA). Flow-cytometry titration curves for 2F5 were modeled using nonlinear least-squares regression to estimate EC50 values, which were transformed to the exposure_score (−log10EC50). The integrated flow-cytometry signal, AUC(FLOW), was calculated as the area under the fluorescence–antibody concentration curve. Neutralization titers below the detection limit (<45) were set to the cutoff prior to log10 transformation. All datasets (ELISA, flow cytometry, neutralization) were merged by animal ID and immunization week to generate a unified matrix for analysis.
Associations between antigen display (exposure_score and AUC(FLOW)) and antibody magnitude (AUC(ELISA)) were assessed using both Pearson and Spearman correlations to capture linear and rank-based relationships. Statistical significance was evaluated using Benjamini–Hochberg false discovery rate (FDR) correction, and 95% confidence intervals were obtained from bootstrapped standard errors. Neutralization data were analyzed per pseudovirus and also as a composite neutralization index calculated as the mean log10ID50 across all viruses tested.
To determine whether antigen display or antibody magnitude predicted neutralization potency, linear regression models were fitted; because ID50 values include left-censored data at the assay detection limit, censored-normal (Tobit) regression was also conducted using the AER package. Model assumptions were verified through standardized residuals, Q–Q plots, and variance inflation factors. Multivariate relationships among assays were examined using principal component analysis (PCA) on z-scored variables (exposure_score, AUC(FLOW), AUC(ELISA), and mean log10ID50). Hierarchical clustering with Euclidean distance and complete linkage was used to visualize the modular organization of display, binding, and neutralization variables.
Responder analyses quantified the proportion of animals achieving ID50 titers at or above predefined thresholds for each pseudovirus. Paired week-0 and week-15 neutralization values were also compared to confirming acquisition of functional activity during immunization. Unless otherwise noted, data are presented as mean ± SEM, and statistical significance was defined as p < 0.05 after FDR adjustment.
2.13. Ethics, Animal Welfare, and Biosafety
All animal procedures were conducted in accordance with the Guide for the Care and Use of Laboratory Animals and were approved by the University of Virginia Animal Care and Use Committee (protocol 41101224; approval date: 05 November 2024; Unique ID: 7018391). Recombinant DNA work and handling of formalin-inactivated E. coli vaccine lots were performed under BSL-2 conditions approved by the UVA Institutional Biosafety Committee (IBC protocol 4276-15). The study complied with ARRIVE reporting guidelines where applicable.
3. Results
3.1. Scaffold-MPER KWC/GRB Vaccine Design
We used strategies previously determined to enhance the immunogenicity of recombinant vaccine immunogens to design immunogens based on the MPER scaffold 3AGJ protein in the KWC/GRB platform. These included expressing multimer versions of 3AGJ, separated by a long, rigid alpha helical linker, with added immunomodulators, including the PADRE non-cognate T-cell agonist, and sequences that function as TLR agonists, and a T-cell co-stimulatory molecule (Table 1).
The 3AGJ component of the vaccines was originally designed as an MPER scaffold to present bNMAbs 10E8/4E10 binding site and is also recognized by bNMAb 2F5. The resulting Scaffold-MPER immunogen designs comprised five candidates (V1–V5) that incorporated immunomodulatory elements (PADRE, FLIC, rSIP, OX40L) and either a single 3AGJ or multimers of 3AGJ (Table 1 and Table 2). Each design represented selected design features.
3.2. Structural Modeling and Predicted Architecture
Predicted tertiary structures generated with AlphaFold2 (v2.3.0) showed that all designs were likely to fold correctly and that the addition of the immunomodulators and other features were unlikely to disrupt the basic structure of the 3AGJ domain (Figure 1a–e). The models had high confidence scores (pLDDT and pTM > 85%). They also retained the main structural features of 3AGJ, including the central helix and the surrounding elements that stabilize the MPER region in its antibody-bound shape. AlphaFold2 does not account for the bacterial outer membrane, so any predicted orientation in which the antigen bends downward toward the β-barrel would not occur in vivo because that space is blocked by the membrane lipid bilayer. These structures should therefore be interpreted as folding predictions, considering the current limitations of the modeling software.
V1 represented the minimal configuration. It contained 3DA linked directly to 3AGJ scaffold, without any additional immunomodulators (Figure 1a). V2 added the PADRE sequence upstream of 3AGJ through the flexible GS×4 linker, which extended the 3AGJ region outward (Figure 1b). V3 included PADRE followed by the short FLIC segment, resulting in a slightly longer arrangement (Figure 1c). V4 and V5 contained two copies of 3AGJ. These domains were separated by the longer semi-rigid alpha helical AQQASSS×3 linker and were combined with additional immunomodulators. V4 included rSIP and a short FLIC, while V5 also included OX40L (Figure 1d–e). In the AlphaFold2 predictions, the two linked 3AGJ units remained parallel and remained separated from each other, and all immunomodulators were positioned in solvent-exposed regions.
Taken together, these in silico predictions support the concept that the strategy produced stable designs with the 3AGJ components arranged in what could be anticipated to be exposed on the surfaces of the outer membranes of the GRB, appropriate for the production of KWC/GRB vaccines.
3.3. Surface Expression and bNAb 2F5 Recognition
Surface expression of the MPER epitope was assessed by flow cytometry using the bNAb 2F5 [22]. All five vaccines showed strong, concentration-dependent binding (Figure 2). Untransformed ME5125 bacteria showed minimal binding, as expected.
Quantitatively, the binding curves for all vaccine designs approached saturation at high antibody concentrations, indicating uniform surface accessibility. However, left-shifted dose–response curves were observed for V4 and V5 compared to V1, V2, and V3, consistent with higher apparent affinity and the fact the V4 and V5 both had two 3AGJ epitopes in each expressed immunogen. V1 and V3 showed intermediate profiles, while V2 required the highest 2F5 concentrations to reach plateau levels. The resulting rank order of apparent binding strength was V4 ≳ V5 > V1 ≈ V3 > V2.
These results demonstrate that 3AGJ was efficiently expressed and properly folded across all vaccines, and that increased modular complexity (addition of rSIP, FLIC, and OX40L together with duplicated 3AGJ) correlated with enhanced 2F5 recognition—an early indicator of preserved MPER antigenicity.
3.4. Induction of MPER-Specific Antibodies (ELISA)
To assess the humoral immunogenicity of the scaffold-MPER 3AGJ vaccines, outbred HET3 mice were vaccinated intramuscularly at weeks 0, 3, 6, 9, and 12 with 5 × 10⁹ formalin-inactivated bacteria (Figure 3a). Plasma samples collected at each time point were evaluated by ELISA using a synthetic MPER peptide corresponding to gp41 residues 659–683 [79].
All vaccinated groups (V1–V5) displayed progressive increases in anti-MPER peptide IgG induction throughout the 15-week schedule (Figure 3b). Mean AUC(ELISA) values rose significantly after week 6, after a prime plus one booster vaccine dose, reaching plateau levels between weeks 12 and 15, suggesting that 3 doses of the vaccine were sufficient to induce a maximal response. Mice vaccinated with the negative control vaccine made from untransformed ME5125 produced no anti-MPER peptide antibodies. The magnitude of antibody induction paralleled immunogen valence: V4 and V5 (both containing duplicated 3AGJ units) achieved the highest endpoint titers, followed by V3 (single 3AGJ with extended linkers), whereas V1 and V2 elicited lower but clearly detectable responses.
Individual animal data confirmed consistent seroconversion across nearly all vaccinated mice (n = 5 per group; n = 4 for V4) with limited inter-animal variability. Notably, animals vaccinated with V4 and V5 vaccines maintained the strongest and most sustained induction of antibodies against MPER peptide, suggesting that duplication of 3AGJ yielded improved induction of antibodies, consistent with our experience with the FP [57].
Collectively, these results demonstrate that all 3AGJ vaccines were immunogenic and capable of eliciting durable, antigen-specific humoral responses, with the multimeric scaffold-MPER 3AGJ designs yielding the most potent anti-MPER IgG activity.
3.5. Neutralizing Activity Against HIV-1 Pseudoviruses
Neutralizing antibody responses were assessed using a panel of HIV-1 Env pseudoviruses that span different levels of neutralization sensitivity. The panel included MN.3 (tier 1A), 25710-2.43 (tier 1B), and the tier 2 viruses CNE55 and X1632_S2_B10. Among these 4 viruses only MN.3 matches to the vaccine MPER sequence in the corresponding region. Plasma samples collected at weeks 0 and 15 were evaluated in pseudovirus-based TZM-bl assays to assess neutralizing activity in plasma. All week 0 samples were below the assay detection thresholds, confirming the absence of pre-existing neutralizing activity.
At week 15, neutralizing activity above predefined cutoffs was detected in a subset of vaccinated animals (Figure 4). Overall, eight of the 24 vaccinated mice (approximately 33%) showed neutralizing activity against at least one pseudovirus. Neutralization was most frequently observed against the tier 2 virus 25710-2.43, followed by MN.3 (Tier 1) and CNE55 (Tier 2), whereas no neutralization was detected against the tier 2 virus X1632_S2_B10. These responses were sporadic and heterogeneous across vaccine constructs, with individual mice exhibiting variable magnitudes of neutralization across viruses.
To determine whether antigen multimerization influenced the likelihood or quality of neutralizing responses, animals were grouped according to vaccine class, with V1–V3 classified as monomeric and V4–V5 as multimeric constructs. When neutralization was considered as a binary outcome, defined as exceeding the virus-specific ID50 cutoff for at least one pseudovirus, a higher proportion of neutralizing mice was observed in the multimeric group compared with the monomeric group. However, this difference did not reach statistical significance by Fisher’s exact test (p = 0.41).
We next compared the magnitude of neutralizing responses between monomeric and multimeric vaccine classes using the log10ID50 values per animal across neutralized viruses. Although multimeric vaccines showed a trend toward higher neutralization titers, this difference was not statistically significant (Wilcoxon rank-sum test, p = 0.55). These results indicate that multimerization alone did not produce a clear increase in neutralization potency at the cohort level.
To further assess neutralization breadth, defined as the number of pseudoviruses neutralized by each animal, we compared breadth distributions between monomeric and multimeric vaccine classes. Broad neutralization was observed in both classes, with a small number of animals in each group neutralizing more than one virus. Overall, the breadth distributions overlapped substantially, and no statistically significant difference between monomeric and multimeric vaccines was detected (Wilcoxon rank-sum test, p = 0.59).
Taken together, these analyses show that neutralizing activity was detected in a subset of animals vaccinated with scaffolded MPER immunogens delivered by the KWC/GRB platform. Neutralization-positive mice were observed in both monomeric and multimeric vaccine groups. Comparisons between vaccine classes revealed no statistically significant differences in the proportion of neutralizing animals, neutralization magnitude, or neutralization breadth. These results indicate that, within the conditions tested, neutralizing responses occurred at low frequency and with substantial inter-animal variability, without a clear separation between monomeric and multimeric vaccine designs.
3.6. Cross-Assay Correlations Between Antigen Exposure and Humoral Response
To quantitatively compare humoral and surface-display readouts, a composite dataset was assembled combining individual ELISA and flow cytometry measurements from all vaccinated mice (V1–V5) across weeks 3, 6, 9, 12, and 15. For each animal and time point, the dataset included the area under the ELISA curve (AUC(ELISA)), representing the magnitude of anti-MPER IgG binding, together with two flow-derived parameters: (i) the exposure_score (−log10EC50_FLOW), calculated from the fitted binding curves of bnAb 2F5 titration, and (ii) the integrated fluorescence intensity (AUC(FLOW)), obtained from the cumulative signal across the full antibody concentration range. This structure enabled direct point-by-point comparisons between surface antigen accessibility and antibody response within and across vaccine candidates (Table 3).
Correlation analyses were performed for each vaccination week using both Pearson’s and Spearman’s coefficients. At week 3, a significant positive correlation was detected between AUC(ELISA) and exposure_score (r = 0.57, p = 0.0039) as well as AUC(FLOW) (r = 0.43, p = 0.036), indicating that animals receiving vaccines with higher surface exposure exhibited stronger antibody responses at early time points (Figure 5 and Figure 6).
This biphasic trend—strong correlation at priming (week 3) and again after the final immunization (week 15), with weak association during the intermediate weeks—was consistently observed across both flow metrics (Figure 7). The high correlation at week 3 likely reflects the early phase of the response, when most mice had low antibody levels and small variations in antigen exposure produced proportionally similar differences in ELISA titers. After the last dose, surface exposure again influenced antibody levels, whereas the intermediate weeks appear to be driven by other immunological processes that weaken the relationship between display and antibody output.
Spearman’s rank analysis showed the same overall pattern as the Pearson tests, with significant correlations at the same time points (Supplementary Table S1). The two flow-cytometry measures (−log10EC50_FLOW and AUC(FLOW)) produced almost identical Spearman values, which is expected because both measurements reflect how much 3AGJ is displayed on the bacterial surface. These results support the conclusion that higher antigen exposure is associated with stronger antibody responses during the early and late phases of immunization.
3.7. Relationship Between Surface Antigen Display and Neutralizing Activity Induction
To determine whether 3AGJ immunogen surface exposure influenced the generation of neutralizing antibodies, flow cytometry readouts were compared with pseudovirus neutralization titers (ID50) for each animal. Analyses were performed separately for the four tested HIV-1 strains (25710-2.43, CNE55, MN.3, X1632_S2_B10) and on a composite neutralization index (log10ID50 per mouse).
Across individual pseudoviruses, neither the exposure_score (−log10 EC50_FLOW) nor AUC(FLOW) showed significant linear correlations with ID50 titers (|r| < 0.25, p > 0.2). When neutralization data were aggregated into a composite index, correlations remained non-significant (exposure: r = −0.021, p = 0.923; AUC(FLOW): r = −0.033, p = 0.879). Nonetheless, most animals displaying measurable neutralization belonged to vaccines with the highest surface exposure (V4 and V5), suggesting that efficient antigen presentation is necessary but not sufficient for functional activity. The absence of a continuous linear trend suggests that neutralization arises once a structural or immunological threshold is reached rather than increasing proportionally with antigen abundance.
3.8. Relationship Between MPER-Specific Antibody Binding and Neutralization
To evaluate whether the magnitude of the MPER-specific humoral response was associated with HIV-1 neutralizing activity, ELISA binding responses were compared with neutralization outcomes measured at week 15. Antibody binding was quantified as AUC values obtained from MPER peptide ELISAs, and neutralization was assessed using per-virus and composite ID50 readouts.
We first examined the global relationship between MPER-specific antibody binding and neutralization magnitude using correlation analyses. Across individual pseudoviruses, no significant associations were detected between AUC(ELISA) and log10ID50 values using either Pearson or Spearman correlation analyses. Similarly, when neutralization was summarized per animal using the log10ID50 across neutralized viruses, no significant correlation with AUC(ELISA) was observed at the cohort level. These results indicate that higher MPER-binding antibody levels did not correspond to increased neutralization titers.
Because neutralization responses were heterogeneous across vaccine candidates, we next evaluated the relationship between ELISA binding and neutralization at the vaccine level. Correlation analyses performed separately for each construct did not reveal consistent associations between AUC(ELISA) and neutralization titers for any pseudovirus. Apparent correlations observed in individual vaccine groups were not robust and were driven by small numbers of animals, without reproducible patterns across vaccines.
To further explore whether ELISA binding distinguished animals with functional activity, mice were classified according to neutralization outcome. AUC(ELISA) values were compared between neutralizing and non-neutralizing animals using a Wilcoxon rank-sum test. The distributions overlapped substantially, and no statistically significant difference in MPER-binding antibody magnitude was detected between the two groups. Neutralizing activity was therefore observed in animals spanning a wide range of ELISA responses, including mice with relatively modest binding titers.
Finally, we assessed whether ELISA binding magnitude was associated with neutralization breadth, defined as the number of pseudoviruses neutralized per animal. Spearman correlation analysis showed no significant association between AUC(ELISA) and neutralization breadth. Animals that neutralized multiple viruses did not exhibit systematically higher ELISA AUC values than those that neutralized none or a single virus.
Taken together, these analyses consistently demonstrate that MPER-specific antibody binding magnitude, as measured by ELISA, did not predict the presence, magnitude, or breadth of HIV-1 neutralization in this study. Neutralizing responses emerged in a subset of animals independently of overall binding titers, indicating that ELISA-based measures of antibody quantity alone were insufficient to distinguish neutralizing from non-neutralizing responses, implying that the vaccines were inducing qualitatively different immune responses in the different mice.
3.9. Integrated Multivariate Modeling of Display, Binding, and Neutralization
To examine how antigen display, antibody binding, and neutralization relate to one another, we performed a principal component analysis (PCA) using three variables: exposure_score (flow cytometry), AUC(ELISA), and log10ID50. The first two components explained 78.6% of the total variance (Figure 8a), and their loadings are shown in Figure 8b. PC1 was driven mainly by exposure_score and AUC(ELISA) (loadings 0.79 and 0.83), indicating that this component represents how much antigen is displayed and how strongly animals made MPER-specific antibodies. PC2 was dominated by log10ID50 (loading 0.91), meaning it primarily captured neutralizing activity.
Animals 4. and V5, the vaccines that included two 3AGJ repeats, tended to cluster in the upper-right region of the PCA plot, where both antibody production and neutralization scores are higher. Animals vaccinated with V1–V3 generally clustered near the center of the plot, consistent with lower responses in both measurements. However, when we built a regression model to test whether exposure_score and AUC(ELISA) could jointly predict neutralization (mean log10ID50), the model explained only ~4.5% of the variance (p = 0.238). This confirms that neutralization cannot be reliably predicted from antigen display or binding strength alone, at least for the 3AGJ immunogen.
Overall, the PCA supports a simple interpretation: vaccines that display antigen well, induce higher antibody levels, and include a multimeric 3AGJ (V4 and V5) tend to create more favorable conditions for neutralization. Only a subset of animals produced neutralizing activity, even within the stronger vaccine groups. This indicates that while antigen display, composition, and antibody levels help support the response, neutralization requires additional factors.
3.10. Integrated Correlation Network and Data-Driven Clustering
To examine how surface display, antibody production, and neutralizing activity relate to one another, we built a correlation matrix that included exposure_score, AUC(FLOW), AUC(ELISA), and the log10ID50 across the four HIV-1 pseudoviruses tested. The network revealed a clear structure. Variables related to antigen display grouped closely together and showed strong positive correlations with ELISA measurements of antibody binding. In contrast, neutralization titers formed a separate group with only limited connections to the display and ELISA variables. Significant correlations after false discovery rate adjustment were found mainly within the display and binding measures, confirming that stronger antigen exposure was consistently associated with higher antibody levels. Correlations between ELISA values and neutralization titers were generally weak or non-significant (Supplementary Tables S2 and S3), indicating that higher antibody quantity did not reliably predict functional activity.
Unsupervised hierarchical clustering of standardized variables supported this pattern (Figure 9). The analysis separated the measurements into two main clusters. The first included exposure_score, AUC(FLOW), and AUC(ELISA), reflecting the strength of antigen presentation and the magnitude of the antibody response. The second cluster consisted of the four neutralization measurements. This division shows that antibody binding and neutralization behave as related but distinct biological processes, a conclusion that is consistent with the principal component analysis described in Section 3.9. The fact that both methods produced the same two-group structure underscores the robustness of this organization.
Together, these analyses provide a clear quantitative description for understanding the immune response to the Scaffold-MPER vaccines. Antigen display and antibody binding form a tightly linked continuum, while neutralization behaves as a separate outcome that appears only in a subset of animals. Although V4 and V5 tended to show higher values across both clusters, neutralization remained variable even within these groups. These findings illustrate that while strong antigen presentation supports antibody induction, the development of neutralizing activity requires additional factors that are not captured by display or ELISA measurements alone.
4. Discussion
The present study builds directly on earlier work that established the KWC/GRB platform as a flexible system for antigen display and vaccine development. In the initial proof of concept experiments, Maeda et al. showed that GRB can stably express foreign antigens on their surface using an autotransporter and that killed whole cell vaccines made from these bacteria can protect animals from viral challenge, even when antibodies are not detectable by ELISA [56]. These findings indicated that the platform could serve as an effective antigen delivery platform and can induce protective immunity through mechanisms that are not limited to serum antibody responses.
A subsequent study by Quintero et al. [57] used the HIV-1 fusion peptide (FP) as a model antigen to explore how antigen design affects antibody induction on this platform. In that work, FP immunogens that incorporated multimerization, rigid α-helical linkers, and immunomodulatory sequences (including PADRE and TLR agonists) induced strong anti-FP antibody responses and bound the FP-directed bnAb VRC34.01. However, the antibodies did not neutralize HIV-1. The most likely explanation was that FP displayed on the bacterial surface may not reproduce the native FP conformation in Env closely enough. Taken together, the Maeda and Quintero studies showed that KWC/GRB vaccines can present foreign antigens, can generate strong antibody responses, and can serve as an engine for antigen optimization, but they also suggested that neutralization would require surface displayed antigens that closely match the structure recognized by a relevant bNMAb.
In the present work, we tested this idea by replacing HIV-1 FP with a stabilized scaffold-MPER immunogen, 3AGJ [11], which reproduces the conformation recognized by the MPER-directed multiple bNAb. Using the same design principles developed previously, we created a series of 3AGJ vaccines that varied in multimerization, linker architecture, and immunomodulatory content, while keeping the same KWC/GRB platform and AIDA-I based surface display system. Across all vaccines, 3AGJ was efficiently expressed on the bacterial surface and showed strong 2F5 binding, with the highest apparent exposure in the multimeric designs, as expected. All vaccines induced MPER-specific antibodies. Vaccine designs containing duplicated 3AGJ units with added immunomodulators produced the strongest and most sustained anti-MPER peptide Ab responses. These results show that a structurally stabilized MPER antigen can be displayed on the KWC/GRB platform and is immunogenic in vivo.
Neutralizing activity against HIV-1 pseudoviruses was detected in a subset of animals. Although ID50 titers were modest, several mice reached values above predefined assay cutoffs for 1 or more viruses. Neutralization was most often observed in animals vaccinated with designs that combined duplicated 3AGJ scaffolds and multiple immunomodulators, suggesting that increased epitope copy number, and inclusion of more immunomodulators together favor conditions for functional antibody induction. The overall frequency of mice producing neutralizing antibodies was low, but to our knowledge this represents the first demonstration that a KWC/GRB vaccine can elicit detectable HIV-1 neutralizing antibodies when a recombinant scaffold-MPER immunogen is used.
Importantly, approximately one third of vaccinated animals (8 of 24 mice) exhibited neutralizing activity against at least one HIV-1 pseudovirus. Although this frequency is modest, it is notable given the well-documented difficulty of eliciting MPER-directed neutralizing antibodies in small animal models [38,80,81]. MPER is among the most challenging HIV-1 epitopes to target, due to its proximity to the viral membrane, sub-dominant immunogenicity, partial lipid dependence, and the atypical features of many MPER-directed bNAbs [82,83,84]. In this context, the observation that a scaffolded MPER immunogen delivered on the KWC/GRB platform can elicit detectable neutralization in a substantial minority of animals represents a meaningful step forward rather than a marginal outcome.
To better understand how antigen display, antibody binding, and neutralization relate to one another, we integrated flow cytometry, longitudinal ELISA, and week 15 neutralization data. Antigen exposure measured by 2F5 binding correlated strongly with MPER-specific antibody levels at early time points and again after the final immunization. This biphasic pattern suggests that the amount of antigen on the bacterial surface plays a major role in shaping antibody titers at the beginning of the response and after the last vaccine dose [85,86,87]. At the beginning of the study, correlations were good because values were uniformly low after a single prime vaccination [28,88,89,90,91]. By the end of the schedule, the relationship between display and ELISA signals reinforced again, indicating renewed antigen driven selection of B cells that recognize MPER like features presented by the scaffold [92].
Neither antigen exposure nor the magnitude of antibody induction predicted neutralization potency. AUC(ELISA) values and flow cytometry measures were only weakly related to ID50 titers, and per vaccine analyses gave similar results. Neutralizing activity appeared only in a subset of animals, including some with intermediate binding titers, while many animals with high binding titers did not neutralize. This pattern indicates that once a threshold level of antigen exposure and antibody production is reached, further increases in antibody quantity do not guarantee the development of functional antibodies [93,94,95,96]. Instead, neutralization likely depends on the quality of the antibody response, which are not captured by ELISA measurements [93,97,98].
These findings are consistent with what is known about MPER immunobiology. MPER directed bNAbs as 2F5 recognize epitopes that lie close to the viral membrane and often require coordinated interactions with both peptide and lipids [12,22,25]. Even when a scaffolded MPER immunogen displays structural features consistent with native MPER, this alone is not sufficient to consistently elicit neutralizing activity in vivo. In the KWC/GRB system, immunogens are displayed by the AT in the context of the E. coli outer membrane, which shares some biophysical features with the mammalian cell membrane and virion envelope lipid bilayer but is not identical [99,100]. In addition, AlphaFold2 models at this time include only the protein itself, without predications as to how embedding in a lipid bilayer might influence structure.
The design variables evaluated in this study provide guidance for future work. Vaccines containing duplicated 3AGJ domains and multiple immunomodulatory elements showed a higher frequency of neutralization events, indicating a trend toward improved neutralization with multimeric designs. While this difference did not reach statistical significance when comparing monomeric and multimeric vaccine classes, neutralization was an infrequent outcome in this study, and the sample size was limited.
These observations support the exploration of additional strategies, such as heterologous prime-boost regimens, which have shown neutralizing immune responses (and, in primate studies, prime-infection studies) [39,41]. A logical next step is to combine MPER scaffold vaccines with more physiologically relevant trimeric MPER immunogen designs in other prime-boost regimens. The Haemophilus influenzae Hia trimeric autotransporter has a structure the closely resembles the trimeric coiled-coil trimeric stem/stalk/MPER regions of viruses with class 1 viral fusion proteins [54,55], so it may be possible to create a native trimeric MPER KWC/GRB vaccine using that AT in the KWC/GRB platform. Prime-boost regimens that begin with 3AGJ scaffolds and then employ another heterologous KWC/GRB MPER boosters may yield better neutralization responses. Similar heterologous strategies in other vaccine platforms have produced stronger neutralizing responses, particularly when the booster presents the epitope in a more native membrane proximal configuration [39,40,41,92,98,101,102,103]. There are several additional scaffold-MPER immunogens, for example ES1, ES2, ES3, and ScafMPER.024, and it may be possible that similar vaccines employing these immunogens could yield better neutralization [9,11,41,104].
Additional improvements could include adjusting linker composition and length to control spacing and orientation between scaffold units and modifying the density [67] or distribution of co stimulatory molecules such as OX40L or other TNF receptor ligands, or other immunomodulators to induce better responses without excessive inflammation [105,106]. Complementary studies using germinal center histology, B cell repertoire sequencing, and competition assays with MPER bNAbs will help clarify which lineages are recruited and how closely they approach known neutralizing solutions [97,107]. Because the KWC/GRB platform is modular, these refinements can be incorporated into subsequent work.
This work has several strengths. It uses the lessons developed in prior FP immunogen designs applied to create new scaffold-MPER vaccines using the KWC/GRB platform. Our work also demonstrates for the first time that a KWC/GRB MPER-targeted vaccine can elicit HIV-1 neutralizing antibodies, an important beginning in the development of low cost, easily manufactured, distribution-friendly, scalable vaccines. The 3AGJ immunogen used in this study is poorly soluble and has proven difficult to express in several protein expression systems, often troubled by the formation of intracellular aggregates [11,108,109]. This work demonstrates that the AT expression systems employed in the KWC/GRB platform can overcome these problems by expressing the immunogen on the surface of the bacteria instead of in the cytoplasm. For ATs, translation and export to the bacterial surface are very tightly coupled, so there is no opportunity for the immunogen to accumulate in the cytoplasm and form aggregates [100,110,111]. Since the 3AGJ immunogen is well-recognized on the bacterial surface by anti-MPER neutralizing bNAbs, it is likely that the immunogen is placed on the bacterial surface in close-to -native conformation. Since 3AGJ has been difficult to express in bacteria, the findings also demonstrate the utility of the inducible promoter that controls the expression of the AIDA-I AT expression cassette in pRAIDA2, a feature that may prove useful for other difficult-to-express vaccine immunogens.
This study also has limitations. Neutralizing activity was assessed only at a single terminal time point, due to the inherent limitations in blood volume obtainable in mouse models, which limited our ability to characterize the temporal development of functional responses. In addition, although 3AGJ reproduces the conformation of MPER, it represents only one of several possible stabilized MPER structures. Other MPER scaffold designs may present different structural features or recruit alternative B cell lineages that may yield better neutralization responses. Our work evaluated a focused set of linkers, multimer formats, and co-stimulatory elements, and a broader exploration of these parameters may reveal additional combinations that result in the induction of a better neutralization response. However, the work clearly outlines directions for subsequent efforts at vaccine improvement.
In summary, our findings show that the KWC/GRB platform can display structurally relevant MPER antigens, induce strong MPER-specific antibody responses, and elicit detectable HIV-1 neutralizing activity in some animals. They also clarify that antigen display and antibody quantity, although tightly linked to one another, are not sufficient to guarantee neutralization. Optimizing the quality of the response is clearly critical, but designing new immunogens using structural biology insights, confirmed by improving structure prediction will likely enable the design and production of new, more effective immunogens. By identifying which design features improve display and binding and by revealing where binding and neutralization diverge, this work provides a foundation and a set of concrete targets for future work that aim to improve functional antibody responses.
5. Conclusions
This study demonstrates that the KWC/GRB platform can display a structurally accurate MPER scaffold, induce robust MPER-specific antibody responses, and elicit detectable HIV-1 neutralization in a subset of animals. These results show that the platform is capable of inducing functional neutralizing Abs when the immunogen is presented in an appropriate conformation. The work further suggests that vaccine performance is influenced primarily by antigen design rather than by intrinsic limitations of the KWC/GRB platform.
The Scaffold-MPER vaccines developed here provide a framework for continued development of KWC/GRB MPER vaccines. Future designs that incorporate additional, improved scaffolds, trimeric MPER immunogens, and well-designed prime-boost schedules may improve functional responses. Given that the KWC/GRB platform can yield immunogens that are recognized by an appropriate bNMAb, even when the immunogen has low solubility and/or a propensity to aggregate formation, our data suggests that future immunogens can be designed without overbearing consideration for solubility and aggregate formation tendency, expanding the potential design repertoire. Together, these findings establish a clear foundation for advancing KWC/GRB-based HIV vaccine designs and analogous designs for other.
Collectively, these results demonstrate that the KWC/GRB platform can be readily adapted to new antigens particularly those that may be difficult to express or are poorly soluble, prone to aggregate formation, and may be particularly useful for vaccines immunogens that are improved by a membrane-proximal presentation.
Supplementary Materials
The following supporting information can be downloaded at the website of this paper posted on Preprints.org, Supplementary File 1, Supplementary File 2.
Author Contributions
Conceptualization, J.S.Q.B., S.L.Z.; methodology, J.S.Q.B., Y.S., F.M., S.M., L.L., P.D.K., X.S., D.C.M., S.L.Z.; software, J.S.Q.B.; validation, J.S.Q.B., S.L.Z.; formal analysis, J.S.Q.B., S.L.Z.; investigation, J.S.Q.B. and S.L.Z.; resources, S.L.Z.; data curation, J.S.Q.B.; writing—original draft preparation, J.S.Q.B.; writing—review and editing, S.L.Z.; visualization, J.S.Q.B.; supervision, S.L.Z.; project administration, S.L.Z.; funding acquisition, S.L.Z. All authors have read and agreed to the published version of the manuscript.
Funding
This work was supported by the Pendleton Laboratory Fund for Pediatric Infectious Disease Research, the Manning Fund for COVID-19 Research at the University of Virginia, the Ivy Foundation, the Coulter Foundation, and by grants from the National Institute of Allergy and Infectious Diseases (NIAID), NIH [R01 AI176515] and the NIAID–Duke University contract (#75N93025C00006). Additional support was provided by the United States Department of Agriculture (USDA) National Institute of Food and Agriculture (NIFA) [2025-67015-44993]. Flow cytometry data were generated in the University of Virginia Flow Cytometry Core Facility (RRID:SCR_017829), which is partially supported by the University of Virginia Comprehensive Cancer Center through the National Cancer Institute (NCI) [P30-CA044579].
Institutional Review Board Statement
The animal study protocol was conducted in accordance with the Guide for the Care and Use of Laboratory Animals and was approved by the University of Virginia Animal Care and Use Committee (protocol number 41101224; unique ID 7018391).
Informed Consent Statement
Not applicable.
Data Availability Statement
The data of this study are available upon reasonable request from the authors.
Acknowledgments
The authors thank the staff of the University of Virginia Flow Cytometry Core Facility (RRID:SCR_017829) for expert technical assistance and animal facility personnel for their support with immunization and sample collection. Some data for this study were generated using instrumentation supported by the UVA Comprehensive Cancer Center (P30-CA044579). The authors also acknowledge the use of ChatGPT (OpenAI, GPT-5 model) under the authors’ supervision for assistance in generating R scripts used in the statistical analyses. We thank X. J. Meng (Virginia Tech) for helpful discussions, advice, and essential involvement in our initial PEDV work using this vaccine platform. The HIV-1 gp41 monoclonal antibody 2F5 used in this study was obtained through BEI Resources, NIAID, NIH.
Conflicts of Interest
The authors declare no conflicts of interest.
Abbreviations
The following abbreviations are used in this manuscript:
| 3AGJ | Scaffolded MPER antigen based on PDB 3AGJ |
| 3DA | DADADA N-terminal motif |
| AEAAAK | Rigid α-helical linker motif AEAAAK (EAAAK repeats) |
| AIDA | Adhesin Involved in Diffuse Adherence |
| AIDA-I | Adhesin Involved in Diffuse Adherence I autotransporter |
| AQQASSS | Semi-flexible α-helical linker motif AQQASSS |
| AT | Autotransporter |
| ATs | Autotransporters |
| AUC | Area Under the Curve |
| AUC(ELISA) | ELISA area under the curve |
| AUC(FLOW) | Flow cytometry area under the curve |
| BCR | B-cell receptor |
| BSA | Bovine serum albumin |
| BSL-2 | Biosafety level 2 |
| CFU | Colony-forming unit |
| DBTL | Design–Build–Test–Learn |
| EC50 | Half-maximal effective concentration |
| ELISA | Enzyme-Linked Immunosorbent Assay |
| Env | Envelope glycoprotein |
| FBS | Fetal bovine serum |
| FDR | False discovery rate |
| FLIC | Flagellin fragment (TLR5 agonist) |
| FP | Fusion Peptide |
| FP-like | Fusion peptide-like |
| GC | Germinal center |
| HBSS | Hank’s Balanced Salt Solution |
| HET3 | Four-way crossbred HET3 mouse stock |
| HIV | Human Immunodeficiency Virus |
| HIV-1 | Human Immunodeficiency Virus type 1 |
| HRP | Horseradish peroxidase |
| ID50 | 50% inhibitory dilution titer |
| ID80 | 80% inhibitory dilution titer |
| IgG | Immunoglobulin G |
| KWC/GRB | Killed Whole-Cell Genome-Reduced Bacteria |
| LB | Luria–Bertani broth/agar |
| ME5125 | Genome-reduced Escherichia coli strain ME5125 |
| MG1655 | Escherichia coli strain MG1655 |
| MPER | Membrane-Proximal External Region |
| NCI | National Cancer Institute |
| NIAID | National Institute of Allergy and Infectious Diseases |
| NIFA | National Institute of Food and Agriculture |
| NIH | National Institutes of Health |
| OD600 | Optical density at 600 nm |
| OX40L | OX40 ligand |
| PADRE | Pan DR Epitope (universal CD4+ T-helper epitope) |
| PBS | Phosphate-buffered saline |
| PC1 | Principal component 1 |
| PC2 | Principal component 2 |
| PCA | Principal component analysis |
| PEDV | Porcine epidemic diarrhea virus |
| RAU | Relative antibody units |
| RLU | Relative luminescence units |
| ROC | Receiver operating characteristic |
| SEM | Standard error of the mean |
| SOC | Super Optimal broth with Catabolite repression |
| SPF | Specific-pathogen-free |
| TBS | Tris-buffered saline |
| TBST | Tris-buffered saline with Tween-20 |
| TLR2 | Toll-like receptor 2 |
| TLR2/4 | Toll-like receptors 2 and 4 |
| TLR4 | Toll-like receptor 4 |
| TLR5 | Toll-like receptor 5 |
| TMB | Tetramethylbenzidine |
| TZM-bl | HIV-1 reporter cell line TZM-bl |
| USA | United States of America |
| USDA | United States Department of Agriculture |
| UVA | University of Virginia |
| V1 | Scaffold-MPER vaccine 1 |
| V2 | Scaffold-MPER vaccine 2 |
| V3 | Scaffold-MPER vaccine 3 |
| V4 | Scaffold-MPER vaccine 4 |
| V5 | Scaffold-MPER vaccine 5 |
| bnAb | Broadly neutralizing antibody |
| bnAbs | Broadly neutralizing antibodies |
| gp41 | Glycoprotein 41 |
| rSIP | Recombinant surface immunogenic protein |
References
- Plotkin, S. Vaccines: Past, Present and Future. Nat Med 2005, 11, S5–S11. [Google Scholar]
- Plotkin, S.A.; Gilbert, P.B. Nomenclature for Immune Correlates of Protection After Vaccination. Clinical Infectious Diseases 2012, 54, 1615–1617. [Google Scholar] [CrossRef] [PubMed]
- Greenwood, B. The Contribution of Vaccination to Global Health: Past, Present and Future. Phil. Trans. R. Soc. B 2014, 369, 20130433. [Google Scholar] [CrossRef]
- Pardi, N.; Hogan, M.J.; Porter, F.W.; Weissman, D. mRNA Vaccines — a New Era in Vaccinology. Nat Rev Drug Discov 2018, 17, 261–279. [Google Scholar] [CrossRef] [PubMed]
- Yu, J.; Sreenivasan, C.; Sheng, Z.; Zhai, S.-L.; Wollman, J.W.; Luo, S.; Huang, C.; Gao, R.; Wang, Z.; Kaushik, R.S.; et al. A Recombinant Chimeric Influenza Virus Vaccine Expressing the Consensus H3 Hemagglutinin Elicits Broad Hemagglutination Inhibition Antibodies against Divergent Swine H3N2 Influenza Viruses. Vaccine 2023, 41, 6318–6326. [Google Scholar] [CrossRef] [PubMed]
- Hotez, P.J.; Bottazzi, M.E. Whole Inactivated Virus and Protein-Based COVID-19 Vaccines. Annu. Rev. Med. 2022, 73, 55–64. [Google Scholar] [CrossRef]
- Broadbent, A.J.; Subbarao, K. Influenza Virus Vaccines: Lessons from the 2009 H1N1 Pandemic. Curr Opin Virol 2011, 1, 254–262. [Google Scholar] [CrossRef]
- Corey, L.; Mascola, J.R.; Fauci, A.S.; Collins, F.S. A Strategic Approach to COVID-19 Vaccine R&D. Science 2020, 368, 948–950. [Google Scholar] [CrossRef]
- Ofek, G.; Guenaga, F.J.; Schief, W.R.; Skinner, J.; Baker, D.; Wyatt, R.; Kwong, P.D. Elicitation of Structure-Specific Antibodies by Epitope Scaffolds. Proc. Natl. Acad. Sci. U.S.A. 2010, 107, 17880–17887. [Google Scholar] [CrossRef]
- Correia, B.E.; Ban, Y.-E.A.; Holmes, M.A.; Xu, H.; Ellingson, K.; Kraft, Z.; Carrico, C.; Boni, E.; Sather, D.N.; Zenobia, C.; et al. Computational Design of Epitope-Scaffolds Allows Induction of Antibodies Specific for a Poorly Immunogenic HIV Vaccine Epitope. Structure 2010, 18, 1116–1126. [Google Scholar] [CrossRef]
- Zhou, T.; Zhu, J.; Yang, Y.; Gorman, J.; Ofek, G.; Srivatsan, S.; Druz, A.; Lees, C.R.; Lu, G.; Soto, C.; et al. Transplanting Supersites of HIV-1 Vulnerability. PLoS ONE 2014, 9, e99881. [Google Scholar] [CrossRef]
- Rujas, E.; Leaman, D.P.; Insausti, S.; Ortigosa-Pascual, L.; Zhang, L.; Zwick, M.B.; Nieva, J.L. Functional Optimization of Broadly Neutralizing HIV-1 Antibody 10E8 by Promotion of Membrane Interactions. J Virol 2018, 92, e02249-17. [Google Scholar] [CrossRef]
- Eslami, M.; Fadaee Dowlat, B.; Yaghmayee, S.; Habibian, A.; Keshavarzi, S.; Oksenych, V.; Naderian, R. Next-Generation Vaccine Platforms: Integrating Synthetic Biology, Nanotechnology, and Systems Immunology for Improved Immunogenicity. Vaccines 2025, 13, 588. [Google Scholar] [CrossRef]
- Barrett, A.; Stanberry, L. Vaccines for Biodefense and Emerging and Neglected Diseases; Academic Press: London, 2009; ISBN 978-0-12-369408-9. [Google Scholar]
- Buck, P.O.; Gomes, D.A.; Beck, E.; Kirson, N.; Mattera, M.; Carroll, S.; Ultsch, B.; Jayasundara, K.; Uhart, M.; Garrison, L.P., Jr. New Vaccine Platforms—Novel Dimensions of Economic and Societal Value and Their Measurement. Vaccines 2024, 12, 234. [Google Scholar] [CrossRef]
- Park, H.; Otte, A.; Park, K. Evolution of Drug Delivery Systems: From 1950 to 2020 and Beyond. Journal of Controlled Release 2022, 342, 53–65. [Google Scholar] [CrossRef]
- Graham, B.S.; Sullivan, N.J. Emerging Viral Diseases from a Vaccinology Perspective: Preparing for the next Pandemic. Nat Immunol 2018, 19, 20–28. [Google Scholar] [CrossRef] [PubMed]
- Burton, D.R.; Hangartner, L. Broadly Neutralizing Antibodies to HIV and Their Role in Vaccine Design. Annual Review of Immunology 2016, 34, 635–659. [Google Scholar] [CrossRef]
- McCoy, L.E.; Burton, D.R. Identification and Specificity of Broadly Neutralizing Antibodies against HIV. Immunological Reviews 2017, 275, 11–20. [Google Scholar] [CrossRef] [PubMed]
- Holmgren, J.; Czerkinsky, C. Mucosal Immunity and Vaccines. Nat Med 2005, 11, S45–S53. [Google Scholar] [CrossRef]
- Lycke, N. Recent Progress in Mucosal Vaccine Development: Potential and Limitations. Nat Rev Immunol 2012, 12, 592–605. [Google Scholar] [CrossRef] [PubMed]
- Franquelim, H.G.; Chiantia, S.; Veiga, A.S.; Santos, N.C.; Schwille, P.; Castanho, M.A. Anti-HIV-1 Antibodies 2F5 and 4E10 Interact Differently with Lipids to Bind Their Epitopes. Aids 2011, 25, 419–428. [Google Scholar] [CrossRef]
- Kong, R.; Xu, K.; Zhou, T.; Acharya, P.; Lemmin, T.; Liu, K.; Ozorowski, G.; Soto, C.; Taft, J.D.; Bailer, R.T.; et al. Fusion Peptide of HIV-1 as a Site of Vulnerability to Neutralizing Antibody. Science 2016, 352, 828–833. [Google Scholar] [CrossRef] [PubMed]
- Wu, X.; Yang, Z.-Y.; Li, Y.; Hogerkorp, C.-M.; Schief, W.R.; Seaman, M.S.; Zhou, T.; Schmidt, S.D.; Wu, L.; Xu, L.; et al. Rational Design of Envelope Identifies Broadly Neutralizing Human Monoclonal Antibodies to HIV-1. Science 2010, 329, 856–861. [Google Scholar] [CrossRef] [PubMed]
- Irimia, A.; Serra, A.M.; Sarkar, A.; Jacak, R.; Kalyuzhniy, O.; Sok, D.; Saye-Francisco, K.L.; Schiffner, T.; Tingle, R.; Kubitz, M.; et al. Lipid Interactions and Angle of Approach to the HIV-1 Viral Membrane of Broadly Neutralizing Antibody 10E8: Insights for Vaccine and Therapeutic Design. PLoS Pathog 2017, 13, e1006212. [Google Scholar] [CrossRef]
- Burton, D.R.; Poignard, P.; Stanfield, R.L.; Wilson, I.A. Broadly Neutralizing Antibodies Present New Prospects to Counter Highly Antigenically Diverse Viruses. Science 2012, 337, 183–186. [Google Scholar] [CrossRef]
- Wang, Q.; Zhang, L. Broadly Neutralizing Antibodies and Vaccine Design against HIV-1 Infection. Front. Med. 2020, 14, 30–42. [Google Scholar] [CrossRef]
- Williams, W.B.; Wiehe, K.; Saunders, K.O.; Haynes, B.F. Strategies for Induction of HIV-1 Envelope-Reactive Broadly Neutralizing Antibodies. Journal of the International AIDS Society 2021, 24, e25831. [Google Scholar] [CrossRef]
- Brouwer, P.J.M.; Antanasijevic, A.; Berndsen, Z.; Yasmeen, A.; Fiala, B.; Bijl, T.P.L.; Bontjer, I.; Bale, J.B.; Sheffler, W.; Allen, J.D.; et al. Enhancing and Shaping the Immunogenicity of Native-like HIV-1 Envelope Trimers with a Two-Component Protein Nanoparticle. Nat Commun 2019, 10. [Google Scholar] [CrossRef]
- Ou, L.; Kong, W.-P.; Chuang, G.-Y.; Ghosh, M.; Gulla, K.; O’Dell, S.; Varriale, J.; Barefoot, N.; Changela, A.; Chao, C.W.; et al. Preclinical Development of a Fusion Peptide Conjugate as an HIV Vaccine Immunogen. Sci Rep 2020, 10, 3032. [Google Scholar] [CrossRef]
- Huang, J.; Ofek, G.; Laub, L.; Louder, M.K.; Doria-Rose, N.A.; Longo, N.S.; Imamichi, H.; Bailer, R.T.; Chakrabarti, B.; Sharma, S.K.; et al. Broad and Potent Neutralization of HIV-1 by a Gp41-Specific Human Antibody. Nature 2012, 491, 406–412. [Google Scholar] [CrossRef]
- van Gils, M.J.; van den Kerkhof, T.L.G.M.; Ozorowski, G.; Cottrell, C.A.; Sok, D.; Pauthner, M.; Pallesen, J.; de Val, N.; Yasmeen, A.; de Taeye, S.W.; et al. An HIV-1 Antibody from an Elite Neutralizer Implicates the Fusion Peptide as a Site of Vulnerability. Nat Microbiol 2016, 2, 16199. [Google Scholar] [CrossRef]
- Domene, C.; Wiley, B.; Insausti, S.; Rujas, E.; Nieva, J.L. Distinctive Membrane Accommodation Traits Underpinning the Neutralization Activity of HIV-1 Antibody against MPER. Mol. Pharmaceutics 2025, 22, 2494–2508. [Google Scholar] [CrossRef]
- Pinto, D.; Fenwick, C.; Caillat, C.; Silacci, C.; Guseva, S.; Dehez, F.; Chipot, C.; Barbieri, S.; Minola, A.; Jarrossay, D.; et al. Structural Basis for Broad HIV-1 Neutralization by the MPER-Specific Human Broadly Neutralizing Antibody LN01. Cell Host & Microbe 2019, 26, 623–637.e8. [Google Scholar] [CrossRef]
- Barouch, D.H. Challenges in the Development of an HIV-1 Vaccine. Nature 2008, 455, 613–619. [Google Scholar] [CrossRef] [PubMed]
- Kim, J.H.; Rerks-Ngarm, S.; Excler, J.-L.; Michael, N.L. HIV Vaccines—Lessons Learned and the Way Forward. Curr Opin HIV AIDS 2010, 5, 428–434. [Google Scholar] [CrossRef] [PubMed]
- Kong, R.; Duan, H.; Sheng, Z.; Xu, K.; Acharya, P.; Chen, X.; Cheng, C.; Dingens, A.S.; Gorman, J.; Sastry, M.; et al. Antibody Lineages with Vaccine-Induced Antigen-Binding Hotspots Develop Broad HIV Neutralization. Cell 2019, 178, 567–584.e19. [Google Scholar] [CrossRef]
- Liu, H.; Su, X.; Si, L.; Lu, L.; Jiang, S. The Development of HIV Vaccines Targeting Gp41 Membrane-Proximal External Region (MPER): Challenges and Prospects. Protein & Cell 2018, 9, 596–615. [Google Scholar] [CrossRef] [PubMed]
- Wang, H.; Cheng, C.; Santo, J.L.D.; Shen, C.-H.; Bylund, T.; Henry, A.R.; Howe, C.A.; Hwang, J.; Morano, N.C.; Morris, D.J.; et al. Potent and Broad HIV-1 Neutralization in Fusion Peptide-Primed SHIV-Infected Macaques. Cell 2024, 187, 7214–7231.e23. [Google Scholar] [CrossRef]
- Cheng, C.; Xu, K.; Kong, R.; Chuang, G.-Y.; Corrigan, A.R.; Geng, H.; Hill, K.R.; Jafari, A.J.; O’Dell, S.; Ou, L.; et al. Consistent Elicitation of Cross-Clade HIV-Neutralizing Responses Achieved in Guinea Pigs after Fusion Peptide Priming by Repetitive Envelope Trimer Boosting. PLoS ONE 2019, 14, e0215163. [Google Scholar] [CrossRef]
- Guenaga, J.; Dosenovic, P.; Ofek, G.; Baker, D.; Schief, W.R.; Kwong, P.D.; Karlsson Hedestam, G.B.; Wyatt, R.T. Heterologous Epitope-Scaffold Prime∶Boosting Immuno-Focuses B Cell Responses to the HIV-1 Gp41 2F5 Neutralization Determinant. PLoS ONE 2011, 6, e16074. [Google Scholar] [CrossRef]
- Ward, A.B.; Wilson, I.A. The HIV -1 Envelope Glycoprotein Structure: Nailing down a Moving Target. Immunological Reviews 2017, 275, 21–32. [Google Scholar] [CrossRef] [PubMed]
- Azoitei, M.L.; Ban, Y.-E.A.; Julien, J.-P.; Bryson, S.; Schroeter, A.; Kalyuzhniy, O.; Porter, J.R.; Adachi, Y.; Baker, D.; Pai, E.F.; et al. Computational Design of High-Affinity Epitope Scaffolds by Backbone Grafting of a Linear Epitope. Journal of Molecular Biology 2012, 415, 175–192. [Google Scholar] [CrossRef]
- Rantalainen, K.; Berndsen, Z.T.; Antanasijevic, A.; Schiffner, T.; Zhang, X.; Lee, W.-H.; Torres, J.L.; Zhang, L.; Irimia, A.; Copps, J.; et al. HIV-1 Envelope and MPER Antibody Structures in Lipid Assemblies. Cell Reports 2020, 31, 107583. [Google Scholar] [CrossRef] [PubMed]
- Zeng, X.; Vidlund, J.; Gillespie, B.; Cao, L.; Agga, G.E.; Lin, J.; Dego, O.K. Evaluation of Immunogenicity of Enterobactin Conjugate Vaccine for the Control of Escherichia Coli Mastitis in Dairy Cows. Journal of Dairy Science 2023, 106, 7147–7163. [Google Scholar] [CrossRef]
- Bhattacharya, S.K.; Sur, D.; Ali, M.; Kanungo, S.; You, Y.A.; Manna, B.; Sah, B.; Niyogi, S.K.; Park, J.K.; Sarkar, B.; et al. 5 Year Efficacy of a Bivalent Killed Whole-Cell Oral Cholera Vaccine in Kolkata, India: A Cluster-Randomised, Double-Blind, Placebo-Controlled Trial. The Lancet Infectious Diseases 2013, 13, 1050–1056. [Google Scholar] [CrossRef] [PubMed]
- Ferreras, E.; Chizema-Kawesha, E.; Blake, A.; Chewe, O.; Mwaba, J.; Zulu, G.; Poncin, M.; Rakesh, A.; Page, A.-L.; Stoitsova, S.; et al. Single-Dose Cholera Vaccine in Response to an Outbreak in Zambia. N Engl J Med 2018, 378, 577–579. [Google Scholar] [CrossRef]
- Jose, J. Autodisplay: Efficient Bacterial Surface Display of Recombinant Proteins. Appl Microbiol Biotechnol 2006, 69, 607–614. [Google Scholar] [CrossRef]
- Henderson, I.R.; Navarro-Garcia, F.; Nataro, J.P. The Great Escape: Structure and Function of the Autotransporter Proteins. Trends in Microbiology 1998, 6, 370–378. [Google Scholar] [CrossRef]
- Henderson, I.R.; Navarro-Garcia, F.; Desvaux, M.; Fernandez, R.C.; Ala’Aldeen, D. Type V Protein Secretion Pathway: The Autotransporter Story. Microbiol Mol Biol Rev 2004, 68, 692–744. [Google Scholar] [CrossRef]
- Leyton, D.L.; Rossiter, A.E.; Henderson, I.R. From Self Sufficiency to Dependence: Mechanisms and Factors Important for Autotransporter Biogenesis. Nat Rev Microbiol 2012, 10, 213–225. [Google Scholar] [CrossRef] [PubMed]
- Benz, I.; Schmidt, M.A. AIDA-I, the Adhesin Involved in Diffuse Adherence of the Diarrhoeagenic Escherichia Coli Strain 2787 (O126:H27), Is Synthesized via a Precursor Molecule. Molecular Microbiology 1992, 6, 1539–1546. [Google Scholar] [CrossRef]
- Cotter, S.E.; Surana, N.K.; Grass, S.; St Geme, J.W., 3rd. Trimeric Autotransporters Require Trimerization of the Passenger Domain for Stability and Adhesive Activity. J Bacteriol 2006, 188, 5400–5407. [Google Scholar] [CrossRef]
- Meng, G.; Surana, N.K.; St Geme, J.W., 3rd; Waksman, G. Structure of the Outer Membrane Translocator Domain of the Haemophilus Influenzae Hia Trimeric Autotransporter. EMBO J 2006, 25, 2297–2304. [Google Scholar] [CrossRef]
- Surana, N.K.; Cutter, D.; Barenkamp, S.J.; St Geme, J.W., 3rd. The Haemophilus Influenzae Hia Autotransporter Contains an Unusually Short Trimeric Translocator Domain. J Biol Chem 2004, 279, 14679–14685. [Google Scholar] [CrossRef] [PubMed]
- Maeda, D.L.N.F.; Tian, D.; Yu, H.; Dar, N.; Rajasekaran, V.; Meng, S.; Mahsoub, H.M.; Sooryanarain, H.; Wang, B.; Heffron, C.L.; et al. Killed Whole-Genome Reduced-Bacteria Surface-Expressed Coronavirus Fusion Peptide Vaccines Protect against Disease in a Porcine Model. Proceedings of the National Academy of Sciences 2021, 118, e2025622118. [Google Scholar] [CrossRef]
- Quintero-Barbosa, J.S.; Song, Y.; Mehl, F.; Mathur, S.; Livingston, L.; Shen, X.; Montefiori, D.C.; Tan, J.; Zeichner, S.L. Engineering Enhanced Immunogenicity of Surface-Displayed Immunogens in a Killed Whole-Cell Genome-Reduced Bacterial Vaccine Platform Using Class I Viral Fusion Peptides. Vaccines 2025, 14, 14. [Google Scholar] [CrossRef]
- Alexander, J.; del Guercio, M.-F.; Maewal, A.; Qiao, L.; Fikes, J.; Chesnut, R.W.; Paulson, J.; Bundle, D.R.; DeFrees, S.; Sette, A. Linear PADRE T Helper Epitope and Carbohydrate B Cell Epitope Conjugates Induce Specific High Titer IgG Antibody Responses1. The Journal of Immunology 2000, 164, 1625–1633. [Google Scholar] [CrossRef] [PubMed]
- Del Guercio, M.-F.; Alexander, J.; Kubo, R.T.; Arrhenius, T.; Maewal, A.; Appella, E.; Hoffman, S.L.; Jones, T.; Valmori, D.; Sakaguchi, K. Potent Immunogenic Short Linear Peptide Constructs Composed of B Cell Epitopes and Pan DR T Helper Epitopes (PADRE) for Antibody Responses in Vivo. Vaccine 1997, 15, 441–448. [Google Scholar] [CrossRef]
- Lu, Y.; Swartz, J.R. Functional Properties of Flagellin as a Stimulator of Innate Immunity. Sci Rep 2016, 6, 18379. [Google Scholar] [CrossRef]
- Sharma, P.; Levy, O.; Dowling, D.J. The TLR5 Agonist Flagellin Shapes Phenotypical and Functional Activation of Lung Mucosal Antigen Presenting Cells in Neonatal Mice. Front. Immunol. 2020, 11. [Google Scholar] [CrossRef] [PubMed]
- Rady, H.F.; Dai, G.; Huang, W.; Shellito, J.E.; Ramsay, A.J. Flagellin Encoded in Gene-Based Vector Vaccines Is a Route-Dependent Immune Adjuvant. PLOS ONE 2016, 11, e0148701. [Google Scholar] [CrossRef]
- Murthy, K.G.; Deb, A.; Goonesekera, S.; Szabó, C.; Salzman, A.L. Identification of Conserved Domains in Salmonella Muenchen Flagellin That Are Essential for Its Ability to Activate TLR5 and to Induce an Inflammatory Response in Vitro. Journal of Biological Chemistry 2004, 279, 5667–5675. [Google Scholar] [CrossRef]
- Diaz-Dinamarca, D.A.; Manzo, R.A.; Soto, D.A.; Avendaño-Valenzuela, M.J.; Bastias, D.N.; Soto, P.I.; Escobar, D.F.; Vasquez-Saez, V.; Carrión, F.; Pizarro-Ortega, M.S.; et al. Surface Immunogenic Protein of Streptococcus Group B Is an Agonist of Toll-Like Receptors 2 and 4 and a Potential Immune Adjuvant. Vaccines 2020, 8, 29. [Google Scholar] [CrossRef] [PubMed]
- Asokan, M.; Rudicell, R.S.; Louder, M.; McKee, K.; O’Dell, S.; Stewart-Jones, G.; Wang, K.; Xu, L.; Chen, X.; Choe, M.; et al. Bispecific Antibodies Targeting Different Epitopes on the HIV-1 Envelope Exhibit Broad and Potent Neutralization. J Virol 2015, 89, 12501–12512. [Google Scholar] [CrossRef]
- Taylor, D.N.; Treanor, J.J.; Sheldon, E.A.; Johnson, C.; Umlauf, S.; Song, L.; Kavita, U.; Liu, G.; Tussey, L.; Ozer, K.; et al. Development of VAX128, a Recombinant Hemagglutinin (HA) Influenza-Flagellin Fusion Vaccine with Improved Safety and Immune Response. Vaccine 2012, 30, 5761–5769. [Google Scholar] [CrossRef]
- Croft, M. Control of Immunity by the TNFR-Related Molecule OX40 (CD134). Annu. Rev. Immunol. 2010, 28, 57–78. [Google Scholar] [CrossRef]
- Amet, N.; Lee, H.-F.; Shen, W.-C. Insertion of the Designed Helical Linker Led to Increased Expression of Tf-Based Fusion Proteins. Pharm Res 2009, 26, 523–528. [Google Scholar] [CrossRef]
- Jeong, W.H.; Lee, H.; Song, D.H.; Eom, J.-H.; Kim, S.C.; Lee, H.-S.; Lee, H.; Lee, J.-O. Connecting Two Proteins Using a Fusion Alpha Helix Stabilized by a Chemical Cross Linker. Nat Commun 2016, 7, 11031. [Google Scholar] [CrossRef] [PubMed]
- Chen, X.; Zaro, J.; Shen, W.-C. Fusion Protein Linkers: Property, Design and Functionality. Adv Drug Deliv Rev 2013, 65, 1357–1369. [Google Scholar] [CrossRef] [PubMed]
- Jumper, J.; Evans, R.; Pritzel, A.; Green, T.; Figurnov, M.; Ronneberger, O.; Tunyasuvunakool, K.; Bates, R.; Žídek, A.; Potapenko, A.; et al. Highly Accurate Protein Structure Prediction with AlphaFold. Nature 2021, 596, 583–589. [Google Scholar] [CrossRef]
- Goddard, T.D.; Huang, C.C.; Meng, E.C.; Pettersen, E.F.; Couch, G.S.; Morris, J.H.; Ferrin, T.E. UCSF ChimeraX: Meeting Modern Challenges in Visualization and Analysis. Protein Science 2018, 27, 14–25. [Google Scholar] [CrossRef]
- Meng, E.C.; Goddard, T.D.; Pettersen, E.F.; Couch, G.S.; Pearson, Z.J.; Morris, J.H.; Ferrin, T.E. UCSF ChimeraX: Tools for Structure Building and Analysis. Protein Science 2023, 32, e4792. [Google Scholar] [CrossRef]
- Pettersen, E.F.; Goddard, T.D.; Huang, C.C.; Meng, E.C.; Couch, G.S.; Croll, T.I.; Morris, J.H.; Ferrin, T.E. UCSF ChimeraX: Structure Visualization for Researchers, Educators, and Developers. Protein Science 2021, 30, 70–82. [Google Scholar] [CrossRef]
- Hashimoto, M.; Ichimura, T.; Mizoguchi, H.; Tanaka, K.; Fujimitsu, K.; Keyamura, K.; Ote, T.; Yamakawa, T.; Yamazaki, Y.; Mori, H.; et al. Cell Size and Nucleoid Organization of Engineered Escherichia Coli Cells with a Reduced Genome. Molecular Microbiology 2005, 55, 137–149. [Google Scholar] [CrossRef]
- Kato, J.; Hashimoto, M. Construction of Consecutive Deletions of the Escherichia Coli Chromosome. Molecular Systems Biology 2007, 3, 132. [Google Scholar] [CrossRef] [PubMed]
- Seaman, M.S.; Janes, H.; Hawkins, N.; Grandpre, L.E.; Devoy, C.; Giri, A.; Coffey, R.T.; Harris, L.; Wood, B.; Daniels, M.G.; et al. Tiered Categorization of a Diverse Panel of HIV-1 Env Pseudoviruses for Assessment of Neutralizing Antibodies. J Virol 2010, 84, 1439–1452. [Google Scholar] [CrossRef] [PubMed]
- Montefiori, D.C. Measuring HIV Neutralization in a Luciferase Reporter Gene Assay. In HIV Protocols; Prasad, V.R., Kalpana, G.V., Eds.; Humana Press: Totowa, NJ, 2009; pp. 395–405. ISBN 978-1-59745-170-3. [Google Scholar]
- Li, M.; Gao, F.; Mascola, J.R.; Stamatatos, L.; Polonis, V.R.; Koutsoukos, M.; Voss, G.; Goepfert, P.; Gilbert, P.; Greene, K.M.; et al. Human Immunodeficiency Virus Type 1 Env Clones from Acute and Early Subtype B Infections for Standardized Assessments of Vaccine-Elicited Neutralizing Antibodies. Journal of Virology 2005, 79, 10108–10125. [Google Scholar] [CrossRef]
- Buzon, V.; Natrajan, G.; Schibli, D.; Campelo, F.; Kozlov, M.M.; Weissenhorn, W. Crystal Structure of HIV-1 Gp41 Including Both Fusion Peptide and Membrane Proximal External Regions. PLoS Pathog 2010, 6, e1000880. [Google Scholar] [CrossRef]
- Kamdem Toukam, D.; Tenbusch, M.; Stang, A.; Temchura, V.; Storcksdieck Genannt Bonsmann, M.; Grewe, B.; Koch, S.; Meyerhans, A.; Nchinda, G.; Kaptue, L.; et al. Targeting Antibody Responses to the Membrane Proximal External Region of the Envelope Glycoprotein of Human Immunodeficiency Virus. PLoS ONE 2012, 7, e38068. [Google Scholar] [CrossRef]
- Shao, S.; Huang, W.-C.; Lin, C.; Hicar, M.D.; LaBranche, C.C.; Montefiori, D.C.; Lovell, J.F. An Engineered Biomimetic MPER Peptide Vaccine Induces Weakly HIV Neutralizing Antibodies in Mice. Ann Biomed Eng 2020, 48, 1991–2001. [Google Scholar] [CrossRef]
- Pancera, M.; Zhou, T.; Druz, A.; Georgiev, I.S.; Soto, C.; Gorman, J.; Huang, J.; Acharya, P.; Chuang, G.-Y.; Ofek, G.; et al. Structure and Immune Recognition of Trimeric Pre-Fusion HIV-1 Env. Nature 2014, 514, 455–461. [Google Scholar] [CrossRef]
- Reardon, P.N.; Sage, H.; Dennison, S.M.; Martin, J.W.; Donald, B.R.; Alam, S.M.; Haynes, B.F.; Spicer, L.D. Structure of an HIV-1–Neutralizing Antibody Target, the Lipid-Bound Gp41 Envelope Membrane Proximal Region Trimer. Proc. Natl. Acad. Sci. U.S.A. 2014, 111, 1391–1396. [Google Scholar] [CrossRef]
- Krebs, S.J.; Kwon, Y.D.; Schramm, C.A.; Law, W.H.; Donofrio, G.; Zhou, K.H.; Gift, S.; Dussupt, V.; Georgiev, I.S.; Schätzle, S.; et al. Longitudinal Analysis Reveals Early Development of Three MPER-Directed Neutralizing Antibody Lineages from an HIV-1-Infected Individual. Immunity 2019, 50, 677–691.e13. [Google Scholar] [CrossRef] [PubMed]
- Bachmann, M.F.; Jennings, G.T. Vaccine Delivery: A Matter of Size, Geometry, Kinetics and Molecular Patterns. Nat Rev Immunol 2010, 10, 787–796. [Google Scholar] [CrossRef]
- Ols, S.; Lenart, K.; Arcoverde Cerveira, R.; Miranda, M.C.; Brunette, N.; Kochmann, J.; Corcoran, M.; Skotheim, R.; Philomin, A.; Cagigi, A.; et al. Multivalent Antigen Display on Nanoparticle Immunogens Increases B Cell Clonotype Diversity and Neutralization Breadth to Pneumoviruses. Immunity 2023, 56, 2425–2441.e14. [Google Scholar] [CrossRef]
- Irvine, D.J.; Read, B.J. Shaping Humoral Immunity to Vaccines through Antigen-Displaying Nanoparticles. Current Opinion in Immunology 2020, 65, 1–6. [Google Scholar] [CrossRef] [PubMed]
- Victora, G.D.; Nussenzweig, M.C. Germinal Centers. Annu. Rev. Immunol. 2012, 30, 429–457. [Google Scholar] [CrossRef] [PubMed]
- Mesin, L.; Ersching, J.; Victora, G.D. Germinal Center B Cell Dynamics. Immunity 2016, 45, 471–482. [Google Scholar] [CrossRef]
- Kelly, H.G.; Tan, H.-X.; Juno, J.A.; Esterbauer, R.; Ju, Y.; Jiang, W.; Wimmer, V.C.; Duckworth, B.C.; Groom, J.R.; Caruso, F.; et al. Self-Assembling Influenza Nanoparticle Vaccines Drive Extended Germinal Center Activity and Memory B Cell Maturation. JCI Insight 2020, 5, e136653. [Google Scholar] [CrossRef] [PubMed]
- Ursin, R.L.; Dhakal, S.; Liu, H.; Jayaraman, S.; Park, H.-S.; Powell, H.R.; Sherer, M.L.; Littlefield, K.E.; Fink, A.L.; Ma, Z.; et al. Greater Breadth of Vaccine-Induced Immunity in Females than Males Is Mediated by Increased Antibody Diversity in Germinal Center B Cells. mBio 2022, 13, e01839-22. [Google Scholar] [CrossRef]
- de Taeye, S.W.; Ozorowski, G.; Torrents de la Peña, A.; Guttman, M.; Julien, J.-P.; van den Kerkhof, T.L.G.M.; Burger, J.A.; Pritchard, L.K.; Pugach, P.; Yasmeen, A.; et al. Immunogenicity of Stabilized HIV-1 Envelope Trimers with Reduced Exposure of Non-Neutralizing Epitopes. Cell 2015, 163, 1702–1715. [Google Scholar] [CrossRef]
- Sok, D.; Burton, D.R. Recent Progress in Broadly Neutralizing Antibodies to HIV. Nat Immunol 2018, 19, 1179–1188. [Google Scholar] [CrossRef]
- Eisen, H.N.; Siskind, G.W. Variations in Affinities of Antibodies during the Immune Response*. Biochemistry 1964, 3, 996–1008. [Google Scholar] [CrossRef] [PubMed]
- Krammer, F.; Palese, P. Advances in the Development of Influenza Virus Vaccines. Nat Rev Drug Discov 2015, 14, 167–182. [Google Scholar] [CrossRef]
- Setliff, I.; Shiakolas, A.R.; Pilewski, K.A.; Murji, A.A.; Mapengo, R.E.; Janowska, K.; Richardson, S.; Oosthuysen, C.; Raju, N.; Ronsard, L.; et al. High-Throughput Mapping of B Cell Receptor Sequences to Antigen Specificity. Cell 2019, 179, 1636–1646.e15. [Google Scholar] [CrossRef]
- Kong, R.; Duan, H.; Sheng, Z.; Xu, K.; Acharya, P.; Chen, X.; Cheng, C.; Dingens, A.S.; Gorman, J.; Sastry, M.; et al. Antibody Lineages with Vaccine-Induced Antigen-Binding Hotspots Develop Broad HIV Neutralization. Cell 2019, 178, 567–584.e19. [Google Scholar] [CrossRef] [PubMed]
- Conti, S.; Kaczorowski, K.J.; Song, G.; Porter, K.; Andrabi, R.; Burton, D.R.; Chakraborty, A.K.; Karplus, M. Design of Immunogens to Elicit Broadly Neutralizing Antibodies against HIV Targeting the CD4 Binding Site. Proc Natl Acad Sci U S A 2021, 118, e2018338118. [Google Scholar] [CrossRef] [PubMed]
- Rojas, E.R.; Billings, G.; Odermatt, P.D.; Auer, G.K.; Zhu, L.; Miguel, A.; Chang, F.; Weibel, D.B.; Theriot, J.A.; Huang, K.C. The Outer Membrane Is an Essential Load-Bearing Element in Gram-Negative Bacteria. Nature 2018, 559, 617–621. [Google Scholar] [CrossRef]
- Nicolay, T.; Vanderleyden, J.; Spaepen, S. Autotransporter-Based Cell Surface Display in Gram-Negative Bacteria. Crit Rev Microbiol 2015, 41, 109–123. [Google Scholar] [CrossRef]
- Pugach, P.; Ozorowski, G.; Cupo, A.; Ringe, R.; Yasmeen, A.; De Val, N.; Derking, R.; Kim, H.J.; Korzun, J.; Golabek, M.; et al. A Native-Like SOSIP.664 Trimer Based on an HIV-1 Subtype B Env Gene. J Virol 2015, 89, 3380–3395. [Google Scholar] [CrossRef]
- Gray, E.S.; Madiga, M.C.; Moore, P.L.; Mlisana, K.; Karim, S.S.; Binley, J.M.; Shaw, G.M.; Mascola, J.R.; Morris, L. Broad HIV-1 Neutralization Mediated by Plasma Antibodies against the Gp41 Membrane Proximal External Region. J Virol 2009. [Google Scholar] [CrossRef]
- Schiffner, T.; Phung, I.; Ray, R.; Irimia, A.; Tian, M.; Swanson, O.; Lee, J.H.; Lee, C.-C.D.; Marina-Zárate, E.; Cho, S.Y.; et al. Vaccination Induces Broadly Neutralizing Antibody Precursors to HIV Gp41. Nat Immunol 2024, 25, 1073–1082. [Google Scholar] [CrossRef] [PubMed]
- Xu, K.; Acharya, P.; Kong, R.; Cheng, C.; Chuang, G.-Y.; Liu, K.; Louder, M.K.; O’Dell, S.; Rawi, R.; Sastry, M.; et al. Epitope-Based Vaccine Design Yields Fusion Peptide-Directed Antibodies That Neutralize Diverse Strains of HIV-1. Nat Med 2018, 24, 857–867. [Google Scholar] [CrossRef] [PubMed]
- Croft, M. The Role of TNF Superfamily Members in T-Cell Function and Diseases. Nat Rev Immunol 2009, 9, 271–285. [Google Scholar] [CrossRef]
- Watts, T.H. TNF/TNFR FAMILY MEMBERS IN COSTIMULATION OF T CELL RESPONSES. Annu. Rev. Immunol. 2005, 23, 23–68. [Google Scholar] [CrossRef]
- Shen, C.H.; DeKosky, B.J.; Guo, Y.; Xu, K.; Gu, Y.; Kilam, D.; Ko, S.H.; Kong, R.; Liu, K.; Louder, M.K.; et al. VRC34-Antibody Lineage Development Reveals How a Required Rare Mutation Shapes the Maturation of a Broad HIV-Neutralizing Lineage. Cell Host Microbe 2020, 27, 531–543 e6. [Google Scholar] [CrossRef]
- Gao, G.; Wieczorek, L.; Peachman, K.K.; Polonis, V.R.; Alving, C.R.; Rao, M.; Rao, V.B. Designing a Soluble near Full-Length HIV-1 Gp41 Trimer. J Biol Chem 2013, 288, 234–246. [Google Scholar] [CrossRef]
- Krebs, S.J.; McBurney, S.P.; Kovarik, D.N.; Waddell, C.D.; Jaworski, J.P.; Sutton, W.F.; Gomes, M.M.; Trovato, M.; Waagmeester, G.; Barnett, S.J.; et al. Multimeric Scaffolds Displaying the HIV-1 Envelope MPER Induce MPER-Specific Antibodies and Cross-Neutralizing Antibodies When Co-Immunized with Gp160 DNA. PLoS ONE 2014, 9, e113463. [Google Scholar] [CrossRef]
- Meuskens, I.; Saragliadis, A.; Leo, J.C.; Linke, D. Type V Secretion Systems: An Overview of Passenger Domain Functions. Front. Microbiol. 2019, 10, 1163. [Google Scholar] [CrossRef]
- van Ulsen, P.; Zinner, K.M.; Jong, W.S.P.; Luirink, J. On Display: Autotransporter Secretion and Application. FEMS Microbiol Letters 2018, 365. [Google Scholar] [CrossRef] [PubMed]
Figure 1.
Predicted tertiary structures of the five 3AGJ vaccine designs (V1–V5) generated with AlphaFold2 v2.3.0. Each panel (a–e) shows three views of the same model: a front view, a 180-degree rotated view, and a top-down view looking toward the expressed antigen. Structural elements are color-coded as follows: 3DA motif (magenta), immunomodulators (PADRE in red, rSIP in orange, FLIC in wheat, OX40L in silver), linkers (GS×4 -L1, AQQASSS×3 -L2, (EAAAK)4–L–(EAAAK)4 -L3; green), the Scaffold-MPER 3AGJ (yellow), and the AIDA-I β-barrel (pink). (a) V1 Design containing 3DA, the Scaffold-MPER 3AGJ domain, and AIDA-I. (b) V2 Design containing 3DA, PADRE, the GS×4 linker (L1), Scaffold-MPER 3AGJ, and AIDA-I. (c) V3 Design containing 3DA, PADRE, L1, FLIC, L1, Scaffold-MPER 3AGJ, and AIDA-I. (d) V4 Design containing 3DA, PADRE, L1, rSIP, L1, FLIC, the AQQASSS×3 linker (L3), Scaffold-MPER 3AGJ, the AEAAAK linker (L2), and a second Scaffold-MPER 3AGJ domain. (e) V5 Design containing 3DA, PADRE, L1, rSIP, L1, FLIC, L1, OX40L, L3, Scaffold-MPER 3AGJ, L2, and a second Scaffold-MPER 3AGJ domain. All AlphaFold2 models produced high pLDDT and pTM confidence scores (>85%). AlphaFold2 does not account for the bacterial outer membrane, so any predicted orientation in which the antigen extends downward along the β-barrel would not occur in vivo because that space is blocked by the outer membrane lipid bilayer. The structures should therefore be interpreted in the light of the software limitations. Abbreviations: 3DA, DADADA motif; PADRE, Pan DR epitope; rSIP, Group B Streptococcus recombinant surface immunogenic protein; FLIC, flagellin fragment (TLR5 agonist); OX40L, OX40 ligand peptide; L1, GS×4 linker; L2, AQQASSS×3 linker; L3, (EAAAK)4–L–(EAAAK)4 linker; 3AGJ, scaffolded HIV-1 MPER antigen; AIDA-I, autotransporter β-barrel domain.
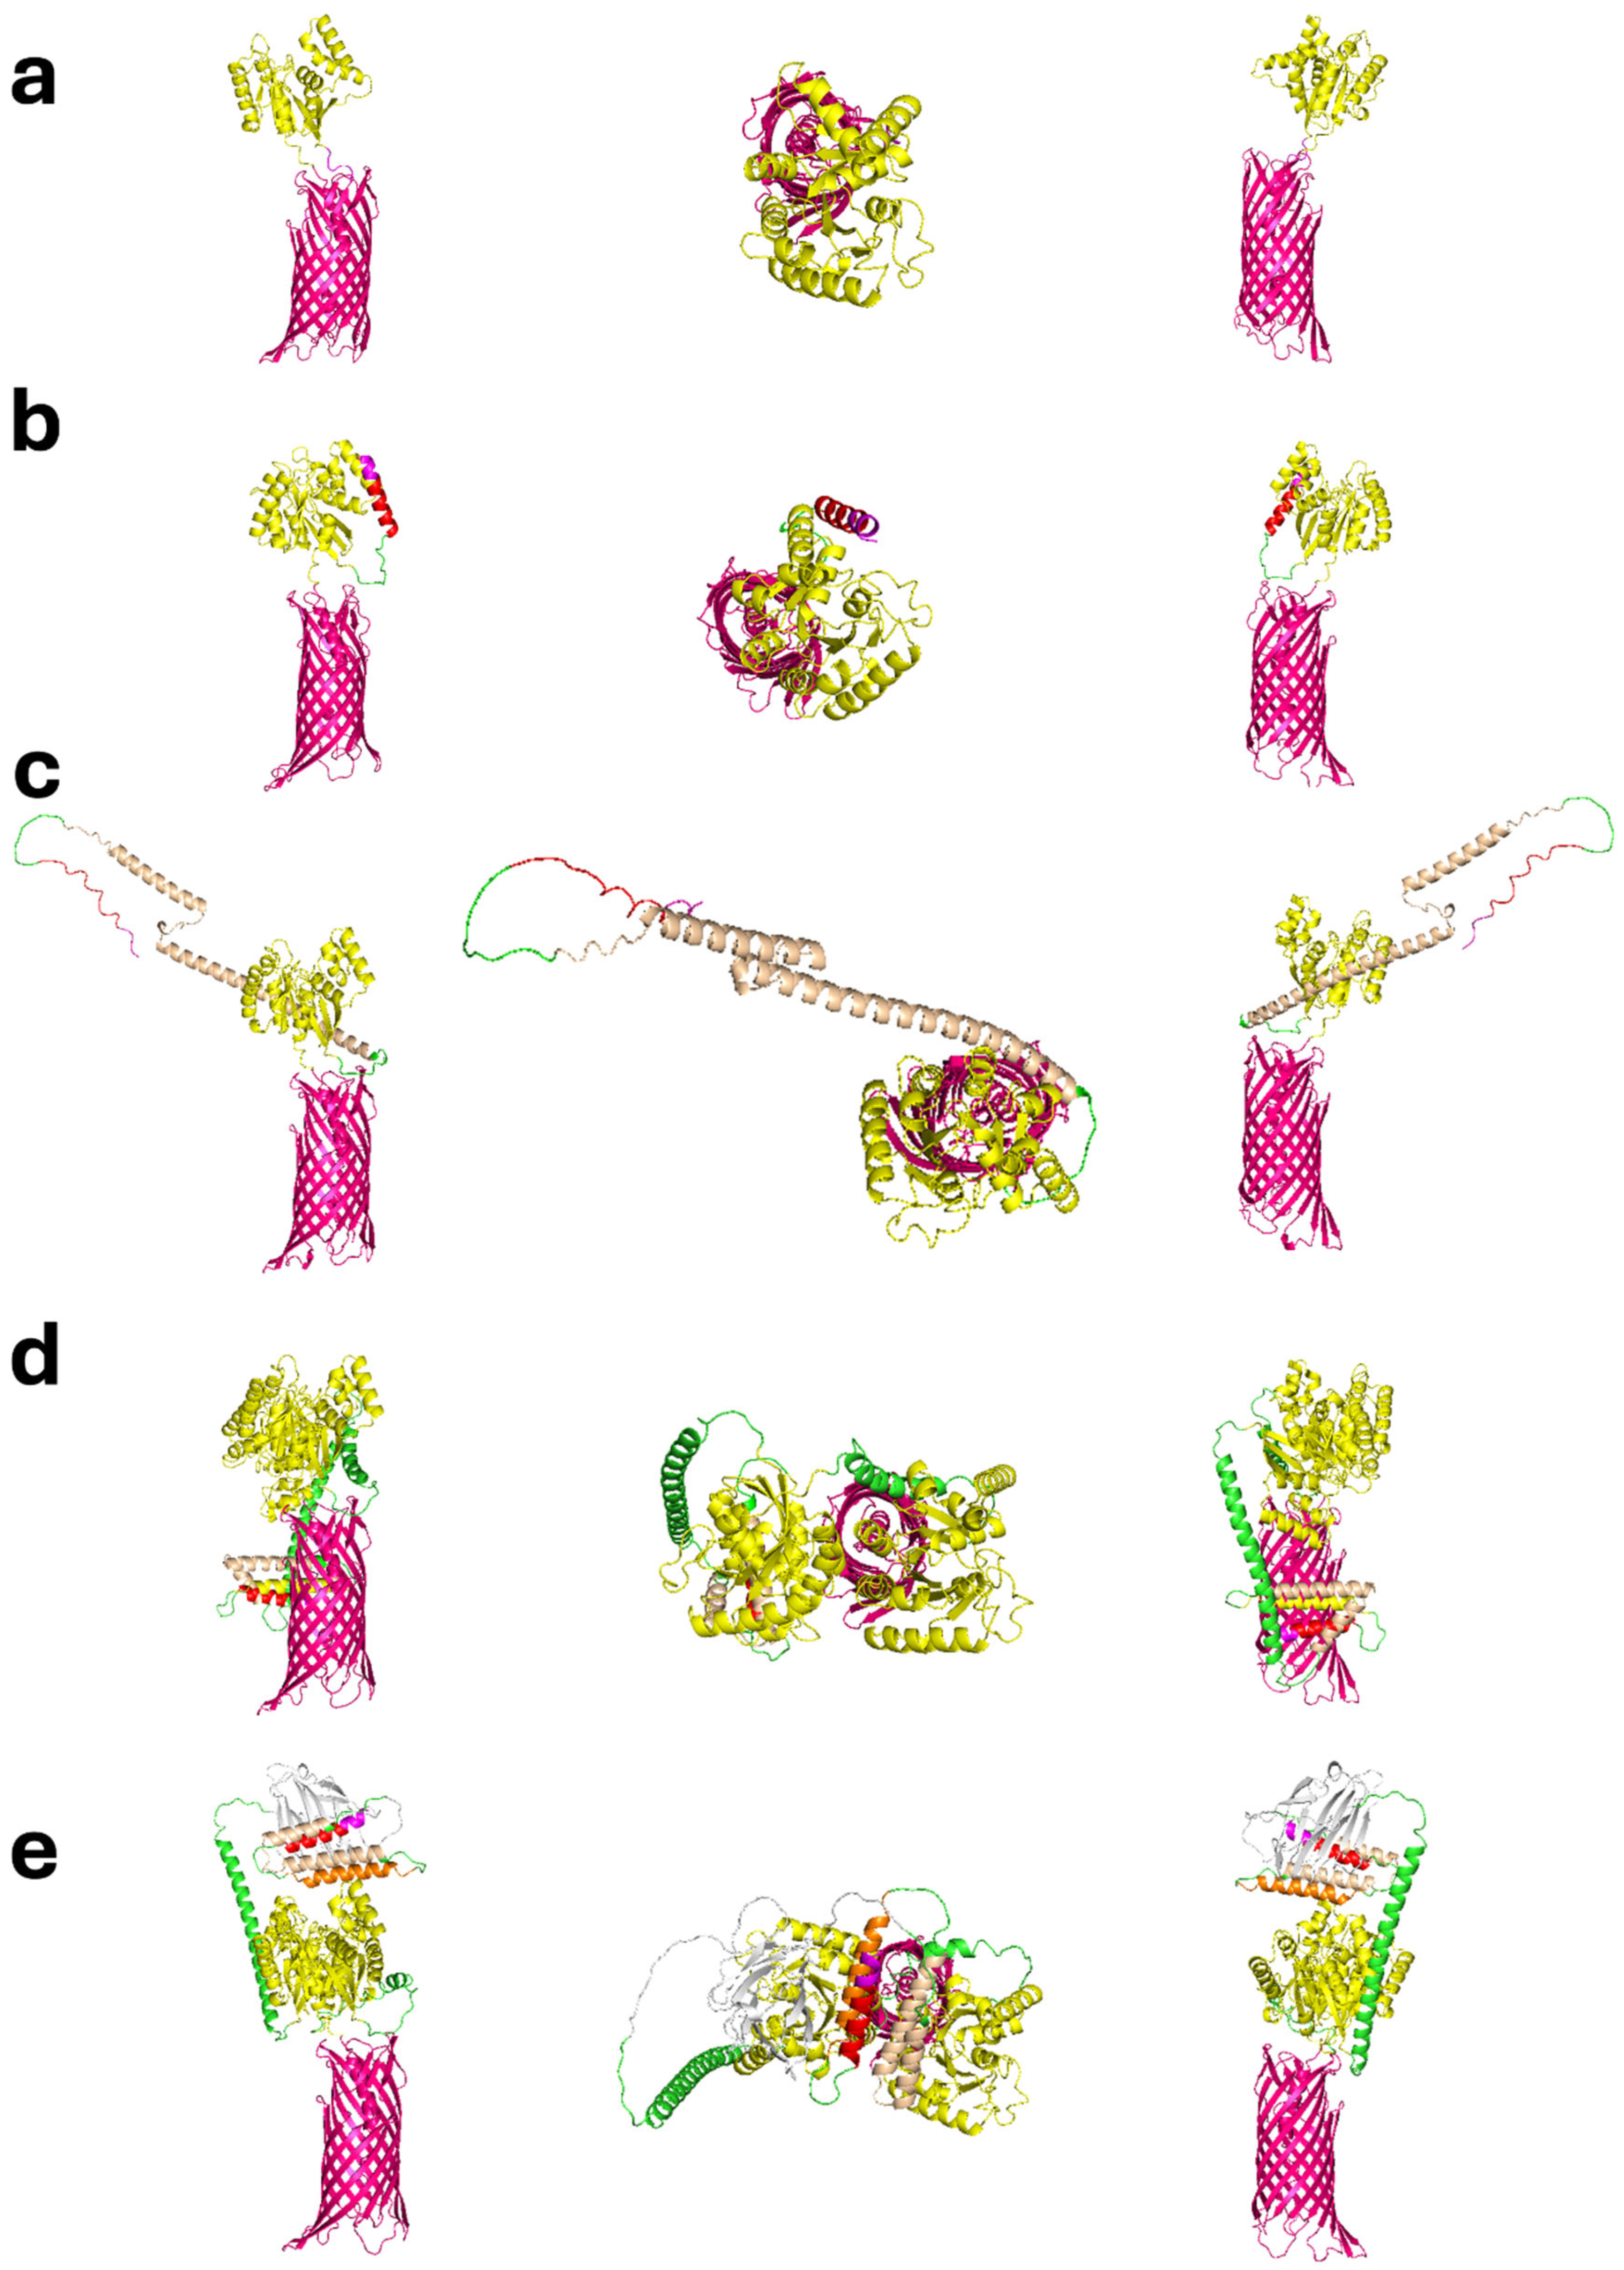
Figure 2.
Flow cytometric analysis of 2F5 binding to formalin-inactivated KWC/GRB cells expressing the V1–V5 immunogen designs. Binding was measured across a range of 2F5 concentrations (µg/mL, log10 scale). Each curve shows the percentage of 2F5-positive cells. ME5125 cells without a passenger domain served as the baseline control (red). Curves are colored as follows: V1 (blue), V2 (green), V3 (orange), V4 (purple), and V5 (brown). All vaccines showed clear, concentration-dependent binding that reached a plateau at higher antibody concentrations. V4 and V5 curves shifted left relative to V1–V3, indicating stronger surface exposure of the Scaffold-MPER 3AGJ epitope and higher apparent binding by 2F5. These data confirm that all vaccines displayed MPER on the bacterial surface, and that multimeric designs (V4 and V5) increased antigen accessibility. Abbreviations: KWC/GRB, killed whole-cell/genome-reduced bacteria; 2F5, MPER-specific broadly neutralizing antibody; ME5125, genome-reduced E. coli strain used as baseline control; MPER, membrane-proximal external region; 3AGJ, scaffolded HIV-1 MPER antigen.
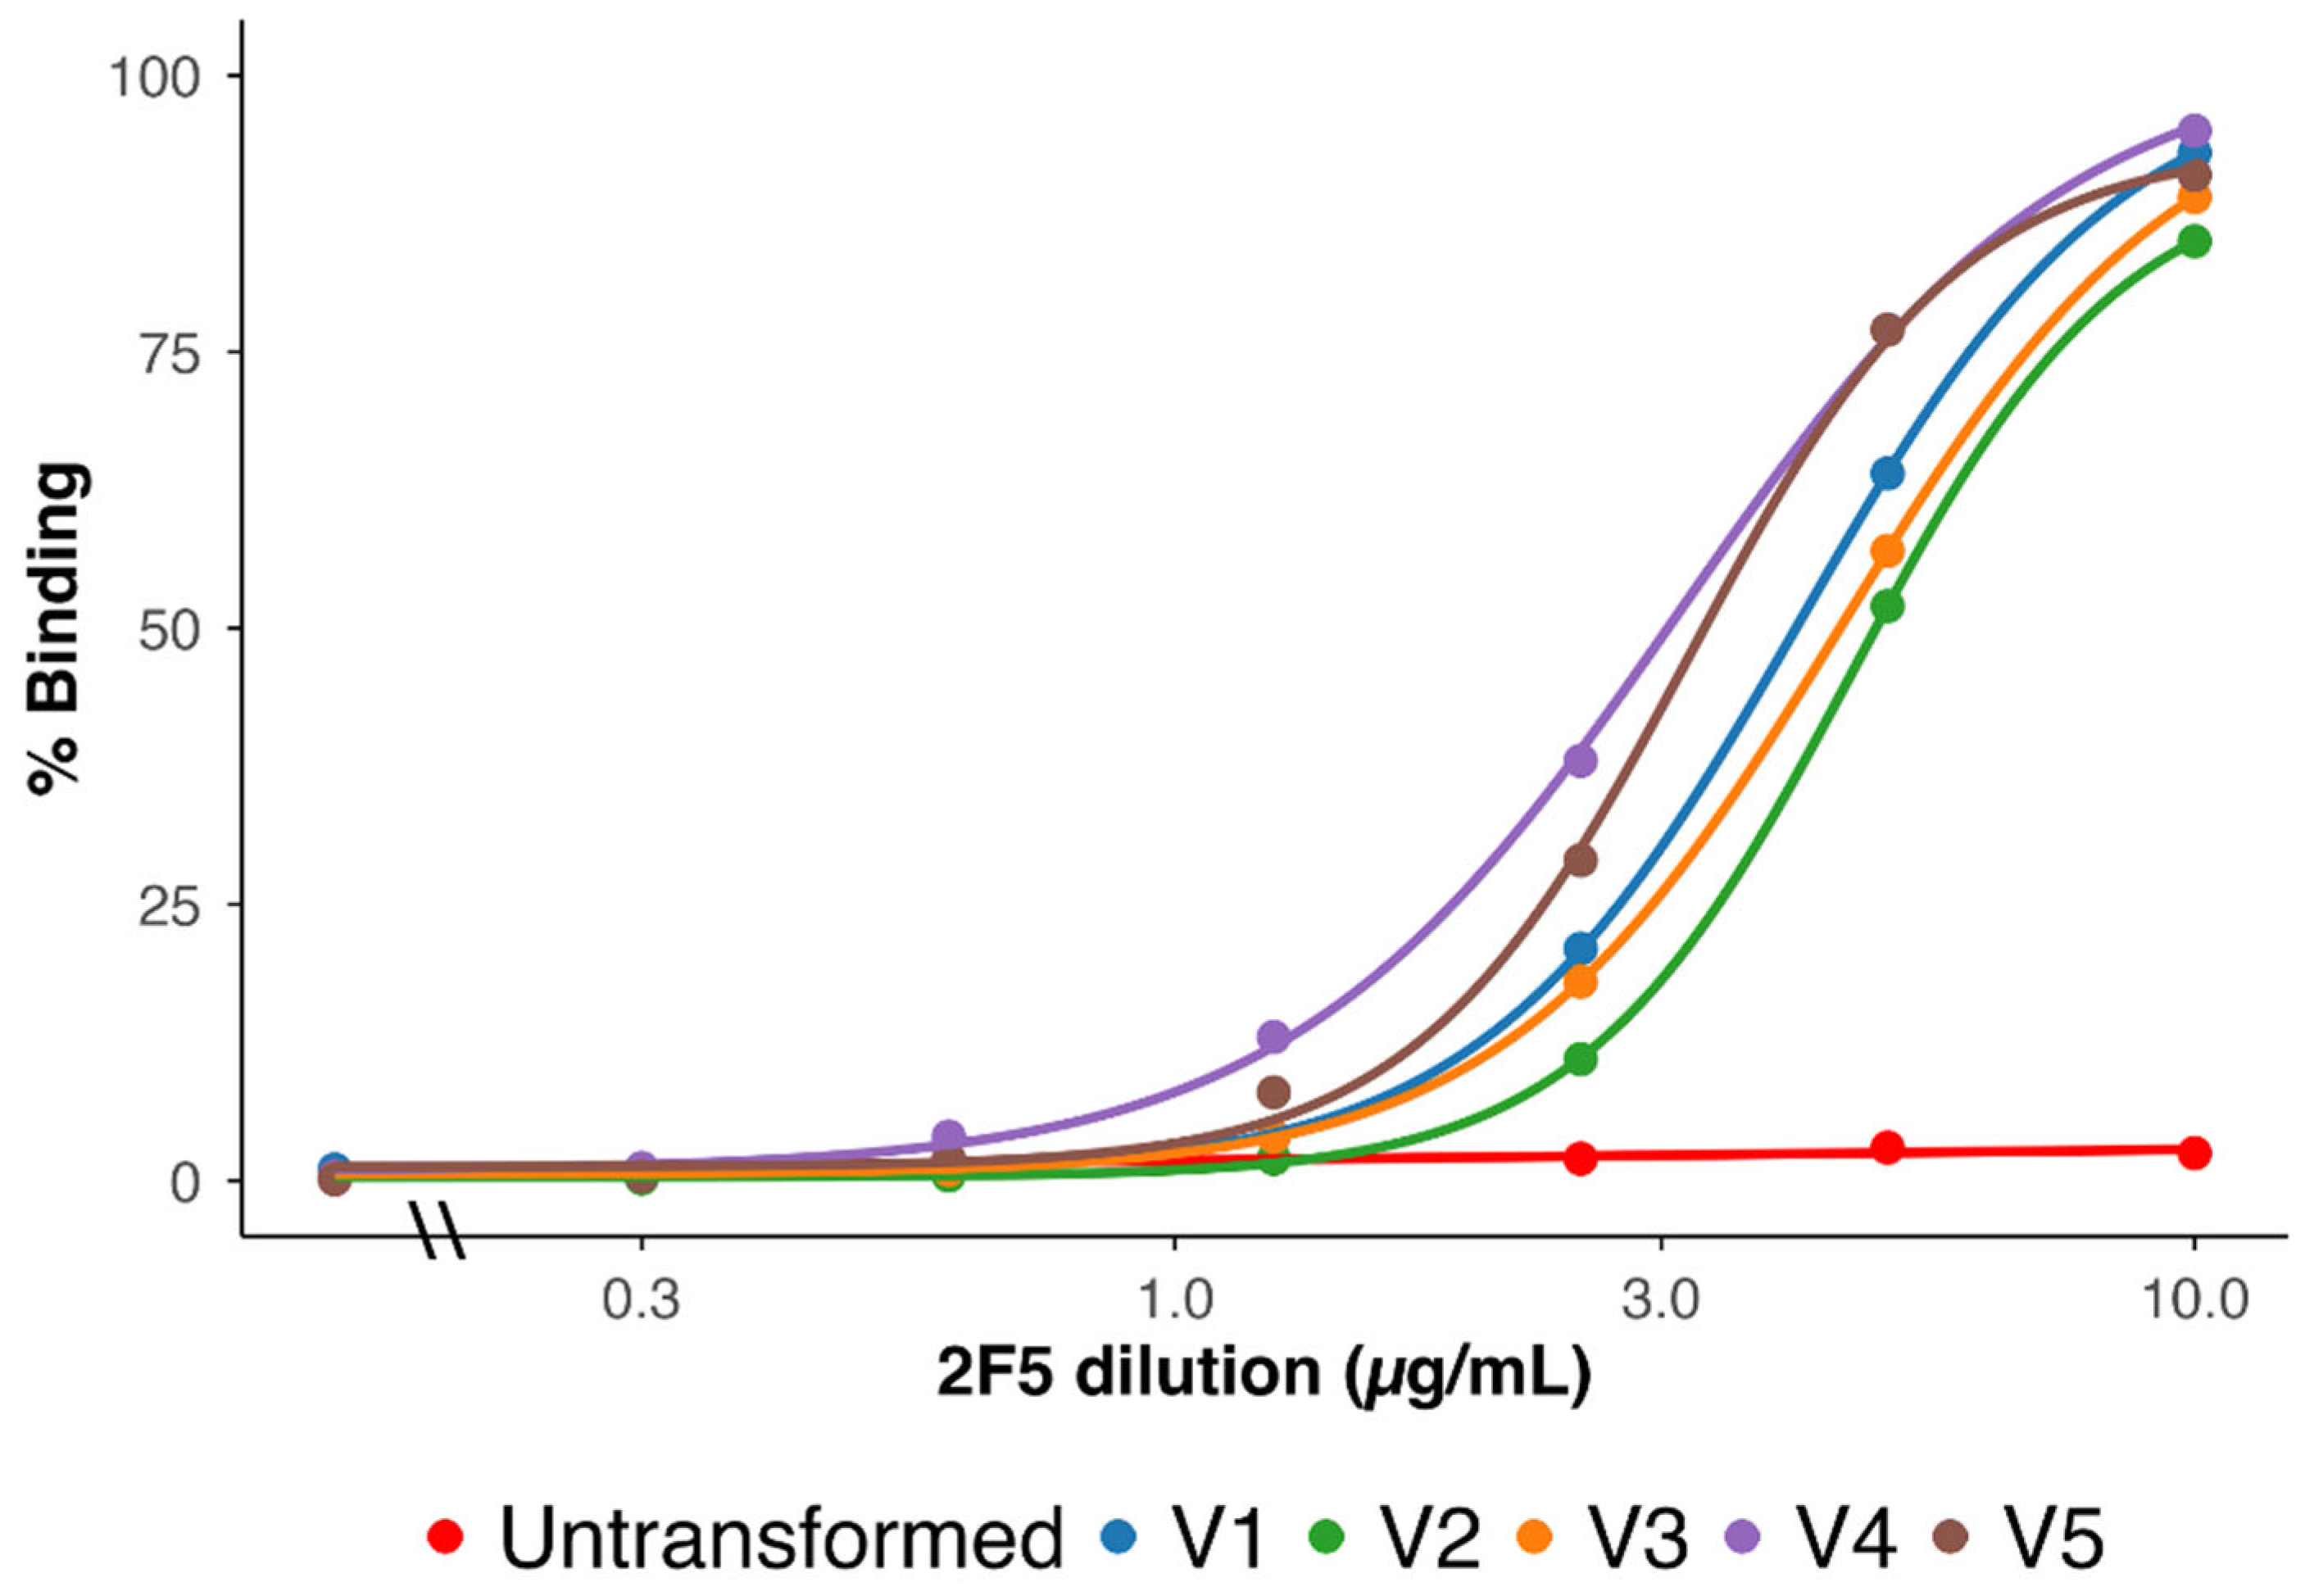
Figure 3.
Vaccination regimen and longitudinal anti-MPER antibody responses induced by 3AGJ MPER vaccines. (a) Schematic of the vaccination schedule. Mice (n = 5 per group; V4 = 4) received intramuscular doses of 5 × 10⁹ inactivated bacteria at weeks 0, 3, 6, 9, and 12; plasma samples were collected at each time point, with terminal sampling at week 15. (b) ELISA quantification of plasma binding to synthetic MPER peptide. Data represent mean ± SEM AUC values per vaccine group over time. All vaccines elicited robust anti-MPER IgG responses that progressively increased with boosting; V4 and V5 achieved the highest endpoint titers. Abbreviations: MPER, membrane-proximal external region; AUC(ELISA), area under the ELISA binding curve; SEM, standard error of the mean; IM, intramuscular; 3AGJ, scaffolded HIV-1 MPER antigen.
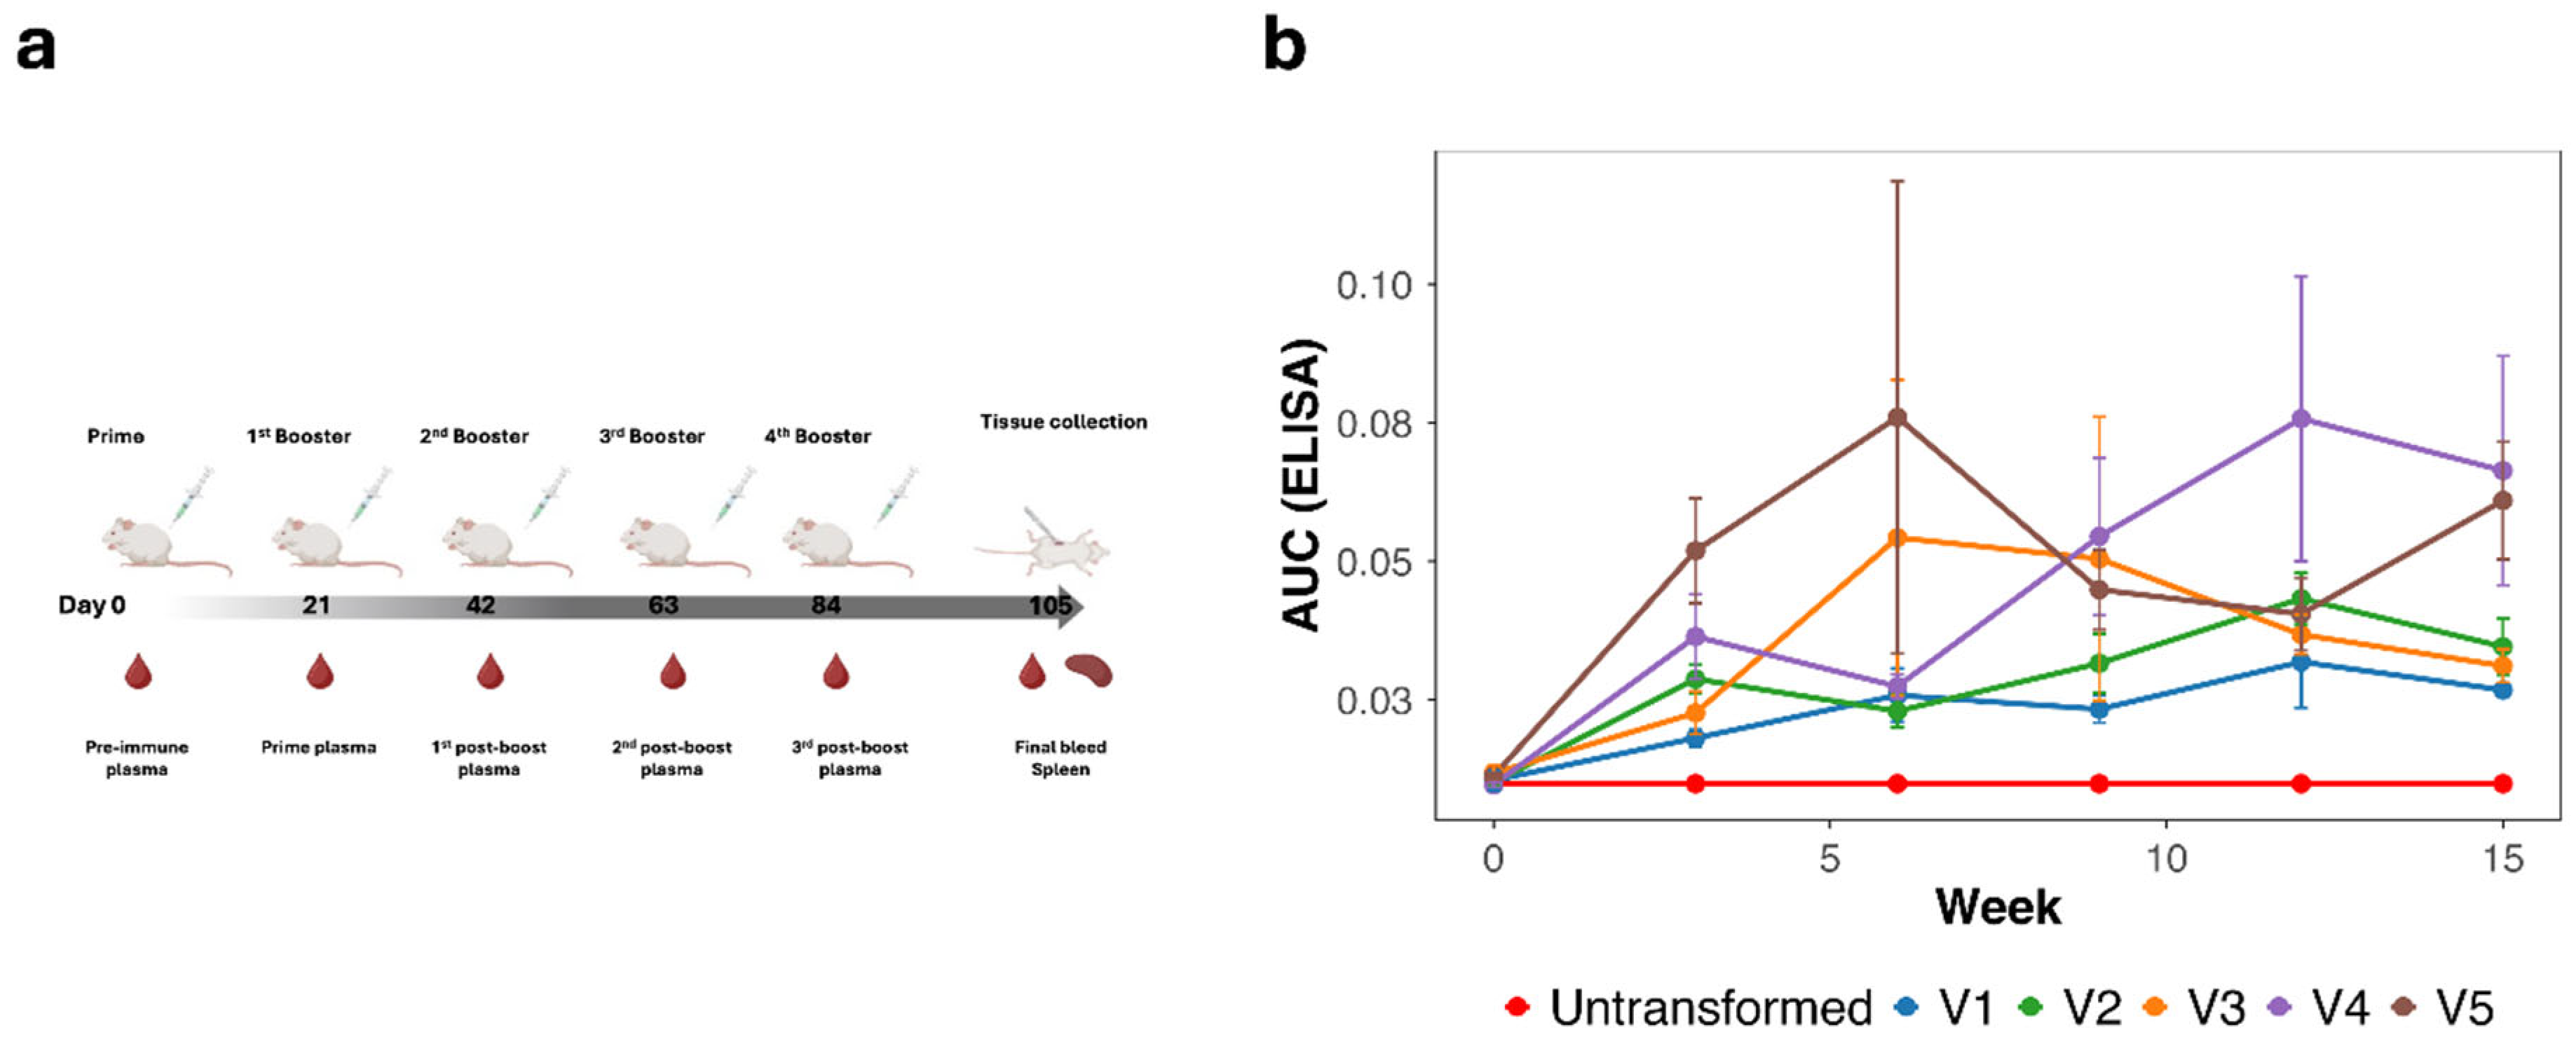
Figure 4.
Neutralizing antibody titers (ID50) measured at week 15 in individual mice vaccinated with 3AGJ MPER vaccines (V1–V5). Neutralization ability was tested using HIV-1 Env pseudoviruses CNE55 (tier-2), X1632_S2_B10 (tier-2), 25710-2.43 (tier-1B), and MN.3 (tier-1A), shown here in the same order as the panels in the figure. Each colored dot represents one mouse; black diamonds indicate the group mean ± SEM. Dashed lines show the predefined neutralization cutoffs for each virus (84.2 for CNE55, 121 for X1632_S2_B10, 63 for 25710-2.43, and 45 for MN.3). Titers above these thresholds were considered positive. Neutralizing activity was sporadic but detectable, appearing most often against the tier-1B virus 25710-2.43, less frequently against MN.3 and CNE55, and not observed against the tier-2 virus X1632_S2_B10. Abbreviations: ID50, 50% inhibitory dilution; SEM, standard error of the mean; MPER, membrane-proximal external region; 3AGJ, scaffolded HIV-1 MPER antigen.
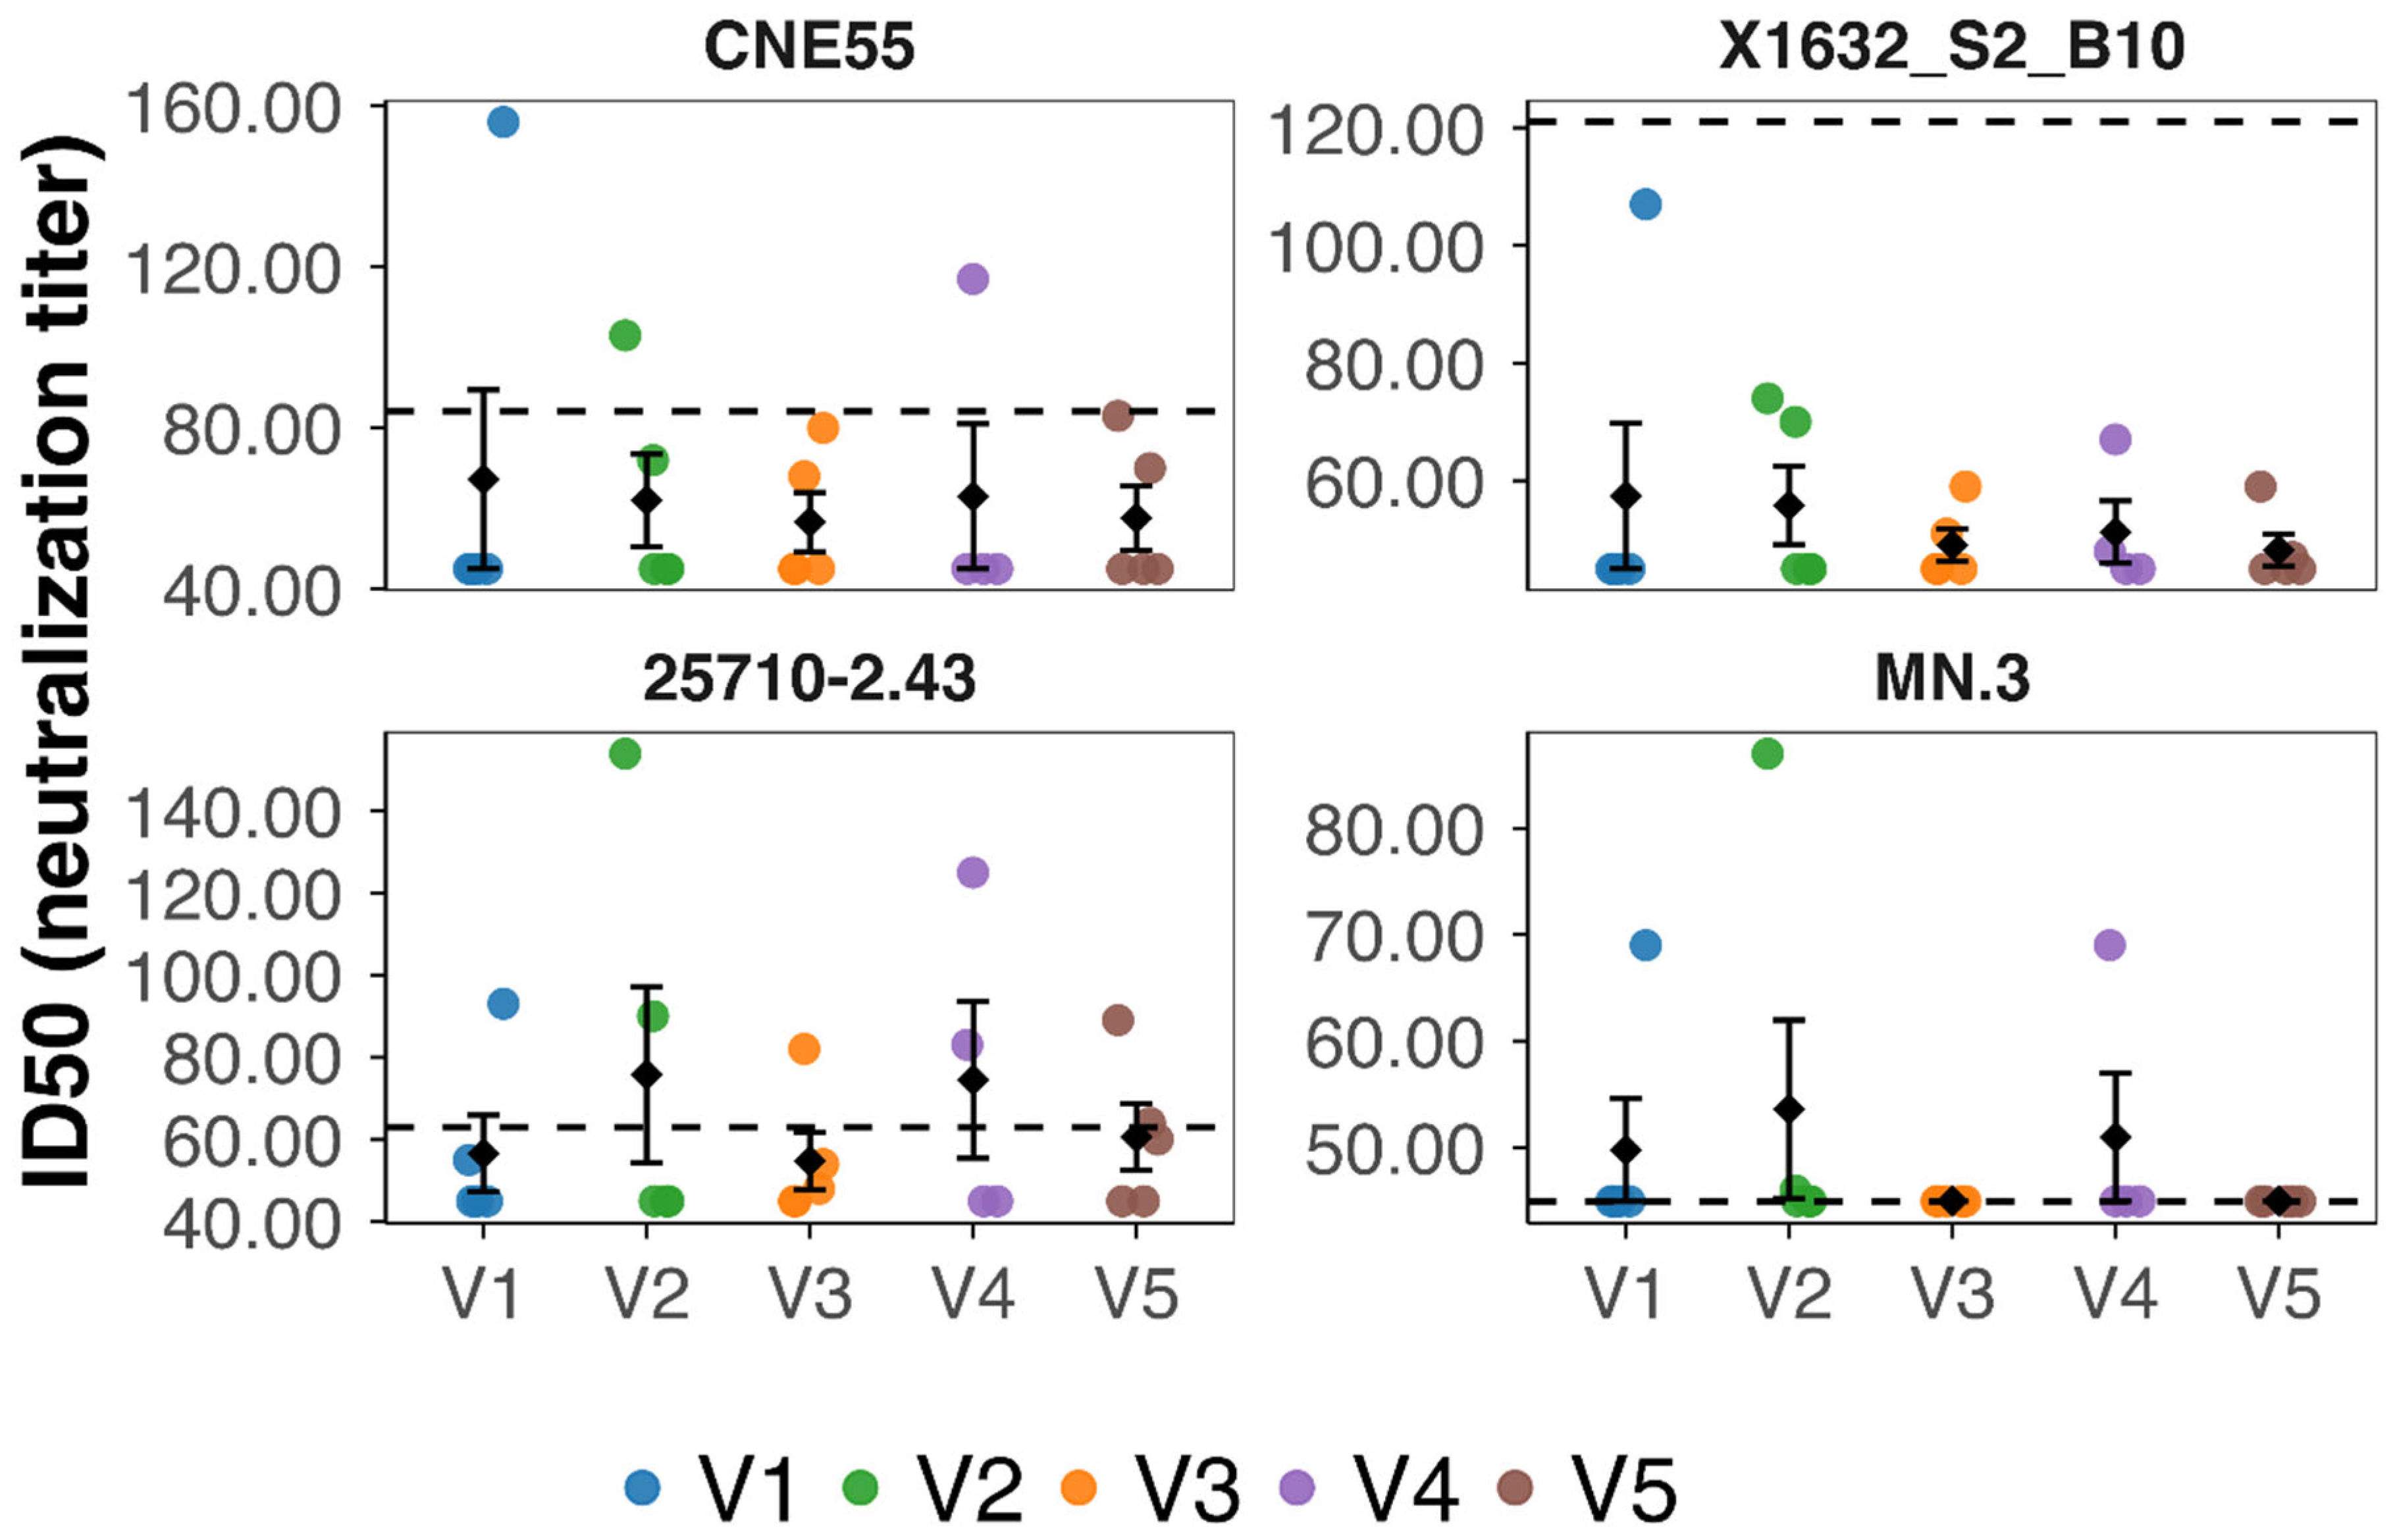
Figure 5.
Correlation between AUC(ELISA) and AUC(FLOW) at weeks 3 (a), 6 (b), 9 (c), 12 (d), and 15 (e). Each panel shows individual animal data points (n=24) with a linear regression line and the corresponding 95% confidence interval. All panels share the same y-axis scale to allow direct comparison across time points. Significant positive correlations were observed at weeks 3 (Pearson r = 0.43, p = 0.036) and 15 (Pearson r = 0.55, p = 0.005), indicating an association between antigen exposure measured by flow cytometry and the magnitude of the ELISA antibody response at these time points. Abbreviations: AUC(ELISA), area under the ELISA binding curve; AUC(FLOW), integrated flow cytometry signal.
Figure 6.
Correlation between AUC(ELISA) and exposure_score (−log10(EC50_FLOW)) at weeks 3 (a), 6 (b), 9 (c), 12 (d), and 15 (e). Each dot represents one animal (n = 24). Solid lines indicate the linear regression fit with the corresponding 95% confidence intervals. Significant correlations were observed at weeks 3 (Pearson r = 0.57, p = 0.0039) and 15 (Pearson r = 0.60, p = 0.0017). Abbreviations: AUC(ELISA), area under the ELISA binding curve; EC50, half-maximal effective concentration; EC50_FLOW, EC50 derived from flow-cytometry binding curves; exposure_score, −log10(EC50_FLOW).
Figure 7.
Temporal evolution of Pearson correlation coefficients between AUC(ELISA) and flow-cytometry parameters. Solid line = ELISA vs exposure_score (−log10 EC50_FLOW); dashed line = ELISA vs AUC(FLOW). Asterisks indicate statistical significance (p < 0.05). The strong correlation at week 3 likely reflects the early phase of the response, when antibody levels were still low and closely tracked antigen exposure. The renewed correlation at week 15 suggests that antigen display again influenced antibody titers after the final immunization. Intermediate weeks show weaker association. Abbreviations: AUC(ELISA), area under the ELISA binding curve; AUC(FLOW), integrated flow-cytometry signal; EC50, half-maximal effective concentration; EC50_FLOW, EC50 derived from flow-cytometry binding curves; exposure_score, −log10(EC50).
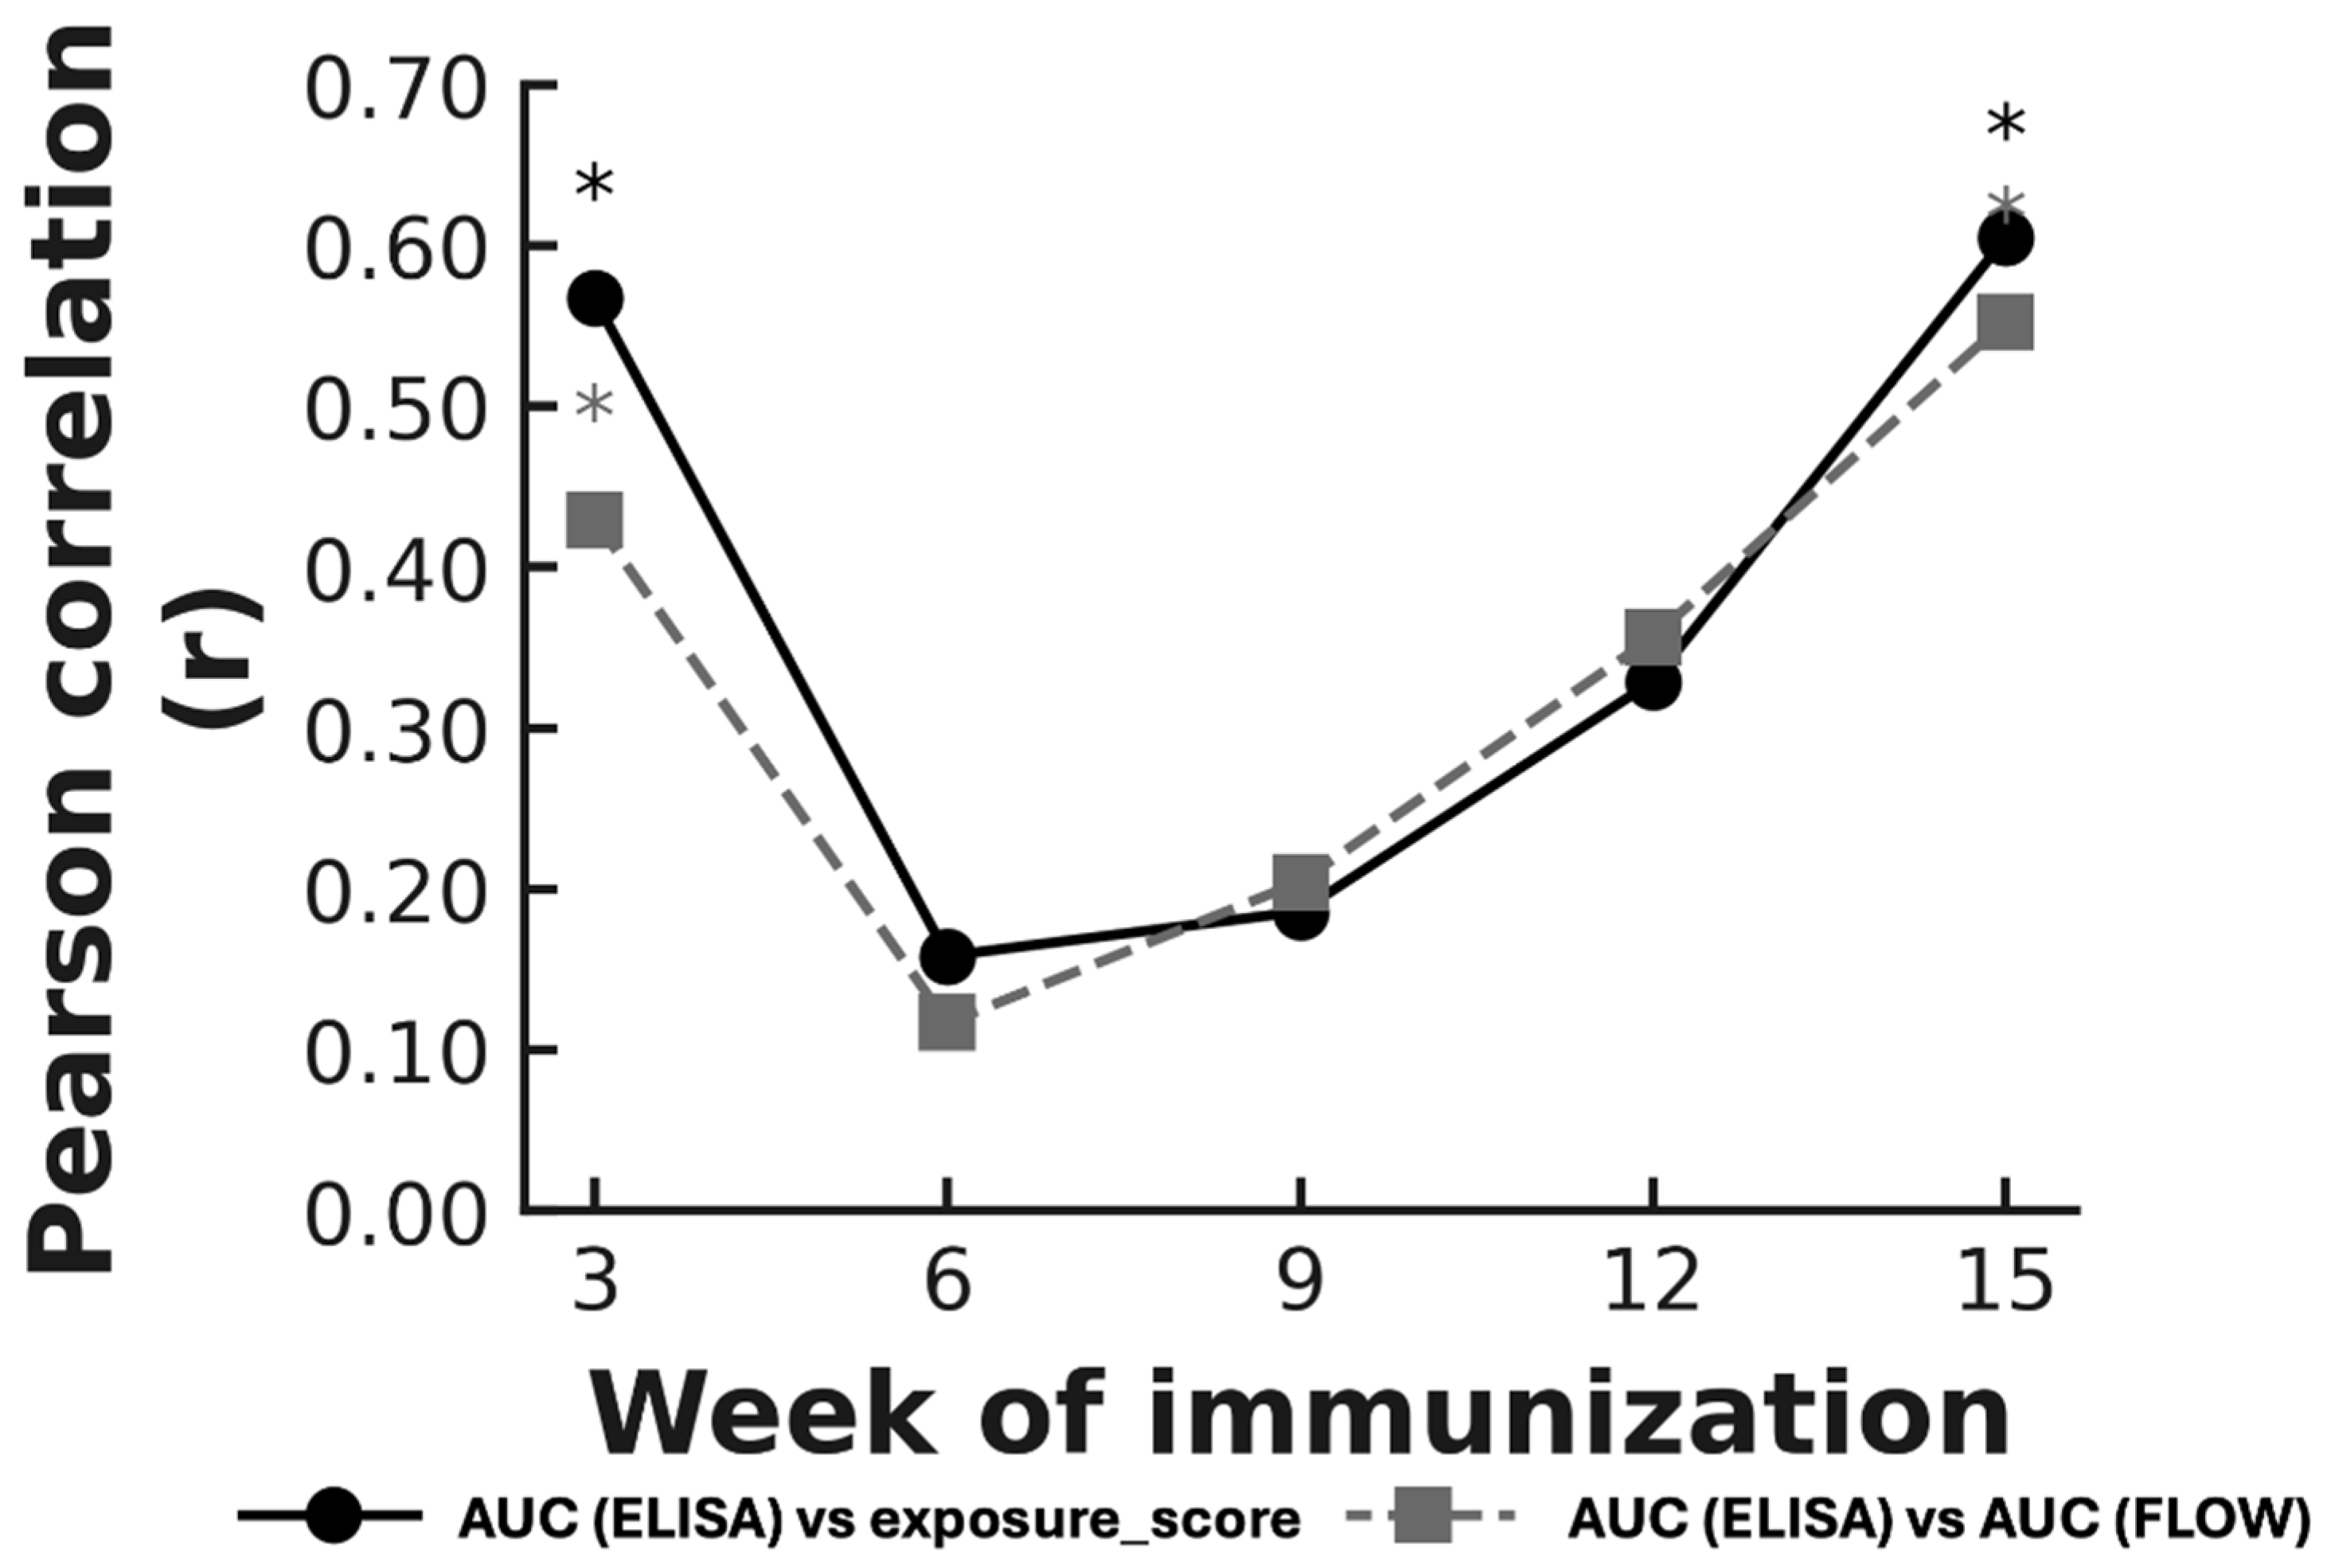
Figure 8.
Integrated multivariate modeling of display, binding, and neutralization. (a) PCA score plot showing animal-level clustering based on exposure_score, AUC(ELISA), and mean log10ID50. Symbols indicate vaccine candidates (V1–V5) labeled by animal ID. (b) PCA variable loadings plot illustrating the relative contributions of display (exposure_score), binding (AUC(ELISA)), and neutralization (mean log10ID50) to PC1 and PC2. V4 and V5 cluster in the upper-right quadrant, combining strong display/binding with moderate neutralization, consistent with orthogonal determinants of immune performance. PCA, principal component analysis; PC1, first principal component; PC2, second principal component; exposure_score, −log10(EC50); AUC(ELISA), area under the ELISA binding curve; mean log10ID50, average log10-transformed neutralization titer. M indicates a male mouse, F indicates a female mouse, with the numbers providing the individual identifier.
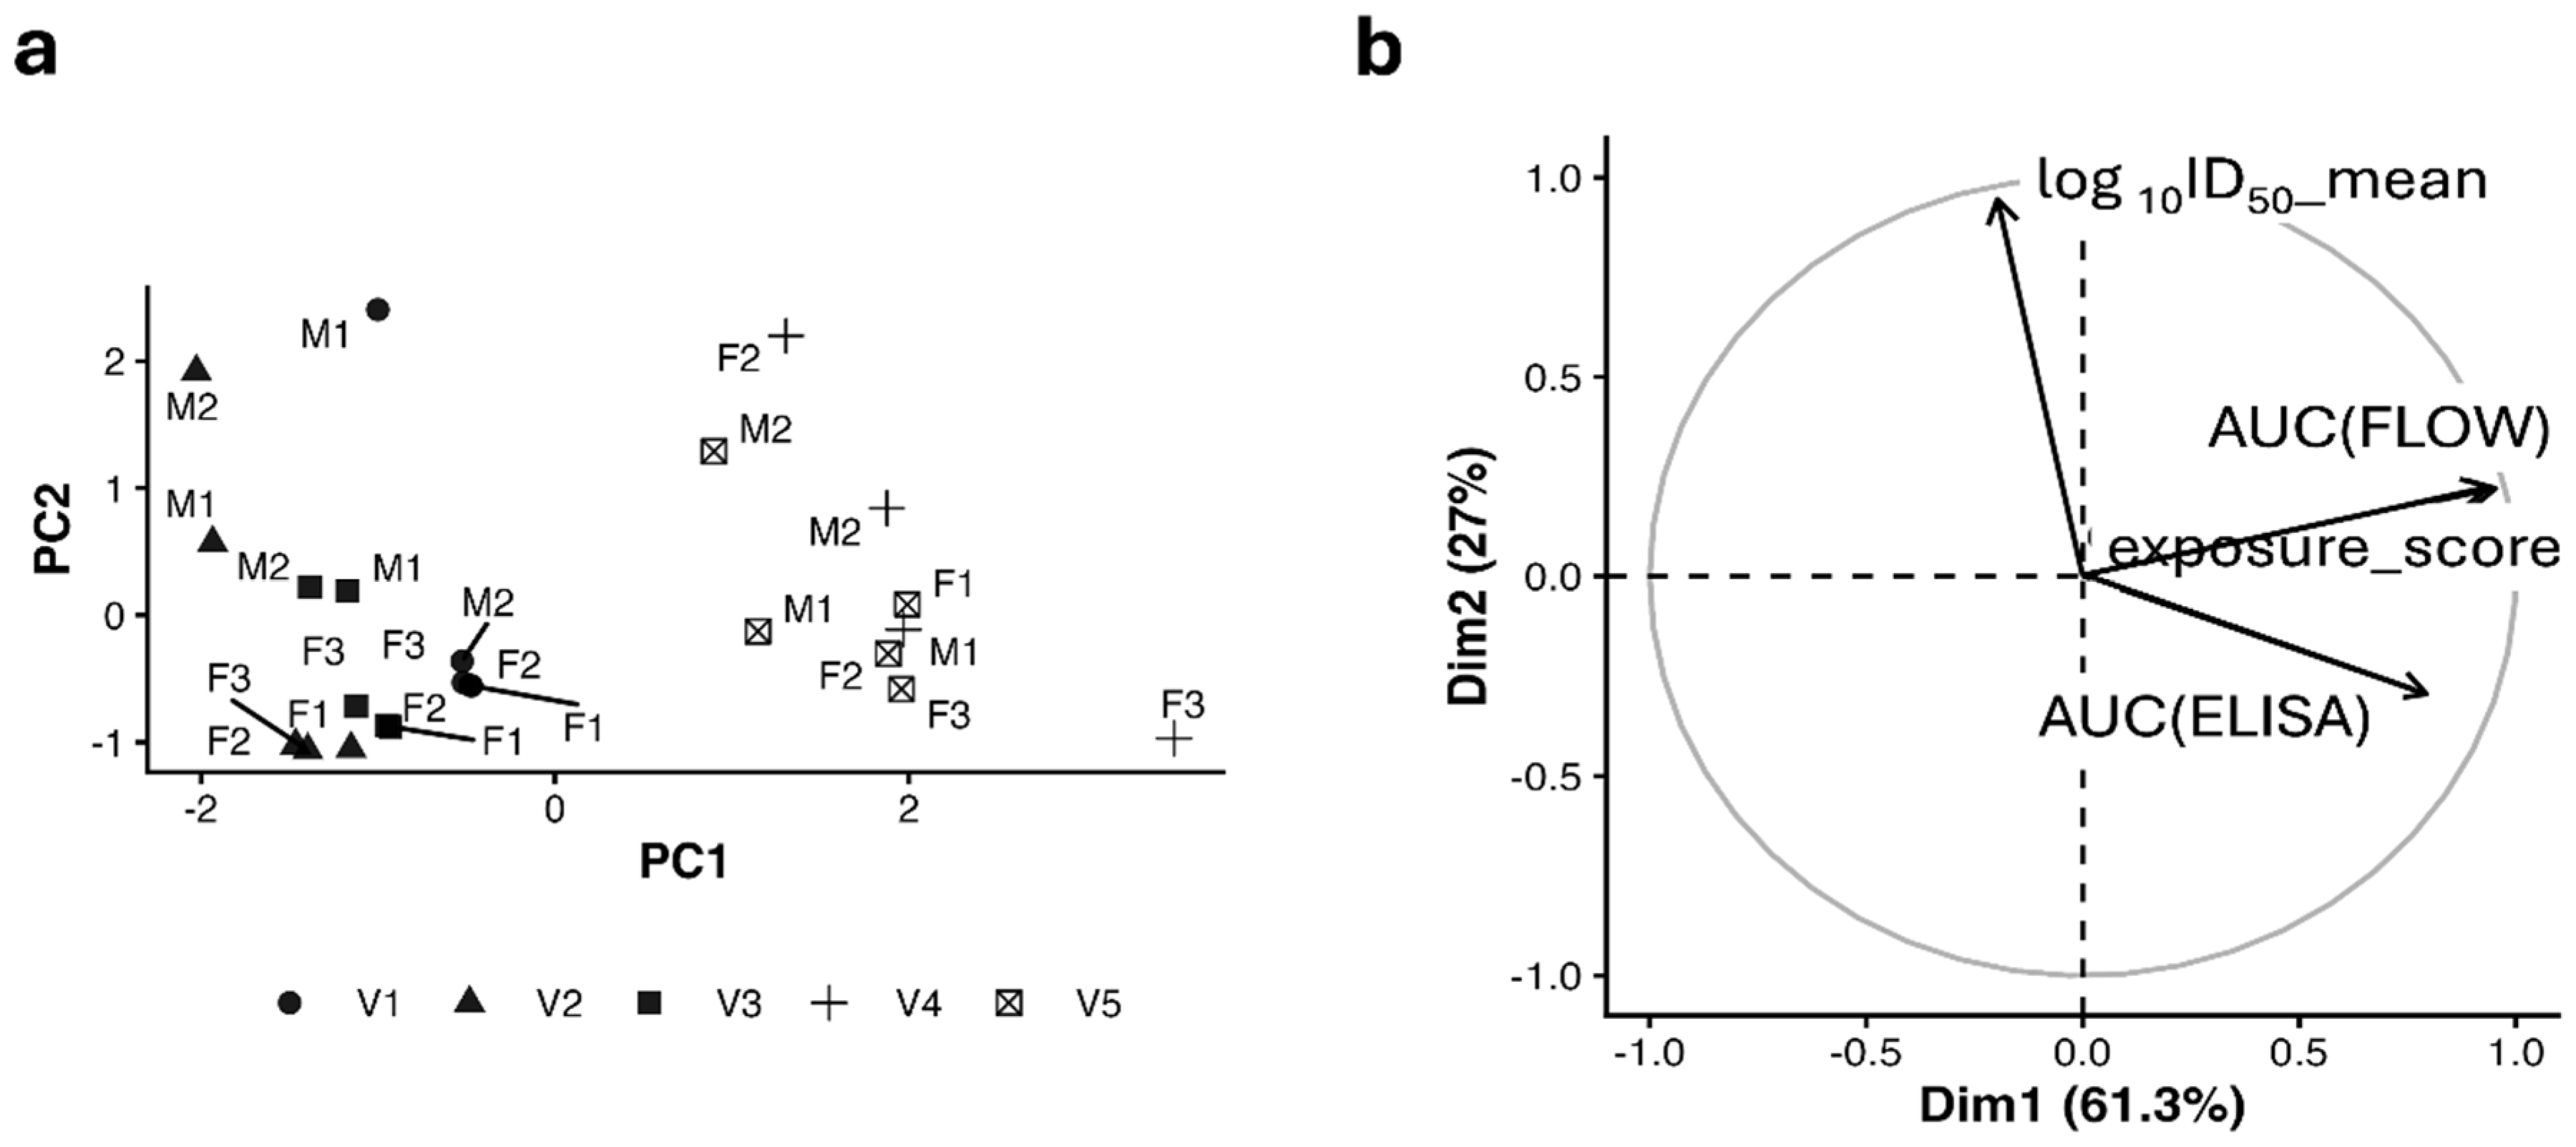
Figure 9.
Heatmap and hierarchical clustering of ELISA, flow cytometry, and neutralization measurements across individual animals. Each row represents a single mouse, annotated by vaccine group, and each column corresponds to a quantitative assay variable: mean log10ID50 (neutralization), AUC(ELISA) (antibody magnitude), exposure score (−log10 EC50; flow-derived antigen accessibility), and AUC(FLOW) (integrated flow cytometry signal). Values were standardized (z-scored) to allow direct comparison across assays. Unsupervised hierarchical clustering reveals that ELISA and flow-cytometry variables group together, reflecting shared dependence on antigen display at the bacterial surface, whereas neutralization measurements form a separate cluster with limited association to display and binding metrics. This organization is consistent with the multivariate analyses described in the main text. Abbreviations: ELISA, enzyme-linked immunosorbent assay; AUC, area under the curve; ID50, 50% inhibitory dilution; EC50, half-maximal effective concentration; FLOW, flow cytometry.
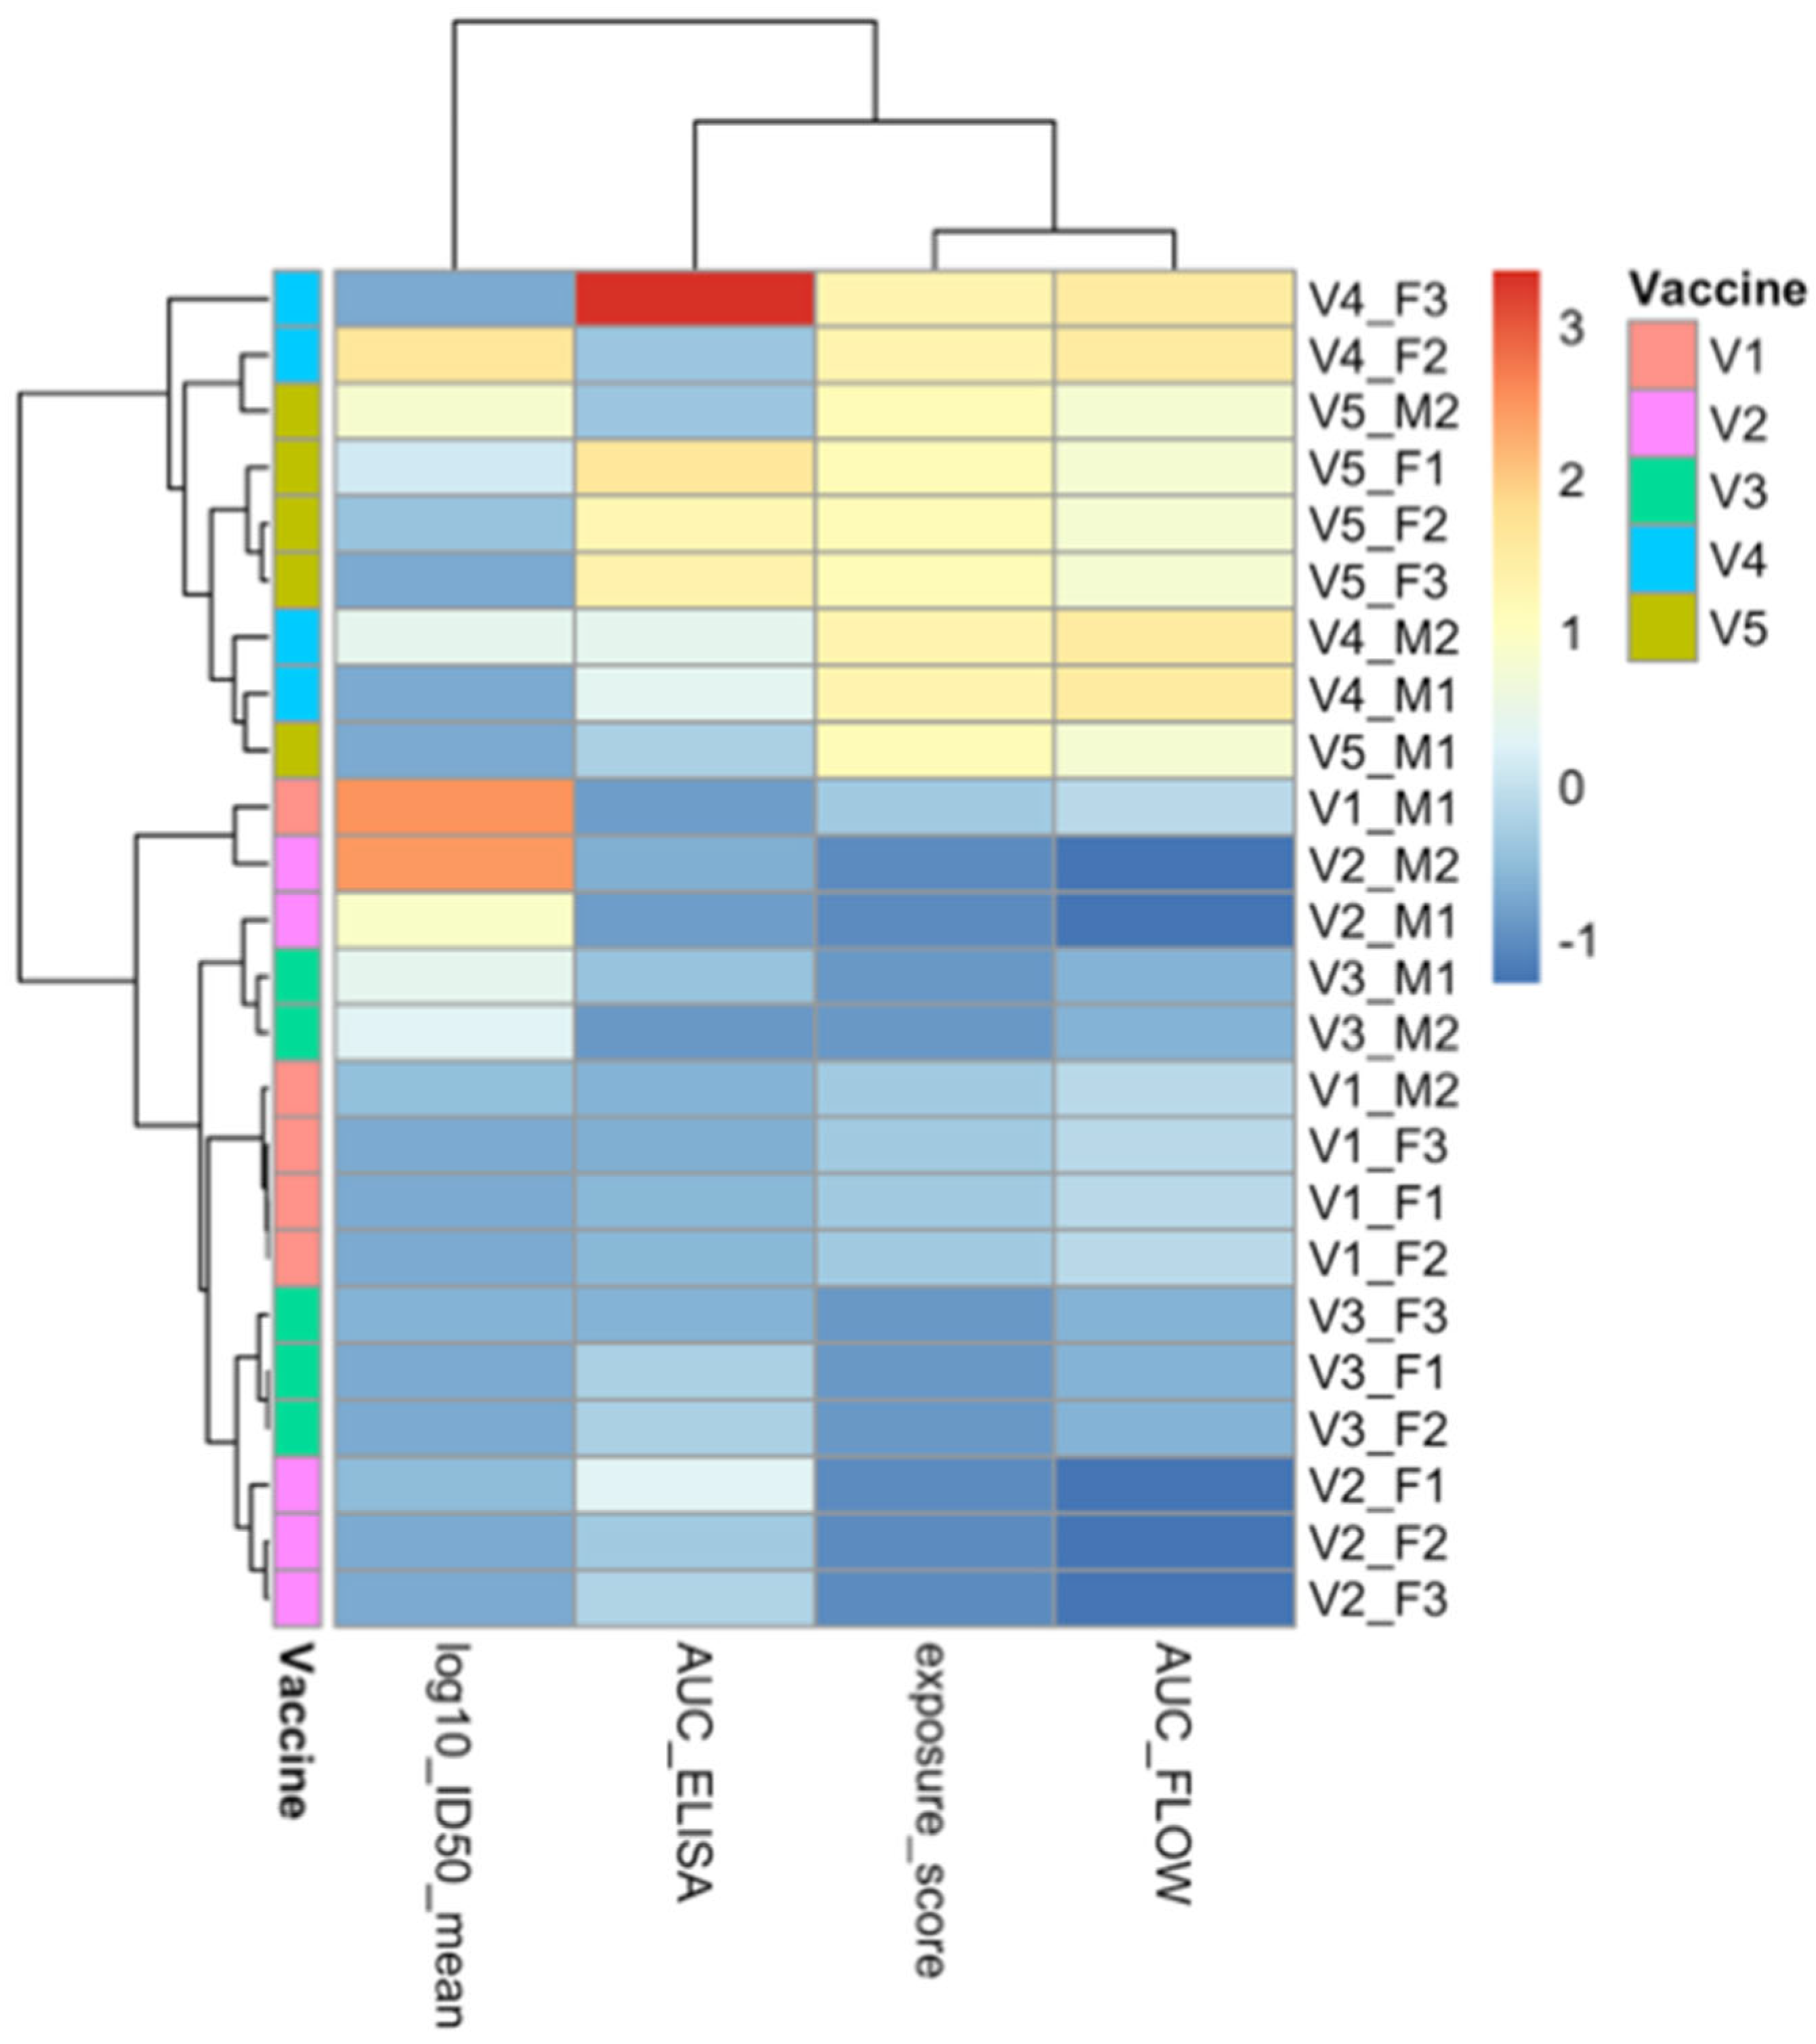

Table 1.
Components of the Scaffold-MPER construct library.
| Component | Name | Sequence | Abbreviation | Function | Ref |
| Motif | DADADA Box | DADADA | 3DA | Increases expression of autotransporter-expressed recombinant passenger proteins | [57] |
| Immunomodulators | Pan DR Epitope non-cognate T-cell antigen | AKFVAAWTLKAAA | PADRE | Enhances the adaptive immune response by providing broad T-helper cell epitope coverage, thereby improving T-cell activation and memory | [57,58] |
| Flagellin from Salmonella enterica (short fragment) | GALNEINNNLQRVRELAVQSANSTNSQSDLDSIQAEITQ | FLIC | TLR5 agonist | [59,60,61,62,65] | |
| Grp A Strep Recombinant Surface Immunogenic Protein | CDTTWTARTVSEVKADLVKQDNK | rSIP | TLR2 and 4 agonists | [63] | |
| OX40L peptide | SSSPAKDPPIQRLRGAVTRCEDGQLFISSYKNEYQTMEVQNNSVVIKCDGLYIIYLKGSFFQEVKIDLHFREDHNPISIPMLNDGRRIVFTVVASLAFKDKVYLTVNAPDTLCEHLQINDGELIVVQLTPGYCAPEGSYHSTVNQVPL | OX40L | T-cell co-stimulation | [66] | |
| Antigen | 3AGJ | KPHMNLVVIGHVDHGKSTLVGHLLARLGYIEWFKLTNLLWQARARGKGSFGFAWILDKMKEERERGITIDLTFMKFETKKYVFTIIDAPGHRDFVKNMITGASQADAAILVVSARKGEFEAGMSTEGQTREHLLLARTMGIEQIIVAVNKMDAPDVNYDQKRYEFVVSVLKKFMKGLGYQVDKIPFIPVSAWKGDNLIERSPNMPWYNGPTLVEALDQLQPPAK | 3AGJ | HIV MPER target | [11] |
| Linkers | GSx4 | GSGSGSGS | L1 | Shorter linker with non-charged, hydrophilic amino acids | [69] |
| AQQASSS×3 | AQQASSSAQQASSSAQQASSS | L2 | Semi-flexible alpha helical linker between scaffold repeats | [68] | |
| (EAAAK)4–L–(EAAAK)4 | AEAAAKEAAAKEAAAKEAAAKALEAEAAAKEAAAKEAAAKEAAAKA | L3 | Rigid linker separating immunomodulator from antigen | [67] |
Table 2.
Composition of the five 3AGJ vaccine designs.
| Vaccine | Composition (N→C) |
| V1 | 3DA–3AGJ |
| V2 | 3DA–PADRE–GS×4–3AGJ |
| V3 | 3DA–PADRE–GS×4–FLIC–GS×4–3AGJ |
| V4 | 3DA–PADRE–GS×4–rSIP–GS×4–short FLIC–(EAAAK)4–L–(EAAAK)4–3AGJ–AQQASSS×3–3AGJ |
| V5 | 3DA–PADRE–GS×4–rSIP–GS×4–short FLIC–GS×4–OX40L–(EAAAK)4–L–(EAAAK)4–3AGJ–AQQASSS×3–3AGJ |
Table 3.
Integrated dataset for correlation analysis (ELISA and flow cytometry).
| Vaccine | Animal | AUC(ELISA) Week 0 | AUC(ELISA) Week 3 | AUC(ELISA) Week 6 | AUC(ELISA) Week 9 | AUC(ELISA) Week 12 | AUC(ELISA) Week 15 | exposure_score | AUC(FLOW) |
| V1 | F1 | 0.01 | 0.01 | 0.01 | 0.01 | 0.02 | 0.03 | −0.62 | 41.27 |
| F2 | 0.01 | 0.02 | 0.04 | 0.02 | 0.03 | 0.03 | |||
| F3 | 0.02 | 0.02 | 0.02 | 0.02 | 0.03 | 0.03 | |||
| M1 | 0.01 | 0.02 | 0.04 | 0.03 | 0.02 | 0.02 | |||
| M2 | 0.01 | 0.02 | 0.02 | 0.03 | 0.06 | 0.03 | |||
| V2 | F1 | 0.01 | 0.02 | 0.02 | 0.03 | 0.05 | 0.05 | −0.67 | 32.23 |
| F2 | 0.01 | 0.04 | 0.03 | 0.02 | 0.05 | 0.03 | |||
| F3 | 0.01 | 0.03 | 0.03 | 0.05 | 0.05 | 0.04 | |||
| M1 | 0.01 | 0.03 | 0.02 | 0.02 | 0.03 | 0.02 | |||
| M2 | 0.01 | 0.03 | 0.02 | 0.03 | 0.04 | 0.03 | |||
| V3 | F1 | 0.02 | 0.04 | 0.21 | 0.15 | 0.04 | 0.04 | −0.65 | 37.39 |
| F2 | 0.01 | 0.02 | 0.03 | 0.02 | 0.03 | 0.04 | |||
| F3 | 0.01 | 0.02 | 0.02 | 0.02 | 0.04 | 0.03 | |||
| M1 | 0.01 | 0.03 | 0.03 | 0.02 | 0.04 | 0.03 | |||
| M2 | 0.01 | 0.01 | 0.02 | 0.03 | 0.02 | 0.02 | |||
| V4 | F2 | 0.01 | 0.02 | 0.02 | 0.04 | 0.04 | 0.03 | −0.49 | 54.14 |
| F3 | 0.01 | 0.03 | 0.03 | 0.04 | 0.14 | 0.13 | |||
| M1 | 0.01 | 0.05 | 0.03 | 0.09 | 0.03 | 0.05 | |||
| M2 | 0.01 | 0.05 | 0.03 | 0.03 | 0.10 | 0.05 | |||
| V5 | F1 | 0.01 | 0.05 | 0.04 | 0.06 | 0.06 | 0.08 | −0.50 | 48.46 |
| F2 | 0.01 | 0.09 | 0.05 | 0.04 | 0.05 | 0.07 | |||
| F3 | 0.01 | 0.04 | 0.25 | 0.07 | 0.05 | 0.08 | |||
| M1 | 0.01 | 0.04 | 0.02 | 0.03 | 0.03 | 0.04 | |||
| M2 | 0.01 | 0.04 | 0.03 | 0.03 | 0.02 | 0.04 |
Disclaimer/Publisher’s Note: The statements, opinions and data contained in all publications are solely those of the individual author(s) and contributor(s) and not of MDPI and/or the editor(s). MDPI and/or the editor(s) disclaim responsibility for any injury to people or property resulting from any ideas, methods, instructions or products referred to in the content. |
© 2026 by the authors. Licensee MDPI, Basel, Switzerland. This article is an open access article distributed under the terms and conditions of the Creative Commons Attribution (CC BY) license (http://creativecommons.org/licenses/by/4.0/).
Copyright: This open access article is published under a Creative Commons CC BY 4.0 license, which permit the free download, distribution, and reuse, provided that the author and preprint are cited in any reuse.


