Submitted:
13 January 2026
Posted:
14 January 2026
You are already at the latest version
Abstract
Background: Osteoarthritis, the most common musculoskeletal disorder primarily af-fects people in their mid-40s and older. As the disease progresses, degenerative chang-es occur in the synovial membrane, subchondral bone, and cartilage. Ultimately, the entire joint and its surrounding tissues become structurally and functionally impaired. Several sets of biochemical markers have been proposed to establish a timely diagnosis and anticipate progression. However, only a few of these are routinely used for disease monitoring.
Methods: We conducted a prospective, single-center cohort study of 72 patients with knee osteoarthritis. Diagnosis was established on clinical data and radiological find-ings. We examined four cartilage metabolic regulatory factors: the Wnt/β-catenin sig-naling inhibitors serum DKK-1 and sclerostin, RANKL, and OPG, correlating these with disease activity and pain scores (WOMAC, VAS, and KOFUS), radiographic stage, inflammatory molecules and indices, and bone mineral density.
Results: DKK-1 levels were higher in the intensive pain group (VAS >5) and were posi-tively correlated with the KOFUS flare-up score throughout the study. This correlation was stronger in individuals with a BMI < 30. Serum DKK-1 levels were higher in pa-tients with lower bone mineral density. No significant modifications in SOST, RANKL, or OPG levels were found.
Conclusion: DKK-1 is an indicator of pain and low-grade flare-ups in patients with knee osteoarthritis (OA), being elevated in the early stages of the disease, associated with increasing pain intensity and impaired bone turnover. Early warnings of aug-mentation would be useful for more efficiently exploiting potential disease-modifying treatments.
Keywords:
osteoarthritis
; knee
; DKK-1
; KOFUS
; VAS
1. Introduction
Osteoarthritis (OA) is the most common musculoskeletal disorder and is considered a degenerative joint disease. It primarily affects individuals aged 40 and above; patients develop pain that worsens with movement, as well as stiffness and swelling. The joints most commonly affected are the knees, hips, cervical and lumbar spines, hands, and first metatarsophalangeal joints [1]. As life expectancy increases and diagnostic capabilities improve, the OA patient population continues to grow [2]. In addition to age, risk factors include sex, obesity, previous joint trauma, metabolic disease, smoking, mechanical factors, and genetic predisposition [3]. During the course of the disease, cartilage degeneration, subchondral bone remodeling, and involvement of the synovial membrane and periarticular tissue are affected to varying degrees [4], which complicates the determination of relevant biomarkers.
Historical data show that OA was differentiated from rheumatoid arthritis (RA) beginning in the early 20th century. Then, in 1950, Kellgren and Lawrence described the radiological scoring system still in use today. Knee osteoarthritis is the most common form, affecting at least half of those with OA. [1]. Starting in the 1970s, multiple studies demonstrated the importance of inflammatory processes and cells in initiating and perpetuating the main pathways [5,6]. In the last two decades, novel research has revealed growing biochemical evidence of the inflammatory process [7,8], and it has been postulated that low-grade synovitis with chronic inflammatory changes and cytokine production is present even in the early stages of OA. Indeed, IL-1 alone or in combination with a mechanical stimulus can trigger an experimental disease, and further, IL-1 receptor antagonist treatment preserves cartilage by suppressing catabolic and pro-inflammatory gene expression [9,10]. However, in advanced stages before knee replacement therapy, the changes resemble those seen in rheumatoid arthritis [11].
Studies over the past two decades have demonstrated the involvement of innate immunity and tissue crosstalk between the synovium and subchondral bone. Compared to the cytokine model, this is associated with a more complex regulation of molecular events [12,13]. Endotyping OA patients as inflammatory or non-inflammatory may account for the varied treatment responses [14]. A 2021 study by Angelini et al. found that categorizing OA patients based on biochemical marker data identified three groups: low tissue turnover, structural progression, and systemic inflammation with persistent pain [15].
The co-existence of metabolic disease, low-grade inflammation, and obesity-related alterations, along with the loss of bone tissue, gives rise to the term “osteoimmunology” [16]. The osteoimmunology mechanisms of osteoporosis resemble the inflammatory pathways of osteoarthritis. Danger signal-induced inflammatory cytokines, such as TNF-α (tumor necrosis factor), IL-1β (interleukin), and IL-6, activate CD4+ T cells. This leads to the overproduction of receptor activator of nuclear factor-κB ligand (RANKL) in subchondral osteoblasts and synovial fibroblasts [17]. In a recent study using a mouse osteoarthritis model, investigators observed that RANKL-driven osteoclast activation and subchondral bone remodeling occurred before cartilage breakdown [18]. Upregulated RANKL signaling induces modifications in the subchondral and synovial joints [19], inducing bone resorption, subchondral sclerosis and osteophyte formation. The inflammatory process is multicellular, involving T cells, neutrophil granulocytes, B cells, macrophages, mast cells, natural killer cells, plasma cells, and dendritic cells [20].
Along with the osteoprotegerin (OPG)/RANKL/RANK regulation, the Wnt/β-catenin pathway plays a crucial role in bone homeostasis but also in the development of osteoarthritis (OA). While it can promote joint homeostasis, it can also contribute to joint destruction. [21]. When the Wnt proteins bind to cell receptors, they stabilize β-catenin. β-catenin then accumulates in the cytoplasm and translocates to the nucleus. There, it promotes the transcription of target genes of MMPs, OPG, and RANKL [21,22].
In OA, Wnt stimulation of osteoblasts leads to activation, subchondral sclerosis, and formation of osteophytes [23,24]. Wnt inhibitors, such as DKK-1 and sclerostin, help control the progression of osteoarthritis (OA) [25,26,27]. Osteocytes produce potential OA biomarkers, such as sclerostin and DKK-1, which can inhibit the canonical Wnt signaling pathway and reduce bone formation [26]. At the level of bone and joints, there are multiple interactions between Wnt signaling and the OPG/RANKL regulatory pathway [28]. The canonical Wnt pathway reduces bone resorption by promoting osteoprotegerin (OPG) expression and inhibiting the expression of RANKL. Conversely, the non-canonical pathway may stimulate RANKL-induced osteoclastogenesis [28].
The objective of this study is to evaluate the potential role of four disease activity biomarkers: DKK-1, sclerostin, OPG, and RANKL, in their relationship with pain, flare-ups, overall disease activity, and radiographic grade in a group of knee osteoarthritis (OA) patients. Despite advances in knowledge, gaps remain in our understanding of crosstalk among signaling pathways and OA patient heterogeneity.
2. Results
2.1. Study Group Characteristics
A total of 72 patients suffering from knee osteoarthritis with an average disease duration of 3-15 years were included in the study. The patients had an average age of 68 years. Eighty-six percent were female, whereas fourteen percent were male. None of the patients had infectious diseases, rheumatoid arthritis, other systemic autoimmune diseases, hepatitis, renal disease, or acute inflammatory syndromes. Hypertension was present in 79% of cases, heart failure in 80.5%, and diabetes in 23.6%. At the investigation, or in recent medical history, thirteen subjects presented hypothyroidism (18%) and twenty-eight (38.8%) showed signs of dyslipidemia (hypercholesterolemia, hypertriglyceridemia, or mixed). The median BMI was 25.7 (24–30.1); 53 subjects were normal or overweight (BMI<30), whereas 19 were obese, with values ≥30. Twenty-one patients had decreased bone mineral density, and of these, 12 were classified as having osteopenia, while nine had osteoporosis. Concerning the local symptoms, hyperemia and crepitus were the most characteristic, mobility impairment being observed in 54.2%, and overt limping in 31.9% of the study subjects. Patients had a mean Kellgren-Lawrence score of 2.35 ± 0.08, a mean WOMAC score of 25.6 ± 1.27, and VAS values of 4.41 ± 0.17. The mean KOFUS flare-up score was 1.94 ± 0.30; thus, all scores indicated low to moderate disease activity.
At the moment of investigation, the majority of patients used topical creams and gels, analgesics, and non-steroidal anti-inflammatory drugs; 54.2% used p. o. chondroprotectors, and 26.4% had infiltrations with intra-articular corticosteroids in the previous 3 months (Table 1).
2.2. Principal Component Analysis
We applied principal component analysis (PCA) to identify the factors responsible for the majority of the variability. Based on the analysis of all 49 continuous variables, 21 models resulted, 10 of which explained 82.9% of the variance. The first four models accounted for nearly 50% of the overall variance. The characteristics of these four PCs are shown in Table 2.
The highest eigenvalues were for PC1 (3.62) and PC2 (2.70). The loadings of these principal components are presented in Figure 1. Disease activity scores: WOMAC, KOFUS, the K-L grade, and VAS all had negative coefficients in PC1 and positive coefficients in PC2. DKK-1 exerted a weak negative influence on PC1 and a stronger negative influence on PC2. WBC, neutrophil-to-lymphocyte ratio, and SIRI had negative coefficients in both.
2.3. Correlations of the K-L, WOMAC, and KOFUS Scores
To characterize the associations between radiological signs of disease severity and pain, functional scores, and biological variables, we first analyzed the correlations between radiological grade and the aforementioned factors. The WOMAC (r = 0.539, p < 0.0001), VAS (r = 0.383, p < 0.001), and KOFUS (r = 0.303, p = 0.009) all showed strong positive correlations with the K-L score. Additionally, the K-L score was positively associated with hemoglobin concentration (p = 0.282, p = 0.027) and showed a tendency to correlate with serum uric acid (r = 0.243, p = 0.060).
Concerning pain, the VAS was strongly, positively correlated with WOMAC (<0.001), radiological grade (p<0.001), and KOFUS flare-up score (p<0.001) in the overall group. KOFUS scores were associated with the WOMAC, too (p<0.001) (Table 3). The VAS, KOFUS and WOMAC were not associated with complete blood count parameters, including the white blood cell number, absolute monocyte and platelet numbers, neutrophil-to-lymphocyte ratio, systemic inflammatory response index, C-reactive protein, thyroid-stimulating hormone, and uric acid. Further, VAS and WOMAC scores could not be correlated with the four elective osteoarthritis biomarkers: serum DKK-1, sclerostin, OPG, and RANKL. DKK-1 showed a significant positive association with KOFUS (r = 0.23, p = 0.046), while sclerostin, OPG, and RANKL were not associated with disease activity (Table 3).
In the subgroup with a body mass index <30, the correlation between serum DKK-1 levels and KOFUS flare-up scores was also significant, and stronger than in the whole group (r = 0.32, p = 0.018) (Figure 2B). If we restricted the analysis to those with BMI<30 and normal BMD (n=38), this correlation has disappeared. In this subgroup, serum DKK-1 titers showed no correlations with the K-L score (r = -0.025, p = 0.879), VAS (r = 0.118, p = 0.486), KOFUS scores (r = 0.238, p = 0.154), or the WOMAC score (r = 0.233, p = 0.165).
Despite the lack of a correlation, if we divided the study subjects in VASlo (VAS<5, n=40) and VAShi (VAS ≥5, n=32) subgroups, serum DKK-1 was found to be significantly higher in the VAShi patients than in the VASlo subgroup (997 pg/mL vs. 641 pg/mL, p=0.040) (Figure 2A).
2.4. Analysis of DKK-1 in the Non-Obese and Low Bone Mineral Density Subgroups
As shown in Table 3, the body mass index did not correlate directly with disease activity scores. However, we assumed different metabolic relationships in obese and non-obese individuals, and we specifically analyzed the correlations of DKK-1, sclerostin, OPG, and RANKL. The occurrence of diabetes and hypothyroidism, the levels of thyroid-stimulating hormone, and serum triglycerides were similar in the subgroups with BMI<30 and BMI≥30. The serum total cholesterol was more elevated in obese individuals, but without significance (222 ± 11 mg/dL vs. 197 ± 7 mg/dL). There were no significant differences in medication with topical creams, analgesics, NSAIDs, chondroprotectors, and corticosteroidal infiltrations between the subgroups.
The DKK-1 and sclerostin levels were slightly higher, and OPG was lower among those with a BMI below 30, but this difference was not significant (Table 1). Among the 53 patients with normal BMI and overweight with BMI<30, a total of 15 had an abnormally low BMD. Nine were classified as osteopenic and six as osteoporotic (28.2% together). In comparison, in the subgroup with obesity (BMI ≥ 30), three out of 19 subjects (15.8%) had osteopenia and osteoporosis, respectively; the difference in distribution was not significant. Thirty-eight patients with BMI <30 and normal BMD had reduced blood levels of DKK-1, compared to the low BMD subgroup (n=15), as shown in Figure 3A (medians 652 pg/mL vs. 965 pg/mL, p = 0.020). Furthermore, the normal BMD subgroup had lower values than the nine patients with osteopenia (medians 652 pg/mL vs. 1,125 pg/mL, p = 0.039) (Figure 3B). DKK-1 levels did not differ significantly in those with osteoporosis, but this subgroup consisted of a smaller number of subjects.
3.5. Simple and Multiple Linear Regression
We investigated whether serum DKK-1 is a predictor of VAS and KOFUS scores in simple linear regression models. In the overall patient group (n = 72), DKK-1 was not a significant determinant of either score (p = 0.191 for VAS and p = 0.112 for KOFUS). DKK-1 was not a predictor in the non-obese patient subgroup (n = 53) for the VAS (p = 0.156). However, DKK-1 levels were significant in predicting the KOFUS score in this subgroup (p = 0.046). Furthermore, we constructed multiple linear regression models to examine the impact of covariates on this relationship. Taking into analysis the Kellgren-Lawrence (K-L) radiological score and serum DKK-1, adjusting for body mass index (BMI) and bone mineral density (BMD) category, a significant model was obtained (Table 4). BMI, the K-L score, and DKK-1 levels were introduced as continuous variables, while BMD was represented as a categorical variable (normal, osteopenic, or osteoarthritic). The radiological score was the stronger predictor, and DKK-1 remained a significant determinant of KOFUS.
3. Discussion
There is no simple correlation between pain and structural deterioration or radiological signs in knee osteoarthritis. Both the synovium and the subchondral bone, along with the bone marrow, contribute to the development of pain [28,29]. This process involves the delivery of pro-inflammatory cytokines and nerve growth factor (NGF), remodeling with continuous production of danger-associated molecular patterns, malfunction of the dorsal root ganglia’s nociceptive neurons, and neuroinflammation. Therefore, it is important to identify patients with low pain scores, reversible extracellular matrix reorganization, and low-to-medium grade cartilage destruction.
3.1. Correlations of Radiological Grade, Pain and Low Osteoarthritis Flare-up Scores
Many research studies have highlighted the complexity of the cellular and mechanical factors that contribute to the development and maintenance of low-grade inflammation and cytokine modulation [7,24]. According to theoretical considerations and experimental observations, Wnt signaling inhibitors and the OPG-RANKL regulatory axis are functionally linked to the mainstream processes of osteoarthritis. In this study, we demonstrated the importance of DKK-1 as a serum biomarker for mild-to-moderate, radiologically graded knee osteoarthritis accompanied by moderate pain and no overt flare-ups. Pain assessment is subjective and depends on personal experience; it is also often influenced by emotional dysregulation and lacks a global evaluation standard [30]. We used two different pain scores: first, the visual analog scale (VAS), which ranges from 1 to 10; second, the Knee Osteoarthritis Flare-Ups Score (KOFUS) validated by Marty et al. in 2009, to understand the mutual impact of regulatory factors, pain, and joint deterioration. [31]. The KOFUS is based on the presence of the following criteria in the knee joint: morning stiffness, swelling, limping, night pain that awakens the patient, and increased warmth over the knee. A cut-off value of 7 demonstrated excellent sensitivity (87%) and specificity (87.9%) for OA, as well as high positive and negative predictive values [32]. However, there are no data on associations with low KOFUS scores. Scores of 7 or less characterized patients in only 12.9% of cases at the rheumatologists’ appointments [32]. A score above seven out of a possible 14 indicates reactivation of knee osteoarthritis (OA). Parry et al.’s longitudinal data collection revealed a significant number of patients with flare-ups primarily attributed to high physical activity [33]. In our cohort, subjects predominantly suffered from mild-to-moderate OA. The mean Kellgren-Lawrence (K-L) score was 2.35 ± 0.08; the mean Western Ontario and McMaster Universities Osteoarthritis Index (WOMAC) score was 25.6 ± 1.27; and the mean Visual Analogue Scale (VAS) score was 4.41 ± 0.17. Significantly higher DKK-1 levels were observed in those with higher VAS. The mean KOFUS flare-up score was 1.94 ± 0.30. There were strong correlations between pain scores and radiological stage despite lower visual analog scale and flare-up scores than radiologically assessed joint deterioration. These associations qualify VAS and the KOFUS score as a valid and sensitive tool for detecting stealthy, small-scale underlying processes and joint deterioration pathways.
3.2. The Influence of an Altered Body Mass Index on Osteoarthritis Pathways
A higher body weight may influence osteoarthritic pathways in several ways: a. it charges mechanical loading; b. alters the body, and implicitly, the joint tissue composition; c. adipose tissue secretes pro-inflammatory adipokines, maintaining low-grade inflammation in the joint; d. alters insulin homeostasis; e. tunes up the immune system in a high-level alertness; f. triggers fibrosis within and around the joints [34,35,36]. Every excessive pound of weight increases up to four-fold the load on the knee, and the frequently associated dyslipidemia also provokes inflammation, higher matrix metalloproteinase (MMP) and a disintegrin and metalloproteinase with trombospondin motifs (ADAMTS) activities, higher oxLDL levels, and increased oxidative stress [34]. The pathogen-associated molecular pattern (PAMP) leakage from the gut leads to more intensive Toll-like receptor triggering, activates M1-type pro-inflammatory macrophages, dendritic cells, Th17 helper lymphocytes, and often associates with mitochondrial dysfunction [35]. A positron-emission-tomography tracer, 18F-sodium fluoride and 18fluodeoxyglucose experiments revealed strong correlations between body mass index, bone turnover, and glucose uptake, respectively [37]. Up-to-now, the description of DKK-1, sclerostin, OPG, and RANKL’s role in OA patients with altered BMI is poorly exploited and lacks the description of direct clinical correlations.
In our cohort, the radiological and the WOMAC scores were comparable, while the VAS and the KOFUS scores showed mild differences in favor of the BMI<30 subgroup; diabetes and hypothyroidism had a similar incidence; the occurrence rate of dyslipidemia and total cholesterol was lower, but all differences lacked significance. In the non-obese, DKK-1 and sclerostin were non-significantly reduced, whereas OPG was slightly elevated; however, DKK-1 showed a significant positive correlation with the KOFUS score. Since several studies have confirmed a downward trend in serum DKK-1 levels in advanced osteoarthritis (OA), our findings may represent a biphasic variation of the biomarker that increases in the low domain in parallel with the flare-up scores. Further, higher OPG may be associated with more advanced stages, these observations could gain specific importance if confirmed in larger populations.
3.3. The Influence of Underlying Altered Bone Metabolism on Markers of Osteoarthritis
At the mechanistic level, the Wnt pathway and its inhibitors affect osteoarthritis and osteoporosis in opposite ways. Corrado et al. cultured osteoarthritic, osteoporotic, and healthy human primary osteoblasts and observed decreased expression in osteoarthritis (OA) and increased expression in osteoporosis (OP), relative to healthy osteoblasts. The RANKL/OPG ratio decreased in OA and increased in OP-derived cells [38]. In Col1a1/DKK-1 transgenic mice that have undergone meniscectomy, osteoarthritis scores improve, osteophytes become less prevalent, and subchondral bone mass decreases [39]. Denosumab treatment that suppresses RANKL and lasted 36 months in osteoporotic postmenopausal women caused a continuous decline in DKK-1 levels and an increase in sclerostin levels [40]. Butler et al. reported that osteoporotic women had serum DKK-1 levels that were nearly 70% higher than healthy women’s levels. Serum levels were negatively correlated with lumbar and femoral T- and Z-scores [41]. Tian et al. confirmed the significant negative correlation with bone mineral density and positive correlation with the bone catabolism marker CTX-I in a larger cohort [42]. Our results reveal that bone turnover and bone mineral density may mask the secretory profiles of underlying osteoarthritis due to the dominating tissue mass, as evidenced by significantly increased serum DKK-1 titers in those with osteopenia and osteoporosis.
3.4. Serum DKK-1 Changes and Comparisons with Other Clinical Research Findings
Our findings revealed a positive association between DKK-1 and KOFUS in the overall patient group. Among non-obese subjects with a normal or overweight BMI (<30), KOFUS showed an even stronger association. Another subgroup, patients with low bone mineral density (encompassing those with osteopenia and overt osteoporosis), exhibited significantly higher serum DKK-1 concentrations.
Our study indicates a link between elevated DKK-1 levels and higher VAS pain scores above five on a scale of ten. We hypothesized that the underlying pathways may differ between obese and non-obese patients and analyzed the latter subgroup separately. Indeed, several relationships were characteristic only of the non-obese OA subjects. These patients had slightly higher VAS and KOFUS scores, as well as higher DKK-1 and sclerostin values and lower OPG serum concentrations, though none of the differences were significant.
The observations are in partial concordance with those of Azzam’s research from 2024, which revealed higher levels of DKK-1 in patients with osteoarthritis (OA) compared to individuals without OA, but also dropping levels with progression of the disease. [43]. In this study, serum DKK-1 had a significant inverse correlation with the radiological grades and was lower in those with ultrasonographic effusion. The population included had an average age of 53.4 ±4 years, possessed a higher BMI (30.4) and VAS (5.9), and much higher WOMAC scores than our cohort (60 ±11.4). Several other studies also revealed decreased DKK-1 in osteoarthritis compared to healthy subjects. The study by Honsawek included the analysis of synovial and plasma levels of DKK-1 in knee OA and showed a strong negative correlation with radiographic severity. The study group found synovial fluid DKK-1 levels lower than in healthy individuals, suggesting reduced systemic production of DKK-1 in OA. [44]. This OA group had 68.8 ±8 years and BMI values close to our cohorts. Ibrahim et al. found higher DKK-1 in OA than in healthy individuals, but lower than in rheumatoid arthritis, both in serum and synovial fluid. This study also highlighted decreased DKK-1 in advanced radiological grades (3-4). Patients were younger (51.4 ±5.8 years), with higher BMI (32 ±3.8), WOMAC (54.6±18), and the KOFUS score close to the pre-established cut-off (6.8) [45]. In line with the previous observations, Hassan et al. described diminished synovial levels of DKK-1 in association with radiological progression, but no significant differences between OA patients and controls. All these studies enrolled a relatively small number of osteoarthritic subjects (a maximum of 45) [46]. In a larger case-control study (148 patients and 101 controls), Min et al. observed a reduction of DKK-1 in OA compared to the control group, setting a sensitivity of 78.6% and a specificity of 40% in the prediction of severe OA [47]. In our cohort, mild osteoarthritic cases with a Kellgren-Lawrence score of 2 had also relatively higher circulating DKK-1 than patients with advanced scores (3-4).
3.5. Osteoprotegerin and RANKL
Osteoprotegerin and RANKL are important regulatory factors in both bone and joint homeostasis. OPG, a decoy receptor of RANKL, blocks osteoclastogenesis and cell maturation. OPG also controls the Wnt/β-catenin pathway [28,48]. Two types of osteoarthritic osteoblasts have been identified: low-level and high-level synthesizers. The former produce less OPG and more RANKL, while the latter express higher levels of OPG and an increased OPG/RANKL ratio. In osteoarthritic cartilage, catabolic and senescent chondrocytes also produce less OPG and higher levels of RANKL in a pro-inflammatory microenvironment [28]. Serum OPG and RANKL levels were higher in knee OA patients than in controls; synovial OPG concentrations were almost four times higher than serum levels [49]. An early study reported elevated serum and synovial OPG levels in OA but not in rheumatoid arthritis or spondyloarthritis [50]. Quresma et al. found that synovial levels of OPG and RANKL could not differentiate between rheumatoid arthritis, spondyloarthritis, and osteoarthritis. However, the RANKL/OPG ratio in the osteoarthritis group showed a strong positive association with C-reactive protein levels [51]. In a previous study, when we compared small groups of patients with early- and advanced-stage OA, we failed to reveal differences in serum and synovial OPG levels [52]. Several factors may generate relevant fluctuations of this marker. Many tissues, such as bone, epithelium, and endothelium, produce OPG. Circulating concentrations are influenced by protein glycosylation and ABO blood groups [53]. Inflammatory cell degradative enzymes, such as neutrophil elastase, cleave OPG [54]; however, the importance of this interaction in vivo needs further proof [55]. In the current study, OPG levels were slightly higher in obese patients but did not correlate with WOMAC, VAS, or KOFUS flare-up scores. RANKL serum levels showed minimal variations, no difference between the BMI-classified groups, and no association with WOMAC, VAS and KOFUS.
3.6. Serum Sclerostin
Sclerostin controls osteoblast proliferation. It preserves chondrocyte metabolism by controlling the canonical and non-canonical Wnt pathways. Further, knocking out the SOST gene in mice has a detrimental effect on cartilage [56]. In contrast, SOST transgenic mice developed only mild post-traumatic osteoarthritis (OA) alongside reduced MMP2 and MMP3 protein levels [57]. Eldin et al. studied 50 OA patients and 30 healthy individuals and found significantly lower plasma sclerostin levels in patients, as well as significant inverse correlations with physical disability, disease duration, and radiological severity [58]. In contrast, in the OFELY study, serum sclerostin levels were not associated with Kellgren-Lawrence scores or radiological progression over a four-year follow-up period [59].
A Polish study of acromegaly patients examined the relationship between OPG/RANKL and SOST in bone resorption and bone mineral density. The study revealed that SOST modulates OPG/RANKL in a compensatory manner [60].
However, our study found no significant association between sclerostin and pain or radiological scores. Specifically, sclerostin could not be associated with disease activity (WOMAC), pain scores (VAS and KOFUS), or radiological deterioration (Kellgren-Lawrence) in the entire cohort or the non-obese subgroup. Alterations in bone mineral density and microarchitecture induced by osteopenia and osteoporosis are linked to multi-omics (proteomics, metabolomics, and genomics) and multiple regulatory mechanisms, including oxidative stress, chronic inflammation, and gut microbiota [61]. The relatively small sample size, consisting mainly of patients with mild-to-moderate disease, may explain this result.
3.7. Relevance of the Study
The current observational study focused on four biomarkers: the Wnt pathway inhibitors DKK-1 and sclerostin, and the proteins osteoprotegerin and RANKL. Under certain conditions, these biomarkers reflect pathological changes characteristic of knee osteoarthritis and may serve as therapeutic targets. There is an upward trend in trials involving disease-modifying osteoarthritis drugs (DMOADs) targeting these pathways. For example, SM04690 (lorecivin) is a promising molecule that aims to modulate the Wnt/β-catenin pathway to prevent or slow disease progression [62]. Further research is needed to confirm the relevance of DKK-1 changes focusing on joint structure deterioration and bone mineral density loss.
3.8. Interactions and Limitations
There are likely many more complex interactions among different pathways, as well as between osteoarthritis (OA) phenotypes, individual patient risk factors, comorbidities like osteoporosis or metabolic disease, and triggering events that contribute to the development and progression of the disease. We did not have synovial fluid samples to investigate, which could have provided additional useful information. Because patient selection for this study was random and not based on body mass index or bone mineral density, the subgroups were imbalanced. Therefore, the results should be confirmed in larger populations.
4. Materials and Methods
4.1. Study Design and Patient Cohort
Between June 2023 and June 2025, we examined a total of 72 patients with primary knee osteoarthritis (62 females and 10 males; mean age: 68 years). All subjects were recruited from the Procardia Outpatient Medical Service in Târgu Mureș and were suffering from knee osteoarthritis at various radiographic stages. Patients with acute inflammatory diseases, severe liver disease, infections, systemic autoimmune disease, or neoplastic disorders were excluded from the study.
Each subject was informed about the study and asked to sign an informed consent form. The study was approved by the Ethics Committee (approval no. 01/04/06/2023). We took a thorough medical history and performed a physical examination in each case. We documented the patients’ demographic information, as well as details regarding disease manifestation, professional risk factors, and medical treatment received. We also noted the presence of any comorbidities. Patients were evaluated in the context of disease activity using three scoring systems: the Visual Analogue Scale (VAS) for pain, the Knee Osteoarthritis Flare-up Score (KOFUS) for OA flare-ups, and the Western Ontario and McMaster Universities Osteoarthritis Index (WOMAC) for pain, stiffness, and daily activities.
4.2. Laboratory Testing
Venous blood samples were collected into Vacutainer tubes with no additive, EDTA-K3, or 3.2% trisodium citrate (Becton-Dickinson Vacutainer Systems, UK) after overnight fasting. Tubes intended for biochemical and coagulation testing were centrifuged at 3,000 rpm for 10 minutes to separate the serum and plasma. C-reactive protein, glucose, creatinine, transaminases, uric acid, total cholesterol and tryglicerides were determined from these samples using a Mindray BS480 analyzer (Shenzhen, China); concentrations of thyroid-stimulating hormone were measured on Mindray CL900i, and plasma fibrinogen was determined on a Coag M analyzer (Diatron, Hungary). The complete blood count was determined from the EDTA-K3 tubes using a Mindray 5380 analyzer (Shenzhen, China), and the neutrophil-to-lymphocyte ratio (N/L) and systemic inflammatory response index (SIRI) were calculated.
4.3. Determination of Disease Activity Biomarkers
Two serum specimens were frozen at -20 °C after centrifugation for subsequent analysis of the specific biomarkers OPG, RANKL, DKK-1, and sclerostin. We used commercially available ELISA kits to analyze the serum concentrations of OPG (R&D Systems, Human Osteoprotegerin/TNFRSF11B Duoset ELISA, DY805), RANKL (R&D Systems, Human TRANCE/RANKL/TNFSF11 Duoset ELISA, DY626), sclerostin (R&D Systems, Human SOST/Sclerostin Duoset ELISA, DY1406), and DKK-1 (R&D Systems, Human DKK-1 Duoset ELISA, DY1906). The complementary reagents were from the Duoset ELISA Ancillary Reagent Kit 2, and the reactions were read using the automated ThunderBolt instrument (Gold Standard Diagnostics, USA). The manufacturer’s recommendations were followed in performing these determinations.
4.4. Radiographic Examination
An X-ray of the knee was taken, including a comparative orthostatic view and a lateral view of the symptomatic knee. Radiographic staging was performed using the Kellgren-Lawrence classification system, which categorizes osteoarthritis into four grades: The grades are as follows: grade 1, suspicious joint space reduction; grade 2, definite osteophytes and probable joint space narrowing; grade 3, moderate osteophytes, definite joint space narrowing, and subchondral sclerosis; grade 4: Large osteophytes, marked joint space narrowing, severe subchondral sclerosis, and bone deformities.
Bone mineral density was determined using dual X-ray absorptiometry (DEXA) in a different outpatient medical service. T-values between 1.5 and 2.49 were considered moderate-to-advanced osteopenia, while values below -2.5 were classified as osteoporosis.
4.5. Statistical Analysis
We analyzed the data distribution using the Lilliefors and Shapiro-Wilk tests. We presented the results according to the distribution type: mean ± standard error (SE), or median (quartile range). We performed a general data exploration using principal component analysis to calculate the eigenvalues and proportion of variance for the main PCs. Considering the group sizes, we used the Mann-Whitney U test for between-group comparisons and Spearman’s rank correlation analysis. We constructed a multiple linear regression model to determine the effect of the variables on VAS and KOFUS in the entire group. We processed the data using GraphPad Prism 10.6.1 and Microsoft Excel 2016. We set the significance threshold at p=0.05.
5. Conclusions
The current study demonstrated the potential benefits of evaluating serum DKK1 levels in patients with knee osteoarthritis. We highlighted that elevated DKK-1 levels were associated with higher pain scores and KOFUS flare-up scores in mild/moderate disease stages. These results should be interpreted taking into consideration the metabolic background, body mass index, and impaired bone turnover. With the early identification of progressors, inclusion of this biomarker in clinical and radiological evaluations might significantly improve patient outcomes.
Author Contributions
Conceptualization, T.CS.N.F. and E.E.N.; methodology, T.CS.N.F., J.SZ., Á.S. and E.E.N.; data curation, T.CS.N.F., E.L.SZ., H.L., J.SZ., L.F.; formal analysis – T.CS.N.F. and E.E.N., writing—original draft preparation, T. CS.N.F. and E.E.N.; writing—review and editing, H.P., P.K., E.H. and E.E.N., supervision – P.K., H.P. and E.E.N. All authors have read and agreed to the published version of the manuscript.
Funding
This research received no external funding.
Institutional Review Board Statement
The study was conducted in accordance with the Declaration of Helsinki, and approved by the Research Ethics Committee of Procardia Medical Center (approval no. 01/04/06/2023).
Informed Consent Statement
Informed consent was obtained from all subjects involved in the study.
Data Availability Statement
data are available as: Nagy, Előd Ernő; Nagy-Finna, Csilla (2026), “Knee_OA_72_data_2026”, Mendeley Data, V1, doi: 10.17632/m5b9hfbkk8.1.
Acknowledgments
The authors thank to Mr. Csaba Bakos for his kind support of ELISA measurements.
Conflicts of Interest
The authors declare no conflicts of interest.
Abbreviations
The following abbreviations are used in this manuscript:
| ADAMTS | A Disintegrin and Metalloproteinase with Thrombospondin motifs |
| BMI | Body mass index |
| BMD | Bone mineral density |
| DKK-1 | Dickkopf-related protein 1 |
| DMOADs | Disease-modifying osteoarthritis drugs |
| IL-1 | Interleukin-1 |
| KOFUS | Knee Osteoarthritis Flare-up score |
| MMP | Matrix metalloproteinase |
| NSAIDs | non-steroidal anti-inflammatory drugs |
| OA | Osteoarthritis |
| OPG | Osteoprotegerin |
| RA | Rheumatoid arthritis |
| RANK | Receptor Activator of Nuclear Factor κB |
| RANKL | Receptor Activator of Nuclear Factor κB Ligand |
| SOST | Sclerostin |
| TNF | Tumor necrosis factor |
| VAS | Visual analogue scale |
| WOMAC score | Western Ontario and McMaster University score |
References
- Leszczynski, P.; Lisinski, P.; Kwiatkowska, B.; Blicharski, T.; Drobnik, J.; Pawlak-Bus, K. Clinical expert statement on osteoarthritis: diagnosis and therapeutic choices. REUMATOLOGIA 2025, 63(2), 104–115. [Google Scholar] [CrossRef]
- Langworthy, M.; Dasa, V.; Spitzer, A. Knee osteoarthritis: disease burden, available treatments, and emerging options. THERAPEUTIC ADVANCES IN MUSCULOSKELETAL DISEASE 2024, 16. [Google Scholar] [CrossRef]
- Loeser, R.; Goldring, S.; Scanzello, C.; Goldring, M. Osteoarthritis: A disease of the joint as an organ. ARTHRITIS AND RHEUMATISM 2012, 64(6), 1697–1707. [Google Scholar] [CrossRef] [PubMed]
- Hsu, H; Siwiec, RM. Knee Osteoarthritis; Treasure Island (FL), 2025. [Google Scholar]
- Dieppe, P. Inflammation in Osteoarthritis. RHEUMATOLOGY AND REHABILITATION 1978, 59–63. [Google Scholar] [CrossRef] [PubMed]
- Huskisson, E.; Dieppe, P.; Tucker, A.; Cannell, L. Another look at osteoarthritis. ANNALS OF THE RHEUMATIC DISEASES 1979, 38(5), 423–428. [Google Scholar] [CrossRef]
- Sandell, L.; Aigner, T. Articular cartilage and changes in arthritis—An introduction: Cell biology of osteoarthritis. ARTHRITIS RESEARCH 2001, 3(2), 107–113. [Google Scholar] [CrossRef]
- Miyashita, T; Ryu, J; Saito, S; Sakamoto, A. Effects of growth factors and cytokines on proteoglycan and collagen synthesis by chondrocytes in guinea pigs with spontaneous osteoarthritis. MODERN RHEUMATOLOGY 2000, 10(1), 45–50. [Google Scholar] [CrossRef]
- Rowan, A.; Hui, W.; Cawston, T.; Richards, C. Adenoviral gene transfer of interleukin-1 in combination with oncostatin M induces significant joint damage in a murine model. AMERICAN JOURNAL OF PATHOLOGY 2003, 162(6), 1975–1984. [Google Scholar] [CrossRef] [PubMed]
- Stone, A.; Grol, M.; Ruan, M.; Dawson, B.; Chen, Y.; Jiang, M.; Song, I.; Jayaram, P.; Cela, R.; Gannon, F.; et al. Combinatorial Prg4 and Il-1ra Gene Therapy Protects Against Hyperalgesia and Cartilage Degeneration in Post-Traumatic Osteoarthritis. HUMAN GENE THERAPY 2019, 30(2), 225–235. [Google Scholar] [CrossRef]
- Smith, M.; Triantafillou, S.; Parker, A.; Youssef, P.; Coleman, M. Synovial membrane inflammation and cytokine production in patients with early osteoarthritis. JOURNAL OF RHEUMATOLOGY 1997, 24(2), 365–371. [Google Scholar]
- de Lange-Brokaar, B.; Ioan-Facsinay, A.; van Osch, G.; Zuurmond, A.; Schoones, J.; Toes, R.; Huizinga, T.; Kloppenburg, M. Synovial inflammation, immune cells and their cytokines in osteoarthritis: a review. OSTEOARTHRITIS AND CARTILAGE 2012, 20(12), 1484–1499. [Google Scholar] [CrossRef] [PubMed]
- Pan, J.; Wang, B.; Li, W.; Zhou, X.; Scherr, T.; Yang, Y.; Price, C.; Wang, L. Elevated cross-talk between subchondral bone and cartilage in osteoarthritic joints. BONE 2012, 51(2), 212–217. [Google Scholar] [CrossRef] [PubMed]
- Werdyani, S.; Liu, M.; Zhang, H.; Sun, G.; Furey, A.; Randell, E.; Rahman, P.; Zhai, G. Endotypes of primary osteoarthritis identified by plasma metabolomics analysis. RHEUMATOLOGY 2021, 60(6), 2735–2744. [Google Scholar] [CrossRef] [PubMed]
- Angelini, F.; Widera, P.; Mobasheri, A.; Blair, J.; Struglics, A.; Uebelhoer, M.; Henrotin, Y.; Marijnissen, A.; Kloppenburg, M.; Blanco, F.; et al. Osteoarthritis endotype discovery via clustering of biochemical marker data. ANNALS OF THE RHEUMATIC DISEASES 2022, 81(5), 666–675. [Google Scholar] [CrossRef]
- Gallois, A.; Mazzorana, M.; Vacher, J.; Jurdic, P. Osteoimmunology: an integrated vision of immune and bone systems. M S-MEDECINE SCIENCES 2009, 25(3), 259–265. [Google Scholar] [CrossRef]
- Xie, Y; Zhang, L; Xiong, Q. Bench-to-bedside strategies for osteoporotic fracture: From osteoimmunology to mechanosensation. BONE RESEARCH 2019, 7, 25. [Google Scholar] [CrossRef]
- Hashimoto, T.; Akagi, M.; Tsukamoto, I.; Hashimoto, K.; Morishita, T.; Ito, T.; Goto, K. RANKL-mediated osteoclastic subchondral bone loss at a very early stage precedes subsequent cartilage degeneration and uncoupled bone remodeling in a mouse knee osteoarthritis model. JOURNAL OF ORTHOPAEDIC SURGERY AND RESEARCH 2025, 20(1). [Google Scholar] [CrossRef]
- Di Cicco, G.; Marzano, E.; Mastrostefano, A.; Pitocco, D.; Castilho, R.; Zambelli, R.; Mascio, A.; Greco, T.; Cinelli, V.; Comisi, C.; et al. The Pathogenetic Role of RANK/RANKL/OPG Signaling in Osteoarthritis and Related Targeted Therapies. BIOMEDICINES 2024, 12(10). [Google Scholar] [CrossRef]
- Li, Y.; Luo, W.; Zhu, S.; Lei, G. T Cells in Osteoarthritis: Alterations and Beyond. FRONTIERS IN IMMUNOLOGY 2017, 8. [Google Scholar] [CrossRef]
- Timmermans, R.; Blom, A.; Nelissen, R.; Broekhuis, D.; van der Kraan, P.; Meulenbelt, I.; van den Bosch, M.; Ramos, Y. Mechanical stress and inflammation have opposite effects on Wnt signaling in human chondrocytes. JOURNAL OF ORTHOPAEDIC RESEARCH 2024, 42(2), 286–295. [Google Scholar] [CrossRef]
- Xue, C.; Chu, Q.; Shi, Q.; Zeng, Y.; Lu, J.; Li, L. Wnt signaling pathways in biology and disease: mechanisms and therapeutic advances. SIGNAL TRANSDUCTION AND TARGETED THERAPY 2025, 10(1). [Google Scholar] [CrossRef]
- Zhen, G.; Wen, C.; Jia, X.; Li, Y.; Crane, J.; Mears, S.; Askin, F.; Frassica, F.; Chang, W.; Yao, J.; et al. Inhibition of TGF-β signaling in mesenchymal stem cells of subchondral bone attenuates osteoarthritis. NATURE MEDICINE 2013, 19(6), 704–+. [Google Scholar] [CrossRef]
- Batarfi, W.; Yunus, M.; Hamid, A.; Maarof, M.; Rani, R. Breaking Down Osteoarthritis: Exploring Inflammatory and Mechanical Signaling Pathways. LIFE-BASEL 2025, 15(8). [Google Scholar] [CrossRef]
- Miyatake, K.; Kumagai, K.; Imai, S.; Yamaguchi, Y.; Inaba, Y. Sclerostin inhibits interleukin-1β-induced late stage chondrogenic differentiation through downregulation of Wnt/β-catenin signaling pathway. PLOS ONE 2020, 15(9). [Google Scholar] [CrossRef]
- Ivanova, M.; Dao, J.; Kasaci, N.; Friedman, A.; Noll, L.; Goker-Alpan, O. Wnt signaling pathway inhibitors, sclerostin and DKK-1, correlate with pain and bone pathology in patients with Gaucher disease. FRONTIERS IN ENDOCRINOLOGY 2022, 13. [Google Scholar] [CrossRef]
- Wang, Y.; Fan, X.; Xing, L.; Tian, F. Wnt signaling: a promising target for osteoarthritis therapy. CELL COMMUNICATION AND SIGNALING 2019, 17(1). [Google Scholar] [CrossRef] [PubMed]
- Kovács, B.; Vajda, E.; Nagy, E. Regulatory Effects and Interactions of the Wnt and OPG-RANKL-RANK Signaling at the Bone-Cartilage Interface in Osteoarthritis. INTERNATIONAL JOURNAL OF MOLECULAR SCIENCES 2019, 20(18). [Google Scholar] [CrossRef]
- Wood, M.; Miller, R.; Malfait, A. The Genesis of Pain in Osteoarthritis: Inflammation as a Mediator of Osteoarthritis Pain. CLINICS IN GERIATRIC MEDICINE 2022, 38(2), 221–238. [Google Scholar] [CrossRef] [PubMed]
- Thirumaran, A.; Deveza, L.; Atukorala, I.; Hunter, D. Assessment of Pain in Osteoarthritis of the Knee. JOURNAL OF PERSONALIZED MEDICINE 2023, 13(7). [Google Scholar] [CrossRef] [PubMed]
- Cross, M.; Dubouis, L.; Mangin, M.; Hunter, D.; March, L.; Hawker, G.; Guillemin, F. Defining Flare in Osteoarthritis of the Hip and Knee: A Systematic Literature Review—OMERACT Virtual Special Interest Group. JOURNAL OF RHEUMATOLOGY 2017, 44(12), 1920–1927. [Google Scholar] [CrossRef]
- Marty, M.; Hilliquin, P.; Rozenberg, S.; Valat, J.; Vignon, E.; Coste, P.; Savarieau, B.; Allaert, F. Validation of the KOFUS (Knee Osteoarthritis Flare-Ups Score). JOINT BONE SPINE 2009, 76(3), 268–272. [Google Scholar] [CrossRef] [PubMed]
- Parry, E; Ogollah, R; Peat, G. Acute flare-ups ’in patients with, or at high risk of, knee osteoarthritis: a daily diary study with case-crossover analysis. OSTEOARTHRITIS CARTILAGE 2019, 27(8), 1124–1128. [Google Scholar] [CrossRef]
- Sobieh, B.; El-Mesallamy, H.; Kassem, D. Beyond mechanical loading: The metabolic contribution of obesity in osteoarthritis unveils novel therapeutic targets. HELIYON 2023, 9. [Google Scholar] [CrossRef]
- Nedunchezhiyan, U.; Varughese, I.; Sun, A.; Wu, X.; Crawford, R.; Prasadam, I. Obesity, Inflammation, and Immune System in Osteoarthritis. FRONTIERS IN IMMUNOLOGY 2022, 13. [Google Scholar] [CrossRef]
- Henriques, J.; Berenbaum, F.; Mobasheri, A. Obesity-induced fibrosis in osteoarthritis: Pathogenesis, consequences and novel therapeutic opportunities. OSTEOARTHRITIS AND CARTILAGE OPEN 2024, 6. [Google Scholar] [CrossRef]
- Reddy, N.; Raynor, W.; Werner, T.; Baker, J.; Alavi, A.; Revheim, M. 18F-FDG and 18F-NaF PET/CT Global Assessment of Large Joint Inflammation and Bone Turnover in Rheumatoid Arthritis. DIAGNOSTICS 2023, 13. [Google Scholar] [CrossRef]
- Corrado, A.; Neve, A.; Macchiarola, A.; Gaudio, A.; Marucci, A.; Cantatore, F. RANKL/OPG Ratio and DKK-1 Expression in Primary Osteoblastic Cultures from Osteoarthritic and Osteoporotic Subjects. JOURNAL OF RHEUMATOLOGY 2013, 40(5), 684–694. [Google Scholar] [CrossRef]
- Funck-Brentano, T.; Bouaziz, W.; Marty, C.; Geoffroy, V.; Hay, E.; Cohen-Solal, M. Dkk-1-Mediated Inhibition of Wnt Signaling in Bone Ameliorates Osteoarthritis in Mice. ARTHRITIS & RHEUMATOLOGY 2014, 66(11), 3028–3039. [Google Scholar] [CrossRef]
- Gatti, D.; Viapiana, O.; Fracassi, E.; Idolazzi, L.; Dartizio, C.; Povino, M.; Adami, S.; Rossini, M. Sclerostin and DKK1 in Postmenopausal Osteoporosis Treated with Denosumab. JOURNAL OF BONE AND MINERAL RESEARCH 2012, 27(11), 2259–2263. [Google Scholar] [CrossRef] [PubMed]
- Butler, J.; Murray, D.; Hurson, C.; O’Brien, J.; Doran, P.; O’Byrne, J. The Role of Dkk1 in Bone Mass Regulation: Correlating Serum Dkk1 Expression with Bone Mineral Density. JOURNAL OF ORTHOPAEDIC RESEARCH 2011, 29, 414–418. [Google Scholar] [CrossRef] [PubMed]
- Tian, J.; Xu, X.; Shen, L.; Yang, Y.; Zhu, R.; Shuai, B.; Zhu, X.; Li, C.; Ma, C.; Lv, L. Association of Serum Dkk-1 Levels with β-catenin in Patients with Postmenopausal Osteoporosis. JOURNAL OF HUAZHONG UNIVERSITY OF SCIENCE AND TECHNOLOGY-MEDICAL SCIENCES 2015, 35, 212–218. [Google Scholar] [CrossRef] [PubMed]
- Azzam, A.; Labib, A.; Haseeb, A.; Abd-Elaziz, A. Correlation of Circulating Dickkopf-1 Level with Sonographic Findings and Radiographic Grading in Primary Knee Osteoarthritis. JOURNAL OF MEDICAL ULTRASOUND 2025, 33(1), 29–34. [Google Scholar] [CrossRef]
- Honsawek, S.; Tanavalee, A.; Yuktanandana, P.; Ngarmukos, S.; Saetan, N.; Tantavisut, S. Dickkopf-1 (Dkk-1) in plasma and synovial fluid is inversely correlated with radiographic severity of knee osteoarthritis patients. BMC MUSCULOSKELETAL DISORDERS 2010, 11. [Google Scholar] [CrossRef]
- Ibrahim, N.; Abdel-Monem, S.; Elbarashy, A.; Elhussieny, H.; Elsayed, R. Study of serum and synovial fluid Dickkopf-1 levels in patients with primary osteoarthritis of the knee joint in correlation with disease activity and severity. EGYPTIAN RHEUMATOLOGY AND REHABILITATION 2020, 47(1). [Google Scholar] [CrossRef]
- Hassan, W.; Behiry, E. DECREASED SYNOVIAL LEVELS OF DICKKOPF-1 ARE ASSOCIATED WITH RADIOLOGICAL PROGRESSION IN KNEE OSTEOARTHRITIS PATIENTS. ANNALS OF THE RHEUMATIC DISEASES 2018, 77, 1146–1146. [Google Scholar] [CrossRef]
- Min, S.; Wang, C.; Lu, W.; Xu, Z.; Shi, D.; Chen, D.; Teng, H.; Jiang, Q. Serum levels of the bone turnover markers dickkopf-1, osteoprotegerin, and TNF-α in knee osteoarthritis patients. CLINICAL RHEUMATOLOGY 2017, 36(10), 2351–2358. [Google Scholar] [CrossRef] [PubMed]
- Boyce, B.; Xing, L.; Chen, D. Osteoprotegerin, the bone protector, is a surprising target for β-catenin signaling. CELL METABOLISM 2005, 2(6), 344–345. [Google Scholar] [CrossRef] [PubMed]
- Pilichou, A.; Papassotiriou, I.; Michalakakou, K.; Fessatou, S.; Fandridis, E.; Papachristou, G.; Terpos, E. High levels of synovial fluid osteoprotegenin (OPG) and increased serum ratio of receptor activator of nuclear factor-κB ligand (RANKL) to OPG correlate with disease severity in patients with primary knee osteoarthritis. CLINICAL BIOCHEMISTRY 2008, 41(9), 746–749. [Google Scholar] [CrossRef]
- Krystufkova, O.; Niederlova, J.; Senolt, V.; Hladikova, M.; Ruzickova, S.; Vencovsky, J. OPG and RANKL in serum and synovial fluids of patients with rheumatoid arthritis, osteoarthritis and spondylarthropathy. 2003, 5, S31–S31. [Google Scholar]
- Quaresma, T.; de Almeida, S.; da Silva, T.; Louzada-Junior, P.; de Oliveira, R. Comparative study of the synovial levels of RANKL and OPG in rheumatoid arthritis, spondyloarthritis and osteoarthritis. ADVANCES IN RHEUMATOLOGY 2023, 63(1). [Google Scholar] [CrossRef] [PubMed]
- Csifo, E.; Katona, T.; Arseni, J.; Nagy, E.; Gergely, I.; Nagy, Ö. Correlation of Serum and Synovial Osteocalcin, Osteoprotegerin and Tumor Necrosis Factor-Alpha with the Disease Severity Score in Knee Osteoarthritis. ACTA MEDICA MARISIENSIS 2014, 60(3), 102–105. [Google Scholar] [CrossRef]
- Nagy, E. E.; Varga-Fekete, T.; Puskas, A.; Kelemen, P.; Brassai, Z.; Szekeres-Csiki, K.; Gombos, T.; Csanyi, M. C.; Harsfalvi, J. High circulating osteoprotegerin levels are associated with non-zero blood groups. BMC CARDIOVASCULAR DISORDERS 2016, 16. [Google Scholar] [CrossRef]
- Sugisaki, R.; Miyamoto, Y.; Yoshimura, K.; Sasa, K.; Kaneko, K.; Tanaka, M.; Itose, M.; Inoue, S.; Baba, K.; Shirota, T.; et al. Possible involvement of elastase in enhanced osteoclast differentiation by neutrophils through degradation of osteoprotegerin. BONE 2020, 132. [Google Scholar] [CrossRef]
- Nagy, E. Elastase mediated-degradation of osteoprotegerin: Possible pitfalls and functional relevance. BONE 2020, 133. [Google Scholar] [CrossRef]
- Bouaziz, W.; Funck-Brentano, T.; Lin, H.; Marty, C.; Hay, E.; Cohen-Solal, M. LACK OF SCLEROSTIN PROMOTES OSTEOARTHRITIS BY ACTIVATING CANONICAL AND NON-CANONICAL WNT PATHWAYS. OSTEOARTHRITIS AND CARTILAGE 2014, 22, S340–S340. [Google Scholar] [CrossRef]
- Chang, J.; Christiansen, B.; Murugesh, D.; Sebastian, A.; Hum, N.; Collette, N.; Hatsell, S.; Economides, A.; Blanchette, C.; Loots, G. SOST/Sclerostin Improves Posttraumatic Osteoarthritis and Inhibits MMP2/3 Expression After Injury. JOURNAL OF BONE AND MINERAL RESEARCH 2018, 33(6), 1105–1113. [Google Scholar] [CrossRef]
- Eldin, A.B.; Mohamed, E.S.; El Zahraa; Hassan, F. The role of sclerostin in knee osteoarthritis and its relation to disease progression. EGYPTIAN JOURNAL OF INTERNAL MEDICINE 2019, 31, 958–964. [Google Scholar] [CrossRef]
- Rousseau, J-C.; Sornay-Rendu, E.; Borel, O.; Bertholon, C.; Garnero, P.; Chapurlat, R. Serum sclerostin is not associated with knee osteoarthritis prevalence and progression of Kellgren-Lawrence score in women: the OFELY study. Osteoarthritis and Cartilage 2014, 22, S68. [Google Scholar] [CrossRef]
- Halupczok-Zyla, J.; Jawiarczyk-Przybylowska, A.; Bolanowski, M. Sclerostin and OPG/RANK-L system take part in bone remodeling in patients with acromegaly. FRONTIERS IN ENDOCRINOLOGY 2024, 15. [Google Scholar] [CrossRef] [PubMed]
- Zhao, Y.; Wang, J.; Xu, L.; Xu, H.; Yan, Y.; Zhao, H.; Yan, Y. Beyond Bone Loss: A Biology Perspective on Osteoporosis Pathogenesis, Multi-Omics Approaches, and Interconnected Mechanisms. BIOMEDICINES 2025, 13(6). [Google Scholar] [CrossRef]
- Yazici, Y.; Kennedy, S.; Swearingen, C.; Tambiah, J. The Novel, Intra-articular CLK/DYRK1A Inhibitor Lorecivivint (LOR; SM04690), Which Modulates the Wnt Pathway, Improved Responder Outcomes in Subjects with Knee Osteoarthritis: A Post Hoc Analysis from a Phase 2b Trial. ARTHRITIS & RHEUMATOLOGY 2019, 71. [Google Scholar]
Figure 1.
Loadings of PC1 vs. PC2. DIS HIST – disease history, RAD SCORE – radiological score, MONO – monocytes, PLT – platelets, N/L – neutrophil-to-lymphocyte ratio.
Figure 1.
Loadings of PC1 vs. PC2. DIS HIST – disease history, RAD SCORE – radiological score, MONO – monocytes, PLT – platelets, N/L – neutrophil-to-lymphocyte ratio.
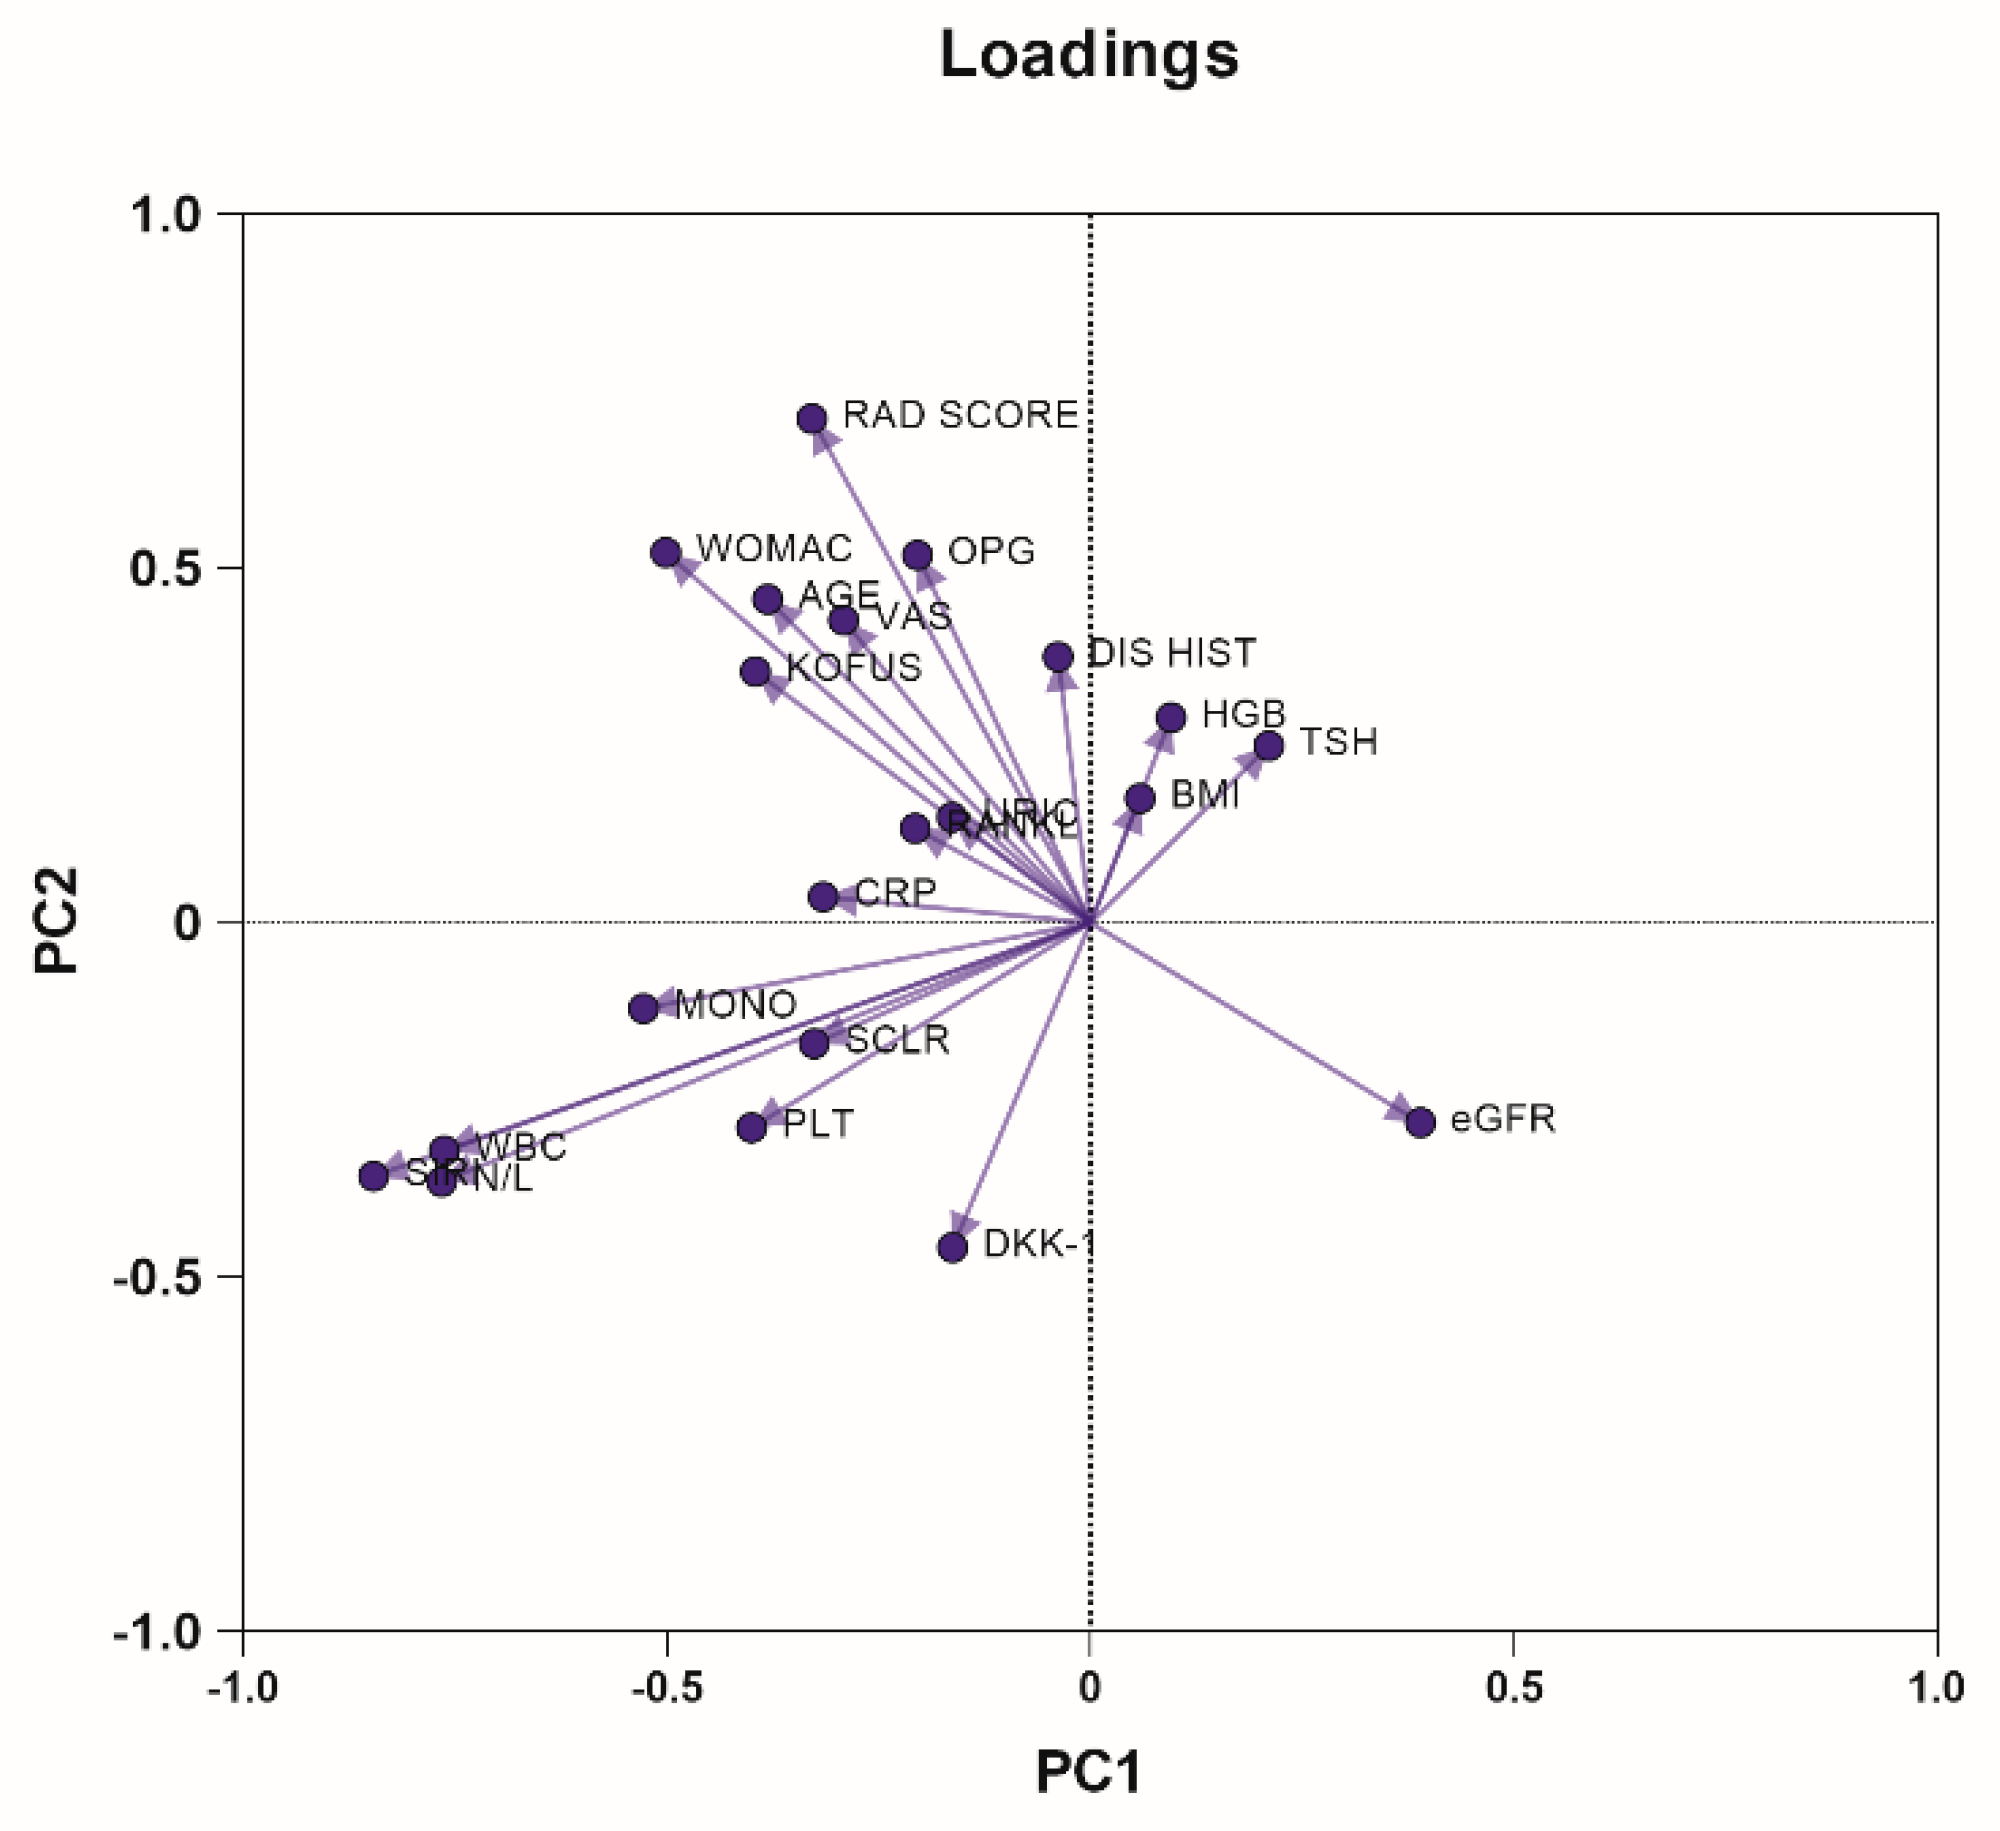
Figure 2.
A-B. Serum DKK-1 levels in the VAShi and the VASlo subgroups in all patients (n=72) (A). Correlation of serum DKK-1 with the KOFUS scores in the non-obese patients (n=53) (B).
Figure 2.
A-B. Serum DKK-1 levels in the VAShi and the VASlo subgroups in all patients (n=72) (A). Correlation of serum DKK-1 with the KOFUS scores in the non-obese patients (n=53) (B).
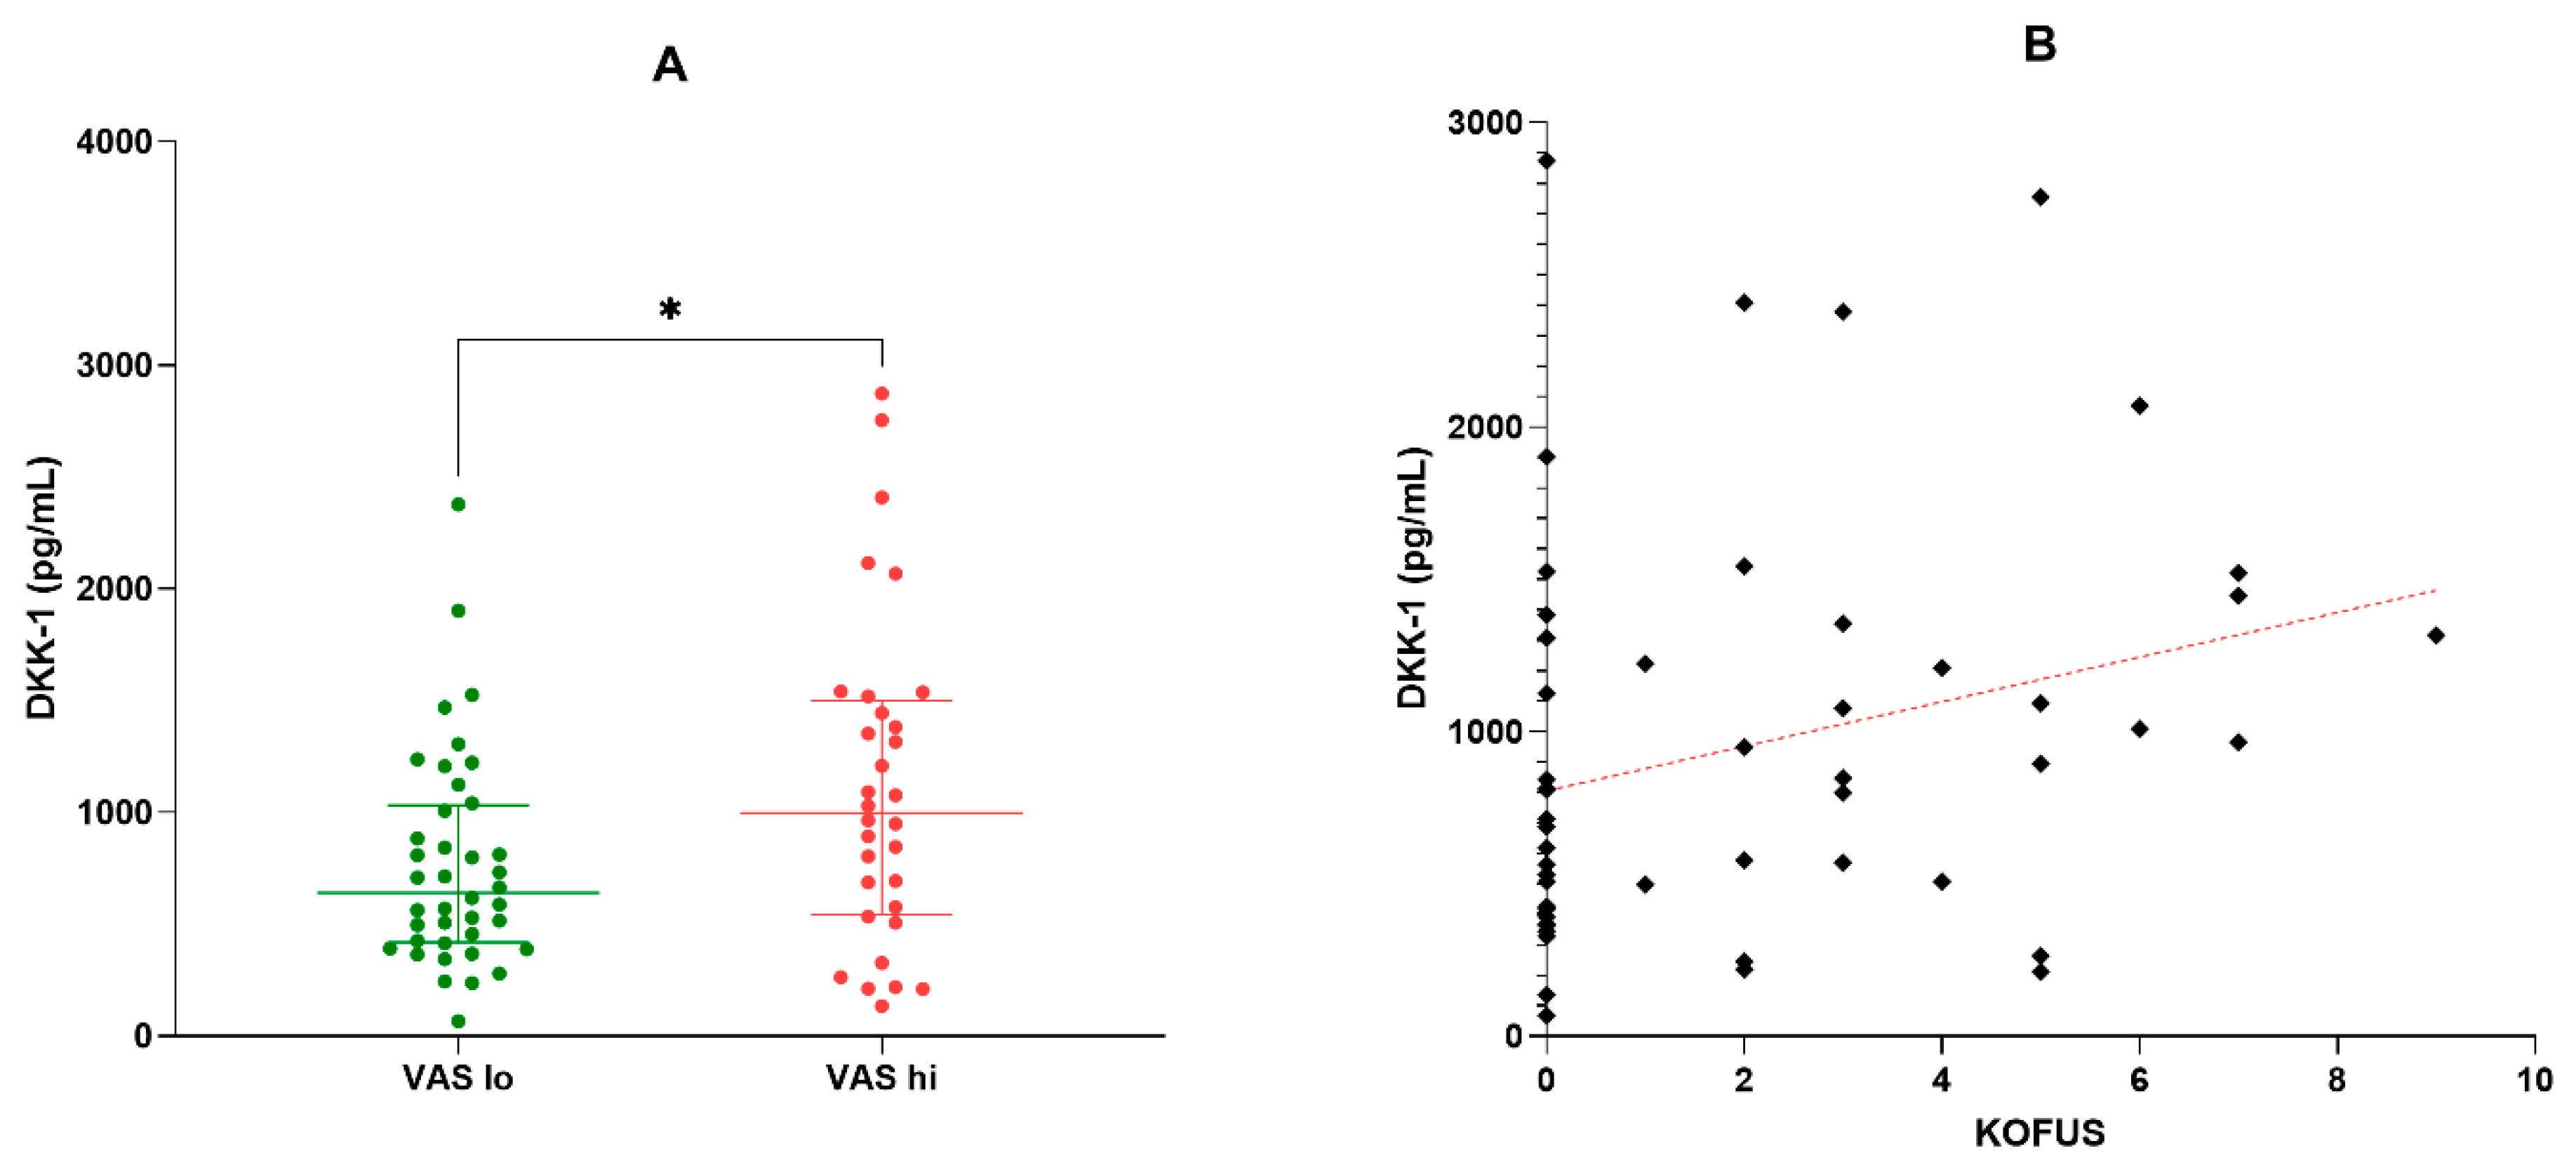
Figure 3.
A-B. Serum DKK-1 in patients with normal vs. abnormally low bone mineral density (A), normal bone mineral density vs. osteopenic vs. osteoporotic patients.
Figure 3.
A-B. Serum DKK-1 in patients with normal vs. abnormally low bone mineral density (A), normal bone mineral density vs. osteopenic vs. osteoporotic patients.
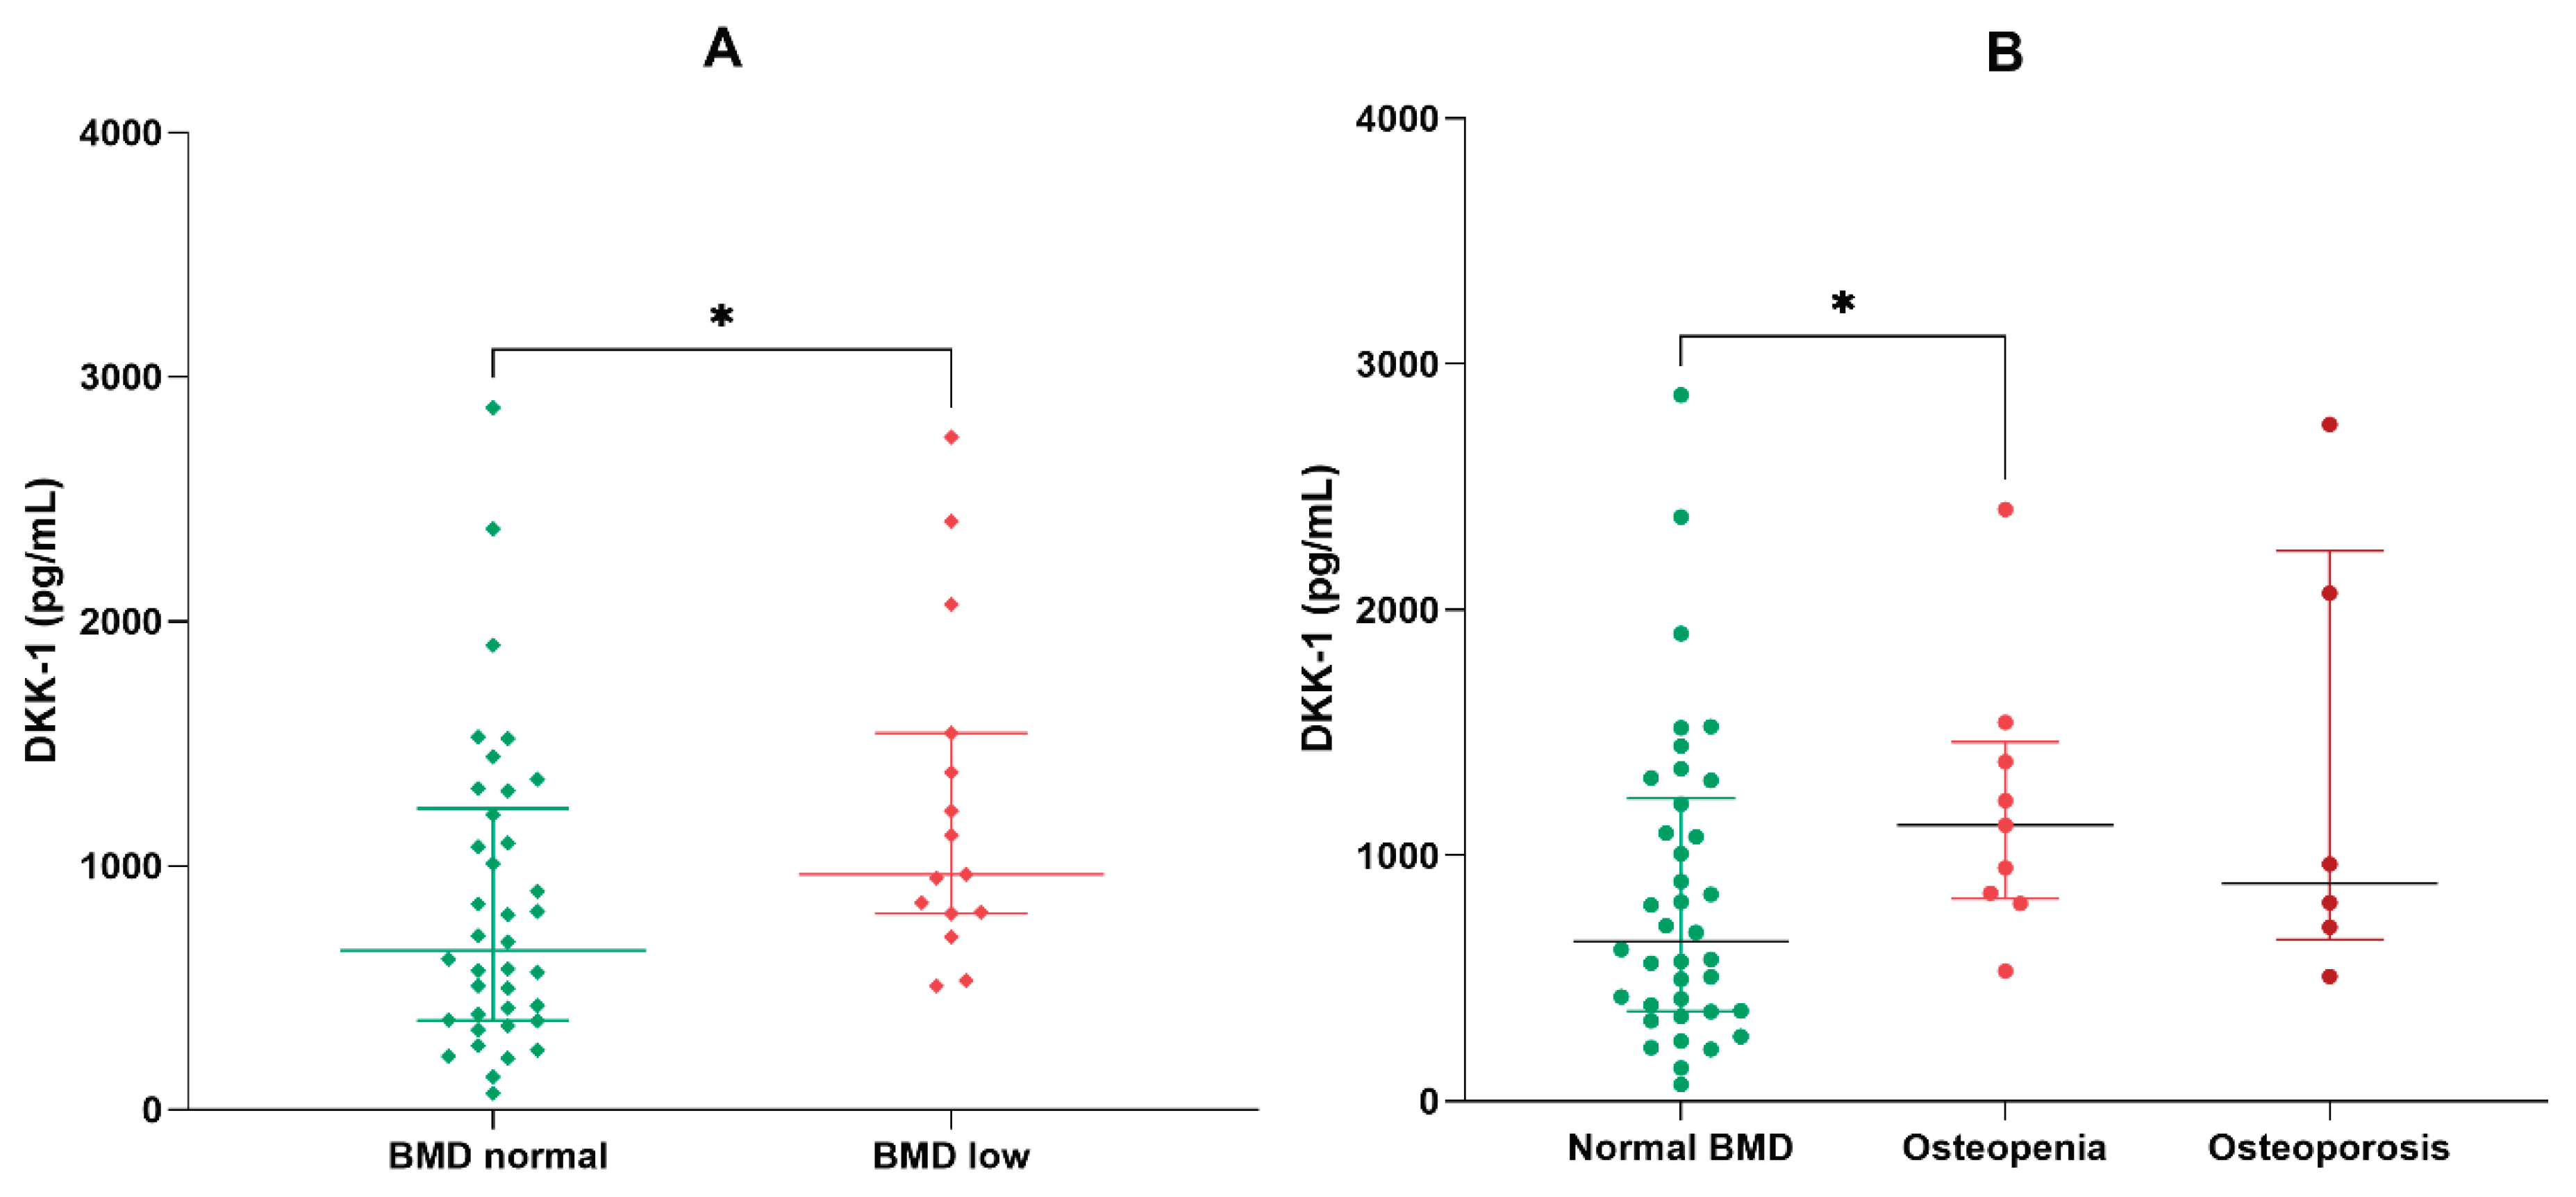

Table 1.
Clinical variables of the overall group of OA patients, and their comparison in the BMI subgroups.
Table 1.
Clinical variables of the overall group of OA patients, and their comparison in the BMI subgroups.
| Variable | All cases (n=72) | BMI<30 (n=53) | BMI≥30 (n=19) | p values |
|---|---|---|---|---|
| Demographic factors | ||||
| Age (years) | 68 (63-75) | 68 (62-75) | 68 (63-75) | 0.829 |
| Gender (f/m) | 62 (86.1) / 10 (13.9) | 44 (83) / 9 (17) | 18 (94.4)/ 1 (5.6) | 0.272 |
| History, symptoms, and comorbidities | ||||
| Disease history (years) | 7 (3-15) | 7 (3-11) | 10 (5-15) | 0.120 |
| Crepitus (y/n) | 50 (69.4) / 22 (30.6) | 34 (64.2) / 19 (35.8) | 16 (84.2) /3 (15.8) | 0.148 |
| Sensibility (y/n) | 27 (37.5) / 45 (62.5) | 17 (32.1) / 36 (67.9) | 10 (52.6) / 9 (47.4) | 0.166 |
| Hyperemia (y/n) | 62 (86.1) / 10 (13.9) | 45 (84.9) / 8 (15.1) | 17 (89.5)/ 2 (10.5) | 1.000 |
| Swelling (y/n) | 7 (9.7) / 65 (90.3) | 5 (9.4) / 48 (90.6) | 2 (10.5) /17 (89.5) | 0.988 |
| Bony prominences (y/n) | 17 (23.6) / 55 (76.4) | 12 (22.6) / 41 (77.4) | 5 (35.5)/ 14 (64.5) | 0.759 |
| Mobility impairment (y/n) | 39 (54.2) / 33 (45.8) | 26 (49) / 27 (51) | 13 (68.4) / 6 (31.6) | 0.184 |
| Coxalgia (y/n) | 6 (8.3) / 67 (91.7) | 3 (5.6) / 50 (94.4) | 3 (15.8) /16 (84.2) | 0.183 |
| Dysplasia (y/n) | 5 (6.9) / 67 (93.1) | 5 (9.4) / 48 (90.6) | 0 (0) /19 (100) | 0.316 |
| Limping (y/n) | 23 (31.9) / 49 (68.1) | 15 (28.3) / 38 (71.7) | 8 (42.1) /11 (57.9) | 0.389 |
| Trauma in history (y/n) | 6 (8.3) / 67 (91.7) | 4 (7.5) / 49 (92.5) | 2 (10.5) /17 (89.5) | 0.647 |
| Heart failure (y/n) | 58 (80.5) / 14 (19.5) | 41 (77.5) / 12 (22.5) | 17 (89.5) /2 (10.5) | 0.714 |
| Hypertension (y/n) | 57 (79.2) / 15 (20.8) | 41 (77.5) / 12 (22.5) | 16 (84.2) /3 (15.8) | 0.744 |
| Diabetes (y/n) | 17 (23.6) / 55 (76.4) | 13 (24.5) / 38 (75.5) | 4 (23.5) /17 (76.5) | 0.761 |
| Hypothyroidism (y/n) | 13 (18) / 59 (82) | 9 (17) / 44 (83) | 4 (21)/ 15 (79) | 0.692 |
| Dyslipidemia (y/n) | 28 (38.8) / 54 (61.2) | 18 (33.9) / 35 (66.1) | 10 (52.6) / 9 (47.4) | 0.152 |
| Osteopenia/osteoporosis (y/n) | 12(16.6)/9(12.5)/51(70.9) | 9(16.9)/6(11.3)/38(71.8) | 3(15.7)/3(15.7)/13(68.6) | 0.600 |
| Clinical data | ||||
| Body mass index | 25.7 (24-30.1) | 24.5 (23.7-26.6) | 31 (30.4-31.6) | <0.001 |
| Kellgren-Lawrence score | 2.35 ± 0.08 | 2.30 ± 0.09 | 2.50 ± 0.14 | 0.328 |
| WOMAC | 25.6 ± 1.27 | 25.5 ± 1.42 | 26.2 ± 2.83 | 0.761 |
| VAS | 4.41 ± 0.17 | 4.51 ± 0.20 | 4.16 ± 0.31 | 0.274 |
| KOFUS flare-ups | 1.94 ± 0.30 | 2.02 ± 0.34 | 1.73 ± 0.65 | 0.518 |
| Laboratory findings | ||||
| C-reactive protein (mg/L) | 3.2 (1.8-5.2) | 3.2 (1.6-4.8) | 3.8 (2.8-7.1) | 0.064 |
| White blood cells (109/L) | 6.4 (5.6-7.3) | 6.3 (5.6-7.2) | 7.1 (5.7-7.8) | 0.561 |
| Hemoglobin (g/dL) | 13.6 (13-14.4) | 13.6 (12.9-14.4) | 13.8 (13.4-14.4) | 0.627 |
| N/L ratio | 1.9 (1.4-2.4) | 1.9 (1.3-2.3) | 1.9 (1.4-2.4) | 0.638 |
| Monocytes (109/L) | 400 (330-510) | 395 (330-500) | 450 (300-560) | 0.793 |
| SIRI | 705 (519-1188) | 6898 (533-880) | 945 (466-1398) | 0.498 |
| Uric acid (mg/dL) | 4.9 (4.3-5.7) | 4.8 (4.4-5.8) | 5.5 (4.2-5.6) | 0.558 |
| eGFR (mL/min/1.73m2) | 82.9 ± 2.1 | 80.0 ± 2.5 | 80.9 ± 3.9 | 0.963 |
| Cholesterol, total (mg/dL) | 204 ± 6 | 197 ± 7 | 222 ± 11 | 0.197 |
| Triglycerides (mg/dL) | 147 ± 9 | 147 ± 11 | 143 ± 14 | 0.711 |
| TSH (µUI/mL) | 1.9 (1.2-3.3) | 1.9 (1.2-3.1) | 2.0 (1.5-3.4) | 0.724 |
| DKK-1 (pg/mL) | 802 (467-1234) | 808 (497-1306) | 693 (456-1207) | 0.667 |
| Sclerostin (pg/mL) | 104 (59-526) | 115 (59-535) | 76 (55-328) | 0.713 |
| OPG (pg/mL) | 3344 (2599-4654) | 2904 (2222-4073) | 3669 (2698-5156) | 0.462 |
| RANKL (pg/mL) | 61 (43-368) | 58 (41-428) | 61 (43-244) | 0.830 |
| Medication | ||||
| Topical creams and gels | 68 (94.4) / 4 (5.6) | 49 (92.4) / 4 (7.6) | 19 (100) / 0 (0) | 0.221 |
| Analgesics | 42 (58.3) / 30 (41.7) | 32 (67.9) / 21 (32.1) | 10 (52.6) / 9 (47.4) | 0.559 |
| NSAIDs, p.o. | 51 (70.8) / 21 (29.2) | 37 (69.8) / 16 (30.2) | 14 (73.6) / 5 (26.4) | 0.751 |
| Chondroprotectors, p.o. | 39 (54.2) / 33 (45.8) | 29 (54.7) / 24 (45.3) | 10 (52.6) / 9 (47.4) | 0.876 |
| Corticosteroids, local infiltrations | 19 (26.4) / 53 (73.6) | 13 (24.5) / 40 (75.5) | 6 (31.6) / 13 (68.4) | 0.552 |
Variables with normal distribution (marked with an asterisk) are represented by mean ± standard error (SE), while variables with abnormal distribution are shown as median (quartile range). For categorical variables, comparisons were made using Fisher’s exact test. The BMI groups were compared using the Mann-Whitney U test for continuous variables. P values less than 0.05 were considered statistically significant.
Table 2.
Principal component analysis defining PCs 1-4.
| PC summary | PC1 | PC2 | PC3 | PC4 |
|---|---|---|---|---|
| Eigenvalue | 3.62 | 2.70 | 2.11 | 1.85 |
| Proportion of variance | 17.24% | 12.87% | 10.07% | 8.81% |
| Cumulative proportion of variance | 17.24% | 30.12% | 40.19% | 48.99% |
Table 3.
Correlations of the VAS and the KOFUS scores in the overall group (n=72).
| VAS | KOFUS | WOMAC | ||||
|---|---|---|---|---|---|---|
| Variables | Spearman R | p-level | Spearman R | p-level | Spearman R | p-level |
| Age | 0.123 | 0.302 | 0.233 | 0.048 | 0.297 | 0.011 |
| Disease history | 0.082 | 0.491 | 0.025 | 0.834 | 0.278 | 0.018 |
| Body mass index | 0.071 | 0.550 | -0.026 | 0.826 | 0.111 | 0.353 |
| WOMAC | 0.651 | <0.001 | 0.534 | <0.001 | - | - |
| K-L score | 0.430 | <0.001 | 0.303 | 0.009 | 0.539 | <0.001 |
| VAS | - | - | 0.597 | <0.001 | 0.623 | <0.001 |
| KOFUS | 0.597 | <0.001 | - | - | 0.534 | <0.001 |
| WBC | 0.134 | 0.303 | 0.087 | 0.507 | 0.082 | 0.529 |
| N/L ratio | 0.023 | 0.855 | -0.048 | 0.714 | 0.085 | 0.514 |
| Monocytes | 0.097 | 0.454 | -0.034 | 0.794 | 0.101 | 0.438 |
| SIRI | 0.099 | 0.445 | -0.042 | 0.746 | 0.147 | 0.257 |
| Hemoglobin | 0.224 | 0.081 | 0.034 | 0.794 | 0.053 | 0.680 |
| eGFR | 0.010 | 0.937 | -0.087 | 0.504 | -0.089 | 0.489 |
| Platelets | 0.163 | 0.210 | -0.026 | 0.840 | 0.229 | 0.075 |
| C-reactive protein | 0.139 | 0.242 | -0.017 | 0.885 | 0.203 | 0.087 |
| TSH | -0.214 | 0.102 | 0.036 | 0.787 | 0.101 | 0.445 |
| Uric acid | 0.016 | 0.901 | -0.042 | 0.750 | -0.114 | 0.385 |
| DKK-1 | 0.166 | 0.191 | 0.236 | 0.046 | 0.147 | 0.2154 |
| Sclerostin | 0.000 | 0.999 | 0.102 | 0.394 | -0.093 | 0.434 |
| OPG | 0.003 | 0.977 | 0.040 | 0.740 | 0.100 | 0.402 |
| RANKL | 0.083 | 0.750 | 0.004 | 0.971 | 0.059 | 0.621 |
| OPG/RANKL | 0.071 | 0.550 | 0.065 | 0.588 | 0.023 | 0.844 |
Correlations were calculated with the Spearman rank correlation method. P<0.05 has been considered the threshold of statistical significance.
Table 4.
Multiple linear regression model for the prediction of the KOFUS score.
| Variable | Estimate | 95% CI | t | P value |
|---|---|---|---|---|
| Intercept | -3.500 | -7.204 to 0.204 | 1.90 | 0.063 |
| Body mass index | 0.060 | -0.061 to 0.181 | 0.99 | 0.322 |
| Bone mineral density | 0.256 | -0.708 to 1.220 | 0.53 | 0.596 |
| Kellgren-Lawrence score | 1.311 | 0.413 to 2.209 | 2.94 | 0.005 |
| sDKK-1 | 0.001 | 4.413e-007 to 0.002 | 2.01 | 0.049 |
F=3.74 and p=0.01 for the overall regression model.
Disclaimer/Publisher’s Note: The statements, opinions and data contained in all publications are solely those of the individual author(s) and contributor(s) and not of MDPI and/or the editor(s). MDPI and/or the editor(s) disclaim responsibility for any injury to people or property resulting from any ideas, methods, instructions or products referred to in the content. |
© 2026 by the authors. Licensee MDPI, Basel, Switzerland. This article is an open access article distributed under the terms and conditions of the Creative Commons Attribution (CC BY) license (http://creativecommons.org/licenses/by/4.0/).
Copyright: This open access article is published under a Creative Commons CC BY 4.0 license, which permit the free download, distribution, and reuse, provided that the author and preprint are cited in any reuse.


