
Submitted:
21 February 2024
Posted:
22 February 2024
You are already at the latest version
Abstract
A proportion of osteoarthritis (OA) patients are unsatisfied with post-operative outcomes following total joint replacement surgery (TJR), with insufficient pain relief or poor functional improvement. Predicting those will have poor outcomes would be beneficial for patients and clinicians. The aim of this study was to determine the relationship between baseline anthropometric data and the concentration of pre-operative serum and peri-operative synovial fluid (SF) cytokines with 7-month post-operative outcomes in a cohort of knee and hip OA patients. 160 OA patients were recruited who were scheduled for TJR. The concentration of 24 cytokines were measured in blood and SF by multiplex assay. EQ5Dindex health status was assessed pre-operatively and at 7-months post-operatively. 13% of patients were identified as non-responders based on EQ5Dindex. Compared to responders, non-responders were of higher BMI, had greater waist and hip circumference and had higher levels of SF leptin but lower levels of SF Resistin (p<0.05). Linear regression analysis found a significant relationship between pre-operative body weight and post-operative response (ΔEQ5Dindex; r=0.222, p=0.049). The combination of body weight with SF amphiregulin and SF IL-6 provided an improved predictive model of post-operative response (r=0.470, p=0.035).
Keywords:
osteoarthritis
; post-operative outcomes
; pain
; health status
; cytokines
; obesity
; inflammation
1. Introduction
With an aging population and increasing incidence of obesity the number of total joint replacements performed each year is increasing and is projected to continue to increase [1]. The main indication for the procedure is osteoarthritis (OA). In 2018, more than 95,000 hip and 100,000 knee total joint replacements surgeries were performed in England, Wales and Northern Ireland. Unfortunately, based on the quality of life patient questionnaires (EQ-5D and Oxford Knee Score), a proportion of patients report dissatisfaction following joint replacement surgery [2]. Approximately 10% of hip OA patients and 20% of knee OA patients report having a poor clinical outcome, mainly characterised by a lack of pain relief or poor improvement in function [3].
In attempting to identify prognostic biomarkers of poor post-operative outcome several studies have examined the association between serum and synovial fluid concentrations of pro-inflammatory cytokines and pain in OA patients [4, 5] since it is known that such inflammatory factors are capable of promote the sensitisation of nociceptors [6, 7] . Indeed, it has previously been reported that patient reported pain is associated with distinct patterns of synovitis [8]. Further, that specific sites of patient reported pain in knee OA patients are associated with greater synovitis , with synovial tissue that exhibited distinct fibroblast subsets that promoted neuronal growth and survival [9]. Furthermore, high concentrations of pre-operative synovial fluid TNFα and IL-6 were associated with increased post-operative pain at two year follow up [10]. In a separate study, a significant correlation was reported between peak CRP levels and the level of pain and stiffness at 2 days post-operatively [11]. However, to date no study has performed multiplexing profiling of both peri-operative synovial fluid and pre-operative serum cytokines and analysed their associations with post-operative joint replacement outcomes in patients with knee and hip OA. Therefore, the aim of this study was to investigate both peri-operative synovial fluid and pre-operative cytokines as potential predictive biomarkers of joint replacement outcome in a cohort of patients with osteoarthritis.
2. Materials and Methods
2.1. Patients
Following ethical approval (UK National Research Ethics Committee 14/ES/1044), 160 OA patients were recruited to the study who were scheduled to undergo total hip replacement surgery (n=97) or total knee replacement surgery (n=63) at either the Royal Orthopaedic Hospital, Birmingham, UK or Russells Hall Hospital, Dudley, UK. Pre-operatively, anthropometric data (including BMI, fat%, waist: hip ratio) were recorded. Patients completed EQ5D [12] pre-operatively and at 7 months post-operatively. Following completion of questionnaires, pre and post-operative data were available for EQ5Dindex and the five components of EQ5D, namely “mobility”, “usual activities”, “self-care”, “pain/discomfort” and “anxiety/depression”. Pre-operatively, blood samples were collected and peri-operatively synovial fluids were aspirated from the joint.
2.2. Quantification of Serum and Synovial Fluid Cytokines by Multiplex Bead Assay
To determine cytokine and chemokine concentrations in serum and synovial fluids, multiplex technology (Luminex® Screening Assay, R&D Systems) was performed. In the case of synovial fluid, samples were treated with 2mg/mL hyaluronidase as previously described [13]. Multi-plex analysis was performed according to the manufacturer’s instructions. In brief, 50 µl of a 1x antibody magnetic bead stock (Adiponectin, Serpin E1, Aggrecan, Amphiregulin, CCL11, CCL2, CCl3, CCL20, Chemerin, CXCL10, Dkk1, Galectin-1, gp130, IL1β, IL10, IL15, IL7, Visfatin, TNF-α, Galectin-3, Galectin-3BP, Lipocalin-2, CCL-4, FABP4, LIF, Leptin, IL6, Resistin, and MMP-1, -2, -3, -7, -8, -9, -10, -12, -13) was added to each well of a 96 well plate. 50 µl of standard solution or serum or hyaluronidase-treated synovial fluid was then added to relevant wells and incubated for 2 hr. Post incubation, the plate was washed 3x with wash buffer and 50 µl of a biotinylated antibody added to all wells. Following a 1 hr incubation, the plate was washed 3x and 50 µl of diluted streptavidin-PE added to all wells. After a further 30 min incubation in the dark, the plate was washed as before and cytokine concentrations analysed using a Luminex® 200™ instrument (Luminex® Corporation, Austin, Texas, USA).
2.3. Statistical Analysis
Data distribution was assessed using Kolmogorov- Smirnov test and was found to not be normally distributed. Mann-Whitney tests were performed to determine significance. Data are presented as Median with Interquartile Range (IQR). Univariate and multivariate linear regression analysis was performed using SPSS v24 software.
3. Results
3.1. Identification of Patients with Poor Post-Operative Outcomes and Analysis of EQ5D Index Components
Based on pre-operative and post-operative EQ-5D index, 87% (n=139) of patients had positive post-operative outcomes and were classified as ‘responders’. The remaining 13% (n=21) of patients, who either had a negative outcome or no improvement, were classified as “non-responders” (Figure 1a, b and Table 1). When comparing outcome between hip and knee joint replacement separately, 89% (n=86) of patients had positive response following hip replacement compared to 84% (n=53) who had positive response following knee replacement (Figure 1a, b and Table 1).
For the pain/discomfort EQ5D component, 72% (n=123) of patients improved following the surgery (Table 1). When comparing outcome between hip and knee joint replacement separately, 77% (n=81) of patients had positive pain/discomfort improvement following hip replacement compared to 63% (n=42) who had positive pain/discomfort improvement following knee replacement (Table 1).
Analysis of individual EQ5D components showed that responders improved in each of the EQ5D components, namely mobility, self-care, usual activities, pain/discomfort and anxiety/depression. The greatest improvements were in the mobility EQ5D component with 100% of hip OA and 100% of knee OA responder patients reporting no problem with their post-operative mobility (Table 2). Notably, the EQ5D pain component showed the least improvement post-operatively, with 15% of hip OA responders and 43% of knee OA responders still reporting “Level 2, some problem”. In contrast, those patients identified as non-responders saw no improvement in any of the EQ5D components (Table 2).
3.2. EQ5D Non-Responders Exhibited Greater Pre-Operative Adiposity and Differential Concentrations of Peri-Operative Synovial Fluid Inflammatory Cytokines
We then compared baseline pre-operative characteristics including anthropometric data, disease severity and serum/synovial fluid cytokine between responder and non-responder patients. Compared to responder patients, non-responder patients had significantly greater BMI (p<0.05), waist circumference (p<0.05) and hip circumference (p<0.05). However, there was no difference in either KL grade or joint space between responder and non-responder patients suggesting that joint severity at the time of surgery was not a factor in post-operative outcomes (Table 3).
In total, we determined the concentration of 24 cytokines/adipokines in peri-operative synovial fluid and pre-operative serum, which have previously been reported to be associated with the inflammatory phenotype of OA [14,15,16]. There was no significant difference in the concentration of any of the 24 cytokines in the serum between responders and non-responder patients. However, comparison of peri-operative synovial fluid cytokine concentrations revealed that non-responders had significantly lower levels of Resistin (0.97 ng/ml vs 2.96 ng/ml, p<0.05) but significantly greater levels of leptin (54.5 ng/ml vs 16.3 ng/ml; p<0.05), compared to responders (Table 3).
3.3. The Relationship between Pre-Operative Anthropometric Data and Post-Operative Change in EQ5D
Next, we investigated whether any of the baseline anthropometric and disease severity characteristics were predictive for post-operative outcome by performing linear regression analysis on their relationship to the change in EQ5Dindex (ΔEQ5D) between pre and 7 months post operation. Neither K/L grade nor joint space at the time of joint surgery was significantly related to ΔEQ5D. Furthermore, despite non-responders having on average a significantly higher BMI, waist circumference and hip circumference we did not observe a significant relationship between these variables and ΔEQ5D. However, baseline body weight showed a small but significant negative relationship to ΔEQ5D (β =-0.005, r=0.22, p=0.049), suggesting that high body weight at baseline explains a proportion of the poor post-operative response (Table 4).
3.4. The Relationship between Pre-Operative Serum and Synovial Fluid Cytokines and Post-Operative Change in EQ5D
We then examined whether the concentrations of pre-operative serum cytokines or peri-operative synovial fluid cytokines were predictive for the 7-month post-operative change in EQ5D (ΔEQ5D). Univariate linear regression was performed, followed by multivariate regression to account for potential confounders including joint severity (K/L grade, joint space), BMI, age, waist and hip circumference and body weight. Of the 24 cytokines quantified in the serum, we observed no significant relationship between cytokine concentration and ΔEQ5D, in either univariate or multivariate analysis (Table 5). Similarly, regression analysis of synovial fluid cytokines revealed no significant relationship between cytokine concentration and ΔEQ5D in either univariate or multivariate analysis with confounders (Table 6). However, there was a trend for a positive relationship between synovial fluid concentrations of IL-6 and ΔEQ5D (r=0.288, p=0.07) in univariate analysis, and a trend for a negative relationship between amphiregulin synovial fluid concentration and ΔEQ5D in both univariate (r=0.268, p=0.09) and multivariate analysis (r=0.619, p=0.07).
Exploring this further, we examined using multiple regression whether the combination of body weight with amphiregulin and/or IL-6 peri-operative synovial fluid concentration would provide a better predictor of ΔEQ5D (Table 7). Amphiregulin synovial fluid concentration with body weight was a significant predictor for the post-operative change in EQ5D (r=0.434, p=0.023), with the equation ΔEQ5D = -0.108[Amphiregulin ng/ml] -0.0006[Body weight kg] + 1.052. Similarly, IL-6 synovial fluid concentration with body weight was also a significant predictor for the post-operative change in EQ5D (r=0.418, p=0.035), with the equation Δ EQ5D = 7.4x10⁻⁵[IL-6 pg/ml] -0.006[Body weight kg] + 0.871. Finally, the combination of both amphiregulin and IL-6 synovial fluid concentrations with body weight provided a marginal improvement in the relationship (r=0.470, p=0.035) with the equation Δ EQ5D = 8.3x10⁻⁵[IL-6 pg/ml] -0.142[Amphiregulin ng/ml] -0.005[Body weight kg] + 0.919.
4. Discussion
This is the first study to profile pre-operative and peri-operatively 24 serum and synovial fluid cytokines and to analyse their associations with post-operative outcomes in knee and hip OA patients following joint replacement surgery. Based on change in EQ5D index we identified a population of knee and hip OA patients as non-responders with little to no improvement in any of the 5 individual EQ5D components including mobility, self-care, usual activities, pain/discomfort and anxiety/depression.
The comparison between the responder and non-responder groups revealed that on average the non-responders were of greater adiposity, with higher BMI and waist and hip circumferences. In line with this observation, non-responders also had significantly higher levels of the obesity-associated adipokine leptin in their joint synovial fluid at the time of joint replacement surgery. Interestingly we observed no difference in the concentration of leptin in the pre-operative serum between responders and non-responders, suggesting that it is the local effect of adiposity on the joint that is more relevant to post-operative outcomes. Taken together these observations infer that the obesity phenotype is associated with poor post-operative outcomes. Notably, obesity is a known risk factor for OA [17, 18], and recently it was determined via molecular endotyping that obesity impacts the inflammatory synovial fibroblast phenotype of not only load-bearing (e.g. knees and hips) [14, 15] but also non-load bearing joints such as the hands [19]. Furthermore, we and others have previously reported that obesity impacts the phenotype of multiple tissues within the synovial joint, including cartilage [20], subchondral bone [21] and the skeletal muscle [22, 23]. This is in line with recently published meta-analysis which demonstrated that pre-surgical obesity was associated with worse clinical outcomes of joint replacement procedure [24]. Furthermore, peri-operative levels of synovial fluid leptin were previously reported to significantly correlate with pre-operative level of pain reported in patients with hip OA [5].
In attempting to establish a predictive model for post-operative outcomes, we performed linear regression analysis of baseline anthropometric and cytokine profiles with change in EQ5Dindex from pre to post-operation. Firstly, our analysis found no relationship between pre-operative K/L grade or joint space with ΔEQ5D, suggesting that disease severity at the time of surgery does not impact on likely outcome. Our finding that body weight was significantly but negatively related to ΔEQ5D provides further support to the notion that increased adiposity is a likely predictor of poor post-operative outcomes. Despite not finding a significant relationship between ΔEQ5D and either the serum or synovial fluid concentration of any one individual cytokine, the synovial fluid concentrations of amphiregulin and/or IL-6 in combination with body weight provided a model that could explain a proportion of the ΔEQ5D response. The lack of a strong relationship between any one individual cytokine and ΔEQ5D suggests that a highly accurate and predictive model is most likely to be developed through the combination of multiple biomarkers, including anthropometric data. Furthermore, our data would suggest that the pre-operative concentration of cytokines in the joint synovial fluid will provide better predictive biomarkers than serum cytokine concentrations.
This study has some limitations. Firstly, expansion of the panel of 24 cytokines/adipokines included in our study would provide a more comprehensive cytokine profile related to mediating pain, which could be informative. Secondly, this study represents a relatively small cohort of 160 number of hip and knee OA patients and therefore requires validation in a larger cohort. However, the observed difference we report in the proportion of positive outcomes between knee and hip joint replacements has been reported previously [25-27] and thus suggests that the dataset is representative of larger dataset studies. Finally, the absence of post-operative levels of cytokine and adipokines means that we cannot determine the impact of post-operative cytokines on outcome.
5. Conclusions
In conclusion, a predictive model combining the synovia fluid concentrations of the cytokines amphiregulin and IL-6 with body weight pre-operatively could explain a proportion of the post-operative change in EQ5Dindex health status. Further analysis of pre-operative markers and validation across a larger patient cohort is required in order to develop a highly accurate and predictive model that could have utility for both clinicians and their patients.
Author Contributions
Conceptualization, S.W.J. and E.T.D.; methodology, D.E.N, E.T.D, and S.W.J; formal analysis, D.E.N, and S.W.J.; investigation, D.E.N, E.T.D and S.W.J.; resources, S.W.J and E.T.D.; data curation, S.W.J, D.E.N and E.T.D.; writing—original draft preparation, D.E.N.; writing—review and editing, S.W.J.; supervision, S.W.J.; funding acquisition, S.W.J. All authors have read and agreed to the published version of the manuscript.
Funding
This research was funded by Medical Research Council, grant number MR/W026961/1 and Versus Arthritis, grant number 21530.
Institutional Review Board Statement
Ethics approval was provided by the UK National Research Ethics Committee (NRES 14/ES/1044), and informed consent was obtained from all patients.
Informed Consent Statement
Informed consent was obtained from all subjects involved in the study.
Data Availability Statement
Data reported in the study are available upon request to the corresponding author.
Acknowledgments
We gratefully acknowledge all the patients who agreed to take part in this study and the research nurses who helped co-ordinate this study at the Royal Orthopaedic Hospital and Russell Hall Hospital in Birmingham, England.
Conflicts of Interest
The authors declare funding from The Medical research Council and Versus Arthritis. The funders had no role in the design of the study; in the collection, analyses, or interpretation of data; in the writing of the manuscript; or in the decision to publish the results.
References
- Matharu, G. S.; Culliford, D. J.; Blom, A. W.; Judge, A. , Projections for primary hip and knee replacement surgery up to the year 2060: an analysis based on data from The National Joint Registry for England, Wales, Northern Ireland and the Isle of Man. Ann R Coll Surg Engl 2022, 104, 443–448. [Google Scholar] [CrossRef] [PubMed]
- Verhaar, J. , Patient satisfaction after total knee replacement-still a challenge. Acta Orthop 2020, 91, 241–242. [Google Scholar] [CrossRef] [PubMed]
- Kahlenberg, C. A.; Nwachukwu, B. U.; McLawhorn, A. S.; Cross, M. B.; Cornell, C. N.; Padgett, D. E. , Patient Satisfaction After Total Knee Replacement: A Systematic Review. HSS J 2018, 14, 192–201. [Google Scholar] [CrossRef] [PubMed]
- Thudium, C. S.; Lofvall, H.; Karsdal, M. A.; Bay-Jensen, A. C.; Bihlet, A. R. , Protein biomarkers associated with pain mechanisms in osteoarthritis. J Proteomics 2019, 190, 55–66. [Google Scholar] [CrossRef] [PubMed]
- Bas, S.; Finckh, A.; Puskas, G. J.; Suva, D.; Hoffmeyer, P.; Gabay, C.; Lubbeke, A. , Adipokines correlate with pain in lower limb osteoarthritis: different associations in hip and knee. Int Orthop 2014, 38, 2577–2583. [Google Scholar] [CrossRef]
- Miller, R. E.; Miller, R. J.; Malfait, A. M. , Osteoarthritis joint pain: the cytokine connection. Cytokine 2014, 70, 185–193. [Google Scholar] [CrossRef] [PubMed]
- Orita, S.; Koshi, T.; Mitsuka, T.; Miyagi, M.; Inoue, G.; Arai, G.; Ishikawa, T.; Hanaoka, E.; Yamashita, K.; Yamashita, M.; Eguchi, Y.; Toyone, T.; Takahashi, K.; Ohtori, S. , Associations between proinflammatory cytokines in the synovial fluid and radiographic grading and pain-related scores in 47 consecutive patients with osteoarthritis of the knee. BMC Musculoskelet Disord 2011, 12, 144. [Google Scholar] [CrossRef] [PubMed]
- de Lange-Brokaar, B. J.; Ioan-Facsinay, A.; Yusuf, E.; Visser, A. W.; Kroon, H. M.; van Osch, G. J.; Zuurmond, A. M.; Stojanovic-Susulic, V.; Bloem, J. L.; Nelissen, R. G.; Huizinga, T. W.; Kloppenburg, M. , Association of pain in knee osteoarthritis with distinct patterns of synovitis. Arthritis Rheumatol 2015, 67, 733–740. [Google Scholar] [CrossRef]
- Nanus, D. E.; Badoume, A.; Wijesinghe, S. N.; Halsey, A. M.; Hurley, P.; Ahmed, Z.; Botchu, R.; Davis, E. T.; Lindsay, M. A.; Jones, S. W. , Synovial tissue from sites of joint pain in knee osteoarthritis patients exhibits a differential phenotype with distinct fibroblast subsets. EBioMedicine 2021, 72, 103618. [Google Scholar] [CrossRef]
- Gandhi, R.; Santone, D.; Takahashi, M.; Dessouki, O.; Mahomed, N. N. , Inflammatory predictors of ongoing pain 2 years following knee replacement surgery. Knee 2013, 20, 316–318. [Google Scholar] [CrossRef]
- Hall, G. M.; Peerbhoy, D.; Shenkin, A.; Parker, C. J.; Salmon, P. , Hip and knee arthroplasty: a comparison and the endocrine, metabolic and inflammatory responses. Clin Sci (Lond) 2000, 98, 71–79. [Google Scholar] [CrossRef] [PubMed]
- Wailoo, A.; Hernandez Alava, M.; Escobar Martinez, A. , Modelling the relationship between the WOMAC Osteoarthritis Index and EQ-5D. Health Qual Life Outcomes 2014, 12, 37. [Google Scholar] [CrossRef] [PubMed]
- Jayadev, C.; Rout, R.; Price, A.; Hulley, P.; Mahoney, D. , Hyaluronidase treatment of synovial fluid to improve assay precision for biomarker research using multiplex immunoassay platforms. J Immunol Methods 2012, 386, 22–30. [Google Scholar] [CrossRef] [PubMed]
- Nanus, D. E.; Wijesinghe, S. N.; Pearson, M. J.; Hadjicharalambous, M. R.; Rosser, A.; Davis, E. T.; Lindsay, M. A.; Jones, S. W. , Regulation of the Inflammatory Synovial Fibroblast Phenotype by Metastasis-Associated Lung Adenocarcinoma Transcript 1 Long Noncoding RNA in Obese Patients With Osteoarthritis. Arthritis Rheumatol 2020, 72, 609–619. [Google Scholar] [CrossRef] [PubMed]
- Pearson, M. J.; Herndler-Brandstetter, D.; Tariq, M. A.; Nicholson, T. A.; Philp, A. M.; Smith, H. L.; Davis, E. T.; Jones, S. W.; Lord, J. M. , IL-6 secretion in osteoarthritis patients is mediated by chondrocyte-synovial fibroblast cross-talk and is enhanced by obesity. Sci Rep 2017, 7, 3451. [Google Scholar] [CrossRef] [PubMed]
- Sohn, D. H.; Sokolove, J.; Sharpe, O.; Erhart, J. C.; Chandra, P. E.; Lahey, L. J.; Lindstrom, T. M.; Hwang, I.; Boyer, K. A.; Andriacchi, T. P.; Robinson, W. H. , Plasma proteins present in osteoarthritic synovial fluid can stimulate cytokine production via Toll-like receptor 4. Arthritis Res Ther 2012, 14, R7. [Google Scholar] [CrossRef] [PubMed]
- Cicuttini, F. M.; Baker, J. R.; Spector, T. D. , The association of obesity with osteoarthritis of the hand and knee in women: a twin study. J Rheumatol 1996, 23, 1221–1226. [Google Scholar]
- Holliday, K. L.; McWilliams, D. F.; Maciewicz, R. A.; Muir, K. R.; Zhang, W.; Doherty, M. , Lifetime body mass index, other anthropometric measures of obesity and risk of knee or hip osteoarthritis in the GOAL case-control study. Osteoarthritis Cartilage 2011, 19, 37–43. [Google Scholar] [CrossRef]
- Wijesinghe, S. N.; Badoume, A.; Nanus, D. E.; Sharma-Oates, A.; Farah, H.; Certo, M.; Alnajjar, F.; Davis, E. T.; Mauro, C.; Lindsay, M. A.; Jones, S. W. , Obesity defined molecular endotypes in the synovium of patients with osteoarthritis provides a rationale for therapeutic targeting of fibroblast subsets. Clin Transl Med 2023, 13, e1232. [Google Scholar] [CrossRef]
- Philp, A. M.; Butterworth, S.; Davis, E. T.; Jones, S. W. , eNAMPT Is Localised to Areas of Cartilage Damage in Patients with Hip Osteoarthritis and Promotes Cartilage Catabolism and Inflammation. Int J Mol Sci 2021, 22. [Google Scholar] [CrossRef]
- Philp, A. M.; Collier, R. L.; Grover, L. M.; Davis, E. T.; Jones, S. W. , Resistin promotes the abnormal Type I collagen phenotype of subchondral bone in obese patients with end stage hip osteoarthritis. Sci Rep 2017, 7, 4042. [Google Scholar] [CrossRef] [PubMed]
- Nicholson, T.; Church, C.; Tsintzas, K.; Jones, R.; Breen, L.; Davis, E. T.; Baker, D. J.; Jones, S. W. , Vaspin promotes insulin sensitivity of elderly muscle and is upregulated in obesity. J Endocrinol 2019. [Google Scholar] [CrossRef] [PubMed]
- Wilhelmsen, A.; Tsintzas, K.; Jones, S. W. , Recent advances and future avenues in understanding the role of adipose tissue cross talk in mediating skeletal muscle mass and function with ageing. Geroscience 2021, 43, 85–110. [Google Scholar] [CrossRef] [PubMed]
- Pozzobon, D.; Ferreira, P. H.; Blyth, F. M.; Machado, G. C.; Ferreira, M. L. , Can obesity and physical activity predict outcomes of elective knee or hip surgery due to osteoarthritis? A meta-analysis of cohort studies. BMJ Open 2018, 8, e017689. [Google Scholar] [CrossRef] [PubMed]
- Bachmeier, C. J.; March, L. M.; Cross, M. J.; Lapsley, H. M.; Tribe, K. L.; Courtenay, B. G.; Brooks, P. M.; Arthritis, C.; Outcome Project, G. , A comparison of outcomes in osteoarthritis patients undergoing total hip and knee replacement surgery. Osteoarthritis Cartilage 2001, 9, 137–146. [Google Scholar] [CrossRef] [PubMed]
- O'Brien, S.; Bennett, D.; Doran, E.; Beverland, D. E. , Comparison of hip and knee arthroplasty outcomes at early and intermediate follow-up. Orthopedics 2009, 32, 168. [Google Scholar]
- Choi, J. K.; Geller, J. A.; Yoon, R. S.; Wang, W.; Macaulay, W. , Comparison of total hip and knee arthroplasty cohorts and short-term outcomes from a single-center joint registry. J Arthroplasty 2012, 27, 837–841. [Google Scholar] [CrossRef]
Figure 1.
Responders and non-responders defined by change in EQ5D index between pre-operative and 7-month post-operative. (a) responder patients, (b) non-responder patients. ***=significantly different between pre and post joint replacement surgery, p<0.001.
Figure 1.
Responders and non-responders defined by change in EQ5D index between pre-operative and 7-month post-operative. (a) responder patients, (b) non-responder patients. ***=significantly different between pre and post joint replacement surgery, p<0.001.
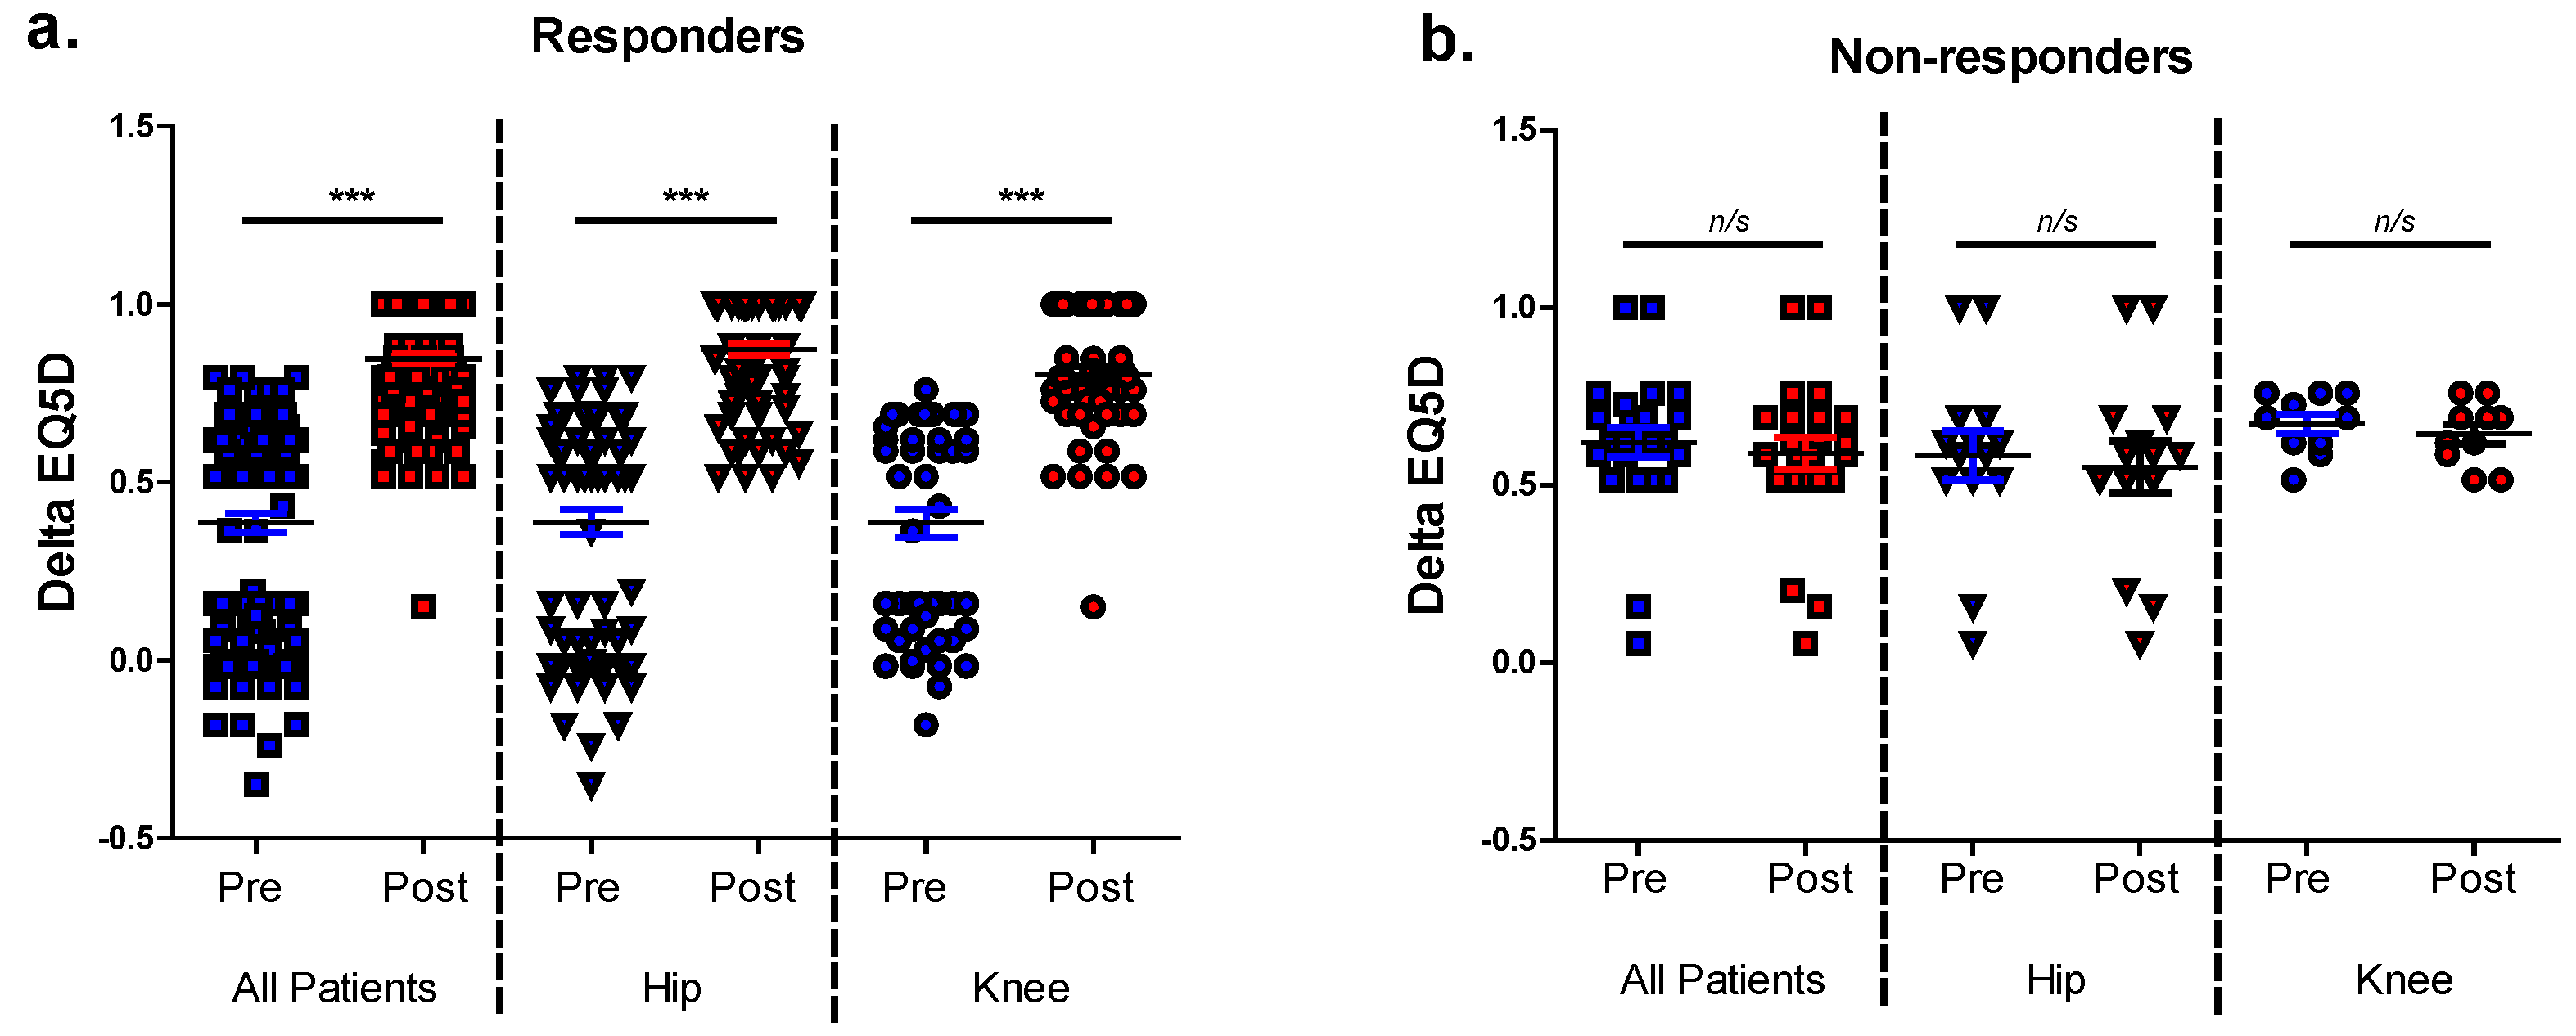

Table 1.
The comparison of post-operative outcomes between knee and hip joint replacement surgery. Data are represented as percentage and number of patients (% (n)) with positive response, negative response and no change between pre-operative scores and post-operative scores.
Table 1.
The comparison of post-operative outcomes between knee and hip joint replacement surgery. Data are represented as percentage and number of patients (% (n)) with positive response, negative response and no change between pre-operative scores and post-operative scores.
| All Joints | Hips | Knees | |
|---|---|---|---|
| EQ5Di | |||
| Responders | 87% (139) | 89% (86) | 84% (53) |
| Non-responders | 13% (21) | 11% (11) | 16% (10) |
| Pain/discomfort | |||
| Responders | 72% (123) | 77% (81) | 63% (42) |
| Non-responders | 28% (49) | 23% (24) | 37% (25) |
Table 2.
Pre and post-operative EQ5D index. EQ-5D index was assessed across 5 different components-mobility, self-care, usual activities, pain/discomfort and anxiety/depression, scored across 3 levels, namely L1 (no problem, L2 (some problem) and L3 (severe problem). Data is represented as % and number of patients (% (n)) for each component and each level of EQ5D.
| Mobility | Self -Care | Usual Activities | Pain/Discomfort | Anxiety/Depression | ||||||
|---|---|---|---|---|---|---|---|---|---|---|
| Pre | Post | Pre | Post | Pre | Post | Pre | Post | Pre | Post | |
| Non-responders | ||||||||||
| All | ||||||||||
| L1 | 19%(14) | 18%(13) | 80%(91) | 75%(86) | 17%(12) | 13%(9) | 4%(2) | 4%(2) | 80%(95) | 77%(92) |
| L2 | 81%(60) | 82%(61) | 20%(23) | 24%(27) | 80%(57) | 83%(59) | 89%(41) | 89%(41) | 19%(23) | 22%(26) |
| L3 | 0%(0) | 0%(0) | 0%(0) | 1%(1) | 3%(2) | 4%(3) | 7(3) | 7(3) | 1%(1) | 1%(1) |
| Hips | ||||||||||
| L1 | 23%(9) | 23%(9) | 75%(45) | 70%(42) | 23%(9) | 21%(8) | 10%(2) | 10%(2) | 79%(54) | 79%(53) |
| L2 | 78%(31) | 78%(31) | 25%(15) | 30%(18) | 74%(29) | 74%(29) | 76%(16) | 76%(16) | 19%(13) | 21%(14) |
| L3 | 0%(0) | 0%(0) | 0%(0) | 0%(0) | 3%(1) | 5%(2) | 14%(3) | 14%(3) | 2%(1) | 2%(1) |
| Knees | ||||||||||
| L1 | 15%(5) | 12%(4) | 85%(46) | 82%(44) | 9%(3) | 3%(1) | 0%(0) | 0%(0) | 80%(41) | 77%(39) |
| L2 | 85%(29) | 88%(30) | 15%(8) | 17%(9) | 88%(28) | 94%(30) | 100%(25) | 100%(25) | 20%(10) | 24%(12) |
| L3 | 0%(0) | 0%(0) | 0%(0) | 2%(1) | 3%(1) | 3%(1) | 0%(0) | 0%(0) | 0%(0) | 0%(0) |
| Responders | ||||||||||
| All | ||||||||||
| L1 | 0%(0) | 100%(91) | 0%(0) | 96%(48) | 0%(0) | 90%(86) | 0%(0) | 76%(93) | 0%(0) | 92%(44) |
| L2 | 100%(91) | 0%(0) | 96%(48) | 4%(2) | 87%(83) | 10%(100 | 54%(66) | 24%(30) | 88(42) | 8%(4) |
| L3 | 0%(0) | 0%(0) | 4%(2) | 0%(0) | 14%(13) | 0%(0) | 46%(57) | 0%(0) | 13%(6) | 0%(0) |
| Hips | ||||||||||
| L1 | 0%(0) | 100%(59) | 0%(0) | 95%(37) | 0%(0) | 89%(55) | 0%(0) | 85%(69) | 0%(0) | 91%(30) |
| L2 | 100%(59) | 0%(0) | 95%(37) | 5%(2) | 86%(53) | 11%(7) | 61%(49) | 15%(12) | 85%(28) | 9%(3) |
| L3 | 0%(0) | 0%(0) | 5%(2) | 0%(0) | 15%(9) | 0%(0) | 40%(32) | 0%(0) | 15%(5) | 0%(0) |
| Knees | ||||||||||
| L1 | 0%(0) | 100%(32) | 0%(0) | 100%(11) | 0%(0) | 91%(31) | 0%(0) | 57%(24) | 0%(0) | 93%(14) |
| L2 | 100%(32) | 0%(0) | 100%(11) | 0%(0) | 88%(30) | 9%(3) | 41%(17) | 43%(18) | 93%(14) | 7%(1) |
| L3 | 0%(0) | 0%(0) | 0%(0) | 0%(0) | 12%(4) | 0%(0) | 60%(25) | 0%(0) | 7%(1) | 0%(0) |
Table 3.
Baseline patient characteristics between EQ5Dindex responders and non-responders. All values are shown as median with IQR. ^=significantly different between responders and non-responders, p<0.05.
Table 3.
Baseline patient characteristics between EQ5Dindex responders and non-responders. All values are shown as median with IQR. ^=significantly different between responders and non-responders, p<0.05.
| All Patients | Responders | Non-responders | ||||
|---|---|---|---|---|---|---|
| Age (years) | 70 (62,75) | 70 (62, 75) | 72.5 (63.5, 76.5) | |||
| Height (cm) | 166 (160, 175) | 167 (160, 175) | 163 (160, 173) | |||
| Weight (kg) | 75.7 (67.4, 91.7) | 75.3 (66, 89.9) | 81.4 (73, 93.7) | |||
| BMI (kg/m2) | 27.3 (24.8, 30.7) | 26.8 (24.6, 30,4) | 29.9 (27.5, 33.6)* | |||
| WC (cm) | 96.3 (85.3, 107 ) | 96 (84, 105) | 108 (91, 112)* | |||
| HC (cm) | 107 (99, 113) | 106 (99, 112) | 113 (104, 121)* | |||
| WHR | 0.91 (0.84, 0.96) | 0.91 (0.84, 0.95) | 0.92 (0.88, 0.98) | |||
| Joint Space (mm) | 0 (0,1) | 0 (0, 1) | 0 (0, 3.3) | |||
| KL Grade | 4 (3, 4) | 4 (3, 4) | 4 (2.8, 4) | |||
| Serum | Synovial Fluid | Serum | Synovial Fluid | Serum | Synovial Fluid | |
| TNFα (pg/ml) | 5.1 (4.2, 5.6) | 5.1 (2.8, 9.5) | 5.1 (4.2, 5.6) | 5.1 (2.8, 9.5) | 5.2 (4, 5.6) | 5.1 (1.4, 14.0) |
| Visfatin (ng/ml) | 2.6 (1.8, 3.3) | 0 (0, 32) | 2.6 (1.8, 3.3) | 0 (0, 36) | 2.6 (1.8, 3.3) | 0 (0, 0) |
| IL10 (pg/ml) | 4.81 (4.46, 4.99) | 17.3 (12.2, 22.6) | 4.8 (4.46,4.99) | 17.3 (11.5, 21.6) | 4.7 (4.46, 5.05) | 21.6 (16.1, 31.3) |
| IL1B (pg/ml) | 15.9 (13.7, 17.8) | 25.1 (9.6, 31.6) | 15.9 (13.3, 17.8) | 28.4 (9.0, 31.6) | 16.1 (14.5, 18.2) | 16.3 (7.2, 36.3) |
| DKK1 (ng/ml) | 3.3 (2.3, 4.7) | 0.50 (0.35, 0.71) | 3.3 (2.3, 4.7) | 0.48 (0.35, 0.72) | 3.6 (2.2, 4.7) | 0.53 (0.41, 0.84) |
| MIP1α (ng/ml) | 0.42 (0.03, 0.54) | 0.34 (0.24, 0.39) | 0.42 (0.03, 0.53) | 0.34 (0.24, 0.39) | 0.46 (0.02, 0.60) | 0.43 (0.16, 0.46) |
| gal1 (ng/ml) | 43.9 (31.1, 58.0) | 110 (87, 126) | 40.7 (29.9, 57.7) | 109 (86, 127) | 53.4 (43.2, 67.8) | 111 (90, 125) |
| Chemerin (ng/ml) | 5.6 (3.4, 7.9) | 3.0 (2.4, 3.6) | 5.6 (3.5, 8.0) | 3.0 (2.4, 3.6) | 4.8 (2.7, 6.8) | 3.3 (3.1, 4.0) |
| Eotaxin (pg/ml) | 125 (61, 228) | 28.9 (9.5, 42.6) | 125 (62, 228) | 28.9 (9.5, 42.6) | 82 (61, 214) | 28.9 (9.5, 42.6) |
| gp130 (ng/ml) | 93 (69, 105) | 71.4 (61.6 76.8) | 93 (69, 104) | 71.4 (61.5, 77.2) | 102 (56, 108) | 67.6 (58.9, 76.8) |
| ip10 (pg/ml) | 23.4 (18.4, 32.4) | 104.4 (70.7, 151.4 | 23.9 (18.4, 36.7) | 106.3 (70.4, 152.9) | 22.8 (17.4, 26.6) | 98.9 (73.2, 265.1) |
| MCP1 (ng/ml) | 0.35 (0.25, 0.46) | 0.30 (0.15, 0.61) | 0.35 (0.25, 0.47) | 0.29 (0.15, 0.64) | 0.35 (0.27, 0.41) | 0.30 (0.18, 0.42) |
| IL7 (pg/ml) | 2.7 (1.8, 3.9) | 4.0 (2.8, 5.2) | 2.7 (1.8, 3.4) | 4.0 (2.8, 5.2) | 2.9 (2.2, 4.4) | 4.6 (4.0, 6.3) |
| MIP3α (pg/ml) | 34.4 (8.8, 59.9) | 22.7 (13.1, 42.6) | 33.5 (8.8, 54.7) | 22.9 (13.8, 43.7) | 62.8 (7.1, 71.2) | 9.4 (7.3, 42.1) |
| Amphiregulin (ng/ml) | 0.59 (0.59, 0.59) | 1.36 (0.55, 1.36) | 0.59 (0.48, 0.59) | 1.36 (0.55, 1.36) | 0.59 (0.59, 0.59) | 1.36 (0.78, 1.65) |
| IL15 (pg/ml) | 4.0 (3.0, 4.7) | 31.1 (20.9, 35.2) | 4.0 (3.0, 4.9) | 31.1 (18.8, 34.9) | 3.4 (3.1, 3.8) | 34.9 (27.0, 37.3) |
| Aggrecan (pg/ml) | 163 (116, 217) | 0 (0, 114) | 163 (116, 217) | 0 (0, 114) | 116 (116, 204) | 0 (0, 244) |
| Resistin (ng/ml) | 14.5 (11.2, 18.3) | 2.90 (1.72, 5.19) | 14.5 (11.2, 19.0) | 2.96 (1.99, 5.70) | 14.9 (8.7, 16.2) | 0.97 (0.53, 2.65)* |
| Serpin E1 (ng/ml) | 135 (100, 167) | 15.6 (8.5, 42.7) | 137 (105, 167) | 16.2 (8.4, 49.4) | 113 (19, 165) | 11.0 (6.6, 18.3) |
| Adiponectin(ug/ml) | 9.9 (6.34, 13.5) | 2.7 (2.0, 4.6) | 9.9 (6.8, 14.2) | 2.8 (2.0, 5.3) | 8.5 (1.4, 11.5) | 2.5 (1.6, 3.2) |
| IL6 (pg/ml) | 2.1 (0.0, 2.7) | 132 (57, 453) | 2.1 (0, 2.8) | 175 (64, 577) | 0 (0, 2.0) | 69 (8, 222) |
| Leptin (ng/ml) | 13.1 (6.7, 26.1) | 17.3 (7.1, 54.6) | 12.6 (6.3, 26.1) | 16.3 (6.5, 48.1) | 23.3 (12.7, 27.6) | 54.5 (40.3, 67.9)* |
| FABP4 (ng/ml) | 18.0 (12.6, 28.2) | 16.7 (8.2, 81.4) | 17.9 (11.8, 27.2) | 16.1 (7.7, 66.0) | 18.8 (15.6, 41.0) | 60.1 (11.7, 159.6) |
| MIP1β (ng/ml) | 152 (105, 184) | 55.9 (0, 105.3) | 150 (101, 187) | 55.9 (0, 105.3) | 128 (85, 165) | 0 (0, 80.6) |
Table 4.
The relationship between anthropometric data and ΔEQ5D (pre and 7 month post-operatively)*.
Table 4.
The relationship between anthropometric data and ΔEQ5D (pre and 7 month post-operatively)*.
| Linear regression coefficient (95% CI) † | r | p-value | |
|---|---|---|---|
| AGE | -0.003 (-0.012, 0.006) | 0.065 | 0.564 |
| Height (cm) | -0.005 (-0.013, 0.003) | 0.137 | 0.228 |
| Weight (kg) | -0.005 (-0.009, -0.00002) | 0.222 | 0.049 |
| BMI | -0.012 (-0.026, 0.003) | 0.181 | 0.108 |
| Waist circumference (cm) | -0.003 (-0.007, 0.0007) | 0.193 | 0.104 |
| Hip circumference (cm) | -0.003 (-0.007, 0.002) | 0.145 | 0.225 |
| WHR | -0.456 (-1.35, 0.440) | 0.121 | 0.313 |
| Joint Space (mm) | -0.023 (-0.075, 0.029) | 0.103 | 0.376 |
| K and L grade | 0.015 (-0.077, 0.106) | 0.037 | 0.751 |
*95% CI=95% confidence interval. † Change in EQ5D per unit increase in parameter.
Table 5.
Relationship between pre-operative serum cytokines and ΔEQ5D (pre and 7 month post-operatively)*.
Table 5.
Relationship between pre-operative serum cytokines and ΔEQ5D (pre and 7 month post-operatively)*.
| Linear regression coefficient (95% CI)† | r | p-value | Multiple Linear regression coefficient (95% CI) ‡ | r | p-value | |
|---|---|---|---|---|---|---|
| TNF-α | -0.006 (-0.04, 0.028) | 0.046 | 0.715 | -0.004 (-0.054, 0.046) | 0.293 | 0.872 |
| Visfatin | 0.001 (-0.006, 0.07) | 0.023 | 0.856 | 0.001 (-0.007, 0.008) | 0.291 | 0.836 |
| IL-10 | -0.0003 (-0.005, 0.005) | 0.013 | 0.92 | -0.001 (-0.006, 0.005) | 0.291 | 0.824 |
| IL-1β | 0.002 (-0.001, 0.006) | 0.174 | 0.165 | 0.003 (-0.001, 0.007) | 0.346 | 0.175 |
| DKK1 | -0.024 (-0.065, 0.017) | 0.147 | 0.243 | -0.031 (-0.082, 0.021) | 0.344 | 0.239 |
| MIP1α | 0.042 (-0.223, 0.306) | 0.04 | 0.754 | 0.014 (-0.307, 0.336) | 0.292 | 0.928 |
| Galectin1 | -0.0008 (-0.003, 0.001) | 0.097 | 0.442 | -0.0001 (-0.003, 0.002) | 0.292 | 0.932 |
| Chemerin | -0.006 (-0.026, 0.013) | 0.079 | 0.531 | -0.007 (-0.032, 0.018) | 0.301 | 0.586 |
| Eotaxin | 0.00014 (-0.00028, 0.00055 ) | 0.082 | 0.519 | 0.00013 (-0.001, 0.001) | 0.284 | 0.968 |
| gp130 | -0.0014 (-0.004, 0.001) | 0.170 | 0.175 | -0.002 (-0.004, 0.001) | 0.336 | 0.230 |
| IP10 | 0.00046 (-0.003, 0.004) | 0.034 | 0.786 | 0.001 (-0.003, 0.005) | 0.297 | 0.679 |
| MCP1 | 0.004 (-0.059, 0.067) | 0.017 | 0.895 | 0.028 (-0.049, 0.104) | 0.308 | 0.472 |
| IL-7 | -0.018 (-0.076, 0.04) | 0.079 | 0.531 | -0.007 (-0.092, 0.078) | 0.293 | 0.872 |
| MIP3α | 6.8x10⁻⁶ (-0.00013, 0.00014) | 0.013 | 0.919 | 6.02x10⁻⁶ (-0.00016, 0.00014) | 0.292 | 0.936 |
| Amphiregulin | 0.091 (-0.340, 0.522) | 0.054 | 0.674 | 0.240 (-0.301, 0.780) | 0.315 | 0.377 |
| IL-15 | 0.002 (-0.012, 0.016) | 0.034 | 0.788 | 0.001 (-0.016, 0.018) | 0.290 | 0.920 |
| Aggrecan | 7.5x10⁻⁵ (-0.00014, 0.00029) | 0.088 | 0.487 | 0.0004 (-0.0001, 0.001) | 0.365 | 0.106 |
| Resistin | 0.007 (-0.001, 0.016) | 0.219 | 0.085 | 0.006 (-0.005, 0.016) | 0.329 | 0.288 |
| Serpin E1 | 0.0005 (-0.0006, 0.0016) | 0.110 | 0.383 | 0.001 (-0.001, 0.002) | 0.318 | 0.361 |
| Adiponectin | 0.008 (-0.004, 0.020) | 0.165 | 0.193 | 0.006 (-0.01, 0.022) | 0.310 | 0.467 |
| IL-6 | 1.9x10⁻⁵ (-0.001, 0.009) | 0.005 | 0.970 | -8.3x10⁻⁵ (-0.001, 0.001) | 0.293 | 0.881 |
| Leptin | 0.00019 (-0.004, 0.004) | 0.012 | 0.925 | 0.00014 (-0.007, 0.007) | 0.279 | 0.967 |
| FABP4 | 0.001 (-0.001, 0.004) | 0.145 | 0.252 | 0.001 (-0.002, 0.004) | 0.308 | 0.494 |
| MIP1β | 0.0006 (-0.0004, 0.0016) | 0.209 | 0.102 | 0.001 (-0.001, 0.002) | 0.312 | 0.430 |
*95% CI=95% confidence interval. † Change in EQ5D per unit increase in cytokine. ‡ Change in EQ5D per unit increase in cytokine including age, body mass index, Kellgren/Lawrence grade, joint space, waist and hip circumference, waist:hip ratio and body weight in the regression equation.
Table 6.
Relationship between pre-operative synovial fluid cytokines and ΔEQ5D (pre and 7 month post-operatively)*.
Table 6.
Relationship between pre-operative synovial fluid cytokines and ΔEQ5D (pre and 7 month post-operatively)*.
| Linear regression coefficient (95% CI)† | r | p-value | Multiple Linear regression coefficient (95% CI) ‡ | r | p-value | |
|---|---|---|---|---|---|---|
| TNF-α | 0.001 (-0.018, 0.020) | 0.016 | 0.921 | 0.008 (-0.022, 0.037) | 0.544 | 0.584 |
| Visfatin | 0.001 (-0.001, 0.003) | 0.195 | 0.222 | 0.001 (-0.001, 0.004) | 0.560 | 0.352 |
| IL-10 | -0.0004 (-0.010, 0.009) | 0.012 | 0.940 | -0.001 (-0.016, 0.013) | 0.537 | 0.843 |
| IL-1β | 0.0005 (-0.006, 0.007) | 0.024 | 0.881 | 0.002 (-0.006, 0.011) | 0.544 | 0.589 |
| DKK1 | -0.073 (-0.225, 0.08) | 0.153 | 0.339 | -0.120 (-0.543, 0.302) | 0.545 | 0.562 |
| MIP1α | -0.284 (-0.882, 0.313) | 0.152 | 0.342 | -0.633 (-0.155, 0.283) | 0.587 | 0.166 |
| Galectin1 | 0.0018 (-0.0019, 0.0056) | 0.156 | 0.329 | 0.0003 (-0.006, 0.005) | 0.536 | 0.906 |
| Chemerin | -0.023 (-0.099, 0.052) | 0.100 | 0.534 | 0.004 (-0.117, 0.126) | 0.536 | 0.940 |
| Eotaxin | -0.0007 (-0.002, 0.001) | 0.146 | 0.362 | -0.001 (-0.002, 0.001) | 0.545 | 0.559 |
| gp130 | -0.001 (-0.008, 0.006) | 0.054 | 0.738 | -0.003 (-0.013, 0.007) | 0.545 | 0.565 |
| IP10 | 0.00013 (-0.0005, 0.0007) | 0.069 | 0.670 | 0.000019 (-0.001, 0.001) | 0.535 | 0.960 |
| MCP1 | 0.026 (-0.052, 0.105) | 0.109 | 0.497 | 0.06 (-0.03, 0.155) | 0.582 | 0.193 |
| IL-7 | -0.033 (-0.093, 0.028) | 0.172 | 0.283 | -0.031 (-0.112, 0.05) | 0.533 | 0.438 |
| MIP3α | 0.002 (-0.002, 0.006) | 0.164 | 0.307 | 0.001 (-0.005, 0.007) | 0.541 | 0.654 |
| Amphiregulin | -0.158 (-0.343, 0.026) | 0.268 | 0.09 | -0.24 (-0.5, 0.021) | 0.619 | 0.07 |
| IL-15 | -0.001 (-0.009, 0.008) | 0.020 | 0.90 | -0.003 (-0.016, 0.010) | 0.543 | 0.615 |
| Aggrecan | -0.0005 (-0.0015, 0.0005) | 0.169 | 0.29 | -0.0004 (-0.002, 0.001) | 0.538 | 0.773 |
| Resistin | 0.0011 (-0.008, 0.010) | 0.041 | 0.801 | -0.002 (-0.016, 0.012) | 0.538 | 0.777 |
| Serpin E1 | 0.0018 (-0.0019, 0.0054) | 0.154 | 0.338 | 0.001 (-0.006, 0.007) | 0.537 | 0.808 |
| Adiponectin | 0.032 (-0.004, 0.069) | 0.274 | 0.083 | 0.022 (-0.055, 0.098) | 0.545 | 0.560 |
| IL-6 | 0.0013 (-0.00001, 0.00028) | 0.288 | 0.072 | 0.0001 (-0.00008, 0.0003) | 0.569 | 0.223 |
| Leptin | 0.0002 (-0.0024, 0.0029) | 0.028 | 0.868 | 0.0002 (-0.006, 0.006) | 0.560 | 0.950 |
| FABP4 | 0.00004 (-0.00009, 0.00018) | 0.104 | 0.521 | -0.001 (-0.003, 0.001) | 0.552 | 0.348 |
| MIP1β | 0.00044 (-0.0012, 0.0021) | 0.089 | 0.585 | -0.001 (-0.003, 0.001) | 0.566 | 0.239 |
*95% CI=95% confidence interval. † Change in EQ5D per unit increase in cytokine. ‡ Change in EQ5D per unit increase in cytokine including age, body mass index, Kellgren/Lawrence grade, joint space, waist and hip circumference, waist:hip ratio and body weight in the regression equation.
Table 7.
Multiple regression models.
| r | p-value | Unstandardized Coefficients (B) | ||||
|---|---|---|---|---|---|---|
| Cytokine | BW | Constant | Equation | |||
| Amph, BW | 0.434 | 0.023 | -0.108 | -0.0006 | 1.052 | ΔEQ5D = -0.108 [Amph ng/ml] -0.0006 [BW kg] + 1.053 |
| IL-6, BW | 0.418 | 0.035 | 7.4x10⁻⁵ | -0.006 | 0.871 | ΔEQ5D = 7.4x10⁻⁵ [IL-6 ng/ml] -0.006 [BW kg] + 0.871 |
| Amph, IL-6, BW | 0.470 | 0.035 | -0.142 (Amph) 8.3x10⁻⁵ (IL-6) |
-0.005 | 0.919 | ΔEQ5D = -0.142 [Amph ng/ml] +8.3x10⁻⁵ [IL-6 ng/ml] -0.005 [BW kg] + 0.919 |
Amph= Amphiregulin, BW=Body weight.
Disclaimer/Publisher’s Note: The statements, opinions and data contained in all publications are solely those of the individual author(s) and contributor(s) and not of MDPI and/or the editor(s). MDPI and/or the editor(s) disclaim responsibility for any injury to people or property resulting from any ideas, methods, instructions or products referred to in the content. |
© 2024 by the authors. Licensee MDPI, Basel, Switzerland. This article is an open access article distributed under the terms and conditions of the Creative Commons Attribution (CC BY) license (http://creativecommons.org/licenses/by/4.0/).
Copyright: This open access article is published under a Creative Commons CC BY 4.0 license, which permit the free download, distribution, and reuse, provided that the author and preprint are cited in any reuse.


