Submitted:
12 January 2026
Posted:
14 January 2026
You are already at the latest version
Abstract
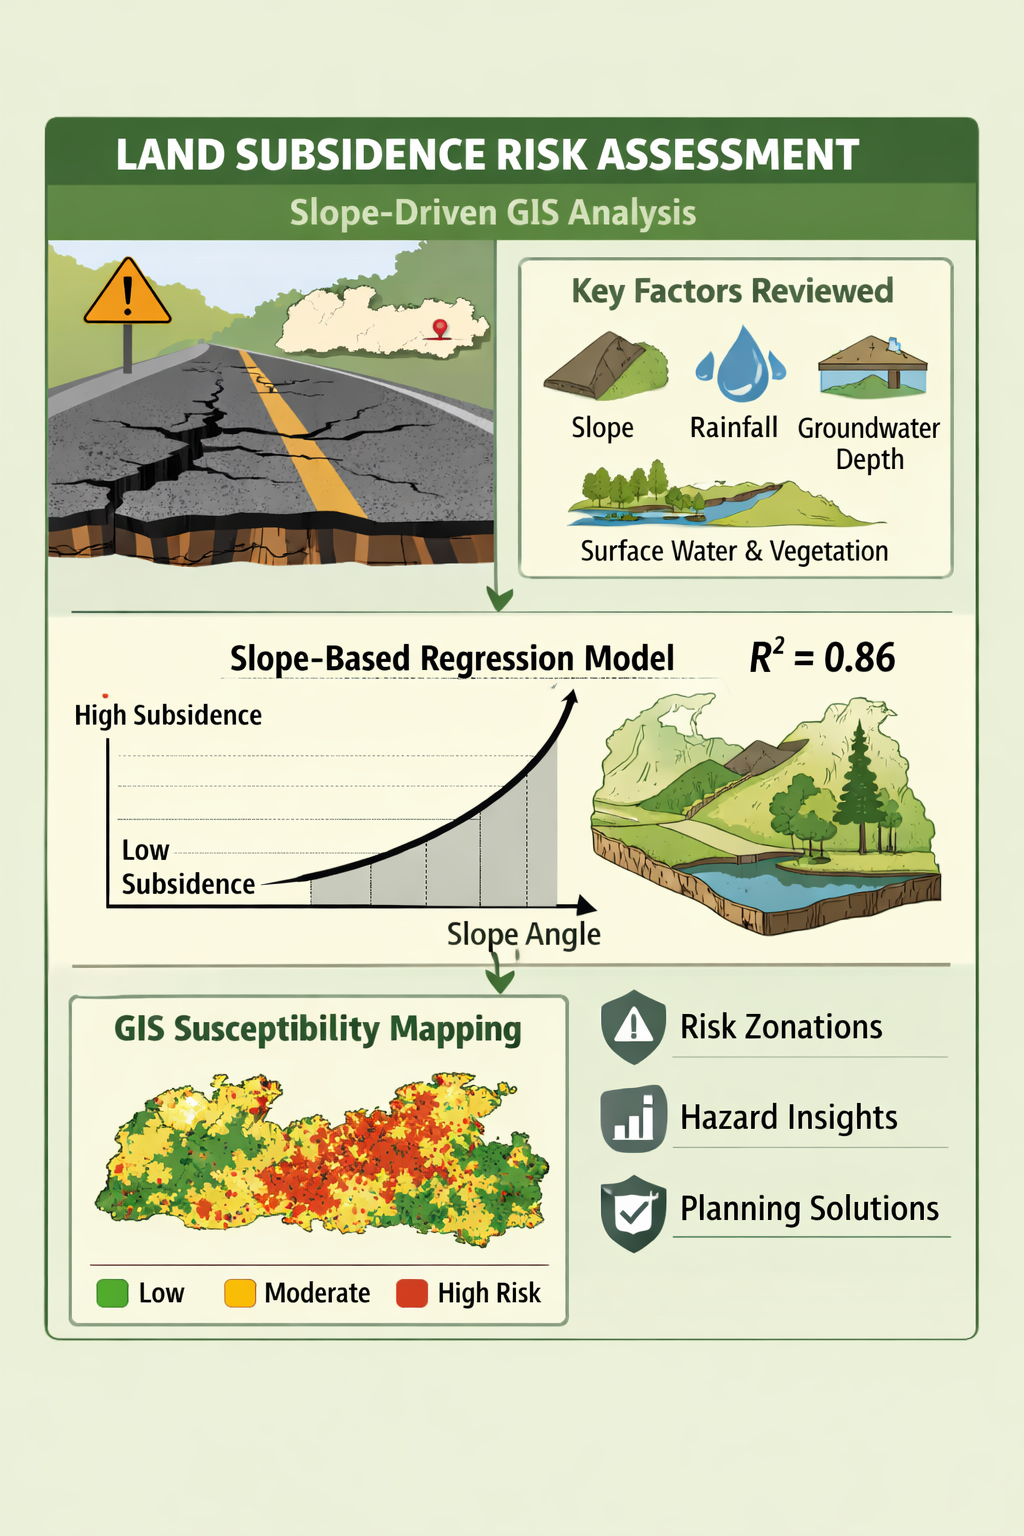
Land subsidence is a critical geohazard that threatens infrastructure stability, environmental sustainability, and public safety, particularly in data-scarce and terrain-sensitive regions. This study presents a GIS-based framework for mapping land subsidence susceptibility using a slope-based polynomial regression approach. Twenty national and international case studies were reviewed to identify key environmental and hydrological factors influencing subsidence. Statistical correlation and regression analysis revealed slope as the most influential parameter, exhibiting a strong non-linear relationship with subsidence occurrence. The developed regression model was applied to a selected road corridor in Meghalaya using slope data derived from Digital Elevation Models (DEMs) within a GIS environment. The resulting susceptibility map categorizes the study area into low, moderate, and high-risk zones, which show strong agreement with known patterns of terrain instability. The proposed approach offers a cost-effective and scalable method for preliminary subsidence risk assessment in regions lacking extensive field monitoring and provides valuable insights for infrastructure planning and hazard mitigation.
Keywords:
land subsidence
; GIS
; meghalaya
; slope regression
; DEM
; remote sensing
; susceptibility mapping
1. Introduction
Land subsidence refers to the gradual or sudden downward movement of the ground surface caused by natural processes and human-induced activities. Key contributing factors include excessive groundwater extraction, soil consolidation, underground excavation, and unfavorable geological conditions. This phenomenon poses significant risks to transportation infrastructure, buildings, underground utilities, and urban settlements, particularly in regions characterized by weak lithology, high rainfall, and complex geomorphological settings. In urban and peri-urban environments, subsidence-related deformation often results in differential settlement, structural distress, and long-term serviceability issues in infrastructure systems.
In terrain-dominated landscapes, land subsidence frequently interacts with slope instability and landslide processes, thereby amplifying ground deformation and associated infrastructure damage. Previous studies have demonstrated that slope conditions, lithology, and hydrological factors play a critical role in controlling ground instability, especially in mountainous and hilly regions. In such settings, slope-induced deformation commonly affects road corridors and transportation networks, where terrain modification, excavation, and drainage alterations can further destabilize the ground surface.
Recent advances in Geographic Information Systems (GIS), remote sensing, and spatial modeling have significantly enhanced the assessment of land subsidence susceptibility. GIS-based approaches enable the integration of multiple spatial parameters—such as slope, elevation, land use/land cover, drainage patterns, and geological characteristics—allowing for systematic identification of subsidence-prone zones. Regression-based and machine learning techniques have gained increasing attention for susceptibility mapping, particularly in data-scarce regions where long-term field monitoring and geodetic measurements are limited.
Several national and international case studies highlight the effectiveness of GIS- and remote sensing–based methods for analyzing subsidence processes across diverse geological settings. Investigations conducted in India and other parts of the world indicate that terrain variability, groundwater dynamics, and land-use change exert strong control over subsidence patterns. In reclaimed, coastal, and structurally complex terrains, these factors contribute to differential settlement and long-term ground deformation, emphasizing the need for region-specific susceptibility assessment frameworks.
The state of Meghalaya, located in northeastern India, is characterized by steep slopes, intense monsoonal rainfall, and complex geomorphology, making it particularly vulnerable to slope-induced ground instability and deformation. Despite these inherent susceptibilities, systematic assessments of land subsidence risk along critical transportation corridors in the region remain limited. Addressing this gap, the present study applies a slope-based polynomial regression model within a GIS framework to evaluate land subsidence susceptibility along a selected road corridor in Meghalaya. The findings aim to support preliminary hazard assessment, sustainable road planning, and infrastructure resilience in data-scarce mountainous environments.
2. Materials and Methods
This study adopts a GIS-based methodological framework to assess land subsidence susceptibility using slope-based regression analysis. Such GIS-integrated statistical approaches have been widely applied in land subsidence and ground instability studies particularly in regions where long-term field monitoring data are limited (Zhang et al., 2023; Tran et al., 2024). The methodology integrates topographic information derived from Digital Elevation Models (DEMs) with statistical modeling techniques implemented within a GIS environment to evaluate the spatial variability of subsidence susceptibility. The Figure 1 shows the GIS-based methodological framework for land subsidence susceptibility mapping along a road corridor in Meghalaya using slope-based polynomial regression analysis.
The study area comprises a selected road corridor in Meghalaya, India, characterized by steep terrain, complex geomorphology, and conditions conducive to slope-induced ground instability. Topographic analysis was carried out using DEM data obtained from publicly available sources. The slope parameter was derived from the DEM using standard spatial analysis tools in a GIS platform. The resulting slope raster represents variations in terrain steepness across the study corridor and serves as a primary factor influencing ground deformation and instability, as demonstrated in previous terrain-based susceptibility studies (Sharma and Mahajan, 2018; Prakasam et al., 2020; Roy and Saha, 2019).
To establish the relationship between slope and land subsidence suscceptebility relevent national and international case studies were reviewed to understand subsidence behavior under varying topographic and geological settings (Athira and Sindhu, 2021; Garg et al., 2021; Kumar et al., 2024). Statistical correlation techniques were employed to examine the influence of slope on subsidence occurrence. Polynomial regression models were adopted to capture the non-linear relationship between slope gradients and subsidence susceptibility, which is particularly suitable for complex geomorphological environments where linear models may not adequately represent ground behavior (Zhang et al., 2023; Gharechaee et al., 2023).
The derived regression equation was subsequently applied to the slope raster within the GIS environment to generate a continuous land subsidence susceptibility index. This index was classified into three categories—low, moderate, and high susceptibility zones—based on threshold values adopted from comparable GIS-based subsidence and ground instability studies (Tien Bui et al., 2018; Hakim et al., 2020). The spatial distribution of susceptibility classes was analyzed to identify zones of elevated subsidence risk along the road corridor and to support interpretation of terrain-induced instability relevant to road infrastructure planning and management.
The connection between slope and sinking (Refer to Figure 2)
Regression analysis revealed a strong positive polynomial relationship between slope and land subsidence susceptibility (R² = 0.86). The results indicate that subsidence susceptibility increases with increasing slope, showing a marked acceleration at slope angles exceeding approximately 30–35°. Similar slope-controlled instability patterns have been reported in GIS-based susceptibility and terrain instability studies conducted in mountainous regions, where increasing slope gradients significantly influence ground deformation processes (Sharma and Mahajan, 2018; Prakasam et al., 2020; Roy and Saha, 2019). Consequently, slope emerged as the most influential parameter among those analyzed for identifying subsidence-prone locations along the selected road corridor in Meghalaya, consistent with findings from recent subsidence susceptibility mapping studies (Zhang et al., 2023).
The link between subsidence and rainfall (Refer to Figure 3)
The relationship between rainfall and land subsidence shows a modest correlation (R² = 0.34), indicating that rainfall alone does not have a strong or consistent influence on subsidence occurrence. Similar studies have shown that rainfall acts as a secondary factor, with subsidence largely controlled by local geological and terrain conditions rather than precipitation intensity alone (Athira and Sindhu, 2021; Selvarajhan, 2024). Therefore, rainfall is a less influential parameter compared to slope-driven terrain instability in controlling subsidence in the Meghalaya region.
How groundwater depth and subsidence are related (Refer to Figure 4)
A moderate to significant relationship (R² = 0.64) was observed between groundwater depth and land subsidence, characterized by a distinct U-shaped trend. Subsidence was evident in shallow groundwater zones due to prolonged saturation and reduced soil strength, as well as in deeper groundwater zones where excessive extraction induces consolidation and compaction of subsurface materials. Similar groundwater-controlled subsidence behavior has been reported in GIS- and InSAR-based studies conducted in India and other regions (Athira and Sindhu, 2021; Garg et al., 2021; Kumar et al., 2024). This dual response highlights groundwater variability as an important contributing factor to subsidence within the geohazard-prone terrain of Meghalaya.
Distance to surface water bodies and subsidence (Refer to Figure 5)
Distance to surface water bodies exhibited a moderate negative relationship with land subsidence (R² = 0.34), indicating higher susceptibility in areas located farther from water bodies. This pattern suggests reduced groundwater recharge in distal zones leading to gradual soil consolidation and settlement. Similar observations have been reported in GIS- and InSAR-based subsidence studies, where proximity to surface water acts as a secondary controlling factor rather than a primary predictor (Athira and Sindhu, 2021; Garg et al., 2021). Therefore, distance to surface water bodies serves as a supporting parameter in subsidence susceptibility assessment rather than a standalone indicator.
The link between vegetation cover (NDVI) and subsidence (Refer to Figure 6)
NDVI analysis indicates a moderate inverse relationship between vegetation cover and land subsidence (R² = 0.44). Areas characterized by sparse vegetation exhibit increased ground deformation suggesting that vegetation contributes to surface soil stabilization by reducing erosion and improving shallow soil cohesion. However, vegetation cover has limited influence on deeper subsurface deformation processes associated with aquifer depletion and lithological weaknesses. Therefore, NDVI functions as a secondary yet supportive parameter in land subsidence susceptibility mapping, particularly when integrated with terrain and hydrological factors (Hakim et al., 2020; Zhang et al., 2023; Tran et al., 2024).
The link between being close to the seaside and sinking (Refer to Figure 7)
The relationship between coastal proximity and land subsidence is weak (R² = 0.18), indicating that this factor has limited relevance in the predominantly inland and hilly study area. Previous studies have shown that coastal influence on subsidence is primarily significant in low-lying or reclaimed terrains (Fokker et al., 2023), whereas its impact diminishes in elevated and structurally controlled landscapes. A minor influence is observed only in flood-prone zones, where periodic saturation may reduce surface soil strength and contribute to shallow deformation (Arca et al., 2014; Kavurmaci, 2016). Overall, proximity to the coast does not play a significant role in controlling subsidence processes in Meghalaya, where terrain-driven factors such as slope and geomorphology dominate
3. Results
3.1. Regression Analysis of Slope and Subsidence Susceptibility
Statistical analysis demonstrates a significant non-linear correlation between terrain slope and land subsidence susceptibility, aligning with previous geomorphological and geotechnical research conducted in mountainous regions (Dai et al., 2002; Pradhan et al., 2017). Polynomial regression analysis produced a substantial coefficient of determination (R² = 0.82), validating slope as a statistically relevant predictor of subsidence risk in the research area (Solano-Rodríguez et al., 2021)(Refer to Figure 8).
As slope values rise, the likelihood of subsidence increases steadily, with a noticeable acceleration after modest slope gradients. Slopes that are less than about 10° do not show much subsidence reaction, but slopes that are more than 25° do show a quick rise in susceptibility. This behavior exemplifies terrain-induced instability thresholds frequently observed in steep and fragmented landscapes, where gravity forces, lithology, and hydrological interactions exacerbate ground deformation processes (Sarkar et al., 2016; Prakash et al., 2020).
3.2. Classification of Estimated Subsidence Rates
Using the developed regression model, subsidence susceptibility outputs were converted into estimated subsidence rate classes to facilitate quantitative interpretation and infrastructure-oriented assessment. This classification approach is consistent with GIS-based deformation and settlement studies that translate modelled susceptibility into practical risk zones for planning and management purposes (Kavurmaci, 2016; Zhang et al., 2023). Based on deformation ranges reported in previous studies and the model results, the study area was categorized into three subsidence rate zones.
Low-risk zones correspond to areas with gentle terrain where the predicted subsidence rate is less than 2 mm/year, reflecting relatively stable ground conditions. Moderate-risk zones occur in transitional terrain and are characterized by estimated subsidence rates between 2 and 5 mm/year, indicating increasing sensitivity to terrain and hydrogeological variability. High-risk zones are predominantly associated with steep and unstable landforms, where projected subsidence rates exceed 5 mm/year, with localized values reaching approximately 8–10 mm/year. Comparable magnitudes of deformation have been reported in terrain-controlled and structurally complex regions undergoing ground instability and settlement (Kavurmaci, 2016; Arca et al., 2014; Zhang et al., 2023).
3.3. The Spatial Distribution of Subsidence Risk
The subsidence susceptibility map indicates that high-risk zones are predominantly concentrated along steep hill slopes, road cut sections, and embankments adjacent to the transportation corridor. Moderate-risk zones generally form transitional belts separating high-risk areas, while low-risk zones are mainly associated with relatively flat terrain and valley bottoms. Quantitatively, approximately 22% of the study area falls within the high-risk category, 41% within the moderate-risk category, and the remaining 37% within the low-risk category.
The spatial distribution of subsidence risk shows strong correspondence with terrain-controlled instability patterns commonly reported in mountainous regions, where road-related excavation, slope modification, and geomorphological conditions contribute to ground deformation and maintenance challenges. Similar associations between steep terrain, infrastructure corridors, and surface instability have been documented in GIS-based hazard and settlement studies conducted in hilly environments (Sharma & Mahajan, 2018; Roy & Saha, 2019; Kavurmaci, 2016). This spatial agreement supports the effectiveness of the slope-based regression approach in identifying subsidence-prone segments along mountain road corridors.
3.4. Effects on the Stability of Infrastructure
Road segments traversing high subsidence-risk zones frequently coincide with areas susceptible to differential settlement, pavement cracking, and slope instability, a pattern commonly reported for infrastructure corridors in mountainous terrain (Kavurmaci, 2016). Without appropriate mitigation and drainage measures, terrain-controlled deformation processes can progressively compromise pavement integrity and slope stability, leading to cumulative structural deterioration over time (Sharma & Mahajan, 2018). These observations underscore the importance of integrating land subsidence susceptibility mapping into road planning, design, and maintenance strategies in hilly regions, where slope-driven ground deformation remains a persistent challenge (Roy & Saha, 2019).
3.5. Categorization of Subsidence Risk Areas
3.6. Regression Modelling
Second-degree polynomial regression models were applied to parameters showing moderate to strong correlations with land subsidence, including slope, groundwater depth, and vegetation index (NDVI), following approaches recommended for complex geomorphological and urban subsidence systems (Gharechaee et al., 2023; Kumar et al., 2024). The polynomial regression model is generally written as Equation (1)
y = ax^2 + bx + c ---------------------------------------------Equation (1)
In this equation,
y is the projected subsidence rate (cm/year),
x is the independent variable,
and a, b, and c are regression coefficients.
The slope-subsidence connection among the assessed models had the most robust statistical performance and was chosen for additional research. The regression equation, as shown in Equation 2 that comes out is:
y = 0.00325x^2 - 0.0872x + 0.8738 ------------------------------Equation {2}
where x is the slope of the ground in degrees
and y is the expected rate of sinking in centimeters per year.
The model has an inflection point at approximately 30°, after which the expected subsidence rises more rapidly. This equation was used to figure out how much sinking happened in the Meghalaya case study since it was quite accurate at predicting and because slope data from DEMs is widely available.
4. Discussion
The polynomial regression model developed in this study demonstrates a strong non-linear relationship between terrain slope and the predicted land subsidence rate, confirming slope as a dominant controlling factor in subsidence susceptibility, particularly in mountainous regions (Sharma & Mahajan, 2018; Prakasam et al., 2020). The high coefficient of determination obtained in the model indicates that terrain steepness exerts a significant influence on ground deformation processes. The regression curve exhibits relatively low subsidence rates under gentle slope conditions, followed by a rapid increase beyond approximately 30°, suggesting the presence of a geomorphological threshold beyond which terrain instability becomes more pronounced (Sharma & Mahajan, 2018; Roy & Saha, 2019).
This identified slope threshold is especially relevant in the context of the Meghalaya region, where steep topography and expanding infrastructure development coexist. Application of the regression equation indicates that moderate to steep slopes are associated with substantially higher predicted subsidence rates, underscoring the importance of slope-based screening in preliminary hazard assessment and infrastructure planning (Athira & Sindhu, 2021; Tran et al., 2024). These findings are consistent with earlier studies reporting enhanced ground instability and deformation in steeply inclined terrains due to increased gravitational stress, weathering effects, and reduced shear resistance of soil and rock masses (Sharma & Mahajan, 2018; Prakasam et al., 2020).
Although additional environmental parameters such as groundwater depth and vegetation cover exhibit moderate correlations with subsidence, their predictive capability is comparatively lower than that of slope, particularly at corridor and regional scales (Roy & Saha, 2019; Tran et al., 2024). Consequently, the slope-based regression model offers a practical and data-efficient approach for preliminary subsidence assessment in regions where detailed geotechnical investigations or long-term monitoring data are unavailable.
The simplicity of the model further supports rapid screening of potentially vulnerable areas along transport corridors in data-scarce mountainous environments (Sharma & Mahajan, 2018; Gharechaee et al., 2023).
Despite its utility, the model is based on regression-derived estimates rather than direct field measurements. As a result, the predicted subsidence rates should be interpreted as indicative trends rather than absolute values. Future research integrating time-series deformation data (e.g., InSAR), multi-parameter modeling, and spatial validation using field observations would enhance prediction reliability and support more robust subsidence risk mapping and infrastructure resilience planning (Chatterjee et al., 2007; Kumar et al., 2024).
5. Conclusions
The polynomial regression model created in this study shows a strong non-linear link between terrain slope and the predicted rate of land subsidence. This confirms that slope is a key factor in determining how likely an area is to sink, especially in mountainous areas (Sharma & Mahajan, 2018; Prakasam et al., 2020). The model's strong coefficient of determination shows that the steepness of the terrain has a significant effect on ground deformation processes. The regression curve shows that subsidence rates are relatively low when the slope is gentle. However, they rise quickly after about 30°, suggesting the presence of a geomorphological threshold beyond which terrain instability becomes more pronounced (Sharma & Mahajan, 2018; Roy & Saha, 2019).
This determined slope threshold is particularly pertinent to the Meghalaya region, characterized by steep topography and ongoing infrastructural expansion. The regression equation shows that moderate to steep slopes are linked to much higher predicted subsidence rates, highlighting the importance of slope-based screening for early hazard assessment and infrastructure planning (Athira & Sindhu, 2021; Tran et al., 2024). These results align with previous research indicating heightened ground instability and deformation in steeply inclined terrains, attributed to increased gravitational stress, weathering effects, and reduced shear resistance of soil and rock masses (Sharma & Mahajan, 2018; Prakasam et al., 2020).
While other environmental factors like groundwater depth and vegetation cover have some effect on subsidence, they are less predictive than slope, particularly at corridor or regional scales (Roy & Saha, 2019; Tran et al., 2024). Consequently, the slope-based regression model provides a practical and data-efficient method for preliminary subsidence evaluation in areas where extensive geotechnical studies or long-term monitoring data are unavailable. Its simplicity also supports rapid screening of potentially vulnerable areas along transport corridors in hilly, data-scarce regions (Sharma & Mahajan, 2018; Gharechaee et al., 2023).
Even though the model is useful, it is based on regression-derived estimates rather than direct field measurements. Therefore, the predicted subsidence rates should be interpreted as indicative trends rather than absolute values. Future research that integrates time-series deformation data (e.g., InSAR), multi-parameter modeling, and spatial validation using field observations would improve prediction reliability and support more robust subsidence risk mapping and infrastructure resilience planning (Chatterjee et al., 2007; Kumar et al., 2024).
Author Contributions
Conceptualization, N. Rajeev and R. Kumar; methodology, N. Rajeev; software, N. Rajeev; validation, N. Rajeev and R. Kumar; formal analysis, N. Rajeev; investigation, N. Rajeev; resources, N. Rajeev; data curation, N. Rajeev; writing—original draft preparation, N. Rajeev; writing—review and editing, N. Rajeev; visualization, N. Rajeev; supervision, R. Kumar and K. Singh; project administration, R. Kumar. All authors have read and agreed to the published version of the manuscript.
Funding
This research received no external funding
Data Availability Statement
The data used in this study were obtained from published literature sources and processed through regression modeling. No new datasets were generated or analyzed. All data supporting the findings of this study are available within the cited references.
Acknowledgments
The authors acknowledge the use of published literature and secondary data sources that supported the regression analysis conducted in this study.
Conflicts of Interest
The authors declare no conflicts of interest.
Abbreviations
| DEM | Digital Elevation Model |
| GIS | Geographic Information System |
| QGIS | Quantum Geographic Information System |
| LSS | Land Subsidence Susceptibility |
| GPS | Global Positioning System |
| RS | Remote Sensing |
| R² | Coefficient of Determination |
| MDPI | Multidisciplinary Digital Publishing Institute |
Appendix A

Table A1.
This is a table caption.
| Sl. No. | Paper Content Included | Where Used in This Research Paper | Fig./Table No. |
| 1 | Definition and significance of land subsidence | Introduction | — |
| 2 | Use of slope as a major influencing parameter | Materials and Methods | Figure 2 |
| 3 | Regression equation derived from global case studies | Regression modelling | Equation (1) |
| 4 | Risk classification based on slope angle (Low, Moderate, High) | Classification of Subsidence Risk Zones | Table 1 |
| 5 | Interpretation of slope and rainfall effect in Meghalaya | Classification of Subsidence Risk Zones | Table 1 |
| 6 | Observations on slope–subsidence relationship | Classification of Subsidence Risk Zones | Figure 7 |
| 7 | Overall summary and practical applications | Conclusion | — |
References
- Athira, B.; Sindhu, G. Assessment of land subsidence and its evaluation in Munroe Island, Kollam, Kerala, India. Environmental Earth Sciences 2021, 80, 1–14. [Google Scholar]
- Selvarajhan, S. Coastal climate vulnerability and adaptation: A case study of Chennai City. Ocean & Coastal Management 2024, 247, 106850. [Google Scholar]
- Sharma, S.; Mahajan, A.K. Comparative evaluation of GIS-based landslide susceptibility mapping using statistical and heuristic approaches for the Dharamshala region of Kangra Valley, India. Arabian Journal of Geosciences 2018, 11, 567. [Google Scholar]
- Prakasam, C.; Aravinth, R.; Kanwar, V.S.; Nagarajan, B. Landslide hazard mapping using geo-environmental parameters: A case study of Shimla Tehsil, Himachal Pradesh. Environmental Earth Sciences 2020, 79, 358. [Google Scholar]
- Roy, J.; Saha, S. Landslide susceptibility mapping using knowledge-driven statistical models in the Darjeeling District, West Bengal. Applied Geography 2019, 106, 65–78. [Google Scholar] [CrossRef]
- Mehmood, A.; Tariq, A.; Khan, M.; Raza, N. Detailed settlement analysis of an old residential building within Lahore Fort, Pakistan. Journal of Cultural Heritage Management and Sustainable Development 2019, 9, 451–465. [Google Scholar]
- Garg, S.; Motagh, M.; Jayaluxmi, I. Land subsidence in Delhi NCR investigated using Sentinel-1 InSAR. Remote Sensing 2021, 13, 2103. [Google Scholar] [CrossRef]
- Phalen, J. Kansai International Airport: A foundation case study. Proceedings of the Institution of Civil Engineers – Geotechnical Engineering 2002, 150, 45–56. [Google Scholar]
- Tran, A.V.; Brovelli, M.A.; Ha, K.T.; Khuc, D.T.; Tran, D.N.; Tran, H.H.; Le, N.T. Land subsidence susceptibility mapping in Ca Mau Province, Vietnam, using boosting models. Geosciences 2024, 14, 195. [Google Scholar] [CrossRef]
- Gharechaee, H.; Samani, A.N.; Sigaroodi, S.K.; Baloochiyan, A.; Moosavi, M.S.; Hubbart, J.A.; Sadeghi, S.M.M. Land subsidence susceptibility mapping using InSAR and machine learning models in a semiarid region of Iran. Remote Sensing 2023, 15, 4330. [Google Scholar]
- Zhang, L.; Arabameri, A.; Santosh, M.; Pal, S.C. Land subsidence susceptibility mapping: Comparative assessment of the efficacy of five models. Remote Sensing 2023, 15, 6872. [Google Scholar] [CrossRef] [PubMed]
- Fokker, P.A.; Gunnink, J.L.; Koster, K.; de Lange, G. Disentangling and parameterizing shallow sources of subsidence: Application to a reclaimed coastal area, Flevoland, the Netherlands. Engineering Geology 2023, 313, 106790. [Google Scholar] [CrossRef]
- Kumar, H.; Syed, T.H.; Amelung, F.; Jayaprasad, P. InSAR-based monitoring of ongoing land subsidence in Ahmedabad, India’s first heritage city. Remote Sensing 2024, 16, 889. [Google Scholar] [CrossRef]
- Naik, S.; Naik, N.P.; Kandolkar, S.S.; Mandrekar, R.L. Settlement of a structure: A case study. In Proceedings of the Indian Geotechnical Conference 2011, Kolkata, India, 2011; pp. 559–563. [Google Scholar]
- Chatterjee, R.S.; Roy, P.; Dasgupta, N. Assessment of land subsidence phenomenon in Kolkata City, India using satellite-based differential InSAR technique. Current Science 2007, 92, 1657–1661. [Google Scholar]
- Hakim, W.L.; Achmad, A.R.; Lee, C.-W. Land subsidence susceptibility mapping in Jakarta using functional and meta-ensemble machine learning algorithms based on time-series InSAR data. Remote Sensing 2020, 12, 1854. [Google Scholar] [CrossRef]
- Poreh, J.; Ochoa-García, Y.; Mendoza, L.; Dávalos-González, C.; López-Castañeda, A.; Salinas-Castillo, C. Assessing subsidence of Mexico City from InSAR and Landsat ETM+ with CGPS and SVM. Remote Sensing 2021, 13, 2534. [Google Scholar] [CrossRef]
- Kavurmaci, M. Settlement suitability analysis using geographical information systems (GIS): A case study in Aksaray, Turkey. International Journal of Geographical Information Science 2016, 30, 489–505. [Google Scholar]
- Arca, D.; Citiroglu, H.K.; Kutoglu, H.S.; Kemaldere, H.; Mekik, C.; Sarginoglu, S.; Arslanoglu, M. Unsustainable urban development for Zonguldak metropolitan area (NW Turkey). Environmental Earth Sciences 2014, 71, 5277–5291. [Google Scholar] [CrossRef]
- Tien Bui, D.; Shahabi, H.; Shirzadi, A.; Chapi, K.; Pradhan, B.; Chen, W.; Khosravi, K.; Panahi, M.; Ahmad, B.B.; Saro, L. Land subsidence susceptibility mapping in South Korea using machine learning algorithms. Sensors 2018, 18, 3601. [Google Scholar] [CrossRef] [PubMed]
Figure 1.
GIS-Based Land Subsidence Susceptibility Mapping Framework.
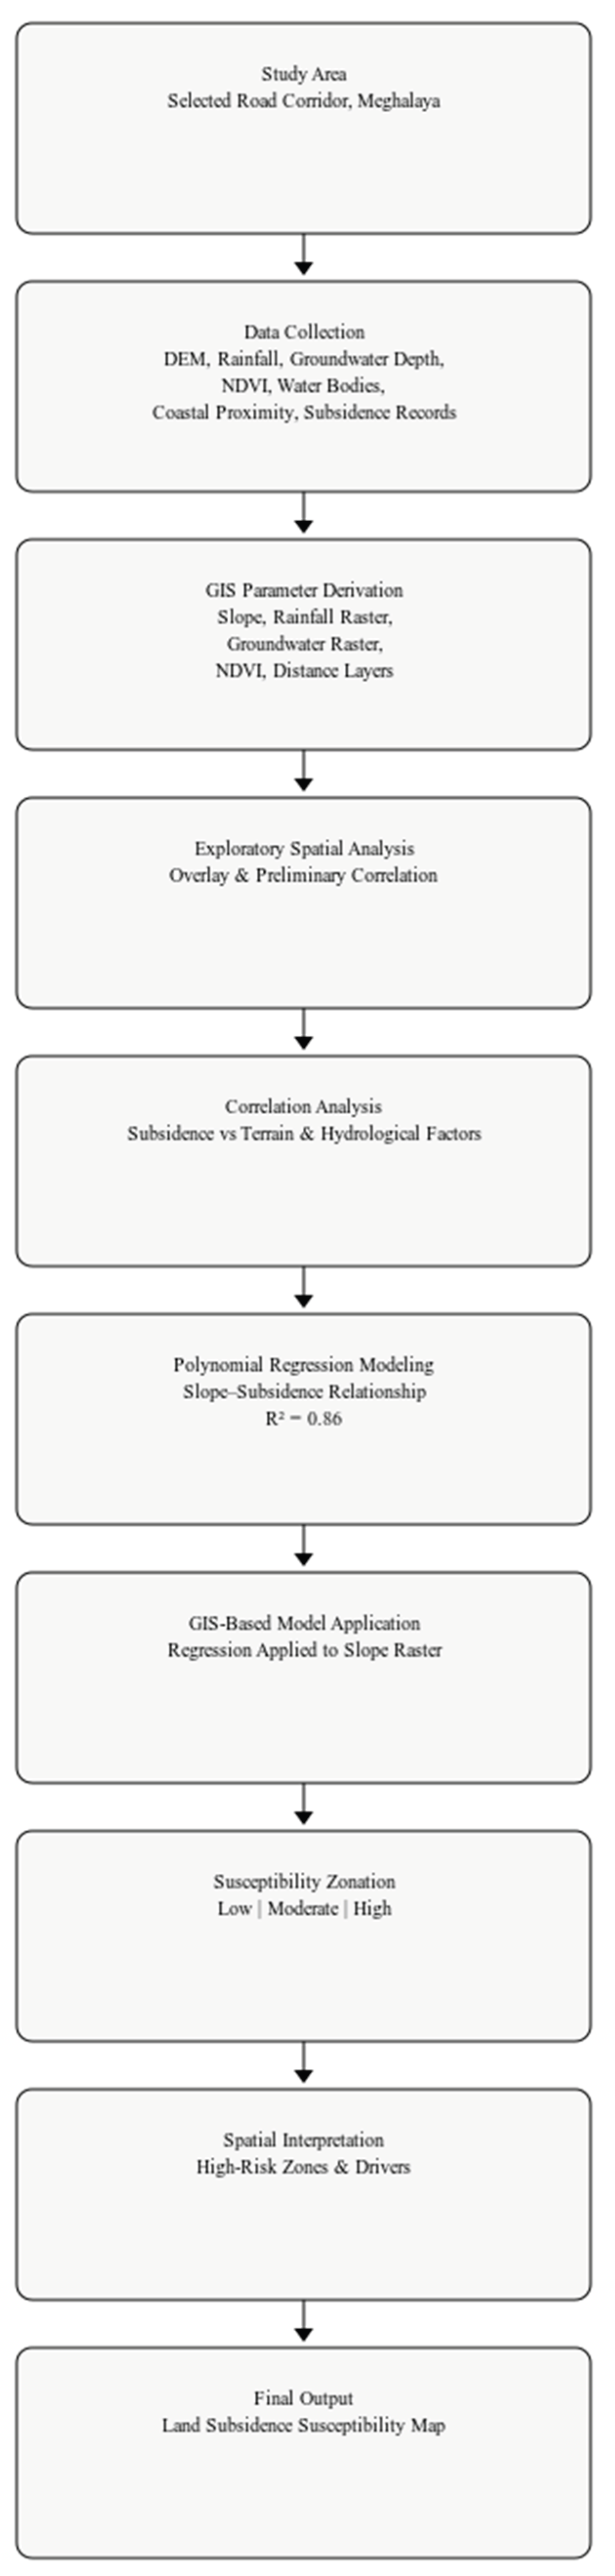
Figure 2.
Subsidence vs Slope.
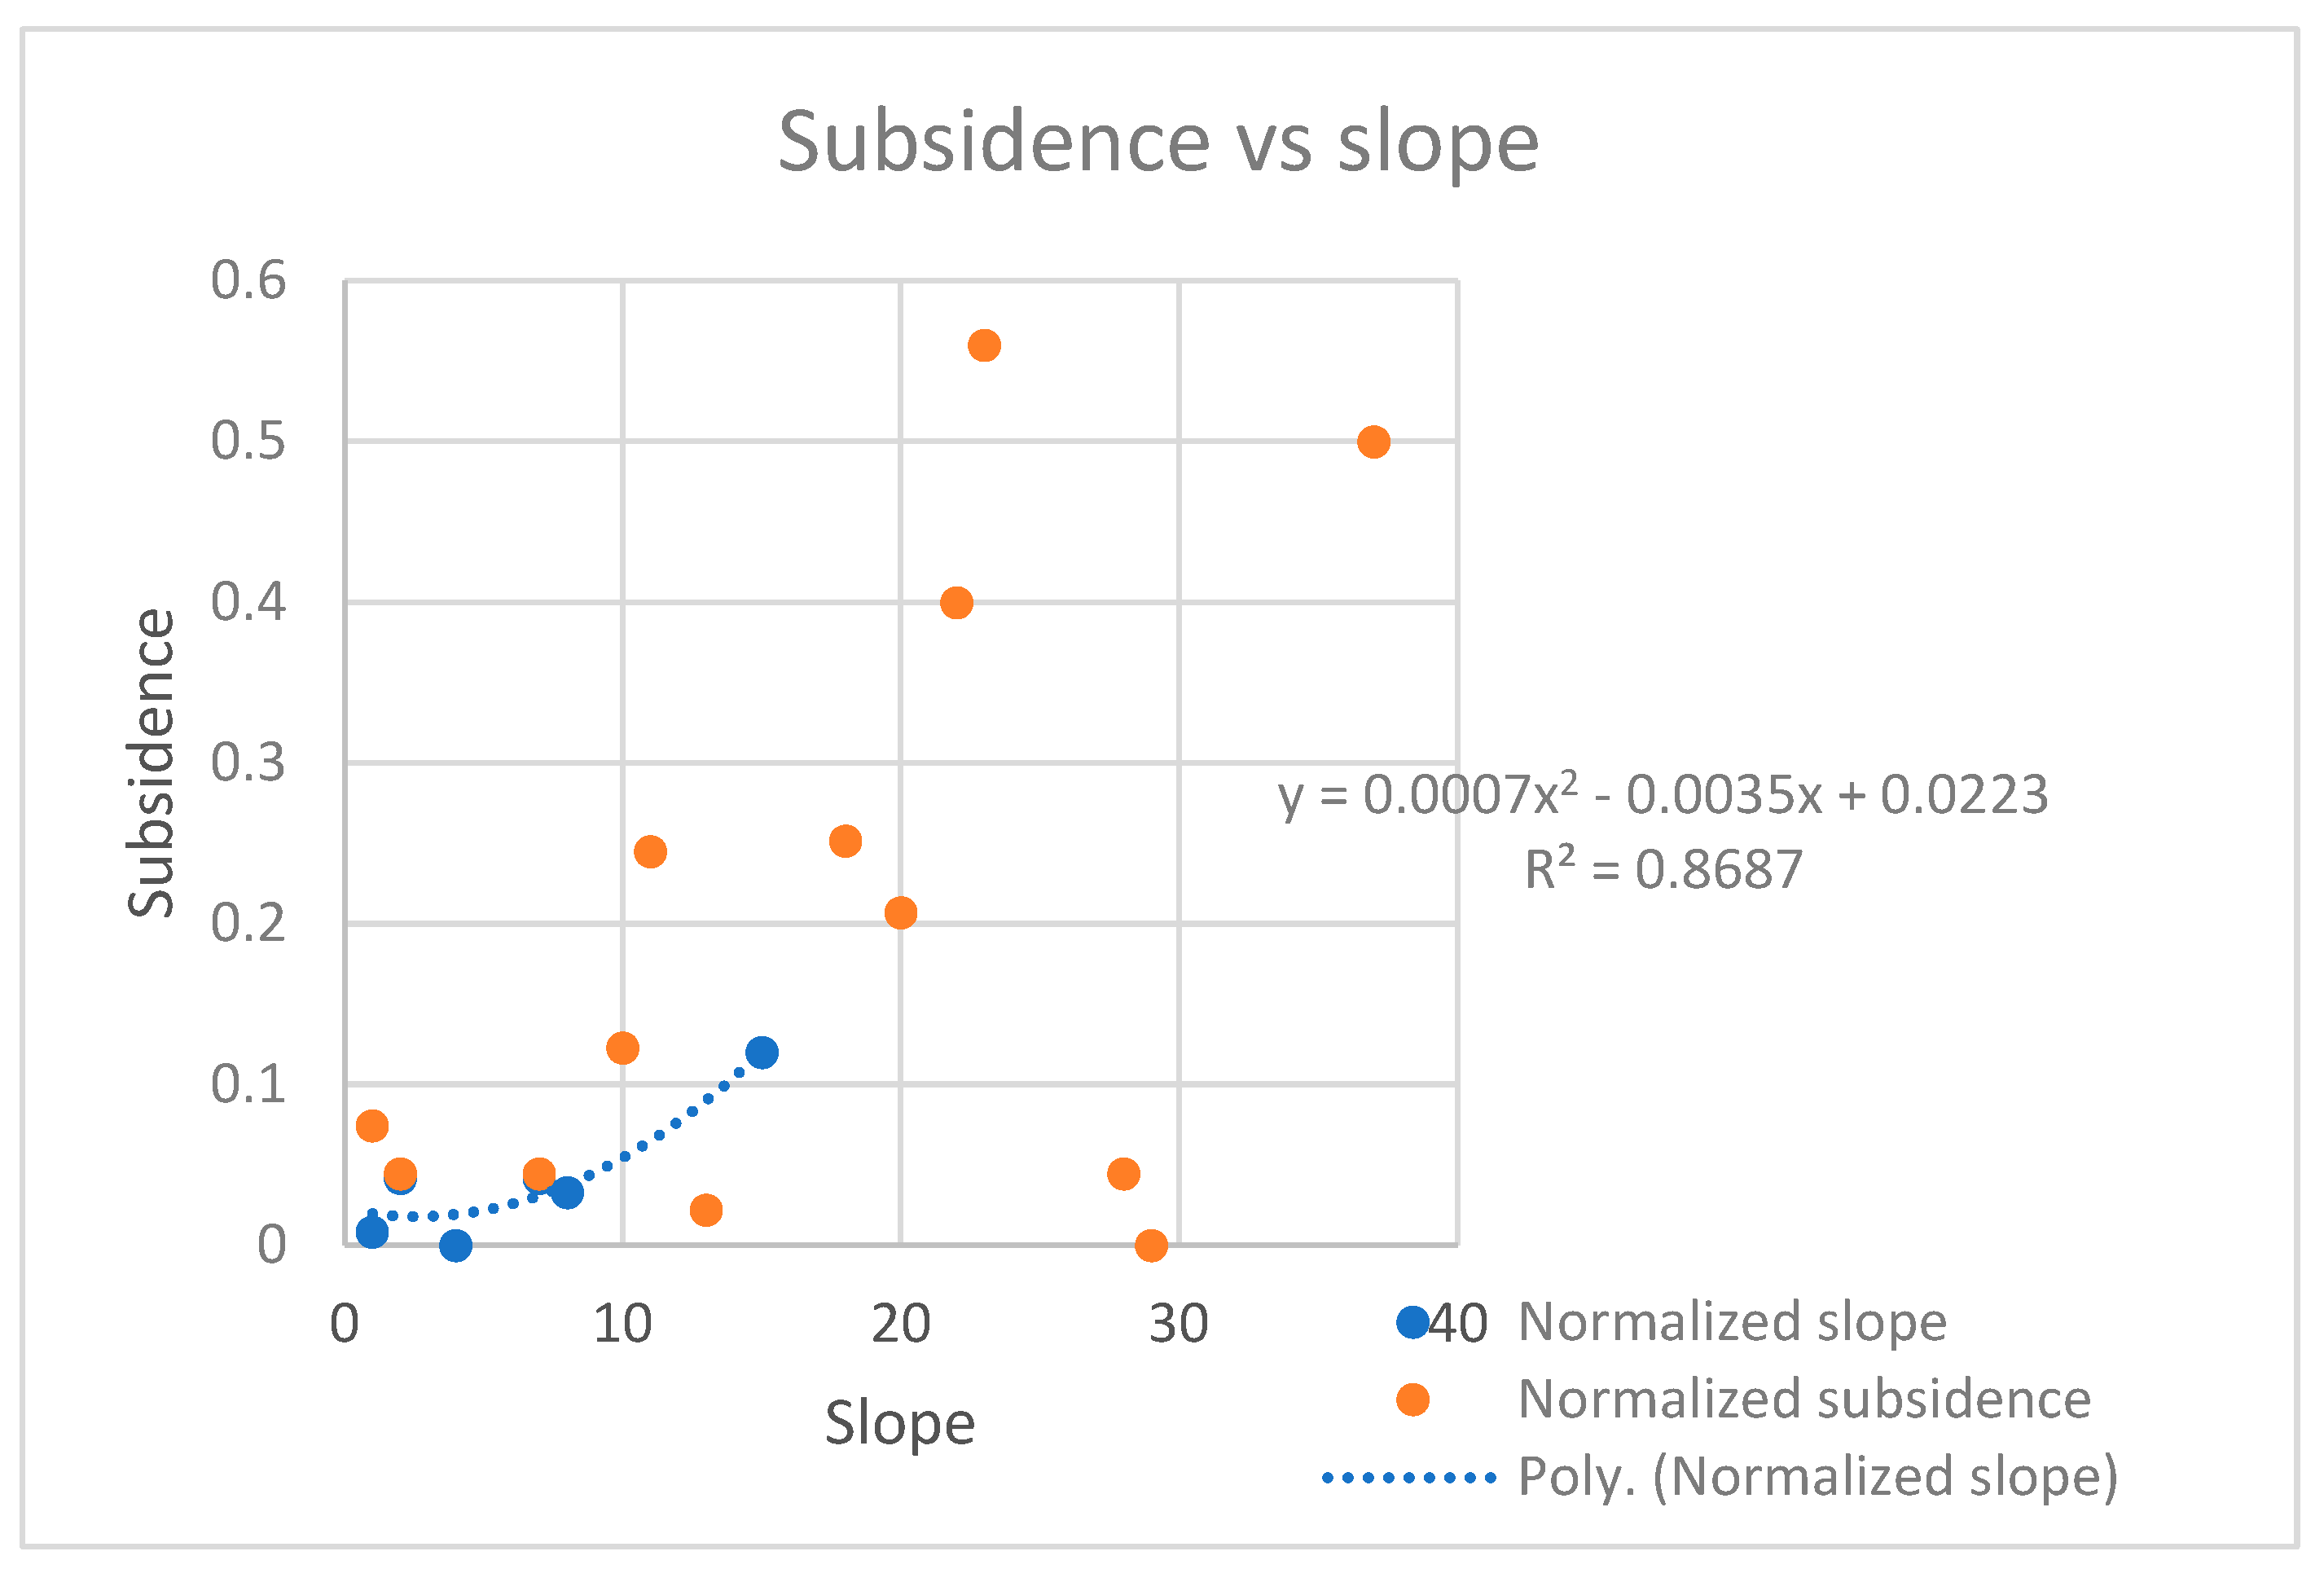
Figure 3.
- Subsidence vs Rainfall.
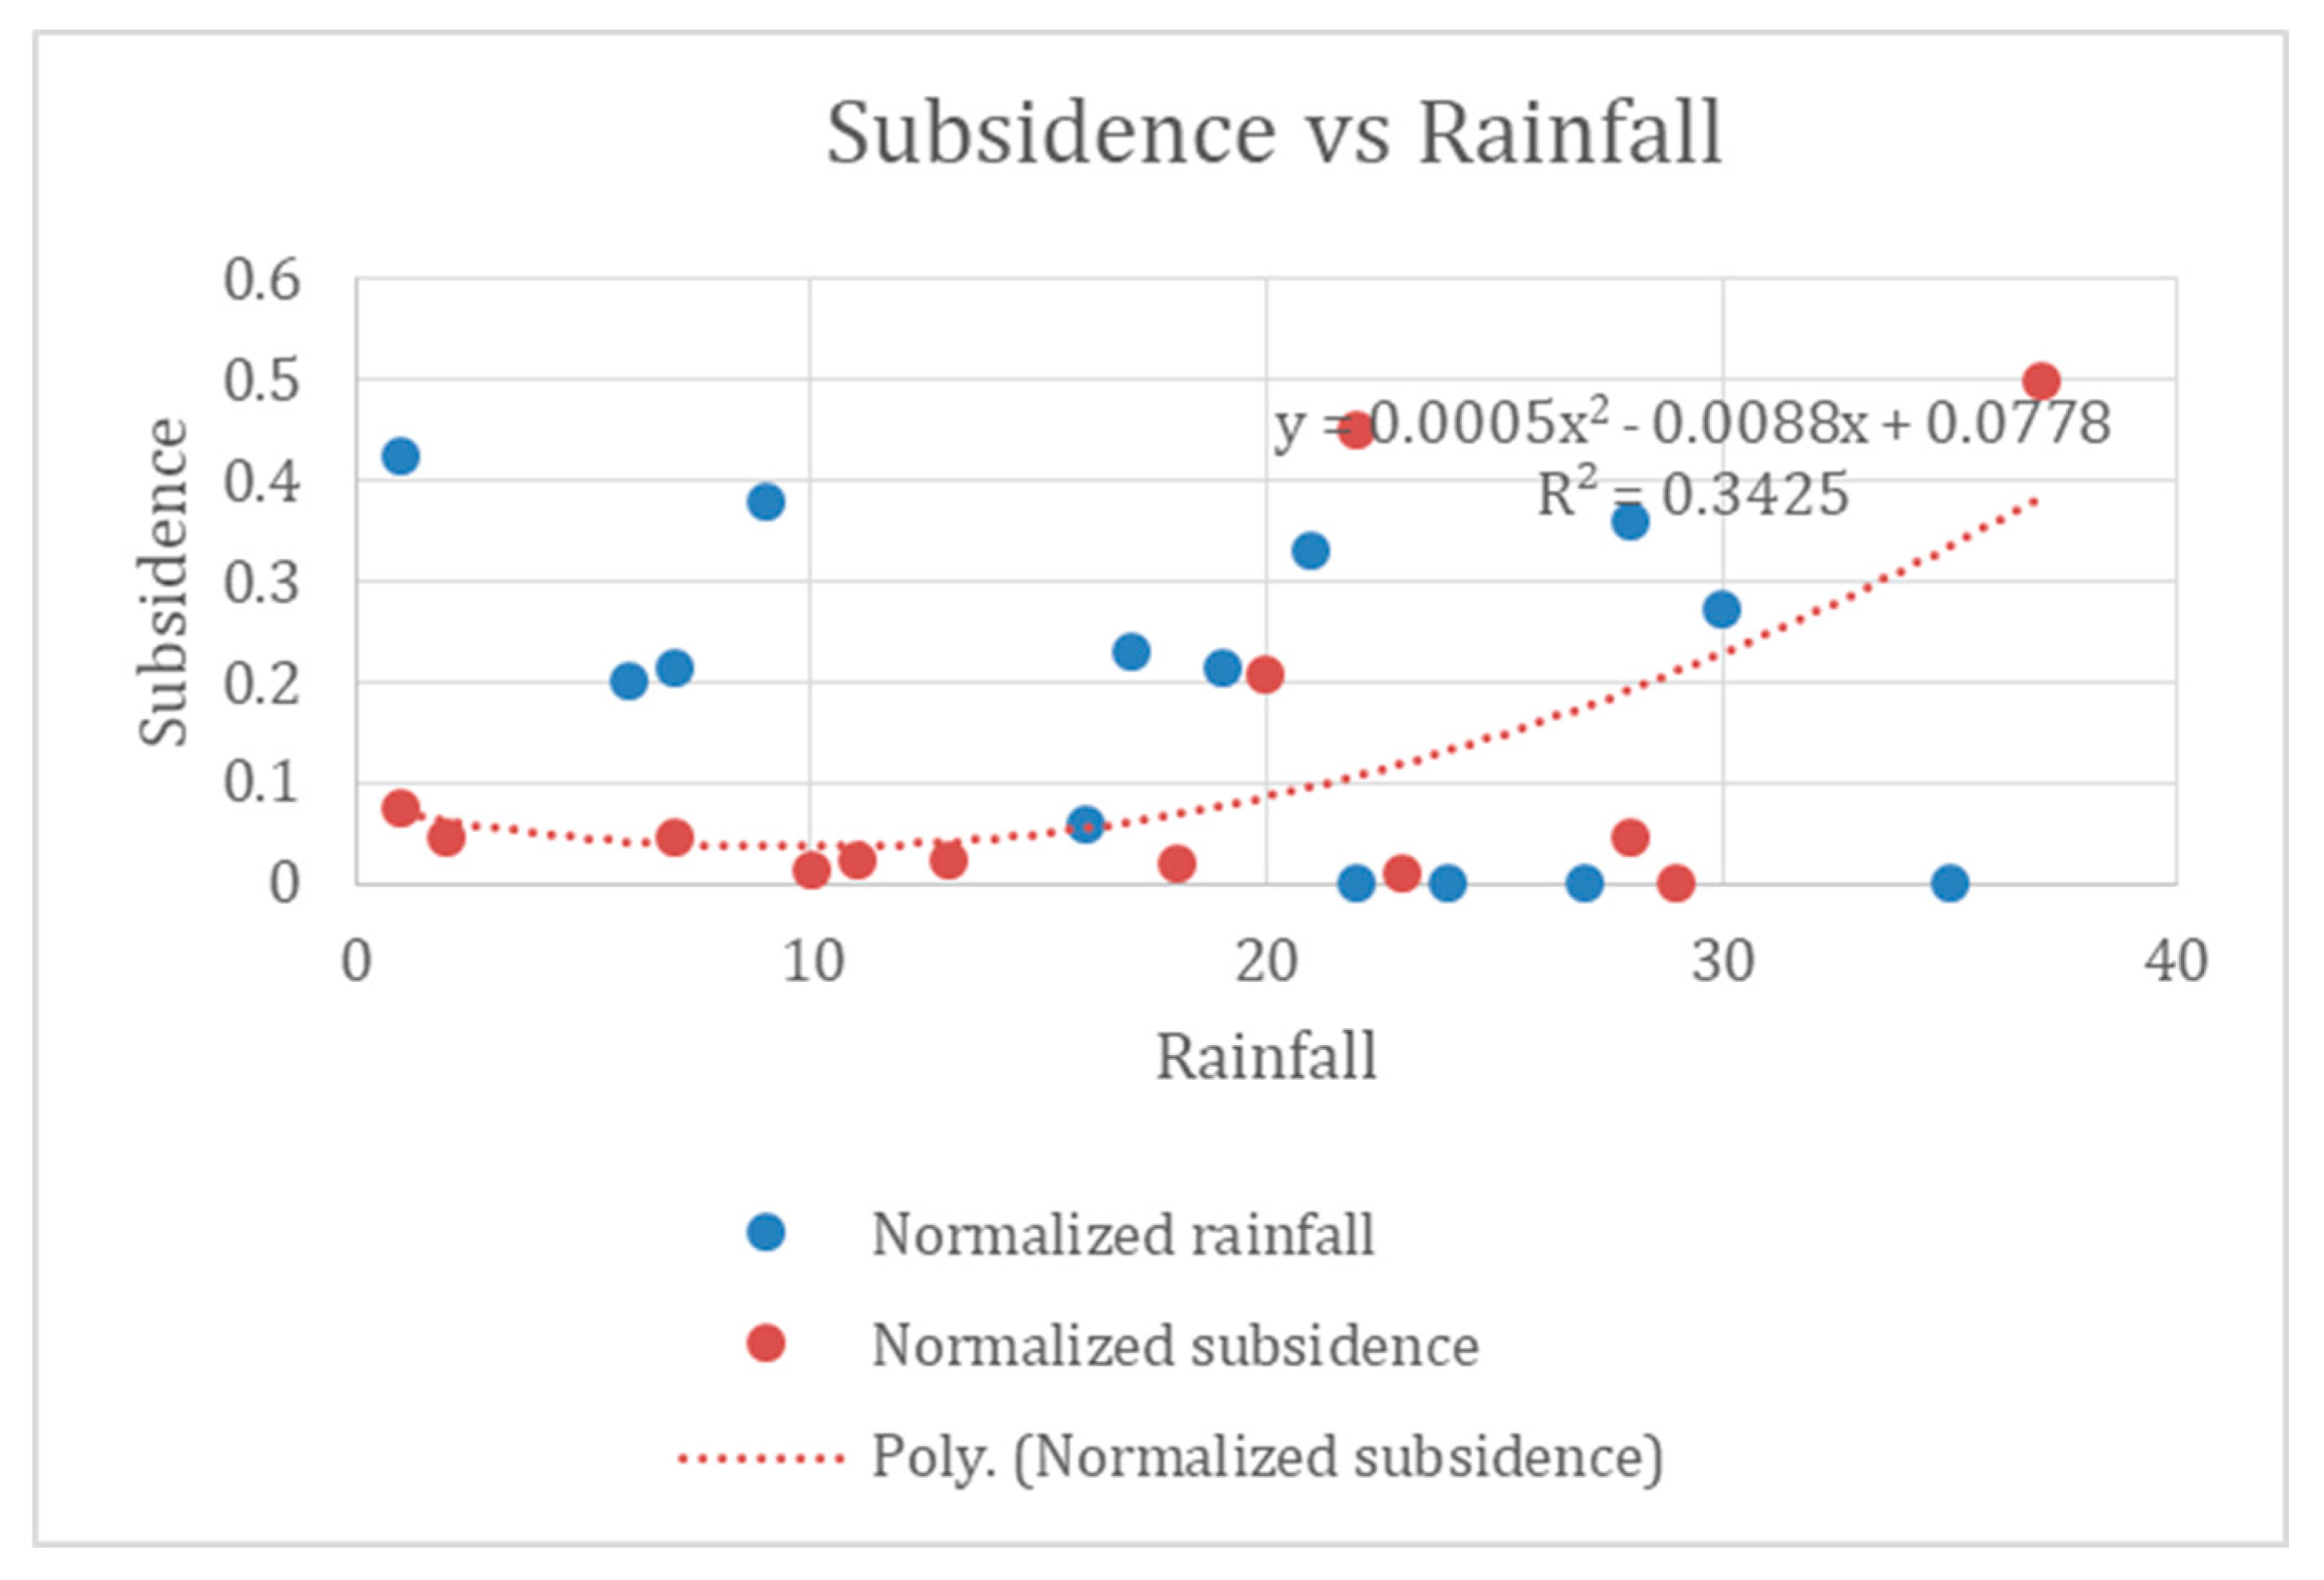
Figure 4.
Subsidence vs Waterdepth.
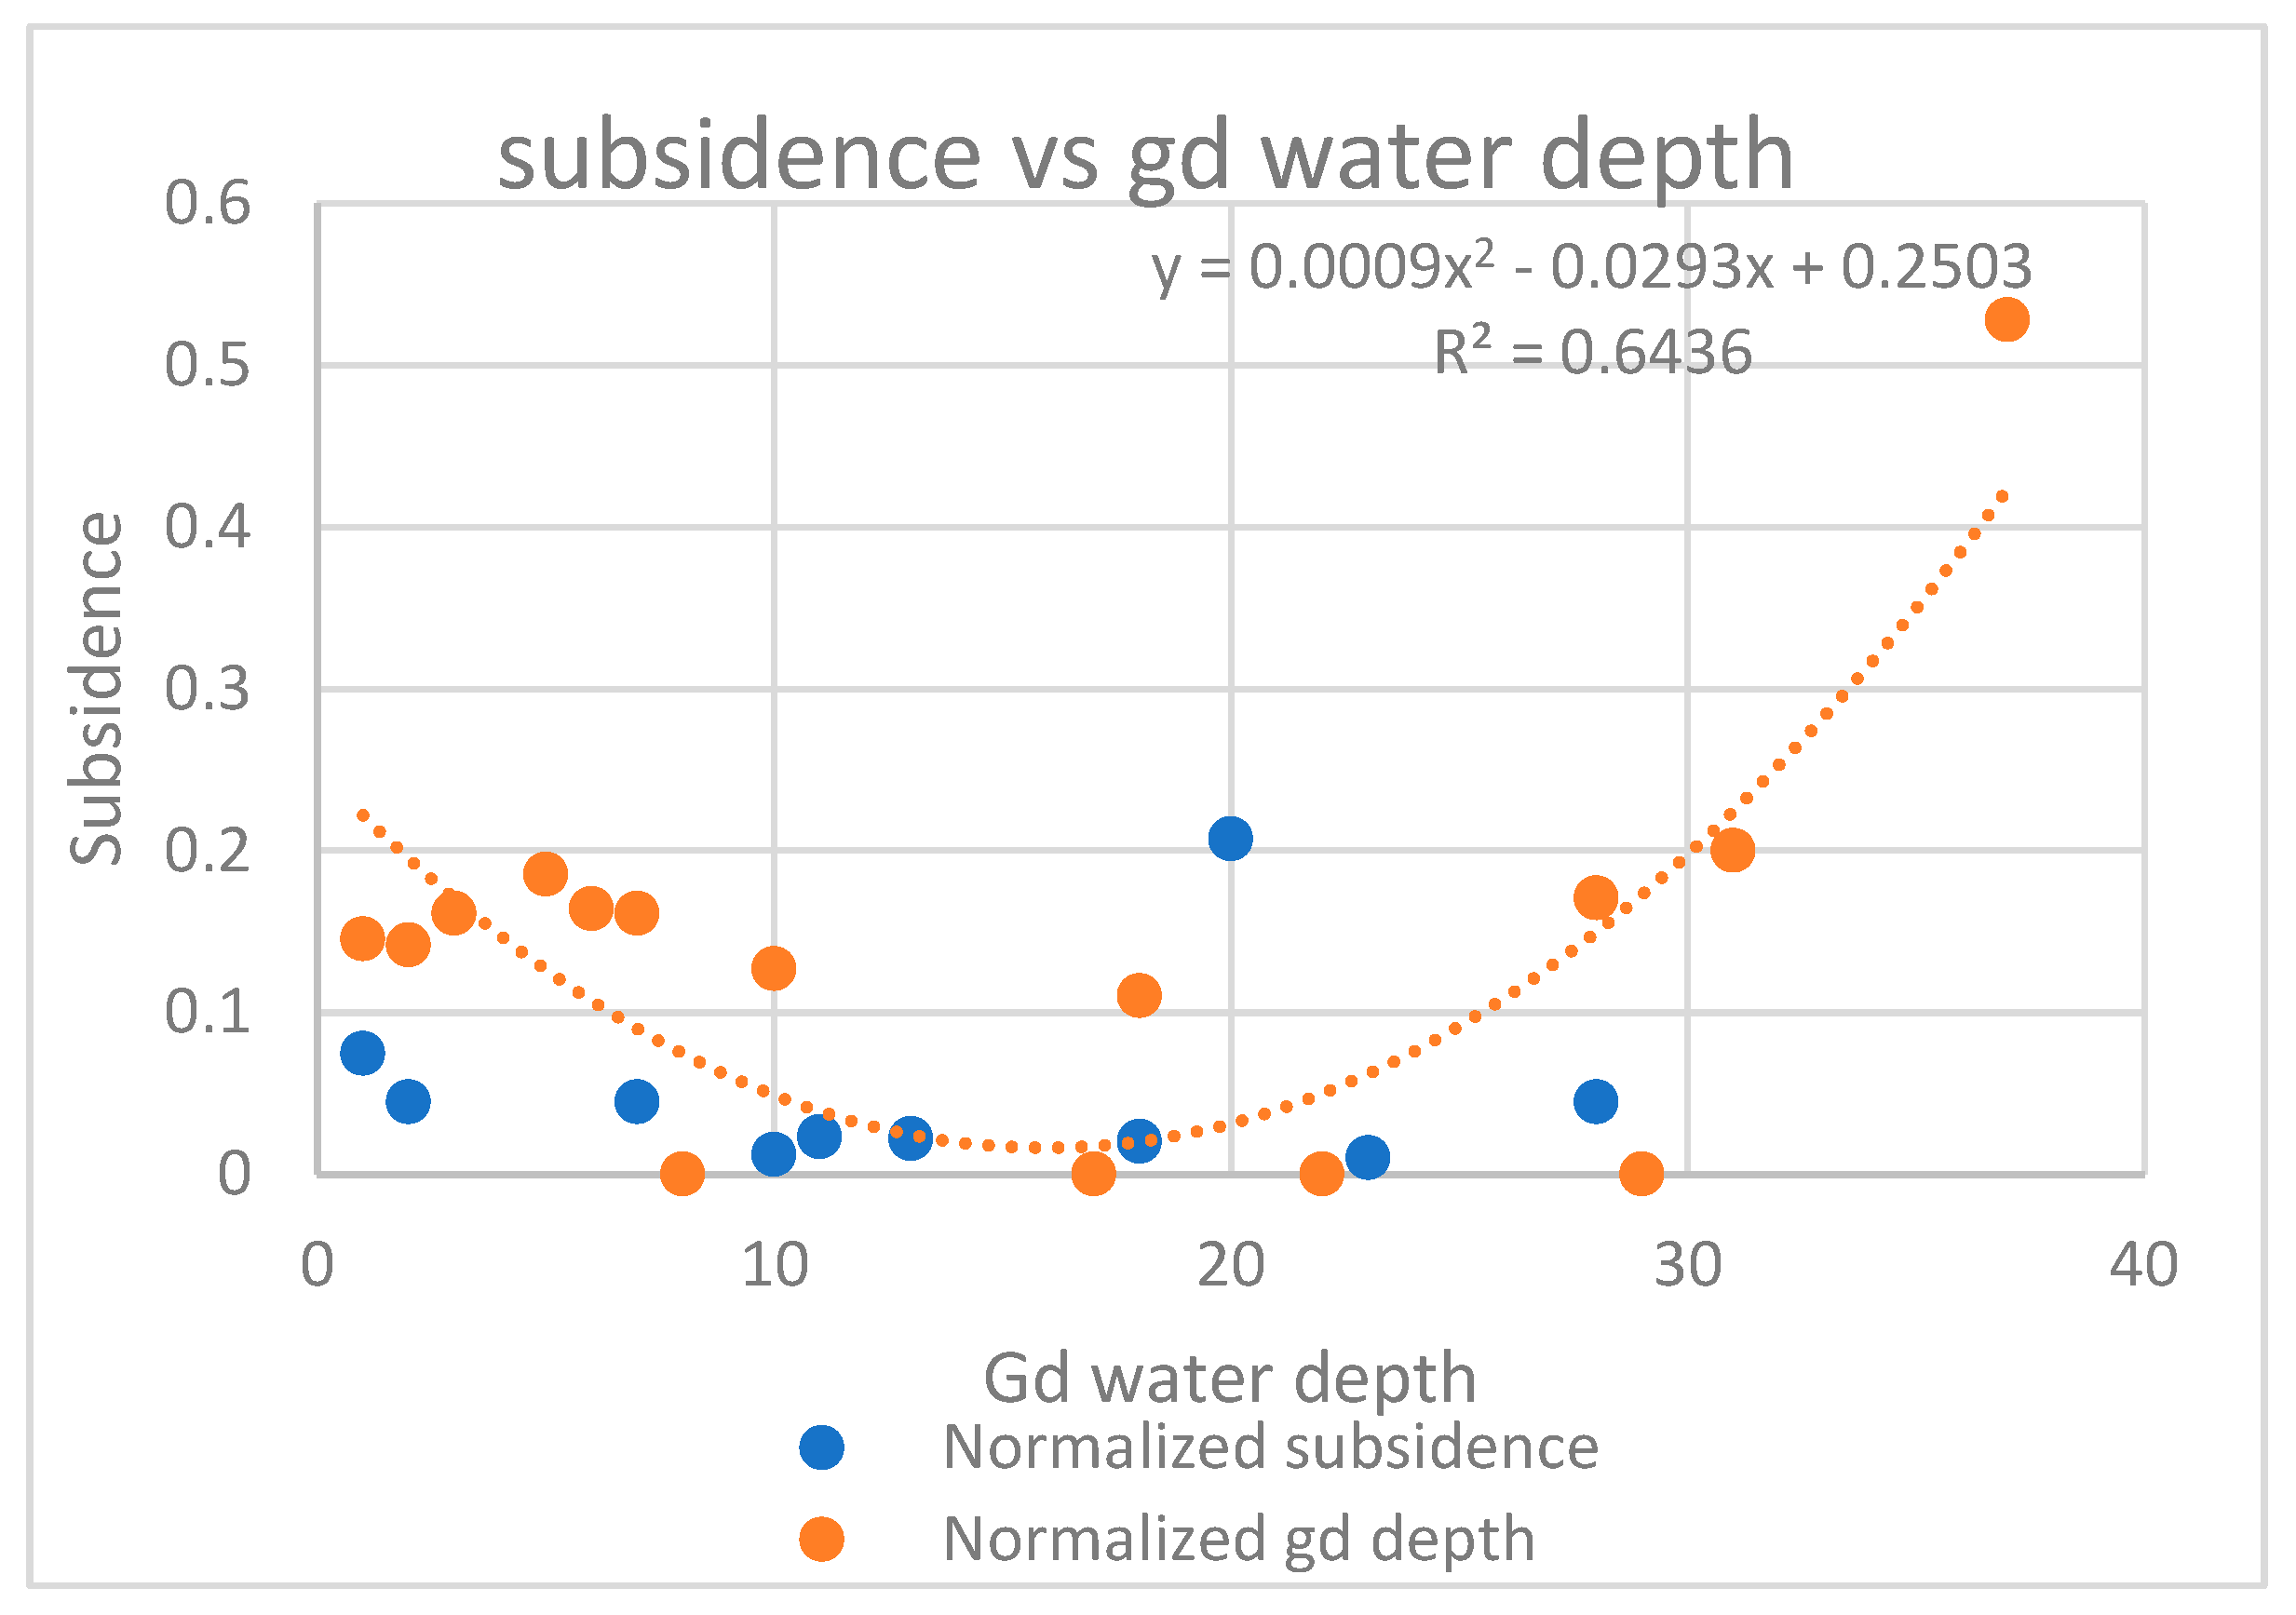
Figure 5.
Subsidence vs Distancce to waterbody.
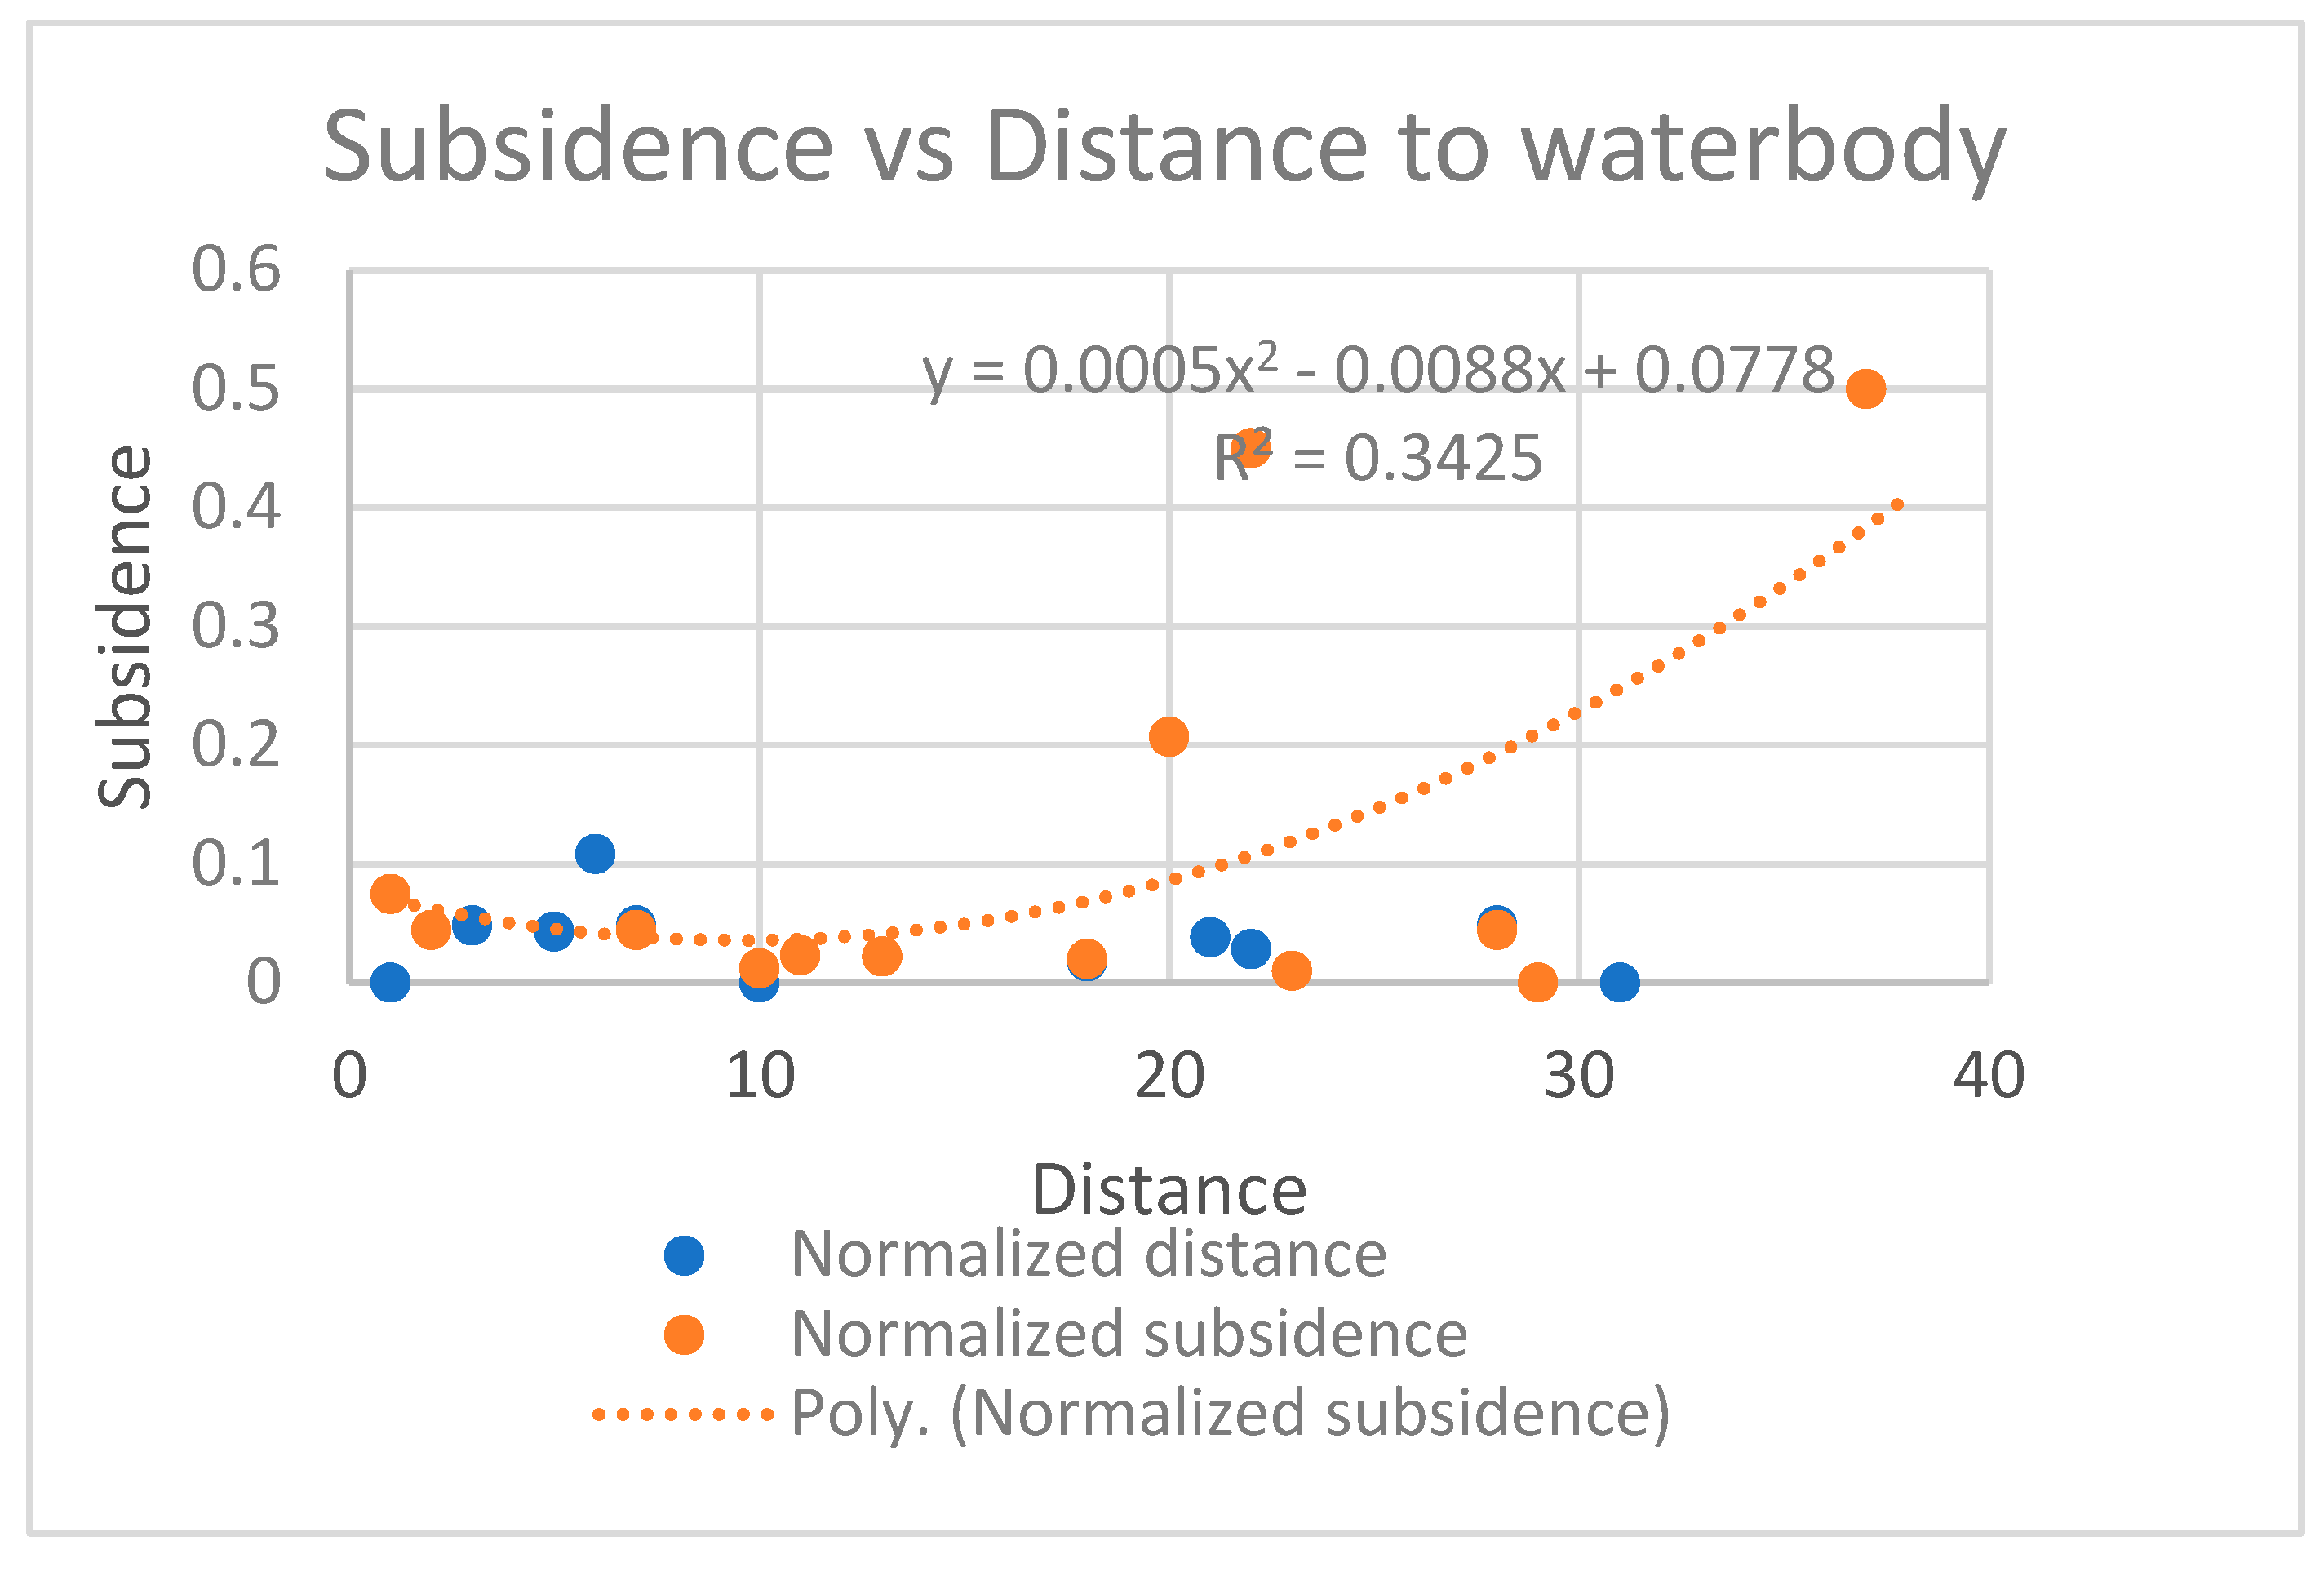
Figure 6.
- Subsidence vs NDVI.
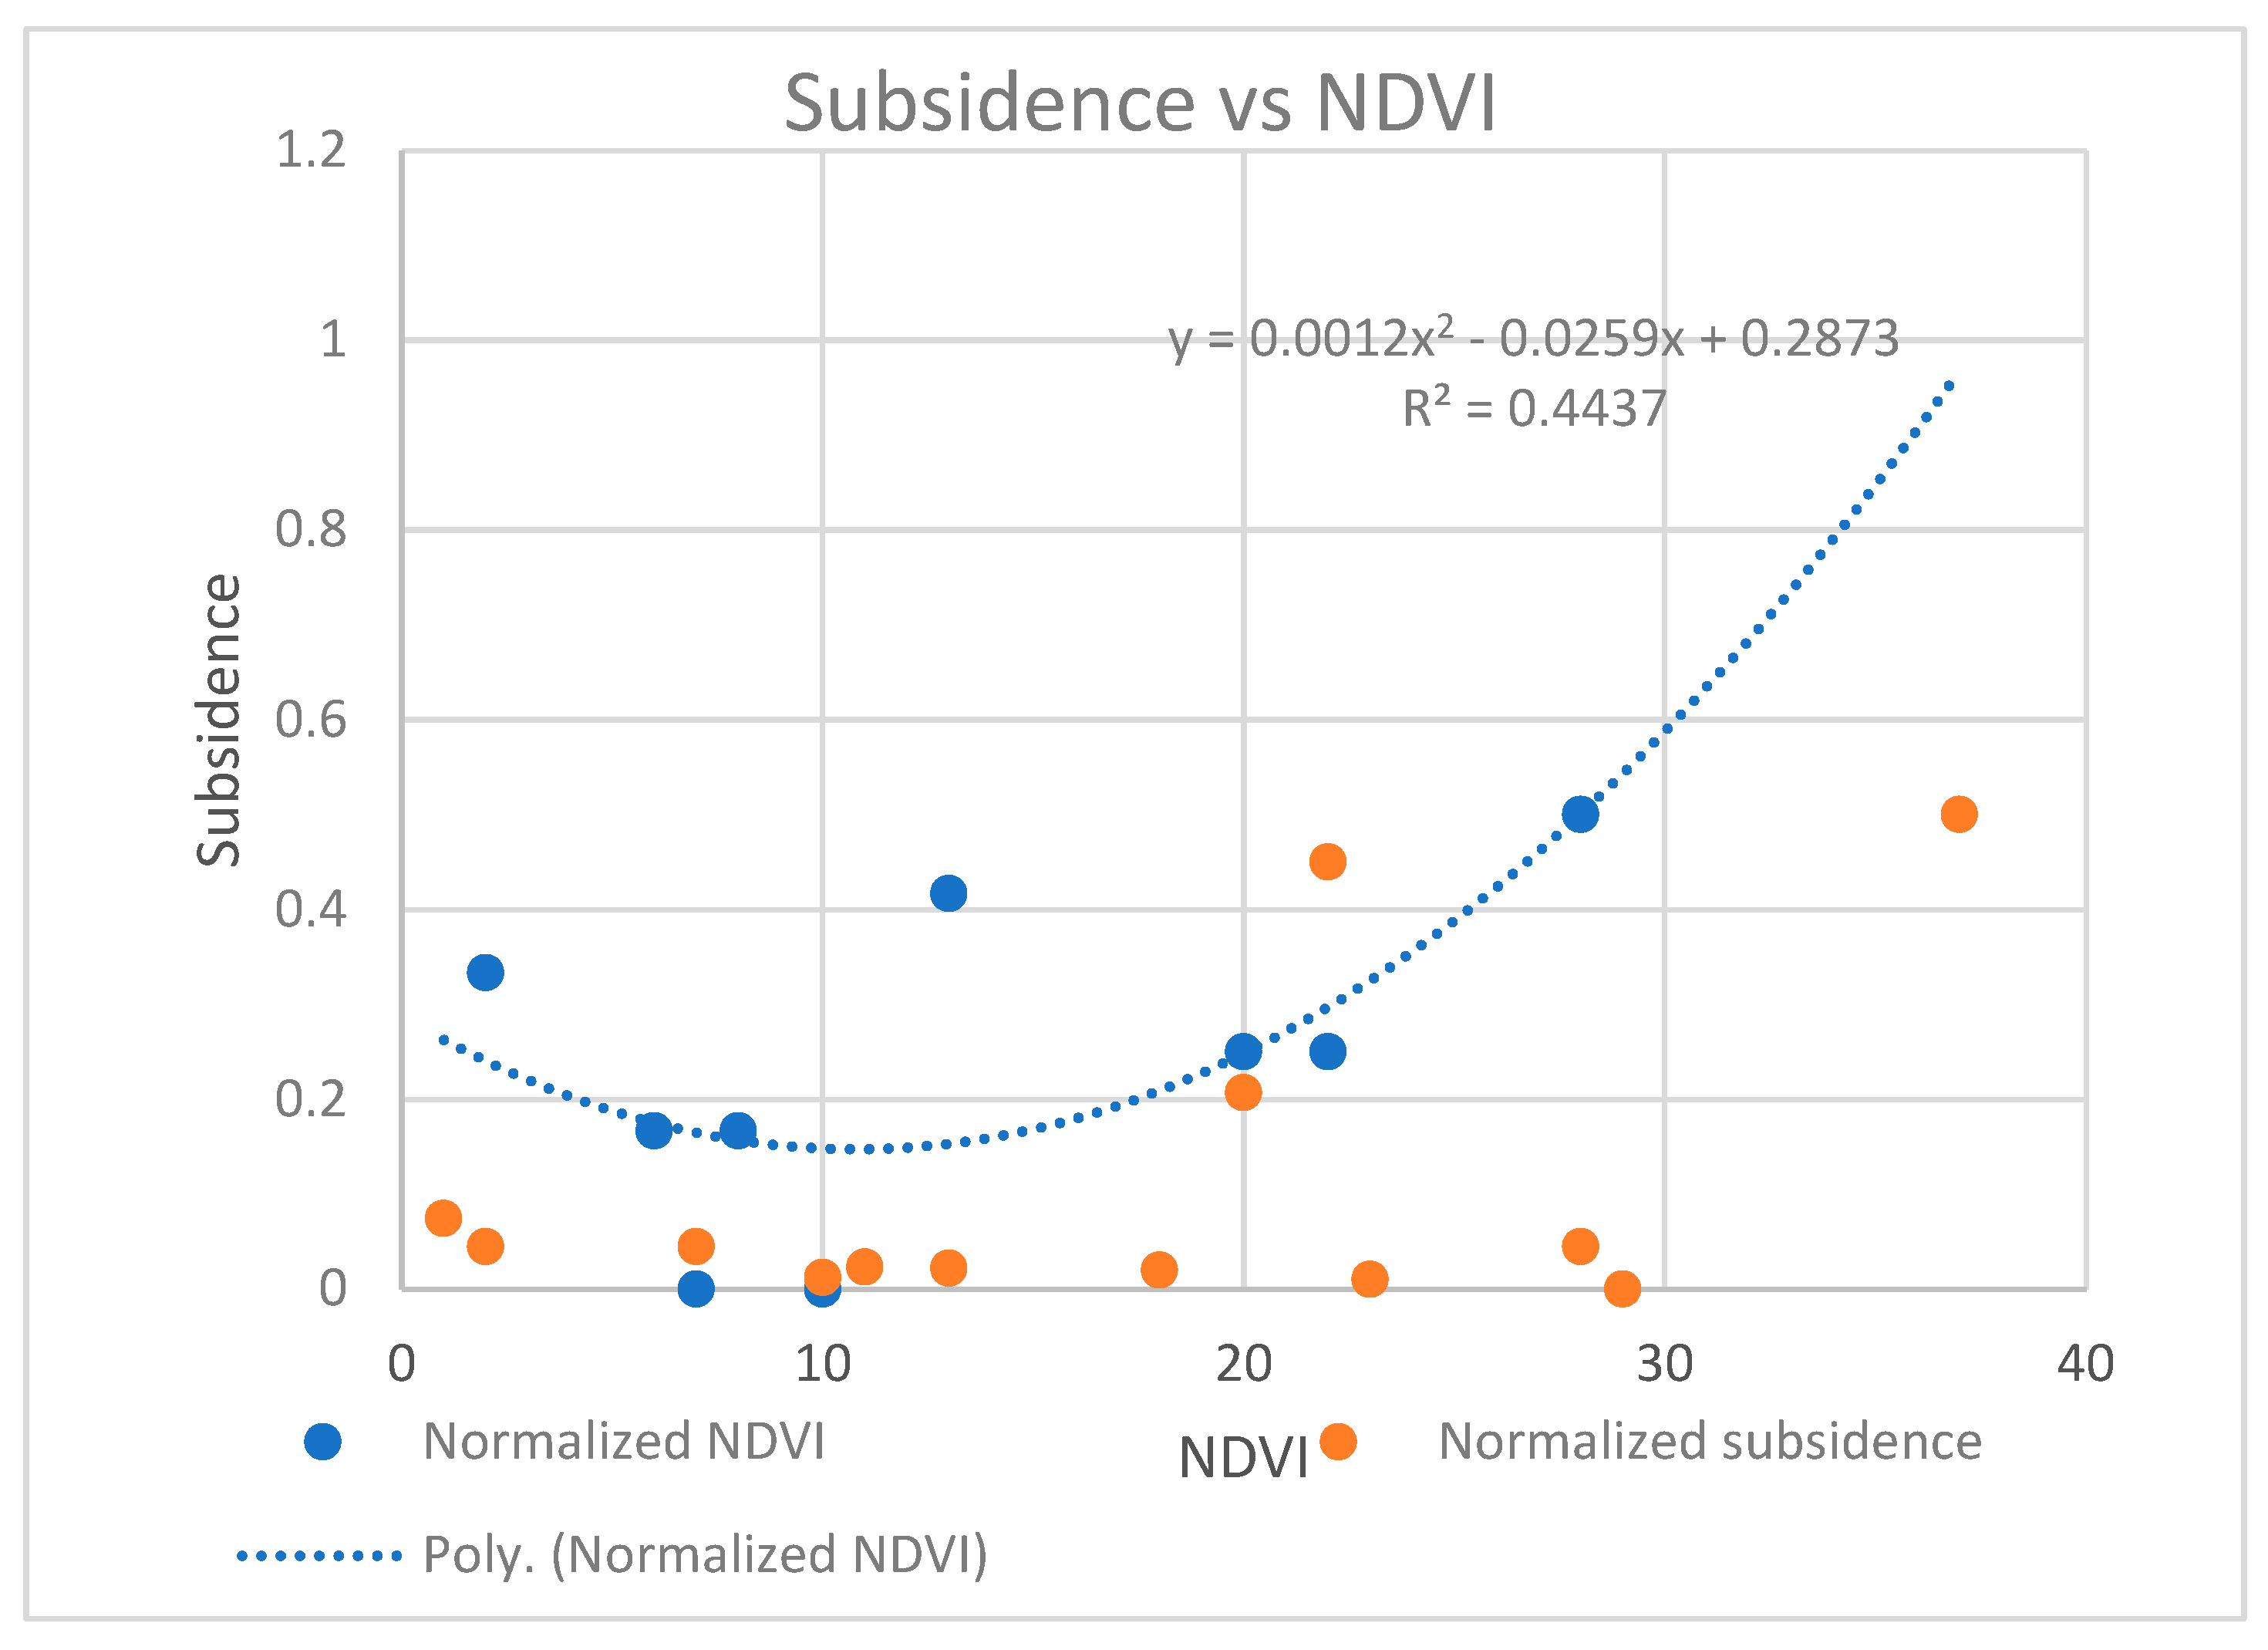
Figure 7.
Subsidence vs Tide.
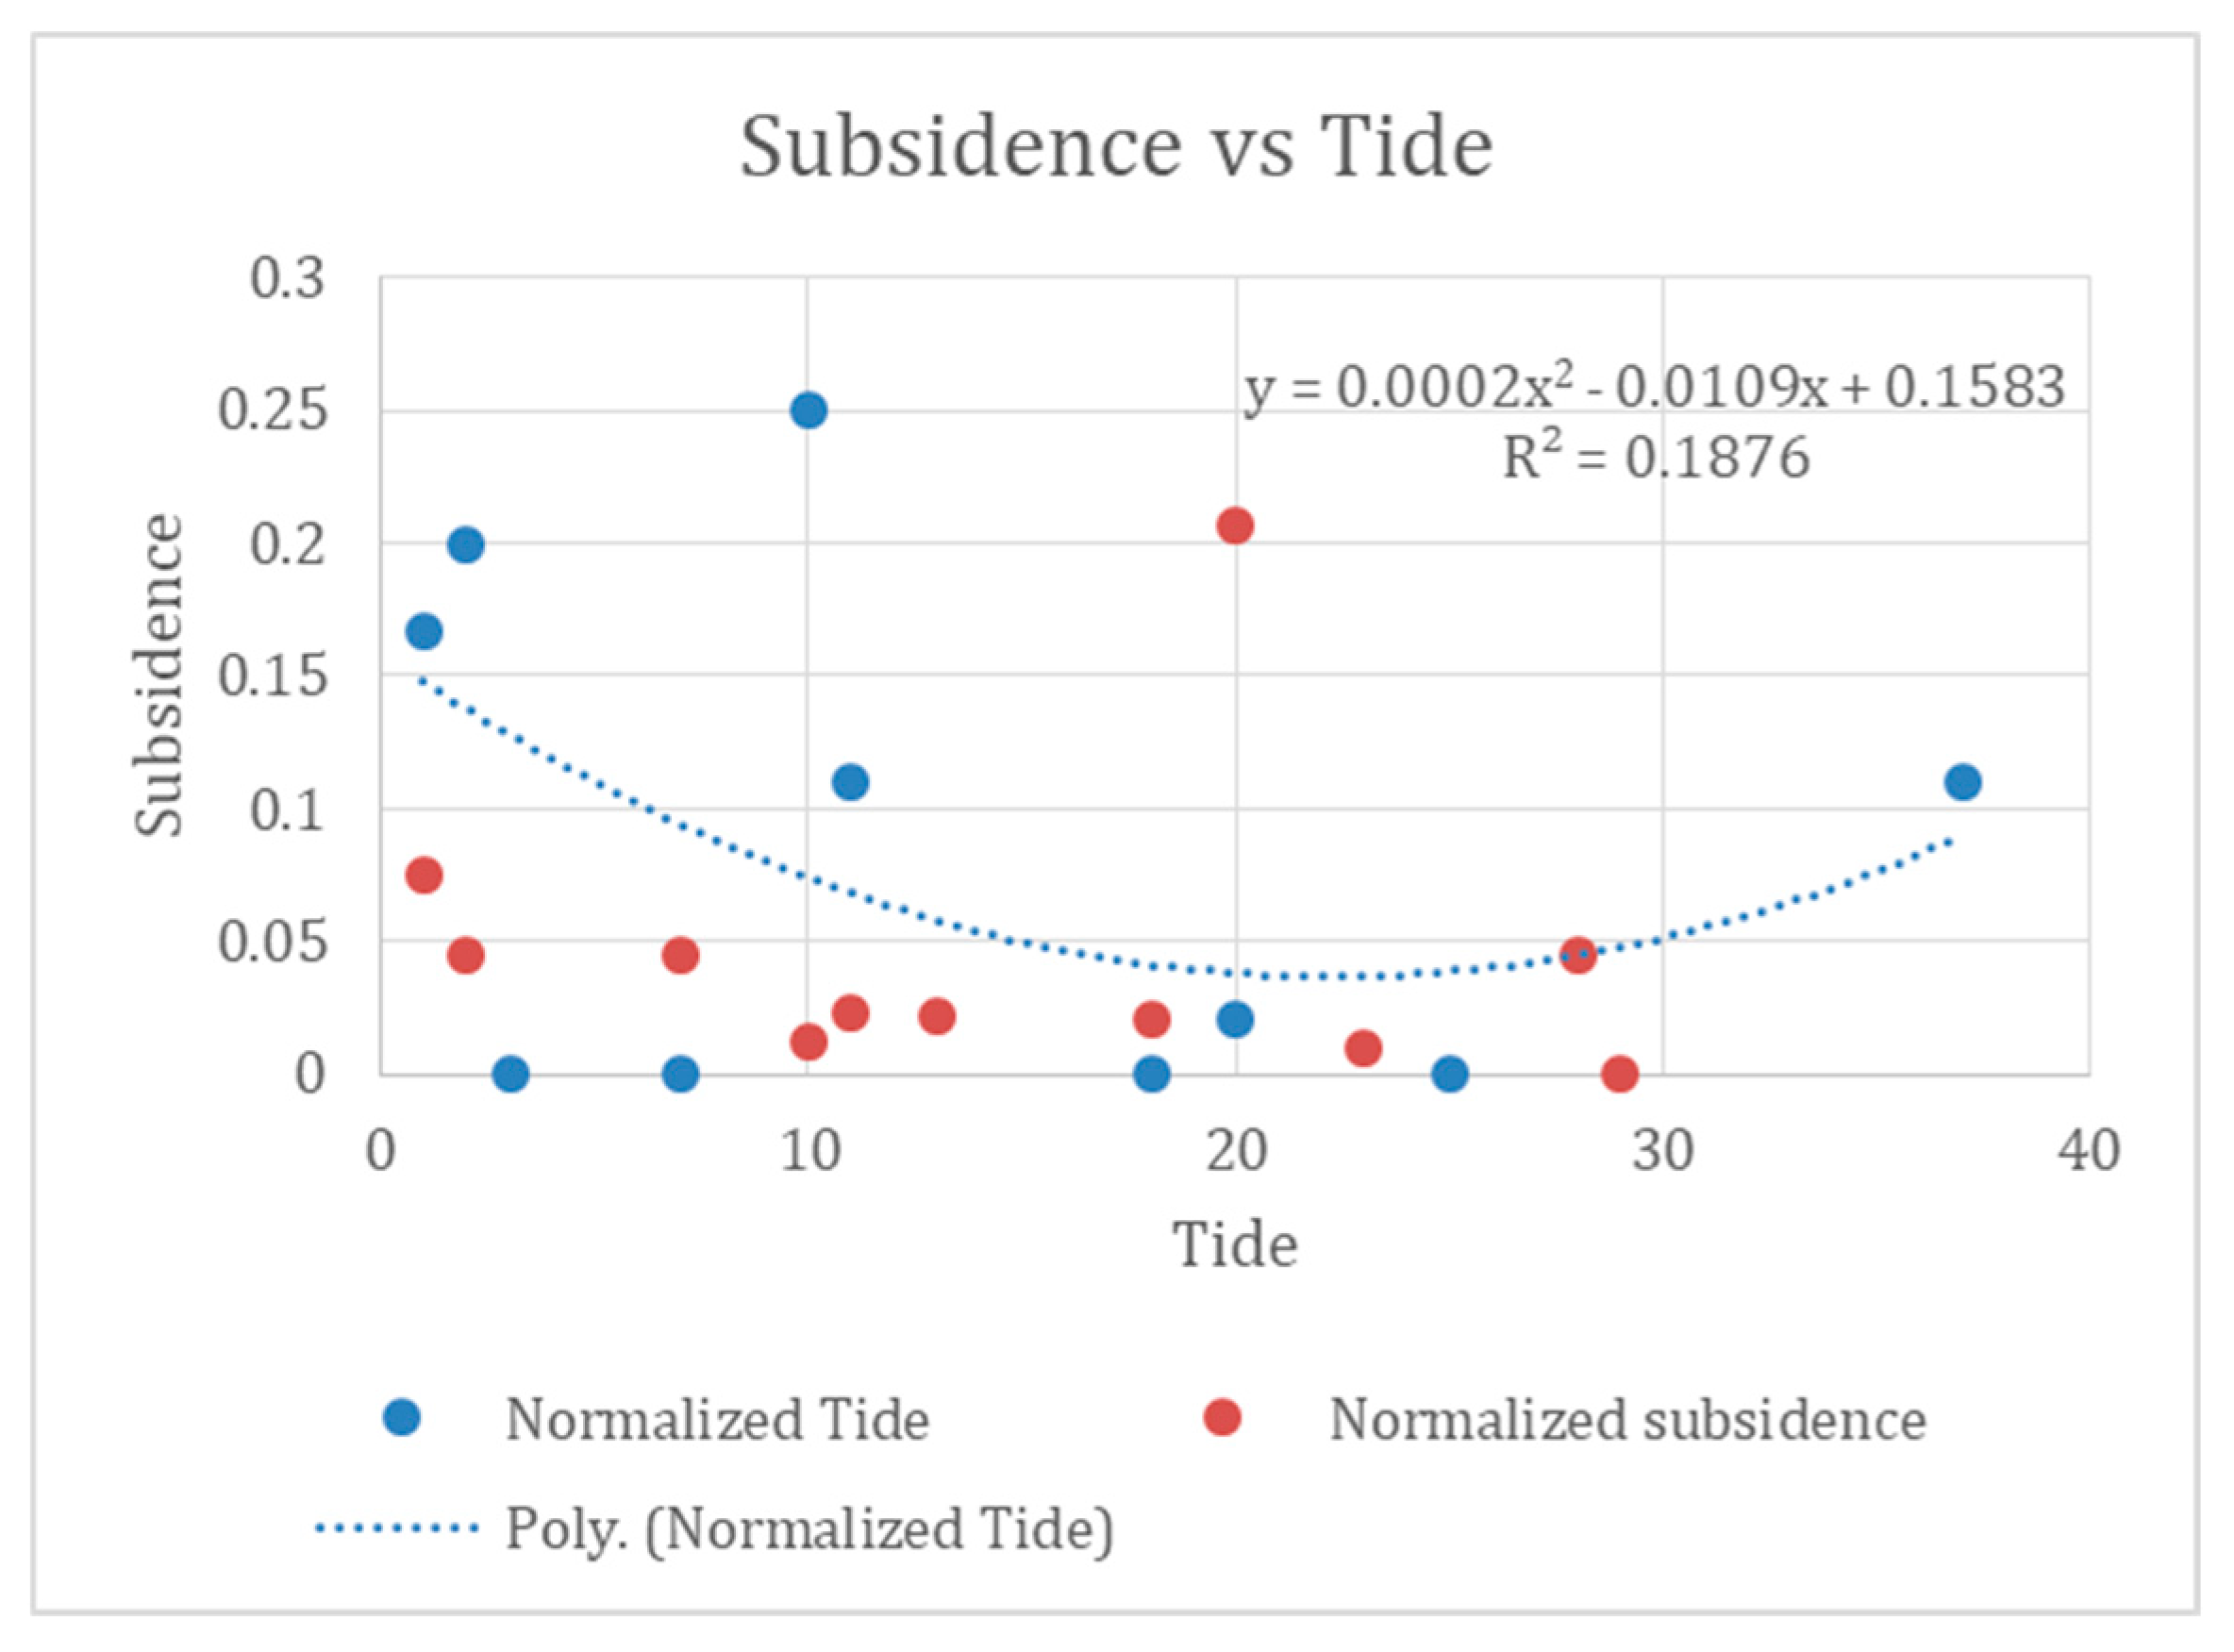
Figure 8.
Subsidence vs Slope in Meghalaya region.
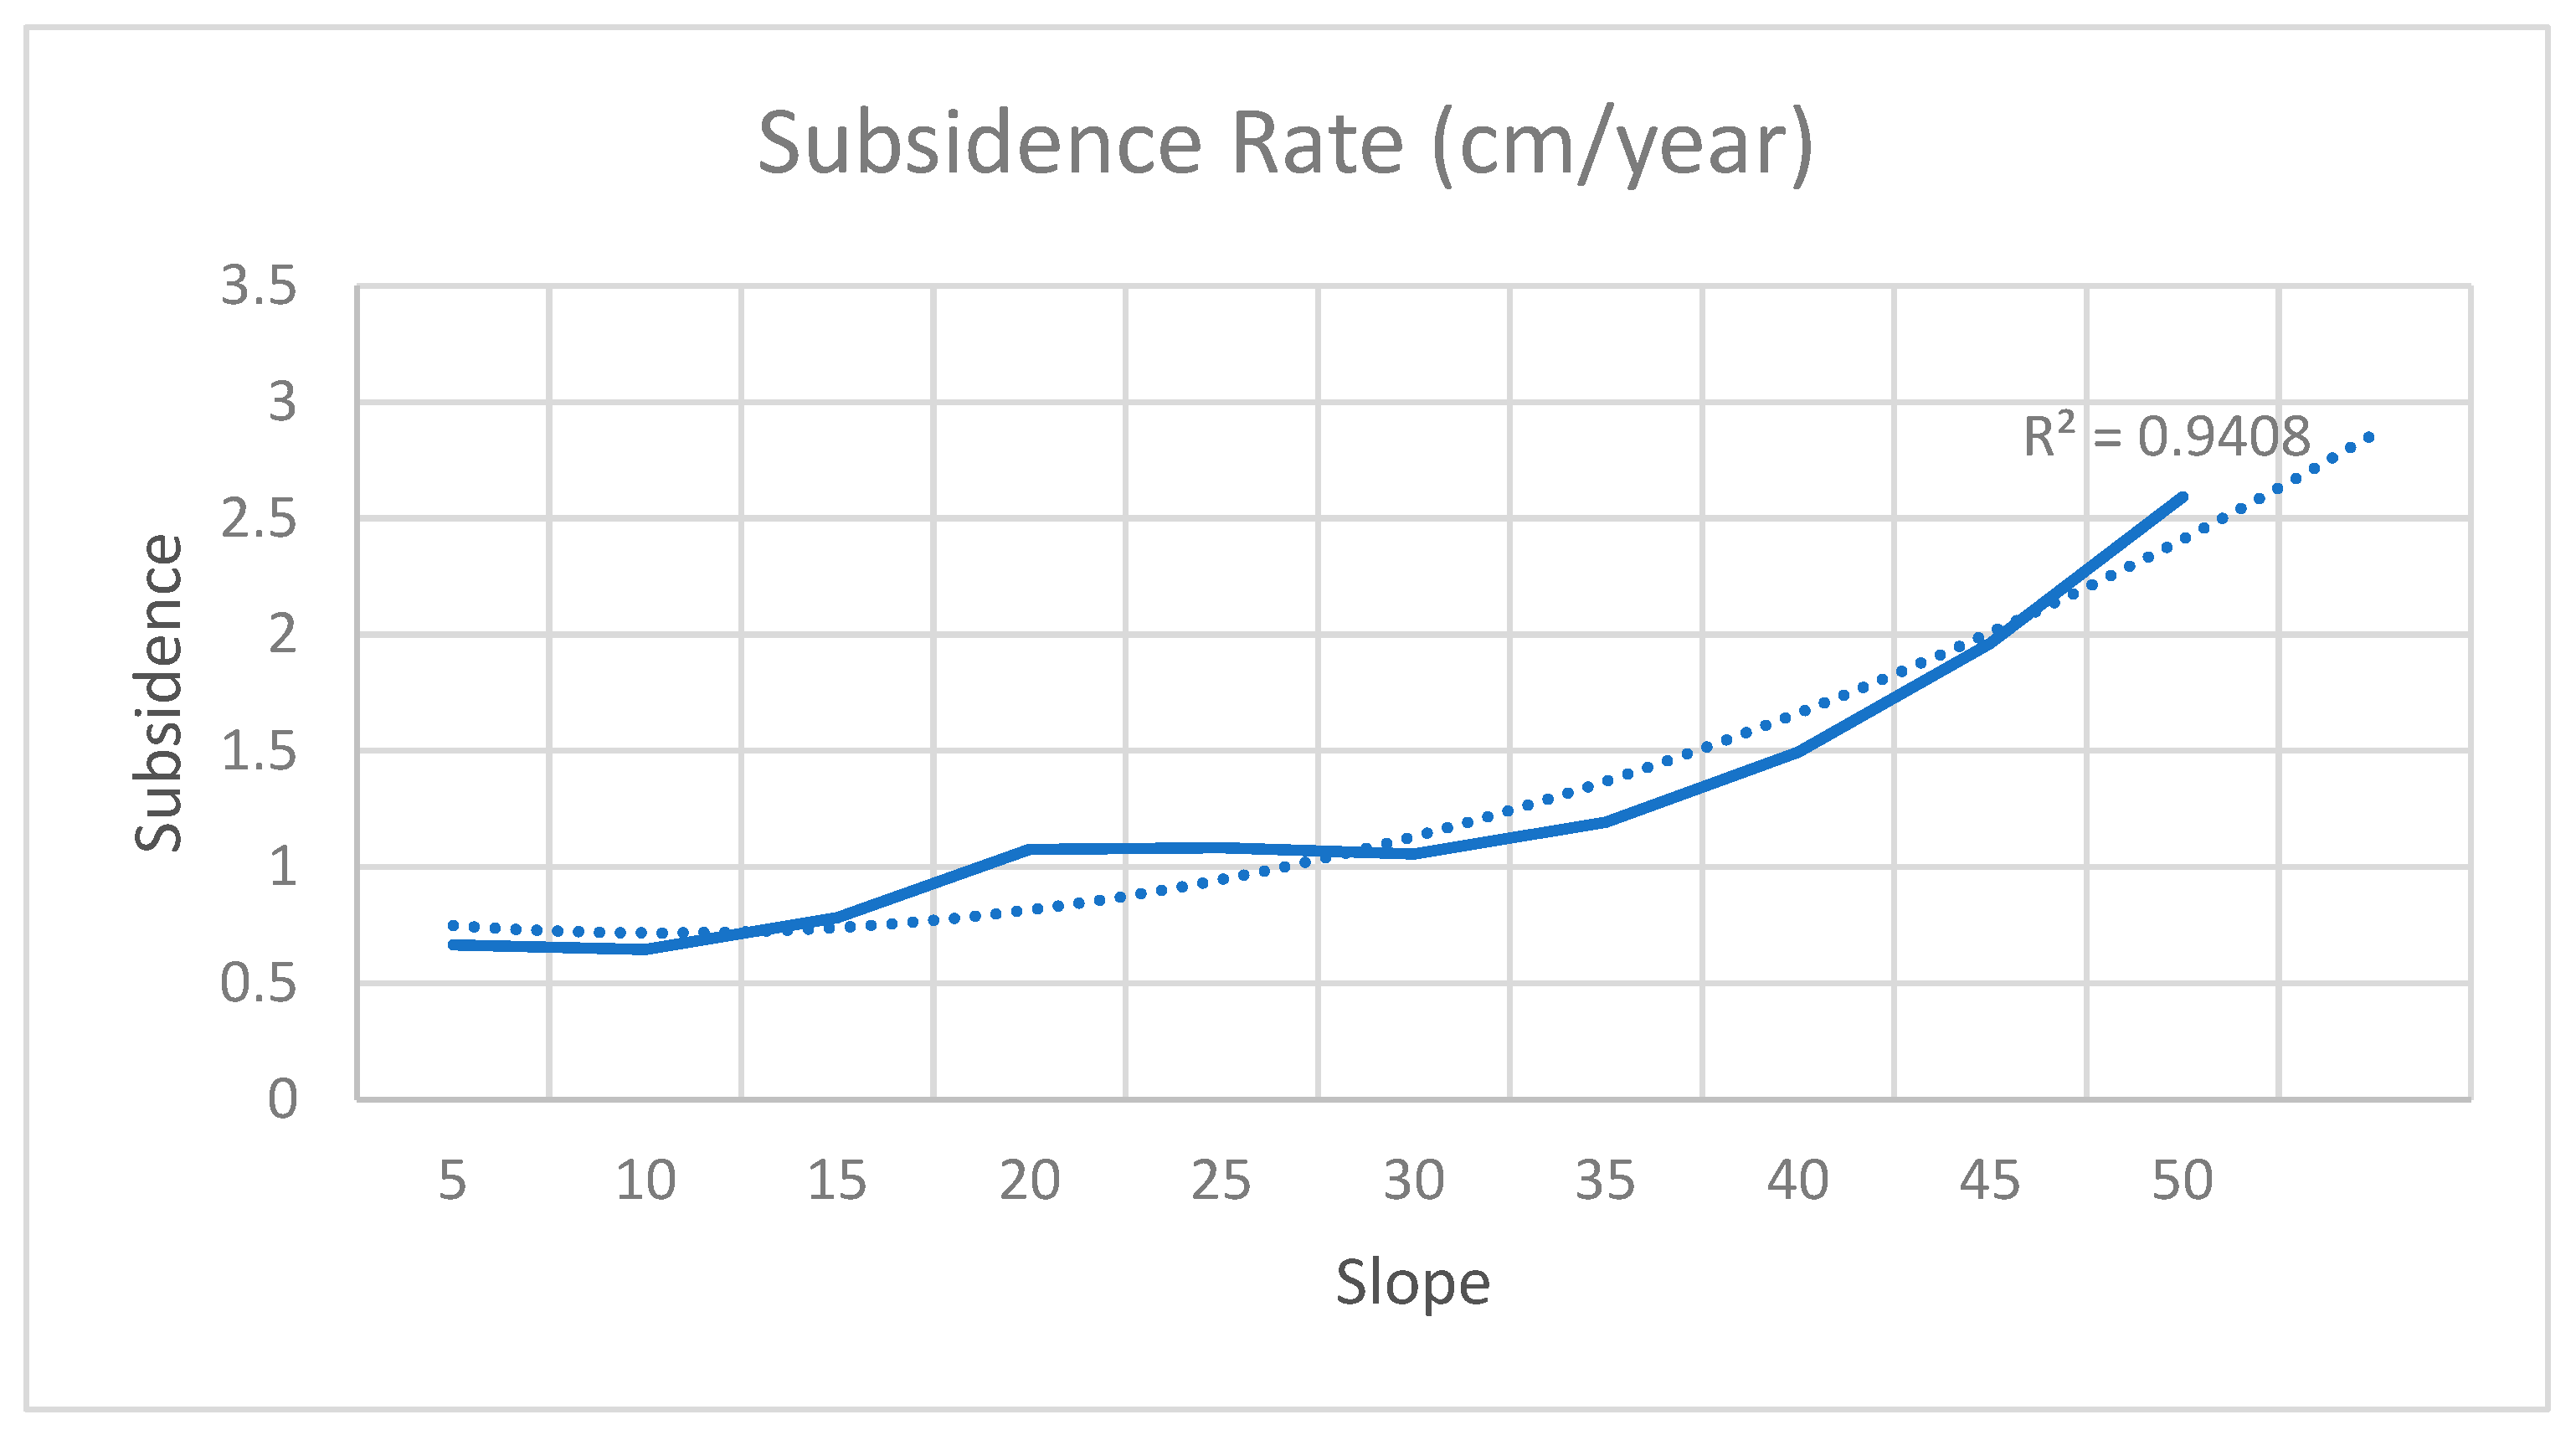
Table 1.
Slope-based land subsidence risk classification showing predicted subsidence rates estimated from the regression model.
Table 1.
Slope-based land subsidence risk classification showing predicted subsidence rates estimated from the regression model.
| Risk Level | Slope Range (°) | Predicted Subsidence (cm/year) |
|---|---|---|
| Low | 0–20 | ≤ 1.0 |
| Moderate | 21–35 | 1.0 – 1.8 |
| High | ≥ 36 | ≥ 1.8 |
Disclaimer/Publisher’s Note: The statements, opinions and data contained in all publications are solely those of the individual author(s) and contributor(s) and not of MDPI and/or the editor(s). MDPI and/or the editor(s) disclaim responsibility for any injury to people or property resulting from any ideas, methods, instructions or products referred to in the content. |
© 2026 by the authors. Licensee MDPI, Basel, Switzerland. This article is an open access article distributed under the terms and conditions of the Creative Commons Attribution (CC BY) license (http://creativecommons.org/licenses/by/4.0/).
Copyright: This open access article is published under a Creative Commons CC BY 4.0 license, which permit the free download, distribution, and reuse, provided that the author and preprint are cited in any reuse.


