
Submitted:
13 January 2026
Posted:
13 January 2026
You are already at the latest version
Abstract
Manual assembly of multi-pin cable harnesses remains vulnerable to miswiring when conductors are visually indistinguishable. This paper presents an industrial case study of a quick-connect harness composed of two connectors (receptacle-type and pin-type) linked by 16 black conductors (2.5 mm²; 200 mm length), where the dominant failure mode is a two-wire swap that breaks correct pin-to-pin mapping and may cause downstream equipment damage. In the baseline state, end-of-line verification relied on visual inspection only (1 min/unit), resulting in an internal nonconformity rate of 4% (repairable). To achieve the operational goal of zero defects (zero escapes), we propose and integrate an electronic pin-to-pin continuity and mapping fixture as a deterministic End-of-Line (EOL) quality gate implementing poka-yoke logic (“no PASS—no shipment”) and enabling structured traceability records. Using a before–after workload model that includes mandatory retest after rework, the fixture reduces test time to 0.33 min/unit. For a monthly volume of 1500 units, total quality workload (test + rework + retest) decreases from 31 h/month to 13.58 h/month, releasing 17.42 h/month. Global quality productivity increases from 48.39 units/h to 110.46 units/h (+128%). The proposed architecture couples deterministic electrical verification with data logging aligned to digital thread and data-driven quality management concepts to sustain continuous improvement and prevent customer escapes.
Keywords:
smart manufacturing
; wire harness
; multi-pin connector
; 100% continuity testing
; pin-to-pin mapping
; miswire diagnosis
; poka-yoke
; traceability
; productivity
; zero defects
1. Introduction
Smart manufacturing aims to improve operational performance by reducing process variability through standardization, connectivity, and data-driven control. In this context, the concept of digital threading continuity and integration of product and process information across lifecycle stages—has gained significant attention as a foundation for traceability, systematic quality improvement, and closed-loop decision-making. Recent studies emphasize both the definitional consolidation of digital thread concepts and the practical challenges of implementation, such as data integration across heterogeneous systems and ensuring actionable continuity of information from design to manufacturing and operations [5,6].
Despite ongoing advances in automation, many industrial assembly environments remain strongly dependent on manual work. As a result, human error continues to be a key contributor to quality losses, especially in repetitive or cognitively demanding assembly tasks. Empirical research in complex manual assembly has shown that manufacturing systems are sensitive to human reliability factors, and that error mitigation often requires structured interventions—improved work instructions, systematic feedback, and objective verification at critical steps [2]. These findings reinforce the need to strengthen quality assurance in manual or semi-manual operations by reducing reliance on subjective judgment and increasing the repeatability of inspection and control.
A widely adopted principle for robust production systems is mistake-proofing (poka-yoke), which focuses on preventing errors or making them immediately detectable at the point of occurrence. In smart production settings, poka-yoke has been combined with operator guidance systems (e.g., pick-to-light) to reduce picking/assembly errors while improving operational efficiency and accuracy [1]. In addition, poka-yoke can be implemented not only at the workstation level but also as a process gate (shipment gating), where defective products are systematically blocked from moving downstream until corrected and re-verified.
This paper addresses an industrial case involving a quick-connect electrical harness consisting of two main connectors (a receptacle-type connector and a pin-type connector) linked by 16 conductors, each with 2.5 mm² cross-section and 200 mm length, with crimped terminals at both ends. The manufacturing route includes procurement and incoming inspection, cable cutting to length, crimping, intermediate checks, connector assembly, and final inspection prior to packing and shipment. A critical product characteristic is that all conductors are black, which makes visual confirmation of the correct pin-to-pin wiring map unreliable without auxiliary marking or measurement. Under these constraints, visual inspection may confirm gross completeness but cannot robustly validate correct circuit mapping.
The dominant nonconformity observed in production is a miswire (swap) of two conductors among the 16 circuits, leading to an incorrect connector-to-connector mapping. In the baseline condition, quality control relied on visual inspection only (mean inspection time 1 min/unit) and the internal nonconformity occurrence rate was 4%.
In quality management terms (ISO 9001 / nonconformity management), the “internal nonconformity occurrence rate” is usually expressed as a percentage representing the share of nonconformities detected internally relative to the relevant total volume checked/produced within the same period.
General formula (percentage):
where:
= number of nonconformities detected internally (in production, quality control, internal audit, etc.)
= total number of units/lots/operations/records inspected or deliverables produced (the reporting base must be clearly defined)
If the rate was 4%, the equivalent relationship is:
For such wiring-map defects, automated verification is often preferred because it directly tests the electrical topology rather than inferring correctness from visual cues. Research on the automation of electrical cable harness testing discusses the feasibility of automated harness testing and highlights strategies to improve adaptability and scalability, including modular hardware/software concepts suitable for broad product ranges [3]. Complementarily, data-driven approaches have also been explored, including AI-based fault detection methods intended to improve quality-control effectiveness in wiring harness manufacturing contexts [4].
Motivated by these directions, this paper proposes a data-centric architecture that integrates an electronic test fixture into the production flow as a mandatory gate prior to packing. The fixture performs 100% continuity testing and reconstructs the complete pin-to-pin connectivity map, enabling deterministic classification of actionable fault categories: open circuits, short/bridging faults, and miswires (swaps). The system outputs standardized diagnostics to guide rework and retest, and logs test outcomes (unit/lot ID, timestamp, PASS/FAIL, defect type, affected positions) to support traceability and continuous improvement in line with digital thread principles [5,6].
A core operational objective of the proposed architecture is zero customer defects, achieved not by assuming error elimination at the source, but by enforcing a poka-yoke shipment rule: no unit may proceed to packing without a PASS result. Units that fail are routed to rework and must be retested until they pass. This form of error-proofing is consistent with broader industrial implementations of sequencing and verification systems that strengthen real-time traceability and prevent process deviations from propagating downstream; for instance, RFID-based sequencing-error-proofing solutions have been reported to improve visibility and control in manufacturing logistics [7]. Beyond quality protection, the proposed fixture reduces test time to 0.33 min/unit, increasing inspection throughput and reducing total QC-plus-rework time at a monthly volume of 1500 units.
The contributions of this work are fourfold: (i) an industrially deployable fixture-based method for automated pin-to-pin verification of multi-circuit harnesses with visually indistinguishable conductors; (ii) a deterministic diagnosis workflow for miswire detection supporting rapid, standardized rework; (iii) a traceability-oriented data model aligned with digital thread concepts; and (iv) an operational analysis demonstrating productivity gains while supporting the goal of zero customer defects through a poka-yoke shipment gate.
The remainder of this paper is organized as follows. Section 2 details the manufacturing context, the fixture architecture, and the pin-to-pin mapping method. Section 3 highlights the methodology and test logic. Section 4 presents the operational calculations and productivity analysis. Section 5 discusses implementation considerations and limitations. Section 6 concludes the paper and outlines future enhancements.
2. Materials and Methods
2.1. Industrial Context and Product Description
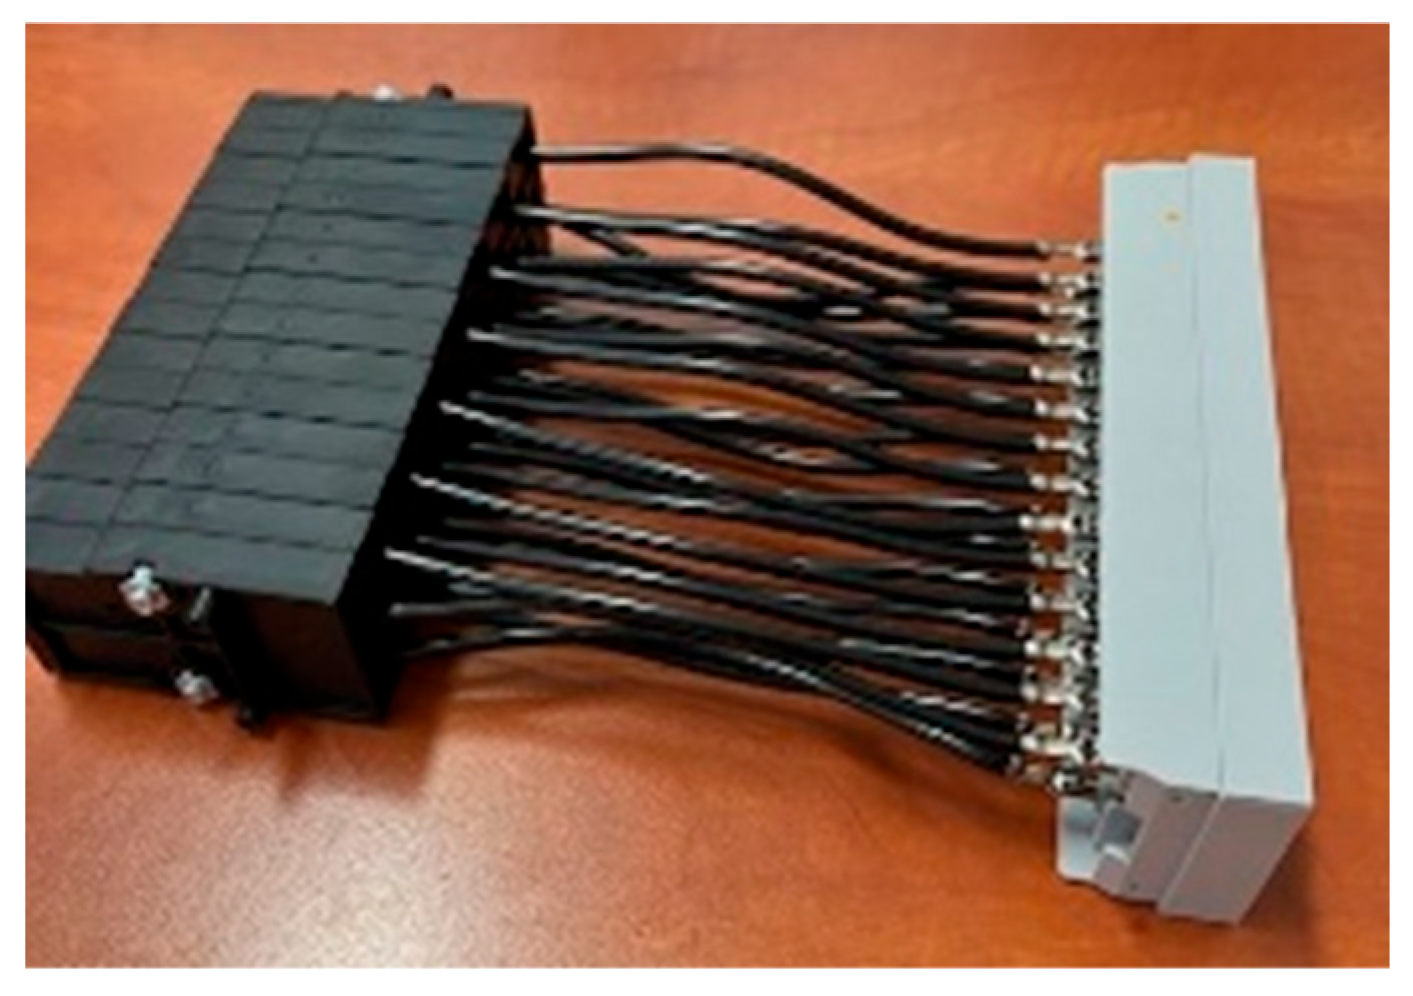
This research is grounded in an industrial production setting manufacturing a quick-connect cable harness intended for industrial equipment. The product consists of two main connectors—a receptacle-type connector (“female”) and a pin-type connector (“male”)—interconnected by 16 individual conductors assembled into a compact harness. Each conductor has a 2.5 mm² cross-section and a nominal length of 200 mm. All conductors are black, eliminating color-based discrimination and increasing the risk of wiring swaps during assembly.
Each conductor is terminated at both ends by a crimped contact that is inserted into the connector cavities according to a specified pin-to-pin mapping. The critical-to-quality (CTQ) characteristic is the mapping correctness (topology) rather than the mechanical presence of terminals alone. A two-wire swap among the 16 circuits constitutes the dominant defect mechanism and can lead to functional nonconformity, equipment malfunction, or potential damage depending on the downstream application. The product configuration and its susceptibility to human error are consistent with findings in complex manual assembly, where similarity and repetition increase the likelihood of selection/insertion errors [2].
Figure 1.
Electrical connection for quick plug.
In terms of manufacturing inputs, the typical bill of materials includes: (i) two connector housings (female and male); (ii) 32 terminals/contacts (two per conductor); (iii) 16 cable segments; and (iv) auxiliary items for packing and labeling. Manufacturing resources include cutting equipment, crimping tools (manual or semi-automatic), insertion tools (if applicable), and work instructions defining the nominal pin map and assembly sequence.
2.2. Process Route and Baseline Inspection
The end-to-end process route follows a conventional multi-stage manufacturing flow: customer request/quantity definition; quotation; procurement from suppliers; raw material storage; incoming inspection; cable cutting to 200 mm; length verification; crimping; crimp inspection; component staging; harness assembly; end-of-line verification; packing; and shipment (Figure 2). The route includes at least three quality-relevant control points: incoming inspection, in-process checks (length and crimp), and final verification.
Figure 2.
Process flow before device implantation.
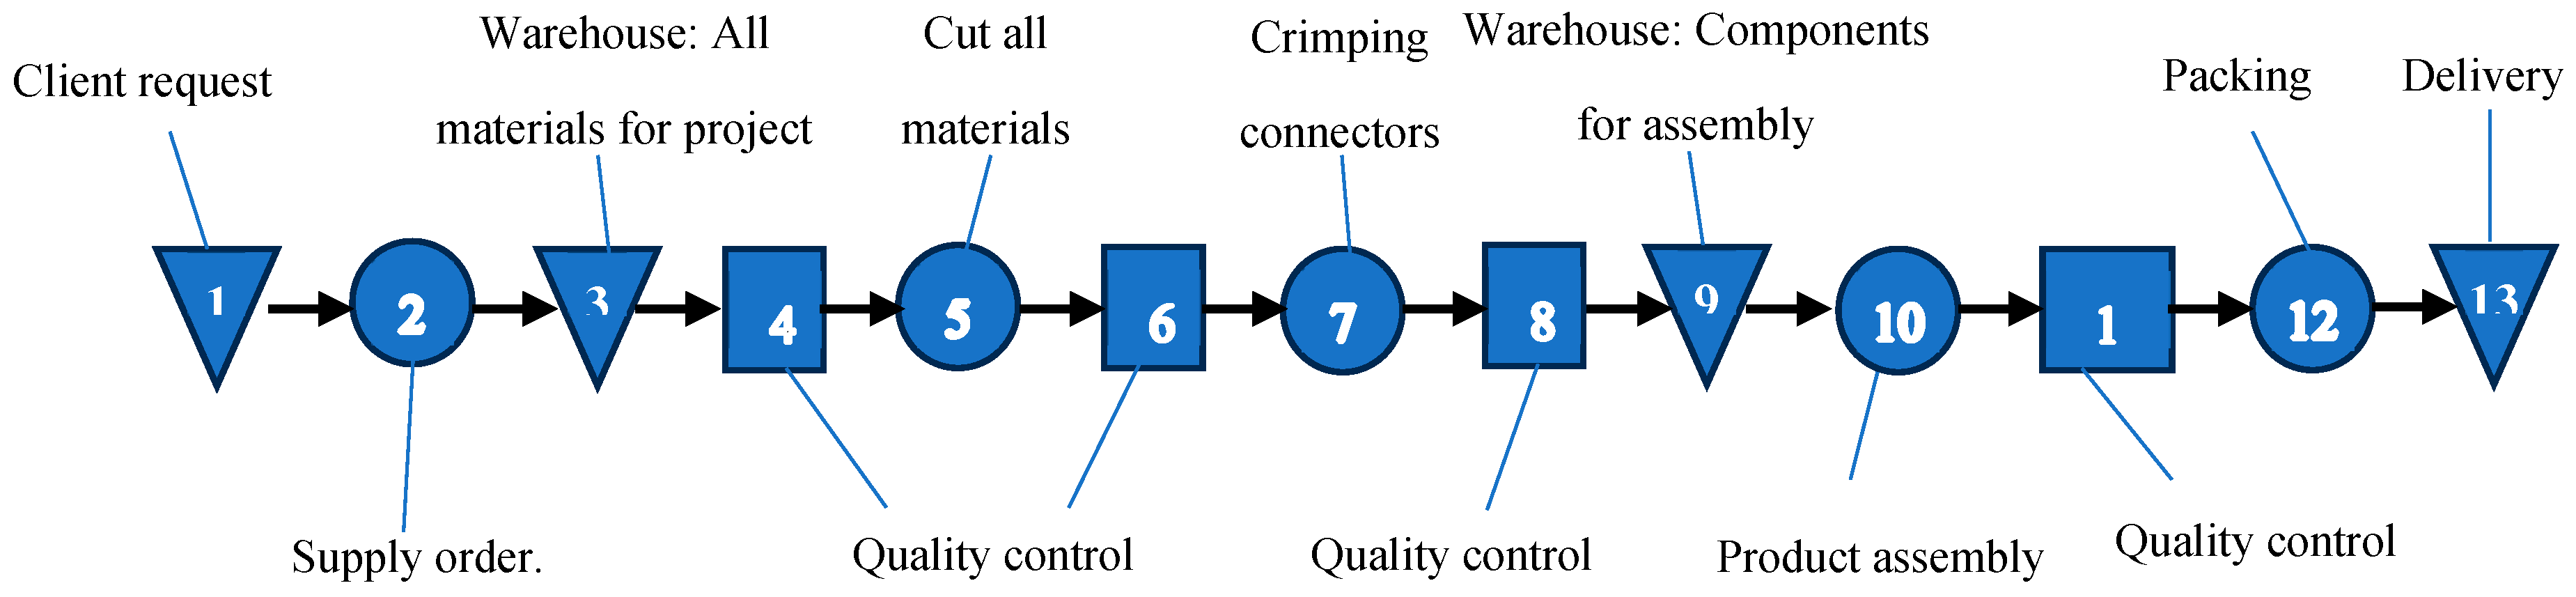
The final verification stage is critical because upstream inspections do not guarantee pin-to-pin mapping correctness. For example, correct cable length and acceptable crimp geometry do not prevent a conductor from being inserted into the wrong cavity. In multi-stage manufacturing systems, such hidden defects can propagate unless explicitly captured at a properly designed quality gate [12].
Baseline EOL inspection was visual only (no multimeter), with mean test time 1 min/unit. The internal nonconformity rate was 4%, and defects were repairable. Because the dominant defect is miswire (two-wire swap) in visually identical conductors, visual inspection provides limited detection capability; strengthening the EOL gate is consistent with multi-stage quality control literature. [8,12]
2.3. Proposed Solution: 100% Electronic Continuity and Mapping Test Fixture (EOL Poka-Yoke)
To achieve the operational goal of zero customer escapes, the proposed intervention is an electronic EOL test fixture performing 100% continuity testing and pin-to-pin mapping verification for all 16 circuits. The fixture is positioned immediately after assembly and before packing, establishing a deterministic EOL quality gate (Figure 3).
The gate is implemented via a poka-yoke rule: “no PASS—no shipment.” Under this rule, any unit failing the mapping test is blocked from packing/shipment and routed to rework, followed by mandatory retest until PASS. Such mistake-proofing logic is consistent with poka-yoke principles emphasizing immediate detection and prevention of defect flow to the customer [13,14]. In addition, formalization of EOL decision-making is aligned with quality gate and virtual quality gate approaches used to prevent defect propagation in multi-stage systems [8,12].
In this work, the acceptance decision is topology-based: the fixture validates that every pin on connector A maps to the correct pin on connector B, and that no opens/shorts are present. Resistance thresholds are not used as acceptance criteria in this version, because the dominant defect risk is miswire topology rather than contact degradation.
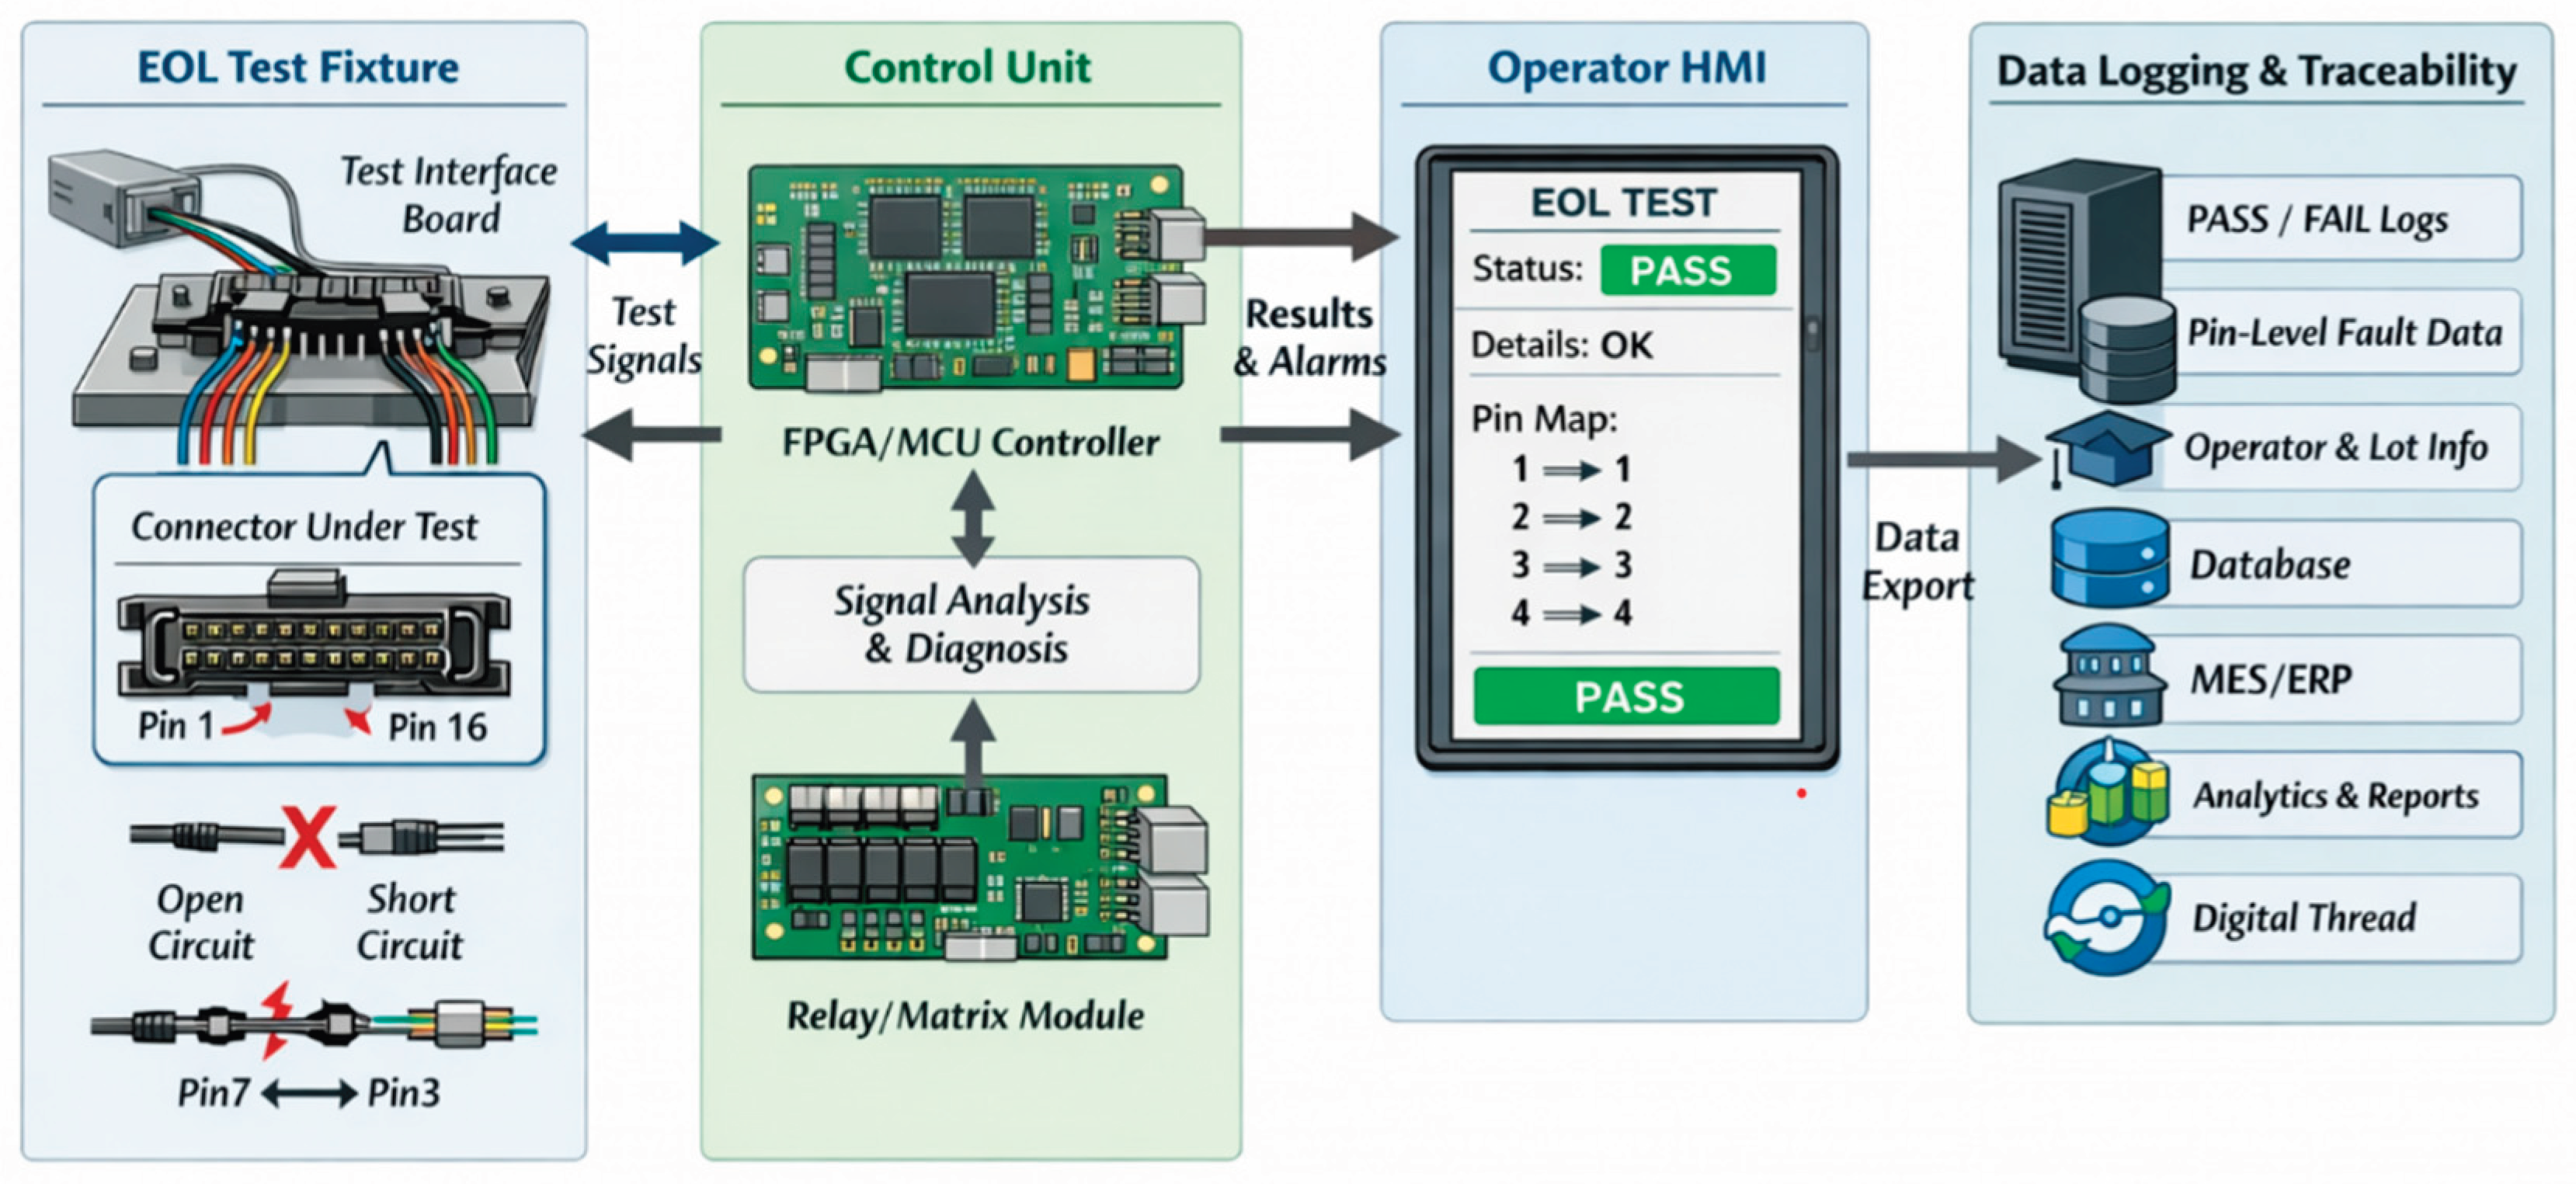
2.4. Data-Centric Architecture and Process Integration
A key design aspect is that the fixture is not only a test device but also a data source for quality management. Each unit tested generates a structured record containing, at minimum: (i) unit or lot identifier; (ii) timestamp; (iii) PASS/FAIL verdict; (iv) defect class (open/short/miswire); (v) pin-level diagnosis (e.g., swapped cavities/pins); and (vi) rework/retest cycle count. This data model supports traceability and continuous improvement.
The approach is consistent with digital thread concepts, where product and process data are linked across lifecycle stages to enhance decision-making and root-cause analysis [5,11]. It also aligns with data-driven quality management approaches in multi-stage manufacturing, where structured inspection data enable actionable analytics and prioritization [10]. In industrial deployment, these data can be exported to a local database, a manufacturing execution system (MES), or enterprise resource planning (ERP) systems to enable lot-level reporting and auditability.
2.5. Evaluation Design, Metrics, and Assumptions
A before–after evaluation was conducted using a monthly workload model based on: N = 1500 units/month, baseline internal nonconformity rate p0 = 4%, baseline test time ttest,0 = 1 min/unit, rework time trw = 5 min/defective unit, and post-implementation test time ttest,1 = 0.33 min/unit. Retest after rework is mandatory in both scenarios to ensure shipment of conforming products.
The model focuses on operationally relevant indicators: (i) total monthly QC workload (test + rework + retest time); (ii) global QC productivity computed over total QC workload; (iii) released time/capacity; and (iv) customer escapes targeted to zero via enforced EOL gate logic.
The internal nonconformity rate p0 is treated as an occurrence rate that may not immediately change due to the gate itself; however, the gate prevents shipment of nonconforming units. This interpretation is consistent with quality-gate literature, which differentiates internal defect occurrence from outgoing quality (escape rate) [8,12]. In subsequent continuous improvement cycles, the logged data are expected to support upstream preventive actions that reduce the internal occurrence rate over time [10].
3. Methodology and Test Logic
3.1. System Overview
The verification system includes:
a mechanical fixture enabling repeatable mating to both connectors;
an electronic addressing layer (e.g., switching/multiplexing);
a continuity and mapping evaluation module;
HMI feedback (PASS/FAIL + fault guidance);
data logging for traceability and improvement.
3.2. Acceptance Criterion (No Resistance Thresholds in the PASS/FAIL Verdict)
Given that the dominant risk is a topological error (miswire/swap), the PASS/FAIL verdict is based strictly on:
continuity for all circuits,
absence of short/bridging faults,
conformance of measured mapping to the nominal mapping.
3.3. Pin-to-Pin Mapping Model and Fault Taxonomy
Let connector A pins be and connector B pins be . The fixture constructs a connectivity matrix :
Conformance is achieved when each row and column contains exactly one “1” and the mapping equals the nominal mapping . Fault classes:
Miswire/swap: bijective mapping differs from nominal (swap pins reported)
3.4. Scan and Decision Procedure (Deterministic Miswire Diagnosis)
Scan: address each on connector A and test continuity against each on connector B to populate C
Decision:
open detected → FAIL
short/bridging detected → FAIL
else mapping equals nominal → PASS; otherwise → FAIL with explicit swap diagnosis
FAIL → rework + mandatory retest until PASS
3.5. Traceability Record Structure (Data-Centric Element)
For each tested unit, the system stores:
unit ID / lot ID, timestamp;
PASS/FAIL;
defect class (open/short/miswire);
affected pins (e.g., swapped indices);
number of rework/retest cycles;
optional station/operator identifier.
3.6. Practical Considerations
Fixture wear and mating stability: periodic inspection and replacement are required to prevent intermittent contact effects. Standards and methods exist to support contact resistance characterization if introduced. [17,18]
Upstream workmanship criteria: the EOL gate complements—rather than replaces—workmanship/acceptance practices for harness assemblies (e.g., IPC/WHMA-A-620). [16]
Scalability: higher pin counts increase scan complexity; modular architectures support adaptation, as recommended in harness testing automation research. [3]
Figure 4.
Data-centric architecture of the electronic test fixture (fixture + control unit + HMI + data logging/traceability).
Figure 4.
Data-centric architecture of the electronic test fixture (fixture + control unit + HMI + data logging/traceability).
4. Results
4.1. Quality Impact: Enforcing Zero Customer Defects (Zero Escapes)
Visual-only inspection has limited capability to confirm correct pin-to-pin mapping when conductors are indistinguishable. The proposed system enforces a poka-yoke EOL rule (“no PASS—no shipment”), which eliminates customer escapes by preventing shipment of miswired units. This aligns with quality gate principles [8,12] and mistake-proofing literature. [13,14]
4.2. Workload Recalculation (Test + Rework + Retest)
Monthly defective units:
Before implementation (visual test + rework + visual retest):
After implementation (fixture test + rework + fixture retest):
Time released:
These results are coherent with multi-stage quality control literature, where strengthening EOL verification reduces total quality workload and prevents downstream propagation. [8,12]
Table 1 summarizes the input parameters and derived monthly indicators used to quantify the before–after impact of replacing visual EOL inspection with a deterministic electrical test fixture. In repetitive manual assembly, perceptual checking of high-similarity components is susceptible to human error and inter-operator variability; therefore, converting inspection into an objective functional gate is a recognized mitigation strategy.
Quality-gate and virtual-quality-gate literature highlights that robust end-of-line gates can achieve zero customer escapes by blocking shipment until conformance, even when internal defects remain repairable. The selected time parameters (test, rework, and mandatory retest) are consistent with prior work on automated cable-harness testing systems that detect opens, shorts, and incorrect pinning/miswires while reducing test time through dedicated fixtures/testers. Finally, the table supports a data-centric perspective: structured EOL logging enables traceability and continuous improvement aligned with digital-thread concepts and data-driven quality management.
4.3. Productivity Improvement
4.3.1. Test-Station Throughput
4.3.2. Global Quality Productivity (Test + Rework + Retest)
Relative gain:
5. Discussion: Human Factors and Data Value
The proposed EOL fixture substantially reduces reliance on perceptual discrimination in a high-similarity assembly context (all-black conductors). In the baseline workflow, the operator’s final judgment depended on visual checking and cognitive verification of a wiring order that is not directly observable once conductors are routed and inserted. Such tasks are known to be susceptible to attention lapses, working-memory overload, and confirmation bias, particularly under repetitive work, time pressure, or frequent changeovers. By converting the verification step from a subjective visual assessment into a deterministic functional check, the fixture decreases the probability that a miswire will remain undetected and reduces inter-operator variability. This is consistent with human reliability findings in complex manual assembly, where standardization and objective feedback mechanisms reduce error occurrence and improve inspection consistency. [2]
From a human factors standpoint, the fixture also enables immediate, actionable feedback. Instead of a generic “fail” condition, the system can indicate the fault class (open/short/miswire) and, for miswires, provide pin-level localization. This changes the operator’s task from searching for an error in an ambiguous condition to performing a guided correction with lower cognitive burden. Over time, this can support learning effects and more stable performance across shifts, because the operator receives consistent feedback and the process becomes less dependent on tacit experience. In practice, such feedback loops are a key mechanism for reducing the probability of repeated errors in manual assembly settings. [2]
From a data perspective, architecture’s value is not limited to gatekeeping. The structured logging of PASS/FAIL outcomes together with fault classes, affected pin indices, timestamps, and rework cycles creates a minimal but high-leverage dataset for continuous improvement. In a digital-thread-oriented perspective, these records can be linked to batch/lot information, work orders, material traceability (connectors, terminals), and station/operator identifiers, thereby creating an auditable chain of evidence for each shipped unit and supporting root-cause analysis when anomalies arise. Such linkage is aligned with digital thread concepts emphasizing lifecycle continuity of product and process information. [5,11] Furthermore, the systematic collection of inspection and rework data enables a data-driven quality management approach by supporting KPI tracking (e.g., first-pass yield, rework rate, retest cycles), defect Pareto analyses (e.g., recurring swapped pin pairs), and targeted interventions (training, work instruction changes, fixture maintenance strategies). These practices are consistent with data-centric quality management approaches in multi-stage manufacturing. [10]
In addition, the logged dataset provides a practical foundation for more advanced analytics if pursued in future work. For example, time-series monitoring can identify drift in failure patterns (e.g., increasing open-circuit occurrences linked to tooling wear in crimping). More sophisticated approaches could combine EOL test results with upstream process signals (crimp parameters, operator sequence, changeover events) to predict risk and recommend preventive actions. Recent research on AI-assisted fault detection in wiring harness manufacturing suggests that machine learning can be used to improve fault identification and decision support, provided that sufficiently structured data are available. In this context, the proposed logging strategy becomes a prerequisite for scaling toward AI-supported quality control, while maintaining deterministic EOL acceptance criteria for shipment decisions. [4]
5. Conclusions and Future Work
5.1. Conclusions
This study proposed and validated a data-centric end-of-line (EOL) architecture for smart cable harness assembly that combines 100% electrical continuity testing, deterministic pin-to-pin mapping verification, and explicit miswire diagnosis for a 16-circuit industrial quick-connect harness with visually indistinguishable conductors. The core contribution is the translation of an error-prone, perception-based final check into a deterministic functional quality gate that enforces the operational rule “no PASS—no shipment.” In line with quality-gate and virtual-quality-gate concepts, the EOL gate prevents downstream propagation and supports the target of zero customer escapes, even when internal repairable defects still occur. [8,12]
From a quality-engineering standpoint, the proposed method directly addresses the dominant failure mode—two-wire swaps (miswire)—which is difficult to detect visually when all conductors share the same color and geometry. By computing and validating the connectivity topology rather than relying on visual confirmation, the fixture provides a repeatable and auditable PASS/FAIL decision. This approach is consistent with harness test automation literature reporting successful detection of incorrect pinning and electrical faults through dedicated test systems. [3,9]
Operationally, the study quantified the impact using a before–after workload model with mandatory retest after rework. With units/month, , min/unit, min/defect, and min/unit, total quality workload (test + rework + retest) decreased from 31 h/month to 13.58 h/month, releasing 17.42 h/month. This corresponds to a ~56% reduction in monthly quality workload. In parallel, global quality productivity increased from 48.39 units/h to 110.46 units/h (+128%). These results substantiate that a deterministic EOL verification strategy can simultaneously strengthen outgoing quality and improve capacity utilization, consistent with the broader rationale of quality-gate placement in multi-stage manufacturing systems. [8,12]
Beyond verification, a key outcome is the data-centric nature of the proposed solution. By logging test outcomes (PASS/FAIL), fault class (open/short/miswire), and pin-level localization, the architecture creates a minimal but high-value dataset for process learning. This enables evidence-based actions such as Pareto analysis of recurring swap pairs, station-level comparison, and monitoring of rework loops. Such logging is consistent with data-driven quality management perspectives and supports traceability aligned with digital thread concepts. [5,10,11]
Finally, the study clarifies the meaning of “zero defects” as zero shipped defects (zero escapes) achieved through the EOL gate logic rather than the elimination of internal defect occurrence. This distinction is critical for correct interpretation and aligns with the role of quality gates in preventing defect propagation. [8,12]
5.2. Future Work
Future work can extend both the technical scope and the manufacturing-system integration of the proposed architecture:
MES/ERP integration and stronger digital thread linkage. Implement automated association between test records and work orders, material lots (connectors, terminals, cable batches), station IDs, and operator IDs. This would transform the current local log into an enterprise traceability asset and strengthen lifecycle continuity in line with digital thread definitions and frameworks. [5,11]
Statistical process monitoring and structured continuous improvement. Use the logged dataset for systematic monitoring of first-pass yield, rework cycles, defect Pareto (swap pairs), and time-based trends. This enables targeted interventions (training, work instruction refinement, fixture maintenance, upstream process controls) and aligns with data-driven quality management approaches for multi-stage manufacturing. [10]
Optional electrical metrics beyond continuity (process indicators). While acceptance is continuity/topology-based in this study, future variants could record contact/loop resistance values for condition monitoring (e.g., early indication of crimp degradation, connector wear). If resistance thresholds become a customer requirement, standardized methods such as IEC 60512-2-1 and MIL-STD-202 Method 307 provide guidance for contact resistance measurement. [17,18]
Scalability to higher pin counts and multiple harness variants. Develop modular hardware/software addressing strategies, barcode/QR-driven variant recognition, and configurable mapping tables to support multi-product lines. This direction follows recommendations in harness testing automation literature emphasizing adaptability and modularization. [3,9]
AI-assisted analytics for defect prevention (beyond EOL detection). Use historical EOL data to predict risk patterns (e.g., specific swap pairs correlating with particular shifts, changeovers, or upstream tooling states) and to recommend preventive actions. Recent research suggests that AI-based fault detection is feasible in harness manufacturing when structured datasets are available, making the proposed logging strategy a practical foundation for advanced analytics. [4]
Human factors and workstation design improvements. Complement EOL detection with upstream error-prevention measures (operator guidance, improved work instructions, kitting strategies, or pick-to-light support), aiming to reduce internal defect occurrence while maintaining zero escapes through the EOL gate. The rationale is consistent with mistake-proofing principles that emphasize prevention and rapid detection. [1,13,14]
Author Contributions
Conceptualization, D.F. and L.F.; methodology, D.F. and L.F.; qualitative analysis, M.C.A. and C.U.; validation, M.C.A. and C.U.; resources, L.F. and A.I.P.; data curation, D.F. and A.I.P; writing —original draft preparation, D.F.; writing—review and editing, D.F., C.U.. and L.F.; visualization, A.I.P. and M.C.A. All authors have read and agreed to the published version of the manuscript.
Funding
This research received no external funding.
Data Availability Statement
The original contributions presented in this study are included in the article. Further inquiries can be directed to the corresponding author.
Conflicts of Interest
The authors declare no conflicts of interest.
Abbreviations
The following abbreviations are used in this manuscript:
| AI | Artificial Intelligence |
| EOL | End-of-Line |
| ERP | Enterprise Resource Planning |
| HMI | Human–Machine Interface |
| ID | Identifier |
| KPI | Key Performance Indicator |
| MES | Manufacturing Execution System |
| QC | Quality Control |
| RFID | Radio-Frequency Identification |
References
- Trojanowska, J.; Husár, J.; Hrehova, S.; Knapčíková, L. Poka Yoke in Smart Production Systems with Pick-to-Light Implementation to Increase Efficiency. Appl. Sci. 2023, 13, 11715. [Google Scholar]
- Torres, Y.; Nadeau, S.; Landau, K. Classification and Quantification of Human Error in Manufacturing: A Case Study in Complex Manual Assembly. Appl. Sci. 2021, 11, 749. [Google Scholar] [CrossRef]
- Bi, Z.; Pomalaza-Ráez, C.; Hershberger, D.; Dawson, J.; Lehman, A.; Yurek, J.; Ball, J. Automation of Electrical Cable Harnesses Testing. Robotics 2018, 7, 1. [Google Scholar] [CrossRef]
- Song, J.; Kumar, P.; Kim, Y.; Kim, H.S. A Fault Detection System for Wiring Harness Manufacturing Using Artificial Intelligence. Mathematics 2024, 12, 537. [Google Scholar] [CrossRef]
- Zhang, Q.; Liu, J.; Chen, X. A Literature Review of the Digital Thread: Definition, Key Technologies, and Applications. Systems 2024, 12, 70. [Google Scholar] [CrossRef]
- Pang, T.Y.; Pelaez Restrepo, J.D.; Cheng, C.-T.; Yasin, A.; Lim, H.; Miletic, M. Developing a Digital Twin and Digital Thread Framework for an ‘Industry 4.0’ Shipyard. Appl. Sci. 2021, 11, 1097. [Google Scholar] [CrossRef]
- Kang, Y.-S.; Kim, H.; Lee, Y.-H. Implementation of an RFID-Based Sequencing-Error-Proofing System for Automotive Manufacturing Logistics. Appl. Sci. 2018, 8, 109. [Google Scholar] [CrossRef]
- Filz, M.-A.; Gellrich, S.; Turetskyy, A.; Wessel, J.; Herrmann, C.; Thiede, S. Virtual Quality Gates in Manufacturing Systems: Framework, Implementation and Potential. J. Manuf. Mater. Process. 2020, 4, 106. [Google Scholar] [CrossRef]
- Khouri, P.M.P.; Walsh, M.J.; Brandl, C.; Rybachuk, M. Design and Automation of Electrical Cable Harnesses Testing System. Microelectronics Reliability 2021, 120, 114097. [Google Scholar] [CrossRef]
- Filz, M.-A.; Bosse, J.P.; Herrmann, C. Digitalization Platform for Data-Driven Quality Management in Multi-Stage Manufacturing Systems. Journal of Intelligent Manufacturing 2024. [Google Scholar] [CrossRef]
- Abdel-Aty, T.A.; Negri, E. Conceptualizing the Digital Thread for Smart Manufacturing: A Systematic Literature Review. Journal of Intelligent Manufacturing 2024. [Google Scholar] [CrossRef]
- Shetwan, A.G.; Vitanov, V.I.; Tjahjono, B. Allocation of Quality Control Stations in Multistage Manufacturing Systems. Computers & Industrial Engineering 2011, 60, 473–484. [Google Scholar] [CrossRef]
- Grout, J.R. Mistake Proofing: Changing Designs to Reduce Error. Qual. Saf. Health Care 2006, 15 (Suppl 1), i44–i49. [Google Scholar]
- Stewart, D.M.; Grout, J.R. The Human Side of Mistake-Proofing. Production and Operations Management 2001, 10, 440–459. [Google Scholar]
- Antonelli, D.; Stadnicka, D. Classification and Efficiency Estimation of Mistake Proofing Solutions by Fuzzy Inference. IFAC-PapersOnLine 2016, 49, 1134–1139. [Google Scholar] [CrossRef]
- IPC/WHMA-A-620C; Requirements and Acceptance for Cable and Wire Harness Assemblies. IPC/WHMA, 2017.
- IEC 60512-2-1:2002; Connectors for Electronic Equipment—Tests and Measurements—Part 2-1: Electrical Continuity and Contact Resistance Tests—Test 2a: Contact Resistance—Millivolt Level Method. IEC, 2002.
- MIL-STD-202; Method 307. Contact Resistance Test Method. U.S. DoD.
- Bi, Z.; Zhang, W.-J. Automation of Electrical Cable Harnesses Testing. Robotics 2018, 7, 1. [Google Scholar] [CrossRef]
- Bogdan, M; Dobocan, C.A. Increasing the productivity of an enterprise by efficiently managing the potential risks that occur in the manufacturing process. Acta Technica Napocensis Series-Applied Mathematics Mechanics And Engineering 2022, 65, 359–364. [Google Scholar]
- Dobocan, C.A.; Blebea, I.; Popescu, D. The application of the optimal control problem with mobile extremes on the new product launch process. Acta Technica Napocensis Series-Applied Mathematics Mechanics And Engineering 2013, 56, 109–114. [Google Scholar]
- Pacurar, A; Pacurar, R.; Eross, B.; Popister, F.; Otel, C.C. Decreasing of the manufacturing time for a thermoforming mold by applying the DFM principles. Modern Technologies In Manufacturing (Mtem 2017 - Amatuc) 2017, 137. [Google Scholar] [CrossRef]
- Otel, CC. Using the linear programming to determine the production plan of the enterprise. Acta Technica Napocensis Series-Applied Mathematics Mechanics And Engineering 2019, 62, 455–460. [Google Scholar]
- Bacila, CG; Dan, I.S. Sustainable industrial development. Performance Management Or Management Performance - Review of Management and Economic Engineering International Management Conference, 2018; pp. 188–193. [Google Scholar]
- Zeng, H.; Fu, X.; Li, Z.; Chen, Z.; Li, J.; Wang, Y.; Deng, X. Design of EM Sensor for Non-Contact Detection of Defective Wire Harness in Conveyor System. Sensors 2022, 22, 7350. [Google Scholar] [CrossRef]
- Song, J.; Zhang, Z.; Wang, H.; Kim, H. A Fault Detection System for Wiring Harness Manufacturing Based on AI Classification under Limited Labeled Data. Mathematics 2024, 12, 537. [Google Scholar] [CrossRef]
- Li, S.; Yuan, Z.; Zhang, Y.; et al. Enhanced YOLO- and Wearable-Based Inspection System for Assembly Verification in Automotive Scenarios (Incl. Wiring Harness Identifiers). Appl. Sci. 2024, 14, 2942. [Google Scholar] [CrossRef]
- Xia, K.; Zhang, J.; Zhou, X.; et al. Prediction of Automotive Wire Harness Aging Based on Feature Engineering and Intelligent Diagnosis. Sensors 2025, 25, 2910. [Google Scholar] [CrossRef] [PubMed]
- Yu, X.; Liu, Y.; Zhang, X.; et al. TCQI-YOLOv5: Total Connection Quality Inspection for Ultra-Fine Multi-Strand Wire Harnesses. Sensors 2025, 25, 7498. [Google Scholar] [CrossRef]
- Guerrero, R.; Saavedra, J.; Romero, E.; et al. Simulation Model for Wire Harness Design in the Car: Discrete-Event Simulation for Assembly-Line Decision Support. Sustainability 2022, 14, 7212. [Google Scholar] [CrossRef]
- Gomes, H.; Navio, F.; Gaspar, P.D.; Soares, V.N.G.J.; Caldeira, J.M.L.P. Radio-Frequency Identification Traceability System Implementation in the Packaging Section of an Industrial Company. Appl. Sci. 2023, 13, 12943. [Google Scholar] [CrossRef]
- Santana, S.; Ribeiro, A. Traceability Models and Traceability Systems to Accelerate the Transition to a Circular Economy: A Systematic Review. Sustainability 2022, 14, 5469. [Google Scholar] [CrossRef]
- Mabkhot, M.M.; Kalawsky, R.S.; Liaqat, A. Introducing the Manufacturing Digital Passport (MDP): A New Concept for Realising Digital Thread Data Sharing in Aerospace and Complex Manufacturing. Systems 2025, 13, 700. [Google Scholar] [CrossRef]
- Goecks, L.S.; Habekost, A.F.; Coruzzolo, A.M.; Sellitto, M.A. Industry 4.0 and Smart Systems in Manufacturing: Guidelines for the Implementation of a Smart Statistical Process Control. Appl. Syst. Innov. 2024, 7, 24. [Google Scholar] [CrossRef]
- Martinelli, M.; Lippi, M.; Gamberini, R. Poka Yoke Meets Deep Learning: A Proof of Concept for an Assembly Line Application. Appl. Sci. 2022, 12, 11071. [Google Scholar] [CrossRef]
- Torres, M.; et al. A Case Study in Complex Manual Assembly: Combining SHERPA and HEART for Human Reliability Analysis. Appl. Sci. 2021, 11, 749. [Google Scholar] [CrossRef]
- Alqahtani, A.; et al. A New Model for Determining Factors Affecting Human Errors in Manual Assembly Processes Using Fuzzy Delphi and DEMATEL Methods. Symmetry 2023, 15, 1967. [Google Scholar] [CrossRef]
- Meiners, M.; Kuhn, M.; Franke, J. Manufacturing Process Curve Monitoring with Deep Learning. Manufacturing Letters 2021, 30, 15–18. [Google Scholar] [CrossRef]
- Wang, P.; Qu, H.; Zhang, Q.; Xu, X.; Yang, S. Production Quality Prediction of Multistage Manufacturing Systems Using Multi-Task Joint Deep Learning. Journal of Manufacturing Systems 2023. [Google Scholar] [CrossRef]
- Sufian, M.; et al. Smart Manufacturing Application in Precision Manufacturing: Implementation and Benefits. Appl. Sci. 2025, 15, 9163. [Google Scholar] [CrossRef]
- Ravai-Nagy, S.; Pop, A.B.; Titu, A.M. Design and Validation of a Fixture Device for Machining Surfaces with Barrel End-Mill on a 3-Axis CNC Milling Machine. Appl. Sci. 2025, 15, 7379. [Google Scholar] [CrossRef]
- Wei, F.; et al. Development and Design of an Online Quality Inspection System for Automotive Electric Seats Using LabVIEW. Sensors 2024, 24, 7085. [Google Scholar] [CrossRef]
- Tian, W.; et al. A Review of Intelligent Assembly Technology of Small Electronic Equipment: Visual Positioning, Trajectory Planning, and Force–Position Coordination. Micromachines 2023, 14, 1126. [Google Scholar] [CrossRef]
- Pacini, A.; et al. Design of Reconfigurable Handling Systems for Visual Inspection in Industrial Contexts. Drones 2025, 9, 257. [Google Scholar] [CrossRef]
- Seriţan, G.C.; et al. Single-Wire Control and Fault Detection for Automotive Lighting (Diagnosis Concepts for Vehicle Electrical Networks). Sensors 2023, 23, 6521. [Google Scholar] [CrossRef]
- Kukulski, J.; et al. Procedure for Conducting Inspection Thermographic Tests for Electrical Heating Systems (Inspection + Electrical Testing Protocols). Appl. Sci. 2025, 15, 11671. [Google Scholar] [CrossRef]
- Xiao, J.; et al. Mechanical Behavior of Crimping Composite Post Insulator (Modeling/Testing of Crimped Interfaces). Buildings 2023, 13, 1275. [Google Scholar] [CrossRef]
Figure 3.
Process flow after device implantation.
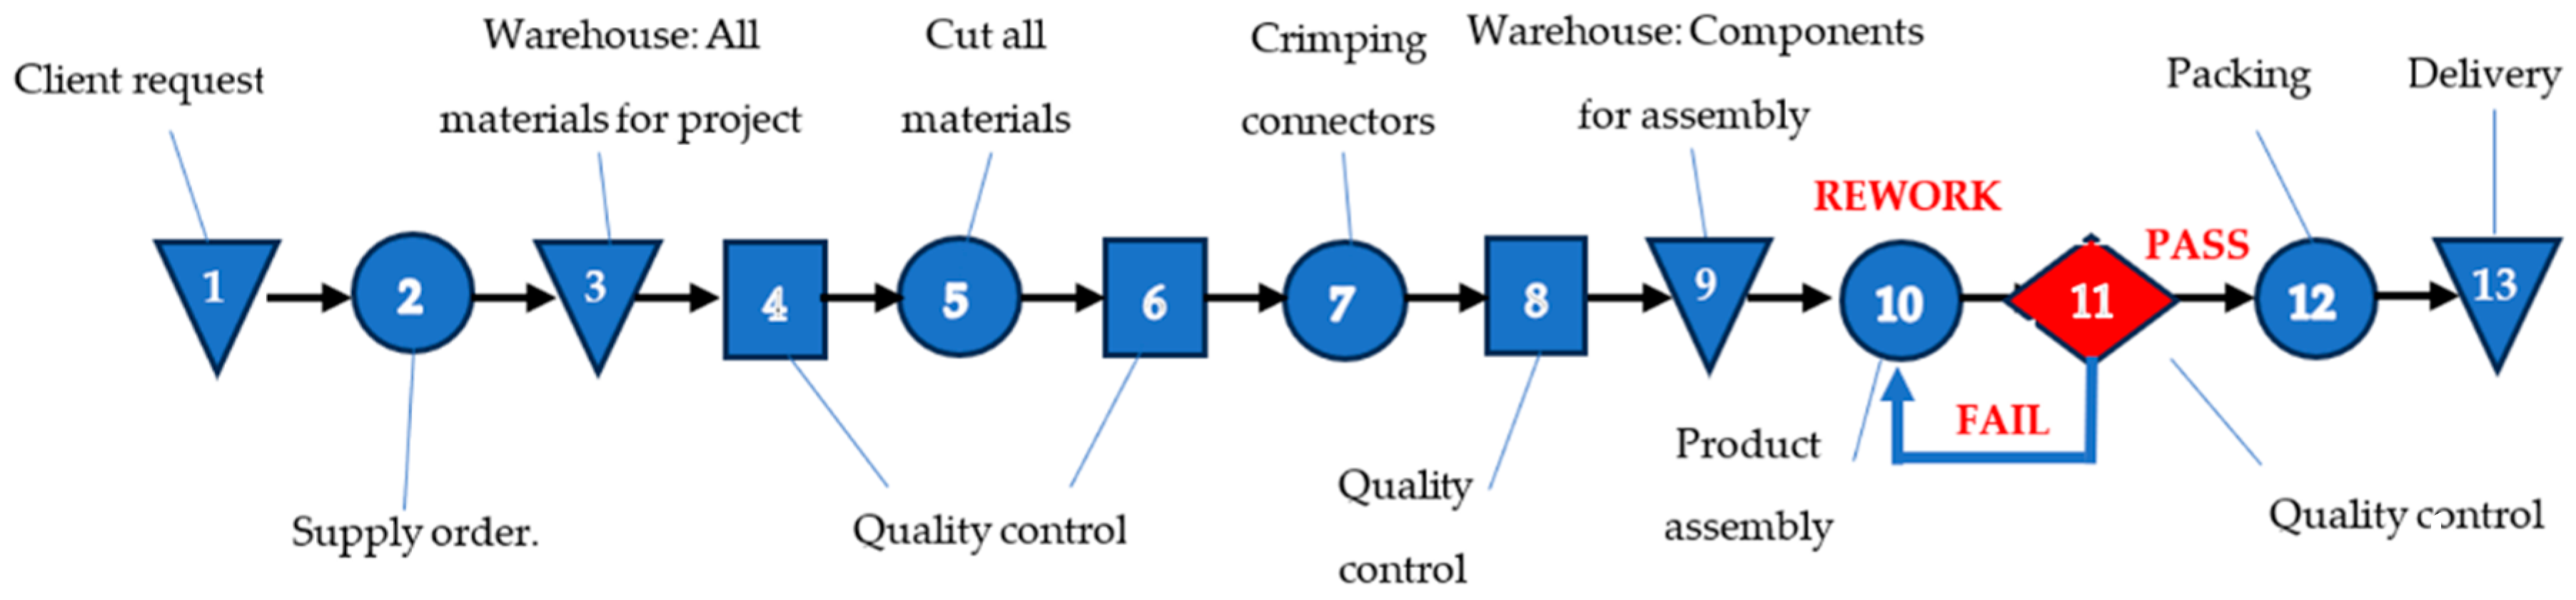

Table 1.
Input parameters and derived monthly indicators for the before–after evaluation (visual inspection vs. EOL fixture).
Table 1.
Input parameters and derived monthly indicators for the before–after evaluation (visual inspection vs. EOL fixture).
| Category | Parameter | Symbol | Baseline (visual) | After implementation (EOL fixture) | Unit / Notes |
|---|---|---|---|---|---|
| Production | Monthly production volume | N | 1500 | 1500 | units/month |
| Quality (internal) |
Internal nonconformity rate (occurrence) | 0.04 | 0.04* | *Occurrence assumed unchanged; customer escapes prevented by gate | |
| Quality (derived) |
Defective units per month | 60 | 60 | units/month | |
| Testing | EOL test time per unit |
|
1 | 0.33 | min/unit |
| Rework | Rework time per defective unit | 5 | 5 | min/defective unit (repairable) | |
| Policy | Retest after rework | — | Yes | Yes | Mandatory retest until PASS |
| QC workload (derived) | Total monthly QC time (test + rework + retest) | 1860 | 814.8 | min/month | |
| QC workload (derived) | Total monthly QC time | 31 | 13.58 | h/month | |
| Productivity (derived) | Global QC productivity | Pglobal = N/(T/60) | 48.39 | 110.46 | units/h (over test + rework + retest) |
| Improvement (derived) | Time released | ΔT=T0−T1 | — | 1045.2 | min/month (= 17.42 h/month) |
| Customer quality |
Customer defects (escapes) | — | Possible | Target: 0 | Achieved through “no PASS—no shipment” gate |
* The internal nonconformity rate represents defect occurrence prior to the EOL gate; after implementation, the gate enforces “no PASS—no shipment”, aiming at zero customer escapes (zero shipped defects), even if repairable internal defects still occur and are corrected via rework and mandatory retest. This interpretation is consistent with quality-gate/virtual-quality-gate concepts for preventing defect propagation downstream. [8,12] .Computation: and . The use of dedicated electrical fixtures for harness continuity and incorrect pinning/miswire detection is aligned with reported harness test automation approaches. [3,9]. Data-centric note: Structured logging of PASS/FAIL and pin-level diagnoses supports data-driven quality management and digital-thread-aligned traceability for continuous improvement. [5,10,11].
Disclaimer/Publisher’s Note: The statements, opinions and data contained in all publications are solely those of the individual author(s) and contributor(s) and not of MDPI and/or the editor(s). MDPI and/or the editor(s) disclaim responsibility for any injury to people or property resulting from any ideas, methods, instructions or products referred to in the content. |
© 2026 by the authors. Licensee MDPI, Basel, Switzerland. This article is an open access article distributed under the terms and conditions of the Creative Commons Attribution (CC BY) license (http://creativecommons.org/licenses/by/4.0/).
Copyright: This open access article is published under a Creative Commons CC BY 4.0 license, which permit the free download, distribution, and reuse, provided that the author and preprint are cited in any reuse.


