
Submitted:
12 January 2026
Posted:
13 January 2026
You are already at the latest version
Abstract
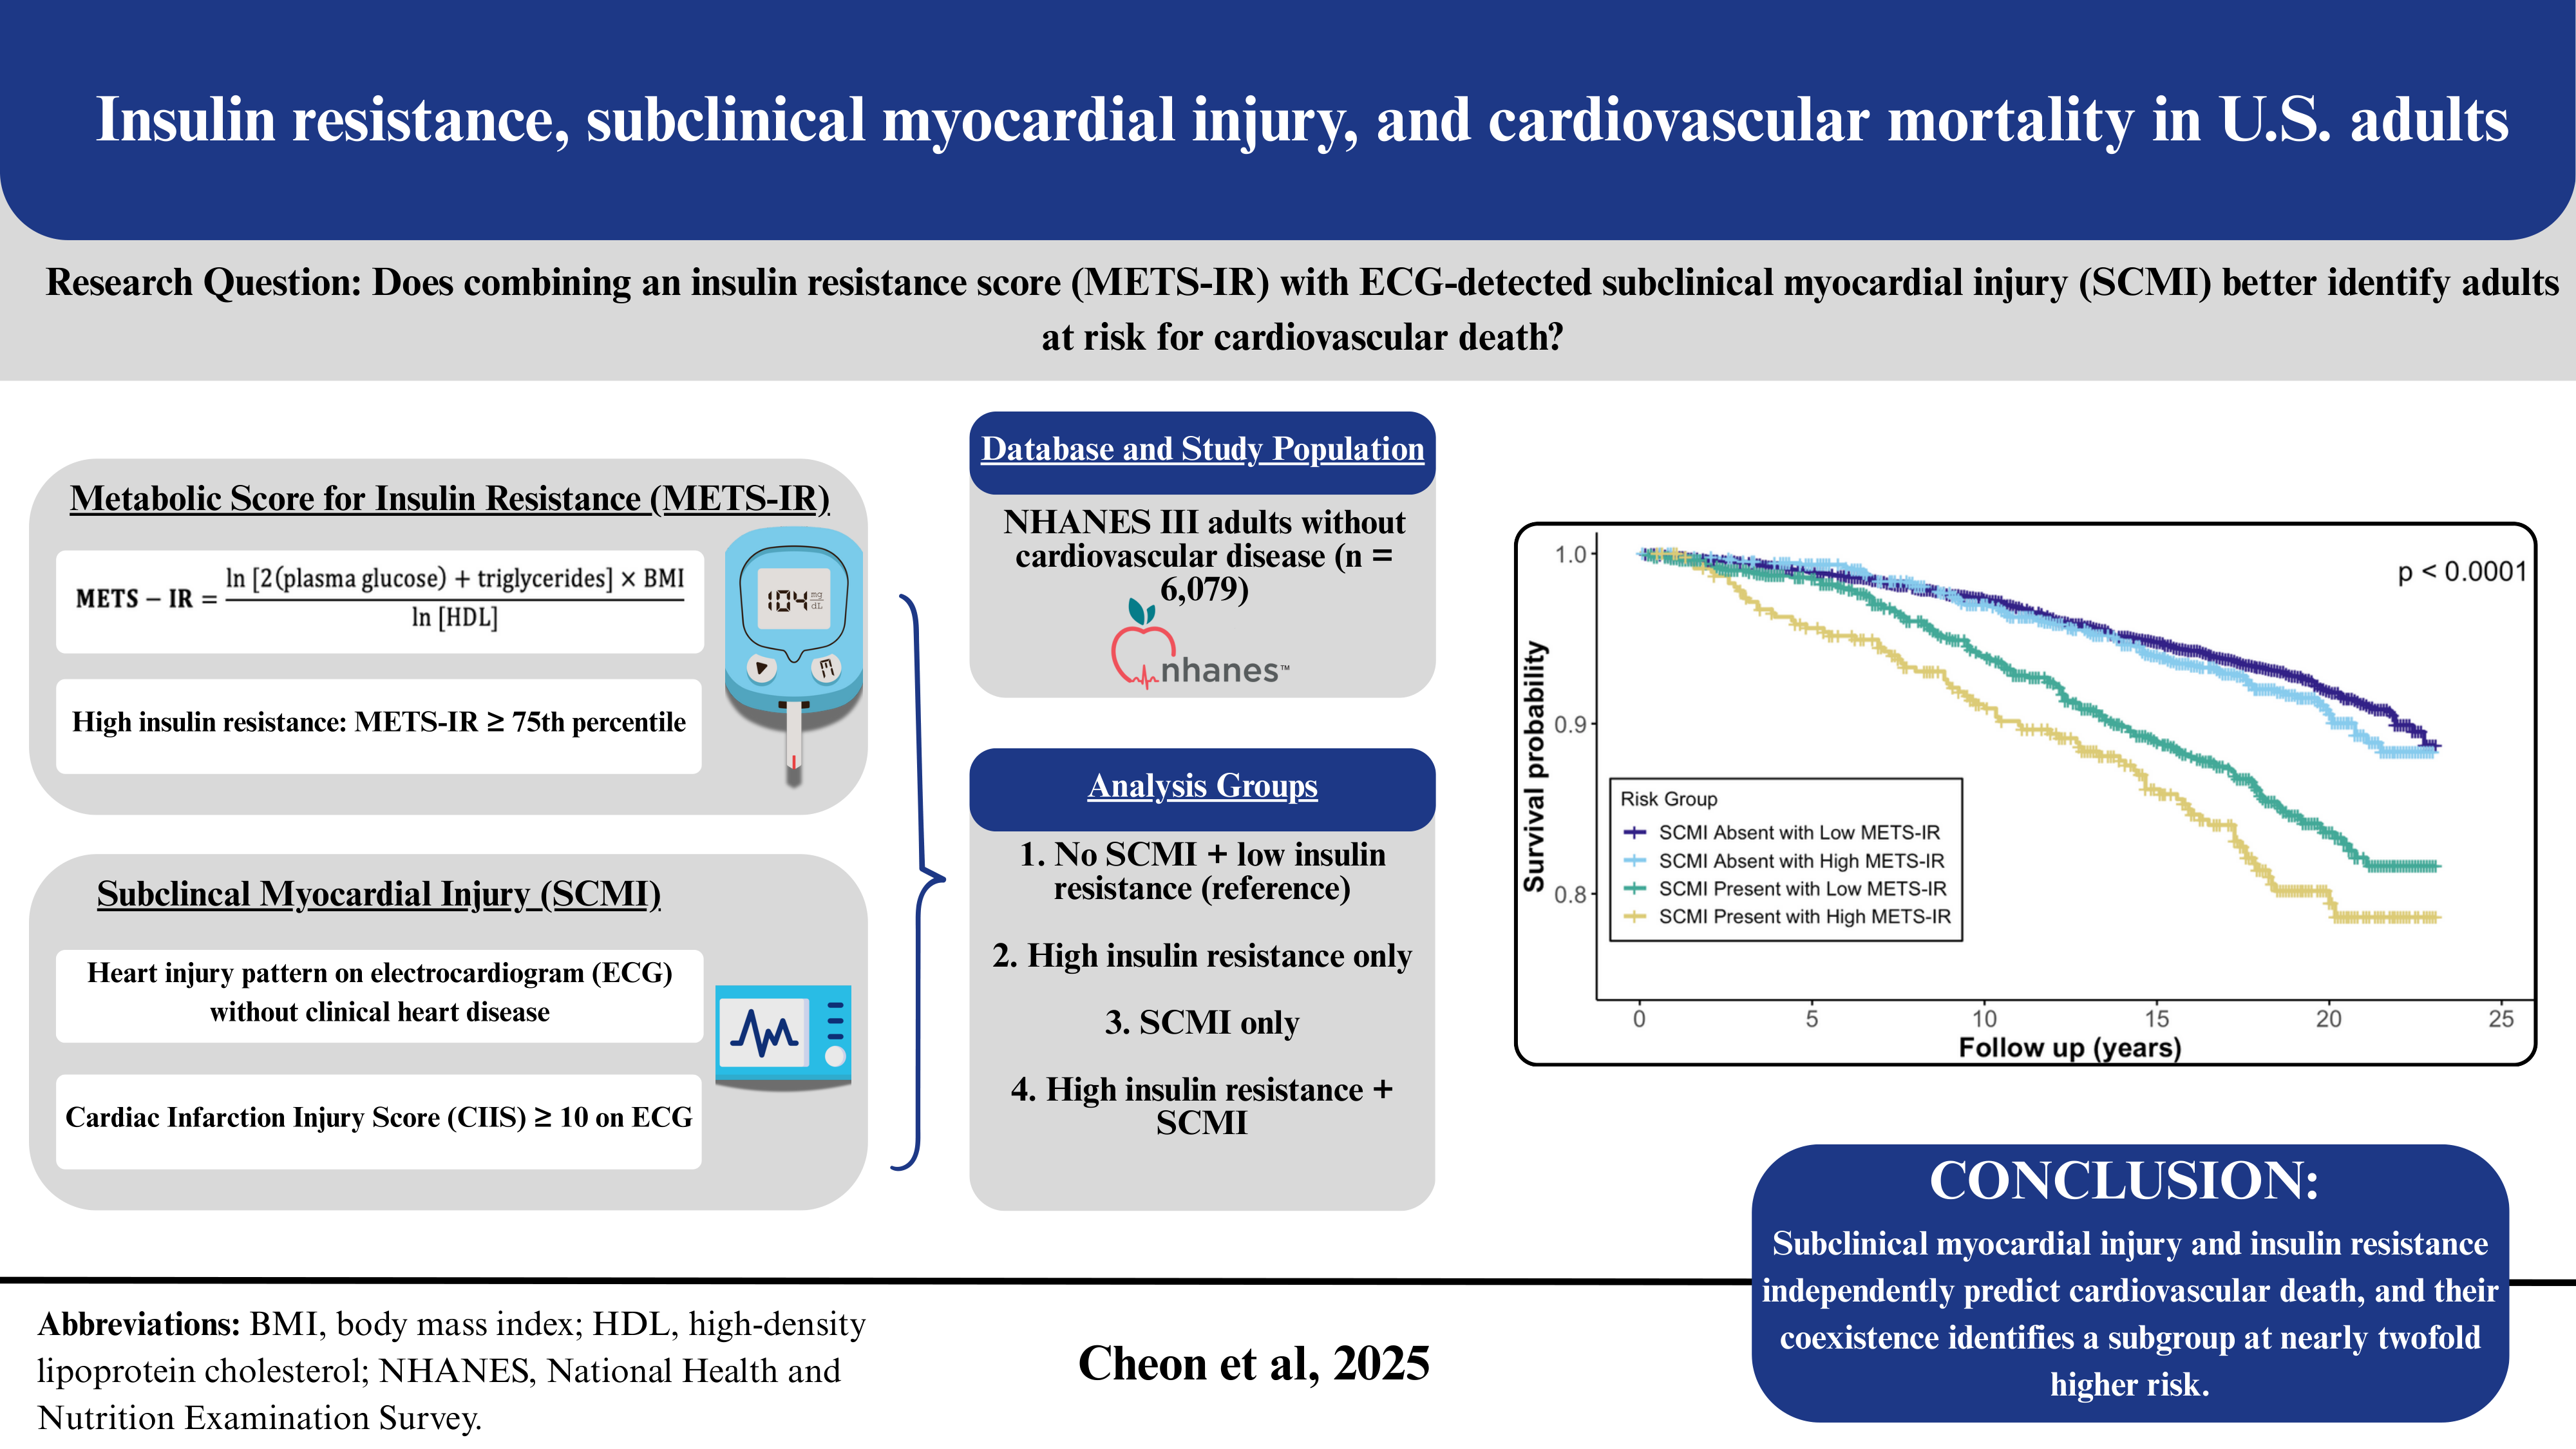
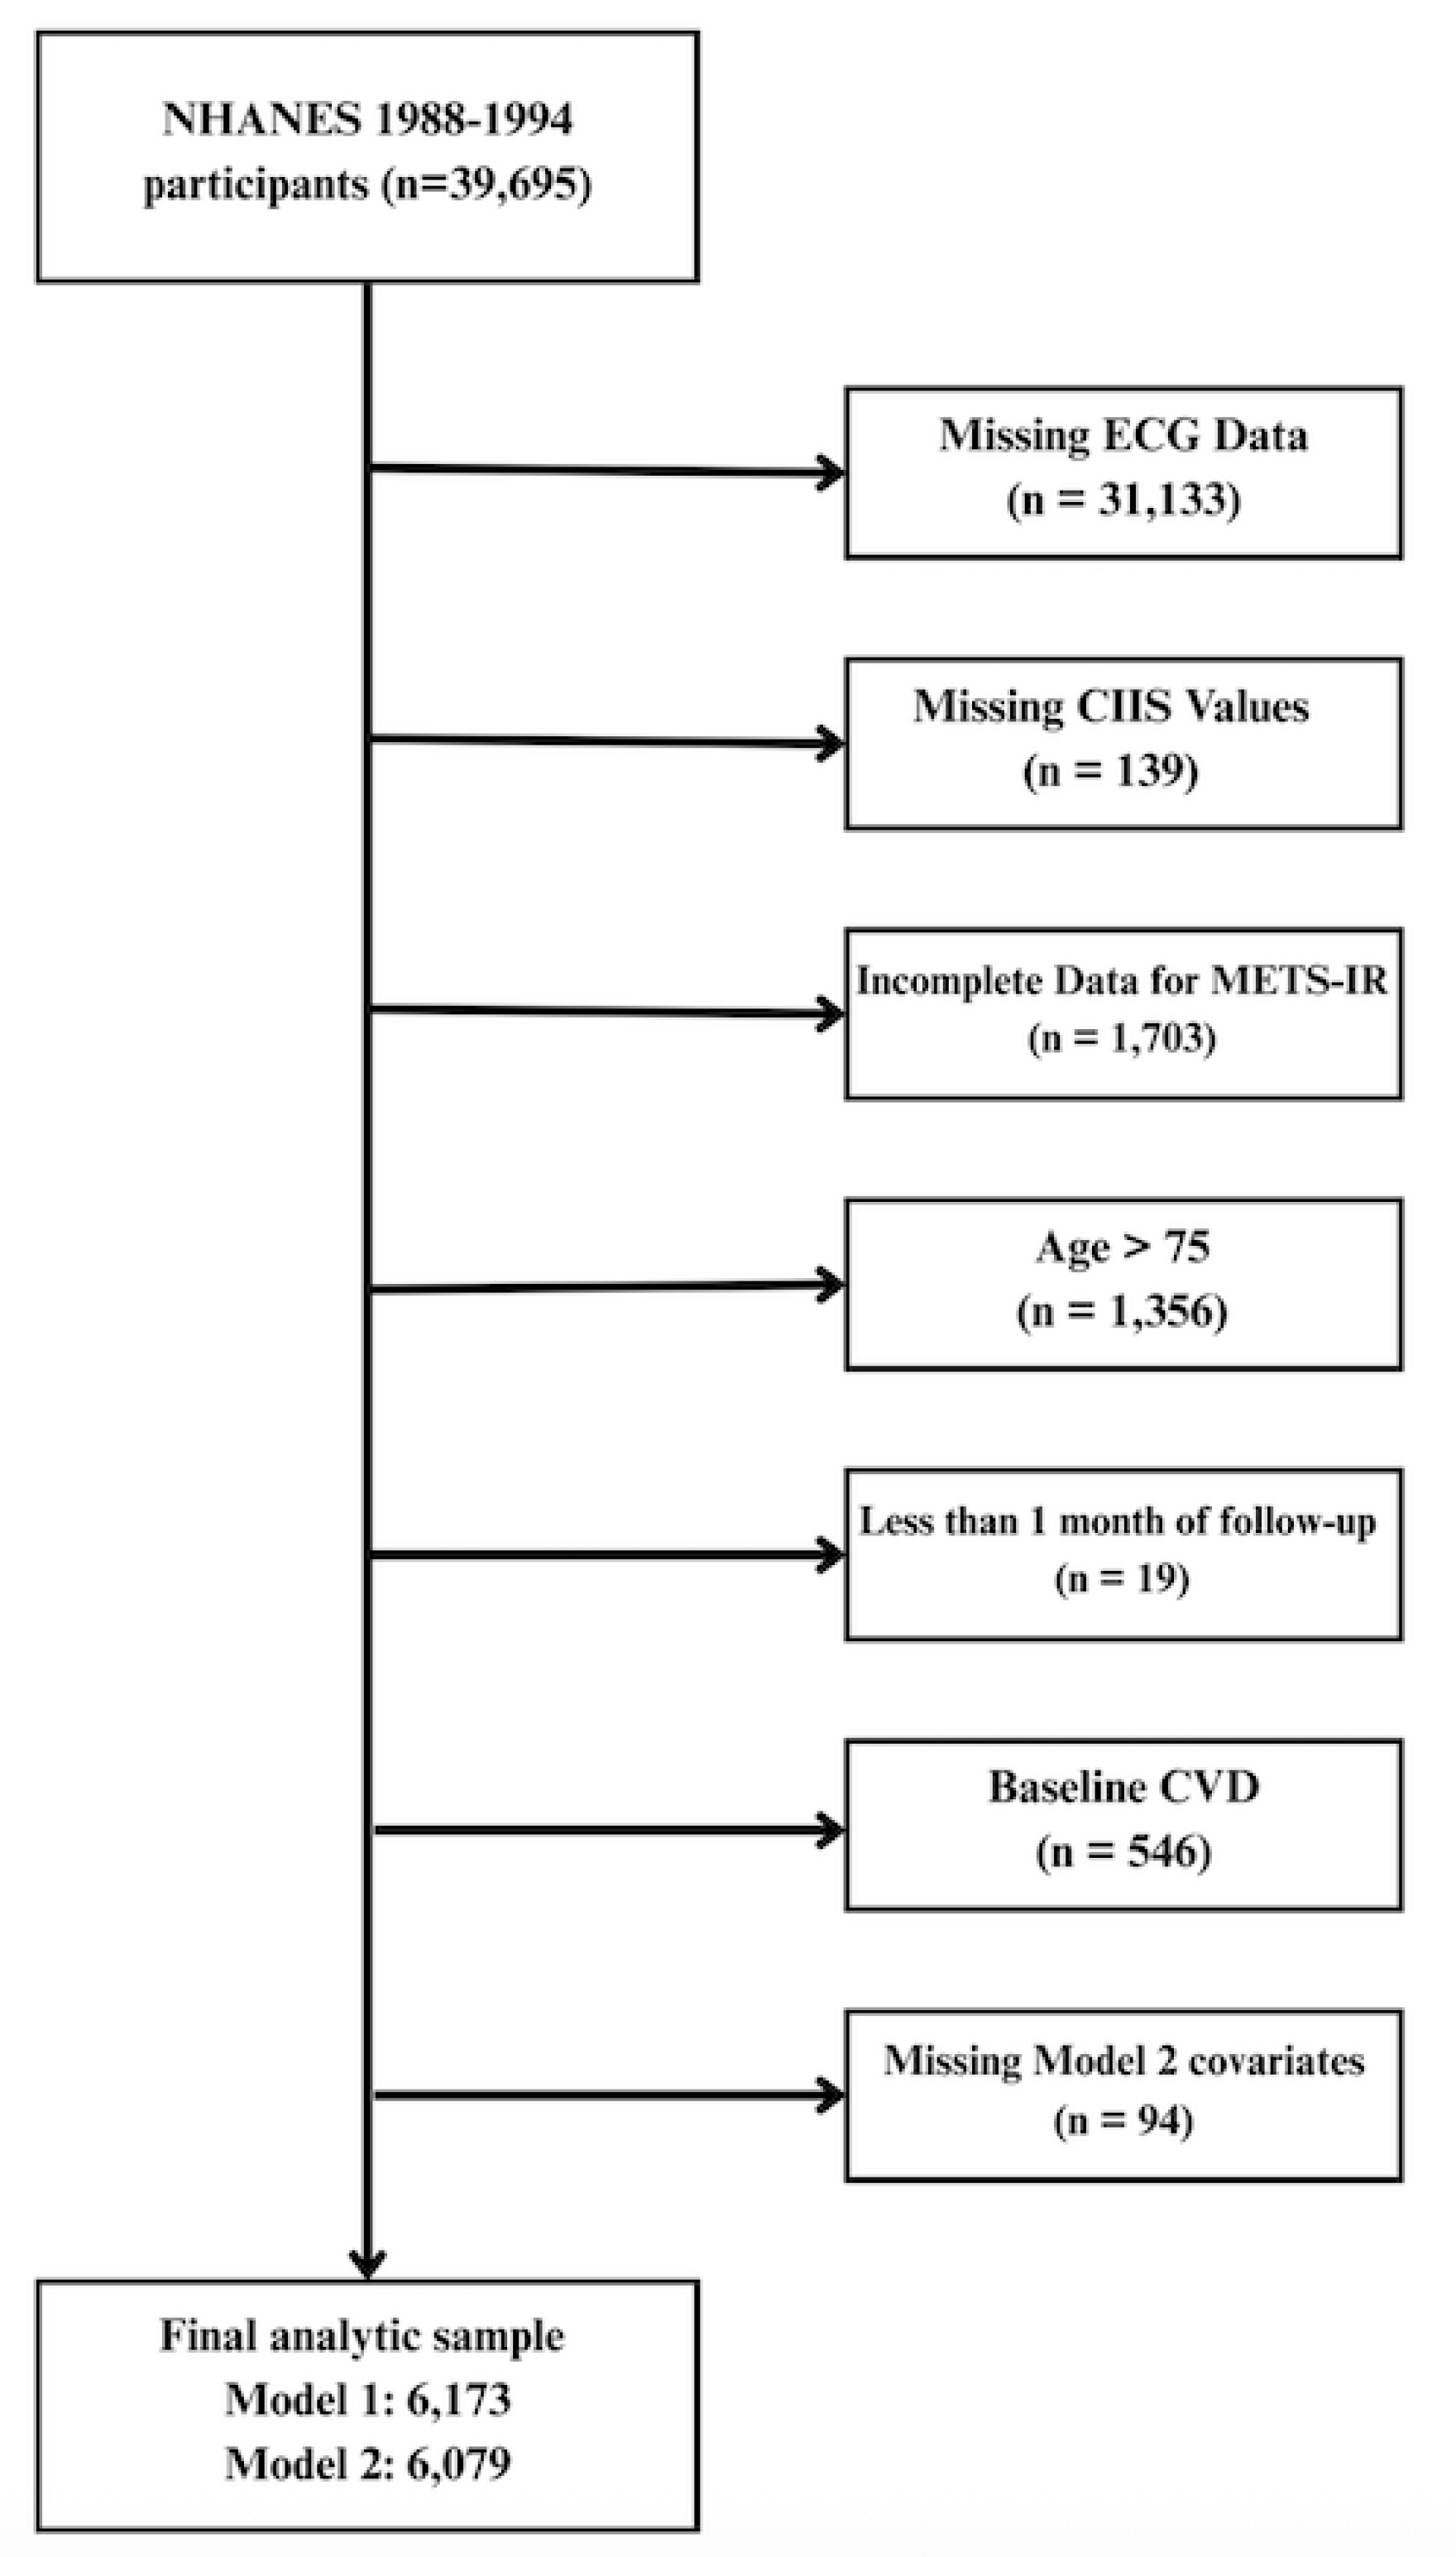
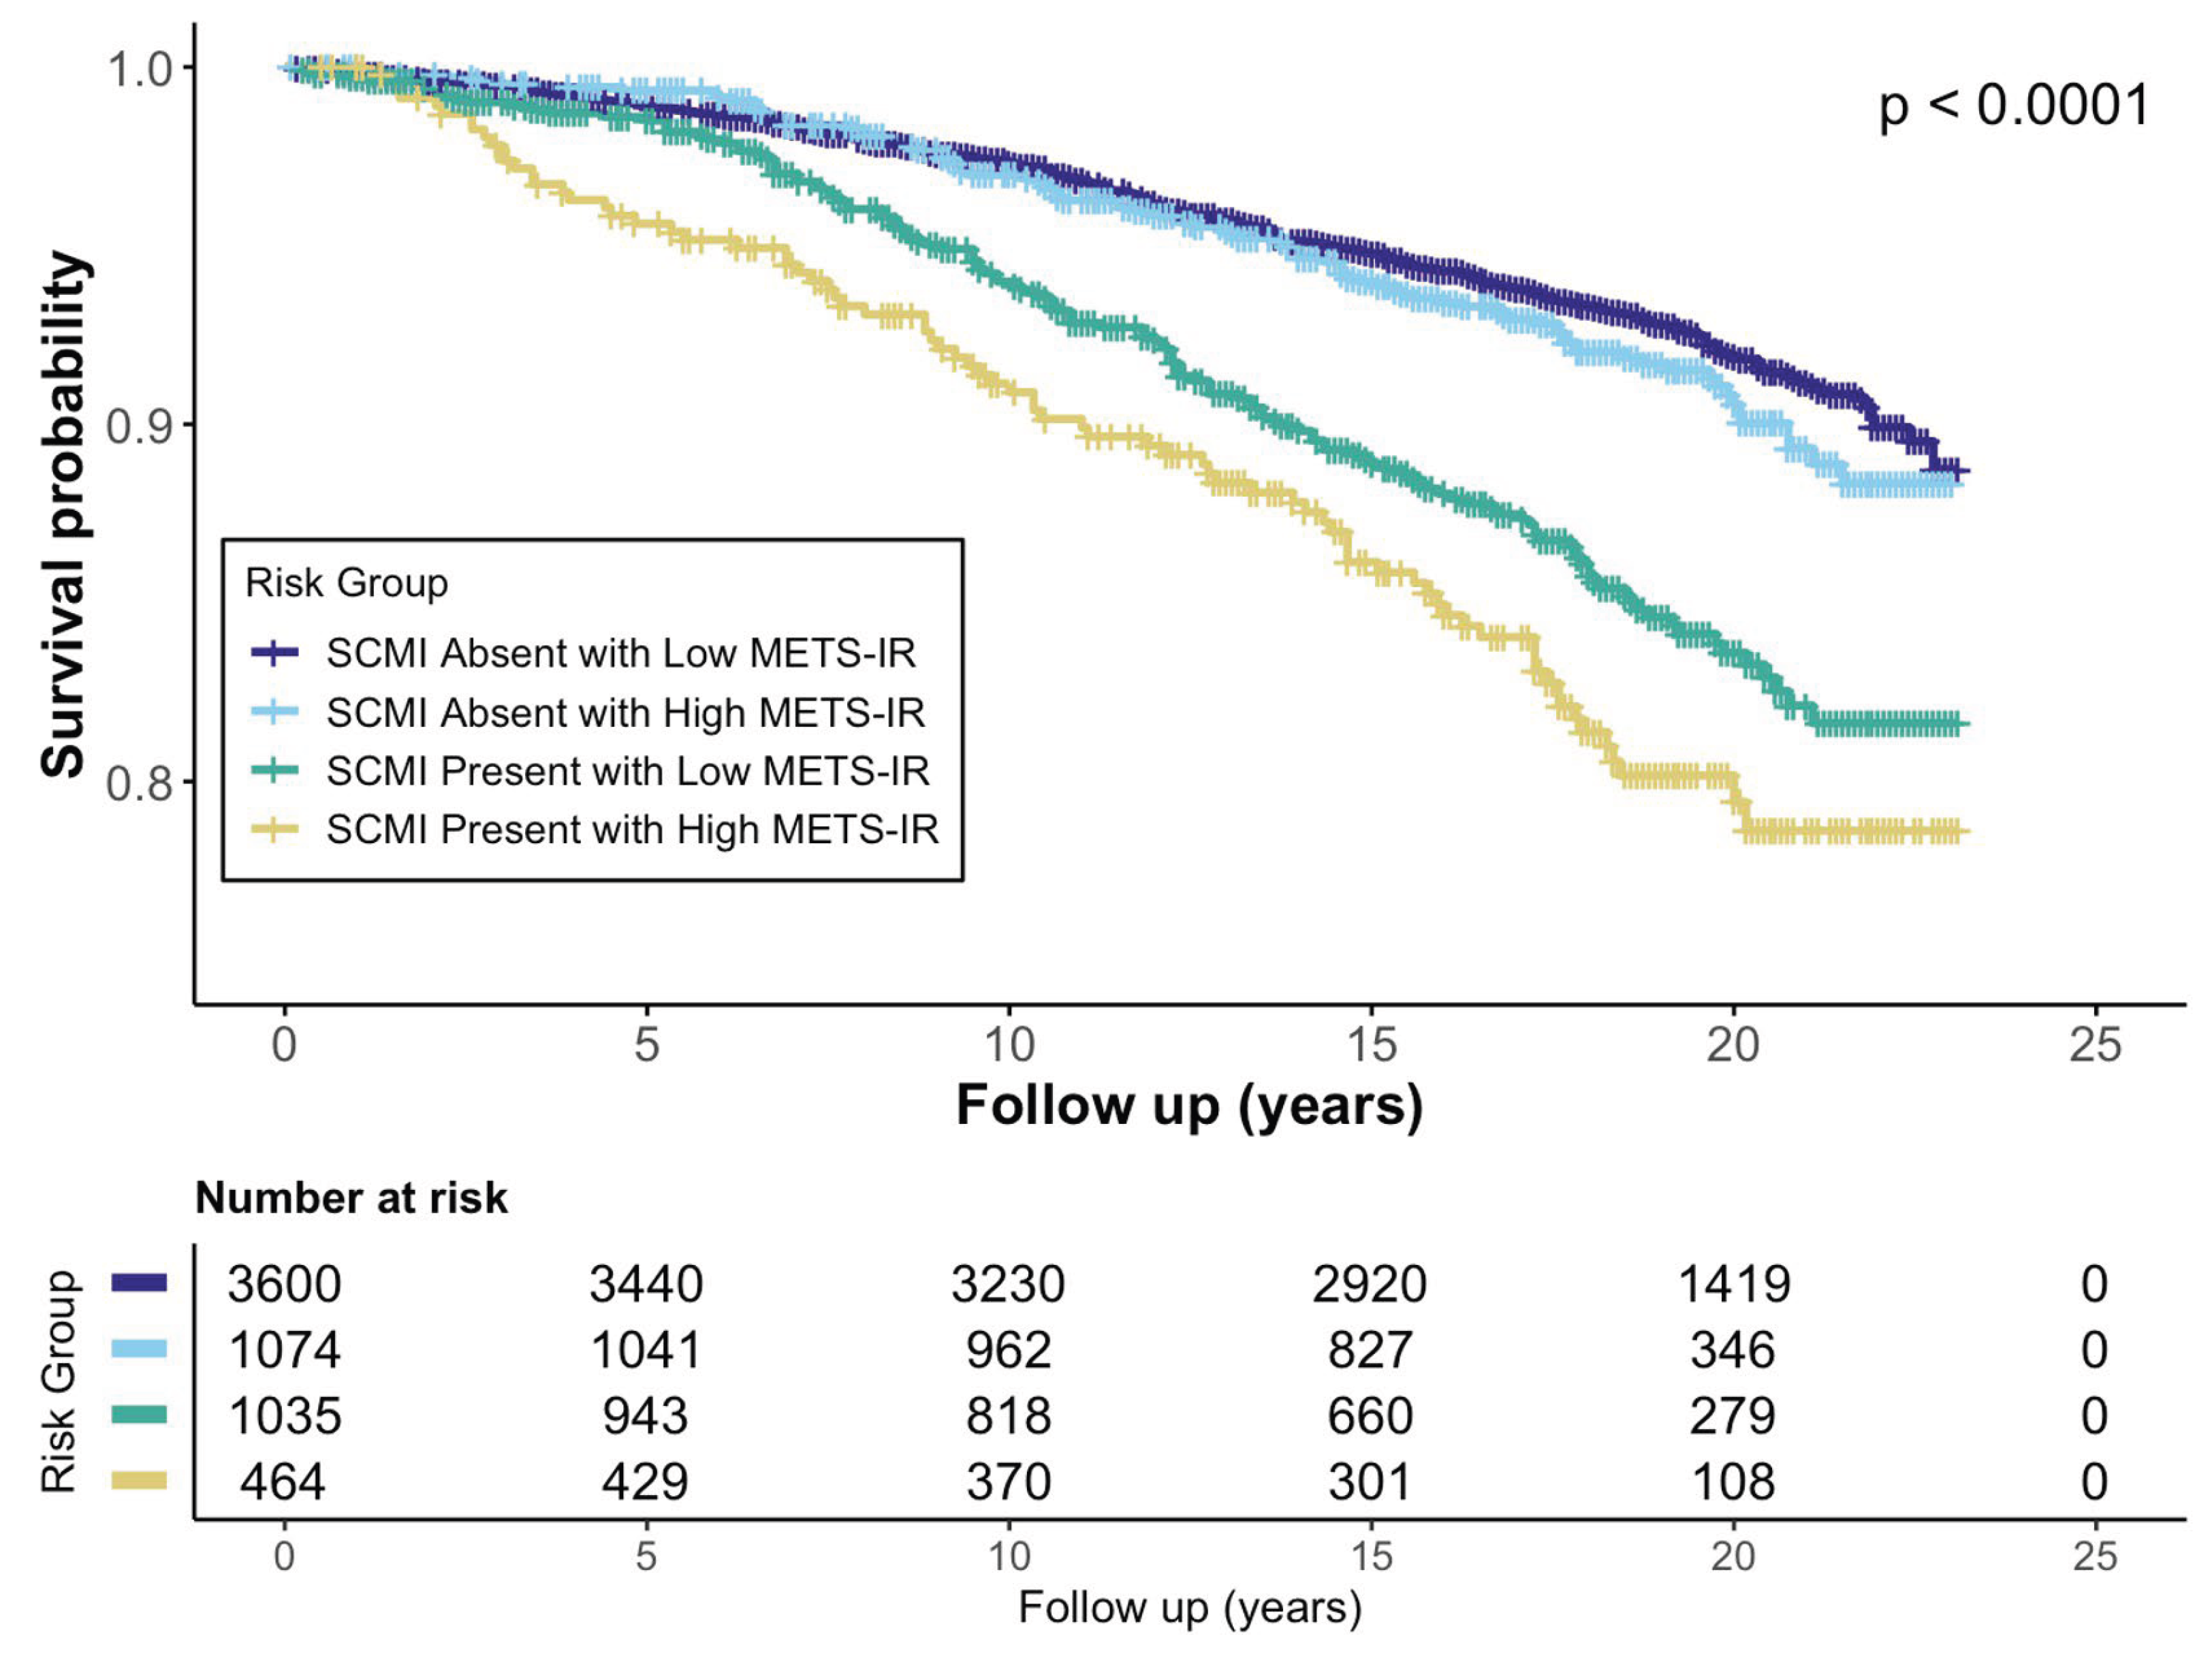
Background/Objectives: The Metabolic Score for Insulin Resistance (METS-IR), a non-insulin-based index of insulin resistance (IR), and subclinical myocardial injury (SCMI), identified by electrocardiogram (ECG), are each associated with cardiovascular disease (CVD). However, their joint impact on mortality remains unclear. We examined the association of METS-IR with SCMI and evaluated the individual and combined associations of SCMI and IR with cardiovascular mortality. Methods: We analyzed adults without baseline CVD from the Third National Health and Nutrition Examination Survey. METS-IR was calculated from fasting glucose, triglycerides, high-density lipoprotein cholesterol, and body mass index and categorized as low (<75th percentile) or high (≥75th percentile). SCMI was defined as a cardiac infarction injury score ≥10 on ECG. Multivariable logistic regression assessed associations between METS-IR and SCMI, and Cox regression estimated cardiovascular mortality risk across SCMI-IR combinations. Results: Among 6,079 participants, 14.1% had SCMI. Higher METS-IR was associated with greater SCMI odds (OR(95%CI): 1.58(1.31-1.90)). Over a median of 18.8 years, 563 (9.1%) cardiovascular deaths occurred. Both SCMI and high IR were individually associated with increased cardiovascular mortality ((HR(95% CI): 1.41(1.19–1.69) and 1.32(1.09–1.59), respectively). Participants with both SCMI and high IR had the highest risk (HR 1.92; 95% CI 1.49–2.50) compared with those with neither condition. Conclusions: In adults without prior CVD, METS-IR was positively associated with SCMI. The coexistence of SCMI and high IR identified a subgroup at nearly twofold higher risk of cardiovascular mortality, supporting combined use of ECG-based injury markers and metabolic indices for cardiovascular risk stratification.
Keywords:
1. Introduction
2. Materials and Methods
2.1. Study Design and Population
2.2. Metabolic Score for Insulin Resistance (METS-IR) Calculation
2.3. Subclinical Myocardial Injury (SCMI)
2.4. Cardiovascular Mortality
2.5. Covariates
2.6. Statistical Analysis
3. Results
3.1. Study Population Characteristics
3.2. Association Between METS-IR and Subclinical Myocardial Injury
3.3. METS-IR, SCMI, and Cardiovascular Mortality
3.4. Joint Association of METS-IR and SCMI with Cardiovascular Mortality
3.5. Subgroup Analyses
4. Discussion
5. Conclusions
Author Contributions
Funding
Institutional Review Board Statement
Informed Consent Statement
Data Availability Statement
Acknowledgments
Conflicts of Interest
Abbreviations
| CI | Confidence Interval |
| CIIS | Cardiac Infarction Injury Score |
| CKD-EPI | Chronic Kidney Disease Epidemiology Collaboration |
| CV | Cardiovascular |
| CVD | Cardiovascular Disease |
| ECG | Electrocardiogram |
| eGFR | Estimated Glomerular Filtration Rate |
| HDL-C | High-Density Lipoprotein Cholesterol |
| HR | Hazard Ratio |
| ICD-10 | International Classification of Diseases, 10th Revision |
| IR | Insulin Resistance |
| LDL-C | Low-Density Lipoprotein Cholesterol |
| METS-IR | Metabolic Score for Insulin Resistance |
| NDI | National Death Index |
| NHANES III | Third National Health and Nutrition Examination Survey |
| OR | Odds Ratio |
| SCMI | Subclinical Myocardial Injury |
References
- Organization, W.H. Cardiovascular Diseases (CVDs) Fact Sheet. 2025 July 31st, 2025 [cited 2025 October 2nd]; Available from: https://www.who.int/news-room/fact-sheets/detail/cardiovascular-diseases-(cvds).
- Rautaharju, P.M., et al., Cardiac infarction injury score: an electrocardiographic coding scheme for ischemic heart disease. Circulation, 1981. 64(2): p. 249-56. [CrossRef]
- Dekker, J.M., et al., Cardiac Infarction Injury Score predicts cardiovascular mortality in apparently healthy men and women. Br Heart J, 1994. 72(1): p. 39-44. [CrossRef]
- O’Neal, W.T., et al., Subclinical myocardial injury identified by cardiac infarction/injury score and the risk of mortality in men and women free of cardiovascular disease. Am J Cardiol, 2014. 114(7): p. 1018-23. [CrossRef]
- Semenkovich, C.F., Insulin resistance and atherosclerosis. J Clin Invest, 2006. 116(7): p. 1813-22. [CrossRef]
- Fazio, S., et al., Insulin resistance/hyperinsulinemia: an important cardiovascular risk factor that has long been underestimated. Front Cardiovasc Med, 2024. 11: p. 1380506. [CrossRef]
- Bello-Chavolla, O.Y., et al., METS-IR, a novel score to evaluate insulin sensitivity, is predictive of visceral adiposity and incident type 2 diabetes. Eur J Endocrinol, 2018. 178(5): p. 533-544. [CrossRef]
- Song, K., et al., Comparison of SPISE and METS-IR and Other Markers to Predict Insulin Resistance and Elevated Liver Transaminases in Children and Adolescents. Diabetes Metab J, 2025. 49(2): p. 264-274. [CrossRef]
- Duan, M., et al., Metabolic score for insulin resistance (METS-IR) predicts all-cause and cardiovascular mortality in the general population: evidence from NHANES 2001-2018. Cardiovasc Diabetol, 2024. 23(1): p. 243. [CrossRef]
- Sun, R., et al., Association of Insulin Resistance With Cardiovascular Disease and All-Cause Mortality in Type 1 Diabetes: Systematic Review and Meta-analysis. Diabetes Care, 2024. 47(12): p. 2266-2274. [CrossRef]
- Zhou, Y. and J. Gao, Association between metabolic score for insulin resistance and cardiovascular disease mortality in patients with rheumatoid arthritis: evidence from the NHANES 1999-2018. Front Endocrinol (Lausanne), 2024. 15: p. 1444800. [CrossRef]
- Liu, Y., et al., Nonlinear associations between METS-IR and all-cause as well as cardiovascular mortality in adults with osteoporosis and osteopenia: evidence from NHANES 2007-2023. Sci Rep, 2025. 15(1): p. 12657. [CrossRef]
- Ezzati, T.M., et al., Sample design: Third National Health and Nutrition Examination Survey. Vital Health Stat 2, 1992(113): p. 1-35.
- Plan and operation of the Third National Health and Nutrition Examination Survey, 1988-94. Series 1: programs and collection procedures. Vital Health Stat 1, 1994(32): p. 1-407.
- Yoon, J., et al., The Metabolic Score for Insulin Resistance (METS-IR) as a Predictor of Incident Ischemic Heart Disease: A Longitudinal Study among Korean without Diabetes. J Pers Med, 2021. 11(8). [CrossRef]
- Su, X., C. Zhao, and X. Zhang, Association between METS-IR and heart failure: a cross-sectional study. Front Endocrinol (Lausanne), 2024. 15: p. 1416462. [CrossRef]
- SERVICES, U.S.D.O.H.A.H., Plan and Operation of the Third National Health and Nutrition Examination Survey 1988-94. 1994, National Center for Heaith Statistics: Vital and Health Statistics. p. 416.
- Thiese, M.S., B. Ronna, and U. Ott, P value interpretations and considerations. J Thorac Dis, 2016. 8(9): p. E928-e931. [CrossRef]
- Rohrich, R.J., et al., When Is Science Significant? Understanding the p Value. Plast Reconstr Surg, 2020. 146(4): p. 939-940. [CrossRef]
- Weng, L., et al., Association between metabolic score for insulin resistance and stroke: a nationally representative cross-sectional study from NHANES 2007-2018. Front Neurol, 2024. 15: p. 1478884. [CrossRef]
- Zheng, R., et al., Linear positive association of metabolic score for insulin resistance with stroke risk among American adults: a cross-sectional analysis of National Health and Nutrition Examination Survey datasets. J Stroke Cerebrovasc Dis, 2024. 33(11): p. 107994. [CrossRef]
- Paoletti, R., et al., Metabolic syndrome, inflammation and atherosclerosis. Vasc Health Risk Manag, 2006. 2(2): p. 145-52. [CrossRef]
- Gallo, G. and C. Savoia, New Insights into Endothelial Dysfunction in Cardiometabolic Diseases: Potential Mechanisms and Clinical Implications. Int J Mol Sci, 2024. 25(5). [CrossRef]
- Ormazabal, V., et al., Association between insulin resistance and the development of cardiovascular disease. Cardiovasc Diabetol, 2018. 17(1): p. 122. [CrossRef]
- Muniyappa, R., et al., Cardiovascular actions of insulin. Endocr Rev, 2007. 28(5): p. 463-91. [CrossRef]
- Savage, D.B., K.F. Petersen, and G.I. Shulman, Disordered lipid metabolism and the pathogenesis of insulin resistance. Physiol Rev, 2007. 87(2): p. 507-20. [CrossRef]
- Fagard, R.H., Smoking amplifies cardiovascular risk in patients with hypertension and diabetes. Diabetes Care, 2009. 32 Suppl 2(Suppl 2): p. S429-31. [CrossRef]

| Variable | Overall (n = 6079) |
Low METS-IR with Absent SCMI (n =3548) |
High METS-IR with Absent SCMI (n = 1057) |
Low METS-IR with Present SCMI (n =1011) |
High METS-IR with Present SCMI (n = 463) |
p-value |
|---|---|---|---|---|---|---|
| Age, years; mean (SD) | 55.79 (10.66) | 54.84 (10.64) | 54.36 (10.17) | 59.71 (10.49) | 57.39 (9.99) | <0.001 |
| Female, n (%) | 3185 (52.4) | 1884 (53.1) | 573 (54.2) | 524 (51.8) | 202 (43.6) | <0.001 |
| Race-Ethnicity, n (%) | <0.001 |
|||||
| Non-Hispanic White | 2793 (45.2) | 1644 (46.3) | 413 (39.1) | 502 (49.7) | 198 (42.8) | |
| Non-Hispanic Black | 1498 (24.3) | 838 (23.6) | 237 (22.4) | 275 (27.2) | 118 (25.5) | |
| Mexican American | 1616 (26.2) | 878 (24.7) | 367 (34.7) | 208 (20.6) | 138 (29.8) | |
| Other | 266 (4.3) | 188 (5.3) | 40 (3.8) | 26 (2.6) | 9 (1.9) | |
| Education ≥ High School, n (%) | 3475 (57.2%) | 2135 (60.2%) | 540 (51.1%) | 531 (52.5%) | 235 (50.8%) | <0.001 |
| Income <$20,000 per year | 2599 (42.1) | 1355 (38.2) | 478 (45.2) | 479 (47.4) | 226 (48.8) | <0.001 |
| Ever Smoker, n (%) | 3473 (56.3) | 1963 (55.3) | 531 (50.2) | 645 (63.8) | 281 (60.7) | <0.001 |
| BMI, mean (SD) | 27.95 (5.58) | 25.82 (3.51) | 34.52 (5.21) | 25.58 (3.76) | 34.56 (5.73) | <0.001 |
| LDL-C, mg/dL; mean (SD) | 136.54 (40.94) | 135.05 (42.22) | 137.47 (38.51) | 138.73 (38.01) | 140.58 (41.53) | 0.136 |
| HDL-C, mg/dL, mean (SD) | 51.07 (16.38) | 54.50 (16.08) | 40.84 (10.76) | 54.90 (17.43) | 39.72 (11.37) | <0.001 |
| Lipid-lowering medications, n (%) | 258 (4.2) | 131 (3.7) | 53 (5.0) | 48 (4.7) | 22 (4.8) | 0.162 |
| Total Cholesterol, mg/dL; mean (SD) | 222.23 (44.00) | 220.12 (42.56) | 223.26 (45.07) | 224.69 (45.50) | 230.62 (47.66) | <0.001 |
| SBP, mmHg; mean (SD) | 130.78 (26.82) | 128.16 (25.71) | 133.77 (36.83) | 133.52 (20.02) | 137.90 (18.42) | <0.001 |
| DBP, mmHg; mean (SD) | 77.63 (25.16) | 76.97 (25.55) | 80.28 (36.54) | 76.39 (10.33) | 79.64 (10.92) | <0.001 |
| EGFR, (mL/min/1.73m2), mean (SD) | 71.30 (17.30) | 73.14 (14.27) | 73.09 (15.85) | 69.20 (16.23) | 70.24 (17.05) | <0.001 |
| Anti-hypertension medications, n (%) | 1243 (20.1) | 531 (15.0) | 278 (26.3) | 239 (23.6) | 172 (37.1) | <0.001 |
| Diabetes Mellitus, n (%) | 955 (15.5) | 301 (8.5) | 287 (27.2) | 128 (12.7) | 154 (33.3) | <0.001 |
| Physically Active, n (%) | 4245 (68.8) | 2560 (72.2) | 671 (63.5) | 668 (66.1) | 289 (62.4) | <0.001 |
| Model 1 | Model 2 | |||
|---|---|---|---|---|
| OR(95% CI) | P-value | OR(95% CI) | P-value | |
| Continuous | ||||
| METS-IR (per SD)* | 1.22(1.15 – 1.29) | <0.0001 | 1.20(1.13 – 1.27) | <0.0001 |
| Categorical | ||||
| Low METS-IR | Reference | -- | Reference | -- |
| High METS-IR | 1.60 (1.40–1.82) | <0.0001 | 1.58 (1.31–1.90) | <0.0001 |
| Exposure Categories | No. Events (%) |
Model 1 | Model 2 | |||
|---|---|---|---|---|---|---|
| HR (95%CI) | P-value | HR (95%CI) | P-value | |||
| Separate Associations | ||||||
|
METS-IR Status |
Low METS-IR | 394(8.5%) | Ref. | -- | Ref. | -- |
| High METS-IR | 167(10.8) | 1.44(1.20 – 1.73) | <0.001 | 1.33(1.11 – 1.60) | <0.003 | |
|
SCMI Status |
SCMI Absent | 352(7.5) | Ref. | -- | Ref. | -- |
| SCMI Present | 211(14.4) | 1.63(1.37 – 1.94) | <0.001 | 1.44(1.21 – 1.72) | <0.001 | |
| Joint Associations | ||||||
|
METS-IR & SCMI Categories |
SCMI Absent with Low METS-IR | 264(7.3) | Ref. | -- | Ref. | -- |
| SCMI Absent with High METS-IR | 88(8.2) | 1.23(0.97 – 1.57) | 0.088 | 1.15(0.90 – 1.47) | 0.277 | |
| SCMI Present with Low METS-IR | 130(12.6) | 1.44(1.17 – 1.79) | <0.001 | 1.29(1.04 – 1.60) | 0.020 | |
| SCMI Present with High METS-IR | 79(17.0) | 2.37(1.84 – 3.06) | <0.001 | 1.98(1.53 – 2.56) | <0.001 | |
| Subgroups | METS-IR | SCMI | No. Events (%)* |
Event Rate (/1,000 PY) |
Hazard Ratio (95% CI) |
P-value | Interaction P-value |
|---|---|---|---|---|---|---|---|
| Men | Low | Absent | 139 (8.2%) | 4.77 | Reference | -- | 0.569 |
| Low | Present | 72 (14.5%) | 10.11 | 1.25 (0.931–1.67) | 0.139 | ||
| High | Absent | 42 (8.6%) | 4.96 | 1.02 (0.673–1.54) | 0.931 | ||
| High | Present | 46 (17.6%) | 11.07 | 1.28 (0.764–2.13) | 0.350 | ||
| Women | Low | Absent | 125 (6.6%) | 3.61 | Reference | -- | |
| Low | Present | 58 (10.9%) | 6.61 | 1.32 (0.962–1.81) | 0.085 | ||
| High | Absent | 46 (7.9%) | 4.52 | 1.39 (0.895–2.15) | 0.143 | ||
| High | Present | 33 (16.2%) | 10.59 | 1.56 (0.901–2.71) | 0.112 | ||
| Blacks | Low | Absent | 72 (8.1%) | 4.64 | Reference | -- | 0.807 |
| Low | Present | 37 (12.8%) | 8.55 | 1.01 (0.666–1.52) | 0.977 | ||
| High | Absent | 22 (8.8%) | 5.22 | 1.31 (0.698–2.46) | 0.401 | ||
| High | Present | 16 (12.9%) | 8.35 | 1.18 (0.54–2.56) | 0.683 | ||
| Non-Blacks | Low | Absent | 192 (7.1%) | 3.98 | Reference | -- | |
| Low | Present | 93 (12.6%) | 8.03 | 1.40 (1.08–1.8) | 0.010 | ||
| High | Absent | 66 (8%) | 4.58 | 1.15 (0.816–1.63) | 0.422 | ||
| High | Present | 63 (18.4%) | 11.76 | 1.38 (0.9–2.13) | 0.138 | ||
| Age <65 years | Low | Absent | 110 (4%) | 2.14 | Reference | -- | 0.965 |
| Low | Present | 39 (6.3%) | 3.64 | 1.19 (0.819–1.72) | 0.364 | ||
| High | Absent | 51 (6%) | 3.31 | 1.43 (0.939–2.18) | 0.096 | ||
| High | Present | 41 (12.3%) | 7.32 | 1.44 (0.828–2.52) | 0.195 | ||
| Age ≥65 years | Low | Absent | 154 (18.3%) | 12.47 | Reference | -- | |
| Low | Present | 91 (22.1%) | 17.56 | 1.31 (1–1.71) | 0.048 | ||
| High | Absent | 37 (16.5%) | 11.54 | 0.95 (0.613–1.46) | 0.801 | ||
| High | Present | 38 (28.8%) | 22.76 | 1.36 (0.798–2.3) | 0.260 | ||
| Never Smoker | Low | Absent | 100 (6.2%) | 3.39 | Reference | -- | 0.091 |
| Low | Present | 41 (11%) | 6.56 | 1.23 (0.85–1.78) | 0.272 | ||
| High | Absent | 46 (8.6%) | 4.9 | 1.53 (0.961–2.44) | 0.073 | ||
| High | Present | 22 (12%) | 7.21 | 0.96 (0.507–1.8) | 0.887 | ||
| Ever Smoker | Low | Absent | 164 (8.2%) | 4.79 | Reference | -- | |
| Low | Present | 89 (13.6%) | 9.22 | 1.31 (1–1.7) | 0.049 | ||
| High | Absent | 42 (7.8%) | 4.54 | 0.91 (0.609–1.36) | 0.651 | ||
| High | Present | 57 (20.1%) | 13.51 | 1.74 (1.08–2.82) | 0.024 | ||
| BMI <30 | Low | Absent | 220 (7%) | 3.95 | Reference | -- | 0.260 |
| Low | Present | 117 (12.9%) | 8.49 | 1.39 (1.11–1.76) | 0.005 | ||
| High | Absent | 10 (5.7%) | 3.3 | 0.95 (0.497–1.81) | 0.873 | ||
| High | Present | 17 (18.3%) | 11.78 | 1.25 (0.55–2.82) | 0.599 | ||
| BMI ≥ 30 | Low | Absent | 44 (9.9%) | 5.45 | Reference | -- | |
| Low | Present | 13 (10.5%) | 6.13 | 0.79 (0.421–1.47) | 0.451 | ||
| High | Absent | 78 (8.7%) | 5.0 | 1.00 (0.663–1.5) | 0.984 | ||
| High | Present | 62 (16.6%) | 10.64 | 2.28 (1.12–4.63) | 0.023 | ||
| Annual Income <$20,000 |
Low | Absent | 151 (10.9%) | 6.55 | Reference | -- | 0.703 |
| Low | Present | 81 (16.6%) | 11.91 | 1.25 (0.942–1.65) | 0.123 | ||
| High | Absent | 51 (10.4%) | 6.19 | 1.15 (0.774–1.7) | 0.496 | ||
| High | Present | 47 (20.5%) | 14.34 | 1.48 (0.91–2.4) | 0.114 | ||
| Annual Income ≥$20,000 |
Low | Absent | 113 (5.1%) | 2.78 | Reference | -- | |
| Low | Present | 49 (9.1%) | 5.38 | 1.28 (0.915–1.8) | 0.148 | ||
| High | Absent | 37 (6.3%) | 3.56 | 1.12 (0.701–1.78) | 0.645 | ||
| High | Present | 32 (13.5%) | 8.01 | 1.33 (0.732–2.4) | 0.351 |
Disclaimer/Publisher’s Note: The statements, opinions and data contained in all publications are solely those of the individual author(s) and contributor(s) and not of MDPI and/or the editor(s). MDPI and/or the editor(s) disclaim responsibility for any injury to people or property resulting from any ideas, methods, instructions or products referred to in the content. |
© 2026 by the authors. Licensee MDPI, Basel, Switzerland. This article is an open access article distributed under the terms and conditions of the Creative Commons Attribution (CC BY) license.


