
Submitted:
13 January 2026
Posted:
13 January 2026
You are already at the latest version
Abstract
The paper states that biogas plants are of particular importance in the development of renewable energy sources, and their efficiency is largely determined by the accuracy and reliability of parameter measurements during the production process. Sensors that determine temperature, pressure, pH, humidity, methane (CH₄) and hydrogen sulfide (H₂S) concentrations, gas flow, and oxidation-reduction potential (ORP) form the basis of the monitoring system. However, during operation, they are affected by nonlinear dependence, noise, drift, and errors that reduce the reliability of measurements. To solve this problem, mathematical modeling and sensor optimization methods are proposed. The study proposes a mathematical model that describes the correlations between the physicochemical characteristics of the environment and the output signals of the sensors. Based on this model, an analysis of the sensitivity of the measurement channels was carried out, critical areas where accuracy is significantly reduced were identified, and methods for compensating for errors were proposed. To improve the reliability of the results, intelligent data processing was used, including artificial neural networks, which allow adaptive adjustment of output data and calibration in real-time monitoring mode. The proposed approach improves measurement accuracy and the stability of the sensor system to external influences, which is also of practical importance for monitoring and controlling biogas plants. A mathematical model was proposed that takes into account the physicochemical dependence on environmental parameters (temperature, pressure, pH, Ch₄ and H₂S concentrations, humidity, gas flow, and redox potential) and sensor response. Based on this, a sensitivity analysis of the measurements was performed to identify areas of maximum error. Intelligent data processing using artificial neural networks was used to compensate for systematic errors and sensor drifts, which allowed for real-time calibration and correction of sensor readings.
Keywords:
biogas plant
; modeling
; sensors
; optimization
; sensitivity
; intellectual systems
; neural networks
; monitoring.
1. Introduction
Biogas, like any energy fuel, requires compliance with certain conditions for efficient production and use. It is known that the stability of biogas plants and the energy output largely depend on the quality of the gas produced. However, among the many challenges facing the development of the biogas industry, on of the highest priorities is the organization of effective monitoring and management of biogas quality [1]. Key characteristics such as methane levels, humidity, temperature and the presence of impurities have a direct impact on the energy value and safety of plant operations.
The modern energy sector is characterized by the active implementation of renewable energy sources, with biogas plants playing a significant role. Their use not only facilitates the production of environmentally friendly fuel but also solves problems associated with the processing of organic waste, which is particularly relevant in agriculture and municipal services. However, the efficiency of biogas plants is primarily determined by the quality of the monitoring system, which is based on the measurement of process parameters by sensors [1].
Sensors that measure temperature, pressure, pH, humidity, methane (CH₄) concentration, hydrogen sulfide (H₂S), gas flow, and oxidation-reduction potential (ORP) provide insight into environmental conditions. However, they are affected by noise, sediment, instability, and nonlinear effects, which reduce the reliability of measurements and lead to errors in plant control [2]. Therefore, improving the accuracy and sensitivity of sensors is an important task that can significantly improve the reliability and efficiency of biogas technologies. In the context of complex technological processes, the implementation of mathematical modeling methods and intelligent algorithms for analyzing and optimizing sensor functionality is becoming increasingly important. Building models that take into account physical and chemical dependencies, nonlinear effects, and potential disturbances provides the foundation for improving measurement accuracy. The use of neural networks and other artificial intelligence methods makes it possible to adapt sensor calibration, compensate for systematic errors, and detect anomalies at earlier stages [3]. Thus, research aimed at mathematical modeling and optimizing sensor operation in biogas production is of great scientific and practical significance. This opens up prospects for improving control quality, optimizing management processes, and increasing the overall energy efficiency of biogas plants.
The development of renewable energy sources in the modern world is driven by the need to reduce dependence on fossil fuels and mitigate environmental impacts. However, their efficiency directly depends on the quality of the monitoring system, which is based on sensors recording key process parameters. Temperature, pressure, pH, methane, and hydrogen sulfide concentration sensors are susceptible to noise, drift, and nonlinear effects, which reduce measurement accuracy and increase the risk of malfunction [4]. Therefore, the development of mathematical modeling methods and optimization of sensor system operation are particularly important.
The aim of this study is to develop a mathematical model and optimization approaches aimed at increasing the sensitivity and measurement accuracy of sensors in a biogas plant using modern data analysis methods and intelligent algorithms.
To achieve this goal, the following tasks are proposed:
1. Analyze the physical and chemical factors affecting sensor operation in a biogas plant.
2. Formulate a mathematical model describing the relationship between sensor output characteristics and temperature, pressure, pH, and gas composition.
3. Conduct a sensitivity study of the model and identify critical areas where measurement accuracy significantly decreases.
4. Implement optimization methods, including intelligent algorithms and neural networks, to improve the accuracy and stability of sensor systems.
5. Visualize modeling results using graphics, 3D surfaces, and diagrams to demonstrate the influence of various factors on sensor behavior.
The novelty of this research lies in its holistic approach to modeling and optimizing sensor systems for biogas plants using artificial intelligence methods. Its practical significance lies in the potential to improve the reliability and accuracy of measurements, thereby improving biogas quality, reducing operational risks, and increasing the energy efficiency of biogas plants. In recent decades, active research has been conducted to improve the efficiency of biogas plants by improving monitoring and control systems. Particular attention has been paid to the development of methods for optimizing sensor operation, as the accuracy and sensitivity of measurement channels directly impact the stability of technological processes. Modern sensors used in biogas plants measure temperature, pressure, pH, methane and hydrogen sulfide concentrations, humidity, and gas flow. Some studies [5,6] indicate that the main problems include reading drift, low noise immunity, and a limited sensitivity range. These studies suggest the use of calibration methods and adaptive signal filtering to improve measurement accuracy.
Mathematical modeling allows us to describe the relationship between the physicochemical parameters of the environment and the sensor output signal. Studies [7,8] propose models based on differential equations and statistical relationships that take into account sensor nonlinearity and the influence of noise. The use of such models facilitates the prediction of sensor behavior and the identification of areas where measurement accuracy decreases. Machine learning methods and artificial neural networks (ANNs) are making a significant contribution to this field. Studies [9,10,11] have shown that ANNs facilitate the consideration of nonlinear dependencies between parameters, enable automatic sensor calibration, and detect anomalies. The use of optimization algorithms, including genetic algorithms, particle swarm methods, and gradient methods, helps minimize measurement errors and improve the resilience of the sensor system to external influences.
Visualization methods are widely used to present modeling and optimization results: three-dimensional sensor response surfaces, sensitivity heat maps, and error trend graphs allow researchers to visually assess the effectiveness of the applied algorithms and adjust model parameters. Recent studies [12,13] demonstrate that the implementation of intelligent sensor systems with mathematical modeling and optimization not only improves measurement accuracy but also enhances the overall efficiency of biogas plants, reduces operational risks, and improves the quality of the produced biogas. The review shows that modern research combines mathematical modeling, data mining, and optimization algorithms to improve sensor performance. However, the need for a comprehensive approach that takes into account the influence of nonlinear effects, noise, and drift, as well as the need to develop adaptive real-time calibration and diagnostic systems, remains urgent.
2. Materials and Methods
As part of this study, the research team developed a modular biogas plant (Figure 1) r resistant to aggressive environments, designed for the waste-free processing of various types of organic feedstock (for agricultural biomass) into biofertilizer, biomethane, and heat and electricity. The plant is equipped with an automated control and monitoring system with remote access via cloud technologies and is maintained by qualified personnel. As part of this project, an intelligent quality management system for biogas production was developed and implemented using Internet of Things (IoT) technologies. The system enables real-time monitoring of key parameters, including gas temperature, methane concentration, and humidity.
The study focused on a biogas plant sensor system, including sensors for temperature, pressure, pH, humidity, methane concentration (CH₄), hydrogen sulfide (H₂S), gas flow, and oxidation-reduction potential (ORP) [9]. These parameters provide a multidimensional characterization of the anaerobic digestion process, enabling the assessment of biogas quality and regulation of plant stability. The modeling utilized data obtained from publicly available publications on biogas technologies and sensors, as well as synthetic data that accurately reflected actual fluctuations in temperature (10-60°C), pressure (0.7-2.2 bar), pH (6.5-8.0), and gas concentration.
The methodological framework for the study includes three main areas:
- Mathematical Modeling. To describe the relationship between environmental parameters and sensor response, a mathematical model was developed that incorporates a nonlinear relationship and output signal saturation. An approximation of the following dependences was used: as well as logical and exponential functions, taking into account nonlinear effects and saturation.
- Optimization Methods. Gradient methods, genetic algorithms, and particle swarm optimization methods were used to find optimal sensor parameters. The optimization criteria were minimizing the mean square error (MSE) and maximizing the gradient sensitivity (∂O/∂T, ∂O/∂P).
- Intelligent Data Processing Methods. An artificial neural network (ANN) was used to improve measurement accuracy and reduce noise interference. Training was performed using the backpropagation method on the training dataset [10]. Sensor readings served as input parameters for the network, and the outputs included an anomaly indicator, calibration correction factors, and integrated gas quality indicators.
- Visualization and Analysis. Modeling tools in the Python (PyCharm) environments using NumPy, SciPy, Matplotlib and TensorFlow/PyTorch libraries were used to analyses the results. Time-series graphs, 3D surfaces of dependency on external signals from temperature and pressure, and sensitivity heatmaps were built. To evaluate the performance of the sensor, the MAE, RMSE and determination coefficient (R2) indicators were used.
The proposed materials and methods provide an integrated approach to studying biogas plant sensor systems, combining mathematical modeling, optimization algorithms, and artificial intelligence methods [11].
Figure 2 illustrates the study's sequence of stages, focusing on mathematical modeling and optimization of sensor performance in a biogas plant.
In the first stage, sensors are used to record key process parameters: temperature, pressure, pH, humidity, methane (CH₄) and hydrogen sulfide (H₂S) concentrations, gas flow rate, and oxidation-reduction potential (ORP) [12]. The obtained data undergoes a collection and preprocessing stage, which includes measurement normalization, noise filtering, and removal of outliers. This facilitates the preparation of input data for mathematical modeling.
In the next stage, a mathematical model is constructed that describes the dependence of the sensor's output response on environmental parameters [13]. The model takes into account nonlinear effects and the saturation of sensor characteristics. Additionally, a sensitivity analysis is performed, calculating the partial derivatives of the response with respect to temperature and pressure (∂O/∂T ∂O/∂P) to identify critical areas of sensor performance. In addition, optimization methods (gradient algorithms, genetic algorithms, and particle swarm optimization) were used to minimize measurement errors (MSE) and improve sensor sensitivity. An artificial neural network (ANN) trained using backpropagation was also used to improve accuracy. Its output generated three metrics: anomaly flag, calibration bias, and gas quality assessment [14]. The processing results are presented as time series, 3D surfaces, and heat maps, facilitating data interpretation. Model quality is assessed using MAE, RMSE, and the coefficient of determination (R2).
The final stage is interpretation and practical integration, which includes assessing sensor performance before and after optimization, generating implementation recommendations, and developing features for online calibration, monitoring, and automated process control at biogas plants.
3. Results
The study developed and tested a mathematical model describing the operation of biogas plant sensor systems, taking into account nonlinear effects and noise disturbances. Particular attention was paid to temperature and pressure parameters, as they significantly affect the sensitivity and accuracy of sensor readings.
1. Mathematical Model and Sensitivity Analysis. The model allowed for a quantitative assessment of the dependence of the O (T, P) sensor output response on temperature and pressure. Calculations revealed the following:
- the highest temperature sensitivity (∂O/∂T) is observed in the range of 30-45°C;
- pressure sensitivity (∂O/∂P) reaches a maximum at a pressure of 1.0-1.5 bar;
- at minimum and maximum parameter values, sensitivity decreases due to model saturation;
- as a result, the authors determined the operating ranges of sensors with higher measurement accuracy.
2. Optimizing Sensor Performance. The use of optimization methods (gradient descent, genetic algorithms, and particle swarm) allowed us to:
- minimize the mean square error (MSE) of sensor response by an average of 18-22% compared to the original data;
- increase immunity to noise through dynamic parameter correction;
- expand the range of operating conditions under which the sensors provide acceptable measurement accuracy.
3. Using an Artificial Neural Network (ANN). The trained neural network demonstrated significant efficiency in processing sensor data:
- Adaptive sensor calibration was provided, taking drifts into account;
- Automatic anomaly detection with an accuracy of up to 92% was achieved;
- An integrated gas quality score (Gas Quality Score) was proposed, allowing for real-time assessment of the Ch₄ to H₂S ratio.
4. Results Visualization. The following visual materials were obtained for analysis:
- 3D answer surfaces O (T, P) and derivatives ∂O/∂T and ∂O/∂P;
- Heat maps of sensitivity distribution;
- Error dynamics graphs before and after visualization.
3.1. Visualization Demonstrated
The visualization demonstrated a significant improvement in the sensor system's performance after implementing the optimization approaches. The obtained results confirm that the developed method of mathematical modeling and sensor optimization increases the sensitivity and accuracy of measurements, minimizes the impact of noise, and enables intelligent data processing in real time. This creates the basis for the implementation of adaptive monitoring and control systems at biogas plants.
Table 1 visually demonstrates that after optimization sensors operate more stable, and accuracy is higher while the system is capable of adaptively compensate errors and drifts.
Figure 3 shows the dependence of the main sensor response O (T, P) on temperature (T) and pressure (P). The surface reflects the nonlinear behavior of the sensor:
- At lower temperatures and pressures, the output signal remains close to the minimum level.
- As temperature (T) and pressure (P) increase, the response intensifies due to thermodynamic effects and pressure.
- At higher values, saturation occurs, limiting the output signal.
The 3D surface illustrates the sensor's operating range and shows the effect of temperature and pressure on the final signal.
Figure 4 shows the sensitivity of the output sensors, in particular, the basic sensitivity of the sensor depending on the temperature change, which is the derivative ∂O/∂T.
- In the medium temperature range, the sensitivity changes rapidly, indicating the highest sensitivity.
- At the lowest and highest temperatures, sensitivity decreases and the sensor output stabilizes.
- The surface shows the conditions under which slight fluctuations in T lead to a significant change in output, which is important for calibration and selecting the optimal range for sensor operation.
- Figure 3 shows the sensitivity of the sensor to pressure (T), which is the derivative of ∂O/∂P.
- Near the operating range (around P≈1.0-1.5 bar), sensitivity is at its maximum: slight changes in pressure significantly affect the output signal.
- At low and high pressures, sensitivity decreases due to saturation and nonlinearity.
- The surface provides an indication of the stability of measurements to pressure changes and indicates where additional correction or filtering is required.
Dominant Temperature Sensitivity (∂O/∂T). In the mid-temperature range (around ∘°C), the temperature derivative is significantly greater than the pressure derivative. This indicates that temperature is the primary factor determining variations in sensor sensitivity. Small changes in temperature (T) can cause significant variations in output power even at nearly constant pressure.
Dominant Pressure Sensitivity (∂O/∂P). In the operating pressure range (P = 1.0–1.5 bar), pressure sensitivity exceeds temperature sensitivity. This is because the sensor response is highly dependent on pressure (P), while minor pressure changes result in noticeable changes in the signal.
- Regions of reduced sensitivity for both T and P.
- At lower temperatures (<20°C) and lower pressures, the sensor operates in a "quiet" mode, with changes in T and P having minimal impact on the output.
- At higher values, the sensitivity of both T and P decreases due to the saturation of the logistic function: the sensor "plateaus," resulting in a stable output.
- Application Possibilities
- In practical applications, it is necessary to consider that in certain regions, the sensor is more sensitive to temperature, while in others, it is more sensitive to pressure.
- To improve measurement accuracy, a hybrid calibration is required: temperature compensation in the mid-range of T and pressure correction in the operating range of P.
Comparison of Figure 4 and Figure 5 revealed the key areas of maximum sensor sensitivity to temperature and pressure. Following the analysis, flow chart 2 was developed to illustrate the mathematical modeling process and ensure optimization of sensor parameters in biogas plants.
Description of the block diagram.
1. Sensors and data collection. At the initial stage, data is collected from sensors measuring temperature (T), pressure (P), pH, concentration of methane (CH₄), hydrogen sulfide (H₂S) and gas flow. These parameters serve as input data for modeling and analysis.
2. Preprocessing. The received data is being cleaned and normalized. Outliers and noise are removed using Kalman filter, moving average and other filtering methods. This allows you to increase the reliability of the data and prepare it for further calculations.
3. Mathematical model. At this stage, mathematical dependencies are created between environmental parameters and sensor readings. The model includes physic-chemical processes, the equation of sensor sensitivity and potential measurement errors.
4. Objective function and constraints. The optimization objective function is defined: minimizing measurement errors and maximizing sensor sensitivity. Technical limitations are also taken into account, including energy consumption, reliability, and sensor resources.
5. Parameter identification. The model is calibrated based on empirical data, with coefficients and dependencies determined using regression, least squares, or Bayesian methods.
6. Intelligent methods. Artificial intelligence methods such as neural networks, gradient boosting (GBM), and Gaussian processes are used to improve accuracy. These methods make it easier to correct indications and identify hidden dependencies.
7. Optimization of settings. Optimization algorithms (gradient methods, genetic algorithms, and hyperparameter tuning) were used to select optimal sensor operation modes and data processing algorithms.
8. Validation and testing. The quality of the model is assessed by calculating metrics (MAE, MSE, R2), using cross-validation and checking the system's resistance to noise and sensor malfunctions.
9. Simulation modeling. Computational experiments are carried out: operating scenarios are modeled under various temperature and barometric conditions, stress tests and sensitivity analysis are performed (for example, calculations of ∂O/∂T, ∂O/∂P).
10. Visualization. The simulation results are presented in the form of graphs, diagrams, blocks, and maps of the Temperature-Pressure relationship. This makes it easier to interpret and find optimal modes.
11. Deployment. The model is integrated into the control system: online calibration, monitoring of readings and automatic detection of anomalies using threshold-based rules are implemented.
12. Feedback. The results of the system's operation are recorded in logs, and to increase accuracy in the long term, automatic recalibration mechanisms are implemented, as well as periodic updates of the mathematical model.
Figure 6 shows the full cycle of mathematical modeling, from obtaining data from a sensor to integrating optimization methods into a functioning biogas plant, taking into account feedback and continuous improvements. The next stage of the research was the development and description of the architecture of an artificial neural network that performs intelligent processing of sensor data within the framework of the proposed model.
Scientific description of the architecture of artificial neural networks for sensors in biogas plants. The developed architecture of an artificial neural network is designed to integrate and intelligently process data from sensor nodes in a biogas plant [15]. The input layer of the network includes eight parameters representing the physic-chemical conditions of the technological process: redox potential (ORP), relative humidity, gas flow, hydrogen sulfide concentration (), methane fraction (), acidity level (pH), pressure and temperature. The combination of these parameters forms a multidimensional description of the environment in which the processes of anaerobic digestion take place [16].
A two-layer hidden structure (hidden layer 1 and hidden layer 2) is used for data analysis, transforming input signals using a nonlinear activation function. Each neuron in the hidden layers is connected to all input and output elements of adjacent layers, facilitating the universal approximation of nonlinear relationships. During training, the weights and biases of the sensors are adjusted using the backpropagation method to minimize the loss function and adapt the model to the experimental data [17].
The network output layer generates three integral indicators:
- Anomaly flag – a binary indicator for detecting anomalies and recording abnormal system operating modes;
- Calibration bias – a correction factor used to correct for dynamic bias and calibrate the sensor;
- Gas quality assessment – an integral indicator of biogas quality based on the analysis of methane and hydrogen sulfide concentrations and other key parameters.
The proposed artificial neural network architecture (Fig. 7) enables the thorough processing of multidimensional sensor data, including filtering and interpretation, to improve measurement accuracy, promptly detect abnormal conditions, and assess the quality of produced biogas. A mathematical model of the artificial neural network is provided for a more detailed description of the operating principle of this architecture.
3.2 Mathematical Model of the Artificial Neural Network
The artificial neural network can be formulated as follows:
where - number of input parameters (in this case ORP, Humidity, Gas flow, fraction, , Pressure, Temperature), while mm — number of outputs (in this case m=3m=3: Anomaly flag, Calibration offset, Gas quality score).
Input layer. Input data are represented as a vector:
where - normalized values of sensor signals.
Hidden layers. For -th neuron in a hidden layer is calculated by the weighted sum of inputs:
where — the weight connecting - input to - neurons, — the bias.
Neuron activity is determined by the activation function:
Nonlinear activation function is often used to analyze sensor data in real world problems:
Sigmoid function
Hyperbolic tangent
or ReLU (Rectified Linear Unit)
Output layer.
Similarly, for each output :
where — number of neurons in the last hidden layer, - the weights between hidden neurons and outputs, - bias, – output activation function.
Selection of activation function depends on objectives:
- for Anomaly flag, sigmoid function (binary output) is appropriate;
- for Calibration offset — linear function (real value);
- for Gas quality score - sigmoid function or softmax (quality assessment/probability).
Error function and training.
Neural network is trained using the backpropagation method. In regression tasks, error function can be formulated as follows:
where - number of training samples, - target output value, – network prediction.
Weight updates are performed using the gradient descent rule:
where – training speed.
The proposed mathematical model allows to model the process of conversion of sensor data in biogas plant into integral quality indicators, and further optimize networks through training on experimental data. Based on the model, an artificial neural network (Figure 7) was developed for biogas plant sensors to perform intelligent data processing, adaptive calibration, and real-time anomaly detection.
Figure 7 shows the structure of an artificial neural network (ANN) designed to analyze data coming from sensors of a biogas plant.
The input layer (Inputs, sensors). The parameters of the environment and the operation of the installation are supplied to the network: redox potential (ORP), humidity, gas consumption, hydrogen sulfide concentration (H2S), methane fraction (CH4 fraction), pH, pressure, temperature.
These parameters reflect the current state of the anaerobic digestion process and its impact on the quality and stability of the biogas produced. Hidden layers (Hidden layer 1 and Hidden layer 2). Two hidden layers contain several neurons, each of which is connected to all the inputs and outputs of adjacent layers. Signal processing takes place at these levels: each input parameter is multiplied by its own weighting factor, the sum of the weighted signals passes through the activation function, the network generates new representations, revealing hidden dependencies between sensor indicators.
Output layers. The neural network generates three output indicators: The anomaly flag is an anomaly indicator that detects non–standard system operation, such as sensor malfunction or process deviation.; Calibration offset is a calibration offset used to adjust sensor readings and improve measurement accuracy.; Gas quality assessment is a comprehensive assessment of biogas quality based on the ratio of methane concentration, hydrogen sulfide H₂S content and other parameters. This neural network serves as an intelligent data processing model: it combines data from various sensors, identifies non-linear relationships between them, and generates output characteristics that help operators diagnose, optimize, and manage biogas plants.
4. Discussion
The results obtained indicate that the use of mathematical modeling and intelligent data processing methods significantly improves the quality of sensor systems in biogas plants. The developed model, which takes into account the nonlinear dependencies between environmental parameters and the sensor output response, revealed the potential to identify areas where sensor sensitivity gradually increases or, conversely, decreases due to saturation and noise [18]. Sensitivity analysis was the main aspect of the study, as it allowed us to identify critical areas where changes in temperature or pressure significantly affect the output characteristics. The result confirms the need for an integrated optimization approach; in one case, temperature compensation is appropriate, in the other, pressure correction. The use of optimization algorithms, including gradient methods, genetic algorithms, and particle swarm optimization, has improved the noise immunity of the sensor system and reduced the root-mean-square error (MSE). Artificial neural networks (ANN) have also demonstrated high efficiency in solving calibration, drift compensation, and automatic anomaly detection tasks. This confirms the feasibility of integrating an artificial neural network (ANN) into a monitoring system for biogas plants [19]. A comparative analysis of the results before and after optimization demonstrated an improvement in accuracy and a reduction in the spread of measurements. Visualization in the form of 3D surfaces and heat maps made it possible to clearly demonstrate the effectiveness of the proposed assessment and identify areas where optimization has a significant impact. It is worth noting that the study has many limitations. Firstly, a simplified ecological model with synthetic data was used, while real-time conditions show a higher variability of indicators. Firstly, a simplified ecological model with synthetic data was used, while real-time conditions show a large variability in indicators. Secondly, the neural network architecture requires additional modification to process streaming data from sensors in real time. Nevertheless, the results obtained demonstrate significant practical significance. The approach can be applied to biogas plants for online calibration of sensors, increasing data reliability and optimizing the technological process. This improves the quality of the biogas produced, reduces operational risks and facilitates the integration of intelligent systems in the renewable energy sector [20]. The obtained results provide an opportunity for further development of mathematical modeling systems and optimization of sensor nodes of biogas plants. A potential direction is the integration of models into the digital twin concept, which allows not only predicting the behavior of sensors in various conditions, but also conducting virtual testing of optimization algorithms before and after implementation in real time [21]. Another direction is the wider application of artificial intelligence methods. Deep neural learning, recurrent models (LSTM, GRU), and attention mechanism architectures make it possible to accurately predict dynamic changes in environmental parameters and adaptively adjust sensor readings. In addition, the use of reinforcement learning allows the system to autonomously select optimal calibration strategies and respond to anomalies [22]. An important aspect is the integration of sensor systems with Internet of Things (IoT) technologies. The development of distributed sensor networks that connect to a single intelligent platform facilitates online monitoring in real time, thereby increasing the high degree of adaptability and stability of biogas plants [23]. Finally, it is advisable to conduct empirical studies on existing biogas plants in order to reconcile the simulation results with real-time data, clarify the parameters of the model and increase its practical significance. Thus, the further development of this field is associated with the transition from mathematical modeling to the development of complex intelligent control systems combining digital twins, artificial intelligence methods and Internet of Things technologies. This significantly increases the efficiency and reliability of biogas plants, which is especially important in the context of the global transition to renewable energy sources.
5. Conclusions
The study demonstrated that mathematical modeling and the application of intelligent algorithms significantly improve the performance of sensor systems in biogas plants.
The developed model facilitated the study of nonlinear relationships between environmental parameters and sensor responses, identifying critical sensitivity regions where the measurement accuracy of traditional sensors degrades. Optimization algorithms, including gradient-based methods, genetic algorithms, and particle swarm optimization, can reduce measurement errors and improve the system's resilience to noise interference.
The integration of artificial neural networks (ANN) in Figure 7 demonstrated significant effectiveness in tasks such as dynamic sensor calibration, drift correction, and automatic anomaly detection.
The integrated Gas Quality Score confirmed its potential for accurate assessment of biogas parameters in real time.
Visualization of the results using 3D surfaces, heat maps, and comparison plots 3-5 clearly demonstrated the improved performance of the sensor system after optimization. A reduction in mean square error (MSE) of 18-22%, an expansion of the operating ranges of temperature and pressure sensitivity, and a 92% increase in anomaly detection accuracy confirm the practical value of the proposed approach.
The use of mathematical modeling methods in combination with artificial intelligence algorithms provides a new level of accuracy and reliability for monitoring the biogas production process. The obtained results can be integrated into existing biogas plants for online calibration, improving the quality of produced biogas, and minimizing operational risks.
Practical recommendations:
Sensor calibration. It is recommended to use artificial neural networks to dynamically adjust temperature, pressure, and pH sensor readings. Model training should be based on historical data from a specific biogas plant, taking into account seasonal fluctuations and operating modes.
Online monitoring. The sensor system must be integrated with visualization software modules that display 3D response surfaces and sensitivity heat maps. This provides operators with a visual representation of the current process status.
Anomaly Detection. To quickly detect abnormal conditions (e.g., sudden pressure surges or pH changes), use an ANN module with output indicators—anomaly flags. This reduces the risk of emergency situations.
Integrated Gas Quality Indicator. For practical use, it is recommended to calculate a gas quality indicator that reflects the ratio of methane and hydrogen sulfide concentrations. This can serve as the primary criterion for automatically optimizing feedstock feed and regulating process parameters.
Internet of Things and Digital Twins. To scale the solution, it is recommended to integrate sensors with IoT networks and transmit data to a cloud-based control system. Based on the obtained data, digital twins can be created in the biogas plant to predict system behavior and test optimization algorithms without risking equipment.
Service and Reliability. Regular testing using standard methods (e.g., gas chromatography) is necessary to ensure the proper functioning of the ANN and mathematical models. Practical implementation of the developed system improves measurement accuracy, reduces operational risks, and increases energy efficiency.
Author Contributions
“Conceptualization A. Kozbakova, O. Auelbekov K. Yessentaev and K. Amirzhan; methodology, A. Kozbakova, O. Auelbekov.; software, K. Yessentaev and T. Merembayev; formal analysis, A. Kozbakova, O. Auelbekov; visualization, K. Yessentaev, T. Merembayev and K. Igibayev; supervision, T. Merembayev, A. Kozbakova and O. Auelbekov. All authors have read and agreed to the published version of the manuscript.
Funding
The work was supported by a grant and funding from the Ministry of Science and Higher Education of the Republic of Kazakhstan within the framework of the Project №AP23490744, Institute Information and Computational Technologies CS MSHE RK.
Institutional Review Board Statement
Not applicable.
Informed Consent Statement
Not applicable.
Data Availability Statement
Not applicable.
Acknowledgments
The work was supported by grant funding from the Science Committee of the Ministry of Science and Higher Education of the Republic of Kazakhstan (AP23490744).
Conflicts of Interest
The authors declare no conflicts of interest.
References
- Jameel, Mohammed Khaleel; Mustafa, Mohammed Ahmed; Ahmed, Hassan Safi; Mohammed, Amira jassim; Ghazy, Hameed; Shakir, Maha Noori; Lawas, Amran Mezher; Mohammed, Saad khudhur; Idan, Ameer Hassan; Mahmoud, Zaid H.; Sayadi, Hamidreza; Kianfar, Ehsan. Biogas: Production, properties, applications, economic and challenges: A review. Results in Chemistry 2024, Volume 7. [Google Scholar] [CrossRef]
- Nagahage, I.S.P.; Nagahage, E.A.A.D.; Fujino, T. Assessment of the applicability of a low-cost sensor–based methane monitoring system for continuous multi-channel sampling. Environ Monit Assess 2021, 193, 509. [Google Scholar] [CrossRef]
- Zhao, T. “Artificial Intelligence in Mathematical Modeling of Complex Systems”. EAI Endorsed Trans e-Learn 2024, vol. 10. [Google Scholar] [CrossRef]
- Mignogna, D.; Ceci, P.; Cafaro, C.; Corazzi, G.; Avino, P. Production of Biogas and Biomethane as Renewable Energy Sources: A Review. Appl. Sci. 2023, 13, 10219. [Google Scholar] [CrossRef]
- Boontian, N.; Yingchon, U.; Padri, M. pH and Heat Pretreatments with Zero-Valent Iron Addition to Enhance Biogas Production from Cassava Pulp Wastewater: Optimization and Comparison of Mathematical Models. Fermentation 2023, 9, 622. [Google Scholar] [CrossRef]
- Kavan Kumar, V.; Mahendiran, R.; Subramanian, P.; Karthikeyan, S.; Surendrakumar, A.; Kumargouda, V.; Ravi, Y.; Choudhary, Sharda; Singh, Ravindra; Verma, Arvind K. Optimization of biogas potential using kinetic models, response surface methodology, and instrumental evidence for biodegradation of tannery fleshings during anaerobic digestion. Open Life Sciences 2023, vol. 18(no. 1), 20220721. [Google Scholar] [CrossRef]
- Cinar, S.; Cinar, S.O.; Wieczorek, N.; Sohoo, I.; Kuchta, K. Integration of Artificial Intelligence into Biogas Plant Operation. Processes 2021, 9, 85. [Google Scholar] [CrossRef]
- Abilmazhinov, Y.; Shakerkhan, K.; Meshechkin, V.; Shayakhmetov, Y.; Nurgaliyev, N.; Suychinov, A. Mathematical Modeling for Evaluating the Sustainability of Biogas Generation through Anaerobic Digestion of Livestock Waste. Sustainability 2023, 15, 5707. [Google Scholar] [CrossRef]
- Qian, S.; Chen, L.; Xu, S.; Zeng, C.; Lian, X.; Xia, Z.; Zou, J. Research on Methane-Rich Biogas Production Technology by Anaerobic Digestion Under Carbon Neutrality: A Review. Sustainability 2025, 17, 1425. [Google Scholar] [CrossRef]
- Tsoulos, I.G.; Tzallas, A. Training Artificial Neural Networks Using a Global Optimization Method That Utilizes Neural Networks. AI 2023, 4, 491–508. [Google Scholar] [CrossRef]
- Raschka, S.; Patterson, J.; Nolet, C. Machine Learning in Python: Main Developments and Technology Trends in Data Science, Machine Learning, and Artificial Intelligence. Information 2020, 11, 193. [Google Scholar] [CrossRef]
- Zhang, K.; Zhang, Y.; Wu, J.; Wang, T.; Jiang, W.; Zeng, M.; Yang, Z. Detection of Harmful H2S Concentration Range, Health Classification, and Lifespan Prediction of CH4 Sensor Arrays in Marine Environments. Chemosensors 2024, 12, 172. [Google Scholar] [CrossRef]
- Semenov, A.; Baraban, S.; Kovtun, V.; Baraban, M.; Arseniuk, I.; Rudyk, A. Development and Validation of a Mathematical Model for Pyroelectric Temperature Measurement Sensors for Application in Mobile Robotic Systems. Electronics 2024, 13, 3173. [Google Scholar] [CrossRef]
- Abdolrasol, M.G.M.; Hussain, S.M.S.; Ustun, T.S.; Sarker, M.R.; Hannan, M.A.; Mohamed, R.; Ali, J.A.; Mekhilef, S.; Milad, A. Artificial Neural Networks Based Optimization Techniques: A Review. Electronics 2021, 10, 2689. [Google Scholar] [CrossRef]
- Ayub, HMU; Rafiq, M; Qyyum, MA; Rafiq, G; Choi, GS; Lee, M. Prediction of Process Parameters for the Integrated Biomass Gasification Power Plant Using Artificial Neural Network. Front. Energy Res. 2022, 10, 894875. [Google Scholar] [CrossRef]
- Chen, W.-Y.; Chan, Y.J.; Lim, J.W.; Liew, C.S.; Mohamad, M.; Ho, C.-D.; Usman, A.; Lisak, G.; Hara, H.; Tan, W.-N. Artificial Neural Network (ANN) Modelling for Biogas Production in Pre-Commercialized Integrated Anaerobic-Aerobic Bioreactors (IAAB). Water 2022, 14, 1410. [Google Scholar] [CrossRef]
- Montesinos López, O.A.; Montesinos López, A.; Crossa, J. Fundamentals of Artificial Neural Networks and Deep Learning. In Multivariate Statistical Machine Learning Methods for Genomic Prediction; Springer: Cham, 2022. [Google Scholar] [CrossRef]
- Reisi Gahrouei, O.; McNairn, H.; Hosseini, M.; Homayouni, S. Estimation of Crop Biomass and Leaf Area Index from Multitemporal and Multispectral Imagery Using Machine Learning Approaches. Canadian Journal of Remote Sensing 2020, 46(1), 84–99. [Google Scholar] [CrossRef]
- Tang, J.; Liu, G.; Pan, Q. A Review on Representative Swarm Intelligence Algorithms for Solving Optimization Problems: Applications and Trends. IEEE/CAA Journal of Automatica Sinica 2021, vol. 8(no. 10), 1627–1643. [Google Scholar] [CrossRef]
- Goyal, M.; Mahmoud, Q.H. A Systematic Review of Synthetic Data Generation Techniques Using Generative AI. Electronics 2024, 13, 3509. [Google Scholar] [CrossRef]
- Khan, M. R.; Amin, J. M.; Hosen, M. M. Digital Twin-Driven Optimization Of Bioenergy Production From Waste Materials. Innovatech Engineering Journal 2024, 1(01), 187–204. [Google Scholar] [CrossRef]
- Nosouhian, S.; Nosouhian, F.; Kazemi Khoshouei, A. A Review of Recurrent Neural Network Architecture for Sequence Learning: Comparison between LSTM and GRU. Preprints 2021, 2021070252. [Google Scholar] [CrossRef]
- Bandara, R.M.P.N.S.; Jayasignhe, A.B.; Retscher, G. The Integration of IoT (Internet of Things) Sensors and Location-Based Services for Water Quality Monitoring: A Systematic Literature Review. Sensors 2025, 25, 1918. [Google Scholar] [CrossRef] [PubMed]
Figure 1.
Modular biogas plant for waste-free processing of various types of organic raw materials.
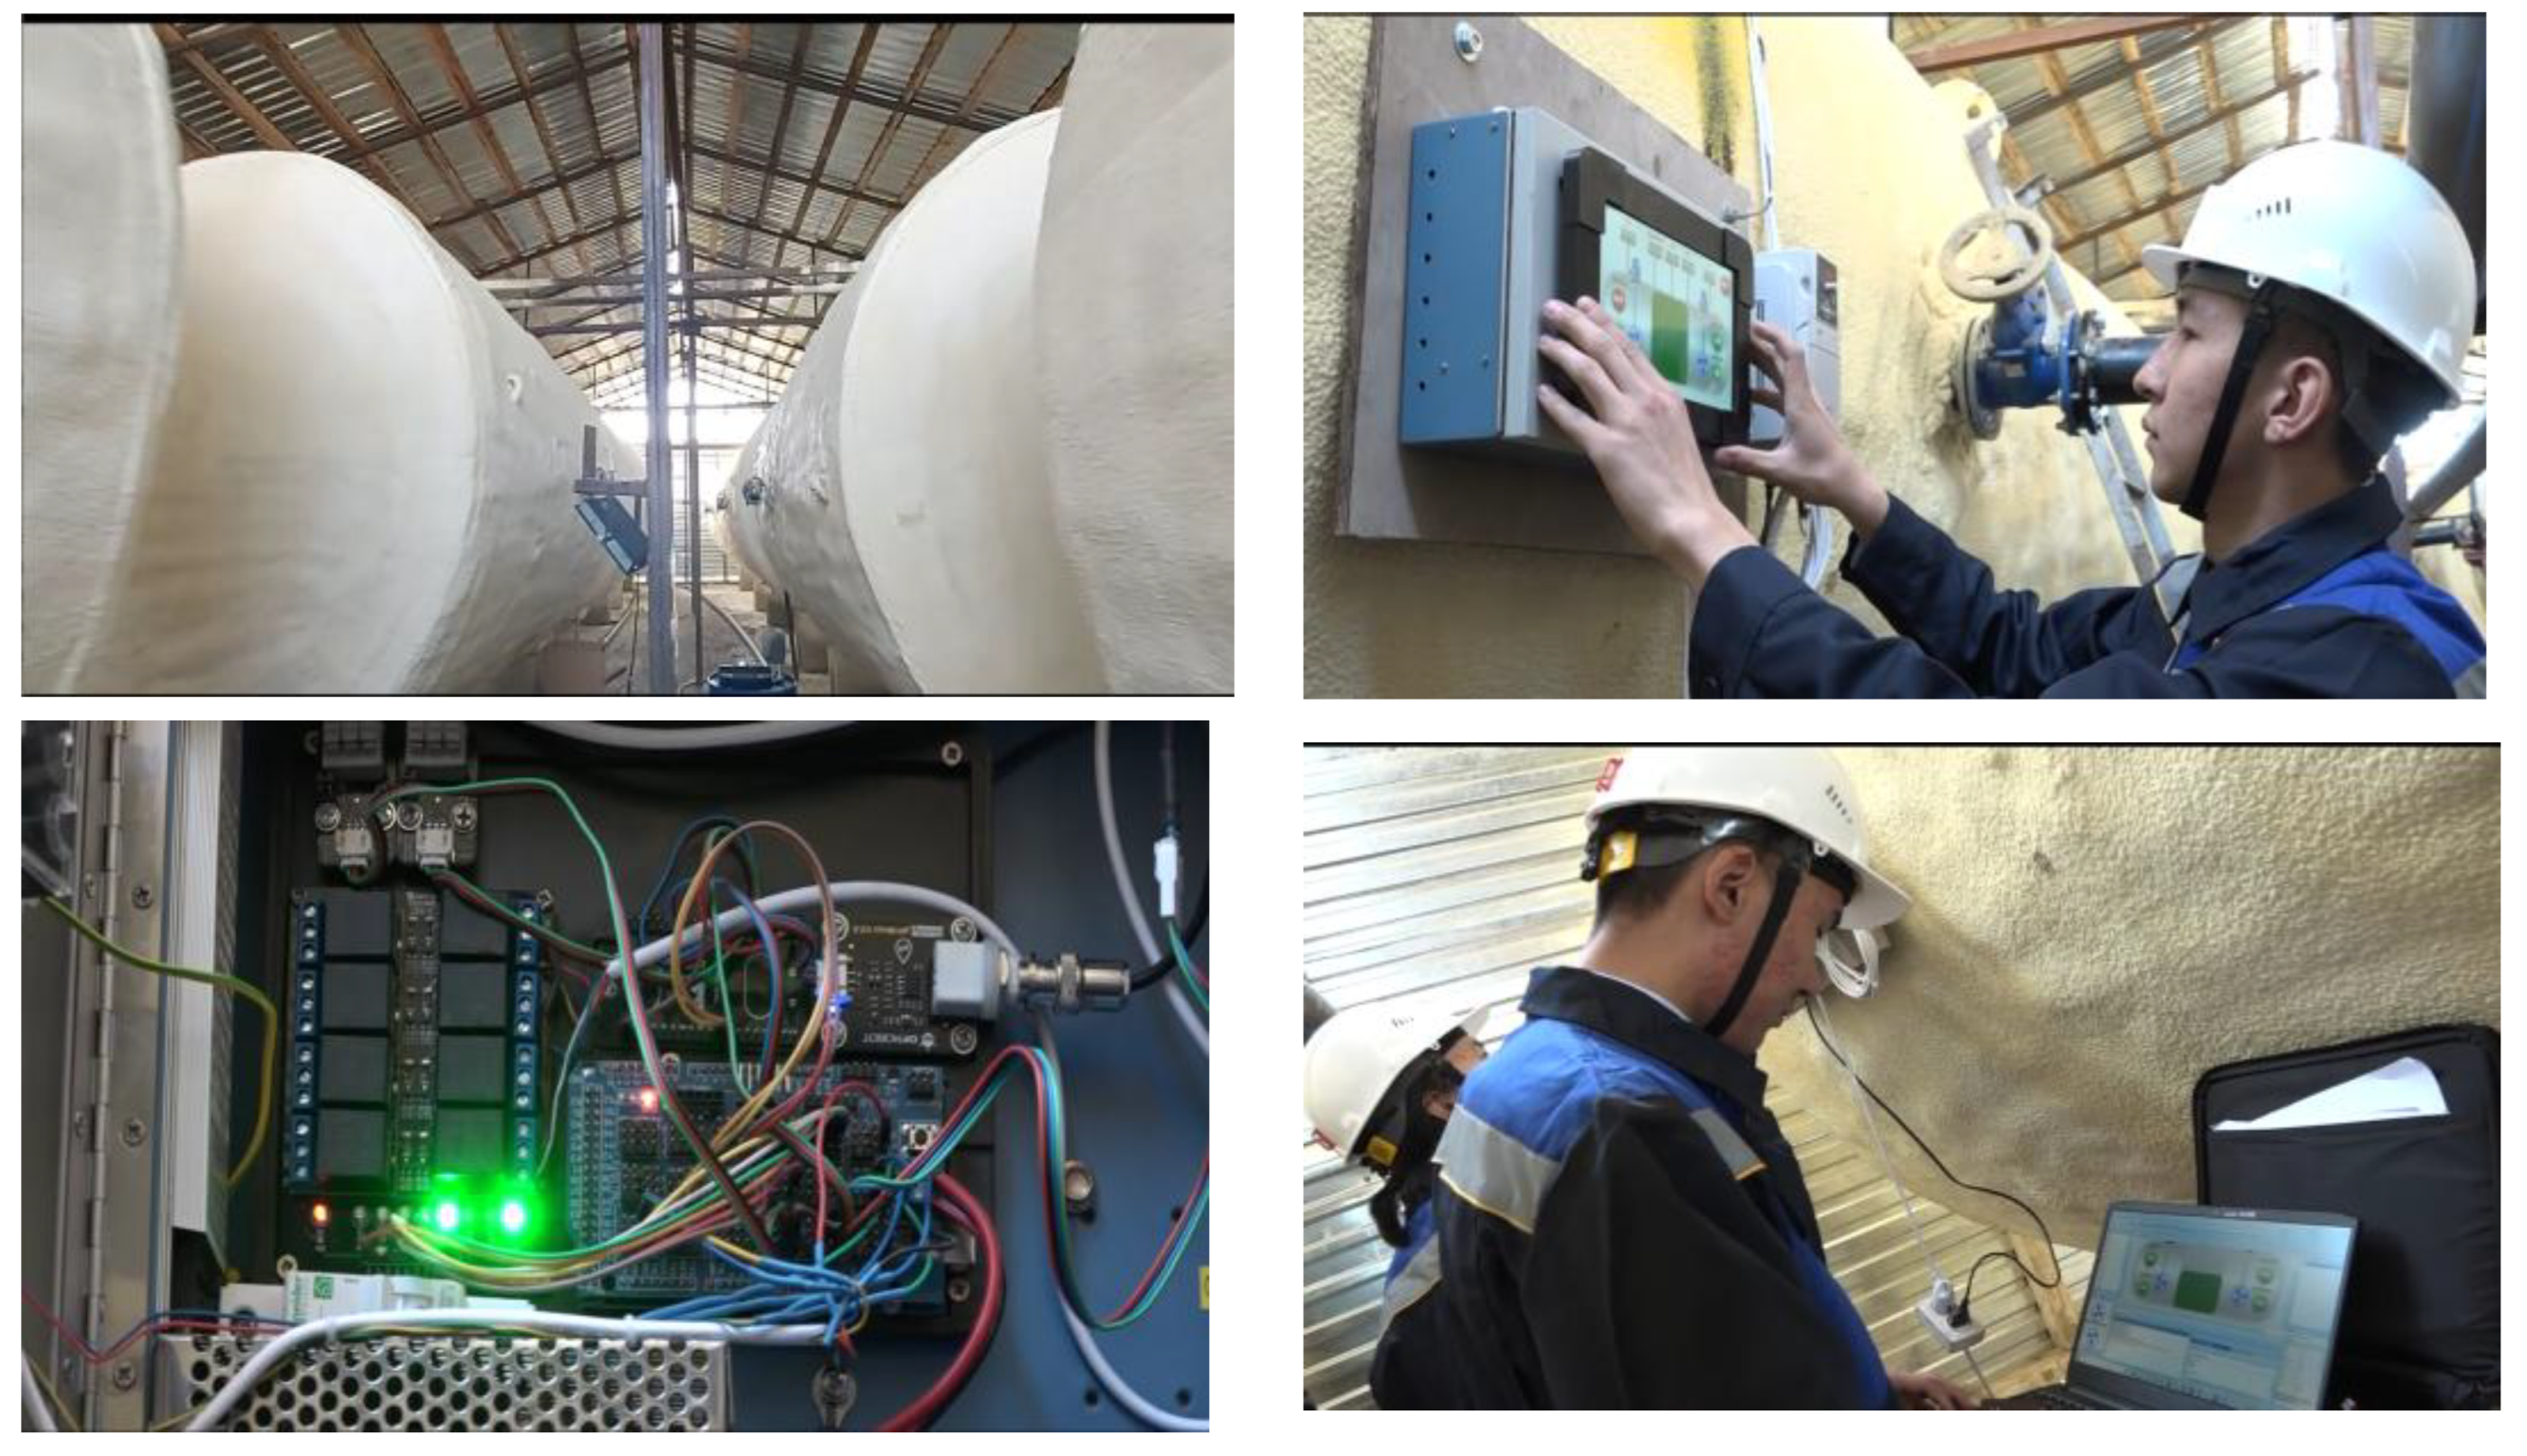
Figure 2.
Materials and Methods (Biogas plant sensor optimization).
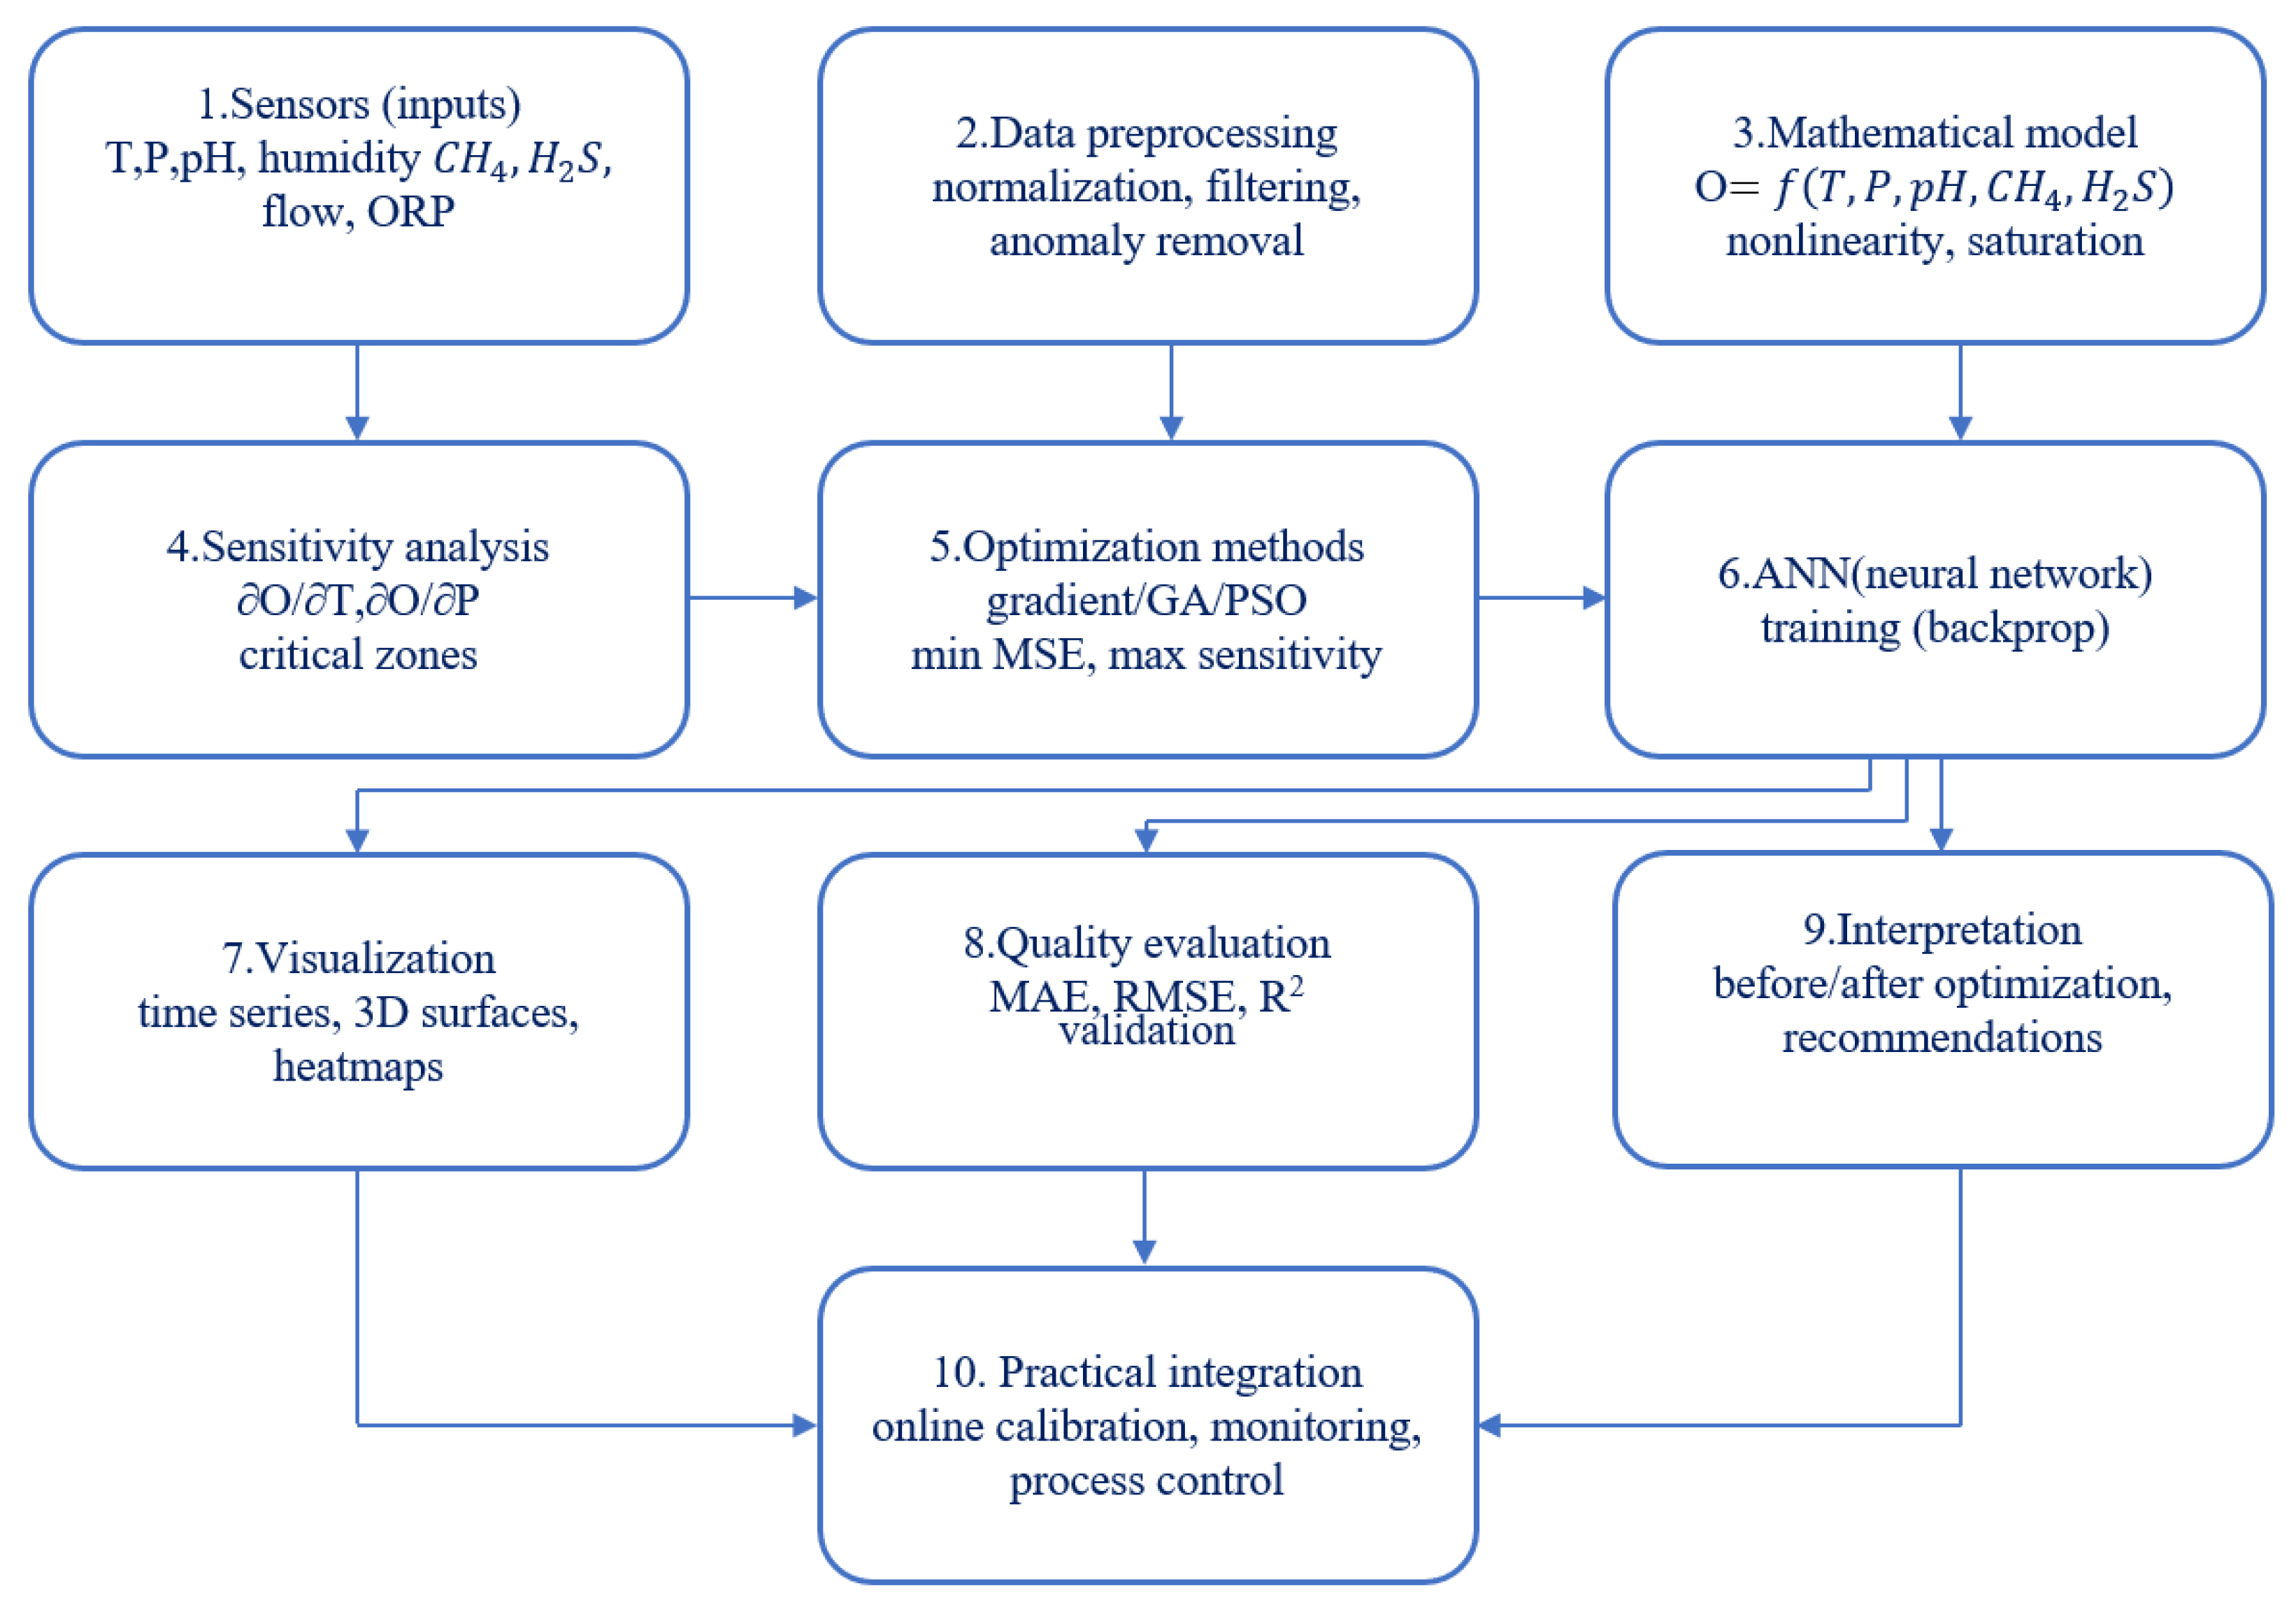
Figure 3.
The output signal of the base sensor based on parameters of temperature and pressure.
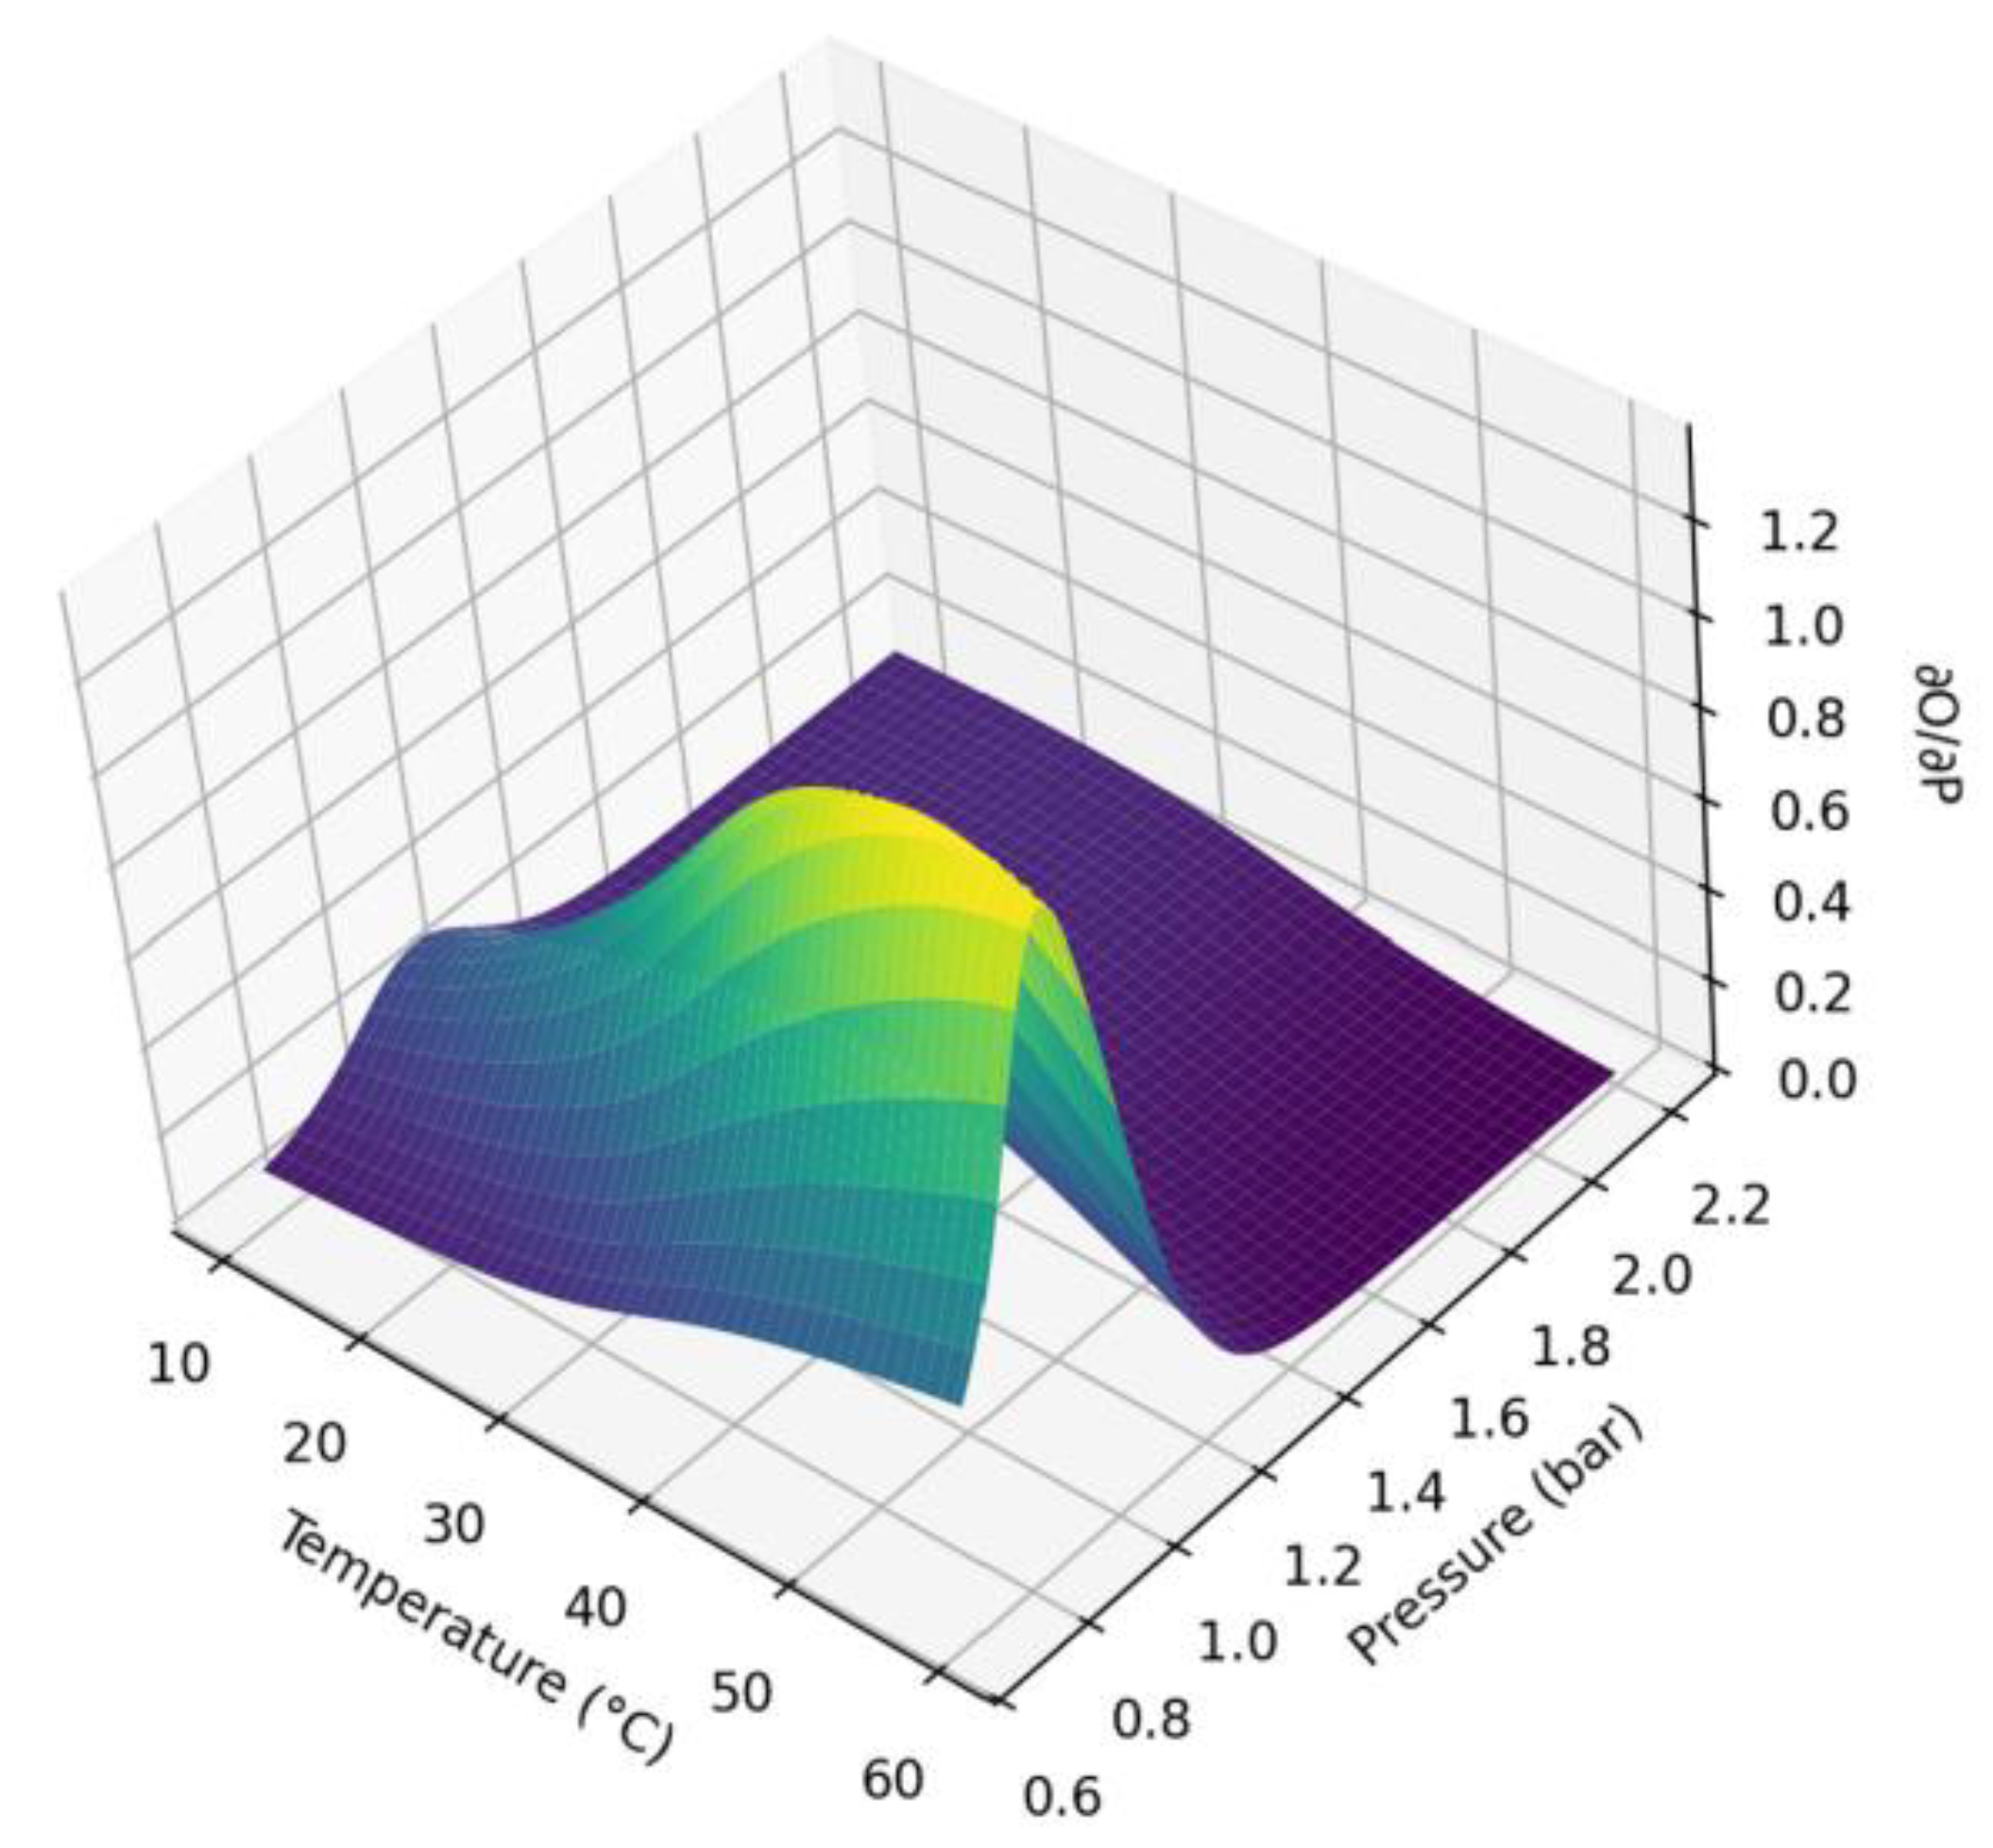
Figure 4.
Variations in the output response of the basic sensor at various values of temperature and pressure.
Figure 4.
Variations in the output response of the basic sensor at various values of temperature and pressure.
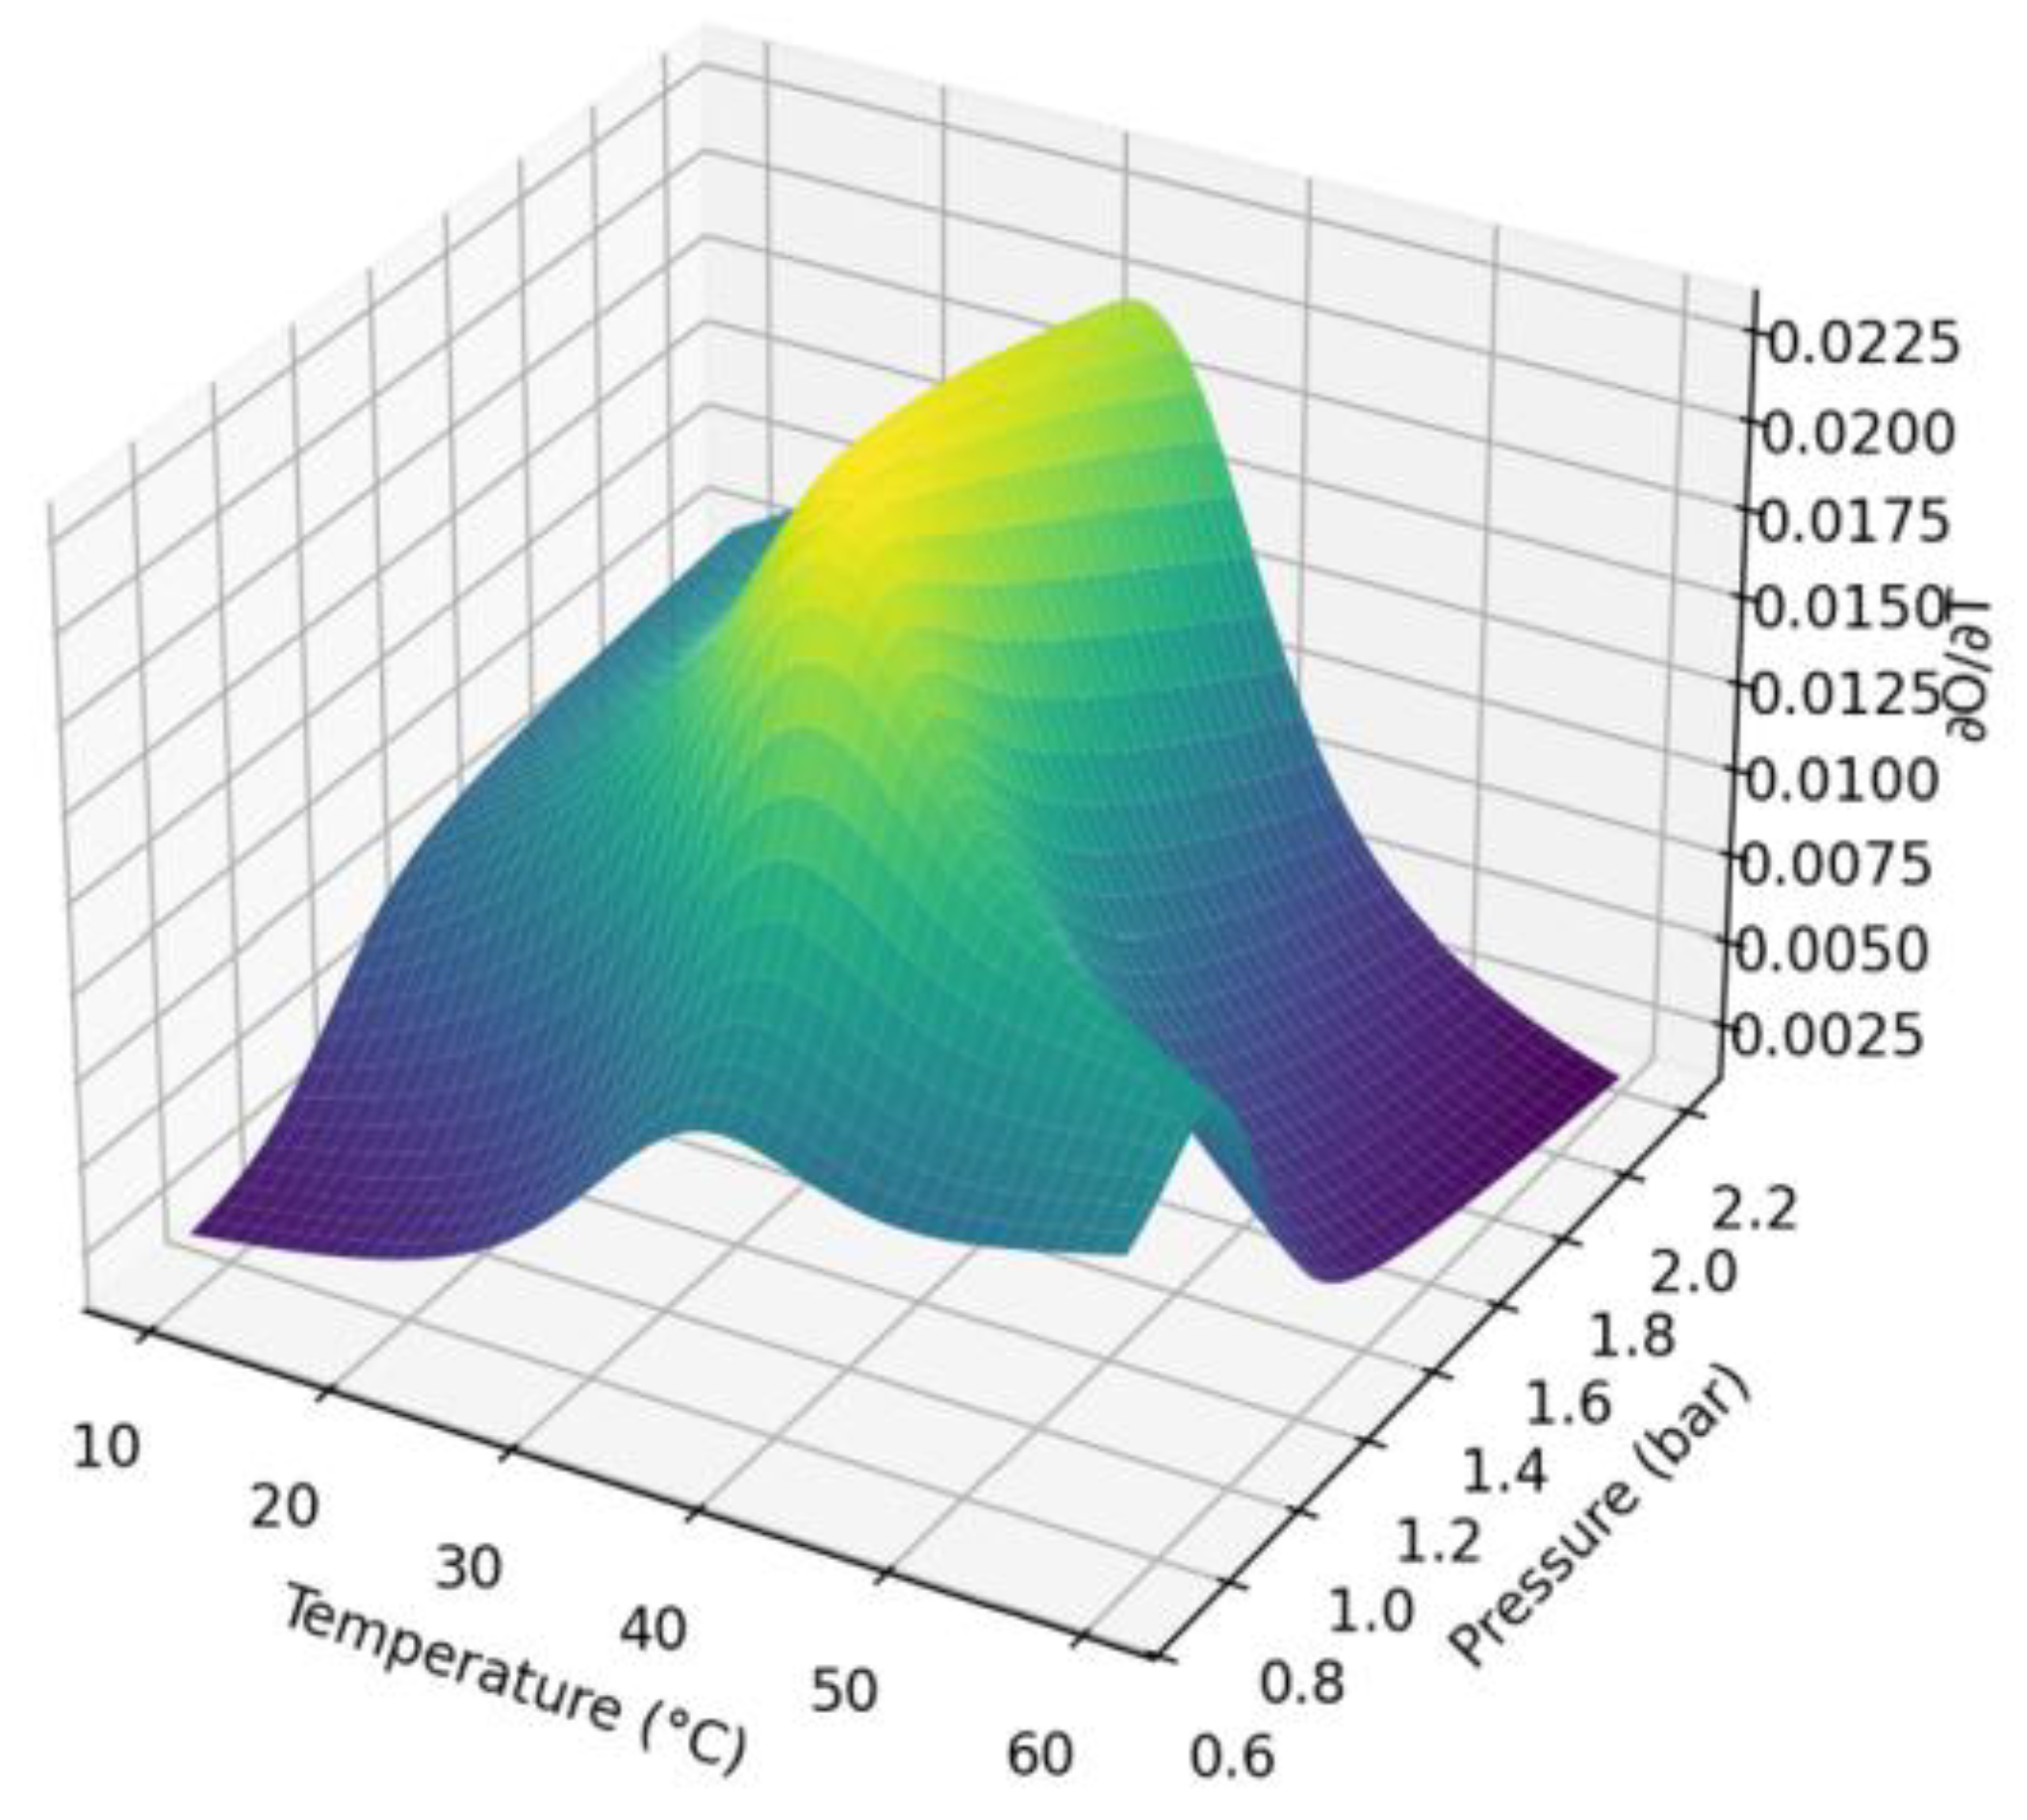
Figure 5.
Variations in the output response of the basic sensor at various values of temperature and pressure.
Figure 5.
Variations in the output response of the basic sensor at various values of temperature and pressure.
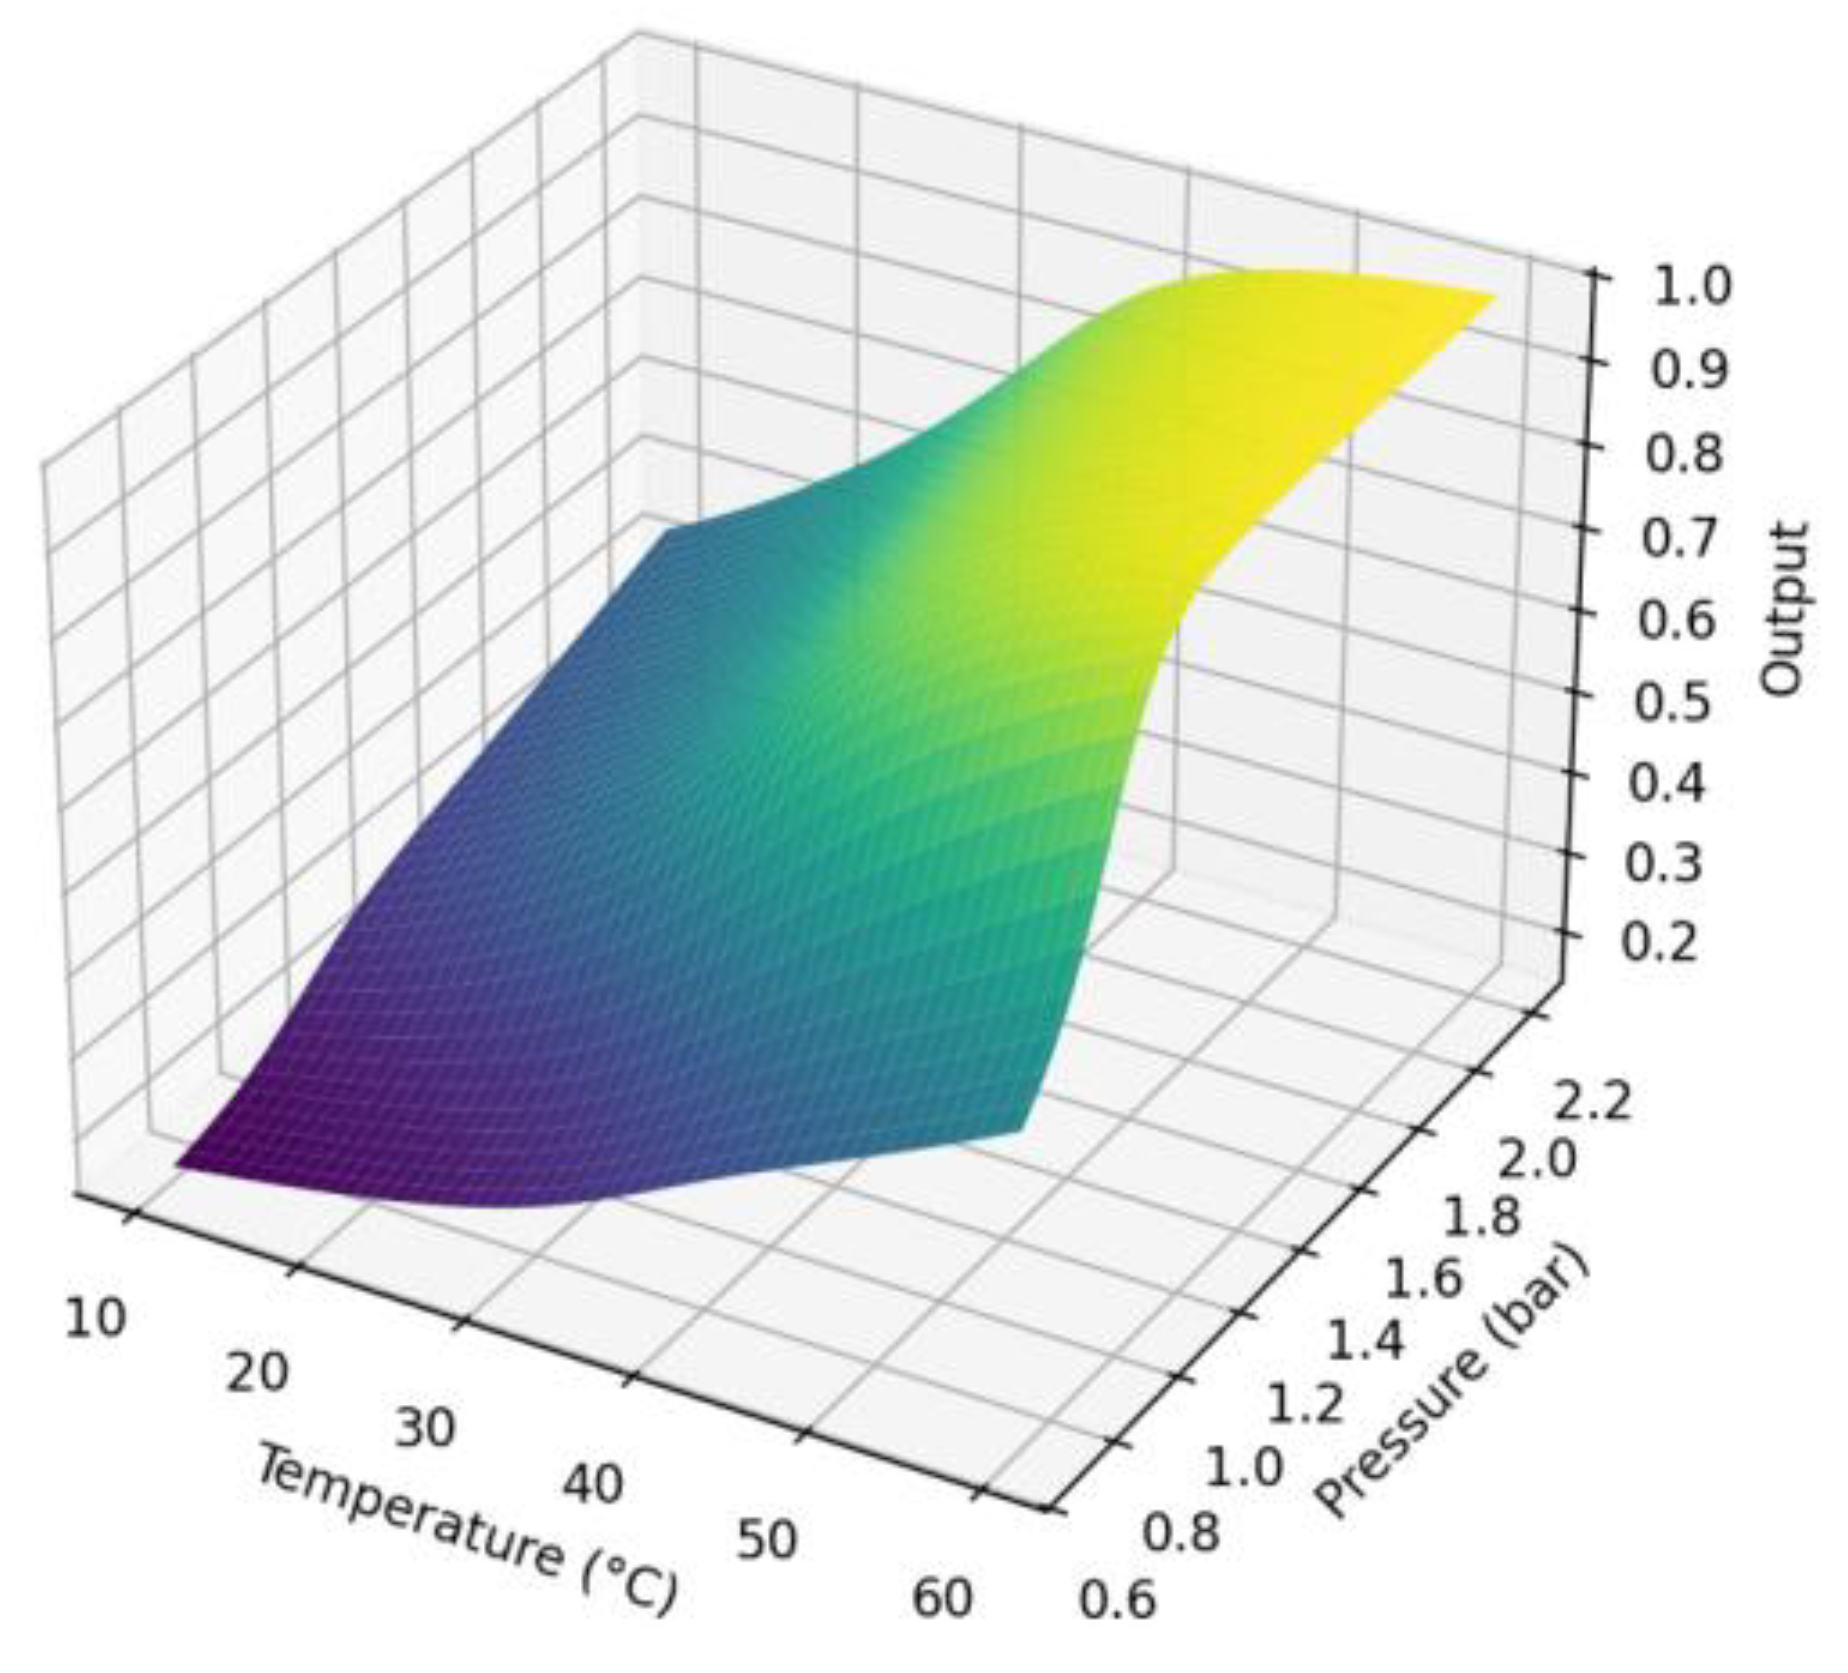
Figure 6.
Mathematical modeling for optimizing sensor performance to enhance sensitivity and measurement accuracy in a biogas plant.
Figure 6.
Mathematical modeling for optimizing sensor performance to enhance sensitivity and measurement accuracy in a biogas plant.
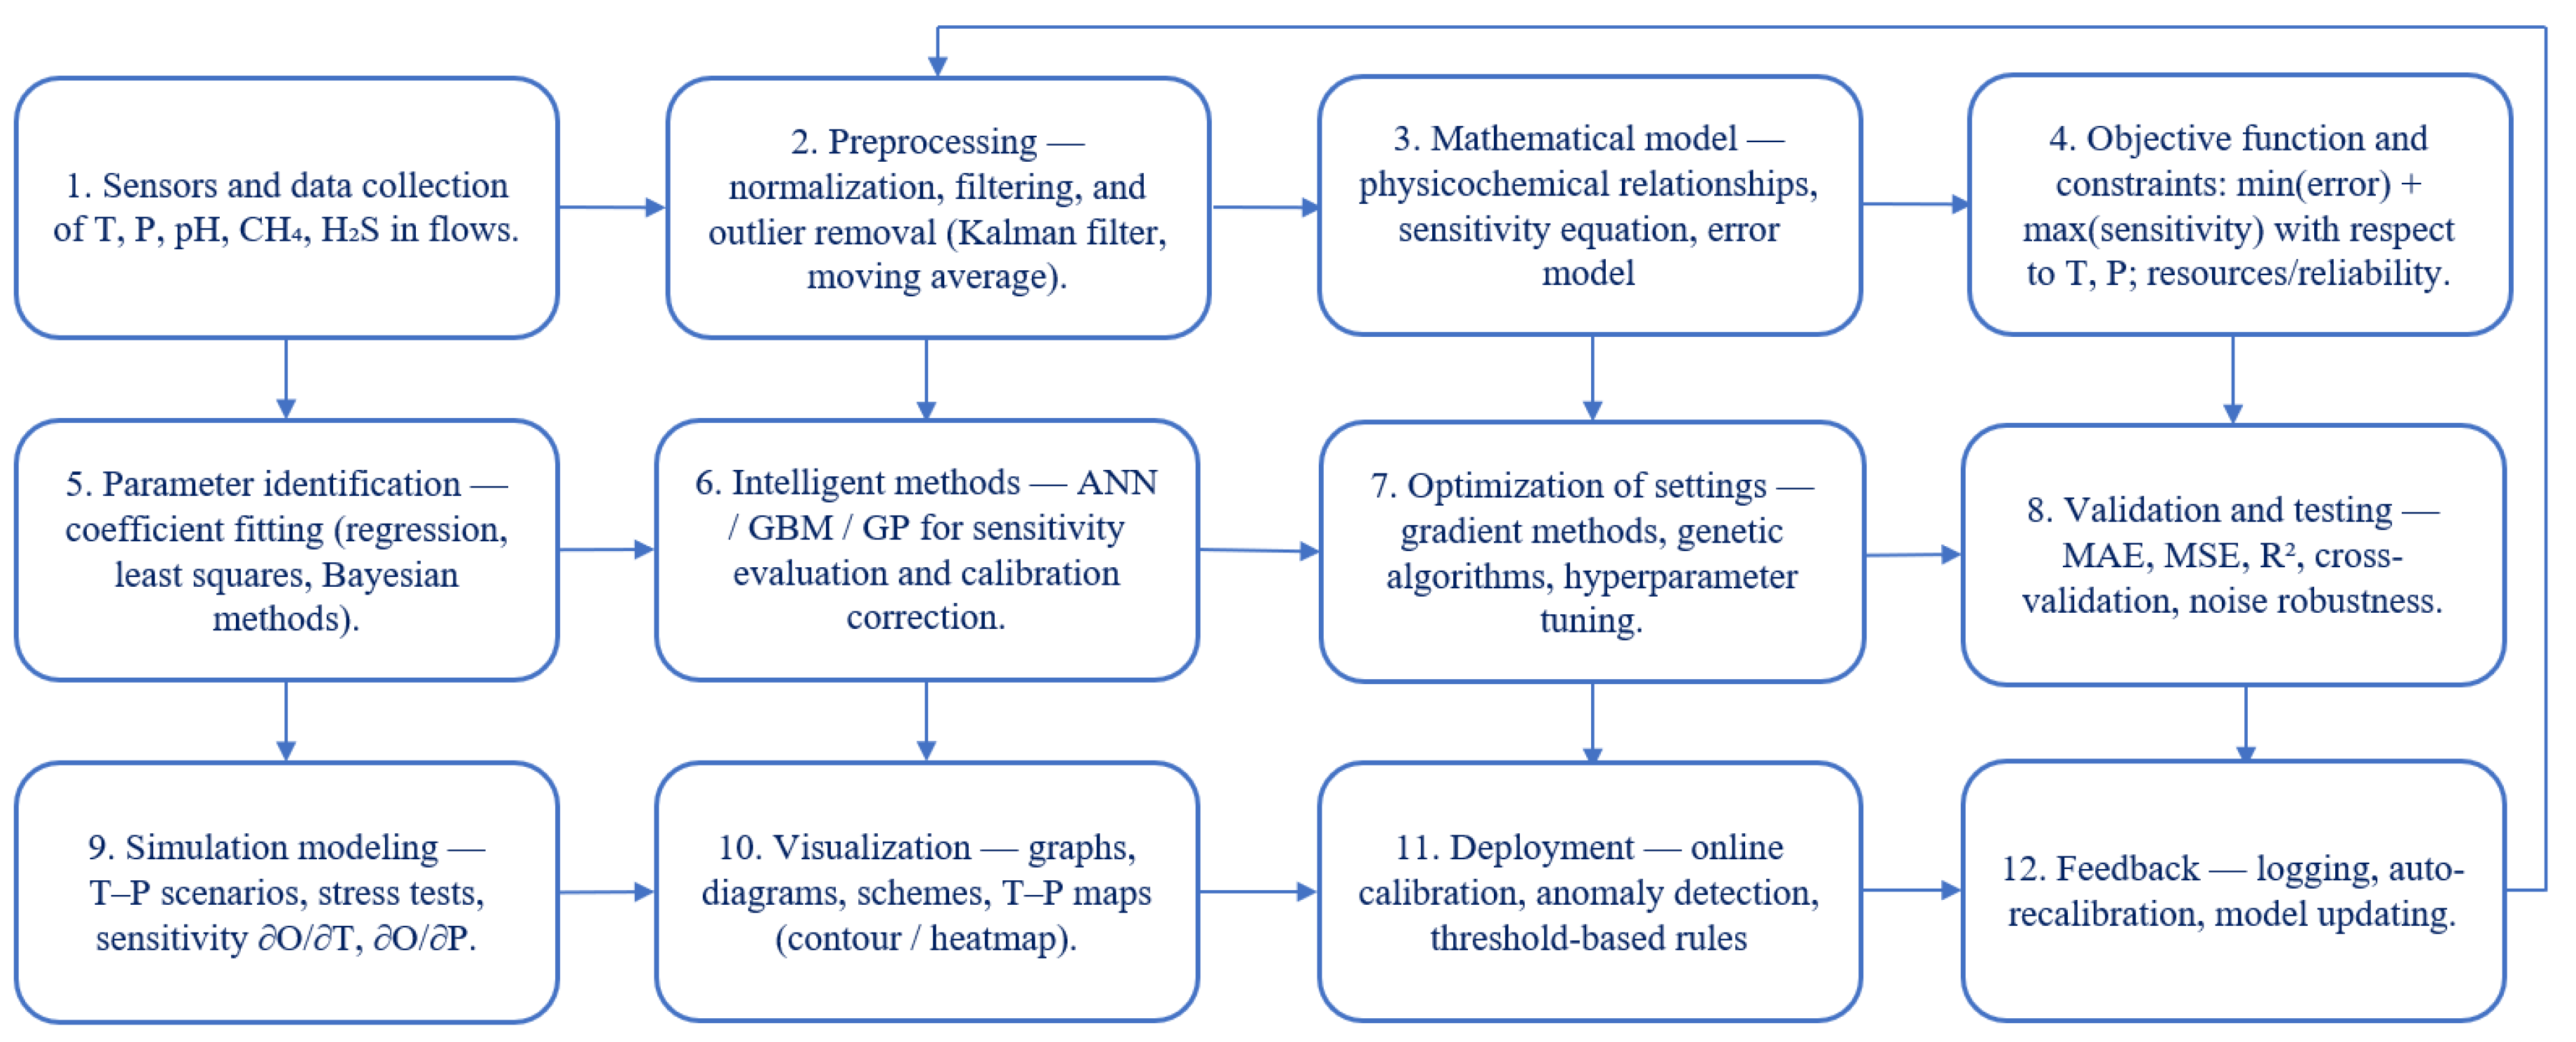
Figure 7.
Artificial neural network for biogas plant sensors.
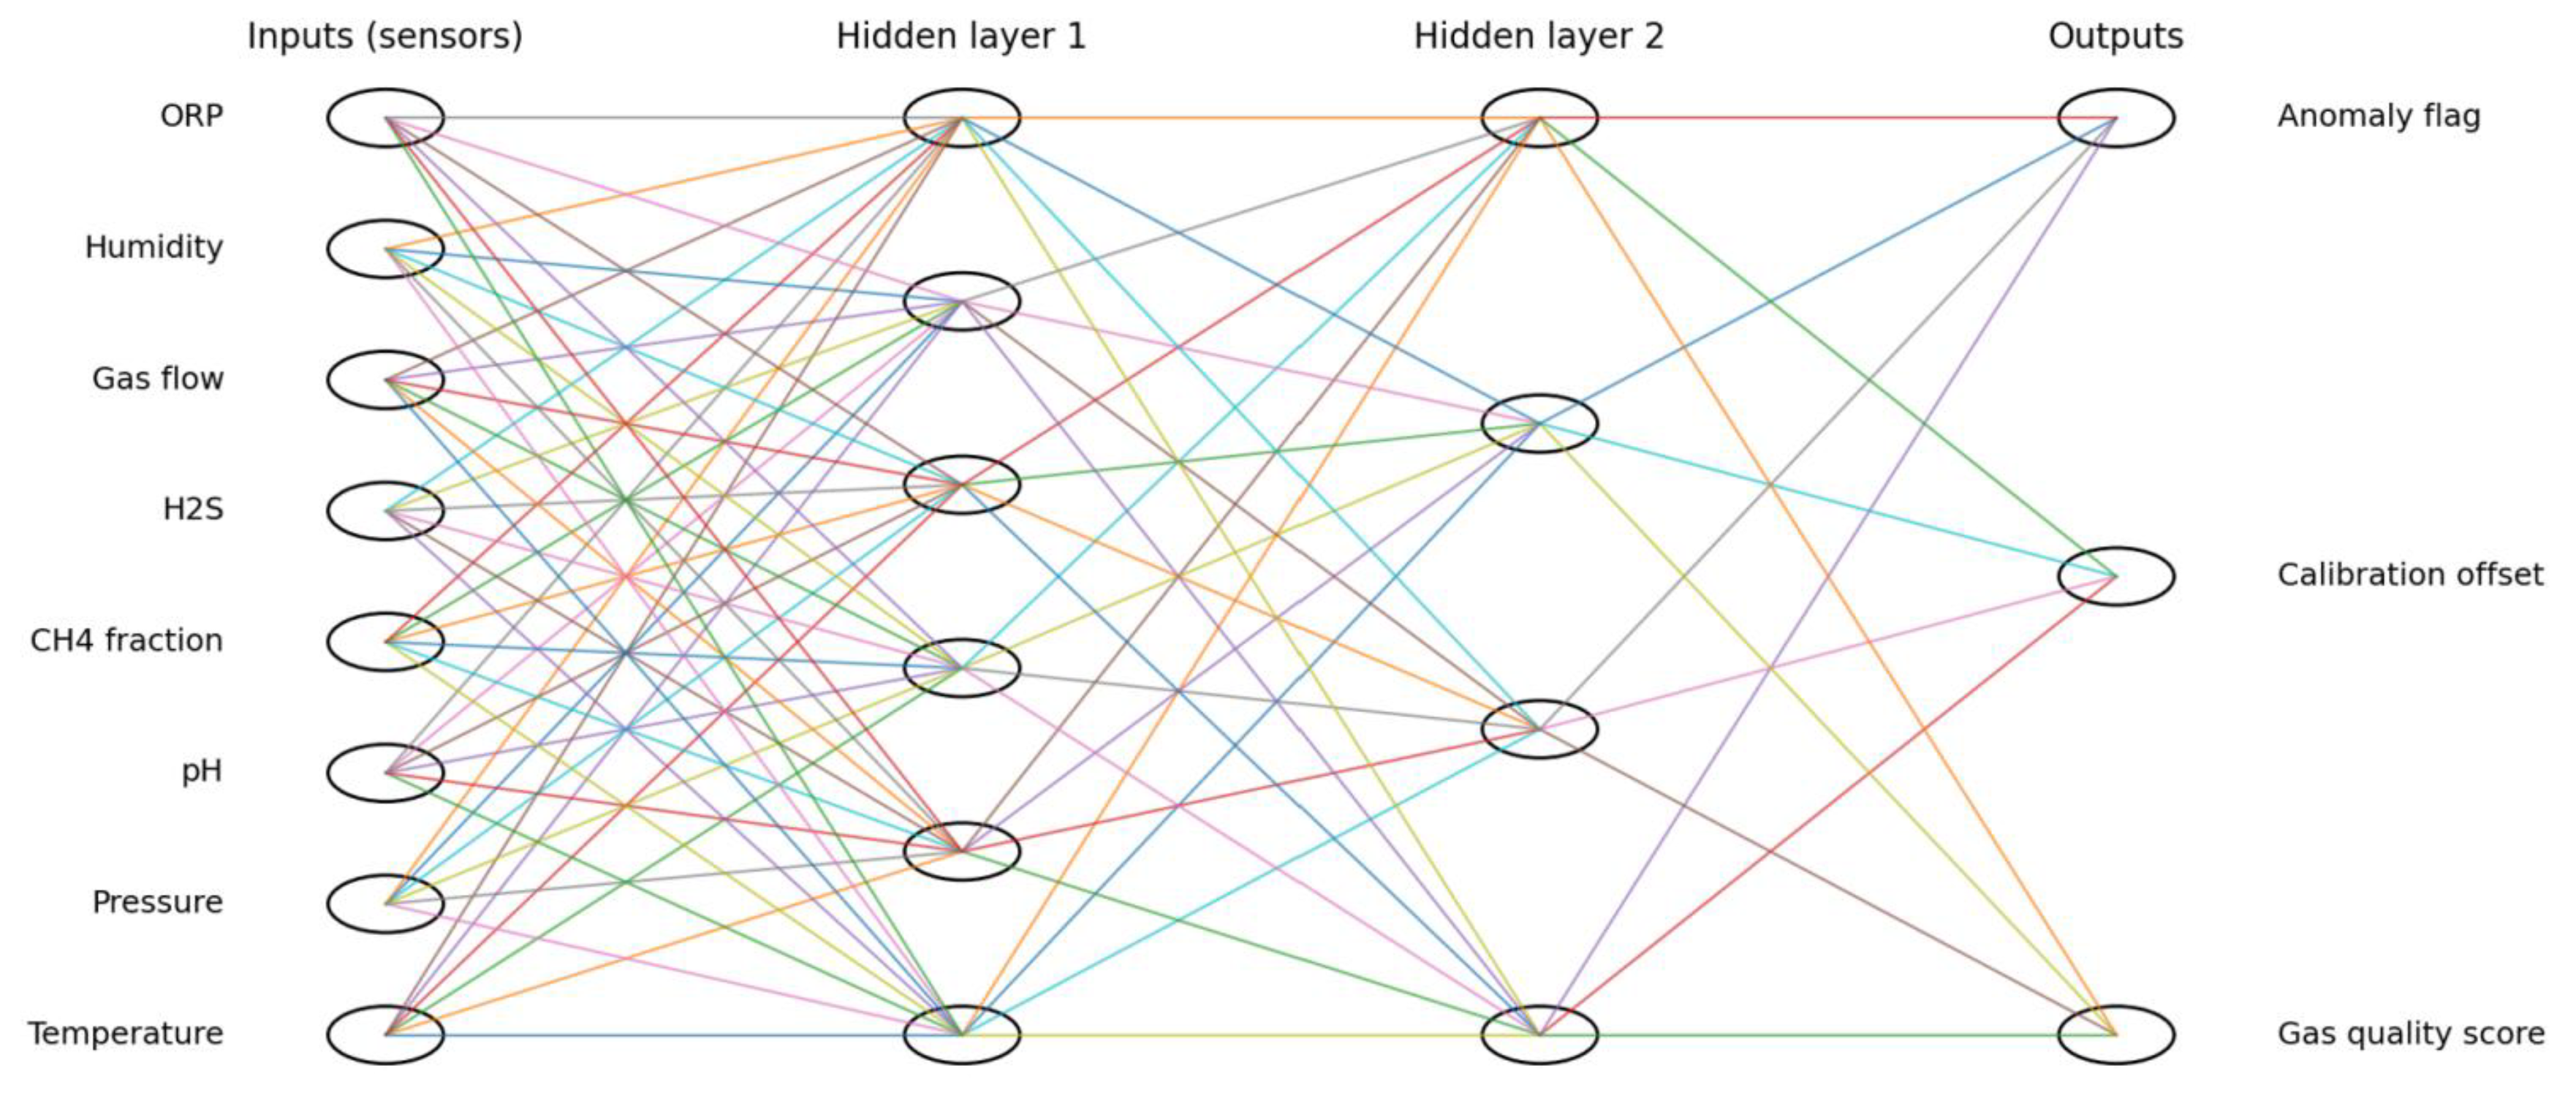

Table 1.
The research results.
| Indictor | Before optimization | After optimization |
| Mean squared error (MSE) | high, nominal 1.00 | Reduced by 18–22%, ~0.78–0.82 |
| Temperature sensitivity (∂O/∂T) | Unstable, a peak in a narrow range of 30–40 °C | Expanded range of 30–45 °C, more consistent |
| Pressure sensitivity (∂O/∂P) | Maximum in the range of 1.0–1.2 bar, a sharp drop beyond | Maximum extension to 1.0–1.5 bar, gradual decrease |
| Noise robustness |
Low, significant impact of random perturbations |
High, error rate reduces with fluctuations ±5% |
| Sensor drift | Non-adjustable | Compensated for ANN (adaptive calibration) |
| Anomaly detection | Absent | Achieved ≈92% accuracy |
| Integral gas quality index | Not calculated | Gas Quality Score was implemented for CH₄/H₂S |
Disclaimer/Publisher’s Note: The statements, opinions and data contained in all publications are solely those of the individual author(s) and contributor(s) and not of MDPI and/or the editor(s). MDPI and/or the editor(s) disclaim responsibility for any injury to people or property resulting from any ideas, methods, instructions or products referred to in the content. |
© 2026 by the authors. Licensee MDPI, Basel, Switzerland. This article is an open access article distributed under the terms and conditions of the Creative Commons Attribution (CC BY) license (http://creativecommons.org/licenses/by/4.0/).
Copyright: This open access article is published under a Creative Commons CC BY 4.0 license, which permit the free download, distribution, and reuse, provided that the author and preprint are cited in any reuse.


