1. Introduction
The modern flight simulator, like the modern aircraft, has developed significantly as aerospace and computer technologies have advanced. The replacement of CRT (cathode ray tube) monitors, which displayed analogue miniature scenes [
1], with high-resolution display technologies presenting computer-generated worlds is a striking example. The enhancement of flight simulators through digital displays, computer-generated graphics [
2], motion systems [
3], and realistic cockpit instrumentation [
4] has created highly realistic experiences. This pursuit of realism has driven the cost of modern simulators to prices that can sometimes exceed that of the actual training aircraft. Development has continued despite the known effectiveness of basic aircraft mock-ups [
5,
6], such as the “paper-tiger” [
7]. The effectiveness of flight simulators is largely a function of the motivation and training conducted using them. However, the realism of the simulator may play a role in driving motivational fidelity [
8] – that is, motivating both the instructor or pilot to engage constructively with the device, or creating acceptance in the trainee pilot. While the acceptance of the technology is important, the investment in expensive or complex simulators must be matched by the transfer of training from simulator to aircraft. A potential solution to the cost, motivation, and training transfer issues may be the use of xR flight simulators, including Virtual Reality flight simulators.
Virtual Reality (VR) is a set of technologies that enable the experience of a “fully immersive”, three-dimensional, computer-generated environment, usually achieved through a Head-Mounted Display (HMD) [
9]. The HMD provides real-time feedback and interaction within the computer-generated environment, without merging real and virtual elements. VR is fully immersive insofar as the design of the VR-HMD should not intentionally merge the real and virtual worlds, as is the case with other xR spectrum technologies [
10]. That is, the real-world setting in which the operator is located is not visible, in part or in whole, from inside the VR-HMD. The emergence of Virtual Reality, and the VR-HMD specifically, as was the case with the PCATD (Personal Computer Aviation Training Device), has been enabled by the increased power and efficiency of modern computers [
11]. Much as the PCATD enabled a generation of pilots to arrive “…fully trained on [Microsoft] flight simulator…” [
12] prior to stepping into the aircraft, the VR Flight Simulator may offer new training opportunities. The place of VR in pilot flight training, and the potential secondary benefits (e.g., cost [
13], access [
14], motivation [
15]), are contingent on its training efficacy. If the VR flight simulator produces negligible training transfer, or creates a negative transfer, then the adoption of the technology would not be advisable.
There are several means by which the training efficacy of a flight simulator, or indeed other kinds of training aid or program, can be quantified. Within many kinds of education research, including aviation education research, the concept of transfer of training (ToT) is common. Research of this nature was become prevalent in military aviation following the Second World War [
16], before spreading into civilian aviation [
4]. Transfer of training, and more specifically true-transfer, refers to the extent to which skills acquired during training are applied during real-world situations [
17]. In the case of flight simulation, this would relate to the application of skills acquired during training in the simulator that are subsequently applied in the aircraft. The training outcome may be quantified as an effect size, as is usual in other education research, or as a metric representing the saving in flight hours which result – for example, the transfer effectiveness ratio (TER)[
18]. Given the cost and complexity of conducting a portion of the research in-aircraft, researchers sometimes rely on quasi-transfer studies. Quasi-transfer uses a second, usually higher-fidelity, simulator as an analogue for the aircraft [
19]. The common use of these approaches in flight simulator training research has not resulted in a similarly large, or even proportionally large, literature on VR flight simulator ToT. A recent structured systematic review on the use of VR for pilot flight training found that less than 10 per cent of the articles, which met the initial inclusion criteria, contained the necessary data for meta-analysis [
20]. Unfortunately, that small proportion of the research which does contain data that are suitable for meta-analysis has often used very limited sample sizes [
21,
22]. The effect sizes for prior VR flight simulator research has varied from showing significant negative transfer (
g=-1.67) [
21], to significant positive transfer (
g=1.82) [
23]. The remaining 90 per cent of research either contains inadequate data for analysis or is concerned with the motivation and intention to use VR.
In considering the current state of the VR flight simulator literature, the research focussed on the intentions for the technology is of some value - in so far as the intended use can inform where research should be focussed. For example, general aviation (GA) is the most common domain of application, and general handling the most common level of skill [
21], which indicates that VR will likely be heavily applied in the
ab initio stage of flight training. Training of general handling is primarily concerned with the basic flight manoeuvres, and the inputs required, for a pilot to control the aircraft safely and effectively in three-dimensional space. During the training for these skills, other secondary skills, which are arguably of greater importance, such as situational awareness, are also developed [
24]. Within the Australian context, the manoeuvres required and the tolerances for those manoeuvres are defined in the Manual of Standards Instrument 2014 for Part 61 of the Civil Aviation Safety Regulations. These manoeuvres and standards, though varying in their legal structure between nations, are nonetheless common for all pilots. If the VR flight simulator is to be used for this kind of training, as appears to be the intention of many, then it must be capable of effectively transferring these skills.
The effectiveness of VR for transferring to trainees the skills of flight, within the construct of a simulator, is still an open question. Existing literature highlights the promises and limitations of the technology, with widely varying transfer observed. For various reasons, the literature also shows an intention to make use of the technology during the earliest stages of flight training—ab initio—potentially effecting piloting skills throughout a career. Considering the importance, the question guiding the present research is: “Does the use of a Virtual Reality flight simulator improve the performance of participants’, as measured by their ability to perform two pre-solo aircraft manoeuvres in a preset pattern?” In answering this question, empirical evidence will be provided on the efficacy of the VR flight simulator.
2. Materials and Methods
This research employs a Separate-Sample Pretest-Posttest design, in which all participants undergo the intervention, but with one group being assessed before intervention (i.e., the pretest group), and a second group after intervention (i.e., the posttest group). The design enables the evaluation of the change attributable to the intervention by comparing the pretest scores of the first group, with the posttest scores of the second, separate group. The comparison of pretest score and posttest score is here used to evaluate the transfer of skills attributable to training undertaken in the VR flight simulator. The design, which is quasi-experimental in nature, is widely attributed in its popularisation to Campbell and Stanley [
25]. Though, that work references earlier works which made use of the design [
26]. The use of a separate-sample pretest-posttest design is often due to circumstances where traditional control group designs are either not viable, or not permissible. For example, where no viable option for the creation of a control group exists, such as the Cincinnati United Nations study [
26], or where the creation of a control group is limited by ethical considerations. An obvious situation that both practicality and ethically restricts the use of traditional control group designs is in applied education. The restriction, or deliberate perversion, of educational outcomes is often forbidden, and is also ethically questionable. Such restrictive circumstances may lead education researchers to prefer pre-experimental designs, like the one-shot case study, or one group pretest-posttest design. These designs, whilst not without value, suffer from numerous internal and external sources of invalidity [
25]. The Separate-Sample Pretest-Posttest design is common in ongoing medical education research due to the need for accurate assessment of training transfer, and the limited ability and want for the creation of a control-group [
27,
28]. Limited literature presently exists outside of this medical education research context.
For the present study, activity and data were originally the result of, and for the sole purpose of, an undergraduate laboratory course at an Australian university. The creation of differential education within the course was not permitted. The pre-testing of a cohort of students, and the post-testing of a cohort of students, either side of an educational activity, was permissible. Data were available for 108 participants of the course (n=106, two excluded due corrupt or invalid data) of which 60 (n = 60) where pretested for their flying skills, and 46 (n=46) were tested post-training. Additional demographic data for the participants were neither obtained at the time of the laboratory activity, nor subsequent to the activity, by the research team owing to limitations imposed by the ethics approval. As part of the original undergraduate course, all participants were verbally instructed to immediately discontinue use of either flight simulator if they experienced simulator sickness, or if they were not comfortable with any sensation that resulted from that use. The theoretical framework within the study assumes that experience of the simulation would increase performance in simulation and assessment. Where repeated measures are likely to find results, as is the case within this theoretical framework, a separate-sample design is preferable.
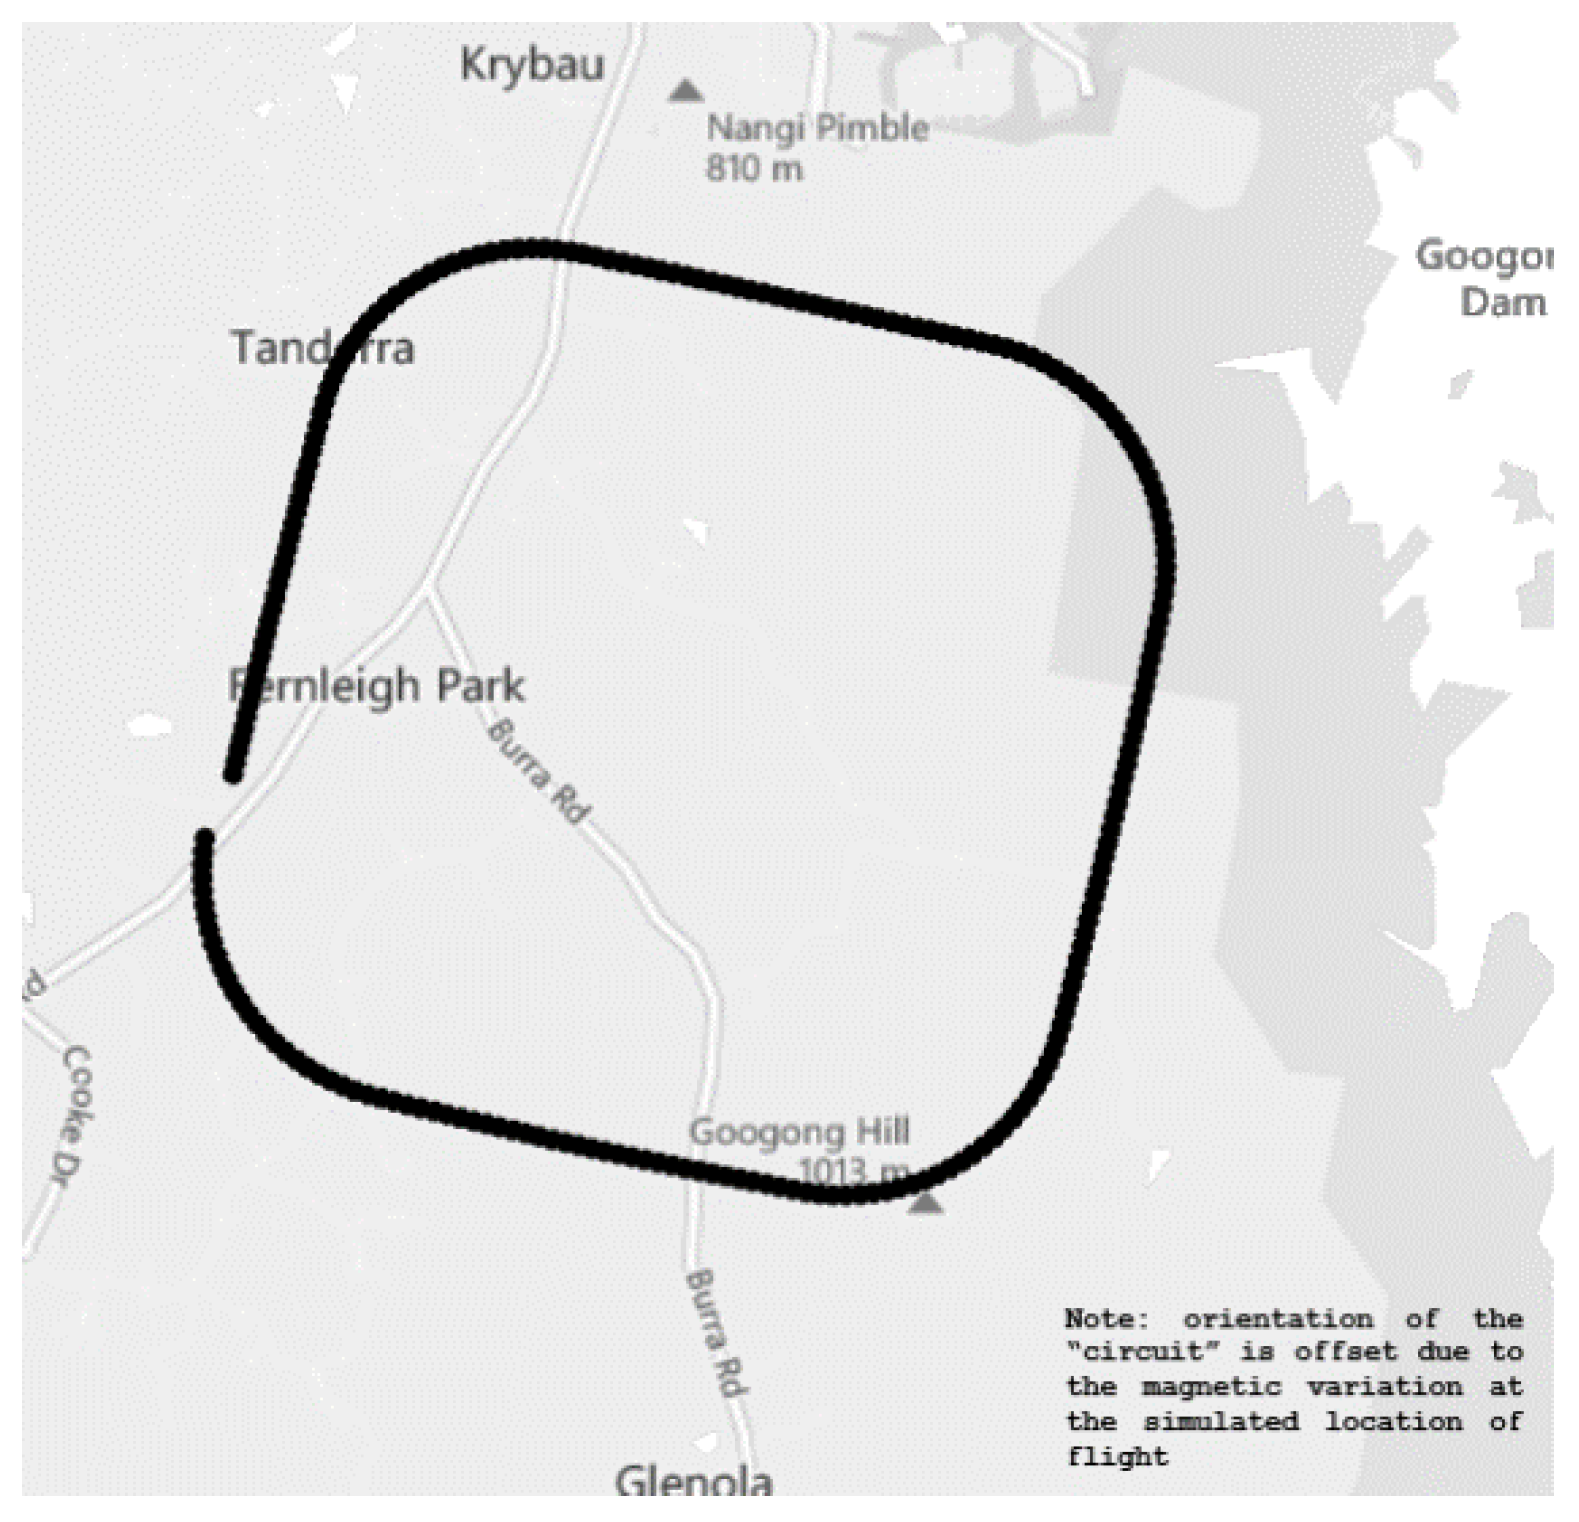
The flight pattern to be flown by each participant during both the assessment phase, whether pre- or post-training, and during training, was a “mid-air square-circuit”. The pattern contains two primary flight phases which are repeated several times. The first is the straight and level (s&l) phase (Aircraft Rating Standard – Aeroplane Category – A3.2), during which the aircraft should be flown at constant altitude, constant heading. The second phase is the turning phase (Aircraft Rating Standard – Aeroplane Category – A3.4), during which the aircraft should be flown at constant altitude, and with sufficient bank angle and rudder input to maintain a balanced turn at a rate of three degrees per second (Rate One Turn, i.e., half standard rate). The “mid-air square-circuit”, an example of which is shown in
Figure 1, consisted of an initial straight and level phase for 30 seconds, followed by a turning phase for 30 seconds, thereafter, alternating back and forth between the phases until a pattern approximating a square, or colloquially a “
squircle”, is flown. The initial heading was 360° magnetic, with an altitude of 4000 feet AMSL. The turn phases, if flown accurately and with correct timing would, of course, results in a total heading change of 90 degrees. This flight pattern is a modified and simplified version of the pattern used in research by Ortiz [
18]. The assessment was flown using an uncertified flatscreen PCATD (Personal Computer Aviation Training Device), with the training conducted using the same computer hardware but with visual display via a wired Virtual Reality head-mounted display (VR-HMD). For the pre-test group, the assessment was conducted by flying the pattern using a flatscreen computer monitor, followed by receipt of the core laboratory training using a VR-HMD. Conversely, the posttest group received the core laboratory training on the VR-HMD, followed by assessment on a flatscreen monitor. Assessment of the separate groups in this manner enables the assessment of the quasi-transfer of flying skills.
The computer used to run both the testing and training simulation/simulator ran the Windows 11 operating system, with an Intel i7 (2.5 GHz) CPU, a Nvidia RTX 3060 GPU (16GB), and 16GB of RAM. For the assessment task[s], the simulation was displayed on a 27-inch flatscreen computer monitor at a resolution of 1920x1080p and a refresh rate of 60Hz. The VR-HMD used for the training was a Meta Quest 2 (formerly Oculus Quest 2). The device is a lightweight (~0.5 kg) VR-HMD, which is designed to completely cover the user’s field-of-view, and thereby achieve full immersion. The headset is advertised by its manufacturer as a Virtual Reality headset, and generally aligns with the definition of such as outlined by Phillips [
29]. The headset has a resolution of 1832x1920p per eye and a maximum refresh rate of 90 Hz, with a field of view of around one hundred degrees. The headset operating system (Version: v61) was recent at the time of use. Connection between the VR-HMD and the PCATD was via a supported USB cable (USB3.2 gen one – signalling 5 Gbps). The flight simulator software used was X-Plane 11 [
30], with all graphical settings at medium. The simulated aircraft used for both testing and training was a Cessna 172 with a Garmin G1000-style glass flightdeck. The controller used for both testing and training was a Thrustmaster T.16000 HCS HOTAS [
31] and associate T.Flight rudder pedals [
32].
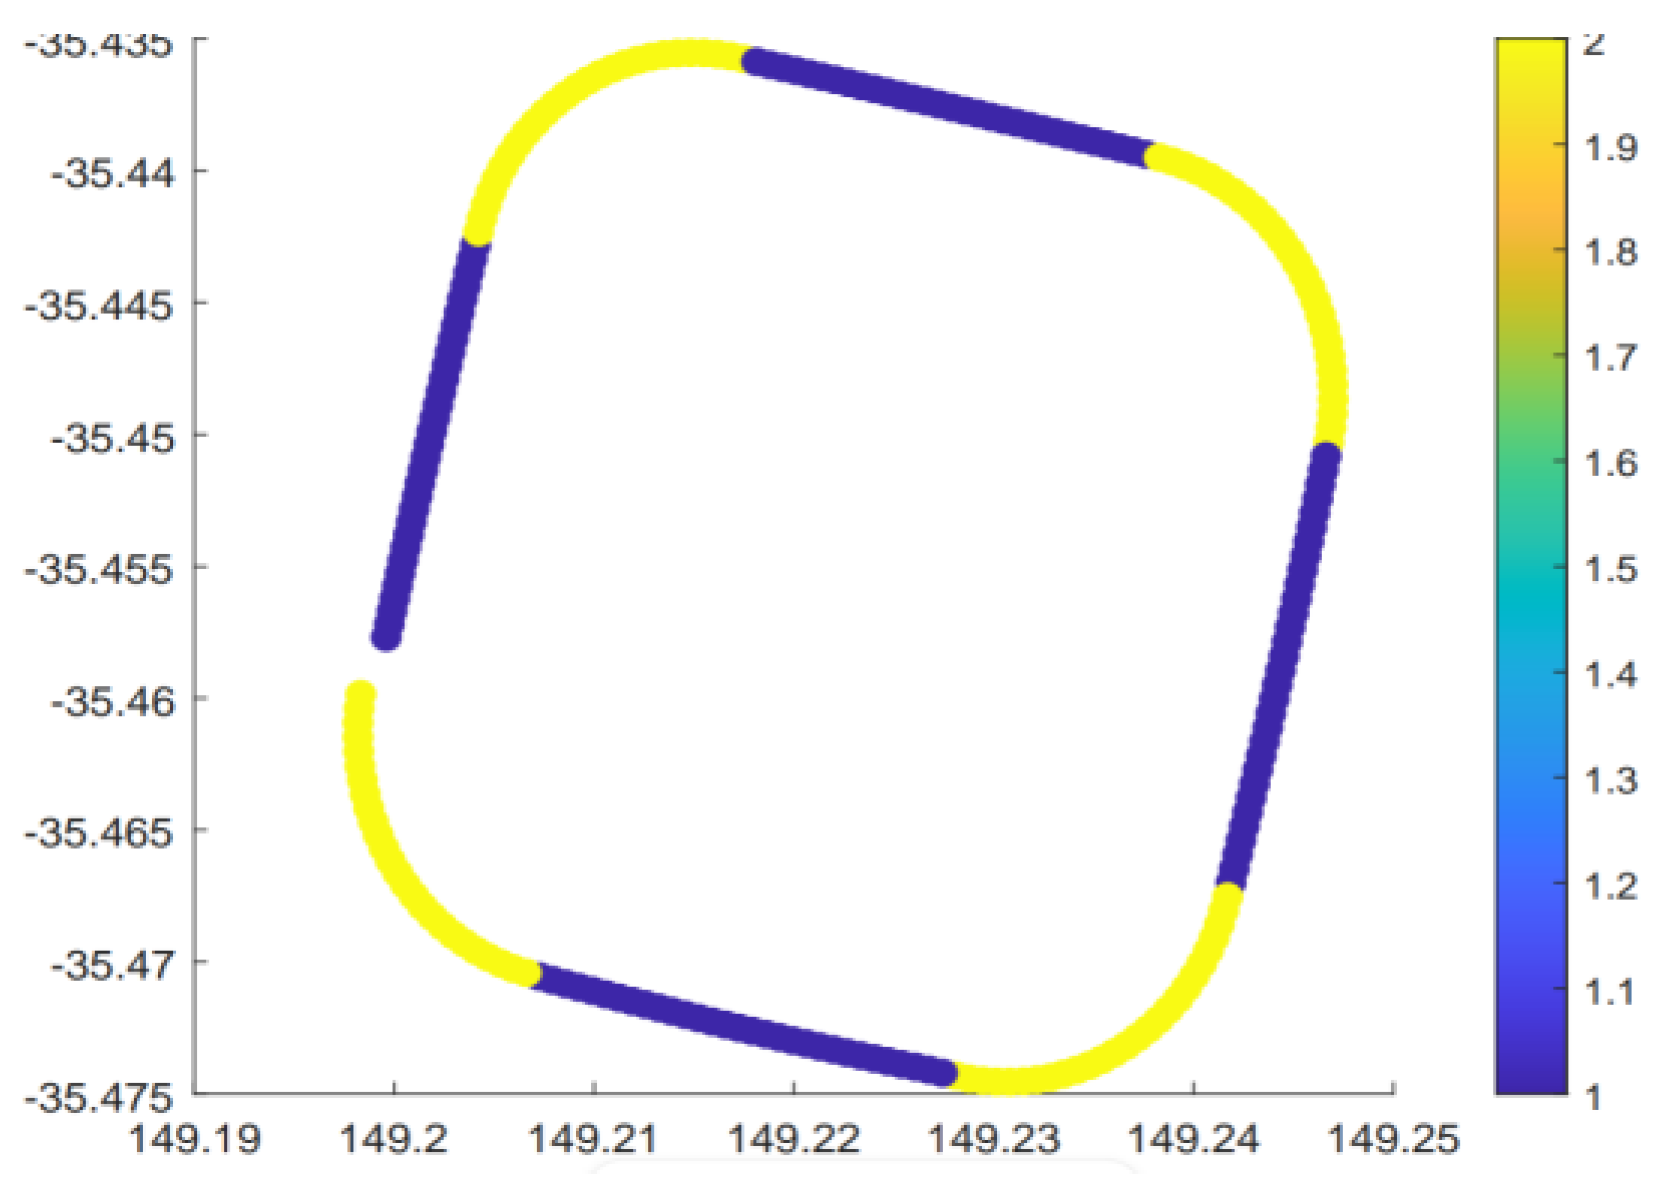
In order that the percentage of time in tolerance (PTiT) of each participant could be calculated for the assessment flight, a Gaussian Mixture Model (GMM) was used to automatically identify each of the straight and level, and the turning phases. This data marking was necessary as each of the two flight phases has quite different flight tolerances. Classification of each phase was based upon heading, bank angle, and time, under the assumption the data for each assessment flight results from multiple Gaussian distributions, each relating to a flight phase. These variables were selected by the researchers through informed inference, based upon their knowledge of flight performance. The ‘
fitgmdist’ function from the MATLAB Statistics and Machine Learning Toolbox was used to fit the GMM to the data. Using an expectation-maximization algorithm, the GMM calculates the probability p(
xi|θ) that each flight data point
xi, given the parameter θ, belongs to a particular flight phase. By iteratively estimating the parameters that maximize the likelihood of the observed data, each data point is assigned to the most probable Gaussian component based on the current parameter estimates. To ensure data for each flight were correctly classified, for the purpose of determining whether a particular data point would represent a moment during which the flight was in tolerance, a colour-coded visual diagram of the flight path was automatically generated. These diagrams, an example of which is shown in
Figure 2, enabled rapid human verification of GMM accuracy. Once each data point for a given flight was assigned to a particular flight phase, the flight tolerances were applied to confirm whether it represented a portion of time during which the flight was in tolerance.
The flight tolerances for each phase, shown in
Table 1, are taken directly from the Manual of Standards Instrument for Part 61 of the Civil Aviation Safety Regulations, for the aeroplane at the private level. The private level was used, in preference to the professional level, as these are the applicable standards during the
ab initio phase of pilot flight training. In order that earlier flying errors or different occurring flight conditions would not compound, the heading and bank angle tolerances were applied to a dynamically calculated target value. For example, the rollout heading for each turn was calculated based upon the heading immediately prior to the initiation of the turn, thereby offsetting any earlier heading errors. The bank angle required, and therefore the allowable range of bank angles, was calculated based upon the instantaneous speed at each moment throughout the turn. This approach does not allow the application of all applicable flight standards and tolerances. The tolerance for the turn onto the nominated heading is not assessable within the PTiT framing.
The null hypothesis (
H0) for this research was that there would be no significant difference in the central tendency of the flight performance, based upon the determined PTiT, between the pretest and posttest. That is, there would have been no transfer of training that resulted from the use of the VR-HMD. Conversely, the alternative hypothesis (
H1) was that the posttest PTiT would be higher than pretest, indicating better flight performance. The null hypothesis is therefore,
where η
1 and η
2 represent the pretest and posttest medians, respectively. The alternate hypothesis being,
where the expectation is that the median of the posttest scores (η
2) will be higher than that of the pretest (η
1).
Prior to statistical testing, which would otherwise have always used some form of t-test, data were checked for underlying expectations of distribution normality and homoskedasticity (equality of variances). Distribution normality was assessed by the Shapiro-Wilk test, and homoskedasticity was assessed by Levene’s test of Equality of Variances. The data were found to be non-normally distributed and homoscedastic, though Levene’s test did approach statistical significance. These results indicate the need to use a non-parametric statistical test.
Following extraction and assumption checking, the Mann-Whitney U test was employed to check for differences in flight performance between pretest and posttest. The Mann-Whitney U test does not assume normal distribution of the data, nor equality of variances. In order that the strength and direction of association between intervention and changes in performance ranks between pretest and posttest could be identified, the Glass rank-biserial correlation coefficient (
rrb) was calculated. This measure can be taken as an effect size, interpretable in the same manner as Pearson’s correlation [
33]. To measure the central tendency difference, the Hodges-Lehmann estimate () was calculated. These measures in combination assess both the statistical significance of the intervention and the practical significance of the change[s]. Due to the nature of the “trial” that originated the data, it was not possible to calculate power
a priori. No
post hoc power calculations were completed, owing to the risk of misinterpretation [
34].
3. Results
The flight performance scores (the percentage of time in tolerance) for the assessment flights, for the pretest (M = 16.4%, SD = 18.1%, Md = 10.3%) and posttest (M = 33.4%, SD = 24.9%, Md = 28.3%) groups, required assumption checking prior to statistical testing. The Shapiro-Wilk test showed a statistically significant deviation from a normal distribution for the PTiT for the pretest group (W = 0.819,
p < 0.001), the posttest group (W = 0.934,
p = 0.012), and the combined (W = 0.880,
p < 0.001). Levene’s test for Equality of Variances showed heteroskedasticity between the pretest and posttest data (
F(1,104) = 7.536,
p = 0.007). Considering that the pretest and posttest group sizes were different, with non-normally distributed and heteroscedastic performance data, the Mann-Whitney U test was best suited for statistical testing. The Mann-Whitney U test is robust to violations of normality, and is more suitable than the
t-test for handling uneven group sizes when data are heteroscedastic [
35].
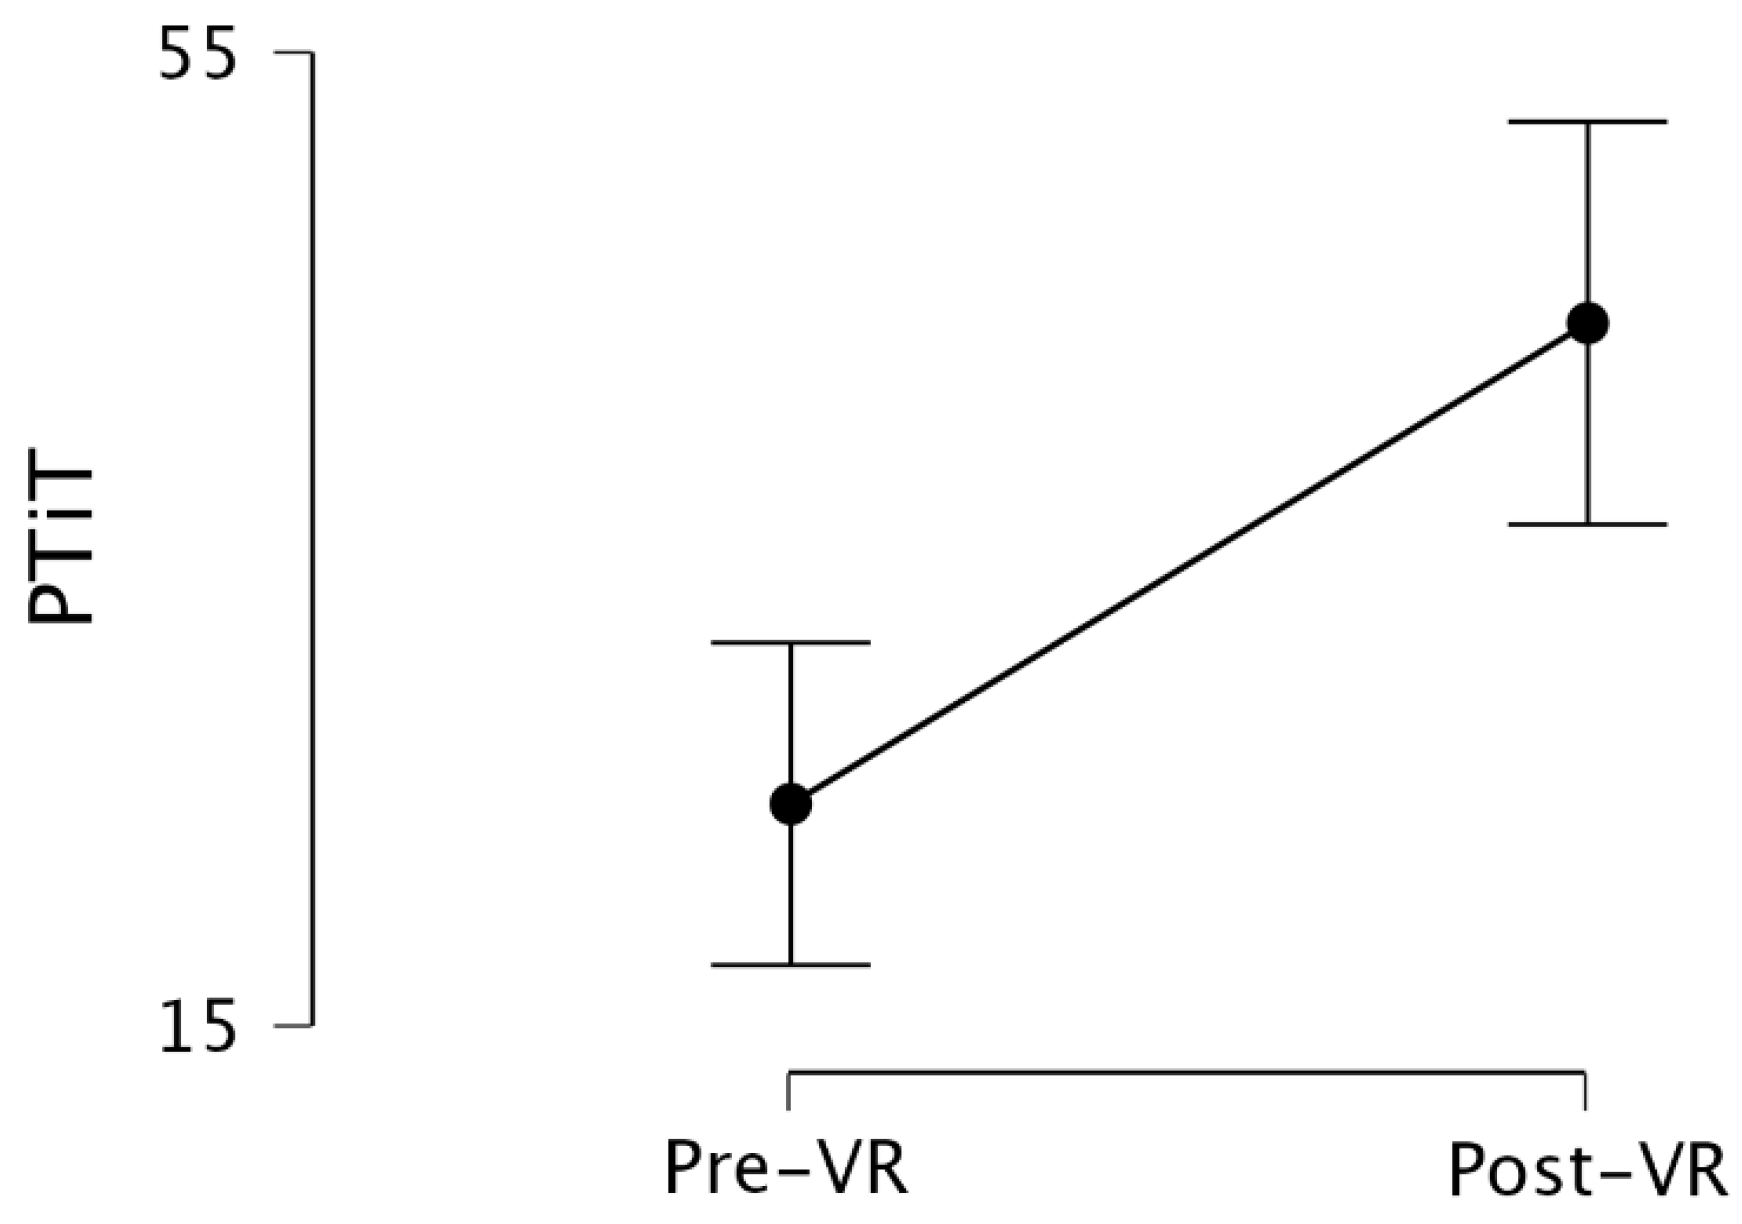
The results of the Mann-Whitney U test (W = 1969, p < 0.001), shown in
Table 2, comparing the separate prestest PTiT and posttest PTiT for the two groups, indicates that the training in the VR simulator changes flight performance to a statistically significant extent. The Hodges-Lehmann Estimate ( = 15.270), which is a measure the central tendency difference, indicates that the flight performance has improved between the pretest and the posttest. This change in performance (PTiT), shown in
Figure 3, suggests that the ‘intervention’ (i.e., training in the VR simulator) was effective. The Glass rank-biserial correlation (
rrb = 0.427), which is here treated as an effect size, indicates a small to moderated positive effect on flight performance. Given the significant U test, the change in the central tendency of the performance, and the rank-biserial correlation, the null hypothesis is rejected.
4. Discussion (Remember to Update Meta-Analysis References)
The addition to, or replacement of, traditional flight simulators by VR-HMD, or other xR spectrum technology, must be done in consideration of the efficacy and efficiency of such technology. The results of this analysis show that, within the specific flight training context examined, and considering the limitations, the use of a Virtual Reality flight simulator is effective for the training of
ab initio flight skills. The percentage of time in tolerance (PTiT), taken as the percentage of the flight during which the participant was effectively performing the role of pilot, was significantly improved by the “intervention”. The Hodges-Lehmann Estimate (=15.270) indicates a notable median difference between the pretest and posttest scores. Within the separate-sample pretest-postest design used, this would indicate that the training in the VR flight simulator had transferred reasonably effectively to the posttest in the traditional simulator. The Glass rank-biserial correlation (
rrb=0.427) further reinforces that the intervention had a moderate positive effect on the performance improvement between the pretest and the posttest, when interpreted in the normal manner [
33]. Though the rank-biserial correlation can be interpreted as an effect size, Hodge’s g effect size is more directly comparable to the existing xR flight simulator literature. Recalculating the rank biserial correlation as Hedges’
g (0.946, 95% CI[0.56, 1.37]), by the usual method [
36], indicates a large positive training effect. These results compare favourably with existing meta-analysis of the broader xR flight training simulator effect sizes (
g=0.880, 95% CI[0.11, 1.66]) [
20]. In examining these improvements, it is important to consider that the improvement has occurred in, and been assessed in, a wholly artificial environment – quasi-transfer. This quasi-transfer is, of course, based on the premise that the traditional simulator is an adequate analogue for the real flight environment.
The large positive effect size for the VR flight simulator was achieved with only short exposure to that simulator (i.e., the intervention), and using a relatively inexpensive setup. The use of an off-the-shelf VR-HMD, consumer-grade computer hardware and flight peripherals may provide evidence of the viability of VR flight simulators. The VR-HMD in the present simulator does not replace the processing capacity of a computer tower, nor the flight-specific peripherals needed for aircraft control. The VR-HMD in this setup is therefore a replacement, or upgrade to, the visual system of the simulator only. The increasing power of mobile computers in terms of both processing and battery technology is likely to lead to VR-HMDs that can match present graphics generated on dedicated graphics cards, in a relatively short time. When considering this development, and XR Simulators in general, it is necessary to consider both the system's cost and its cost-benefit ratio. The visual systems, as well as the motion systems, have long been noted as primary drivers of increased simulator cost, particularly where higher fidelity in visuals and motion are required [
37]. Though it may be possible to theorise about the operating cost of this setup, as compared to the cost of an aircraft, the present design does not enable accurate quantification. Nor is it possible to make a direct cost, or other, comparison to a non-VR flight simulator. Therefore, it is necessary to examining the outcomes on their own merit.
The use of [traditional] flight simulators for the training, or pretraining, of piloting skills is well established in the aviation and education literature [
38]. The effectiveness of such simulators, and likely that of VR flight simulator, as with training conducted airborne, is ultimately a result of the flight instructor [
39]. When considering the results of the present research, the training conducted differed significantly from that in formal pilot training programs. Participants in the two groups received no direct verbal instruction during the simulated flight, nor verbal coaching, or error catching and correction. Detection of errors early in training is one of, if not the primary, enabler of learning in the cockpit environment [
24]. The large effect size, and otherwise positive training outcome that resulted, was achieved without even the use of this ‘old-fashioned’ educational theory, such as instructivism. It is possible that with proper instruction, within an instructivist framework, or a more modern educational theory framework, that the training outcome could be further improved. That being further supported by the long-acknowledged need for “ingenuity” on the part of the flight instructor, in order that the simulator can be used to its best effect [
38]. The prior notwithstanding, the results were in an area of training (i.e., basic contact) in which flight simulators are known to be highly effective [
40]. Areas of flight training that are known to be less effective in-simulator, such as formation and instrument flying [
41], which were not addressed by this research, nor in the broader xR literature [
20], may be less effective in a VR flight simulator. These types of flying differ significantly from basic visual manoeuvring, requiring a more developed capacity for understanding relational information [
42], and future aircraft state projection [
43].
When considering the results of the present research, it is necessary to consider the ways in which it differs from existing research, both in the traditional simulator and the xR flight simulator literature. The most evident differences between this and previous research are the design, and the quantification of training efficacy. The separate-sample pretest-posttest design, which enabled this research, is common in ongoing medical research, has not previously been used in this area.
History,
maturation,
instrumentation, and
mortality, which are the sources of invalidity inherent to the design [
25], are minimised by the implementation. For example, the
instrumentation is not a risk to validity owing to the tools being both objective and unchanged during the term of the research. The time between pretest and posttest was less than two hours, making it unlikely that the remaining sources of invalidly would have impacted the outcome. The method of quantifying the training efficacy, which had been referred to as ‘quasi-transfer’, differs from the more common approach used in much simulator training literature. Namely, the participants in this research were trained for a set time, not to a set standard. It is more usual to train participant in the experimental group in the simulator until proficiency is reached, then train to the same proficiency in the aircraft [or aircraft analogue], and calculate a transfer effectiveness ratio [
44] to quantify the aircraft instruction saved [
38,
39,
45]. This approach was not viable given the research design, which itself was necessary owing to the origins of the data. Furthermore, in examining the positive training effect, it is important to consider research on traditional flight simulators showing that quasi-transfer studies can overestimate the transfer [
36]. The large effect size (
g = 0.946) found by this research is therefore likely to overstate the true-transfer of learning achievable in a VR flight simulator.
There is a considerable and sustained research literature on the motivating effects of various simulator enhancement technologies, such as motion systems [
46]. Often, these technologies are objectively better for training on their own merit — the addition of high-definition displays to simulators being a classic example [
47]. Motivating both the flight instructor and trainee to invest time and effort can be a potential benefit of new technology, including xR spectrum technologies. These potential positives must be weighed in consideration of potential limitations. A limit to the potential of any flight simulator is the development of compensatory skills. Compensatory skills are adaptive abilities and technique which are learned in response to the simulator environment, but which are different to the skills required in the real flight environment [
4]. Such adaptions to the flight simulator can be dangerous when they are inadequate or inappropriate for real-world flight [
48]. Participants in the research demonstrated behaviours likely to represent the development of compensatory skills, such as leaning forward and making unusual head movements. The leaning towards instrumentation (i.e., leaning forward) may represent an adaption to limitations in the visual rendering capabilities of the VR-HMD used. This behaviour has previously been observed by Auer, Gerken, Reiterer and Jetter [
21], who noted similar behaviour in a VR flight simulator study. A more concerning possibility is that these compensatory skills are not a result of insufficient graphical capacity of the headset, but instead a result of participants attempting to compensate for negative sensations caused by the headset [
49]. Simulator sickness, often measured using the Simulator Sickness Questionnaire [
50], is a noted limitation of many xR spectrum technologies [
20]. Given the focus on VR flight simulators for the training of
ab initio skills, and the implications of the development of compensatory skills from zero hours, this is a matter that deserves further consideration.