
Submitted:
12 January 2026
Posted:
13 January 2026
You are already at the latest version
Abstract
Spatial variability within soil profiles can substantially influence plant growth and productivity by modifying soil water and nutrient availability. In this study, we evaluated the relationship between soil physicochemical properties and yield in a young almond orchard established on a Calcaric Solimovic Regosol under Mediterranean conditions. The soil profile comprised three horizons showing marked variability in depth and texture. Based on these differences, the experimental plot was divided into two zones: Zone A, characterized by a thicker upper horizon and a lower proportion of sand in the subsoil, and Zone B, with a thinner topsoil and higher sand content in the buried horizon. Within each zone, the almond cultivars ‘Marta’ and ‘Marinada’ were planted in a balanced design using two rootstocks: INRA GF-677 and GARNEM®. Almond yield was the parameter most strongly affected by soil heterogeneity, showing pronounced differences among soil zones and rootstock–cultivar combinations. Yield followed the sequence Marta > Marinada/GF-677 > Marinada/GARNEM®, and was reduced in Zone B by 37%, 68%, and 72%, respectively, compared with Zone A. In contrast, soil zones had no significant effect on leaf and kernel mineral nutrient concentrations, which varied mainly according to cultivar.
Keywords:
almond yield
; soil profile heterogeneity
; soil texture
; rootstock–cultivar interaction
; almond ionome
1. Introduction
Almond (Prunus dulcis (Mill.) D.A. Webb) is one of the most important tree nut crops worldwide. The United States is currently the leading producer, followed by Mediterranean countries such as Spain and Italy [1]. In the Mediterranean region, almond cultivation has traditionally relied on rainfed orchards characterized by wide tree spacing, low external inputs, and the integration of winter cover crops and sheep grazing. However, during recent decades, this traditional production system has been severely challenged. Climate change has increased the frequency and intensity of drought events, particularly affecting rainfed agriculture [2], while the emergence and spread of new diseases, such as leaf scorch caused by Xylella fastidiosa, have further threatened orchard viability [3]. These pressures, combined with market-driven intensification of agricultural systems have led to the widespread replacement of traditional almond orchards with intensive and super-intensive plantations that require high inputs of water and other natural resources [4]. Under current and projected climate change scenarios, such production models face serious limitations, especially regarding water availability and soil health. Consequently, almond cultivation in Mediterranean environments urgently requires more sustainable soil and water management strategies capable of balancing crop productivity with the preservation of natural resources [5].
Agricultural soils are a finite and non-renewable resource that underpins food production. Inappropriate management practices can lead to soil degradation, including salinization and groundwater contamination, often driven by excessive fertilization [6]. Understanding soil properties and their interactions with vegetation and environmental factors is therefore essential to improve sustainable production practices, as soil characteristics directly influence water retention, nutrient availability, and root development [7]. Among these characteristics, within-field soil heterogeneity plays a crucial role in determining spatial variability in crop growth and yield. Such heterogeneity often necessitates site-specific irrigation and fertilization strategies to achieve consistent productivity while minimizing environmental impacts such as nutrient leaching and soil erosion [7,8]. Soil texture is a key determinant of crop performance because it governs water-holding capacity, aeration, drainage, and nutrient retention. The relative proportions of sand, silt, and clay define the physicochemical and biological properties of soils, thereby influencing water and nutrient dynamics within the root zone [9]. In heterogeneous soils, uniform management practices can exacerbate water percolation and nutrient leaching, ultimately compromising groundwater quality and resource-use efficiency [10].
Although the effects of soil heterogeneity on crop production have been investigated in annual cropping systems, mainly focusing on variability within the topsoil [11,12], comparatively little attention has been given to perennial fruit crops. In tree orchards, root systems explore deeper soil layers, making the properties of buried horizons potentially as important as those of the topsoil [13]. Variations in horizon depth, texture, and chemical composition may therefore have long-term implications for tree growth, yield, and nutrient uptake, particularly in young orchards where root systems are still developing. On this basis, in this field study, we evaluated the impact of soil profile heterogeneity on vegetative growth, yield, and mineral nutrition in a young almond orchard established under Mediterranean conditions. Specifically, we examined the response of three rootstock–cultivar combinations to spatial variation in soil horizons. The objectives of this study were to: (1) assess the relationship between soil physicochemical properties and almond growth, yield, and quality; and (2) compare the responses of different almond rootstock–cultivar combinations to within-field soil heterogeneity.
2. Materials and Methods
2.1. Experimental Site and Environmental Conditions
The study was conducted from January 2021 to October 2025 at the experimental station of the University of the Balearic Islands (Balearic Islands, Spain; 39°38′17″ N, 2°38′53″ E). The experimental plot covered an area of 1,500 m² (30 × 50 m). The regional climate is Mediterranean, characterized by a mean annual precipitation of approximately 450 mm, concentrated mainly in autumn and winter. October and November are typically the wettest months, whereas rainfall is scarce or absent from June to August. Summers are hot, with daily maximum temperatures frequently exceeding 30 °C, while winters are mild, with minimum temperatures rarely dropping below 1 °C.
2.2. Soil Physicochemical Characterization
Preliminary observations of soil characteristics were carried out in 2020, when a 50 m-long trench was mechanically excavated alongside the experimental plot to install a row of trees in large containers. The trench, approximately 1 m deep, allowed direct visualization of the soil profile and revealed marked heterogeneity, indicating that the plot could be subdivided into two distinct zones. This observation provided the basis for the present study. Detailed soil mapping was subsequently performed by manually excavating soil pits to a depth of approximately 100 cm. Soil horizons were identified, described in the field according to the World Reference Base for Soil Resources [14], and sampled for physicochemical and biological analyses.
Soil texture was determined using the Bouyoucos hydrometer method [15]. Field capacity (FC) and permanent wilting point (PWP) were measured using a pressure plate apparatus after equilibration at −33 kPa and −1500 kPa, respectively [16]. Soil bulk density (BD) was calculated from intact core samples as the ratio of oven-dry soil mass to total core volume. Soil organic carbon (SOC) was determined using the Walkley–Black method [17]. Available phosphorus (P Olsen) was measured following the Olsen method [18]. Calcium carbonate equivalent (CCE) was determined using the Bernard calcimeter method [19], while active calcium carbonate (ACC) was quantified using the ammonium oxalate procedure [20]. Cation exchange capacity (CEC) was determined by cation displacement with 1 N ammonium acetate buffered at pH 7.0 [21]. Soil electrical conductivity (EC) and pH were measured in 1:5 and 1:2.5 soil-to-water suspensions, respectively. Total microbial activity was assessed in samples from the upper horizon using the fluorescein diacetate (FDA) hydrolysis assay [22]. Exchangeable K, Ca, Mg, and Na were extracted using ammonium acetate (pH 7.0), whereas Fe, Zn, Mn, and Cu were extracted using EDTA as a chelating agent. All elements were quantified by inductively coupled plasma optical emission spectroscopy (ICP-OES; Perkin-Elmer Plasma-2000, Perkin-Elmer Inc., Norwalk, CA, USA).
2.2. Experimental Design and Almond Orchard Management Practices
Based on key soil profile characteristics likely to influence crop performance, specifically the depth of the upper horizon and the proportion of sand within the profile, the experimental plot was divided into two zones, designated Zone A and Zone B. Each zone occupied approximately half of the total plot area.
In February 2021, a total of 288 almond trees (Prunus dulcis (Mill.) D.A. Webb) were planted following a balanced experimental design. Ninety-six trees corresponded to the high-vigor cultivar ‘Marta’ grafted onto the INRA GF-677 rootstock. The remaining 192 trees were of the medium–low vigor cultivar ‘Marinada’, with half grafted onto INRA GF-677 and half onto the GARNEM® rootstock.
Trees were arranged in six rows, with 48 trees per row, spaced 1 m apart within rows and 4 m between rows (Figure 1d). Trees were planted in groups of four of the same rootstock–cultivar combination. Rows 1 and 6 served as border rows and were excluded from sampling. Within each group of four trees, only the two central trees were included in the study, marked with a red star in Figure 1d, to minimize potential root overlap effects between different rootstock–cultivar combinations. A maximum of 12 trees per rootstock–cultivar combination were sampled in each soil zone.
Spontaneous inter-row vegetation was allowed to grow from autumn to spring and was incorporated into the soil before the onset of the dry season to minimize competition for water. To clearly assess the influence of soil properties on tree performance, no fertilization was applied throughout the experimental period. Supplemental irrigation was provided by drip irrigation during the dry season, using recommended irrigation rates for almonds grown on sandy soils to ensure adequate water supply across the heterogeneous soil conditions. Annual pruning was carried out each January, after leaf fall, to control canopy growth.
2.4. Almond Tree Physiological Parameters, Growth and Almond Yield
Tree growth was assessed by measuring trunk diameter at mid-height between the soil surface and the first main branch using a digital caliper. This non-destructive measurement has been shown to correlate positively with tree biomass in fruit trees [23].
Physiological measurements were conducted in May, July, and September on 12 trees per rootstock–cultivar combination and soil zone. Measurements were taken on fully expanded leaves located on current-year shoots that did not bear fruit. Leaf chlorophyll content was estimated using a chlorophyll content meter (Model CI-01, Hansatech Instruments, Norfolk, England), and stomatal conductance was measured using a SC-1 leaf porometer (METER Group, Inc., San Francisco, CA, USA). All measurements were performed on clear, sunny days between 11:00 and 13:00 h using leaves fully exposed to sunlight.
In 2024 and 2025, almonds were manually harvested during the third week of September. Fruits from each tree were counted and weighed after hull removal. Kernels were obtained by manual shelling and subsequently weighed to determine kernel yield.
2.5. Leaf and Almond Ionome
Leaf ionome from samples collected in July are shown. This period was reported as optimal for assessing mineral nutrient status in almond leaves due to the stabilization of nutrient concentrations [24]. After physiological measurements, leaves were harvested, washed three times with distilled water, and oven-dried at 70 °C for 12 h.
Representative almond samples from each rootstock–cultivar combination and soil zone were washed three times with distilled water. After removing excess surface water, skins and seeds were separated and oven-dried at 100 °C for 24 h to determine water content and mineral nutrient concentrations.
Finely ground, oven-dried leaf, skin, and seed samples (0.05 g) were digested in a mixture of H₂O₂:HNO₃:HClO₄ (1:0.4:0.1, v/v/v) at 90 °C for 3 h. After cooling, digests were brought to a final volume of 10 mL with Milli-Q water and filtered through hydrophilic PVDF syringe filters (25 mm diameter, 0.45 µm pore size; Phenomenex) prior to analysis by ICP-OES.
2.6. Statistical Analysis
Statistical analyses were performed using SPSS Statistics software. Data normality and homogeneity of variances were assessed using the Shapiro–Wilk and Levene’s tests, respectively. Differences among treatments were analyzed by analysis of variance (ANOVA), followed by Duncan’s multiple range test when significant effects were detected. Correlation heat maps were generated based on Pearson correlation coefficients to evaluate relationships between soil physicochemical properties and almond yield.
3. Results
3.1. Soil Physicochemical and Biological Properties
The orchard soil was classified as a Calcaric Solimovic Regosol according to the World Reference Base for Soil Resources [14]. The soil profile consisted of three horizons exhibiting marked spatial variability, which justified the subdivision of the experimental plot into two distinct zones, Zone A and Zone B (Figure 1d).
The upper horizon (Aαp) was deeper in Zone A (35 cm) than in Zone B (30 cm) and displayed a loamy texture in both zones, with a higher silt content in Zone A (Table 1). Although field capacity showed similar values in both zones, the permanent wilting point was lower in Zone A. Key fertility-related parameters, including soil organic carbon (SOC), C/N ratio, and cation exchange capacity (CEC), were higher in Zone A, whereas growth-limiting factors such as calcium carbonate equivalent (CCE), active calcium carbonate (ACC), and soil pH were lower in this zone (Table 1). The buried horizon (2Aαb) was thicker in Zone B (40 cm) than in Zone A (25 cm). Texture differed markedly between zones, being loamy in Zone A and sandy loam in Zone B, with the latter showing a substantially higher sand content. This difference was associated with lower SOC and CEC and higher CCE and pH in Zone B compared with Zone A (Table 1). The parent material horizon (2Cα) exhibited a clay loam texture in Zone A and a loam texture in Zone B, with generally similar physicochemical properties in both zones. Olsen-extractable P was consistently very low (<5 mg kg⁻¹) across all horizons in both zones (Table 1).
Among macronutrients, exchangeable K and Mg concentrations were higher in the upper horizon than in deeper layers, with no significant differences between zones. In the buried horizon, however, both K and Mg were higher in Zone A than in Zone B (Table 1). Exchangeable Na also showed higher concentrations in the upper horizon, without significant differences between zones. Regarding EDTA-extractable micronutrients, Fe concentrations were similar between the upper and buried horizons but were consistently higher in Zone A than in Zone B (Table 1). Manganese concentrations were higher in the upper horizon, whereas Zn and Cu showed no significant differences among horizons or between zones.
Total microbial activity, assessed using the fluorescein diacetate (FDA) hydrolysis assay, was measured in July 2025 in soil samples collected from the almond rhizosphere and bulk soil. No significant differences between rhizosphere and bulk soil were observed in Zone A (Figure 2). In contrast, FDA activity in Zone B was significantly higher in the rhizosphere than in the bulk soil. While rhizosphere FDA activity did not differ significantly between zones, bulk soil activity was higher in Zone B than in Zone A (Figure 2).
3.2. Almond Physiological Parameters, Growth and Yield
Tree growth, assessed by trunk diameter in 2024 and 2025, differed significantly among scions, rootstocks, and soil zones (Figure 3). The cultivar ‘Marta’ consistently exhibited greater trunk diameter than ‘Marinada’ in both zones. Within ‘Marinada’, trees grafted onto INRA GF-677 showed higher growth than those grafted onto GARNEM® in Zone A, whereas no significant differences between rootstocks were observed in Zone B (Figure 3). In Zone A, all rootstock–cultivar combinations showed a significant increase in trunk diameter from 2024 to 2025. In Zone B, trunk growth increased in ‘Marta’ and ‘Marinada’/GF-677, while no significant year-to-year increase was observed in ‘Marinada’/GARNEM® (Figure 3). For both years, trunk diameter of ‘Marinada’ grafted onto INRA GF-677 was significantly greater than that of trees grafted onto GARNEM® in Zone A, whereas rootstock effects were not significant in Zone B. Overall, trunk diameter was consistently higher in Zone A than in Zone B for all rootstock–cultivar combinations (Figure 3).
Leaf chlorophyll content differed significantly among cultivars and soil zones (Figure 4a). ‘Marta’ exhibited higher chlorophyll values than ‘Marinada’ grafted onto either rootstock in both zones. Moreover, chlorophyll content in ‘Marta’ was higher in Zone A than in Zone B, whereas ‘Marinada’ showed similar values in both zones. In contrast, stomatal conductance did not differ significantly among rootstock–cultivar combinations or between soil zones (Figure 4b).
Almond yield was the tree parameter most strongly affected by soil heterogeneity. Cumulative yield over the 2024 and 2025 seasons varied markedly according to soil zone, cultivar, and rootstock (Figure 5). All rootstock–cultivar combinations exhibited significantly higher yields in Zone A than in Zone B. Among cultivars, ‘Marta’ showed higher yields than ‘Marinada’, and within ‘Marinada’, trees grafted onto INRA GF-677 outperformed those grafted onto GARNEM® (Figure 5). Kernel proportion (kernel weight as a percentage of total nut weight) did not differ significantly among rootstock–cultivar combinations or between soil zones, with average values ranging from 25.1% to 27.4%.
Correlation heat maps illustrating relationships between soil physicochemical properties and almond yield for the upper and buried horizons are presented in Figure 6. In the upper horizon, sand content, permanent wilting point, CCE, and pH were negatively correlated with yield, whereas silt content, bulk density, SOC, and CEC showed positive correlations, particularly for ‘Marinada’/GARNEM® (Figure 6). In the buried horizon, sand content, CCE, and pH were strongly negatively correlated with almond yield, while silt and clay content, FC, PWP, BD, SOC, C/N ratio, CEC, and EC showed positive correlations (Figure 6).
3.3. Leaf and Almond Ionome
Leaf mineral nutrient concentrations of fully expanded leaves collected in July 2025 are presented in Table 2. Leaf K, S, Fe, Mn, and Cu did not differ significantly among soil zones or rootstock–cultivar combinations. In contrast, leaf Ca and Mg concentrations were higher in ‘Marinada’ grafted onto GARNEM® than in ‘Marinada’/GF-677 and ‘Marta’, with no significant zone effects. Leaf Na and B concentrations were higher in ‘Marta’ than in ‘Marinada’, irrespective of soil zone. Leaf P concentrations were higher in ‘Marinada’, with a tendency toward higher values in Zone B, while leaf Zn also tended to be higher in ‘Marinada’ in Zone B (Table 2).
Macronutrient and micronutrient concentrations in almond skin and seed that differed among treatments are shown in Figure 7 and Figure 8, respectively. Potassium concentrations were similar between skin and seed in ‘Marta’, whereas in ‘Marinada’ K concentrations were higher in seeds than in skins. Skin K concentrations were significantly higher in ‘Marta’ than in ‘Marinada’, with no significant differences between soil zones (Figure 7a,d). Calcium concentrations were approximately twofold higher in skins than in kernels (Figure 7b,e). Kernel Ca was significantly higher in ‘Marta’ than in ‘Marinada’, whereas skin Ca did not differ significantly among rootstock–cultivar combinations or soil zones. Magnesium concentrations in kernel and skin showed no significant differences among cultivars or zones, with values ranging from 2.3 ± 0.16 to 2.5 ± 0.17 mg g⁻¹ DW in seeds and from 1.95 ± 0.26 to 2.31 ± 0.22 mg g⁻¹ DW in skins. Sulfur concentrations in both skin and seed were lower in ‘Marinada’ than in ‘Marta’, with no significant zone effects (Figure 7c,f). Phosphorus concentrations in kernel and skin showed no significant differences among cultivars or zones, with values ranging from 4.75 ± 0.28 to 5.11 ± 0.15 mg g⁻¹ DW in seeds and from 1.78 ± 0.28 to 1.98 ± 0.19 mg g⁻¹ DW in skins.
Micronutrient concentrations were generally higher in skins than in seeds (Figure 8). Seed Fe concentrations were higher in ‘Marta’ than in ‘Marinada’, with a similar trend observed in skins (Figure 8a). In contrast, seed Mn and Zn concentrations were higher in ‘Marinada’ than in ‘Marta’, with a comparable trend for skin Mn (Figure 8b,c,e). Skin Zn concentrations did not differ between cultivars in Zone A; however, in Zone B, ‘Marta’ exhibited higher values than in Zone A.
4. Discussion
Sustainable agricultural practices are increasingly required to maintain almond production in Mediterranean regions, where natural resources, particularly water, are limited and climate variability is intensifying. Achieving a balance between crop productivity and the preservation of soil and water resources is therefore a major challenge for almond cultivation under these conditions [5]. In this context, improving resource-use efficiency is essential, and soils represent one of the most critical yet heterogeneous components of agricultural systems.
Agricultural soils are inherently variable, often exhibiting pronounced differences in physicochemical and biological properties over short spatial scales. Consequently, sustainable agronomic practices must account for within-field soil heterogeneity to maintain soil health, optimize water use, and maximize crop yield [26]. While the influence of soil heterogeneity on crop productivity has been extensively studied in annual cropping systems [11,12], much less attention has been given to perennial fruit crops, despite their deeper and longer-lived root systems.
In the present study, we investigated how spatial variation in soil profile characteristics affected vegetative growth, yield, and mineral nutrition in a young almond orchard established under Mediterranean conditions. The experimental plot was located on a gentle alluvial slope, where soil formation processes resulted in contrasting horizon characteristics within a relatively small area. Specifically, sand content in the buried horizon increased from west to east, while the depth of the upper horizon decreased in the same direction. This pattern likely reflects the origin of the upper loamy horizon from upslope materials, which progressively thinned downslope. Based on these characteristics, the plot was divided into two zones with contrasting soil profiles that remained largely undisturbed by past agricultural practices.
The soil was classified as a Calcaric Solimovic Regosol, a soil type commonly found in xeric environments where limited leaching promotes the accumulation of carbonates and results in high pH values. Although such soils can be highly productive when adequately supplied with water and nutrients, their high carbonate content and alkalinity strongly limit the availability of key nutrients such as phosphorus and micronutrients, particularly Fe, Zn, and Cu [27]. In this study, rainfall was insufficient to establish the orchard and was therefore supplemented with drip irrigation. However, no fertilization was applied in order to assess the intrinsic capacity of the soil to support tree growth and yield, as well as potential differences in nutrient-use efficiency among rootstock–cultivar combinations.
As hypothesized, trees growing in Zone A, characterized by a thicker upper horizon and a lower sand content in the buried horizon, exhibited greater vegetative growth and, more notably, substantially higher almond yields than those in Zone B. Among the soil attributes contributing to these differences, the depth of the upper horizon emerged as a key factor. Increased topsoil depth has been reported to enhance crop productivity and nutrient-use efficiency, particularly under high planting density conditions [28,29]. In the present orchard, the narrow in-row spacing (1 m) likely intensified competition for water and nutrients, an effect further exacerbated by the absence of fertilization. Under these conditions, a deeper and more fertile upper horizon in Zone A provided a greater reservoir of resources to support tree growth and yield.
In addition to topsoil depth, the higher sand content in the buried horizon of Zone B played a critical role in limiting almond performance. Sandy soils typically exhibit lower field capacity and cation exchange capacity, reducing their ability to retain water and nutrients. These limitations are particularly restrictive in arid and semi-arid environments, where water availability is already constrained [30]. The strong negative correlations observed between sand content in the buried horizon and almond yield highlight the importance of subsoil properties in perennial cropping systems, where roots increasingly explore deeper layers as trees mature.
Tree responses to soil heterogeneity varied among rootstock–cultivar combinations. Both ‘Marinada’ rootstock combinations showed reduced growth in Zone B, and the superior performance of ‘Marinada’ grafted onto INRA GF-677 observed in Zone A was not maintained under the poorer soil conditions of Zone B, where no significant differences between rootstocks were detected. These results suggest that rootstock advantages may be strongly context-dependent and diminish under restrictive soil conditions.
Cultivar-related differences in growth were consistent with known vigor characteristics. ‘Marta’, a high-vigor cultivar, exhibited greater trunk growth than ‘Marinada’, a moderate-vigor cultivar, across both soil zones [31]. Trunk diameter was used as a proxy for tree size, a metric widely reported to correlate with biomass and yield potential in fruit trees [32,33]. In young almond orchards, reductions in yield have frequently been linked to limited vegetative growth [34]. However, in the present study, yield was proportionally more affected by soil limitations than vegetative growth. For example, yield reductions in Zone B were substantially greater than reductions in trunk growth, particularly for ‘Marinada’ grafted onto GARNEM®. This disproportionate reduction in yield suggests a potential trade-off between vegetative growth and reproductive output in young trees under resource-limited conditions. When soil resources are scarce, trees may prioritize vegetative development, such as root and canopy expansion, to secure future productivity, at the expense of current yield [35]. Similar negative relationships between vegetative growth and fruit yield have been reported in young olive trees [36], and this trade-off may be more pronounced in cultivars with lower vigor due to their higher reproductive sink strength [37]. Interestingly, despite its lower vigor, ‘Marinada’ consistently produced lower yields than ‘Marta’ in both soil zones. This contrasts with findings by Llompart et al. (2024) [38], who reported higher kernel yields for ‘Marinada’ than for ‘Marta’ when grown on more fertile clay loam soils in Mallorca. The superior performance of ‘Marta’ observed here suggests a more efficient interaction between this cultivar and the rootstocks under the edaphic constraints of the present study [39]. Higher chlorophyll content in ‘Marta’ may partly explain this advantage, as chlorophyll concentration is closely linked to photosynthetic capacity and biomass production [40]. The absence of differences in stomatal conductance among treatments indicates that photosynthetic limitations in ‘Marinada’ were unlikely to be driven by water stress, a conclusion supported by stomatal conductance values consistent with those reported for well-watered almond trees [41].
Despite the pronounced effects of soil heterogeneity on growth and yield, no significant impact was observed on leaf or kernel mineral nutrient composition. Both cultivars maintained adequate nutritional status in leaves and kernels, even under conditions of low soil P and Fe availability. This may partly reflect the role of soil microbial activity, which showed comparable or even higher values in Zone B. Previous studies have reported positive relationships between microbial activity and soil properties such as SOC and CEC [42], which may enhance nutrient mobilization in low-fertility soils.
Leaf nutrient concentrations were consistent with reference values reported for July, the period during which leaf mineral concentrations are most stable in almond [24]. In contrast to studies reporting strong rootstock effects on mineral nutrition in other fruit species [43], variation in leaf and kernel ionome in this study was primarily driven by cultivar rather than rootstock or soil zone. Particularly noteworthy was the adequate leaf P concentration despite very low soil P availability, highlighting the capacity of almond trees to activate efficient P acquisition strategies [44]. Both rootstocks used, INRA GF-677 and GARNEM®, are known for their tolerance to calcareous and alkaline soils and for their efficiency under low-fertility and water-limited conditions [43]. Recent evidence suggests that the tolerance of INRA GF-677 to calcareous soils may be linked to enhanced expression of genes involved in Fe transport and stress defense mechanisms [45].
The variation in kernel mineral nutrient composition was mainly cultivar dependent and remained largely unaffected by soil heterogeneity [46]. Almond seeds and skins contained mineral concentrations comparable to those previously reported for almonds grown in Mediterranean environments [47,48]. Notably, the skin contributed a substantial proportion of Ca, P, Fe, Mn, and Zn, emphasizing its nutritional relevance.
Overall, these findings indicate that in young almond orchards, reduced upper horizon depth and increased sand content in the buried horizon have a much stronger negative impact on yield than on vegetative growth or kernel mineral composition, and that responses vary among rootstock–cultivar combinations. These results underscore the importance of accounting for within-field soil heterogeneity when designing sustainable management strategies aimed at optimizing productivity without compromising soil and water resources.
Author Contributions
The following statements should be used “Conceptualization and methodology, J.V., C.C. and R.B.; almond orchard establishment and management, J.M.D., C.C., A.R-M. and M.C.; sample preparation, soil and plant analysis, M.C., A.R-M., C.C., R.B. and J.V.; writing—original draft preparation, C.C.; writing—review and editing, C.C., J.V., P.R., A.R-M. All authors have read and agreed to the published version of the manuscript.
Funding
This work has been partially sponsored by the Comunitat Autònoma de les Illes Balears through the Direcció General de Política Universitària i Recerca with funds from the Tourist Stay Tax Law (PDR2018/46 – ITS2017-006) (2020-2023).
Data Availability Statement
The original contributions presented in this study are included in the article/supplementary material. Further inquiries can be directed to the corresponding author(s).
Acknowledgments
We are grateful to Bàrbara Maria Quetglas and Pere Antoni Gost for their help starting the almond orchard. We acknowledge the support Dr. José González at the Scientific Technical Services of the University of the Balearic Islands for his expertise in ICP-OES.
Conflicts of Interest
The authors declare no conflicts of interest.
References
- FAOSTAT Food Balance Sheets. 2020. Available online: http://www.fao.org/faostat/en/#data/FBS (accessed on 24 April 2020).
- Freitas, T.R.; Santos, J.A.; Silva, A.P.; Fraga, H. Reviewing the Adverse Climate Change Impacts and Adaptation Measures on Almond Trees (Prunus dulcis). Agriculture 2023, 13, 1423. [CrossRef]
- Marco-Noales, E.; Barbé, S.; Monterde, A.; Navarro-Herrero, I.; Ferrer, A.; Dalmau, V.; Aure, C.M.; Domingo-Calap, M.L.; Landa, B.B.; Roselló, M. Evidence that Xylella fastidiosa is the Causal Agent of Almond Leaf Scorch Disease in Alicante, Mainland Spain (Iberian Peninsula). Plant Dis. 2021, 105, 3349–3352. [CrossRef]
- Fulton, J.; Norton, M.; Shilling, F. Water-indexed benefits and impacts of California almonds. Ecol. Indic. 2019, 96, 711–717. [CrossRef]
- García-Tejero, I.F.; Herencia, J.F.; Cárceles, B.; Rubio-Casal, A.E.; Gálvez, B.; Durán-Zuazo, V.H. Chapter 8-Redesigning soil-water management with sustainable resilience strategies in almond orchards in a Mediterranean environment. In Sustainable Agriculture under Drought Stress. Integrated soil, water and nutrient management; Etesami, H.; Chen, Y (Eds); Academic Press: London, UK, 2025; pp. 89-104.
- Kopittke, P.M.; Harper, S.M.; Asio, L.G.; Asio, V.B.; Batalon, J.T.; Batuigas, A.M.T.; Gonzaga Jr., A.B.; Gonzaga, N.R.; De Guzman, M.T.L.; Lumanao, D.M.; McKenna, B.A.; Sayon, G.B.; Vergara, J.R.M.; Sanchez, P.B. Soil degradation: an integrated model of the causes and drivers. Int. Soil Water Conser. Res. 2025, 13, 744-755.
- Wang, X.; Cheng, L.; Xiong, C.; Whalley, W.R.; Miller, A.J.; Rengel, Z.; Zhang, F.; Shen, J. Understanding plant–soil interactions underpins enhanced sustainability of crop production. Trends Plant Sci. 2024, 29, 1181–1190. [CrossRef]
- Kintl, A.; Šmeringai, J.; Lošák, T.; Huňady, I.; Sobotková, J.; Hrušovský, T.; Varga, L.; Vejražka, K.; Elbl, J. The Effect of Soil Heterogeneity on the Content of Macronutrients and Micronutrients in the Chickpea (Cicer arietinum L.). Soil Syst. 2024, 8, 75. [CrossRef]
- Mishra, R.; Singh, D. Role of soil texture and structure in water retention and crop productivity. IJCRT 2025, 13, 2320-2882.
- Chen, S.; Du, T.; Wang, S.; Parsons, D.; Wu, D.; Guo, X.; Li, D. Evaluation and simulation of spatial variability of soil property effects on deep percolation and nitrate leaching within a large-scale field in arid Northwest China. Sci. Total. Environ. 2020, 732, 139324. [CrossRef]
- Yao, R.-J.; Yang, J.-S.; Zhang, T.-J.; Gao, P.; Wang, X.-P.; Hong, L.-Z.; Wang, M.-W. Determination of site-specific management zones using soil physico-chemical properties and crop yields in coastal reclaimed farmland. Geoderma 2014, 232-234, 381–393. [CrossRef]
- Habib-Ur-Rahman, M.; Raza, A.; Ahrends, H.E.; Hüging, H.; Gaiser, T. Impact of in-field soil heterogeneity on biomass and yield of winter triticale in an intensively cropped hummocky landscape under temperate climate conditions. Precis. Agric. 2021, 23, 912–938. [CrossRef]
- Thorup-Kristensen, K.; Halberg, N.; Nicolaisen, M.; Olesen, J.E.; Crews, T.E.; Hinsinger, P.; Kirkegaard, J.; Pierret, A.; Dresbøll, D.B. Digging Deeper for Agricultural Resources, the Value of Deep Rooting. Trends Plant Sci. 2020, 25, 406–417. [CrossRef]
- IUSS Working Group WRB. World reference base for soil resources. International soil classification system for naming soils and creating legends for soil maps. 4th edition. International Union of Soil Sciences (IUSS), Vienna, Austria, 2022; pp. 236.
- Bouyoucos, G.J. Hydrometer Method Improved for Making Particle Size Analyses of Soils1. Agron. J. 1962, 54, 464–465. [CrossRef]
- Richards, L.A.; Fireman, M. PRESSURE-PLATE APPARATUS FOR MEASURING MOISTURE SORPTION AND TRANSMISSION BY SOILS. Soil Sci. 1943, 56, 395–404. [CrossRef]
- Nelson, D.A.; Sommers, L. Total carbon, organic carbon and organic matter. In Methods of soil analysis. Part 2. Chemical and microbiological properties; Page, A.L. (Ed.); American Society of Agronomy and Soil Science Society of America: Madison, WI, 1982; pp. 539-579.
- Olsen, S.R.; Sommers, L.E. Phosphorus. In Methods of soil analysis. Part 2. Chemical and microbiological properties; Page, A.L. (Ed.); American Society of Agronomy and Soil Science Society of America: Madison, WI, 1982; pp. 403-430.
- Muller, G.; Gatsner, M. Chemical analysis. Neu. Jb. Mineral. Mh. 1971, 10, 466-469.
- Drouineau, G. Dosage rapide du calcaire actif de sols. Nouvelles donnees sur la reportation de la nature des fractions calcaires. Ann. Agron. 1942, 12, 441-450.
- Rhoades, J.D. Cation exchange capacity. In Methods of soil analysis. Part 2. Chemical and microbiological properties; Page, A.L. (Ed.); American Society of Agronomy and Soil Science Society of America: Madison, WI, 1982; pp.149-152.
- Adam, G.; Duncan, H. Development of a sensitive and rapid method for the measurement of total microbial activity using fluorescein diacetate (FDA) in a range of soils. Soil Biol. Biochem. 2001, 33, 943–951. [CrossRef]
- Deist, J.; Eksteen, G.J.; Visser, C.J.; Zyl, E.J. Can we determine the size of a tree? Deciduous Fruit Grower 1973, 23, 93-97.
- Ferrández-Cámara, M.; Martínez-Nicolás, J.J.; Alfosea-Simón, M.; Cámara-Zapata, J.M.; Moreno, P.M.; García-Sánchez, F. Techniques of interpretation of the foliar analysis of the almond tree in Spain. In Prime Archives in Agricultural Research: Volume 2 (eBook); Silva J. (Ed.); Vide Leaf: Telangana, India, 2024.
- Yada, S.; Huang, G.; Lapsley, K. Natural variability in the nutrient composition of California-grown almonds. J. Food Compos. Anal. 2013, 30, 80–85. [CrossRef]
- Hernández-Ochoa, I.M.; Gaiser, T.; Grahmann, K.; Engels, A.M.; Ewert, F. Within-Field Temporal and Spatial Variability in Crop Productivity for Diverse Crops—A 30-Year Model-Based Assessment. Agronomy 2025, 15, 661. [CrossRef]
- Bolan, N.; Srivastava, P.; Rao, C.S.; Satyanaraya, P.; Anderson, G.C.; Bolan, S.; Nortjé, G.P.; Kronenberg, R.; Bardhan, S.; Abbott, L.K. ; Zhao, H.; Mehra, P.; Satyanarayana, S.V.; Khan, N.; Wang, H.; Rinklebe, J.; Siddique, K.H.M.; Kirkham, M.B. Chapter two – Distribution, characteristics and management of calcareous soils. Adv. Agron. 2023, 182, 81-130.
- Zhang, X.; Lv, Y.; Dai, H.; Kong, Y.; Wang, Y.; Liu, K. Increasing Topsoil Depth Improves Yield and Nitrogen Fertilizer Use Efficiency in Maize. Agronomy 2025, 15, 2160. [CrossRef]
- Zhang, X.; Kong, Y.; Lv, Y.; Yao, F.; Cao, Y.; Shao, X.; Geng, Y.; Wang, L.; Wang, Y. Increased topsoil depth required to support increased grain yield production in high density maize. Field Crop. Res. 2024, 308. [CrossRef]
- Musei, S.K.; Kuyah, S.; Nyawira, S.; Ng’ang’a, S.K.; Karugu, W.N.; Smucker, A.; Nkurunziza, L. Sandy soil reclamation technologies to improve crop productivity and soil health: a review. Front. Soil Sci. 2024, 4, 1345895. [CrossRef]
- Egea, G.; Nortes, P.A.; González-Real, M.M.; Baille, A.; Domingo, R. Agronomic response and water productivity of almond trees under contrasted deficit irrigation regimes. Agric. Water Manag. 2010, 97, 171–181. [CrossRef]
- Westwood, M.N.; Roberts, A.N. The Relationship Between Trunk Cross-sectional Area and Weight of Apple Trees1. J. Am. Soc. Hortic. Sci. 1970, 95, 28–30. [CrossRef]
- Hill, S.; Stephenson, D.; Taylor, B. Almond yield in relation to tree size. Sci. Hortic. 1987, 33, 97–111. [CrossRef]
- Calderón-Pavón, A.; García-Tejero, I.F.; Noguera-Artiaga, L.; Lipan, L.; Sendra, E.; Hernández, F.; Herencia-Galán, J.F.; Carbonell-Barrachina, Á.A.; Zuazo, V.H.D. Linking Almond Yield and Quality to the Production System and Irrigation Strategy Considering the Plantation Age in a Mediterranean Semiarid Environment. Agronomy 2025, 15, 1448. [CrossRef]
- Lehnebach, R.; Beyer, R.; Letort, V.; Heuret, P. The pipe model theory half a century on: a review. Ann. Bot. 2018, 121, 773–795. [CrossRef]
- Rosati, A.; Paoletti, A.; Al Hariri, R.; Morelli, A.; Famiani, F. Resource investments in reproductive growth proportionately limit investments in whole-tree vegetative growth in young olive trees with varying crop loads. Tree Physiol. 2018, 38, 1267–1277. [CrossRef]
- Plavcová, L.; Mészáros, M.; Šilhán, K.; Jupa, R. Relationships between trunk radial growth and fruit yield in apple and pear trees on size-controlling rootstocks. Ann. Bot. 2022, 130, 477–489. [CrossRef]
- Llompart, M.; Barceló, M.; Pou, J.; Luna, J.M.; Miarnau, X.; Garau, M.C. Adaptation of Almond Cultivars in Majorca Island: Agronomical, Productive, and Fruit Quality Characteristics. Agronomy 2024, 14, 1927. [CrossRef]
- Shivran, M.; Sharma, N.; Dubey, A.K.; Singh, S.K.; Sharma, N.; Sharma, R.M.; Singh, N.; Singh, R. Scion–Rootstock Relationship: Molecular Mechanism and Quality Fruit Production. Agriculture 2022, 12, 2036. [CrossRef]
- Croft, H.; Chen, J.M.; Luo, X.; Bartlett, P.; Chen, B.; Staebler, R.M. Leaf chlorophyll content as a proxy for leaf photosynthetic capacity. Glob. Chang. Biol. 2017, 23, 3513–3524. [CrossRef]
- Sperling, O.; Gardi, I.; Ben-Gal, A.; Kamai, T. Deficit irrigation limits almond trees’ photosynthetic productivity and compromises yields. Agric. Water Manag. 2023, 289. [CrossRef]
- Tao, K.; Tian, H.; Fan, J.; Li, D.; Liu, C.; Megharaj, M.; Li, H.; Hu, M.; Jia, H.; He, W. Kinetics and catalytic efficiency of soil fluorescein diacetate hydrolase under the pesticide parathion stress. Sci. Total. Environ. 2021, 771, 144835. [CrossRef]
- Reig, G.; Garanto, X.; Mas, N.; Iglesias, I. Long-term agronomical performance and iron chlorosis susceptibility of several Prunus rootstocks grown under loamy and calcareous soil conditions. Sci. Hortic. 2020, 262. [CrossRef]
- Lambers, H. Phosphorus Acquisition and Utilization in Plants. Annu. Rev. Plant Biol. 2022, 73, 17–42. [CrossRef]
- Sun, S.; Li, J.; Song, H.; Chen, D.; Tu, M.; Chen, Q.; Jiang, G.; Zhou, Z. Comparative transcriptome and physiological analyses reveal key factors in the tolerance of peach rootstocks to iron deficiency chlorosis. 3 Biotech 2022, 12, 1–13. [CrossRef]
- Prats-Moya, S.; Grané-Teruel, N.; Berenguer-Navarro, V.; Martín-Carratalá, M.L. Inductively Coupled Plasma Application for the Classification of 19 Almond Cultivars Using Inorganic Element Composition. J. Agric. Food Chem. 1997, 45, 2093–2097. [CrossRef]
- Muhammad, S.; Sanden, B.L.; Lampinen, B.D.; Saa, S.; Siddiqui, M.I.; Smart, D.R.; Olivos, A.; Shackel, K.A.; DeJong, T.; Brown, P.H. Seasonal changes in nutrient content and concentrations in a mature deciduous tree species: Studies in almond (Prunus dulcis (Mill.) D. A. Webb). Eur. J. Agron. 2015, 65, 52–68. [CrossRef]
- El Bernoussi, S.; Boujemaa, I.; El Guezzane, C.; Bou-Ouzoukni, Y.; Nounah, I.; Bouyahya, A.; Ullah, R.; Iqbal, Z.; Maggi, F.; Caprioli, G.; et al. Comparative analysis of nutritional value and antioxidant activity in sweet and bitter almonds. LWT 2024, 206. [CrossRef]
Figure 1.
Soil profile Zone A (a) and Zone B (b). Overview of the almond orchard (c). Top view of the experimental site subdivided into two zones (d). Trees were planted in 6 rows leaving a space of 4 m between rows. In each row, 48 trees were planted with 1 m spacing between trees. Only trees inside the black rectangle were sample. Rows 1 and 6, (borderlines) were not sampled, neither the first and last tree in rows 2, 3, 4 and 5. The trees were planted in groups of 4, alternating rootstock-cultivar. In each group of four, the two middle trees were sampled to diminish any root overlapping effect among different rootstock-cultivar (red stars). M, ‘Marta’; MGF ‘Marinada’ grafted onto INRA GF-677; MGN, ‘Marinada’ grafted onto GARNEM®.
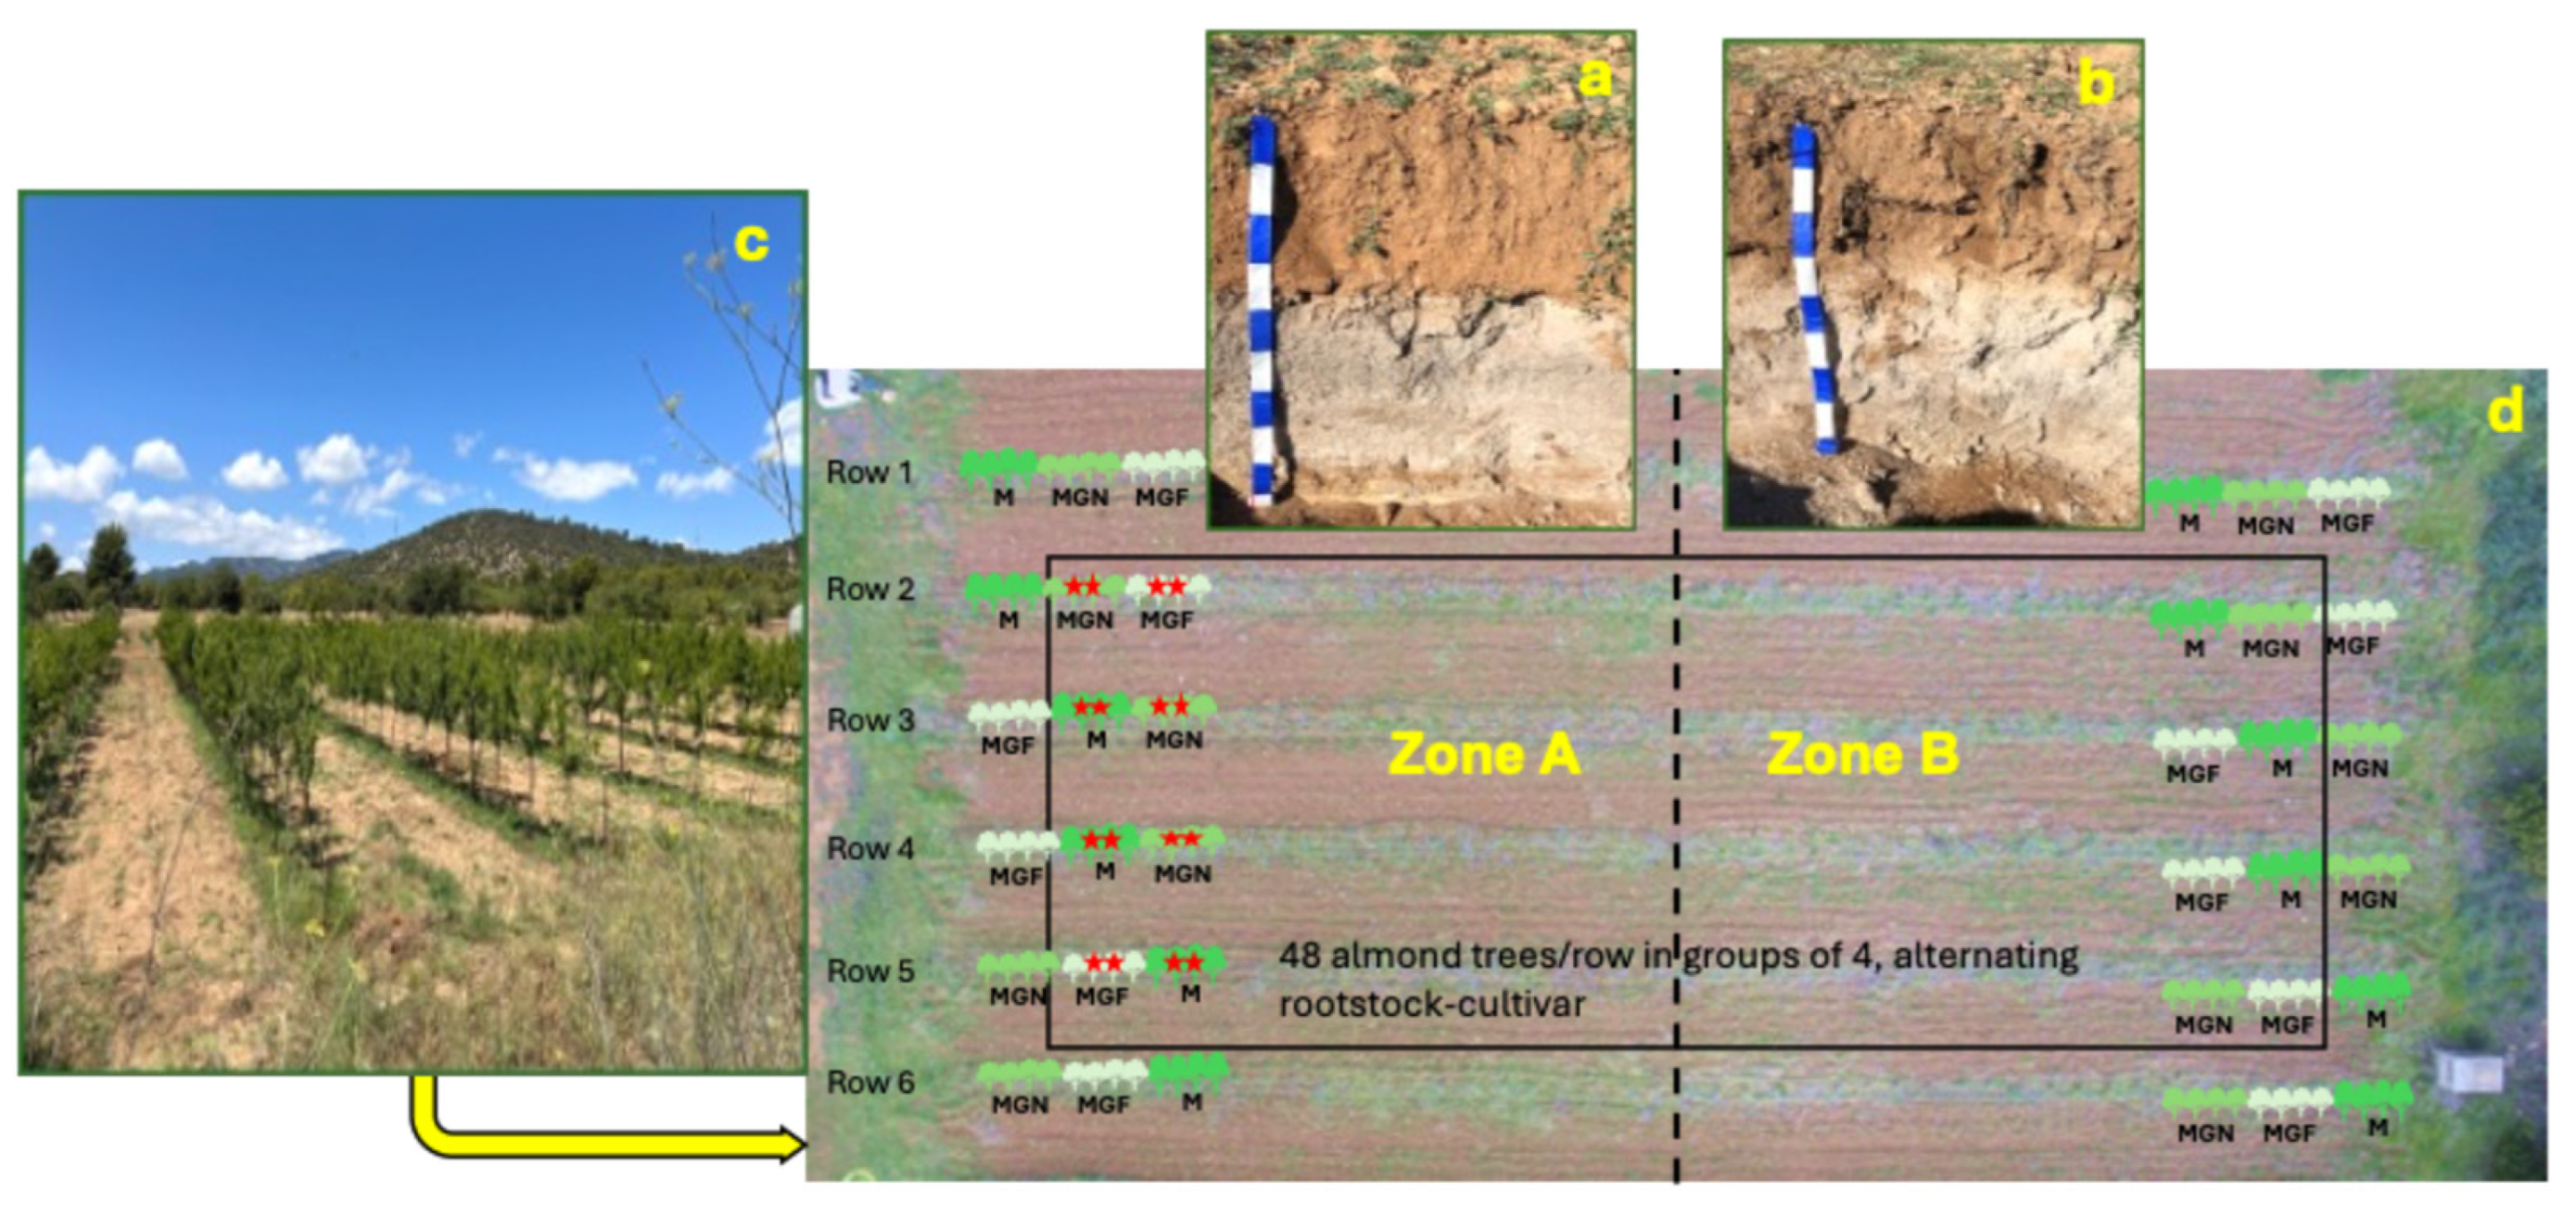
Figure 2.
Fluorescein diacetate activity (FDA) in the almond rhizosphere and bulk soil in Zone A and Zone B (n=8). Different lowercase letters above the bars indicate a significant difference at P< 0.05 level (Duncan’s multiple comparison test).
Figure 2.
Fluorescein diacetate activity (FDA) in the almond rhizosphere and bulk soil in Zone A and Zone B (n=8). Different lowercase letters above the bars indicate a significant difference at P< 0.05 level (Duncan’s multiple comparison test).
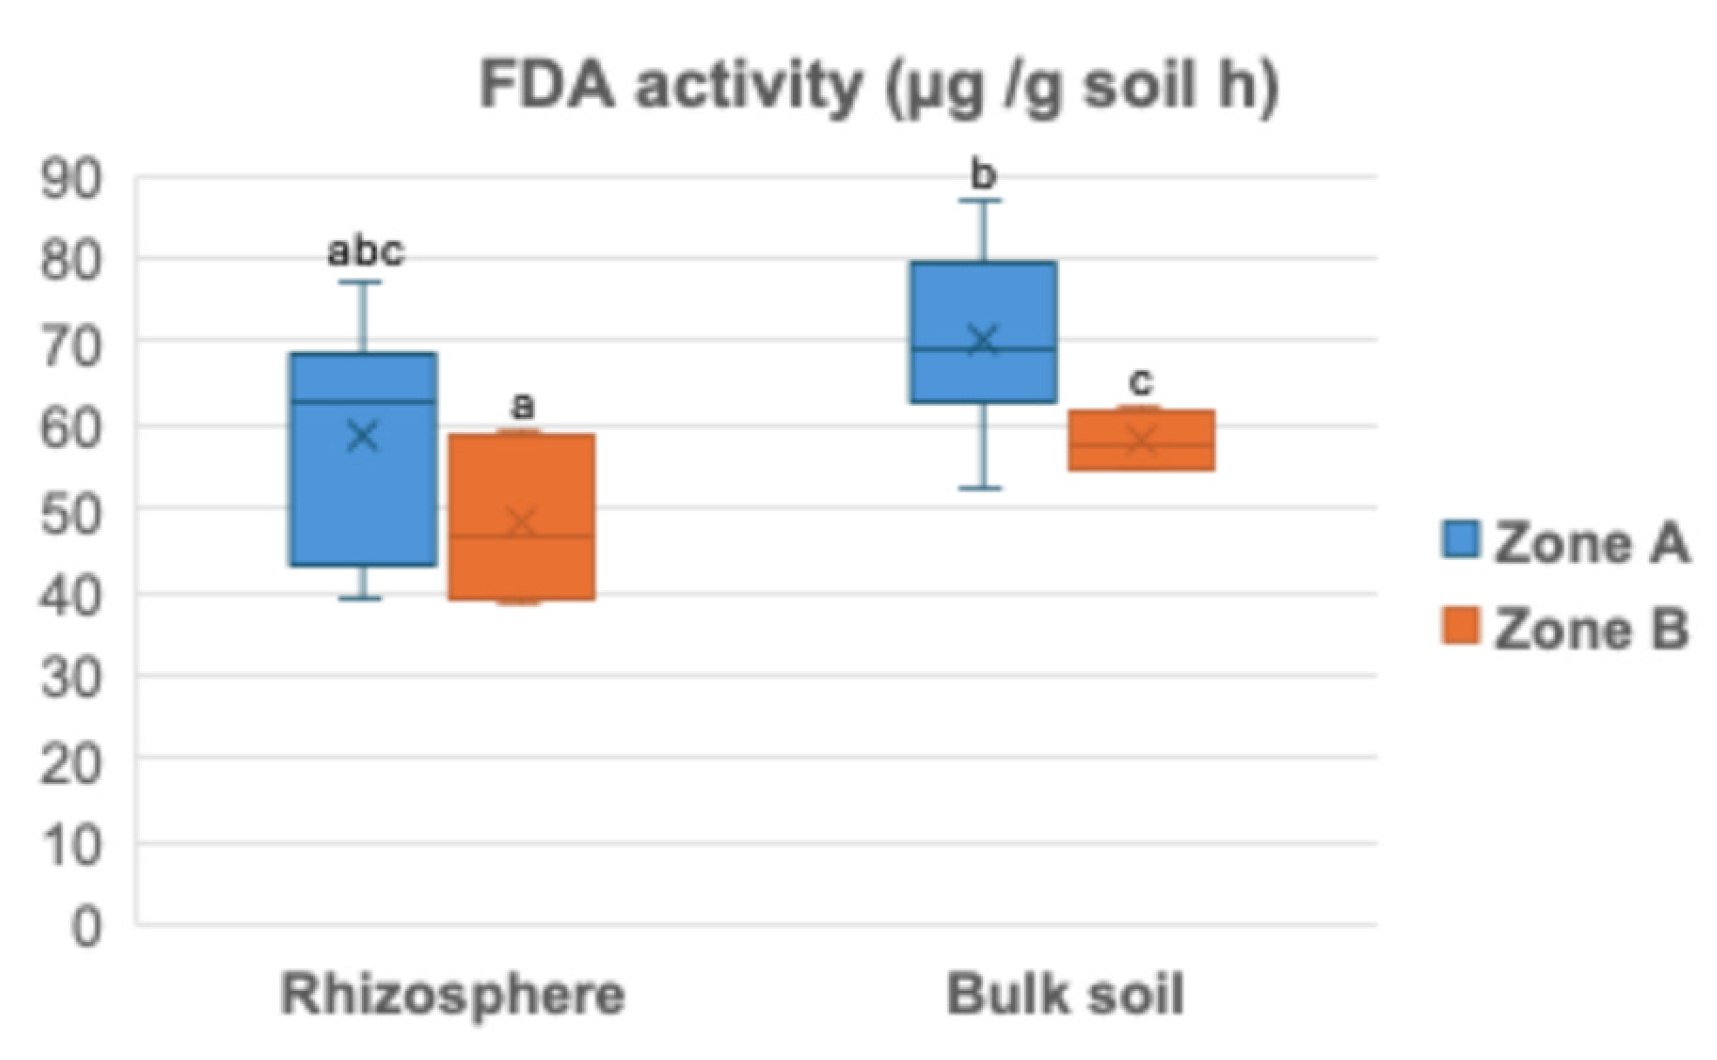
Figure 3.
Trunk diameter measured at 1 m from the soil surface. Means of 12 replicates ± SD; Different lower-case letters above the bars indicate significant differences among M, MGF and MGN in Zone A; different upper-case letters above the bars indicate significant differences among M, MGF and MGN in Zone B; and asterisks above the bars indicate a significant difference in the cultivar between zones at P< 0.05 level (Duncan’s multiple comparison test). M, ‘Marta’; MGF ‘Marinada’ grafted onto INRA GF-677; MGN, ‘Marinada’ grafted onto GARNEM®.
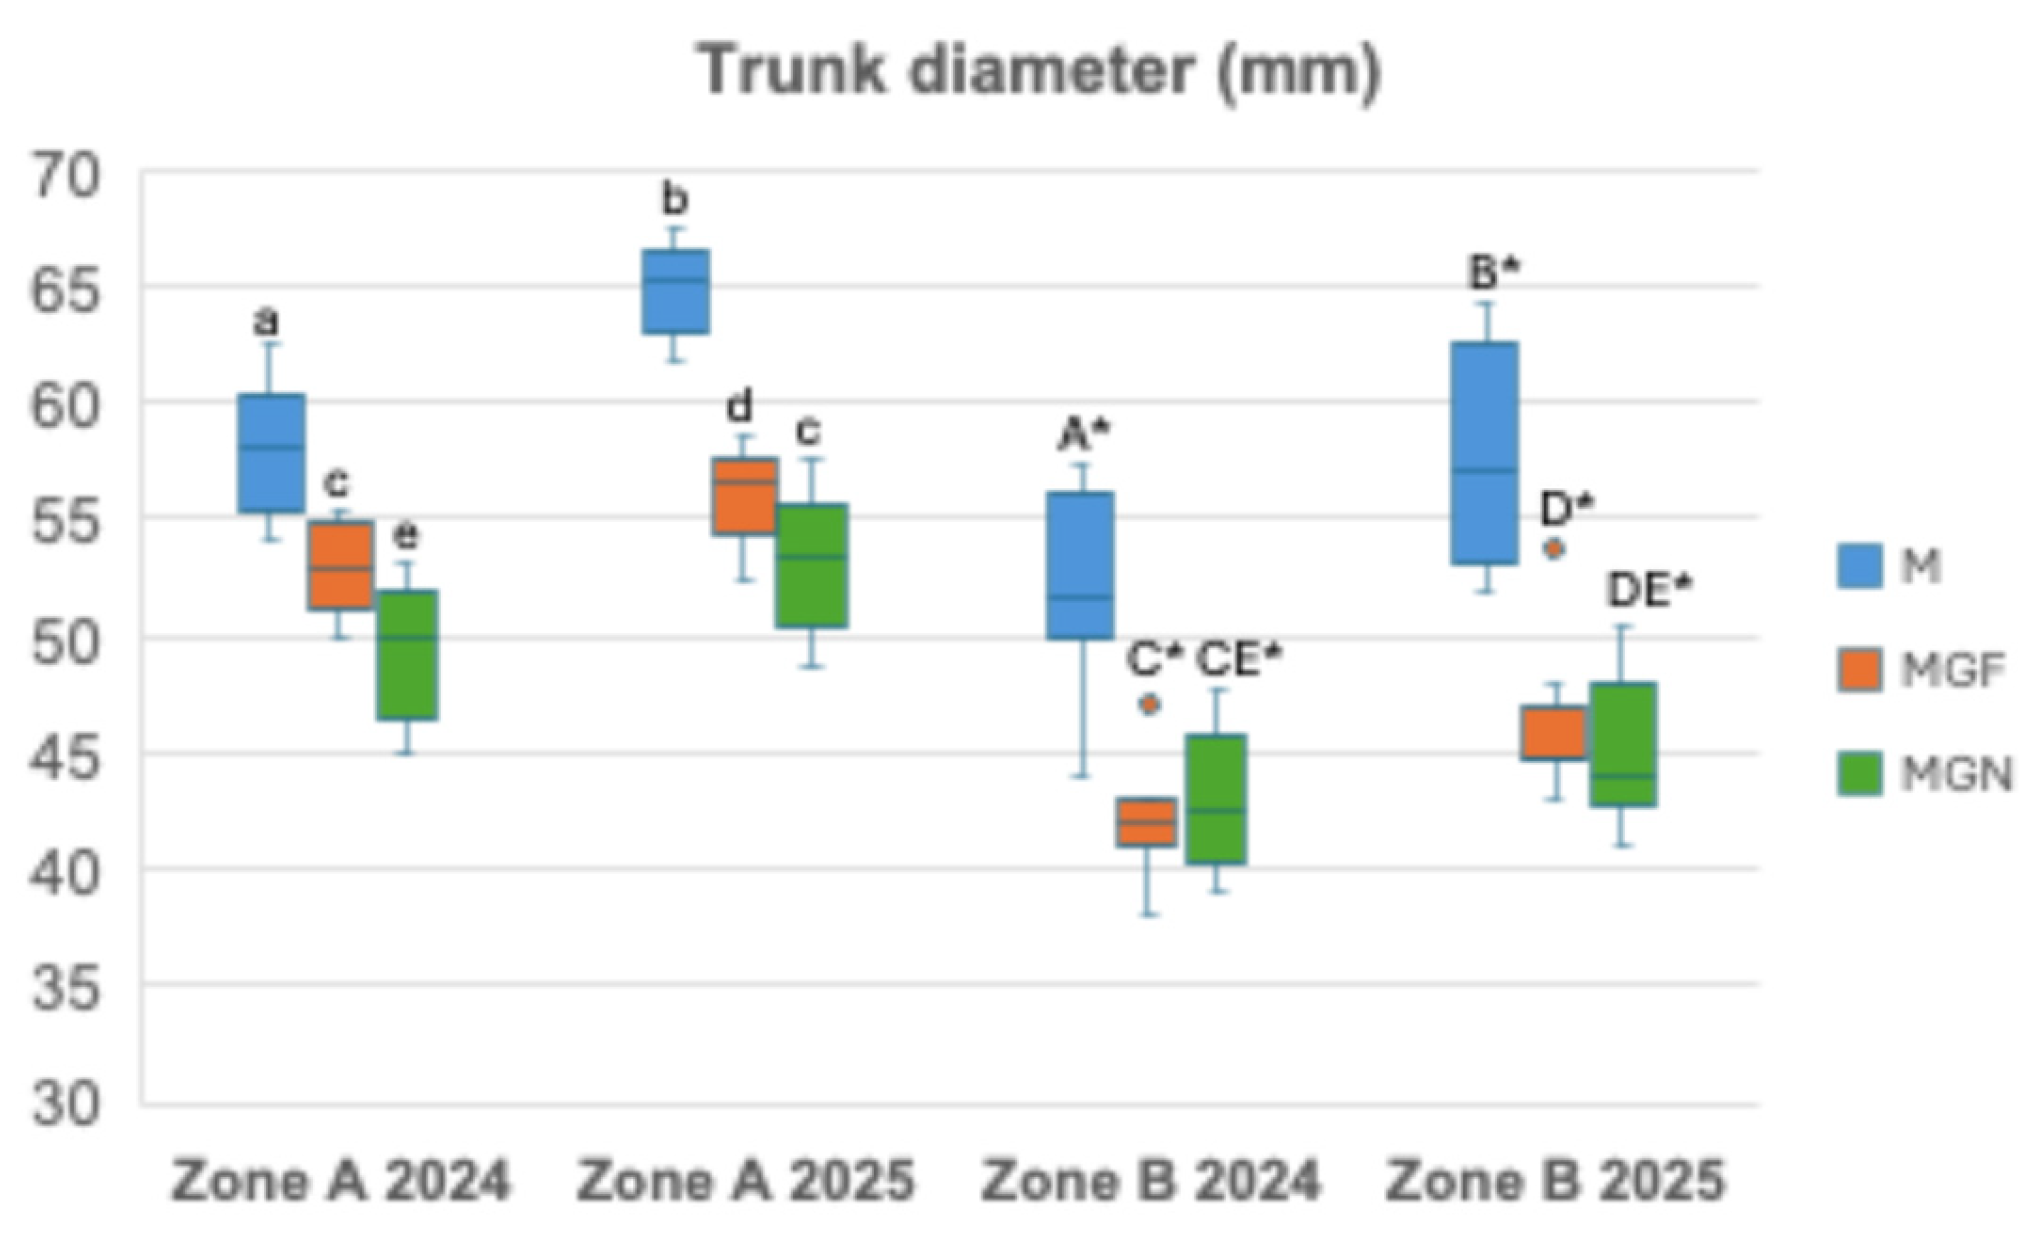
Figure 4.
Chlorophyll SPAD (a) and Stomatal conductance (b). Means of 12 replicates ± SD; different lowercase letters above the bars indicate a significant difference at P< 0.05 level (Duncan’s multiple comparison test). M, ‘Marta’; MGF677 ‘Marinada’ grafted onto INRA GF-677; MGN, ‘Marinada’ grafted onto GARNEM®.
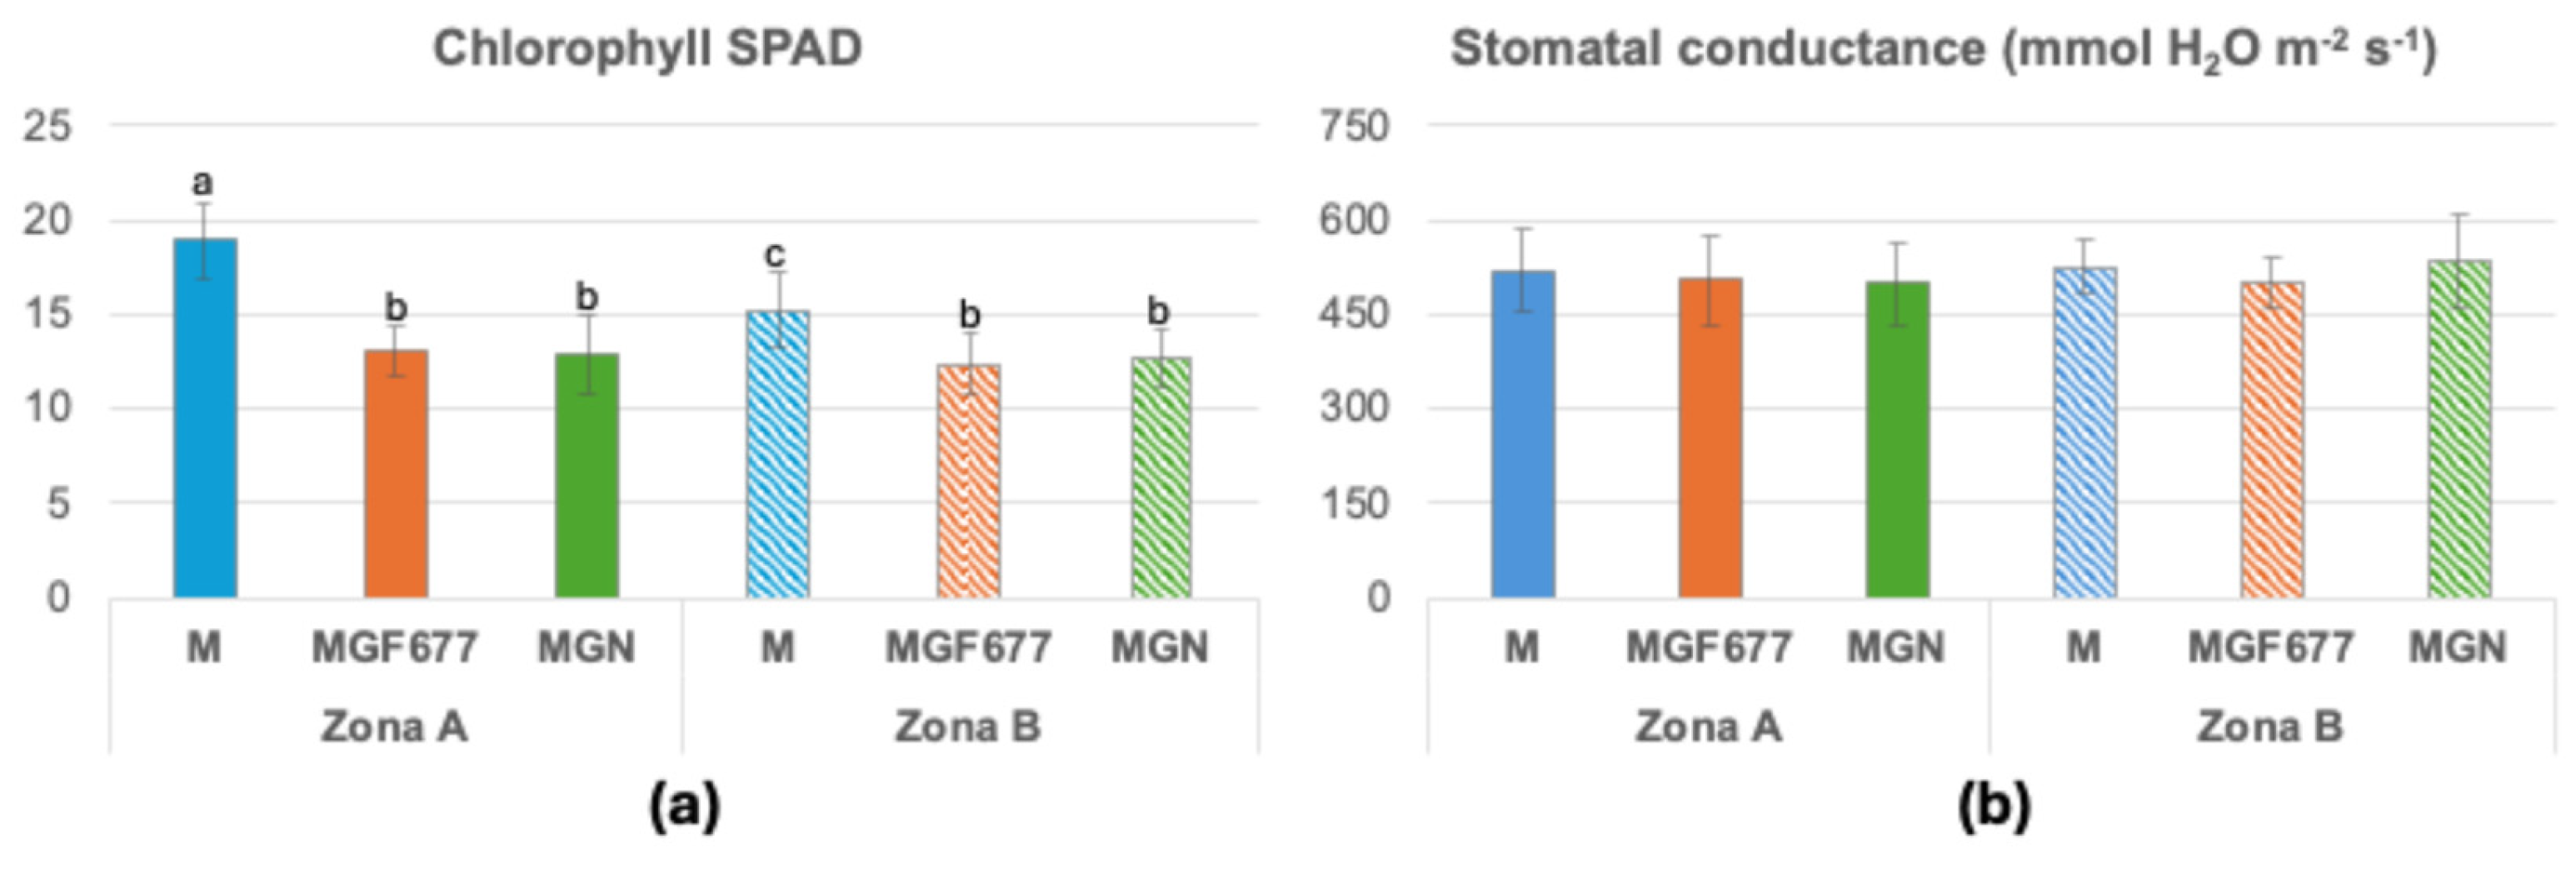
Figure 5.
Cumulative almond (a) and kernel yields (b) of 2024 and 2025. Means of 12 replicates ± SD; different lowercase letters above the bars indicate a significant difference at P< 0.05 level (Duncan’s multiple comparison test). M, ‘Marta’; MGF ‘Marinada’ grafted onto INRA GF-677; MGN, ‘Marinada’ grafted onto GARNEM®.
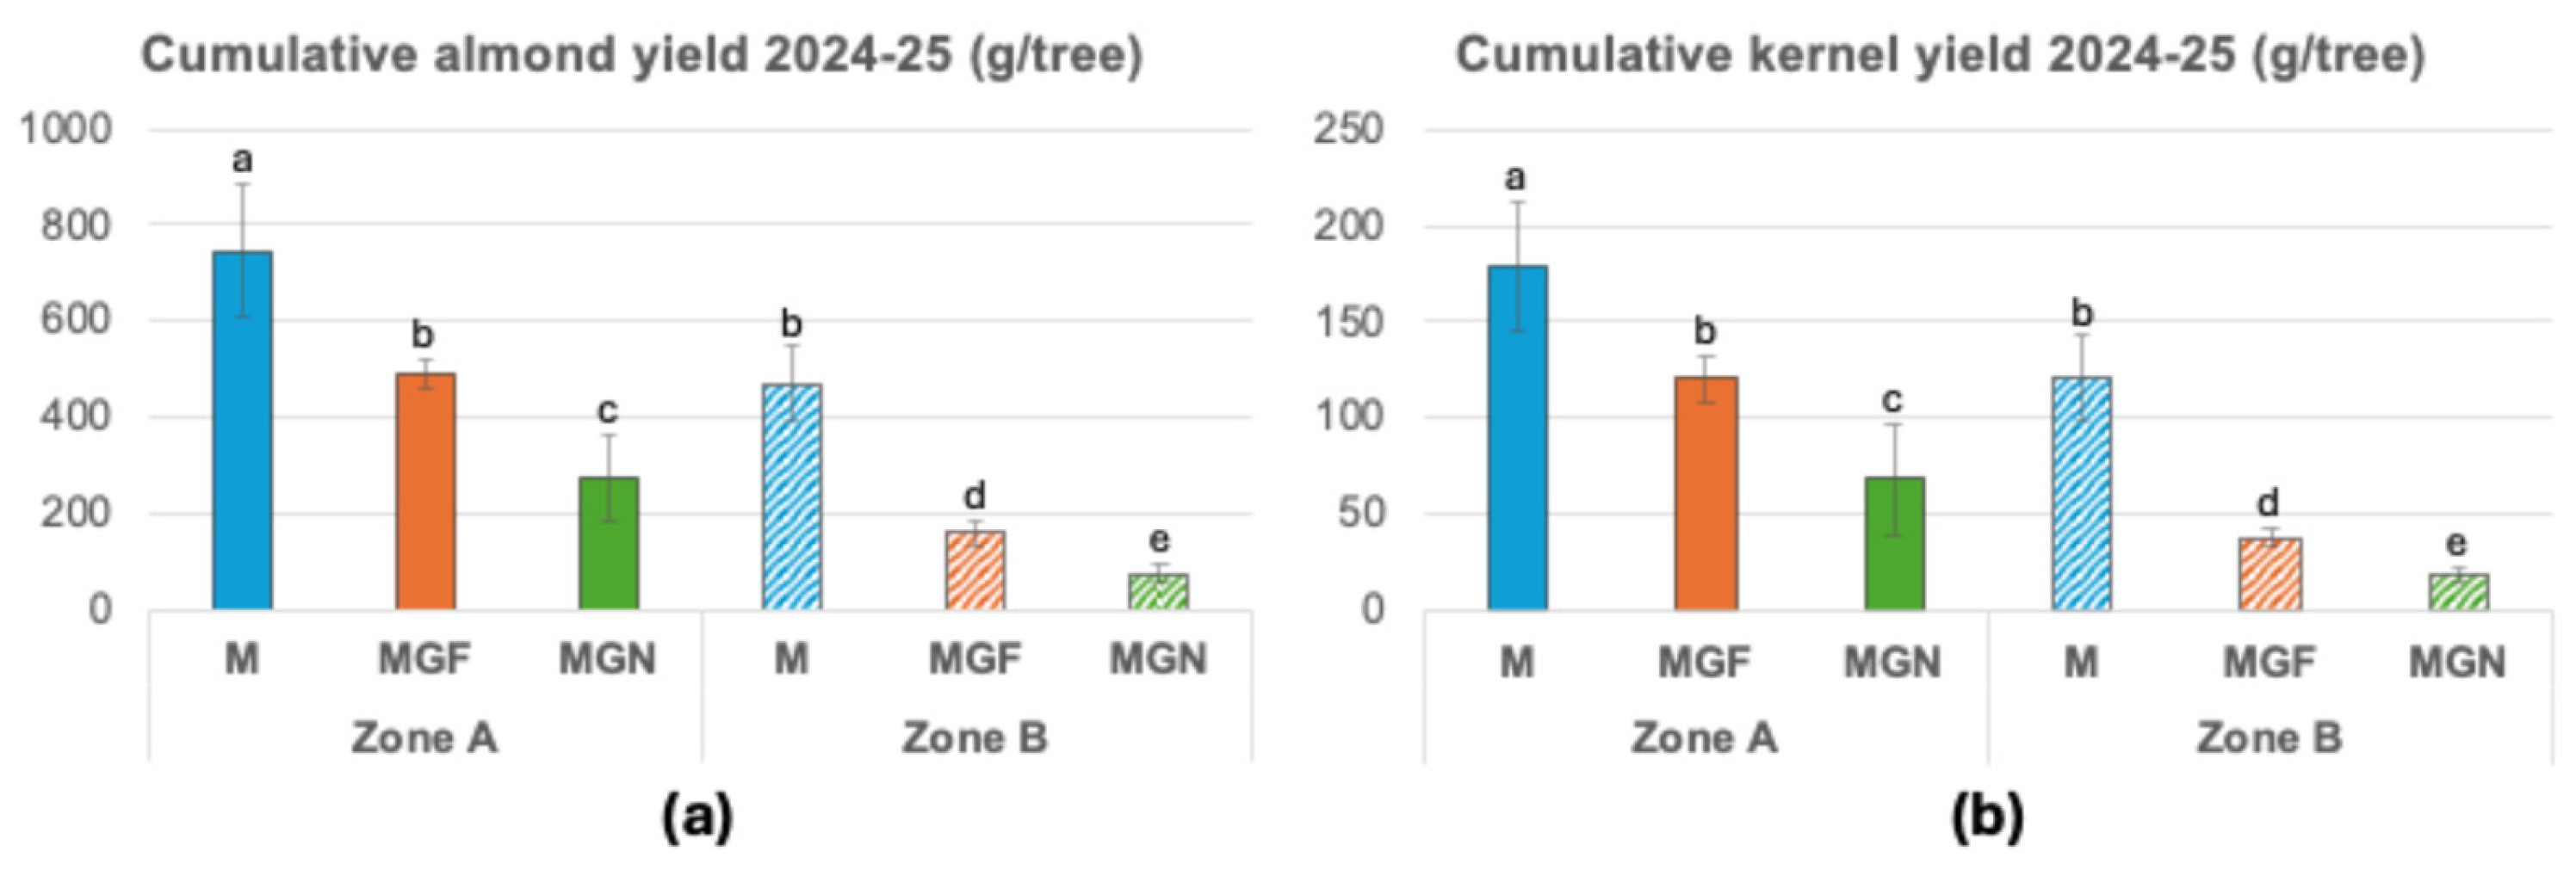
Figure 6.
Qualitative correlation color map of the upper horizon (a) and the buried horizon (b) physicochemical parameters that presented differences between Zone A and Zone B and almond yield in these two zones. Negative correlation is shown in brown; positive correlation is shown in green. SOC, soil organic carbon; CEC, cation exchange capacity; CCE, calcium carbonate equivalent; ACC, active calcium carbonate; EC, electrical conductivity. M, ‘Marta’; MGF ‘Marinada’ grafted onto INRA GF-677; MGN, ‘Marinada’ grafted onto GARNEM®.
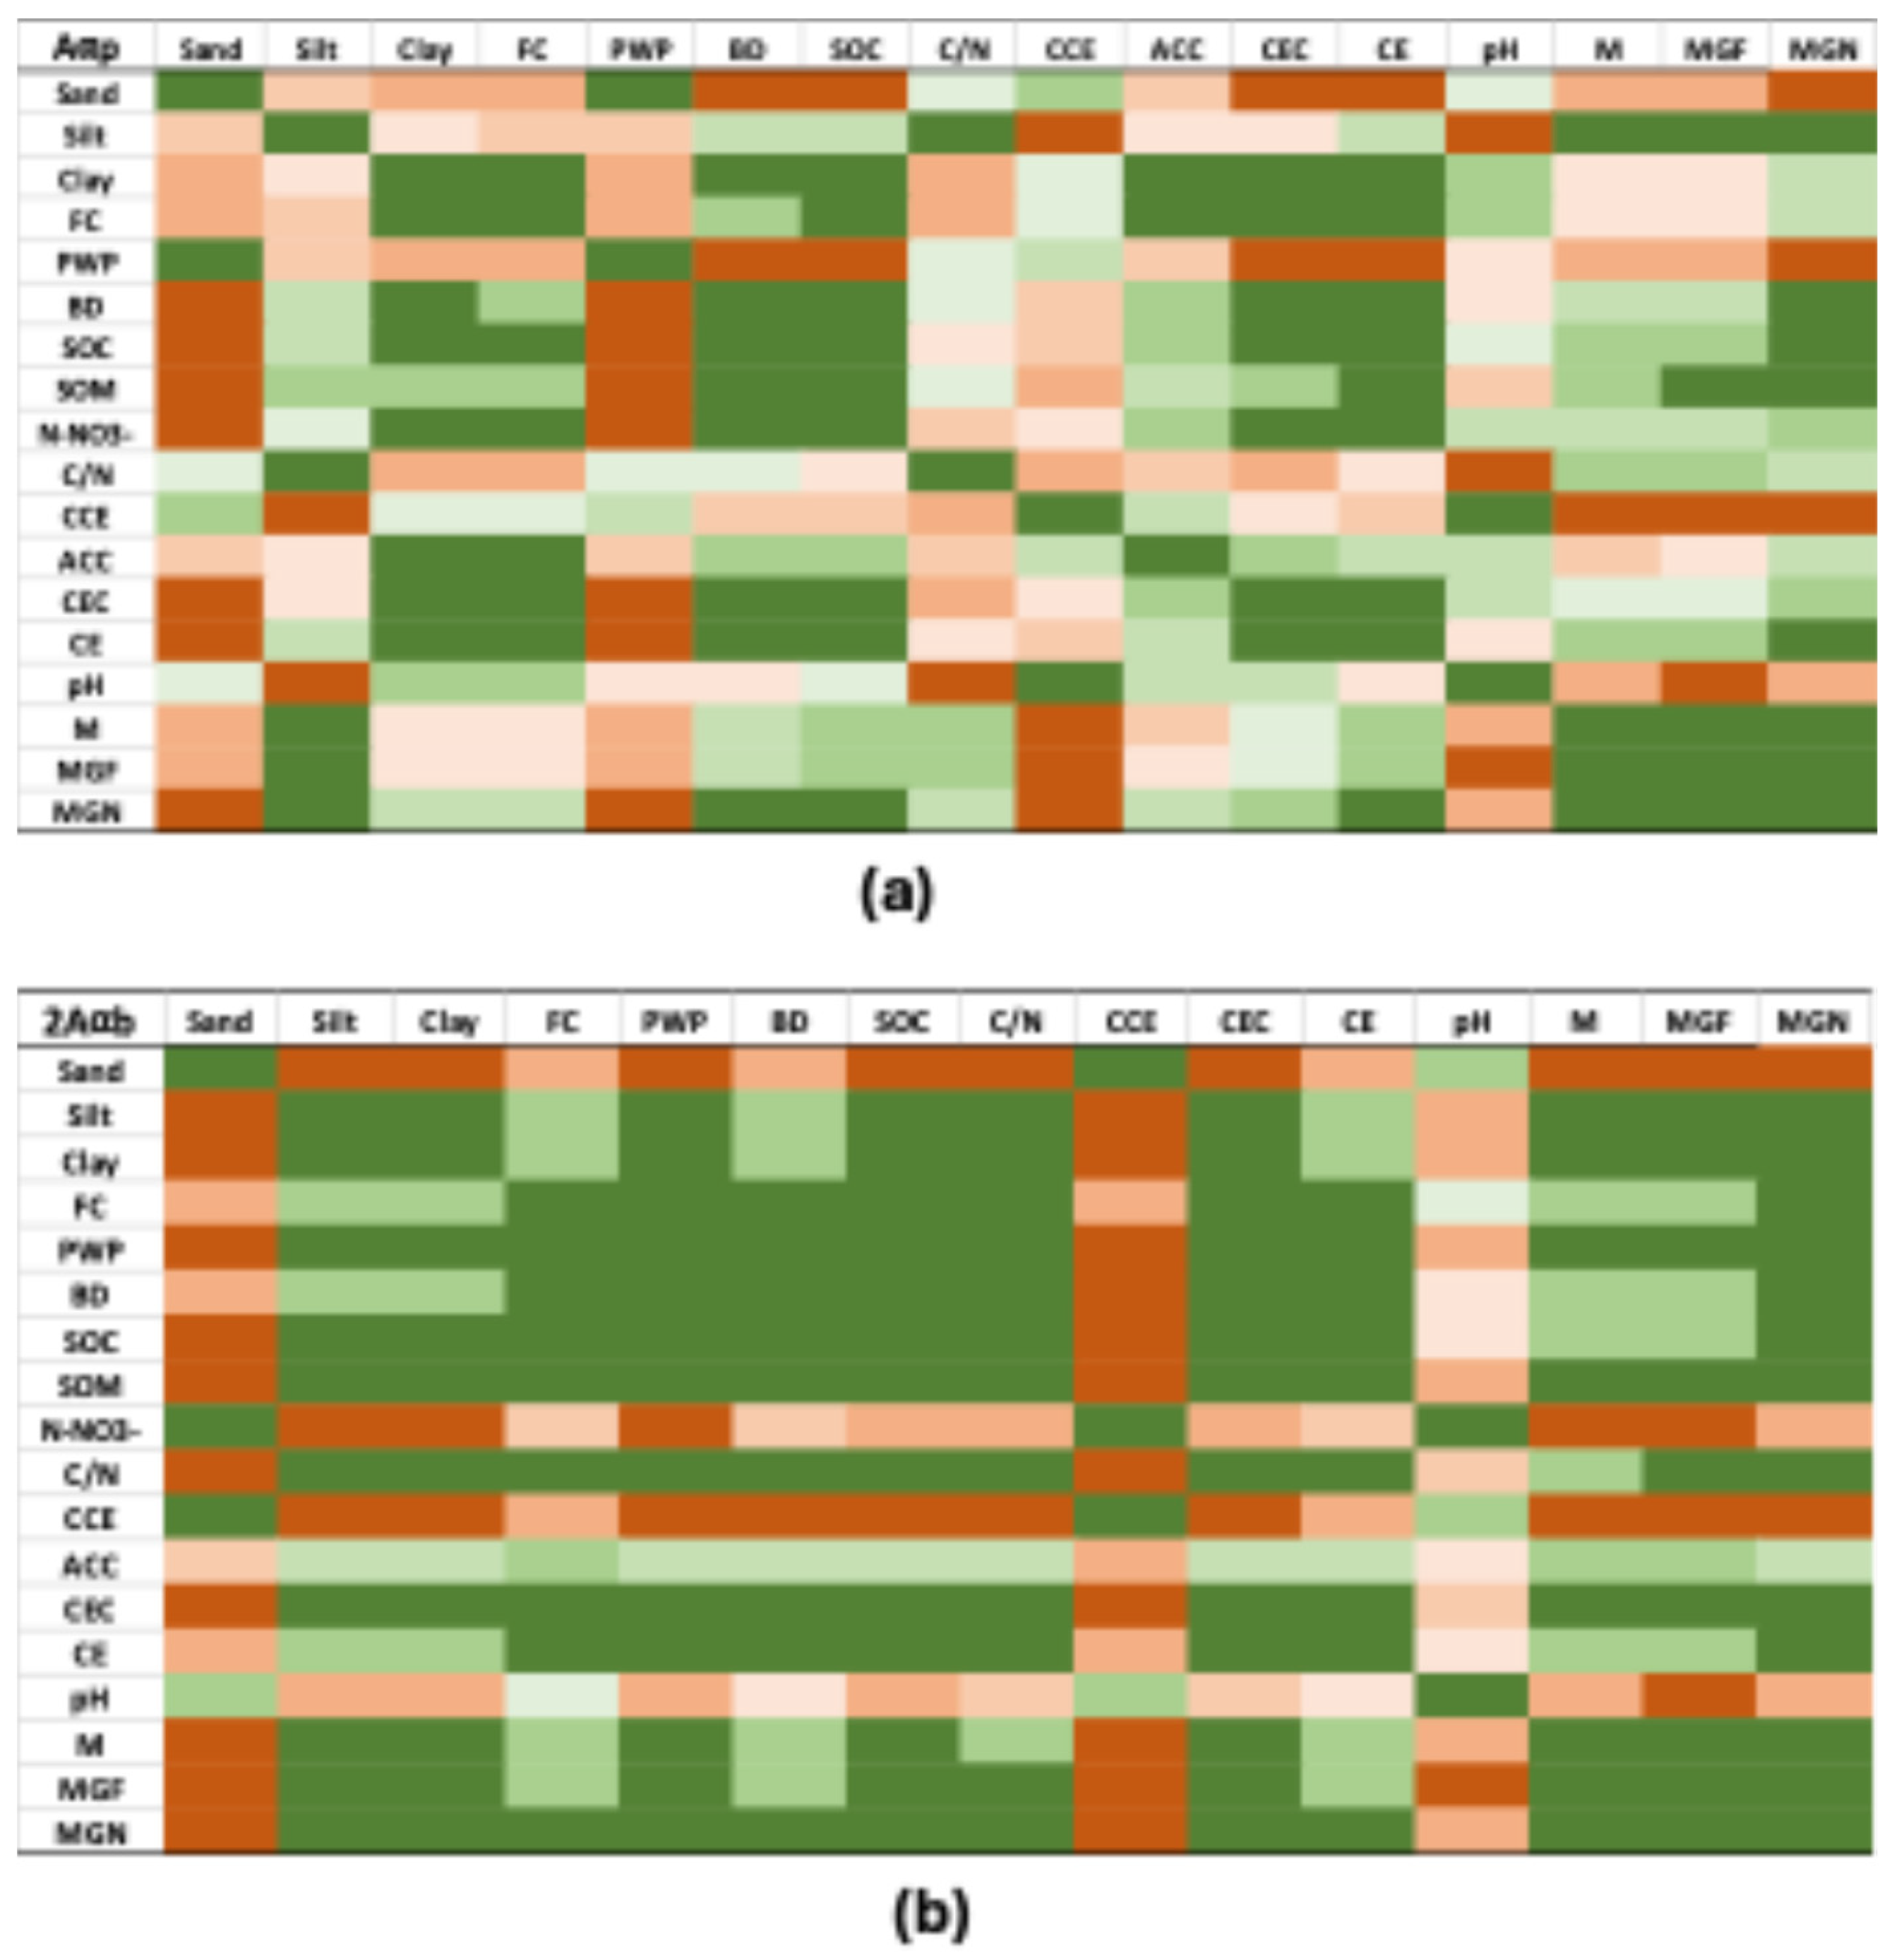
Figure 7.
Potassium, Ca and P concentration in seed (a,b,c) and skin (d,e,f) in mg/ g dry weight. Means of 12 replicates ± SD; different lowercase letters above the bars indicate a significant difference at P< 0.05 level (Duncan’s multiple comparison test). Reference values from seven major California varieties [25]: K (5.4-9); Ca (1.98-3.7); Mg (22-30). M, ‘Marta’; MGF ‘Marinada’ grafted onto INRA GF-677; MGN, ‘Marinada’ grafted onto GARNEM®. .
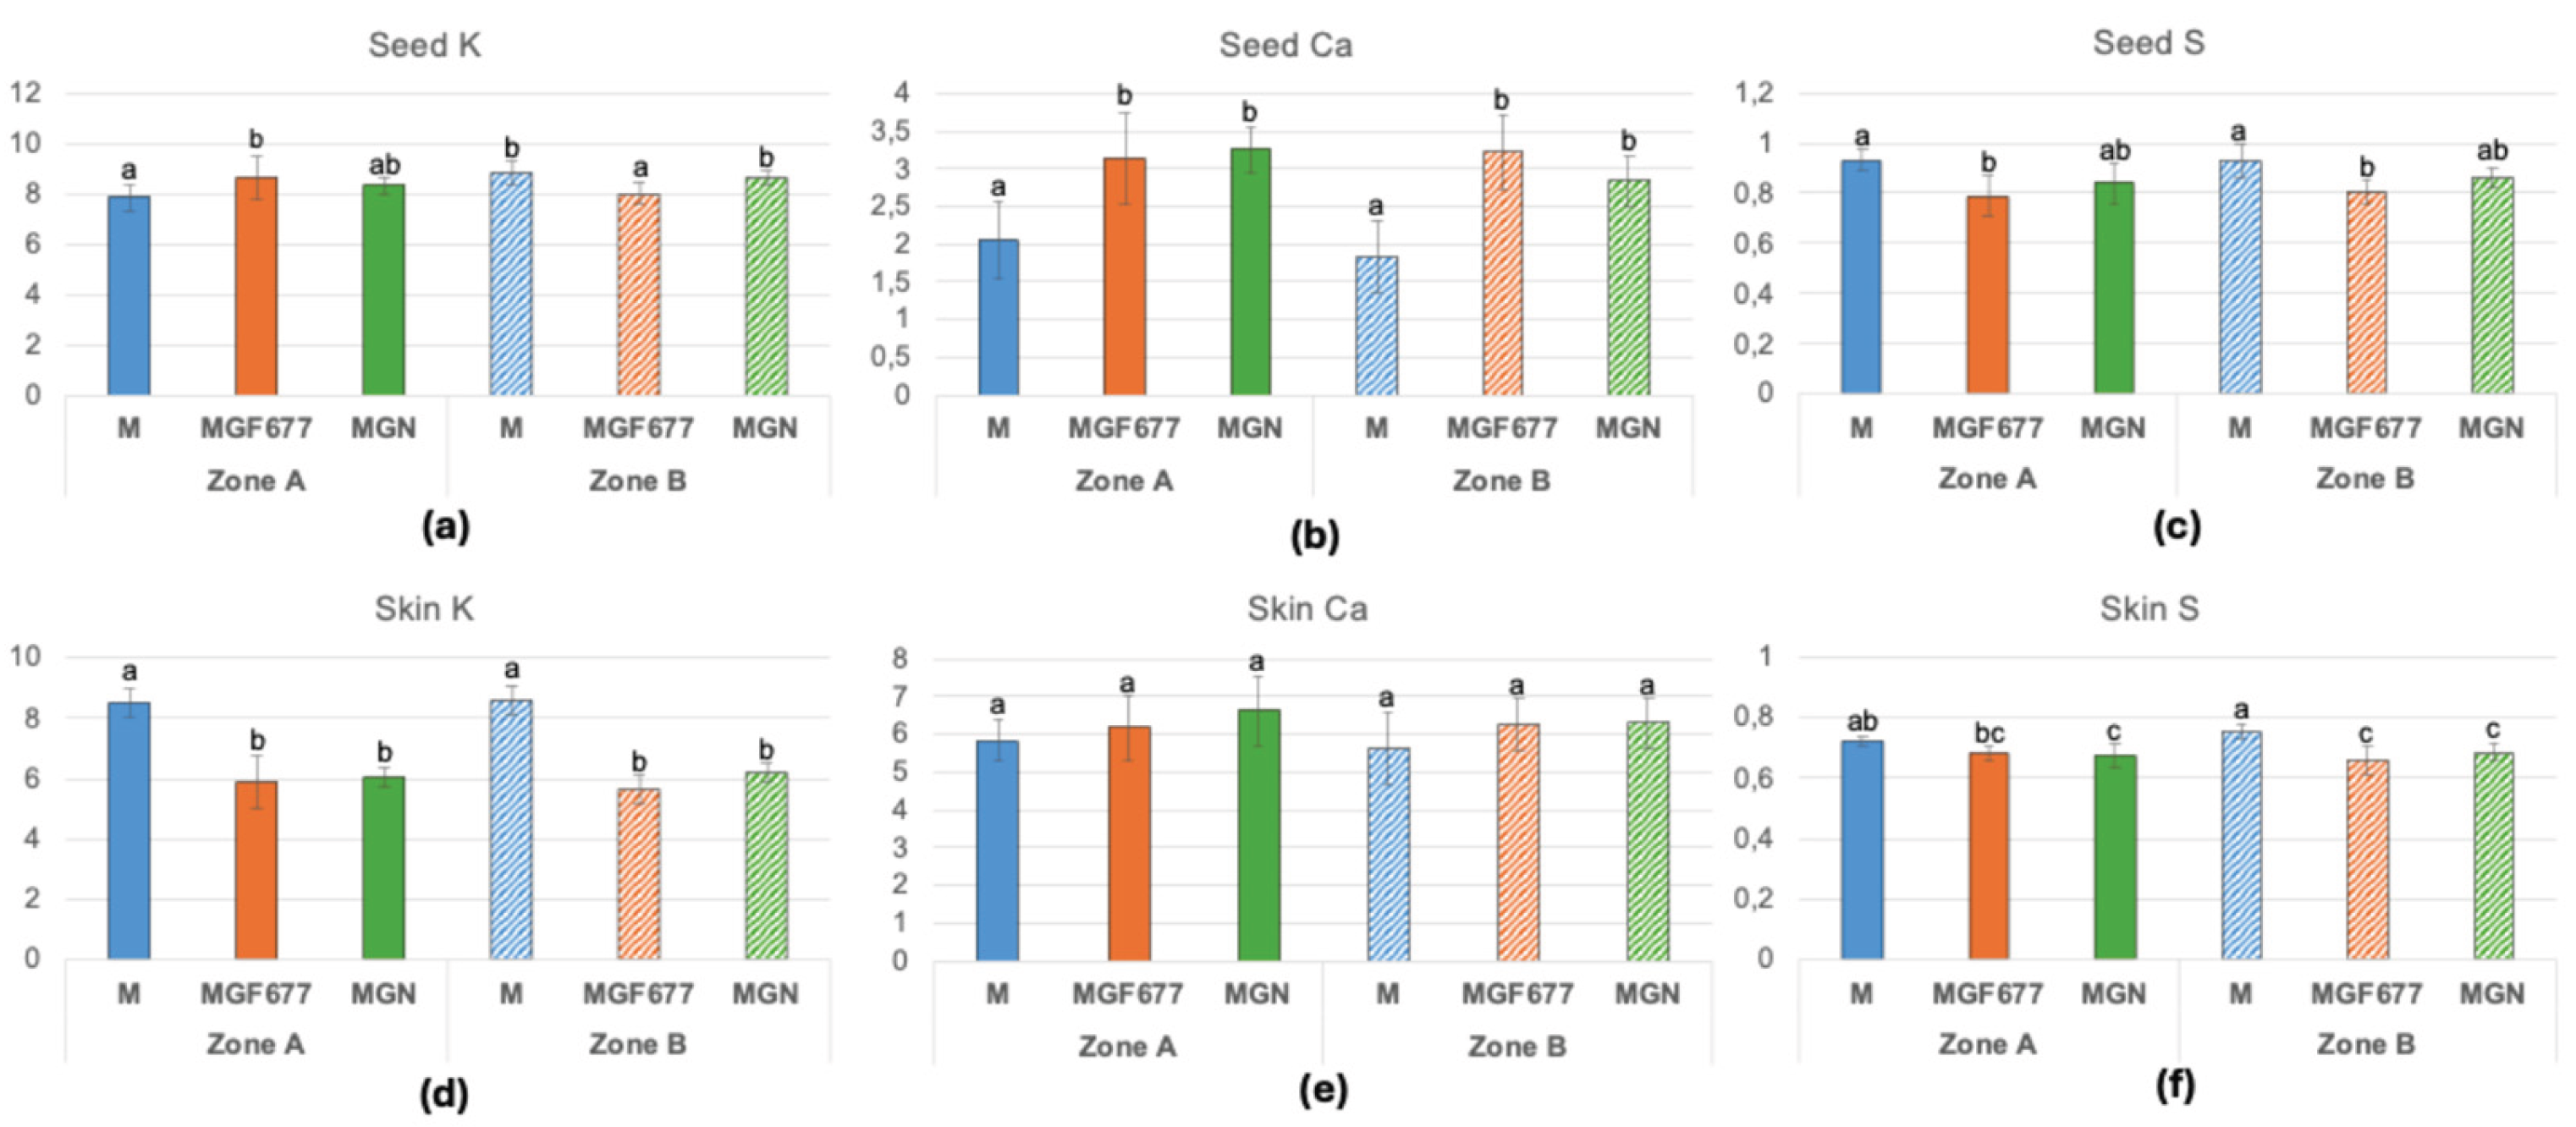
Figure 8.
Iron, Mn and Zn concentration in almond seed (a,b,c) and skin (d,e,f) in µg/ g dry weight. Means of 12 replicates ± SD; different lowercase letters above the bars indicate a significant difference at P< 0.05 level (Duncan’s multiple comparison test). Reference values from seven major California varieties [25]: Fe (26-45); Mn (13-40); Zn (20-40). M, ‘Marta’; MGF ‘Marinada’ grafted onto INRA GF-677; MGN, ‘Marinada’ grafted onto GARNEM®.
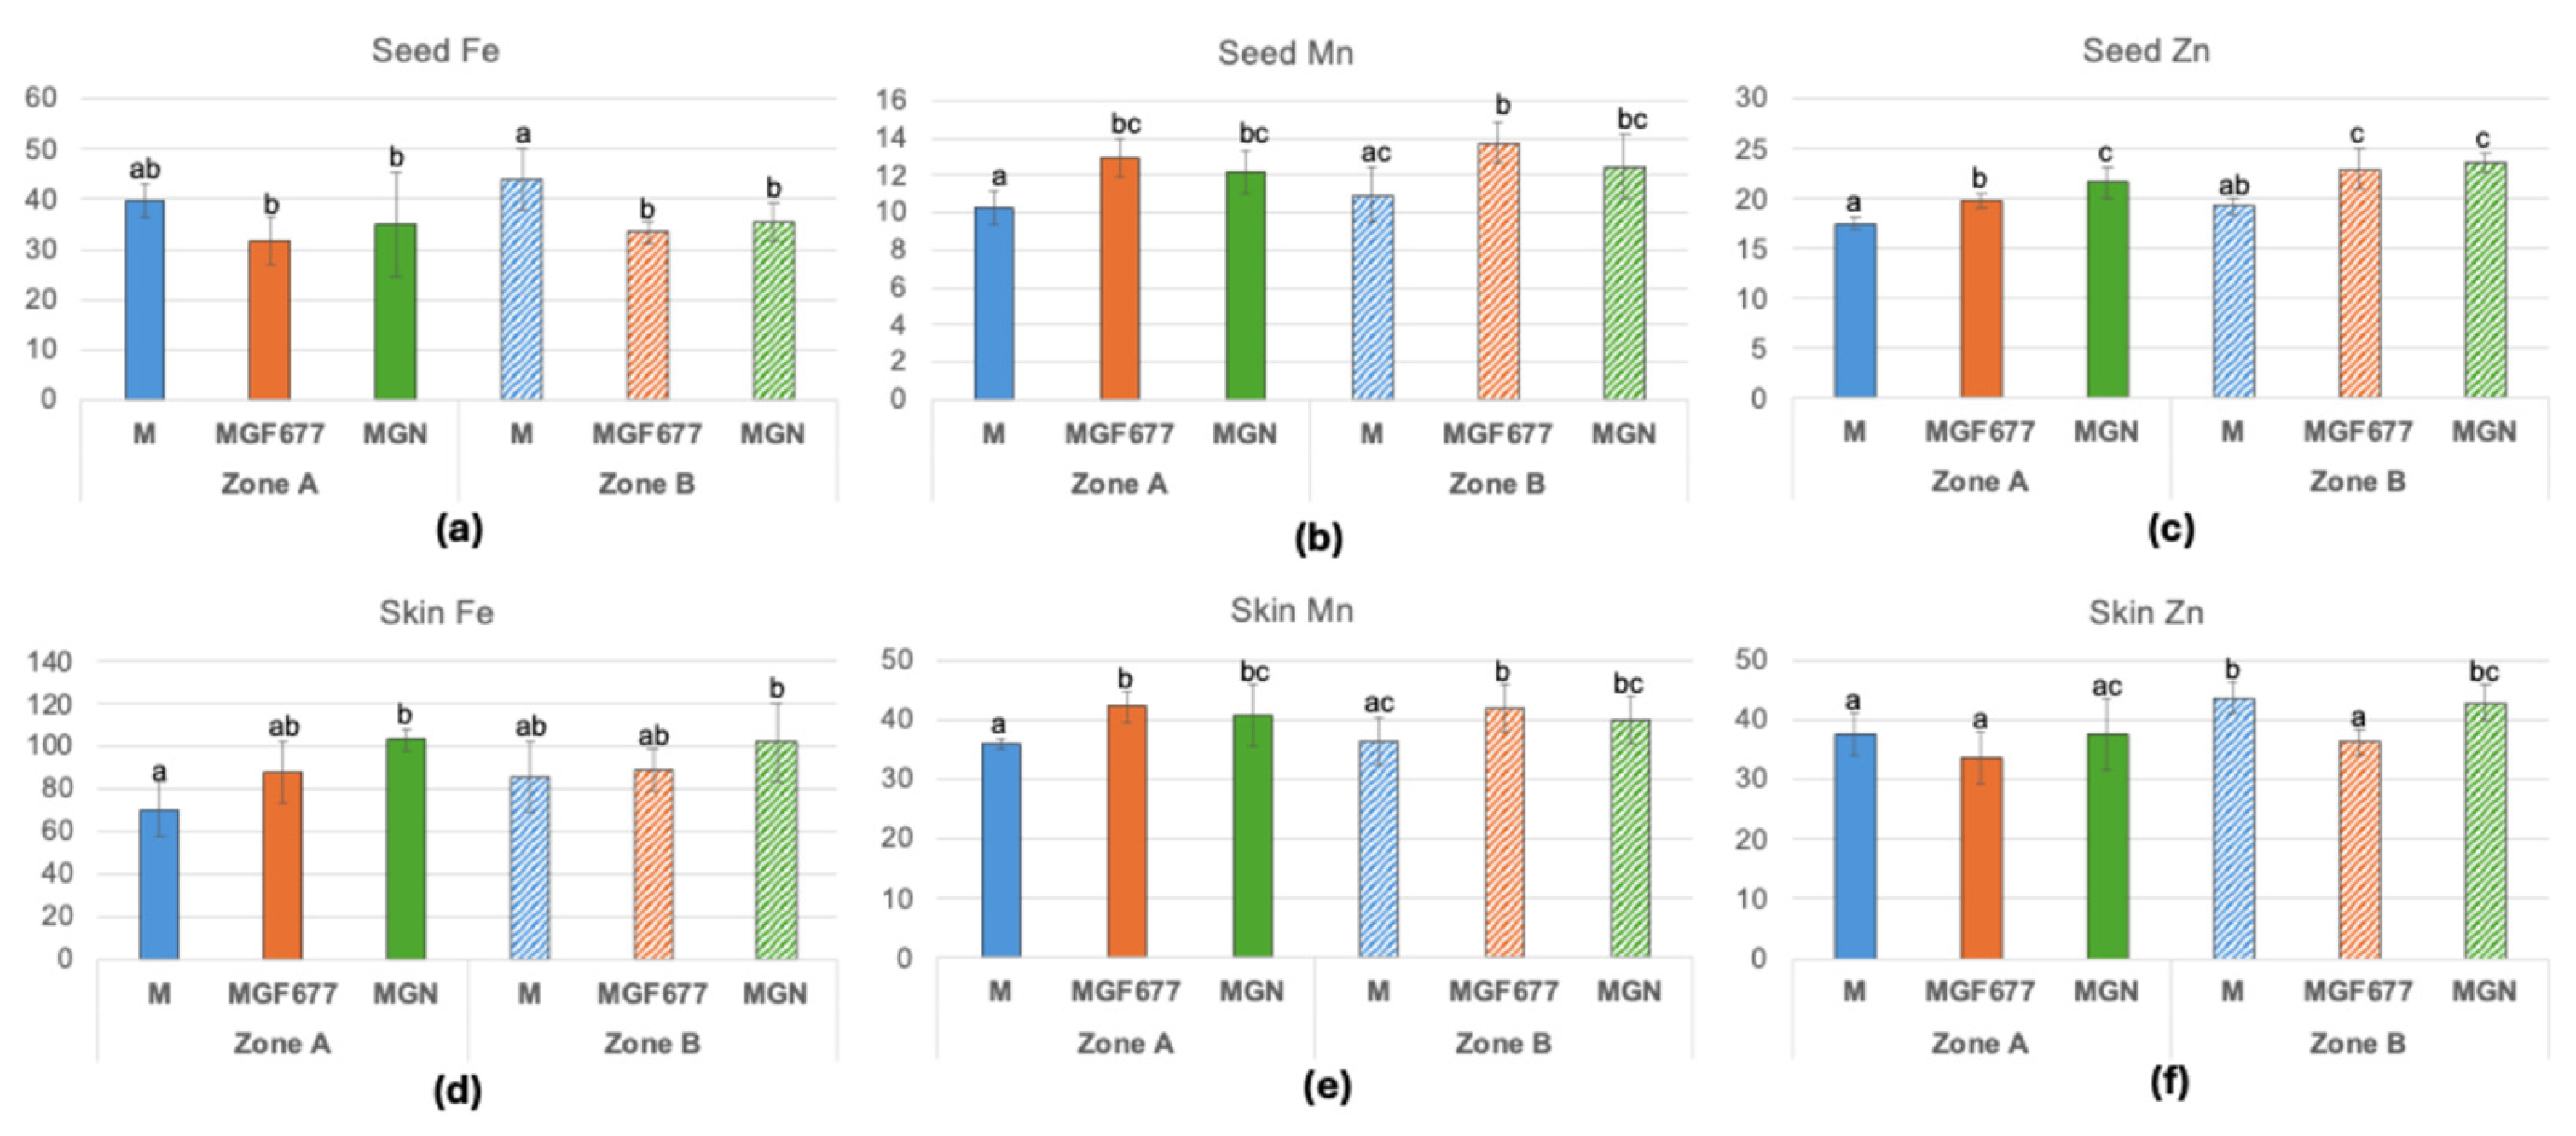

Table 1.
Soil profile physicochemical parameters of the two zones. FC, field capacity; PWP, permanent wilting point; BD; bulk density; SOC, soil organic carbon; SOM, soluble organic matter; C/N, carbon/nitrogen ratio; P, phosphorus; CCE, calcium carbonate equivalent; ACC, active calcium carbonate; CEC, cation exchange capacity; EC, electrical conductivity.
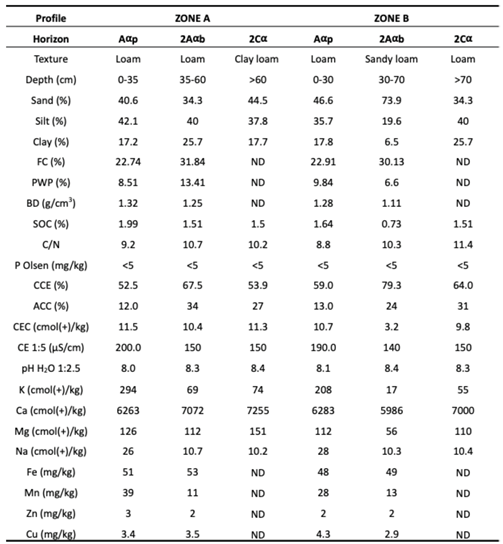 |
Table 2.
Leaf mineral nutrient composition. Means of 12 replicates ± SD; different letters indicate a significant difference at P< 0.05 level (Duncan’s multiple comparison test). M, ‘Marta’; MGF ‘Marinada’ grafted onto INRA GF-677; MGN, ‘Marinada’ grafted onto GARNEM®.
Table 2.
Leaf mineral nutrient composition. Means of 12 replicates ± SD; different letters indicate a significant difference at P< 0.05 level (Duncan’s multiple comparison test). M, ‘Marta’; MGF ‘Marinada’ grafted onto INRA GF-677; MGN, ‘Marinada’ grafted onto GARNEM®.
 |
Unit () varietal nutrient contents (/g leaf, dry weight).
Disclaimer/Publisher’s Note: The statements, opinions and data contained in all publications are solely those of the individual author(s) and contributor(s) and not of MDPI and/or the editor(s). MDPI and/or the editor(s) disclaim responsibility for any injury to people or property resulting from any ideas, methods, instructions or products referred to in the content. |
© 2026 by the authors. Licensee MDPI, Basel, Switzerland. This article is an open access article distributed under the terms and conditions of the Creative Commons Attribution (CC BY) license.
Copyright: This open access article is published under a Creative Commons CC BY 4.0 license, which permit the free download, distribution, and reuse, provided that the author and preprint are cited in any reuse.


