Submitted:
12 January 2026
Posted:
13 January 2026
You are already at the latest version
Abstract
Due to the seasonality of its production and to its polluting characteristics, the management and disposal of large amounts of grape pomace (GP) produced worldwide every year can pose a significant economic and environmental challenge. The research on the possible exploitation of GP for various purposes has been constantly growing during the last years, due to the increased general sensibility on issues like sustainability of agro-industrial production and to the growing consumer demand for the use of natural versus synthetic compounds.
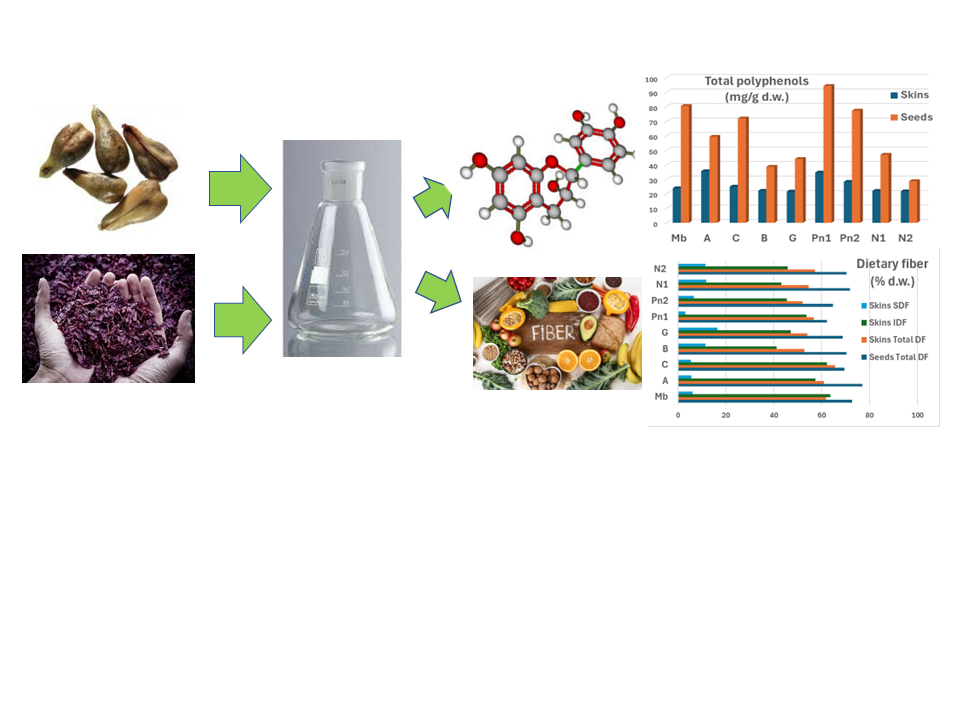
The work concerned the determination of the polyphenolic profile and the dietary fiber content of skins and seeds from unfermented and fermented white and red grape pomace of different cultivars, sampled from local wineries in the Piedmont area (Italy) after winemaking.
A double extraction was performed to maximize the extraction of polyphenols from grape pomace flours. The extractable polyphenols content (EPP) was determined in the extracts, while the non-extractable condensed tannins (NEPP) linked to the fiber were quantified in the residue after extraction. The total dietary fiber (TDF) was determined for skins and seeds; limited to skins, the analysis was extended to the distinction between soluble and insoluble dietary fiber (SDF and IDF).
The polyphenolic and dietary fiber content was significantly higher in seeds than in skins. However, from a nutritional point of view, skins dietary fiber may be more interesting due to the higher NEPP content than seeds; moreover, the winemaking technique influenced the quantity and characteristics of skins fiber, which contained SDF, almost absent in seeds.
Keywords:
winemaking byproducts
; grape pomace
; extraction
; polyphenols
; dietary fiber
1. Introduction
The world production of grape pomace (GP) by the wine industry annually exceeds 10 Mt (FAOSTAT, 2020). Due to its seasonality and polluting characteristics, the management and disposal of large amounts of GP can pose a significant economic and environmental challenge; however, GP is one of the richest sources of natural phenolic compounds, which are widely studied, due to their effective antioxidant and free radical scavenging activities, as biologically active substances in the food industry (nutraceuticals, food preservatives), in medicine, pharmacology, and biomedicine, as well as for many other industrial applications (natural colorants, cosmetics, etc.).
The research on the possible exploitation of GP for various purposes has been constantly growing during the last years, due to the increased general sensibility on issues like sustainability of agro-industrial production and to the growing consumer demand for the use of natural versus synthetic compounds. Limited to the food sector, GP is used to improve food quality and develop ingredients and products with high added value (Martinez et al., 2016), to produce functional foods and food supplements (dietary fibers and polyphenols, pomace powder), and for food processing (biosurfactants, natural antioxidant, natural colorants) (Rózek et al., 2010; Dwyer et al., 2014; Shinagawa et al., 2015).
In addition to polyphenols, the nutritional value of GP is also due to the high content of dietary fiber (DF). The AACC (American Association of Cereal Chemists) defines DF as the edible part of plants or analogous carbohydrates that are resistant to digestion and absorption in the human small intestine, with complete or partial fermentation in the large intestine (AACC, 2001). DF includes polysaccharides, oligosaccharides, lignin and associated plant substances, and it has several beneficial effects for human health: it regulates intestinal transit, prevents diabetes, hypertension, coronary heart disease, cardiovascular disease and colon cancer (Zhang et al., 2017).
Based on its solubility in water, DF can be distinguished into:
- Insoluble dietary fiber (IDF), which includes insoluble hemicellulose, cellulose, resistant starch and lignin. Due to its ability to retain water, IDF promotes satiety and improves digestion.
- Soluble dietary fiber (SDF), which includes pectin, gums and mucilages. Due to its capacity to lower cholesterol levels and the glycemic index, SDF is associated with a reduction in the risk of cardiovascular disease.
Generally, fruit dietary fiber is of better quality than dietary fiber from cereals, due to its higher total and soluble fiber content, a better insoluble/soluble fibre ratio, water and oil holding capacity and colonic fermentability, as well as its lower phytic acid contents and caloric values (Martín-Carrón et al., 1999). In addition, fruit DF contains a significant amount of secondary compounds associated with it, such as polyphenols and terpenes. This type of fiber is called "antioxidant dietary fiber” (ADF), and the definition refers particularly to a concentrate of DF that contains high amounts of natural antioxidants associated with non-digestible compounds, generally defined as “non-extractable polyphenols” (NEPP) (Saura Calixto, 1998; Goñi et al., 2009). NEPP are a relevant fraction of dietary polyphenols exerting their main biological action in the colon, where they are extensively fermented by the action of microbiota, giving place to absorbable metabolites. NEPP have different potential health-related properties, particularly for gastrointestinal health, such as increases in antioxidant and antiproliferative capacities, reduction of intestinal tumorigenesis and modification of gene expression (down-regulation of genes associated with tumour development and proto-oncogenes, and up-regulation of tumour-suppressor genes) (Pérez-Jiménez et al., 2013).
In view of the possible exploitation of GP as a food additive or dietary supplement in the food industry (nutraceutics), this work is innovative since, as a follow-up to our previous work (Guaita et al., 2023), it reports for the first time to our knowledge the characterization of the polyphenolic profile and the dietary fiber content of skins and seeds from unfermented and fermented GP. Seven grape cultivars, widely grown in the Piedmont area (Italy), were studied: Muscat blanc, Cortese, Arneis, Pinot noir, Barbera, Grignolino, Nebbiolo.
2. Materials and Methods
GP was sampled from local wineries in the Piedmont area (Italy) after pressing (fresh unfermented GP, from white winemaking process: UGP) or after racking off and pressing (fermented GP, from red winemaking process: FGP).
9 different types of GP were analyzed, sampled as winemaking by-products of 7 grape cultivars: 3 white cultivars (Muscat blanc, Arneis, Cortese) and 4 red cultivars (Barbera, Grignolino, Pinot noir and Nebbiolo); Pinot noir was also sampled as UGP (from white winemaking), and Nebbiolo was sampled as FGP after macerations of different duration. The description of the material used is reported in Table 1. For each GP sample, the study focused on the composition of skins and seeds separately.
2.1. Sample Preparation
Before drying, UGP was washed with water to remove residual sugars. All GP samples were dried under controlled conditions: pre-drying for 48 h at room temperature in a ventilated and dehumidified room, followed by drying at 40 °C for 48 hours, up to constant weight (residual humidity 5-10%). Once dried, the skins were separated from the seeds, and the 2 fractions were separately milled to obtain skins and seeds flours.
An extraction method aimed at maximizing the extraction of the polyphenolic component from the flours was applied, that allows to determine the total polyphenolic content through the characterization of two different fractions: EPP (extractable polyphenols) and NEPP (non-extractable polyphenols). In parallel, the quantification of other components of dietary interest, such as dietary fiber and total proteins, was carried out.
2.2. Extraction of EPP
The polyphenolic extracts of skins and seeds flours were obtained with a double solid/liquid extraction (Llobera & Canellas, 2007): two successive extractions of 1 g of flour, first with 10 mL of methanol/water 50:50 %v/v followed by 10 mL of acetone/water 70:30 %v/v (extraction ratio 1:10 w/v). For each extraction: 15 min of ultrasound (50 W, 48 kHz ± 10%), 1 hour of orbital shaker (ambient temperature), 15 min of centrifuge (20 °C, 4000 rpm). All extractions were performed in duplicate. The supernatants were combined and dried under vacuum for the subsequent analysis of extractable polyphenols (EPP).
The residue after extraction was analyzed to determine the fraction of non-extractable polyphenols (NEPP) as condensed tannins (CT).
2.3. Polyphenolic Composition of EPP and NEPP
The content of total polyphenols (GAE), total flavonoids and total anthocyanins in the EPP fraction was determined with spectrophotometric methods (Guaita et al., 2021):
- -
- Total anthocyanins and total flavonoids: the extract was diluted 50-fold with hydrochloric ethanol (ethanol/H2O/HCl; 70:30:1) and the absorbance at 540 nm (total anthocyanins) and 280 nm (total flavonoids) was measured. The results were expressed, respectively, as malvidin and (+)-catechin equivalents.
- -
- Total polyphenols: 1 mL extract was diluted 20-fold with water, and 1 mL of diluted sample was added to 1 mL of Folin-Ciocalteu reagent, basified with 4 mL of sodium carbonate 10% w/v, and filled up to 20 mL. After 90 min, the absorbance at 750 nm was measured. The results were expressed as gallic acid equivalents (GAE).
The condensed tannins (CT) content was determined in the NEPP fraction with the method proposed by Goñi et al. (2009, modified), based on the Bate-Smith reaction. Strong acidic conditions are needed to release NEPP from the dietary fiber (DF) matrix: the residue after the extraction is treated with 20 mL of 50% HCl in ethanol, containing Fe (II) as catalyst (300 mg/L of FeSO4×7H2O); blank reading at 532 nm; 30 min boiling with reflux tubes; final reading at 532 nm. The calibration curve of the reaction was calculated using the same procedure with 4 different polyphenolic extracts with known concentrations of GAE and CT (determined with the phloroglucinolysis HPLC method ̶ Guaita et al., 2023). The same method with the same calibration curve was used to measure the CT content as EPP in the extracts.
2.4. Determination of Dietary Fiber
The percentage content of dietary fiber (total dietary fiber, TDF) of the flours was determined with the official enzymatic gravimetric method AOAC 985-29 (Megazyme kit, Foss Fibertech 1023). Briefly, samples are subjected to sequential enzymatic digestion by heat-stable α-amylase, protease and amyloglucosidase to simulate the digestion in the human body, thus separating and quantifying dietary fiber as indigestible residue, after correction for indigestible protein and ash content.
The analysis was extended to the distinction between soluble and insoluble dietary fiber (SDF and IDF) only for the skins samples, since SDF in the seeds is generally present at low concentrations: as grape seeds are not particularly rich in starch and other carbohydrates, the fibrous portion is largely represented by IDF (Alía et al., 2003; Alvarez-Ossorio et al., 2022).
Total nitrogen as indigestible protein fraction was determined in all DF fractions (TDF, IDF, SDF) applying the Kjeldahl method.
2.5. Statistical Analysis
The data were processed with univariate (one-way ANOVA, and Tukey's pairwise comparison test and correlation analysis) and multivariate (PCA and Cluster Analysis) analysis techniques (XLSTAT 2019, Addinsoft, Paris, France, 2019).
3. Results and Discussion
3.1. Skins: Polyphenolic Composition
Table 2 reports the polyphenolic profile of the skins flours. The residual humidity of the flours ranged between 5.4 and 10.0 %: all data reported in the table are corrected for humidity and are referred to the dried flour weight (d.w.).
As regards EPP, the total polyphenol content (GAE) varied between 21.5 and 35.5 mg/g d.w. The highest GAE values were observed for Arneis and Pinot noir 1 (UGP) which were significantly different from all the others, similar to each other. The only exception was Pinot noir 2 which had intermediate values and was not significantly different from all the others.
These values are in line with the findings of Llobera & Canellas (2007, 2008), Vatai et al. (2009), Deng et al (2011) for GP from French grape varieties, while averagely higher were the values reported by Bravo & Saura-Calixto (1998) and Makris et al. (2007) for GP from Spanish and Greek grape varieties, ranging from 36.2 and 54.0 mg/g d.w. In any case, Ishiwata et al. (2004), Llobera & Canellas (2007) and Deng et al (2011), considering documentary bibliographic values, highlight the generally higher polyphenolic content of GP compared to other fruit pomaces.
The CTex content varied between 24.9 and 35.5 mg/g d.w. (Table 2). The highest concentrations of CTex in the skins were found for Pinot noir (1 and 2) and Arneis, followed by a second group formed by Nebbiolo (1 and 2) and Cortese and, finally, a third group with the remaining samples (Muscat blanc, Barbera and Grignolino).
The content of CTnex varied between 11.6 and 18.4 mg/g d.w.: the highest concentration was found for Pinot noir 2 (FGP); following, in descending order of concentration, Nebbiolo 1 (short maceration), Grignolino, Cortese and Muscat blanc, Nebbiolo 2 (long maceration), Pinot noir 1 and Barbera and, finally, Arneis. This range of concentration is perfectly in line with the values found for the same raw material (GP skins) and with the same analytical method by Llobera & Canellas (2007, 2008), Goni et al. (2009), Deng et al (2011). The content of CTnex in the skins varied with the cultivar: the provenience from UGP or FGP did not seem to have a discriminating effect. This represents an original result of our research.
Considering total CT (CTex + CTnex), their content varied between 36.8 and 51.6 mg/g d.w.: the varietal differences are flattened, though Pinot noir (1 and 2) still maintains the highest values, followed by Arneis and Nebbiolo 1.
Only for red grape skins, total anthocyanins (red pigments) were quantified (Table 2): their content varied between 0.25 and 6.2 mg/g d.w. The highest concentrations were observed for Pinot noir 1, followed by Barbera and Pinot noir 2, while extremely low was the total anthocyanins content of the 3 remaining samples (Grignolino, Nebbiolo 1 and Nebbiolo 2). The concentration of anthocyanins probably depends both on the original richness of the cultivar (Chorti et al., 2010) and on the duration of the fermentative maceration (contact between skins and must).
3.2. Skins: Dietary Fiber Composition
The data relating to the fiber content of the skins are reported in Table 3.
The total fiber content (TDF) varied from 52.1 % of Pinot noir 2 to 69.7 % of Muscat blanc; no significant differences were observed between the 2 samples of the same cultivar (52-57% for Pinot noir and 55-57% for Nebbiolo), subjected to different winemaking processes. Subsequently, the analysis was extended to the distinction between the insoluble fiber (IDF: cellulose, hemicelluloses with a higher polymerization degree, and lignin) and the soluble fiber (SDF: pectins and hemicelluloses, soluble in water): IDF prevailed on SDF in all samples.
Overall, white grape skins had averagely higher concentrations of TDF and, above all, of IDF, compared to red grapes skins. As regards the IDF content, 2 significantly different groups were distinguished: the first consisting of Muscat blanc, Cortese and Arneis (significantly higher values) and the second consisting of Pinot noir 2, Nebbiolo (1 and 2) and Barbera; finally, intermediate values were found for Pinot noir 1 (UGP) and Grignolino (FGP with short maceration).
The SDF content was averagely lower in UGP flours, while the IDF content was lower in FGP flours. It is possible that during the fermentative maceration, in the case of FGP, part of IDF has been hydrolyzed and released in the must, due to the effect of endogenous grape enzymes (or, possibly, added enological enzymes) or to the effect of acidic pH. Moreover, in the case of red winemaking, the increase in alcohol content during fermentative maceration may have caused the precipitation of a part of SDF. As regards FGP, the highest concentrations of SDF were found for Grignolino, Barbera and Nebbiolo.
According to Bender et al. (2020), the high IDF content can be considered a positive result in view of possible uses of GP as a dietary supplement to increase the content of indigestible insoluble compounds (Martínez et al., 2012). On the other hand, Sheng et al. (2017) reported that the low SDF content of GP limits its use for food application due to the healthier benefits for human nutrition of the SDF fraction. In this sense, our results show how red GP (Barbera, Grignolino and Nebbiolo) may be more interesting for the food industry than white GP.
Table 3 shows the percentage of nitrogenous compounds that were found in the residues at the end of the enzymatic process, mainly proteins indigestible by the proteases used in the hydrolysis step of the method AOAC 985-29. As regards IDF, the nitrogen residue represented on average about 18.5 % of the collected residue and the values ranged from a minimum of 16.0 % for Muscat blanc to a maximum of 22.65 % for Pinot noir 2. As regards SDF, the indigestible protein residue was averagely lower than in the IDF fraction, with an average value of 13.8 %, but with a much wider range from a minimum of 7.8 % for Grignolino, to a maximum of 24.4 % for Pinot noir 1. However, considering that the overall percentage of SDF was significantly lower than the IDF one, the mass quantities of the nitrogen residues in SDF were quite limited, and not enough to consider them as a source of proteins or amino acids (after hydrolysis). Conversely, it could be degraded by gut microorganisms and therefore represent a source of amino acids for the bacteria themselves.
3.3. Skins: Relationship Between the Analyzed Chemical Variables and Between the Studied Cultivars
A Pearson’s correlation analysis was first conducted between all the parameters determined for the skins (Table 4).
The trend of the total flavonoid content was similar to that of GAE index: as reported in Table 4, the 2 variables were, in fact, significantly and positively correlated with each other (r = 0.89). Also the condensed tannins content (CTex) was significantly correlated with total polyphenols (GAE) and total flavonoids, although with lower r values (0.80 and 0.82, respectively).
No correlation was observed between the condensed tannin content of the NEPP fraction (CTnex) and that of the EPP fraction (CTex), nor between CTnex and GAE and total flavonoids. The concentration of CTnex varied with the raw material: the origin as UGP or FGP did not seem to have a discriminating effect, but the varietal differences prevailed.
A negative correlation was observed between SDF and IDF. On the contrary, the correlation between TDF and IDF (which represents the largest share of TDF), was highly significant and positive.
Furthermore, the positive correlation between the polyphenolic fractions and the nitrogen residue of the SDF fraction can be justified both by considering that higher concentrations of polyphenols may reduce the protease activity during the AOAC method for the determination of DF, or that the SDF fraction includes a part of polyphenols bound to it, which in turn binds a part of the protein fraction. On the other hand, the correlations between the SDF/IDF ratio with the two parameters that make up the ratio are irrelevant, as they are due to the calculation of the ratio between these variables.
Finally, the negative correlation between the nitrogen residue of SDF and the percentage of SDF is of minimal interest; this result was not observed for the IDF component. The parameters "fiber content” (TDF, IDF and SDF) and "CTex” or “CTnex” were independent of each other, because they varied with the type of GP analyzed (grape cultivar, winemaking process).
All data (skins polyphenolic composition and fiber content) were subjected to Principal Component Analysis (PCA). Figure 1 shows the representation of the loadings (variables) and the scores (skin samples from different cultivars) in the space defined by the first two Principal Components, that overall describes 80% of the variability of the original data.
The first Principal Component is positively associated with the variables expressing the polyphenolic content of the skins (GAE, total flavonoids, CT TOT and CTex) and with the protein fraction of SDF, while it is negatively associated with SDF%. The second Principal Component is positively associated with the content of non-extractable condensed tannins (CTnex) and with the protein fraction of IDF, and negatively associated with IDF% and TDF%.
The first axis (PC1) discriminates the skins samples from each other based on their varietal origin: in particular, Pinot noir (P1 and P2), Arneis and Cortese are distinguished from the others by the higher polyphenolic content and the lower SDF%. The second axis (PC2) discriminates FGPs from UGPs (winemaking technique: fermented vs unfermented), due particularly to the higher content of non-extractable condensed tannins (CTnex) and to the lower IDF%. When considering as a whole the chemical composition data (Cluster Analysis with Ward’s method, data not reported), all FGPs, except Pinot noir 2, are distinguished from UGPs. Pinot noir 2 is classified in this second group mainly due to the higher polyphenolic content (extractable fraction) on the one hand, and to the lower SDF content on the other side.
Overall, it is important to notice that the grape variety of origin influences above all the polyphenolic content of the extractable fraction (what is normally determined through chemical analysis), while the winemaking technique (fermented vs unfermented) exerts its effect mainly on the non-extractable polyphenolic fraction (CTnex) and on the IDF% content.
3.4. Seeds: Polyphenolic Composition
Table 5 shows the chemical composition of seeds flours. The residual humidity of the flours ranged between 5.5 and 8.1 % (data not reported): all data reported in the table are corrected for humidity and are referred to the dried flour weight (d.w.).
The highest concentration of total polyphenols (GAE) was observed for Pinot noir as UGP (Pinot noir 1), then, in decreasing order of concentration, Muscat blanc, similar to Pinot noir 2 (FGP), Cortese and Arneis. The other FGP samples with lower GAE concentrations ranked, in decreasing order of polyphenolic content, as follows: Nebbiolo 1 (short maceration), Grignolino, Barbera and Nebbiolo 2 (long maceration). A similar trend was observed for total flavonoids and CTex.
The condensed tannin content in the NEPP fraction (CTnex), despite the presence of significant differences (Table 5), varied little between the different samples and was independent from the polyphenols content of the extractable fraction (GAE, total flavonoids and CTex).
Considering total CT (CTex + CTnex), their content varied between 34.2 and 88.4 mg/g d.w.: the technological and varietal differences are noticeable, since high values were observed for all UGPs and, among FGPs, Pinot noir and Grignolino prevailed.
Finally, red grapes seeds had a low content of total anthocyanins (Table 5), adsorbed on the surface of the seeds during the fermentative maceration. The concentration in total anthocyanins was low, with significant differences between the samples. The highest values were observed for Pinot noir 1 (UGP) and Nebbiolo 2 (FGP with long maceration): the total anthocyanin content therefore does not seem to depend on the duration of the contact between seeds and skins, probably because the adsorption phenomena of the coloring substance are very rapid, or they may also depend on the characteristics of the outermost cortical part of the seeds.
3.5. Seeds: Dietary Fiber Composition
The seeds were all very rich in dietary fiber, with concentrations ranging from 62.3 % of Pinot noir 1 to 77.1 % of Arneis (Table 5). It is interesting to notice that in the case of the two cultivars of which two different samples have been characterized (Pinot noir and Nebbiolo), the measured DF contents were very close, independently of the winemaking technique (70-71% for Nebbiolo and 62-64% for Pinot noir). In decreasing order of DF content, the samples ranked as follows: Arneis with the highest value (77 %), followed by Barbera, Nebbiolo and Muscat blanc with values ranging between 70 and 72 %, then Grignolino and Cortese (values below 70 %), and finally Pinot noir with the lowest DF content.
The percentage content of the nitrogen residue (expressed as proteins %) in TDF varied from 9.1 to 13.7 % (Table 5): Cortese seeds (highest content) were significantly different from those of Barbera and Nebbiolo (1 and 2) (lowest values). In this regard, procedures for the extraction of proteins from grape seeds are currently under study (Alvarez-Ossorio et al., 2022), and some works (Vincenzi et al., 2013) have verified interesting results with their use as protein clarifiers in wines.
3.6. Seeds: Relationship Between the Analyzed Chemical Variables and Between the Studied Cultivars
The correlation between variables and the multivariate analysis were also performed for the seeds samples. Table 6 shows the correlation matrix between the chemical parameters that describe the polyphenolic content of seeds flours: high correlation coefficients between GAE, total flavonoids and CTex were observed, as already reported for the skins.
Besides the expected correlations between the 3 main polyphenolic indexes (GAE, flavonoids and CTex) reported in Table 6, it is interesting to notice the correlation between these indexes and the nitrogen residue. Also in this case, it can be assumed that a higher polyphenols content may inhibit the action of proteases during the hydrolysis process in the fiber extraction method, or that part of this fraction remains bound to polyphenols.
The results of the multivariate analysis with PCA, calculated with the parameters relating to the polyphenolic and TDF content of the seeds samples, are reported in Figure 2.
The first Principal Component is positively associated with the extractable polyphenolic components of the seeds (GAE, total flavonoids, CTex, and CT TOT). The seeds samples from unfermented GP (UGP) are positioned on the positive side of the first Principal Component. The lower polyphenolic content of FGP samples is probably due to losses that occur during the fermentative maceration of the grapes. Pinot noir is an exception: its high natural polyphenolic content in the seeds (Casazza et al., 2011; Guaita et al., 2023) has influenced the high polyphenolic concentration of FGP samples, which are close to UGP samples.
The second Principal Component, positively associated with the TDF and CTnex parameters, does not allow for discriminating seeds samples either by the winemaking technique or by the cultivar of origin. It should be noted, however, that the variability described by the second Principal Component is only 14.56% of the total variability (about 5 times lower than that of the first PCA). The data were then subjected to Cluster Analysis (Ward's method, data not shown) which, as for the skins samples, classified the seeds samples into two groups: one consisting of the UGP samples and Pinot Noir as FGP (Pinot noir 2), and the other consisting of the remaining FGP samples. Excluding Arneis, the same distribution is observed along the first Principal Component.
3.7. Comparison Between Skins and Seeds Composition
Significant differences in polyphenolic content were observed between skins and seeds: for all samples, the skins had much lower GAE values than the corresponding seeds, from -70 % for Muscat blanc to -25 % for Nebbiolo 2. The GAE index was highly and positively correlated with the condensed tannins content, which was higher in the seeds, especially in those deriving from UGP, with significant differences between cultivars.
The NEPP fraction (CTnex) was higher in the skins, from 2.6 (Arneis) to 4.4 times (Nebbiolo 1), than in the respective seeds. This difference may be explained by the different lignin content of skins and seeds (higher in seeds, lower in skins) as reported by Bender et al. (2020). As lignin is synthetized by the same route of flavonoids, lower lignin contents may correspond to higher NEPP concentrations. Despite the presence of significant differences, the NEPP content was more homogeneous among the seeds from different cultivars (3.4 - 4.9 mg/g d.w.) compared to the skins (11.6 - 18.4 mg/g d.w).
These dietary polyphenols linked to the dietary fiber matrix can be considered as prebiotics, since they represent a fermentable substrate for gut bacterial microflora in addition to indigestible carbohydrates and proteins (Goni et al., 2009).
According to documentary bibliographic values, grape pomace ranks very high among other vegetable/fruit matrices for the dietary fiber content (Goni et al. 2009; O'Shea et al., 2012; Pop et al., 2021; Bhatt & Gupta, 2023; Plakantonaki et al., 2023). The TDF content was significantly higher in seeds than in skins, and no correlation (r = 0.38) between skins and seeds TDF was observed, thus highlighting the metabolic independence between the two districts of the fruit. Limited to skins, it is interesting to notice how the management of the winemaking process has influenced the quantity and characteristics of the skins fiber: the TDF and IDF content was higher in UGP skins, while the opposite was observed for the SDF fraction.
These results are original: to our knowledge, the determination of skins and seeds DF has never been carried out before on GP from Piedmont grapes. Considering data as a whole, our results (TDF%: 52,1-77,1; IDF%: 41,3-63,6; SDF%: 3,14-16,5) are in line with the findings of Llobera & Canellas (2007, 2008), Gonzalez-Centeno et al. (2010), Gul et al. (2013), Beres et al. (2019), Bender et al. (2020), obtained for whole grape pomace (skins + seeds), while Deng et al (2011) obtained much lower values and greater difference between white (lower values) and red (higher values) grape varieties.
4. Conclusions
A partial characterization of different kinds of grape pomace sampled after white and red winemaking was carried out, focusing on two macroclasses of compounds interesting for the functionality of this byproduct: the polyphenolic fraction and the dietary fiber fraction.
The content of both classes of molecules was significantly higher in seeds than in skins. However, when considering the nutritional value of GP flours as a possible food ingredient (e.g. as dietary supplement), it is interesting to notice that the polyphenolic fraction linked to the fiber, considered as prebiotic, was much higher in skins than in the respective seeds. Moreover, the fiber obtained from skins may be more interesting from a dietary point of view also for the presence of SDF, almost absent in grape seeds.
These results are of practical interest, when the use of flour is aimed at enriching food in polyphenolic compounds and dietary fiber. Therefore, depending on the origin of GP, its use could be directed to different areas.
Finally, it is interesting to notice that there is a part of protein/nitrogen residue linked to the fiber that could be of further interest, more for technological aspects (e.g. as fining agent for astringency reduction in wines) than for a dietary significance.
Author Contributions
Massimo Guaita: Methodology, Investigation, Formal analysis, Writing – original draft, Writing – review & editing. Alice Zocco: Formal analysis. Stefano Messina: Formal analysis. Silvia Motta: Formal analysis. Jean Daniel Coisson: Supervision. Antonella Bosso: Supervision, Writing – review & editing.
Funding
This work was funded by the PHENOCYCLES project, funded by the European Union under the Marie Skłodowska-Curie Actions (MSCA) Staff Exchanges. Grant agreement ID: 101131420. DOI: 10.3030/101131420.
Data Availability Statement
All data used for this research are reported in the article in the form of figures and tables.
Competing of Interest
The authors declare that they have no known competing financial interests or personal relationships that could have appeared to influence the work reported in this paper.
References
- AACC report The definition of dietary fiber. American Association of Cereal Chemists 2001, 46, 112–126.
- Alía, M.; Horcajo, C.; Bravo, L.; Goya, L. Effect of grape antioxidant dietary fiber on the total antioxidant capacity and the activity of liver antioxidant enzymes in rats. Nutrition Research 2003, 23, 1251–1267. [Google Scholar] [CrossRef]
- Alvarez-Ossorio, C.; Orive, M.; Sanmartín, E.; Alvarez-Sabatel, S.; Labidi, J.; Zufia, J.; Bald, C. Composition and Techno-functional Properties of Grape Seed Flour Protein Extracts. ACS Food Science and Technology 2022, 2, 125−135. [Google Scholar] [CrossRef]
- Bender, A.B.B.; Speroni, C.S.; Moro, K.I.; Morisso, F.D.P.; dos Santos, D.R.; da Silva, L.P.; Penna, N.G. Effects of micronization on dietary fiber composition, physicochemical properties, phenolic compounds, and antioxidant capacity of grape pomace and its dietary fiber concentrate. LWT – Food Science and Technology 2020, 117, 108652. [Google Scholar] [CrossRef]
- Beres, C.; Pereira Freitas, S.; de Oliveira Godoy, R.L.; Rodrigues de Oliveira, D.C.; Deliza, R.; Iacominid, M.; Mellinger-Silva, C.; Correa Cabral, L.M. Antioxidant dietary fibre from grape pomace flour or extract: Does it make any difference on the nutritional and functional value? Journal of Functional Foods 2019, 56, 276–285. [Google Scholar] [CrossRef]
- Bhatt, S.; Gupta, M. Dietary fiber from fruit waste as a potential source of metabolites in maintenance of gut milieu during ulcerative colitis: A comprehensive review. Food Research International 2023, 164, 112329. [Google Scholar] [CrossRef]
- Bravo, L.; Saura-Calixto, F. Characterization of Dietary Fiber and the In Vitro Indigestible Fraction of Grape Pomace. American Journal of Enology and Viticulture 1998, 49, 135–141. [Google Scholar] [CrossRef]
- Casazza, A.A.; Aliakbarian, B.; Perego, P. Recovery of phenolic compounds from grape seeds: effect of extraction time and solid-liquid ratio. Natural Product Research 2011, 25, 1751–1761. [Google Scholar] [CrossRef]
- Chorti, E.; Guidoni, S.; Ferrandino, A.; Novello, V. Effect of different cluster sunlight exposure levels on ripening and anthocyanin accumulation in Nebbiolo grapes. American Journal of Enology and Viticulture 2010, 61, 9. [Google Scholar] [CrossRef]
- Deng, Q.; Penner, M.H.; Zhao, Y. Chemical composition of dietary fiber and polyphenols of five different varieties of wine grape pomace skins. Food Research International 2011, 44, 2712–2720. [Google Scholar] [CrossRef]
- Dwyer, K.; Hosseinian, F.; Rod, M.R. The market potential of grape waste alternatives. Journal of Food Research 2014, 3, 91. [Google Scholar] [CrossRef]
- Goñi, I.; Díaz-Rubio, M.E.; Pérez-Jiménez, J.; Saura-Calixto, F. Towards an updated methodology for measurement of dietary fiber, including associated polyphenols, in food and beverages. Food Research International 2009, 42, 840–846. [Google Scholar] [CrossRef]
- Gonzalez-Centeno, M.R.; Rossello, C.; Simal, S.; Garau, M.C.; Lopez, F.; Femenia, A. Physico-chemical properties of cell wall materials obtained from ten grape varieties and their byproducts, grape pomaces and stems. LWT – Food Science and Technology 2010, 43, 1580–1586. [Google Scholar] [CrossRef]
- Guaita, M.; Panero, L.; Motta, S.; Mangione, B.; Bosso, A. Effects of high-temperature drying on the polyphenolic composition of skins and seeds from red grape pomace. LWT - Food Science and Technology 2021, 145, 111323. [Google Scholar] [CrossRef]
- Guaita, M.; Motta, S.; Messina, S.; Casini, F.; Bosso, A. Polyphenolic Profile and Antioxidant Activity of Green Extracts from Grape Pomace Skins and Seeds of Italian Cultivars. Foods 2023, 12, 3880. [Google Scholar] [CrossRef]
- Gul, H.; Acun, S.; Sen, H.; Nayir, N.; Turk, S. Antioxidant activity, total phenolics and some chemical properties of Okuzgozu and Narince grape pomace and grape seed flour. Journal of Food, Agriculture and Environment 2013, 11, 28–34. [Google Scholar]
- Ishiwata, K.; Yamaguchi, T.; Takamura, H.; Matoba, T. DPPH Radical-Scavenging Activity and Polyphenol Content in Dried Fruits. Food Science and Technology Research 2004, 10, 152–156. [Google Scholar] [CrossRef]
- Llobera, A.; Canellas, J. Dietary fibre content and antioxidant activity of Manto Negro red grape (Vitis vinifera): pomace and stem. Food Chemistry 2007, 101, 659–666. [Google Scholar] [CrossRef]
- Llobera, A.; Canellas, J. Antioxidant activity and dietary fibre of Prensal Blanc white grape (Vitis vinifera) by-products. International Journal of food science and technology 2008, 43(11), 1953–1959. [Google Scholar] [CrossRef]
- Makris, D.P.; Boskou, G.; Andrikopoulos, N.K. Polyphenolic content and in vitro antioxidant characteristics of wine industry and other agri-food solid waste extracts. Journal of Food Composition and Analysis 2007, 20, 125–132. [Google Scholar] [CrossRef]
- Martín-Carrón, N.; Goñi, I.; Larrauri, J.A.; García-Alonso, A.; Saura-Calixto, F. Reduction in serum total and LDL cholesterol concentrations by a dietary fiber and polyphenol-rich grape product in hypercholesterolemic rats. Nutrition Research 1999, 19, 1371–1381. [Google Scholar] [CrossRef]
- Martínez, R.; Torres, P.; Meneses, M. A.; Figueroa, J. G.; Pérez-Álvarez, J. A.; Viuda-Matos, M. Chemical, technological and in vitro antioxidant properties of mango, guava, pineapple and passion fruit dietary fibre concentrate. Food Chemistry 2012, 135, 1520–1526. [Google Scholar] [CrossRef] [PubMed]
- Martinez, G.A.; Rebecchi, S.; Decorti, D.; Domingos, J.M.B.; Natolino, A.; Del Rio, D.; Bertin, L.; Da Porto, C.; Fava, F. Towards multi-purpose biorefinery platforms for the valorisation of red grape pomace: production of polyphenols, volatile fatty acids, polyhydroxyalkanoates and biogas. Green Chemistry 2016, 18, 261–270. [Google Scholar] [CrossRef]
- O'Shea, N.; Arendt, E.K.; Gallagher, E. Dietary fibre and phytochemical characteristics of fruit and vegetable by-products and their recent applications as novel ingredients in food products. Innovative Food Science & Emerging Technologies 2012, 16, 1–10. [Google Scholar] [CrossRef]
- Pérez-Jiménez, J.; Díaz-Rubio, M.E.; Saura-Calixto, F. Non-extractable polyphenols, a major dietary antioxidant: occurrence, metabolic fate and health effects. Nutrition Research Reviews 2013, 26, 118–129. [Google Scholar] [CrossRef]
- Plakantonaki, S.; Roussis, I.; Bilalis, D.; Priniotakis, G. Dietary Fiber from Plant-Based Food Wastes: A Comprehensive Approach to Cereal, Fruit, and Vegetable Waste Valorization. Processes 2023, 11, 1580. [Google Scholar] [CrossRef]
- Pop, C.; Suharoschi, R.; Pop, O.L. Dietary Fiber and Prebiotic Compounds in Fruits and Vegetables Food Waste. Sustainability 2021, 13, 7219. [Google Scholar] [CrossRef]
- Rózek, A.; García-Pérez, J.V.; López, F.; Güell, C.; Ferrando, M. Infusion of grape phenolics into fruits and vegetables by osmotic treatment: Phenolic stability during air drying. Journal of Food Engineering 2010, 99(2), 142–150. [Google Scholar] [CrossRef]
- Saura-Calixto, F. Antioxidant Dietary Fiber Product: A New Concept and a Potential Food Ingredient. Journal of Agricultural and Food Chemistry 1998, 46, 4303–4306. [Google Scholar] [CrossRef]
- Sheng, K.; Qu, H.; Liu, C.; Yan, L.; You, J.; Shui, S.; Zheng, L. A comparative assess of high hydrostatic pressure and superfine grinding on physicochemical and antioxidant properties of grape pomace. International Journal of Food Science and Technology 2017, 52, 2106–2114. [Google Scholar] [CrossRef]
- Shinagawa, F.B.; Carvalho de Santana, F.; Torres, L.; Filho, J. Grape seed oil: A potential functional food? Food Science and Technology (Campinas) 2015, 35(ahead). [Google Scholar] [CrossRef]
- Vatai, T.; Škerget, M.; Knez, Ž. Extraction of phenolic compounds from elder berry and different grape marc varieties using organic solvents and/or supercritical carbon dioxide. Journal of Food Engineering 2009, 90(2), 246–254. [Google Scholar] [CrossRef]
- Vincenzi, S.; Dinnella, C.; Recchia, A.; Monteleone, E.; Gazzola, D.; Pasini, G.; Curioni, A. Grape seed proteins: A new fining agent for astringency reduction in red wine. Australian Journal of Grape and Wine Research 2013, 19, 153–160. [Google Scholar] [CrossRef]
- Zhang, L.; Zhu, M.T.; Shi, T.; Guo, C.; Huang, Y.S.; Chen, Y.; Xiea, M.Y. Recovery of dietary fiber and polyphenol from grape juice pomace and evaluation of their functional properties and polyphenol compositions. Food & Function 2017, 8, 341. [Google Scholar]
Figure 1.
Graphical representation of the loadings (original variables: dietary fiber and polyphenolic parameters) and scores (skins samples, in bold) in the space described by the first two Principal Components (BiPlot) (Principal Component Analysis).
Figure 1.
Graphical representation of the loadings (original variables: dietary fiber and polyphenolic parameters) and scores (skins samples, in bold) in the space described by the first two Principal Components (BiPlot) (Principal Component Analysis).
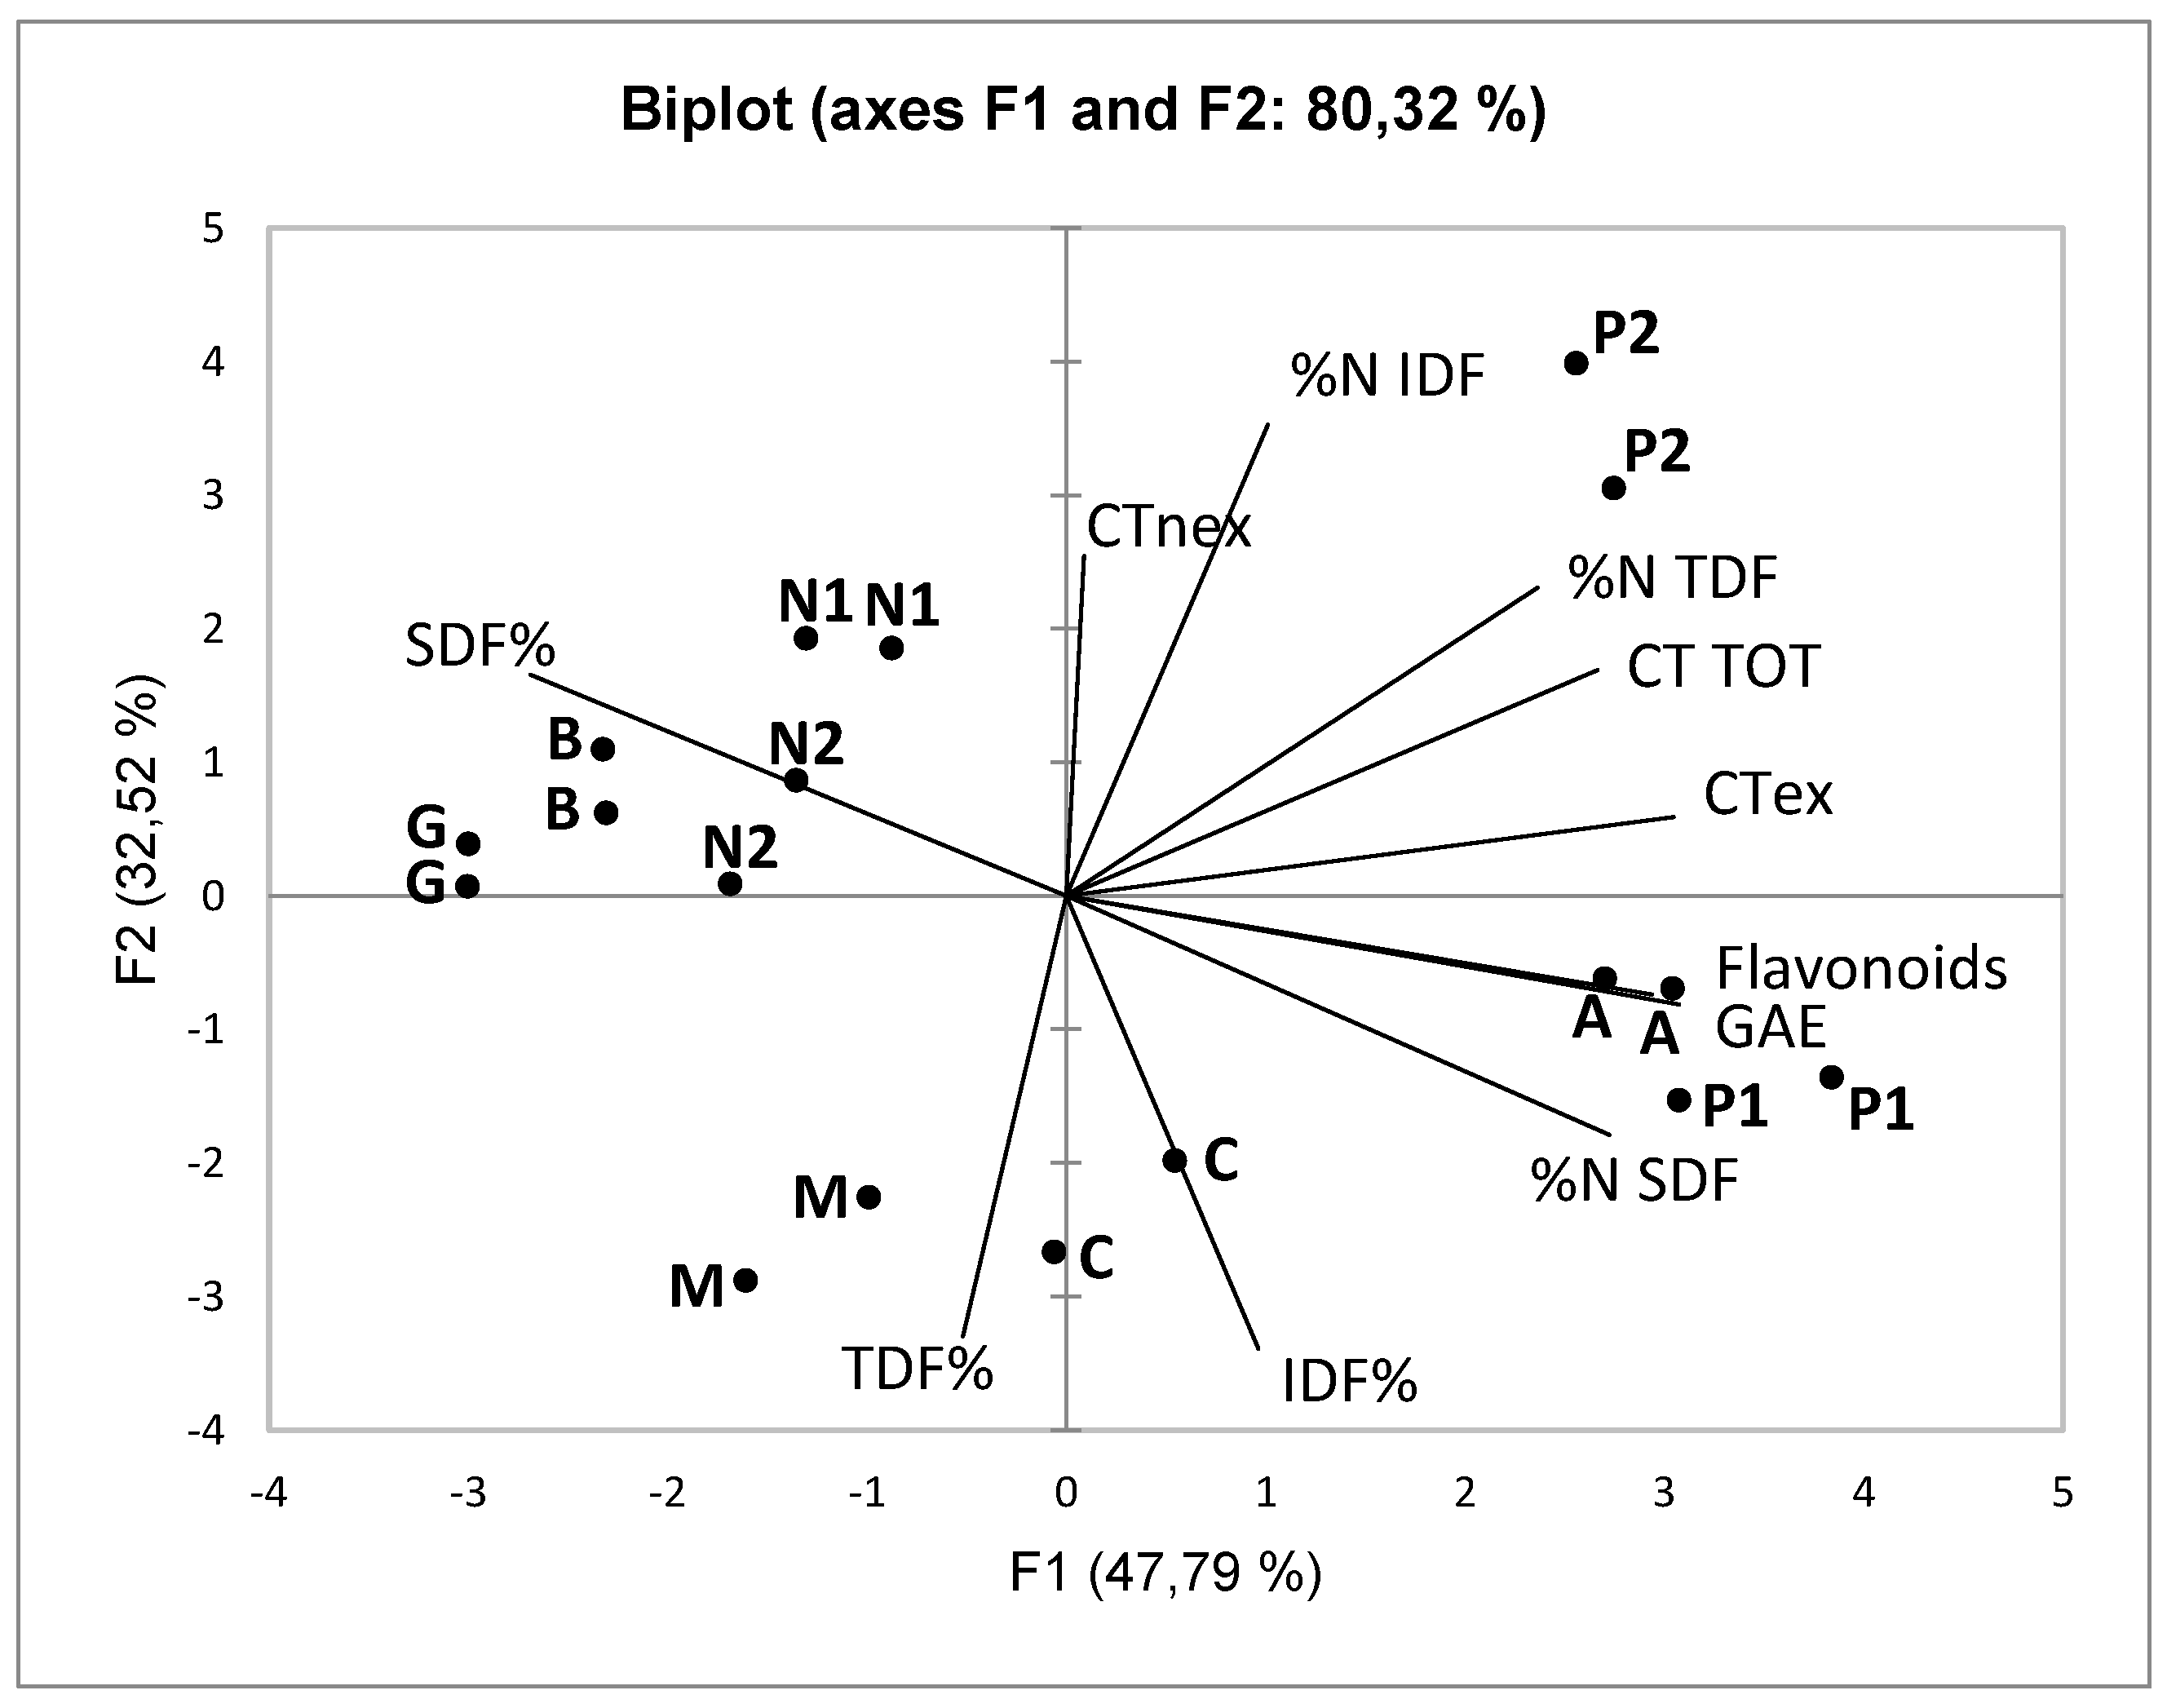
Figure 2.
Graphical representation of the loadings (original variables: dietary fiber and polyphenolic parameters) and scores (seeds samples, in bold) in the space described by the first two Principal Components (BiPlot) (Principal Component Analysis).
Figure 2.
Graphical representation of the loadings (original variables: dietary fiber and polyphenolic parameters) and scores (seeds samples, in bold) in the space described by the first two Principal Components (BiPlot) (Principal Component Analysis).
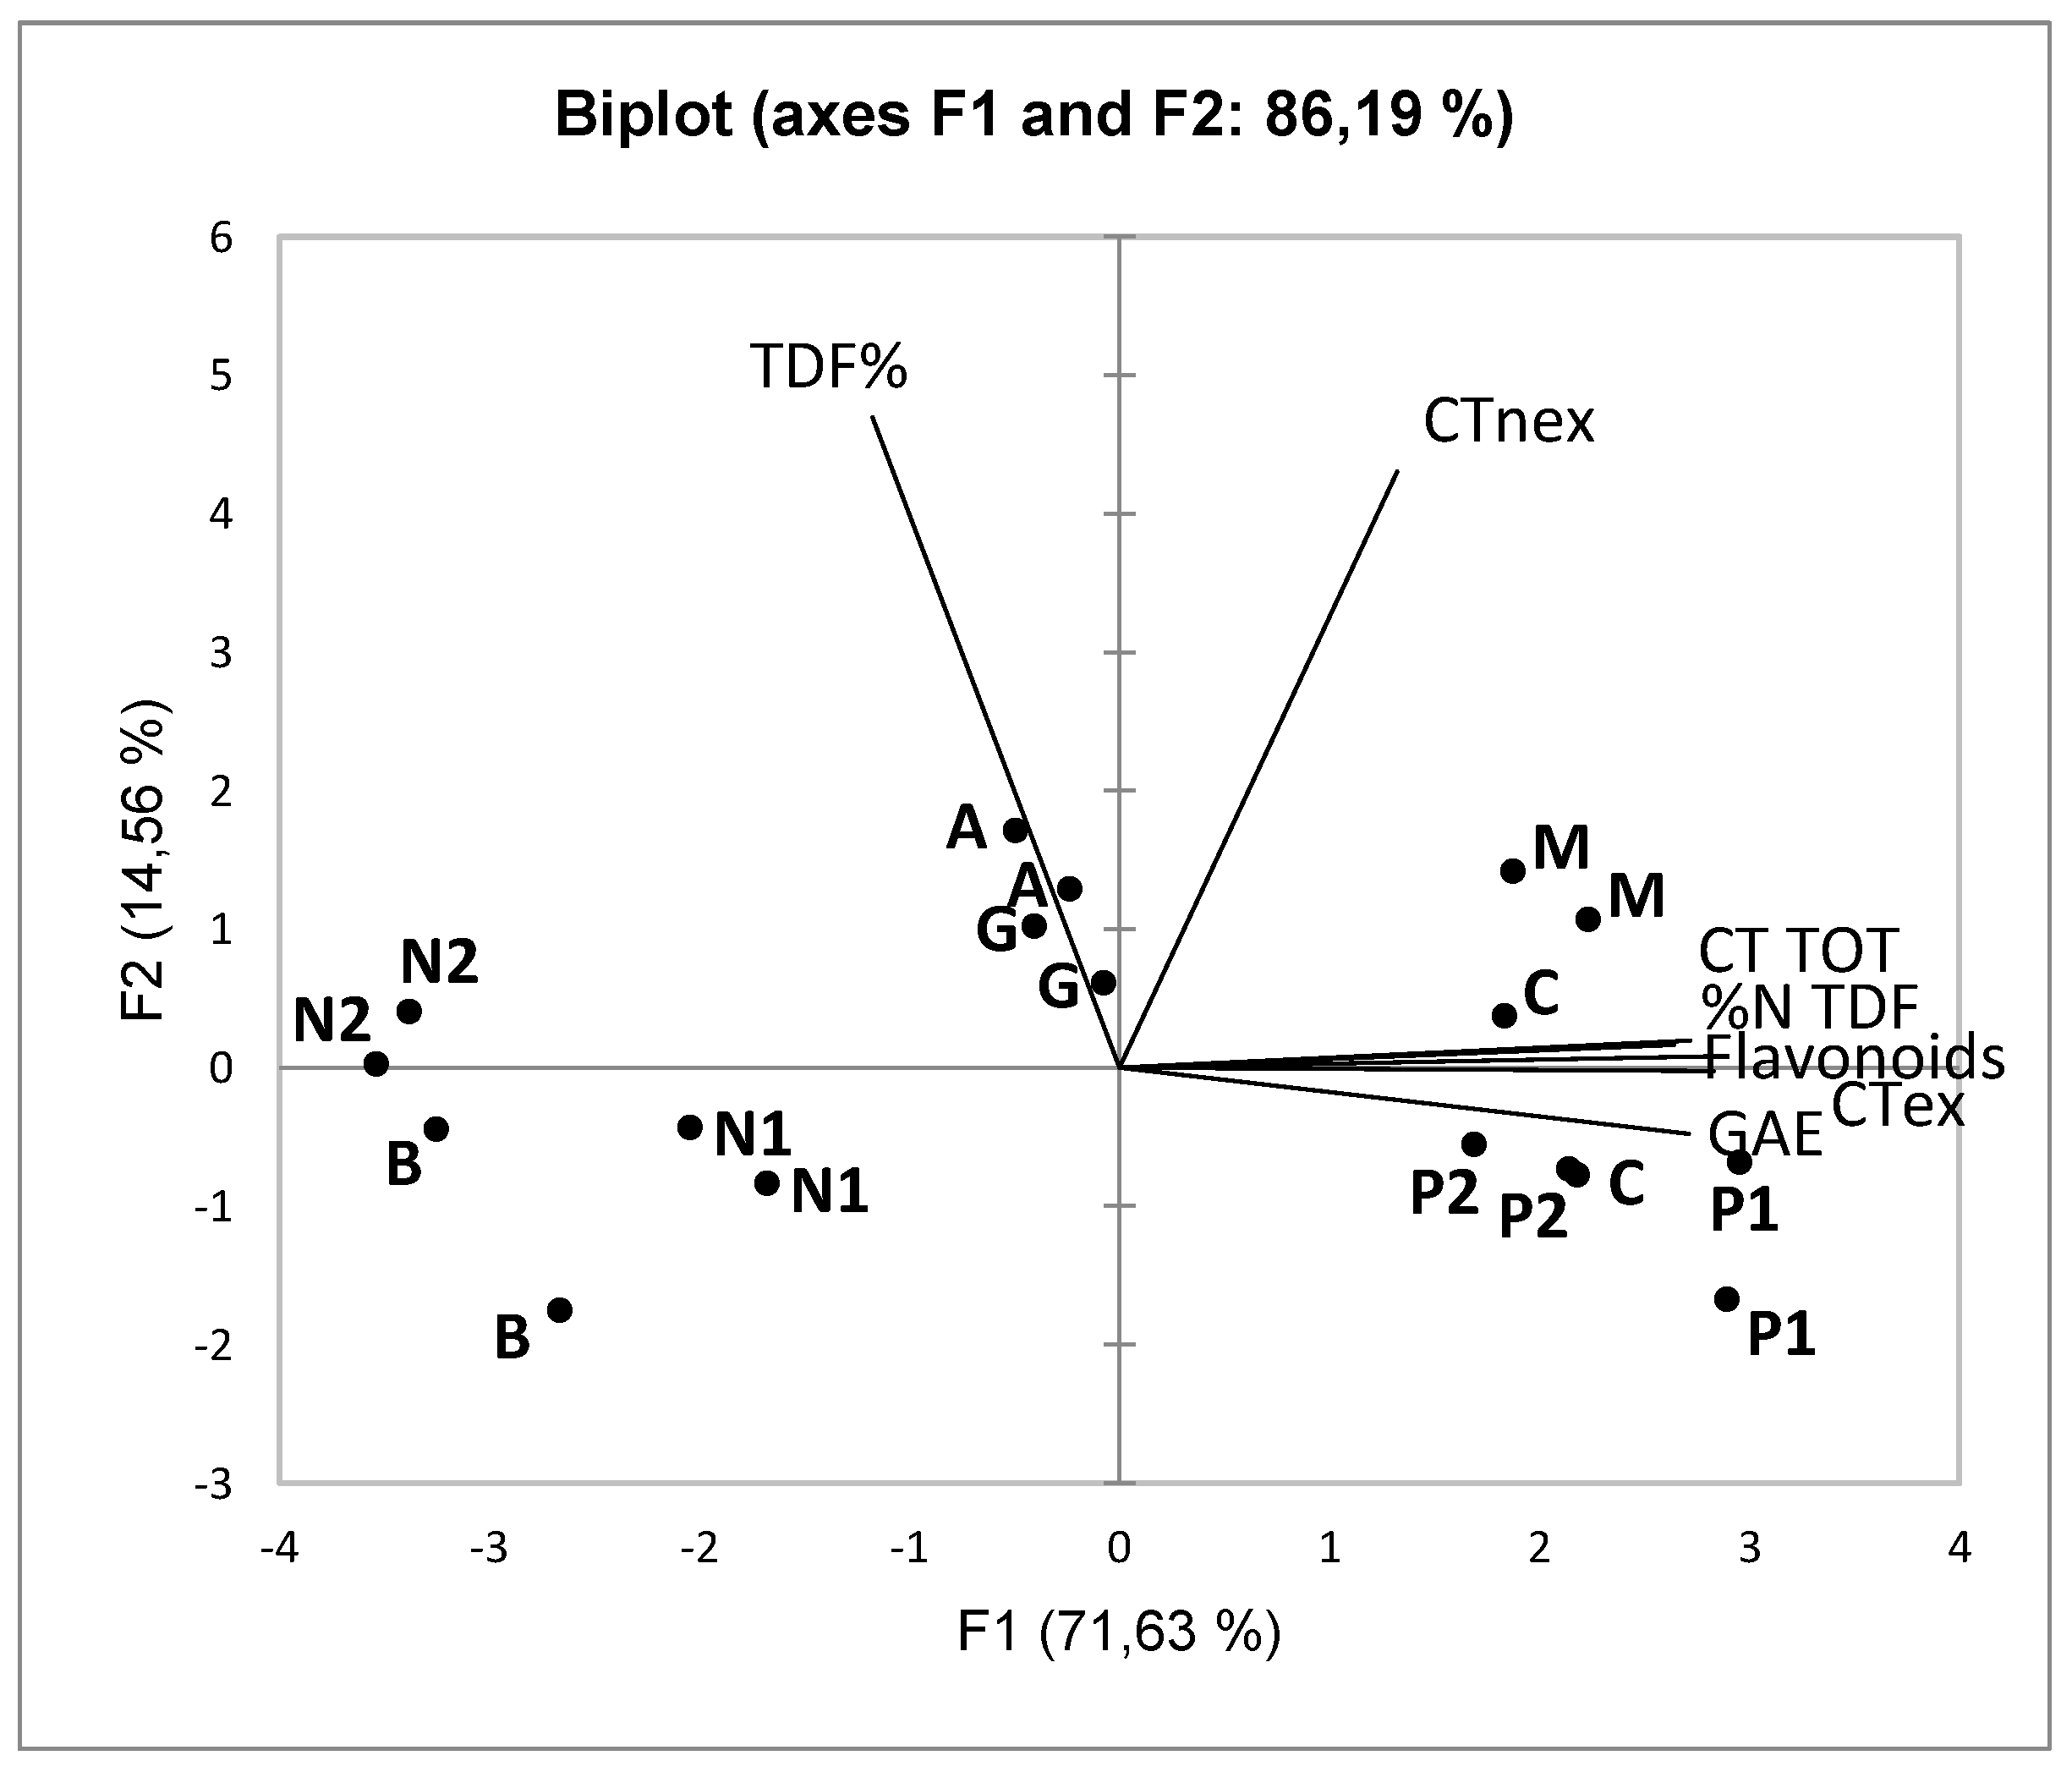

Table 1.
Characteristics of the samples.
| Cultivar | type of GP | Characteristics | |
|---|---|---|---|
| white cultivars | Muscat blanc | UGP | unfermented |
| Arneis | UGP | ||
| Cortese | UGP | ||
| red cultivars | Barbera | FGP | fermented (10 days) |
| Grignolino | FGP | fermented (10 days) | |
| Pinot noir 1 | UGP | unfermented | |
| Pinot noir 2 | FGP | fermented (10 days) | |
| Nebbiolo 1 | FGP | fermented, short maceration (5 days) | |
| Nebbiolo 2 | FGP | fermented, long maceration (15 days) |
Table 2.
Polyphenolic profile of the skins flours. The data are expressed in mg/g dry weight (d.w.) of skins flour.
Table 2.
Polyphenolic profile of the skins flours. The data are expressed in mg/g dry weight (d.w.) of skins flour.
| Skins | GAE | total flavonoids | CT ex | CT nex | CT TOT | total anthocyanins |
|---|---|---|---|---|---|---|
| Muscat blanc | 23.8 b* | 22.6 d | 25.8 c | 13.7 d | 39.5 d | |
| Arneis | 35.5 a | 30.3 b | 34.4 a | 11.6 g | 46.0 b | |
| Cortese | 24.9 b | 26.4 c | 28.9 b | 13.8 d | 42.6 c | |
| Barbera | 22.0 b | 21.1 de | 24.9 c | 11.9 fg | 36.8 e | 3.1 b |
| Grignolino | 21.5 b | 20.0 de | 25.8 c | 14.5 c | 40.3 cd | 0.25 c |
| Pinot noir 1 | 34.6 a | 34.5 a | 35.5 a | 12.1 f | 47.6 b | 6.2 a |
| Pinot noir 2 | 28.2 ab | 29.0 bc | 33.2 a | 18.4 a | 51.6 a | 2.0 b |
| Nebbiolo 1 | 22.0 b | 18.8 e | 30.2 b | 15.6 b | 45.8 b | 0.65 c |
| Nebbiolo 2 | 21.7 b | 22.2 d | 29.4 b | 13.2 e | 42.5 c | 0.64 c |
| F | 13.1 | 96.3 | 54.0 | 1137 | 90.0 | 114 |
| Pr > F | 0.000 | < 0.0001 | < 0.0001 | < 0.0001 | 0.000 | < 0.0001 |
*Different letters along the column discriminate the samples significantly different from one another (p < 0.05, Tukey’s test).
Table 3.
Percentage values (as d.w.) of total, insoluble and soluble fiber, and percentages of the residue of the nitrogenous component (expressed as proteins %) after enzymatic action in the respective fiber fractions.
Table 3.
Percentage values (as d.w.) of total, insoluble and soluble fiber, and percentages of the residue of the nitrogenous component (expressed as proteins %) after enzymatic action in the respective fiber fractions.
| Total fiber (TDF) | Insoluble fiber (IDF) | Soluble fiber (SDF) | ||||
|---|---|---|---|---|---|---|
| Skins | % TDF | % protein | % IDF | % protein | % SDF | % protein |
| Muscat blanc | 69.7 a* | 15.7 cd | 63.6 a | 16.0 c | 6.1 cd | 12.9 bc |
| Arneis | 63.0 bc | 19.7 b | 57.4 ab | 19.9 b | 5.6 cd | 17.8 b |
| Cortese | 67.8 ab | 16.4 cd | 62.3 a | 16.3 c | 5.5 d | 18.3 ab |
| Barbera | 52.8 d | 17.0 c | 41.3 d | 19.1 b | 11.6 b | 9.6 c |
| Grignolino | 63.6 b | 15.3 d | 47.1 cd | 17.9 bc | 16.5 a | 7.8 c |
| Pinot noir 1 | 56.8 d | 17.2 c | 53.6 bc | 16.9 c | 3.1 e | 24.4 a |
| Pinot noir 2 | 52.0 d | 21.5 a | 45.4 d | 22.6 a | 6.6 c | 13.6 bc |
| Nebbiolo 1 | 55.0 d | 17.3 c | 43.1 d | 19.2 b | 11.9 b | 10.5 c |
| Nebbiolo 2 | 57.3 cd | 16.1 cd | 45.9 d | 17.9 bc | 11.4 b | 9.0 c |
| F | 35.99 | 40.02 | 50.9 | 29.5 | 505 | 21.3 |
| Pr > F | 0.000 | 0.000 | < 0.0001 | < 0.0001 | < 0.0001 | < 0.0001 |
*Different letters along the column discriminate the samples significantly different from one another (p < 0.05, Tukey’s test).
Table 4.
Pearson's correlation matrix between the parameters relating to dietary fiber and polyphenols in the skins.
Table 4.
Pearson's correlation matrix between the parameters relating to dietary fiber and polyphenols in the skins.
| Variables | TDF % | IDF% | SDF% | SDF/IDF ratio | %N IDF | %N SDF | GAE | Total flavonoids | CTex | CTnex | CT TOT |
|---|---|---|---|---|---|---|---|---|---|---|---|
| TDF% | 1 | 0.867 | -0.186 | -0.345 | -0.693 | 0.144 | -0.011 | -0.040 | -0.293 | -0.256 | -0.371 |
| IDF% | 0.867 | 1 | -0.650 | -0.766 | -0.593 | 0.547 | 0.357 | 0.386 | 0.087 | -0.276 | -0.053 |
| SDF% | -0.186 | -0.650 | 1 | 0.984 | 0.113 | -0.858 | -0.719 | -0.822 | -0.618 | 0.154 | -0.461 |
| SDF/IDF ratio | -0.345 | -0.766 | 0.984 | 1 | 0.206 | -0.846 | -0.701 | -0.796 | -0.564 | 0.164 | -0.410 |
| % N IDF | -0.693 | -0.593 | 0.113 | 0.206 | 1 | -0.202 | 0.162 | 0.098 | 0.350 | 0.526 | 0.546 |
| % N SDF | 0.144 | 0.547 | -0.858 | -0.846 | -0.202 | 1 | 0.779 | 0.873 | 0.708 | -0.290 | 0.475 |
| GAE | -0.011 | 0.357 | -0.719 | -0.701 | 0.162 | 0.779 | 1 | 0.893 | 0.798 | -0.262 | 0.566 |
| Total flavonoids | -0.040 | 0.386 | -0.822 | -0.796 | 0.098 | 0.873 | 0.893 | 1 | 0.817 | -0.168 | 0.625 |
| CTex | -0.293 | 0.087 | -0.618 | -0.564 | 0.350 | 0.708 | 0.798 | 0.817 | 1 | 0.052 | 0.886 |
| CTnex | -0.256 | -0.276 | 0.154 | 0.164 | 0.526 | -0.290 | -0.262 | -0.168 | 0.052 | 1 | 0.510 |
| CT TOT | -0.371 | -0.053 | -0.461 | -0.410 | 0.546 | 0.475 | 0.566 | 0.625 | 0.886 | 0.510 | 1 |
Values in bold are different from 0 with a significance level alpha=0.05.
Table 5.
Polyphenolic profile and TDF content of seeds flours. The data are expressed as mg/g dry weight (d.w.) of seeds flour.
Table 5.
Polyphenolic profile and TDF content of seeds flours. The data are expressed as mg/g dry weight (d.w.) of seeds flour.
| Seeds | GAE | total flavonoids | CT ex | CT nex | CT TOT | total anthocyanins | % TDF | % protein |
|---|---|---|---|---|---|---|---|---|
| Muscat blanc | 80.5 b* | 159.2 a | 77.4 c | 4.8 a | 82.2 c | 72.7 ab | 12.5 ab | |
| Arneis | 59.3 c | 90.2 c | 58.4 d | 4.5 c | 63.0 d | 77.1 a | 12.1 ab | |
| Cortese | 71.9 b | 135.1 ab | 81.8 ab | 4.2 c | 86.0 ab | 69.5 ab | 13.7 a | |
| Barbera | 38.6 de | 55.6 de | 37.8 f | 3.4 d | 41.2 f | 0.23 b | 70.5 ab | 9.7 c |
| Grignolino | 44.0 d | 75.3 cd | 59.3 d | 4.9 a | 64.3 d | 0.27 b | 68.8 ab | 12.2 ab |
| Pinot noir 1 | 94.3 a | 154.7 a | 84.1 a | 4.3 c | 88.4 a | 0.64 a | 62.3 b | 13.2 ab |
| Pinot noir 2 | 77.3 b | 122.4 b | 80.6 bc | 4.4 bc | 84.9 bc | 0.44 ab | 64.8 ab | 12.8 ab |
| Nebbiolo 1 | 46.9 d | 70.5 cd | 46.3 e | 3.6 d | 49.9 e | 0.24 b | 71.9 ab | 11.1 bc |
| Nebbiolo 2 | 28.7 e | 35.1 e | 29.9 g | 4.3 bc | 34.2 g | 0.59 a | 70.4 ab | 9.1 c |
| F | 140 | 65.0 | 1232 | 190 | 1365.5 | 14.9 | 3.1 | 14.5 |
| Pr > F | < 0.0001 | < 0.0001 | < 0.0001 | < 0.0001 | 0.000 | 0.003 | 0.1 | 0.0 |
*Different letters along the column discriminate the samples significantly different from one another (p < 0.05, Tukey’s test).
Table 6.
Pearson's correlation between the parameters relating to dietary fiber and polyphenols in the seeds.
Table 6.
Pearson's correlation between the parameters relating to dietary fiber and polyphenols in the seeds.
| Variables | TDF% | %N TDF | GAE | Total flavonoids | CTex | CTnex | CT TOT |
|---|---|---|---|---|---|---|---|
| TDF% | 1 | -0.344 | -0.355 | -0.280 | -0.374 | 0.012 | -0.370 |
| % N TDF | -0.344 | 1 | 0.814 | 0.817 | 0.922 | 0.417 | 0.922 |
| GAE | -0.355 | 0.814 | 1 | 0.964 | 0.938 | 0.297 | 0.935 |
| Total flavonoids | -0.280 | 0.817 | 0.964 | 1 | 0.940 | 0.370 | 0.940 |
| CTex | -0.374 | 0.922 | 0.938 | 0.940 | 1 | 0.416 | 1.000 |
| CTnex | 0.012 | 0.417 | 0.297 | 0.370 | 0.416 | 1 | 0.436 |
| CT TOT | -0.370 | 0.922 | 0.935 | 0.940 | 1.000 | 0.436 | 1 |
Values in bold are different from 0 with a significance level alpha=0,05.
Disclaimer/Publisher’s Note: The statements, opinions and data contained in all publications are solely those of the individual author(s) and contributor(s) and not of MDPI and/or the editor(s). MDPI and/or the editor(s) disclaim responsibility for any injury to people or property resulting from any ideas, methods, instructions or products referred to in the content. |
© 2026 by the authors. Licensee MDPI, Basel, Switzerland. This article is an open access article distributed under the terms and conditions of the Creative Commons Attribution (CC BY) license (http://creativecommons.org/licenses/by/4.0/).
Copyright: This open access article is published under a Creative Commons CC BY 4.0 license, which permit the free download, distribution, and reuse, provided that the author and preprint are cited in any reuse.


