Submitted:
09 January 2026
Posted:
13 January 2026
You are already at the latest version
Abstract
The Glycaemic Index (GI) serves as a critical indicator of carbohydrate quality linked to postprandial glycaemic response. As “Low-GI” claims proliferate on front-of-pack la-bels, it remains unclear how consumers value this complex signal. This study quantifies willingness to pay (WTP) for Low-GI labeling and tests a “motivation–capability” mechanism, positing that health orientation motivates label use, while objective Low-GI knowledge facilitates targeted evaluation across nutritional contexts. A dis-crete choice experiment was conducted in China using plain yogurt (N = 910). Mixed logit models analyzed how the valuation of the Low-GI claim is moderated by carbo-hydrate context, health orientation, and objective knowledge. Results indicate a sig-nificant average premium for Low-GI labeling, with health orientation acting as a consistent motivational amplifier. Objective knowledge functions as a critical moder-ator interacting with carbohydrate context, driving label valuation only in specific low- or high-carbohydrate profiles while triggering skepticism in regular-carbohydrate ones. These findings suggest that the public-health effectiveness of emerging physiological claims depends jointly on consumer motivation and label-specific literacy. Conse-quently, policy interventions should combine label standardization with targeted ed-ucation, equipping consumers with the capability to decode the claim’s physiological meaning rather than relying on a generalized health halo.
Keywords:
Low-GI claim
; front-of-package labeling
; willingness to pay
; discrete choice experiment
1. Introduction
Low-glycaemic index (GI) diets are widely discussed as a practical approach to improving carbohydrate quality and moderating postprandial glycaemic response—an outcome closely linked to cardiometabolic risk [1,2,3]. This issue is particularly salient in China, which has the world’s largest number of adults living with diabetes [4]. Alongside growing scientific and policy attention, GI-related labeling and “Low-GI” claims have become increasingly visible in food markets, reflecting both consumer demand and firms’ incentives to differentiate products with health-oriented signals [5,6]. The yogurt category provides a timely setting to study this phenomenon: yogurt is often perceived as a “healthy” everyday food, it is physiologically compatible with Low-GI positioning [7], and yogurt products in China are increasingly marketed with multiple front-of-pack (FOP) cues in a rapidly developing market [8].
For the Low-GI attribute to effectively shape purchase decisions, it requires a communication format that facilitates rapid notice and processing. FOP cues can facilitate rapid interpretation and have been shown to affect attention and evaluations [9,10]. Yet Low-GI is a comparatively complex physiological claim that is not readily verified from the nutrition facts panel, potentially increasing misinterpretation [6,11]. This complexity may amplify the well-documented heterogeneity in FOP effects across label formats and consumer groups [10,12]. Accordingly, in the Low-GI context we expect consumers’ motivation to use health information (health orientation) and their capability to decode the claim (objective Low-GI knowledge) to play a more central role in shaping responses.
Consistent with evidence that consumers differ widely in how they attend to and use FOP cues, we examine health orientation as a key motivational source of heterogeneity in responses to Low-GI labeling [13,14]. In this context, health orientation—conceptualized as a stable motivational tendency to prioritize health outcomes in daily dietary choices—offers a parsimonious framework for explaining such variation. Consumers with higher health orientation are more likely to allocate visual attention to on-package nutrition information [14] and to incorporate these cues into purchase decisions [13]. Despite the established role of health orientation in shaping information processing, to our knowledge, no prior work has directly examined whether this motivational factor modulates consumer responses specifically to Low-GI labeling.
Motivation alone, however, may be insufficient when the claim entails physiological complexity. We therefore distinguish capability from motivation and focus on objective knowledge about the Low-GI claim (objective Low-GI knowledge) as a separate mechanism shaping label valuation [13]. Rather than treating knowledge merely as a background control, we posit that objective Low-GI knowledge functions as a “cognitive decoder,” affecting whether consumers can correctly map the physiological meaning of the claim onto the information available at purchase [15]. This mechanism is particularly pertinent for GI-related claims because the underlying concept is physiological and cannot be directly verified from the nutrient panel alone [1].
When nutrition cues co-occur, consumers may evaluate claims through a lens of cue congruence [16]. Accordingly, we expect that any context dependence in Low-GI valuation is tied to the product’s carbohydrate context—that is, whether the surrounding carbohydrate profile makes the claim’s functional meaning more (or less) diagnostic. Crucially, we argue that carbohydrate context primarily moderates the knowledge channel: consumers with objective Low-GI knowledge are more able to interpret when and why Low-GI should matter under different carbohydrate contexts, whereas health orientation should act as a broadly positive and context-stable motivational driver of responsiveness to health-related cues.
To address these gaps, this study employs a discrete choice experiment (DCE) in a yogurt choice setting in China to estimate willingness to pay (WTP) for Low-GI labeling and to identify systematic preference heterogeneity. DCEs provide a robust framework for decomposing choices into part-worth utilities and testing interaction-based mechanisms under controlled information presentation [17,18,19]. Our approach also aligns with recent consumer research that uses choice experiments to quantify label valuation and preference heterogeneity in food markets [20,21,22]. Drawing upon signaling and information-economics perspectives [23,24,25], we propose the following hypotheses:
Hypothesis 1 (H1).
Consumers derive positive marginal utility from the Low-GI label in our yogurt choice setting, resulting in a premium in WTP relative to products without the label.
Hypothesis 2 (H2).
Consumers with higher health orientation place a greater value on the Low-GI label in our yogurt choice setting, independent of their objective Low-GI knowledge. This reflects the motivational aspect of consumer choice, where health-oriented individuals are more prone to use health cues as heuristic signals of “better-for-you” quality.
Hypothesis 3 (H3).
The valuation of the Low-GI label in our yogurt choice setting is context-dependent; its utility is amplified when the product’s carbohydrate context aligns with the label to present a more coherent health scenario (e.g., low-carbohydrate contexts).
Hypothesis 4 (H4).
Objective Low-GI knowledge acts as a cognitive decoder that enables consumers to distinguish the functional mechanism of the label across contexts. Knowledgeable consumers will not value the label uniformly; instead, they will exhibit higher WTP in contexts where the label offers a clearer functional rationale—either as perceived two-cue reinforcement (low-carbohydrate contexts) or as a cue for a more gradual postprandial glycaemic response relative to higher-GI alternatives (high-carbohydrate contexts)—while discounting the label in ambiguous regular-carbohydrate contexts where the functional positioning is less diagnostic.
Empirically utilizing DCE estimates, this study contributes to the extant literature in three distinct ways. First, it extends evidence on WTP for relatively novel and conceptually abstract physiological claims (Low-GI) within a realistic choice setting. In contrast to prior nutrition-labeling research that has largely focused on consumer responses to simpler nutrient information and familiar health/credence cues [9,26,27], existing evidence on Low-GI valuation remains relatively limited and concentrated in specific product contexts and stated-preference applications [28,29]. Second, it clarifies the role of consumer motivation by quantifying how health orientation shapes functional-label valuation, demonstrating that health orientation acts as a consistent amplifier of WTP. Third, it incorporates objective Low-GI knowledge to probe the mechanisms underlying context-dependent valuation, showing that carbohydrate-context variation in the WTP premium is concentrated among knowledgeable consumers—consistent with a decoder-based interpretation of how consumers process complex physiological claims.
2. Related Research
2.1. Functional Foods and Complex Health Claims: The Case of Low-GI
Functional foods are typically positioned as products offering benefits beyond basic nutrition; however, consumer uptake often hinges on whether the claimed mechanism is understandable and credible at the point of purchase [30]. Compared with simpler nutrient-content claims, “Low-GI” represents a complex physiological claim: it refers to the postprandial glycaemic response elicited by available carbohydrates, and its definition and testing rely on standardized measurement protocols [31]. While the existence of international GI tables and methodological standards has supported scientific comparability, it also underscores that GI is not a single-ingredient attribute—its realized value depends heavily on the food matrix, processing, and serving context [6].
From a labeling perspective, the policy and scientific debate remain active. Reviews for regulators have questioned whether GI labeling might mislead consumers if interpreted as a blanket “healthier” cue, particularly when it distracts attention from the overall nutrient composition [32]. Empirically, consumer-side evidence suggests that GI concepts can be difficult to interpret without guidance, creating substantial heterogeneity in understanding and usage [11]. Concurrently, GI-related research continues to expand in applied nutrition and food systems, including work connecting GI metrics with broader carbohydrate quality indicators [33].
Crucially for the present context, evidence regarding the monetary valuation of Low-GI claims remains limited and is largely concentrated in carbohydrate-dense staple categories rather than dairy. For instance, discrete choice experiments (DCE) have quantified a positive WTP for Low-GI rice, suggesting that the claim can carry a market premium when attached to a staple food where glycaemic response is salient in consumers’ minds [29]. However, to our knowledge, comparable WTP estimates for Low-GI claims in yogurt (and more broadly in fermented dairy) remain scarce. In yogurt research, Low-GI is predominantly discussed as a physiological property rather than as a market signal whose value can be monetized [7]. Meanwhile, dairy labeling debates tend to focus on compliance and the consistency between on-pack claims and nutrition information, which are relevant to consumer trust but do not directly recover the magnitude of a Low-GI premium [34]. Against this backdrop, our study contributes to the literature by quantifying (i) whether a Low-GI front-of-pack claim commands a premium in the yogurt category, and (ii) how that premium is contingent upon the product’s nutritional context (carbohydrate level) and consumer heterogeneity.
2.2. Labels as Signals under Information Asymmetry
A core premise in food labeling research is that when consumers cannot fully verify quality or health outcomes prior to purchase, labels function as signals to mitigate information asymmetry. In economic terms, many health and functional attributes are typical “credence attributes,” the veracity of which remains difficult to verify even after consumption [35]. In such markets, a combination of regulatory disclosure and voluntary claims shapes “believable quality cues,” influencing both consumer choice and corporate product strategy [36]. Reviews of labeling economics further emphasize that the effectiveness of a signal depends on its verifiability, the cost of understanding, and its combination with other quality cues [37].
The distinct challenge of complex functional signals like Low-GI is that they do not correspond to familiar nutritional dimensions (e.g., “low fat” or “low sugar”) but require specific knowledge to map “GI” onto health outcomes. Consequently, the signaling strength of Low-GI is likely highly dependent on consumer cognitive processing and trust in the information source. This dependency explains why cross-national studies often observe significant disparities in the credibility, difficulty of understanding, and overall acceptance of nutrition and health claims [38]. In this context, our research contributes by empirically examining the valuation of Low-GI in the Chinese yogurt market, explicitly modeling how the signaling efficacy of this complex physiological cue is conditioned by the interplay between nutritional context and consumer cognitive capability.
2.3. Nutritional Context, Congruence, and Halo Effects
A prevalent argument in food consumption research is that the effect of a label is not constant but contingent upon its congruence with nutritional facts and its potential to trigger a “health halo.” Extensive experimental evidence indicates that health and nutrition claims can enhance consumers’ judgments of overall healthfulness—and even alter risk perception and trust—but may also be discounted or viewed with skepticism when information conflicts [39,40]. More granular evidence from package information combination studies suggests that when the nutrition facts panel aligns with the claim (congruence), consumers are more likely to form positive evaluations. Conversely, when claims are inconsistent with nutritional facts, consumers often fail to identify the discrepancy or rely on heuristic biases, processing only the claim while ignoring the facts [41,42,43].
At the attentional level, visual attention to nutrition information is also influenced by label presentation and familiarity; thus, in realistic purchase settings, the combination of “FOP signals + key nutrition facts” may be more determinant of choice than either information source alone [16,44,45]. These studies collectively suggest that identifying the true market value of a complex claim like Low-GI requires testing it within a specific nutritional context rather than estimating it in isolation. To capture these dynamics, we explicitly model the interaction between the Low-GI label and carbohydrate content (nutritional context). This approach allows us to translate the theoretical concepts of "congruence" and "halo effects" into an estimable utility structure (WTP), thereby testing whether consumers rationally adjust their valuation based on nutritional consistency.
2.4. Consumer Heterogeneity: Health Orientation and Nutrition Knowledge as a “Decoder”
Existing literature repeatedly emphasizes that consumers are not a homogeneous group; the transition from “seeing a label” to “perceiving value” is jointly shaped by motivation and capability. Health orientation (or health consciousness) is generally viewed as a stable motivational variable that increases attention to health-related cues and reinforces the probability of choosing products with health claims [46,47]. However, motivation alone does not guarantee “correct understanding”: nutrition knowledge and literacy critically affect whether consumers can effectively read and integrate on-pack nutrition information, thereby altering the marginal effect of the claim [27].
Classic frameworks in consumer expertise suggest that knowledge alters the weighting of extrinsic cues and the manner of information integration, enabling high-knowledge individuals to perform consistency checks and reduce reliance on single signals [48]. Our study extends this literature by operationalizing the “decoder” mechanism: we distinguish between health orientation and objective knowledge to test how these distinct factors moderate the marginal utility of the Low-GI label across congruent and incongruent nutritional contexts.
3. Materials and Methods
3.1. Survey Administration and Participants
The study was carried out online in late 2025 (November–December) via the Wenjuanxing platform. Participation was voluntary and anonymous. Before proceeding, respondents were informed that the survey was for academic research purposes and provided informed consent. Eligible participants were screened at the beginning of the questionnaire and were required to be 18 years or older and to be the primary or joint household food purchase decision-maker. Respondents who completed the survey received a small cash incentive.
To ensure data quality, an instructional attention-check item was embedded in the questionnaire. Responses that failed this attention check (which instructed respondents to select “Agree”) were excluded from the analysis. The final analytic sample consisted of 910 valid respondents, contributing 10,920 choice tasks (910 × 12). The average completion time was approximately 6.7 minutes, suggesting limited rapid satisficing.
3.2. Discrete Choice Experiment (DCE): Attributes and Design
The study employed a generic discrete choice experiment to elicit consumer preferences for original-flavored yogurt. Each choice task presented three product alternatives (A/B/C) and an opt-out option (“I would not buy any of these / I would buy other brands”), which avoids forced choices and better reflects real purchase settings. A short cheap-talk script was presented prior to the DCE to encourage respondents to make choices as if they were shopping in a real-world setting, considering their actual budget and habits.
Each yogurt alternative was described by five attributes. Specifically, these attributes included price, carbohydrate content, fat content, the Low-GI label, and the organic label. Although not central to our research question, fat content and the organic label were included as market-relevant controls to capture salient health/quality cues and reduce confounding when estimating preferences for the Low-GI label [49,50]. Except for price, all attributes were categorical and subsequently represented by dummy variables in the econometric models. To reduce information asymmetry and help respondents better anchor their choices, the levels for nutritional attributes (carbohydrate and fat content) were explicitly presented with auxiliary numerical values in addition to their categorical labels. Carbohydrate content, rather than sugar, was selected because Chinese nutrition facts panels commonly report carbohydrates as a standard item, whereas sugar information is not consistently displayed; moreover, in yogurt products carbohydrate levels are closely related to perceived sweetness and energy density, providing a familiar and comparable nutrition reference for consumers.
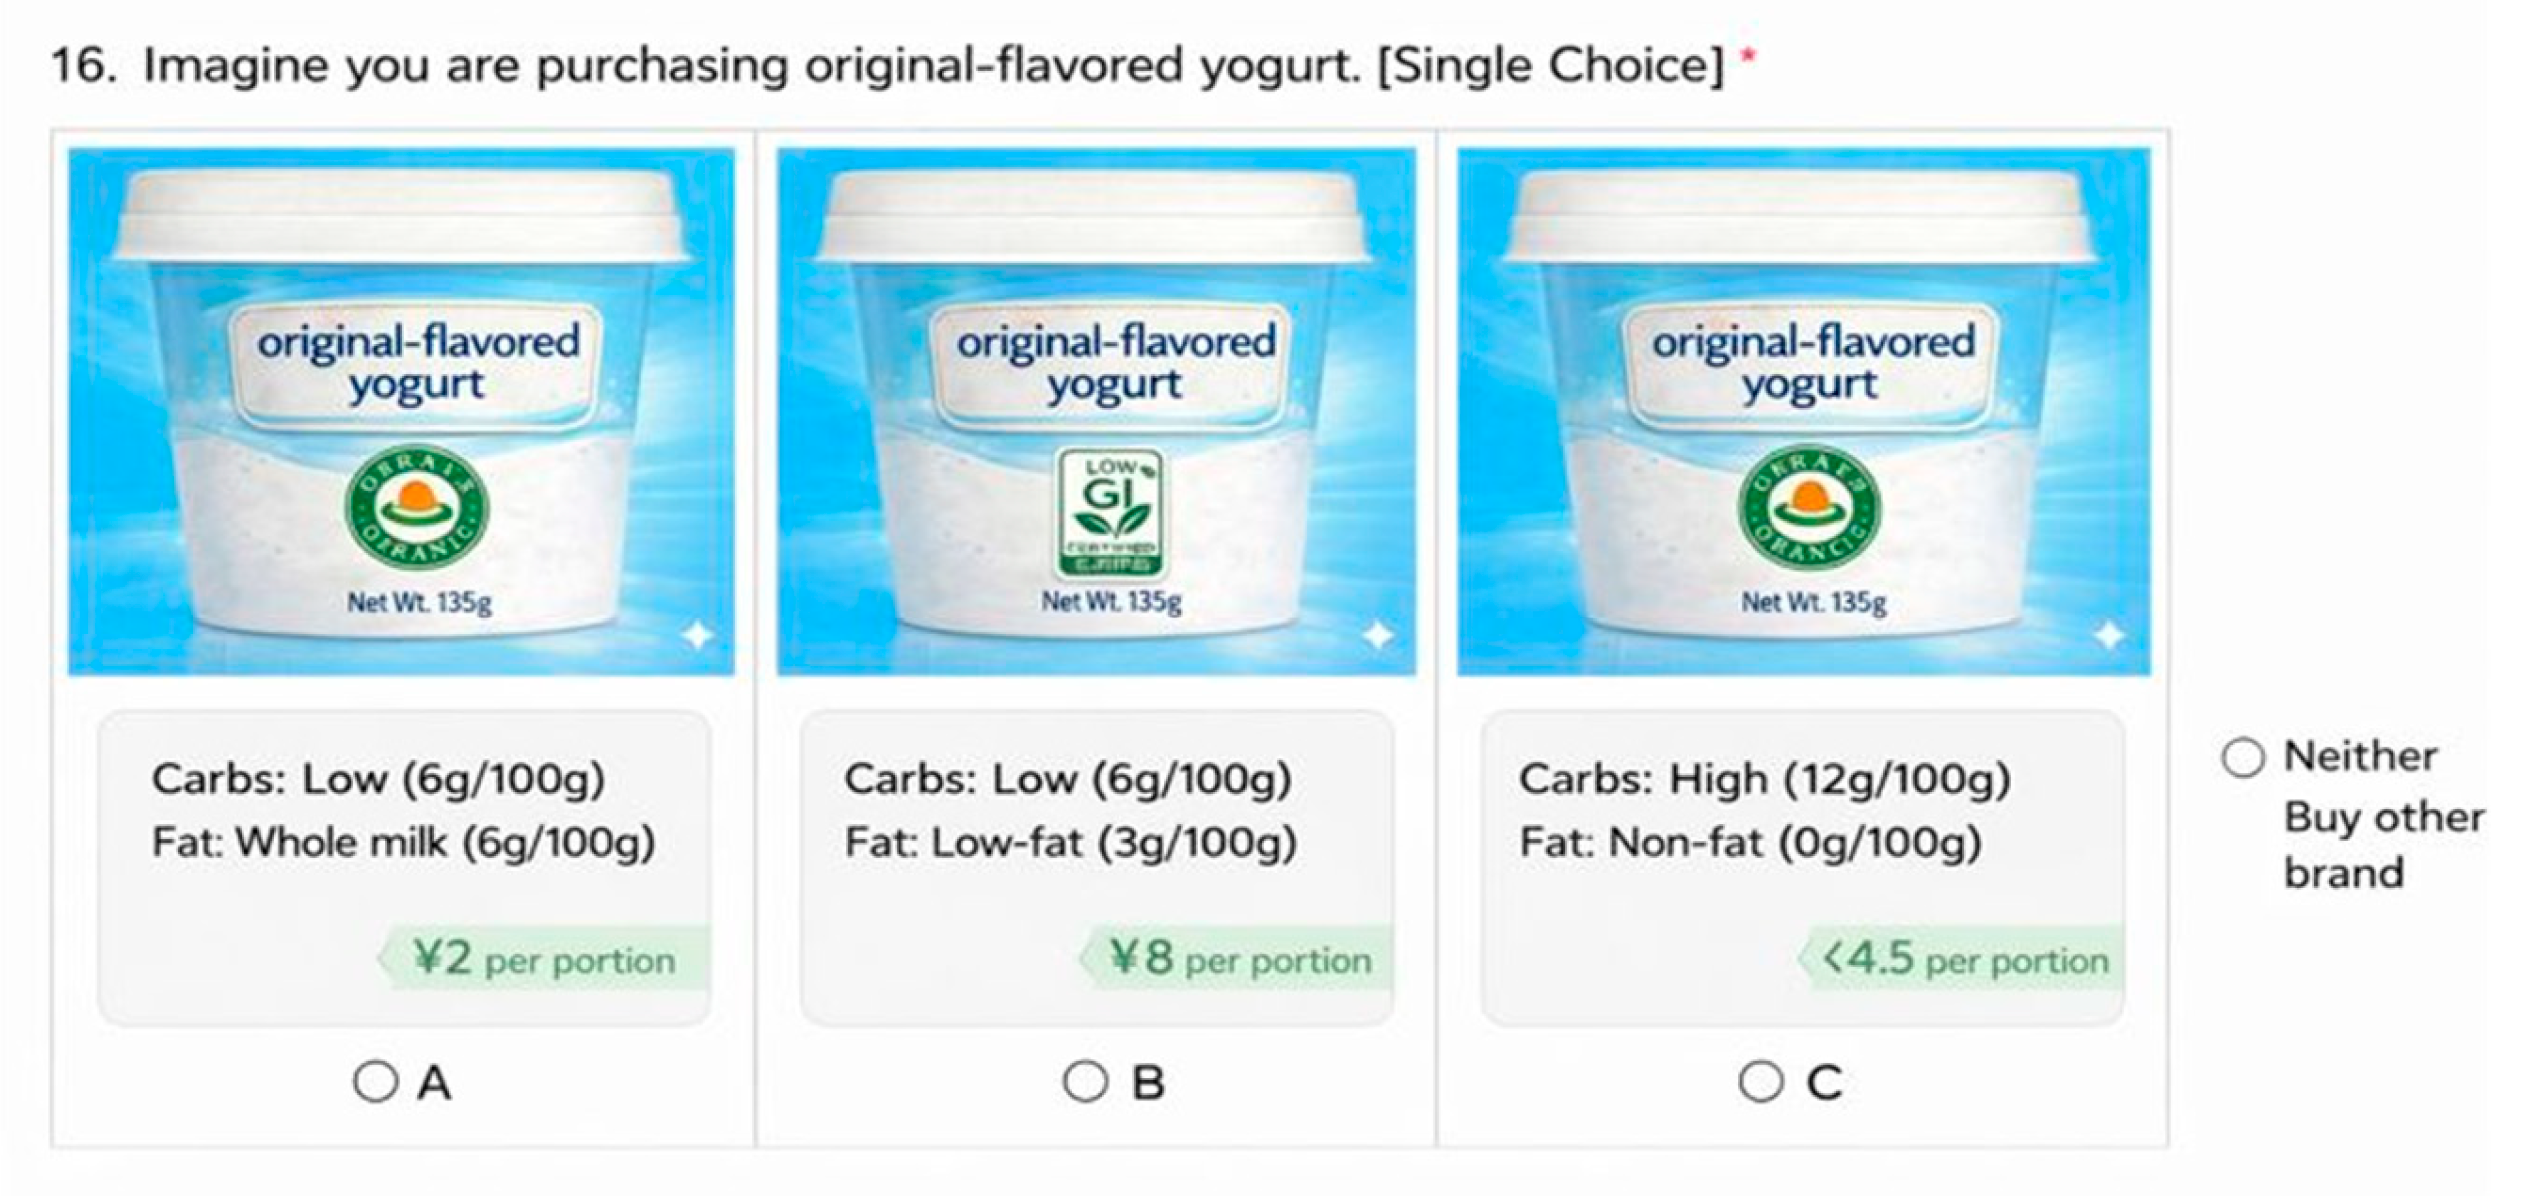
Prior to the DCE, respondents were shown the corresponding package labels and informed that the products carried “Low-GI” and “organic” labels, but no further explanation of the Low-GI concept was provided. This was intentional to avoid priming or experimenter-demand effects and to preserve the naturally existing variation in consumers’ knowledge. After completing the DCE, respondents took an objective knowledge quiz about Low-GI, and the measured level of understanding was used as a key source of heterogeneity in subsequent analyses. The specific attributes and levels are presented in Table 1. A sample choice card illustrating the presentation of these categorical labels and auxiliary values is shown in Figure 1.
A pilot study (n≈80) was conducted to test comprehension and to obtain preliminary parameter estimates. Based on the pilot results, a Bayesian D-efficient design was generated using NGENE, with normally distributed priors specified using pilot-based means and variances. During the design generation process, specific constraints were implemented to prohibit dominant alternatives. The final experimental design comprised 24 choice sets, which were divided into two blocks of 12 tasks each to reduce respondent burden. Each participant was randomly assigned to one block and completed 12 choice tasks.
3.3. Variable construction
To examine preference heterogeneity related to health motivation and objective understanding of the Low-GI concept, two measures were constructed from the questionnaire. Health orientation was assessed using three 7-point Likert items: 'I often reflect on my health status', 'I am very sensitive to changes in my health', and 'I actively pay attention to the impact of my daily diet on my health'. Responses were averaged to form a composite index and mean-centered prior to inclusion in interaction terms with the Low-GI label. The scale showed good internal consistency (Cronbach’s α = 0.856). Construct validity was supported (KMO = 0.733; Bartlett’s test p < 0.001), and an exploratory one-factor solution yielded strong loadings (0.872–0.891), with AVE = 0.778 and CR = 0.913.
Objective Low-GI knowledge was measured using a multiple-choice item. Respondents who selected the scientifically correct definition—i.e., a more gradual postprandial blood glucose rise given the same carbohydrate intake—were coded as 1; all other responses were coded as 0. Incorrect responses included defining Low-GI as (i) having lower carbohydrate or sugar content, (ii) involving less carbohydrate or sugar absorption, or (iii) “do not know.” This single-item measure captures objective concept recognition (i.e., whether respondents understood the core physiological meaning of Low-GI) rather than broader nutrition knowledge; single-item measures are often adequate when the construct is narrow and unidimensional [51]. Given the cognitive demands of DCE tasks, keeping the knowledge check brief helps reduce respondent burden and satisficing [52].
3.4. Econometric Specification and Model Strategy
3.4.1. Random Utility Framework
Consumer choices were modeled within the Random Utility Theory (RUT) framework. For a respondent in choice situation , the utility derived from selecting alternative among options (comprising three yogurt profiles and an opt-out option) is expressed as:
where represents the deterministic component of utility and is the stochastic error term, assumed to be independently and identically distributed (i.i.d.) following a Gumbel (Type I extreme value) distribution. The systematic utility of the opt-out option was normalized to zero. A single alternative-specific constant () was specified for the three purchase alternatives, with the opt-out as the reference, to capture the baseline propensity to purchase a yogurt product.
3.4.2. Mixed Logit Estimation
To account for unobserved preference heterogeneity, Mixed Logit (MIXL) models were estimated using simulated maximum likelihood. The vector of taste parameters is assumed to vary across individuals according to a multivariate normal distribution:
where is the vector of mean population preferences and is the covariance matrix. To capture the correlations among random parameters, a Cholesky decomposition was applied to the covariance matrix. In our model specification, six attribute parameters—the Low-GI label, organic certification, two dummy variables for carbohydrate levels (low and high), and two dummy variables for fat content (skim and whole)—were specified as random parameters following a normal distribution. Conversely, the price coefficient, the alternative-specific constant (), and all interaction terms (including two-way and three-way interactions) were treated as fixed parameters. The price coefficient was kept fixed to ensure stability in the estimation of Willingness to Pay (WTP) and to avoid the identification issues associated with a random price distribution. Interaction terms were fixed to facilitate a more straightforward interpretation of how specific consumer characteristics (health orientation and knowledge) moderate the utility of the Low-GI label. The models were estimated using 500 Halton draws in Stata 16.0.
3.4.3. Model Sequence
Three sequential models were estimated to test the research hypotheses (H1–H4). For categorical attributes, 'regular carbohydrate' and 'low-fat' were set as the reference categories.
Model 1 (Baseline Main-Effects): This model evaluates the general impact of the Low-GI label and other product attributes. The systematic utility is defined as:
H1 is supported if and is statistically significant. The mean WTP for the Low-GI label is computed as .
Model 2 (Two-Way Interaction): To investigate how Low-GI valuation is moderated by health orientation, carbohydrate context, and objective knowledge, interaction terms were introduced:
H2 is assessed via the interaction between the Low-GI label and health-orientation scores, while H3 is tested through the interactions with carbohydrate levels.
Model 3 (Three-Way Interaction): To explore the "decoder" role of knowledge (H4), we included three-way interaction terms:
This model tests whether objective knowledge conditions the cue congruence effect of Low-GI and carbohydrate levels. By combining these coefficients, the marginal utility and WTP for Low-GI can be derived across different carbohydrate contexts and knowledge groups.
4. Results
4.1. Sample Characteristics and Descriptive Statistics
The socio-demographic profile of the valid respondents () is summarized in Table 2. The sample exhibited a balanced gender distribution, with 50.11% males and 49.89% females. In terms of age, the largest groups were aged 18–25 (29.34%) and 26–35 (21.65%), representing a relatively young and active consumer segment. Regarding education, the majority of participants had completed vocational or higher education, with 19.78% holding a bachelor's degree. The geographic distribution was diverse, with a broad representation across different regions and city tiers, ranging from Tier 1 cities (15.38%) to rural areas (17.80%), ensuring a wide coverage of the Chinese consumer market.
Regarding economic status, 53.63% of households reported a monthly post-tax income of less than 5,000 CNY, while 25.82% earned between 5,000 and 9,999 CNY. In terms of consumption habits, over 60% of respondents purchased original-flavored yogurt at least twice a month, with 51.76% buying it 2–3 times monthly, indicating high familiarity with the product category. Notably, in the discrete choice experiment, the opt-out option (“would not buy”) was selected in only 7.44% of the total choice tasks. This low opt-out rate suggests that the experimental design successfully presented realistic and attractive alternatives, and that respondents were highly engaged in the decision-making process.
In addition, respondents’ health orientation and objective Low-GI knowledge were summarized as key individual characteristics. The mean health orientation index (average of three items on a 1–7 scale) was 4.201 (SD = 1.510), suggesting moderate health-related attentiveness in the sample. Regarding objective Low-GI knowledge, fewer than half of respondents correctly identified Low-GI as indicating a more gradual postprandial blood glucose rise under the same carbohydrate intake (46.48%). Misconceptions were common: 28.13% interpreted Low-GI as implying lower carbohydrate/sugar content, and 20.00% believed it means less carbohydrate/sugar is absorbed by the body, while 5.38% reported not knowing the definition. This distribution highlights substantial knowledge gaps and supports our focus on knowledge as a key factor shaping how consumers interpret Low-GI information in different carbohydrate contexts.
4.2. General Consumer Preferences: Baseline Results (Model 1)
Model 1 in Table 3 presents the baseline Mixed Logit (MIXL) estimation results, which evaluate consumer preferences for the primary attributes of original-flavored yogurt. Consistent with economic theory, the coefficient for price is negative and statistically significant (), indicating that higher price levels decrease the probability of selection. The alternative-specific constant () is positive and highly significant, reflecting a robust baseline propensity among respondents to select one of the yogurt alternatives rather than the opt-out option, thereby suggesting a high level of engagement with the product category.
Regarding the labeled attributes, the Low-GI label yields a positive and highly significant utility premium (). This result demonstrates that consumers derive substantial marginal utility from the presence of a Low-GI claim relative to an otherwise identical product, providing strong empirical support for H1. Similarly, the organic label exerts a positive and significant effect on choice, aligning with previous literature that identifies organic certification as a key credence attribute associated with perceived healthfulness and superior quality.
In contrast, the preference for physical attributes reveals a different pattern. Relative to the reference level (low-fat), both skim and whole-fat alternatives are associated with significantly lower utility. This implies that respondents in this study systematically favor the baseline "low-fat" profile over the extremes of fat content in the context of original-flavored yogurt. Regarding carbohydrate content, respondents exhibited a significant preference for the low-carbohydrate profile () relative to the regular baseline, whereas the high-carbohydrate alternative did not yield a statistically significant difference in utility.
Finally, the estimated standard deviations of the random coefficients are statistically significant for all key attributes. This confirms the presence of substantial unobserved preference heterogeneity across the sample, validating the use of the Mixed Logit specification to capture individual-level variations in the valuation of yogurt attributes and functional labels.
4.3. Moderating Effects of Context and Individual Characteristics (Models 2 and 3)
Column 2 in Table 3 presents the estimation results for Model 2, which extends the baseline specification by introducing several two-way interaction terms to examine whether the utility derived from the Low-GI label is conditional upon the product’s carbohydrate context and the consumers' individual characteristics. The empirical results reveal distinct and statistically significant moderation patterns that refine the understanding of Low-GI label valuation. The model captures the role of individual heterogeneity through health-orientation moderation (H2). The interaction between the Low-GI label and health orientation is positive and statistically significant (). Given that the health orientation variable is mean-centered, this estimated coefficient indicates that respondents with a health orientation above the sample average place a higher valuation on the Low-GI label, a finding that is consistent with the predictions of H2. This suggests that consumers who are more intrinsically motivated by health-related goals are more sensitive to functional claims that facilitate the selection of healthier dietary options.
Furthermore, regarding context moderation (H3), the interaction between the Low-GI label and the low-carbohydrate yogurt profile is positive and highly significant (), indicating that the marginal utility of a Low-GI claim is substantially amplified when the product is presented within a low-carbohydrate nutritional context. In contrast, the interaction between the Low-GI label and the high-carbohydrate profile does not reach statistical significance, suggesting that the incremental value of the Low-GI label does not significantly differ in a high-carbohydrate context relative to the reference carbohydrate level. Taken together, these findings provide empirical support for H3, suggesting that the effectiveness of a functional label is context-dependent and appears stronger when the overall nutritional profile is conceptually congruent with the health cues signaled by the label.
The interaction between the Low-GI label and objective knowledge () is not statistically significant in Model 2, implying that knowledge does not act as a simple additive moderator of Low-GI valuation in a generalized context. This lack of a direct interaction effect motivates the subsequent analysis of higher-order interactions in Model 3. In this final specification, objective knowledge is examined as a potential “decoder” that shapes how consumers jointly interpret the Low-GI claim and the specific carbohydrate context provided. This approach allows for a more nuanced investigation of whether nutritional knowledge is required to reconcile functional information with the physical attributes of the product, particularly when such information may appear complex or contradictory to uninformed consumers.
It is also important to highlight the robustness of the model specification. As shown in Table 3, the coefficients for the non-interacted control attributes—specifically price, organic certification, and fat content—remained remarkably stable in magnitude and significance compared to the baseline model. While the main effect of the low-carbohydrate attribute decreased in magnitude in Model 2, this is an expected structural shift: the utility previously attributed to the low-carbohydrate attribute alone is now captured by the significant interaction term (). This pattern clarifies the interpretation of the coefficients: once the interaction is included, the main effect is identified at the baseline (Low-GI = 0), while the significant interaction term captures the incremental utility of low carbohydrate specifically when the label is present, consistent with H3.
4.4. The "Decoder" Role of Knowledge
Column 3 in Table 3 presents the estimation results of Model 3, which extends the analysis by incorporating three-way interaction terms between objective knowledge, the Low-GI label, and carbohydrate levels. This advanced specification is explicitly designed to test H4 by examining whether nutritional knowledge functions as a cognitive "decoder", enabling consumers to discriminate the value of the Low-GI label based on the specific carbohydrate context. The empirical results provide robust evidence that knowledgeable consumers do not value the label uniformly; rather, they adjust their preference according to the distinct nutritional logic of each product profile, distinguishing between the physiological velocity of the glucose response (GI) and the total quantity of carbohydrate intake.
The most pronounced positive effect is observed in the low-carbohydrate context (). For knowledgeable consumers, this combination is consistent with a cue-reinforcing interpretation of quantity and quality cues. Specifically, the low-carbohydrate attribute provides a favorable quantity signal (lower carbohydrate intake), while the Low-GI label provides a favorable quality signal (slower glycemic response rate). Together, the pattern of estimates suggests that the marginal value of the Low-GI label is highest when the surrounding nutritional information supports a coherent physiological narrative. Notably, comparing Model 2 and Model 3 reveals a critical insight regarding the base interaction effect. Once objective knowledge is explicitly modeled in the three-way interaction, the two-way interaction term between the Low-GI label and the low-carbohydrate context (Low-GI × Carb: low) becomes statistically insignificant (). In Model 3, this term specifically captures the incremental effect among less knowledgeable consumers (ObjKnow = 0). Its insignificance suggests that, for consumers who do not correctly understand the Low-GI concept, the Low-GI claim does not generate additional utility in the low-carb setting beyond the main effects. This pattern is consistent with the possibility that low-knowledge consumers do not systematically integrate the Low-GI claim with carbohydrate-quantity cues; instead, they may treat the two pieces of information as weakly diagnostic or only loosely related. This pattern clarifies that the cue-congruence effect originally detected in Model 2 is, in fact, driven almost entirely by the knowledgeable segment. By isolating this effect, Model 3 further supports the proposed “decoder” role of knowledge, showing that the cue-reinforcement mechanism in perceived healthfulness operates only when consumers have sufficient cognitive capability to interpret the signal.
Crucially, a positive and significant effect also emerges in the high-carbohydrate context (), although the magnitude is smaller than in the low-carbohydrate scenario. In the high-carbohydrate context, the positive three-way interaction is consistent with a risk-mitigation interpretation: knowledgeable consumers may interpret the Low-GI label as a cue of slower carbohydrate absorption, leading them to expect a more gradual postprandial glycaemic response relative to higher-GI alternatives, even in a high-carbohydrate option[2,3]. More broadly, the estimates suggest that objective knowledge is associated with greater reliance on a mechanism-based evaluation (GI as a “rate” cue) rather than a purely heuristic “health halo.”
In contrast, relative to these specialized profiles, the valuation of the Low-GI label in the regular-carbohydrate context (the reference category) is significantly lower. Crucially, the negative interaction term observed here does not imply that knowledgeable consumers view the label negatively; rather, it indicates that their net marginal utility in the reference context (calculated as ) converges toward zero, rendering the WTP statistically insignificant. For knowledgeable consumers, a 'Regular Carb + Low GI' product lacks a clear functional positioning, being neither a strict diet option nor a specialized energy source. Consequently, without the clear cue congruence in perceived healthfulness (in low-carbohydrate contexts) or risk-mitigation value (in high-carbohydrate contexts) found at the extremes, the marginal utility of the label diminishes. Collectively, these findings support the view that objective knowledge acts as a sophisticated filter that amplifies the label’s value when it offers a clearer perceived functional rationale, thereby providing strong empirical support for H4.
Finally, the stability of the estimates across Model 2 and Model 3 warrants mention. Despite the increased complexity introduced by the three-way interaction terms, the coefficients for the control variables (price, organic, fat) and the carbohydrate main effects remained virtually unchanged compared to Model 2. Specifically, the main effect for the low-carbohydrate attribute remained statistically insignificant (), mirroring the result in Model 2. This consistency confirms that for the baseline group (uninformed consumers in the absence of a Low-GI label), physical carbohydrate reduction alone continues to generate limited utility.
4.5. Willingness to Pay (WTP) Estimates and Economic Implications
To translate utility estimates into economically interpretable metrics, willingness-to-pay (WTP) for the Low-GI label was computed as using the Delta method. We calculate WTP for the Low-GI label based on the estimated parameters from Model 3 (Table 3), because it provides the richest representation of preference heterogeneity by incorporating both contextual interactions and individual-level moderators, and it also delivers the best overall fit among the competing specifications, as indicated by the lowest AIC and BIC. Table 4 reports WTP (CNY) across three carbohydrate contexts (low/regular/high), stratified by objective knowledge (Obj = 0 vs. 1) and health orientation (evaluated at 0 and ±1 SD of the mean-centered health index). The results show that the economic value of the low-GI label is strongly context-dependent and differs systematically across consumer segments.
Health orientation acts as a general upward shift in valuation. Across knowledge groups and carbohydrate contexts, higher health orientation is associated with higher WTP for the Low-GI label. For example, among consumers without objective knowledge in the regular-carbohydrate context, WTP increases monotonically from 2.14 CNY (−1 SD) to 4.55 CNY (+1 SD). This pattern indicates that stronger health motivation translates into a greater willingness to pay for a health-related label.
Objective knowledge operates as a contextual “decoder”, amplifying valuation when carbohydrate information provides a congruent (or salient) context. In the low-carbohydrate context, knowledgeable consumers exhibit a substantially larger premium for the low-GI label, amounting to nearly 2.3 times the value placed by uninformed consumers (7.42 CNY vs. 3.20 CNY). In the high-carbohydrate context, knowledgeable consumers also maintain a higher WTP (3.58 CNY) than uninformed consumers (2.67 CNY). These differences suggest that objective knowledge helps consumers integrate the Low-GI claim with the product’s carbohydrate profile, thereby strengthening the perceived relevance of the label in context.
In contrast, in the regular-carbohydrate reference context, knowledgeable consumers show a small and statistically insignificant WTP (0.97 CNY), while uninformed consumers display a moderate premium (3.35 CNY). This pattern may reflect differences in information processing: consumers with limited objective knowledge may rely on a general “health halo” associated with the label, whereas knowledgeable consumers may evaluate the label more critically when the surrounding nutritional context does not clearly signal a low- or high-carbohydrate positioning, making the incremental information content of the label less diagnostic.
Finally, the magnitude of the Low-GI premium is economically meaningful when benchmarked against other attributes. Under the low-carbohydrate context among knowledgeable consumers with higher health orientation (+1 SD), WTP reaches 8.62 CNY, exceeding the premium associated with the organic label (1.60 CNY). This comparison highlights that Low-GI can function as a high-intensity functional signal, but the premium is most likely to be realized when the label is paired with a nutritionally congruent product profile and targeted toward consumers with sufficient nutritional literacy to interpret its physiological implications.
Figure 2 visualizes the WTP estimates from Table 4, highlighting three systematic regularities. First, health orientation acts as a consistent amplifier, increasing WTP across all contexts. Second, objective knowledge generates a strong cue-congruence premium: in the low-carbohydrate context, knowledgeable consumers exhibit the highest WTP, which widens further with health motivation. Third, a “decoder” mechanism is evident in the distinction between contexts: unlike uninformed consumers who value the label globally, knowledgeable consumers discount the label in the regular-carbohydrate context while maintaining a positive “risk-mitigation” valuation in the high-carbohydrate setting. This confirms that the label’s economic value is structurally determined by the interplay of nutritional context and consumer capability.
5. Discussion
This study used a discrete choice experiment (DCE) to quantify consumers’ willingness to pay (WTP) for a “Low-GI” front-of-pack (FOP) claim in China’s yogurt market and to unpack why this value varies across consumers and product profiles. Positioned within the broader agenda of food labeling as a policy instrument, our findings highlight that complex physiological claims do not function as unconditional signals of healthiness. Instead, their behavioral and welfare relevance depends on (i) whether consumers are motivated to use health information (health orientation) and (ii) whether they have the label-specific capability to interpret what the claim means (objective Low-GI knowledge), especially when other nutrition cues are present on the package. In other words, the effectiveness of emerging labels hinges on a “motivation–capability” pathway, and the label’s economic value is structurally shaped by the interaction between the claim and the surrounding nutrition context.
5.1. General Preference for Low-GI Labeling (Baseline Valuation)
Across the full sample, the Low-GI claim generated a statistically significant utility premium, implying that consumers are willing to pay extra for this FOP signal. This baseline result is consistent with labeling research emphasizing how front-of-pack information can reduce search costs and shape product evaluation when quality/health attributes are not directly observable [10,12]. Importantly, our result extends existing work on glycaemic index labeling as a nutrition-information policy tool by illustrating that consumers attach value to Low-GI cues even in categories where physiological meaning is not self-evident from the nutrition panel [5,32]. In the yogurt category, a Low-GI label appears to function as a salient shortcut that many consumers translate into perceived added value, thereby creating meaningful demand for the claim as a labeling attribute.
5.2. The Role of Health Motivation
We find clear evidence that health orientation amplifies consumers’ valuation of the Low-GI claim. This pattern aligns with prior evidence that health motivation and nutrition orientation increase attention to and use of nutrition information on packages [13,14]. From the perspective of food-labeling interventions, this result implies that the same label can generate very different behavioral responses depending on the motivational state of the target population. For labeling policy and public-health strategy, it suggests that increasing label availability alone may not shift behavior uniformly; outcomes will likely be strongest among consumers who already prioritize health goals [14].
5.3. The Role of Nutritional Context and Knowledge
A central contribution of this study is showing that the Low-GI claim is not evaluated in isolation. Its value depends on the broader nutritional context—here, carbohydrate content—because consumers interpret multiple on-pack cues jointly. This is consistent with evidence that consumers’ responses to health claims depend strongly on what other nutrition information appears on the package [16] and on how claims interact with nutrition facts and consumers’ motivation to process information [53]. In Model 2, the Low-GI premium appears larger in low-carbohydrate profiles, consistent with cue congruence: “low carb” (quantity cue) and “low GI” (quality/rate cue) together create a coherent health narrative [16]. However, Model 3 demonstrates that this congruence effect is largely driven by consumers who correctly understand the Low-GI concept, which supports a “decoder” mechanism: objective knowledge enables consumers to map the claim onto the product’s nutritional profile and to adjust valuation in a context-sensitive way rather than applying a blanket “health halo” [11,13,27].
Three implications follow that are directly relevant to food-labeling debates. First, knowledgeable consumers display the strongest WTP when “Low-GI” is paired with low carbohydrate content, consistent with a reinforcing two-cue interpretation (a favorable quantity–quality bundle). Second, knowledgeable consumers retain a positive valuation even in high-carbohydrate profiles, consistent with a “risk-mitigation” logic: they may view Low-GI as informative about the rate of postprandial glycaemic response relative to higher-GI alternatives, even when carbohydrate quantity is high [2,3]. Third—and most revealing—knowledgeable consumers discount the claim in the regular-carbohydrate reference context, where the product does not provide a clear functional positioning and the incremental diagnostic value of the claim is weaker. By contrast, less knowledgeable consumers show a more global premium, consistent with a generalized health-halo response rather than a mechanism-based evaluation [11,27].
Taken together, these results highlight a key challenge for complex health claims: when consumers lack label-specific literacy, the claim may be valued as a broad positive signal even in contexts where its functional meaning is ambiguous. This is precisely the type of mechanism that motivates policy attention to claim governance and consumer comprehension when simplified FOP cues coexist with more detailed nutrition information [16,53].
5.4. Implications for Industry and Policy
Our evidence suggests that the behavioral effectiveness of a Low-GI claim depends on whether consumers can interpret it correctly and integrate it with co-occurring nutrition information. This supports approaches that reduce comprehension costs—clearer claim definitions, more standardized presentation, and complementary interpretive elements that help consumers understand what the claim does and does not imply [5,11].
The results reveal segmentation opportunities that align tightly with consumer behavior. For low-carbohydrate products, Low-GI can be positioned as a complementary “quality-of-carbohydrate” signal that reinforces an already coherent nutrition profile. For higher-carbohydrate products, the claim may be framed more carefully as an absorption-rate cue that differentiates the product within its category, without implying that Low-GI negates high carbohydrate quantity [2,3]. More broadly, firms’ returns to Low-GI labeling are likely to be highest when targeting consumers with higher health orientation and when the product formulation supports a credible nutrition narrative [13,14].
From a policy perspective, our findings imply that the welfare impact of physiological claims is conditional on consumer capability. Motivation raises general responsiveness, but knowledge determines whether the claim is used diagnostically [27]. Therefore, policy packages that combine claim standardization and enforcement with targeted nutrition education are more likely to translate labeling into informed choices [5,13].
5.5. Limitations and Future Research
Several limitations point to promising directions for future research in food labeling and consumer behavior. First, as a stated-preference DCE, our WTP estimates may differ from real-market behavior under time pressure and budget constraints. Future work should validate these patterns using incentive-compatible designs and field evidence. Second, we focused on one product category (plain yogurt). Because label interpretation depends on the food matrix and category expectations, replication in other contexts would clarify how general the “cue reinforcement vs. risk mitigation” logic is [16]. Third, our knowledge measure captures objective concept recognition but not broader label trust or subjective understanding; incorporating these dimensions would help distinguish “knowing” from “believing” a claim [11,27]. Finally, more policy-evaluation work could exploit natural experiments or staggered introductions of labeling rules to assess causal impacts on purchasing and diet quality.
Author Contributions
methodology, Yixin Guo; formal analysis, Yixin Guo; data curation, Wenxue Tang; writing—original draft preparation, Yixin Guo, Leyi Wang and Wenxue Tang; writing—review and editing, Wenxue Tang, Xiaoou Liu; supervision, Xiaoou Liu. All authors have read and agreed to the published version of the manuscript.
Funding
This work is supported by the Fundamental Research Funds for the Central Universities, and the Research Funds of Renmin University of China (Grant No. 22XNL012).
Institutional Review Board Statement
Ethical review and approval were waived for this study due to the fact that it consisted of an anonymous online survey regarding consumer preferences for yogurt products. The study was conducted on a voluntary basis with adult participants only, involved no physical or psychological intervention, and did not collect or involve any sensitive personal data.
Informed Consent Statement
Informed consent was obtained from all subjects involved in the study.
Data Availability Statement
The data and analysis code presented in this study are available from the corresponding author on reasonable request.
Acknowledgments
The authors would like to thank all the respondents who participated in the anonymous online survey for their time and contribution to this study.
Conflicts of Interest
The authors declare no conflict of interest. The funders had no role in the design of the study; in the collection, analyses, or interpretation of data, in the writing of the manuscript, or in the decision to publish the results.
Abbreviations
The following abbreviations are used in this manuscript:
| FOP | Front-of-pack |
| GI | Glycemic Index |
| WTP | Willingness to Pay |
| DCE | Discrete Choice Experiment |
| RUT | Random Utility Theory |
| MIXL | Mixed Logit |
| ASC | Alternative-Specific Constant |
| CNY | Chinese Yuan |
| AIC | Akaike Information Criterion |
| BIC | Bayesian Information Criterion |
| SD | Standard Deviation |
| SE | Standard Error |
Appendix A
Figure A1.
Illustrative English translation of the decision situation shown in Figure 1. The actual experiment was conducted in Chinese; this translation is provided for reference.
Figure A1.
Illustrative English translation of the decision situation shown in Figure 1. The actual experiment was conducted in Chinese; this translation is provided for reference.
References
- Augustin, L.S.A.; Kendall, C.W.C.; Jenkins, D.J.A.; Willett, W.C.; Astrup, A.; Barclay, A.W.; Björck, I.; Brand-Miller, J.C.; Brighenti, F.; Buyken, A.E.; et al. Glycemic Index, Glycemic Load and Glycemic Response: An International Scientific Consensus Summit from the International Carbohydrate Quality Consortium (ICQC). Nutrition, Metabolism and Cardiovascular Diseases 2015, 25, 795–815. [Google Scholar] [CrossRef]
- Jenkins, D.J.; Wolever, T.M.; Taylor, R.H.; Barker, H.; Fielden, H.; Baldwin, J.M.; Bowling, A.C.; Newman, H.C.; Jenkins, A.L.; Goff, D.V. Glycemic Index of Foods: A Physiological Basis for Carbohydrate Exchange. The American Journal of Clinical Nutrition 1981, 34, 362–366. [Google Scholar] [CrossRef] [PubMed]
- Vlachos, D.; Malisova, S.; Lindberg, F.A.; Karaniki, G. Glycemic Index (GI) or Glycemic Load (GL) and Dietary Interventions for Optimizing Postprandial Hyperglycemia in Patients with T2 Diabetes: A Review. Nutrients 2020, 12, 1561. [Google Scholar] [CrossRef] [PubMed]
- Li, Y.; Teng, D.; Shi, X.; Qin, G.; Qin, Y.; Quan, H.; Shi, B.; Sun, H.; Ba, J.; Chen, B.; et al. Prevalence of Diabetes Recorded in Mainland China Using 2018 Diagnostic Criteria from the American Diabetes Association: National Cross Sectional Study. BMJ 2020, m997. [Google Scholar] [CrossRef] [PubMed]
- Barclay, A.W.; Augustin, L.S.A.; Brighenti, F.; Delport, E.; Henry, C.J.; Sievenpiper, J.L.; Usic, K.; Yuexin, Y.; Zurbau, A.; Wolever, T.M.S.; et al. Dietary Glycaemic Index Labelling: A Global Perspective. Nutrients 2021, 13, 3244. [Google Scholar] [CrossRef]
- Mitchell, H.L. The Glycemic Index Concept in Action. The American Journal of Clinical Nutrition 2008, 87, 244S–246S. [Google Scholar] [CrossRef]
- Wolever, T.M. Yogurt Is a Low–Glycemic Index Food. The Journal of Nutrition 2017, 147, 1462S–1467S. [Google Scholar] [CrossRef]
- Yang, S.; Bhargava, N.; O’Connor, A.; Gibney, E.R.; Feeney, E.L. Dairy Consumption in Adults in China: A Systematic Review. BMC Nutr 2023, 9, 116. [Google Scholar] [CrossRef]
- Croker, H.; Packer, J.; Russell, S.J.; Stansfield, C.; Viner, R.M. Front of Pack Nutritional Labelling Schemes: A Systematic Review and Meta-analysis of Recent Evidence Relating to Objectively Measured Consumption and Purchasing. J Human Nutrition Diet 2020, 33, 518–537. [Google Scholar] [CrossRef]
- Ikonen, I.; Sotgiu, F.; Aydinli, A.; Verlegh, P.W.J. Consumer Effects of Front-of-Package Nutrition Labeling: An Interdisciplinary Meta-Analysis. J. of the Acad. Mark. Sci. 2020, 48, 360–383. [Google Scholar] [CrossRef]
- Slabber, M. Complexities of Consumer Understanding of the Glycaemic Index Concept and Practical Guidelines for Incorporation in Diets. South African Journal of Clinical Nutrition 2005, 18, 252–257. [Google Scholar] [CrossRef]
- Campos, S.; Doxey, J.; Hammond, D. Nutrition Labels on Pre-Packaged Foods: A Systematic Review. Public Health Nutr. 2011, 14, 1496–1506. [Google Scholar] [CrossRef] [PubMed]
- Grunert, K.G.; Wills, J.M.; Fernández-Celemín, L. Nutrition Knowledge, and Use and Understanding of Nutrition Information on Food Labels among Consumers in the UK. Appetite 2010, 55, 177–189. [Google Scholar] [CrossRef] [PubMed]
- Visschers, V.H.; Hess, R.; Siegrist, M. Health Motivation and Product Design Determine Consumers’ Visual Attention to Nutrition Information on Food Products. Public Health Nutr. 2010, 13, 1099–1106. [Google Scholar] [CrossRef]
- Kliemann, N.; Wardle, J.; Johnson, F.; Croker, H. Reliability and Validity of a Revised Version of the General Nutrition Knowledge Questionnaire. Eur J Clin Nutr 2016, 70, 1174–1180. [Google Scholar] [CrossRef]
- Talati, Z.; Pettigrew, S.; Neal, B.; Dixon, H.; Hughes, C.; Kelly, B.; Miller, C. Consumers’ Responses to Health Claims in the Context of Other on-Pack Nutrition Information: A Systematic Review. Nutrition Reviews 2017, 75, 260–273. [Google Scholar] [CrossRef]
- Lancsar, E.; Louviere, J. Conducting Discrete Choice Experiments to Inform Healthcare Decision Making: A User??S Guide. PharmacoEconomics 2008, 26, 661–677. [Google Scholar] [CrossRef]
- Louviere, J.J.; Hensher, D.A.; Swait, J.D.; Adamowicz, W. Stated Choice Methods: Analysis and Applications, 1st ed.; Cambridge University Press, 2000; ISBN 978-0-521-78830-4. [Google Scholar]
- Train, K.E. Discrete Choice Methods with Simulation, 2nd ed.; Cambridge University Press, 2001; ISBN 978-0-521-76655-5. [Google Scholar]
- Sayeed, Z.; Sugino, H.; Sakai, Y.; Yagi, N. Consumer Preferences and Willingness to Pay for Mud Crabs in Southeast Asian Countries: A Discrete Choice Experiment. Foods 2021, 10, 2873. [Google Scholar] [CrossRef]
- Yeh, C.-H.; Hartmann, M.; Langen, N. The Role of Trust in Explaining Food Choice: Combining Choice Experiment and Attribute Best–Worst Scaling. Foods 2020, 9, 45. [Google Scholar] [CrossRef]
- Yeh, C.-H.; Menozzi, D.; Török, Á. Eliciting Egg Consumer Preferences for Organic Labels and Omega 3 Claims in Italy and Hungary. Foods 2020, 9, 1212. [Google Scholar] [CrossRef]
- Onwezen, M.C.; Reinders, M.J.; Verain, M.C.D.; Snoek, H.M. The Development of a Single-Item Food Choice Questionnaire. Food Quality and Preference 2019, 71, 34–45. [Google Scholar] [CrossRef]
- Connelly, B.L.; Certo, S.T.; Ireland, R.D.; Reutzel, C.R. Signaling Theory: A Review and Assessment. Journal of Management 2011, 37, 39–67. [Google Scholar] [CrossRef]
- Dranove, D.; Jin, G.Z. Quality Disclosure and Certification: Theory and Practice. Journal of Economic Literature 2010, 48, 935–963. [Google Scholar] [CrossRef]
- Oostenbach, L.H.; Slits, E.; Robinson, E.; Sacks, G. Systematic Review of the Impact of Nutrition Claims Related to Fat, Sugar and Energy Content on Food Choices and Energy Intake. BMC Public Health 2019, 19, 1296. [Google Scholar] [CrossRef]
- Miller, L.M.S.; Cassady, D.L. The Effects of Nutrition Knowledge on Food Label Use. A Review of the Literature. Appetite 2015, 92, 207–216. [Google Scholar] [CrossRef]
- Custodio, M.C.; Ynion, J.; Demont, M.; De Steur, H. Consumers’ Acceptance and Valuation of Healthier Rice: Implications for Promoting Healthy Diets in the Philippines. British Food Journal 2025, 127, 52–71. [Google Scholar] [CrossRef]
- Cuong, O.Q.; Connor, M.; Demont, M.; Sander, B.O.; Nelson, K. How Do Rice Consumers Trade off Sustainability and Health Labels? Evidence from Vietnam. Front. Sustain. Food Syst. 2022, 6, 1010161. [Google Scholar] [CrossRef]
- Annunziata, A.; Vecchio, R. Consumer Perception of Functional Foods: A Conjoint Analysis with Probiotics. Food Quality and Preference 2013, 28, 348–355. [Google Scholar] [CrossRef]
- Brouns, F.; Bjorck, I.; Frayn, K.N.; Gibbs, A.L.; Lang, V.; Slama, G.; Wolever, T.M.S. Glycaemic Index Methodology. Nutr. Res. Rev. 2005, 18, 145–171. [Google Scholar] [CrossRef]
- Aziz, A.; Dumais, L.; Barber, J. Health Canada’s Evaluation of the Use of Glycemic Index Claims on Food Labels. The American Journal of Clinical Nutrition 2013, 98, 269–274. [Google Scholar] [CrossRef]
- Fontanelli, M.D.M.; Batista, L.D.; Martinez-Arroyo, A.; Mozaffarian, D.; Micha, R.; Rogero, M.M.; Fisberg, R.M.; Sarti, F.M. Pragmatic Carbohydrate Quality Metrics in Relation to Glycemic Index, Glycemic Load, and Front-of-Pack Warning Labels in Grain Foods. Foods 2024, 13, 1299. [Google Scholar] [CrossRef] [PubMed]
- Wadhwa, S.-R.S.; McMahon, A.T.; Neale, E.P. A Cross-Sectional Audit of Nutrition and Health Claims on Dairy Yoghurts in Supermarkets of the Illawarra Region of New South Wales, Australia. Nutrients 2021, 13, 1835. [Google Scholar] [CrossRef] [PubMed]
- Darby, M.R.; Karni, E. Free Competition and the Optimal Amount of Fraud. The Journal of Law and Economics 1973, 16, 67–88. [Google Scholar] [CrossRef]
- Caswell, J.A.; Mojduszka, E.M. Using Informational Labeling to Influence the Market for Quality in Food Products. American J Agri Economics 1996, 78, 1248–1253. [Google Scholar] [CrossRef]
- Bonroy, O.; Constantatos, C. On the Economics of Labels: How Their Introduction Affects the Functioning of Markets and the Welfare of All Participants. American J Agri Economics 2015, 97, 239–259. [Google Scholar] [CrossRef]
- Van Trijp, H.C.M.; Van Der Lans, I.A. Consumer Perceptions of Nutrition and Health Claims. Appetite 2007, 48, 305–324. [Google Scholar] [CrossRef]
- Benson, T.; Lavelle, F.; Bucher, T.; McCloat, A.; Mooney, E.; Egan, B.; Collins, C.E.; Dean, M. The Impact of Nutrition and Health Claims on Consumer Perceptions and Portion Size Selection: Results from a Nationally Representative Survey. Nutrients 2018, 10, 656. [Google Scholar] [CrossRef]
- Kaur, A.; Scarborough, P.; Rayner, M. A Systematic Review, and Meta-Analyses, of the Impact of Health-Related Claims on Dietary Choices. Int J Behav Nutr Phys Act 2017, 14, 93. [Google Scholar] [CrossRef]
- Roe, B.; Levy, A.S.; Derby, B.M. The Impact of Health Claims on Consumer Search and Product Evaluation Outcomes: Results from FDA Experimental Data. Journal of Public Policy & Marketing 1999, 18, 89–105. [Google Scholar] [CrossRef]
- Ford, G.T.; Hastak, M.; Mitra, A.; Ringold, D.J. Can Consumers Interpret Nutrition Information in the Presence of a Health Claim? A Laboratory Investigation. Journal of Public Policy & Marketing 1996, 15, 16–27. [Google Scholar]
- Garretson, J.A.; Burton, S. Effects of Nutrition Facts Panel Values, Nutrition Claims, and Health Claims on Consumer Attitudes, Perceptions of Disease-Related Risks, and Trust. Journal of Public Policy & Marketing 2000, 19, 213–227. [Google Scholar] [CrossRef]
- Bix, L.; Sundar, R.P.; Bello, N.M.; Peltier, C.; Weatherspoon, L.J.; Becker, M.W. To See or Not to See: Do Front of Pack Nutrition Labels Affect Attention to Overall Nutrition Information? PLoS ONE 2015, 10, e0139732. [Google Scholar] [CrossRef] [PubMed]
- Bialkova, S.; Van Trijp, H. What Determines Consumer Attention to Nutrition Labels? Food Quality and Preference 2010, 21, 1042–1051. [Google Scholar] [CrossRef]
- Dutta-Bergman, M.J. Health Attitudes, Health Cognitions, and Health Behaviors among Internet Health Information Seekers: Population-Based Survey. J Med Internet Res 2004, 6, e15. [Google Scholar] [CrossRef]
- Michaelidou, N.; Hassan, L.M. The Role of Health Consciousness, Food Safety Concern and Ethical Identity on Attitudes and Intentions towards Organic Food. Int J Consumer Studies 2008, 32, 163–170. [Google Scholar] [CrossRef]
- Alba, J.W.; Hutchinson, J.W. Dimensions of Consumer Expertise. J CONSUM RES 1987, 13, 411. [Google Scholar] [CrossRef]
- Richetin, J.; Caputo, V.; Demartini, E.; Conner, M.; Perugini, M. Organic Food Labels Bias Food Healthiness Perceptions: Estimating Healthiness Equivalence Using a Discrete Choice Experiment. Appetite 2022, 172, 105970. [Google Scholar] [CrossRef]
- Li, T.; Dando, R. Impact of Common Food Labels on Consumer Liking in Vanilla Yogurt. Foods 2019, 8, 584. [Google Scholar] [CrossRef]
- Bergkvist, L.; Rossiter, J.R. The Predictive Validity of Multiple-Item versus Single-Item Measures of the Same Constructs. Journal of Marketing Research 2007, 44, 175–184. [Google Scholar] [CrossRef]
- Krosnick, J.A. Response Strategies for Coping with the Cognitive Demands of Attitude Measures in Surveys. Applied Cognitive Psychology 1991, 5, 213–236. [Google Scholar] [CrossRef]
- Keller, S.B.; Landry, M.; Olson, J.; Velliquette, A.M.; Burton, S.; Andrews, J.C. The Effects of Nutrition Package Claims, Nutrition Facts Panels, and Motivation to Process Nutrition Information on Consumer Product Evaluations. Journal of Public Policy & Marketing 1997, 16, 256–269. [Google Scholar] [CrossRef]
Figure 1.
`An example of a decision situation. The original questionnaire was designed in Chinese; an English version of this example is provided in Appendix Figure A1 for reference.
Figure 1.
`An example of a decision situation. The original questionnaire was designed in Chinese; an English version of this example is provided in Appendix Figure A1 for reference.
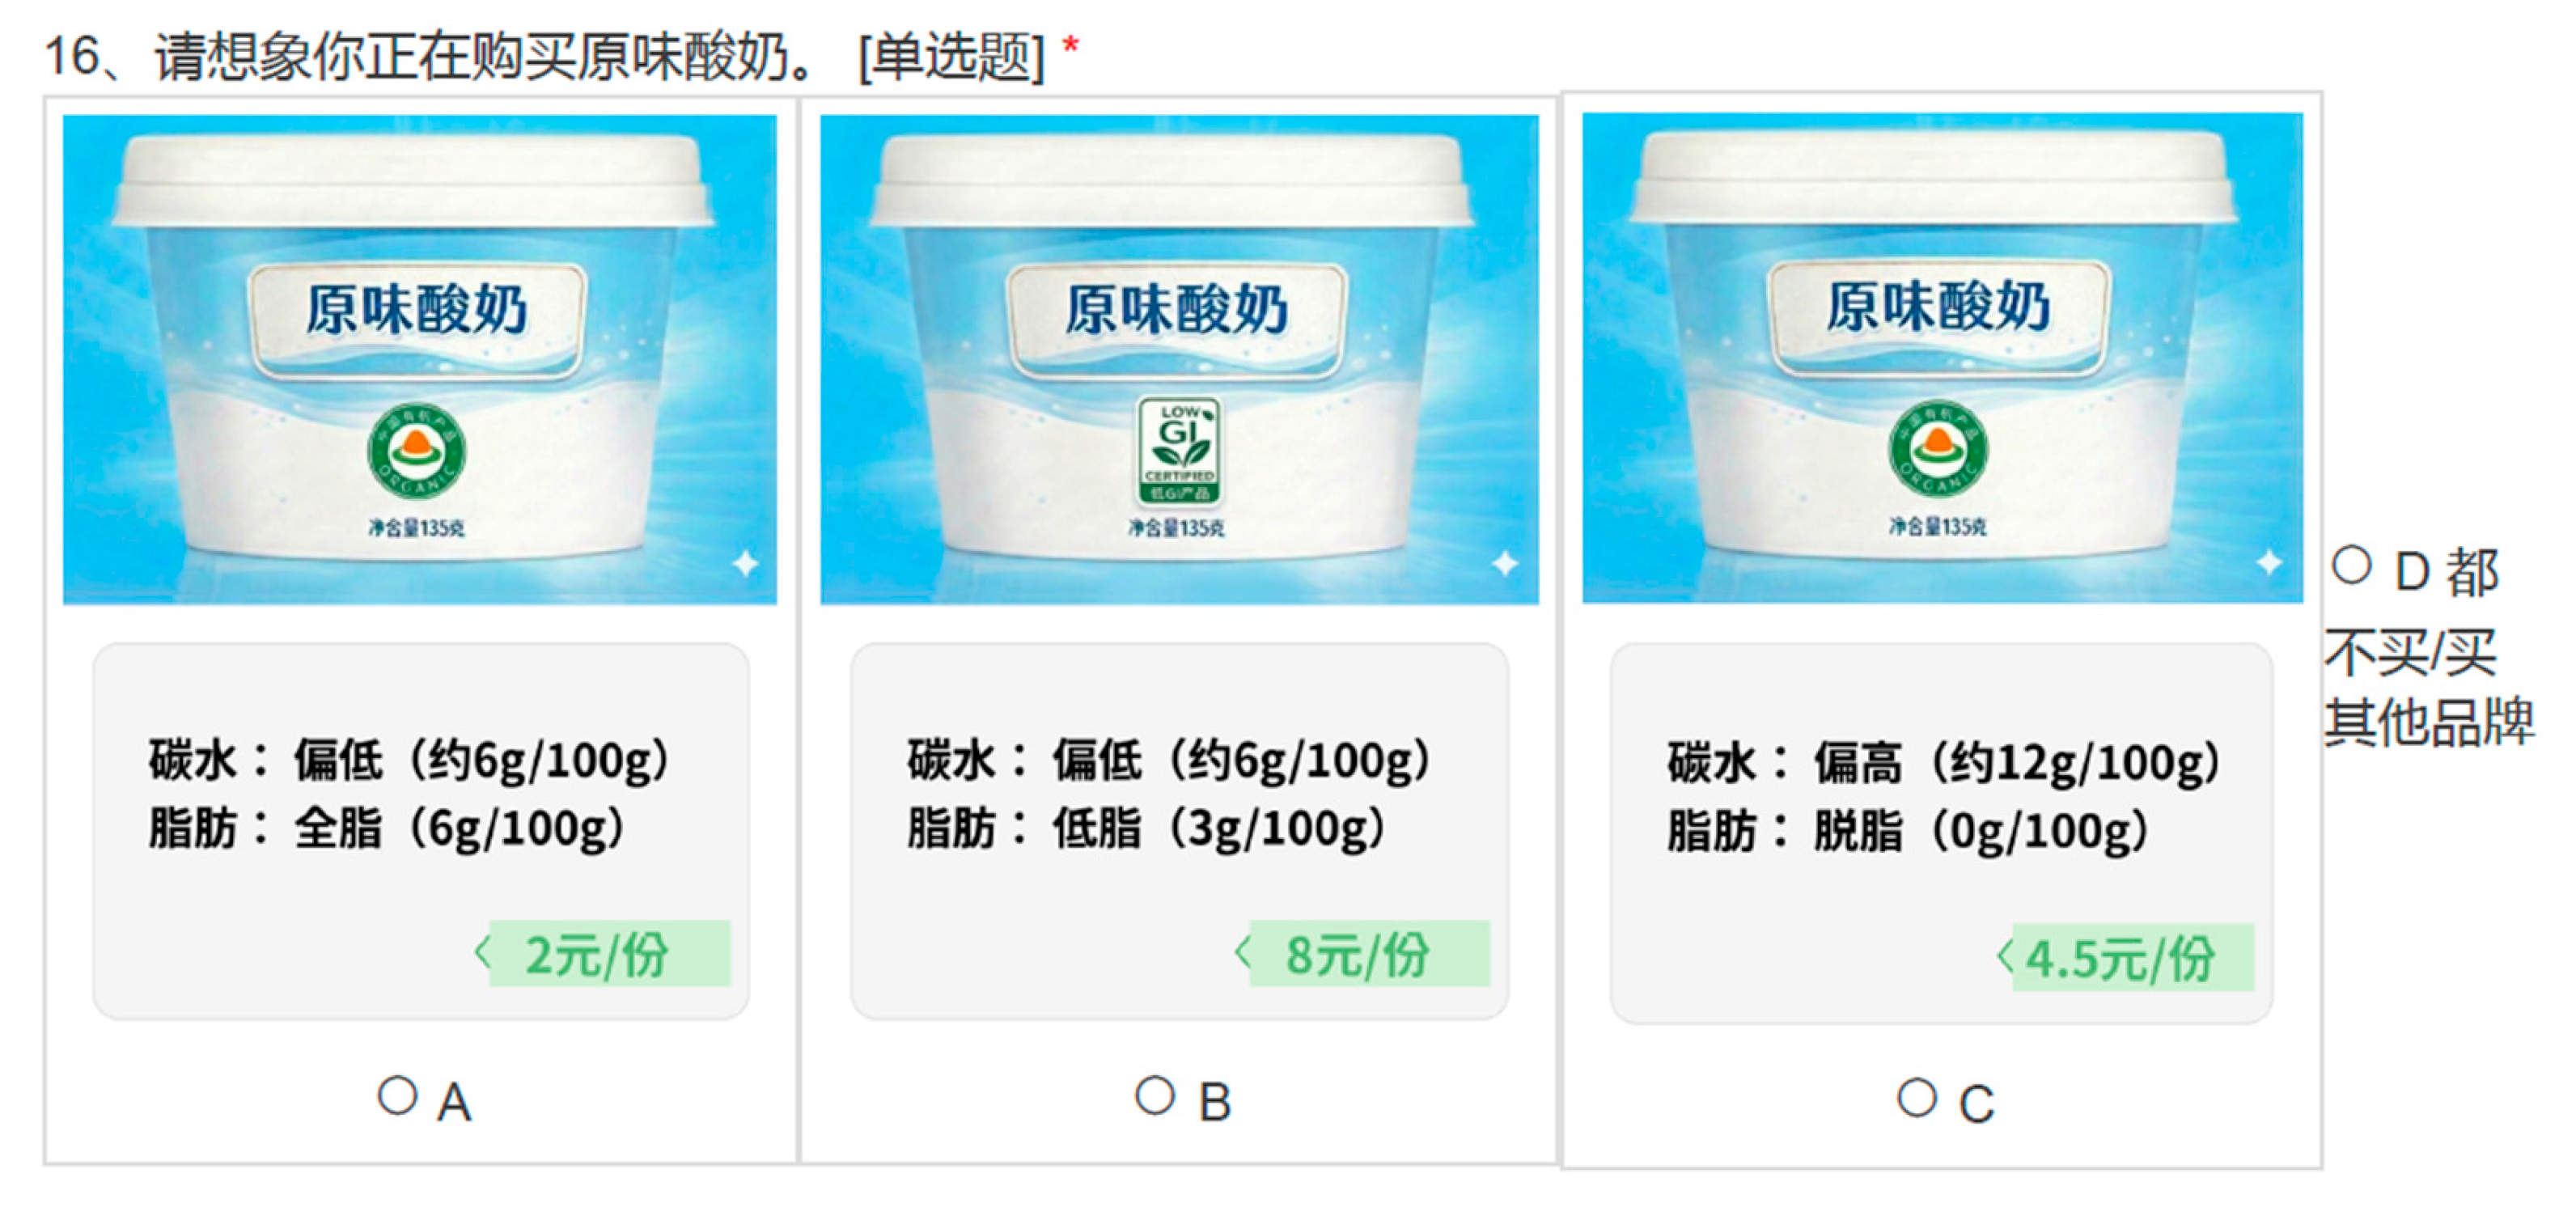
Figure 2.
Consumers’ willingness to pay for Low-GI under various health orientations, respective objective knowledge, and carbohydrate content.
Figure 2.
Consumers’ willingness to pay for Low-GI under various health orientations, respective objective knowledge, and carbohydrate content.
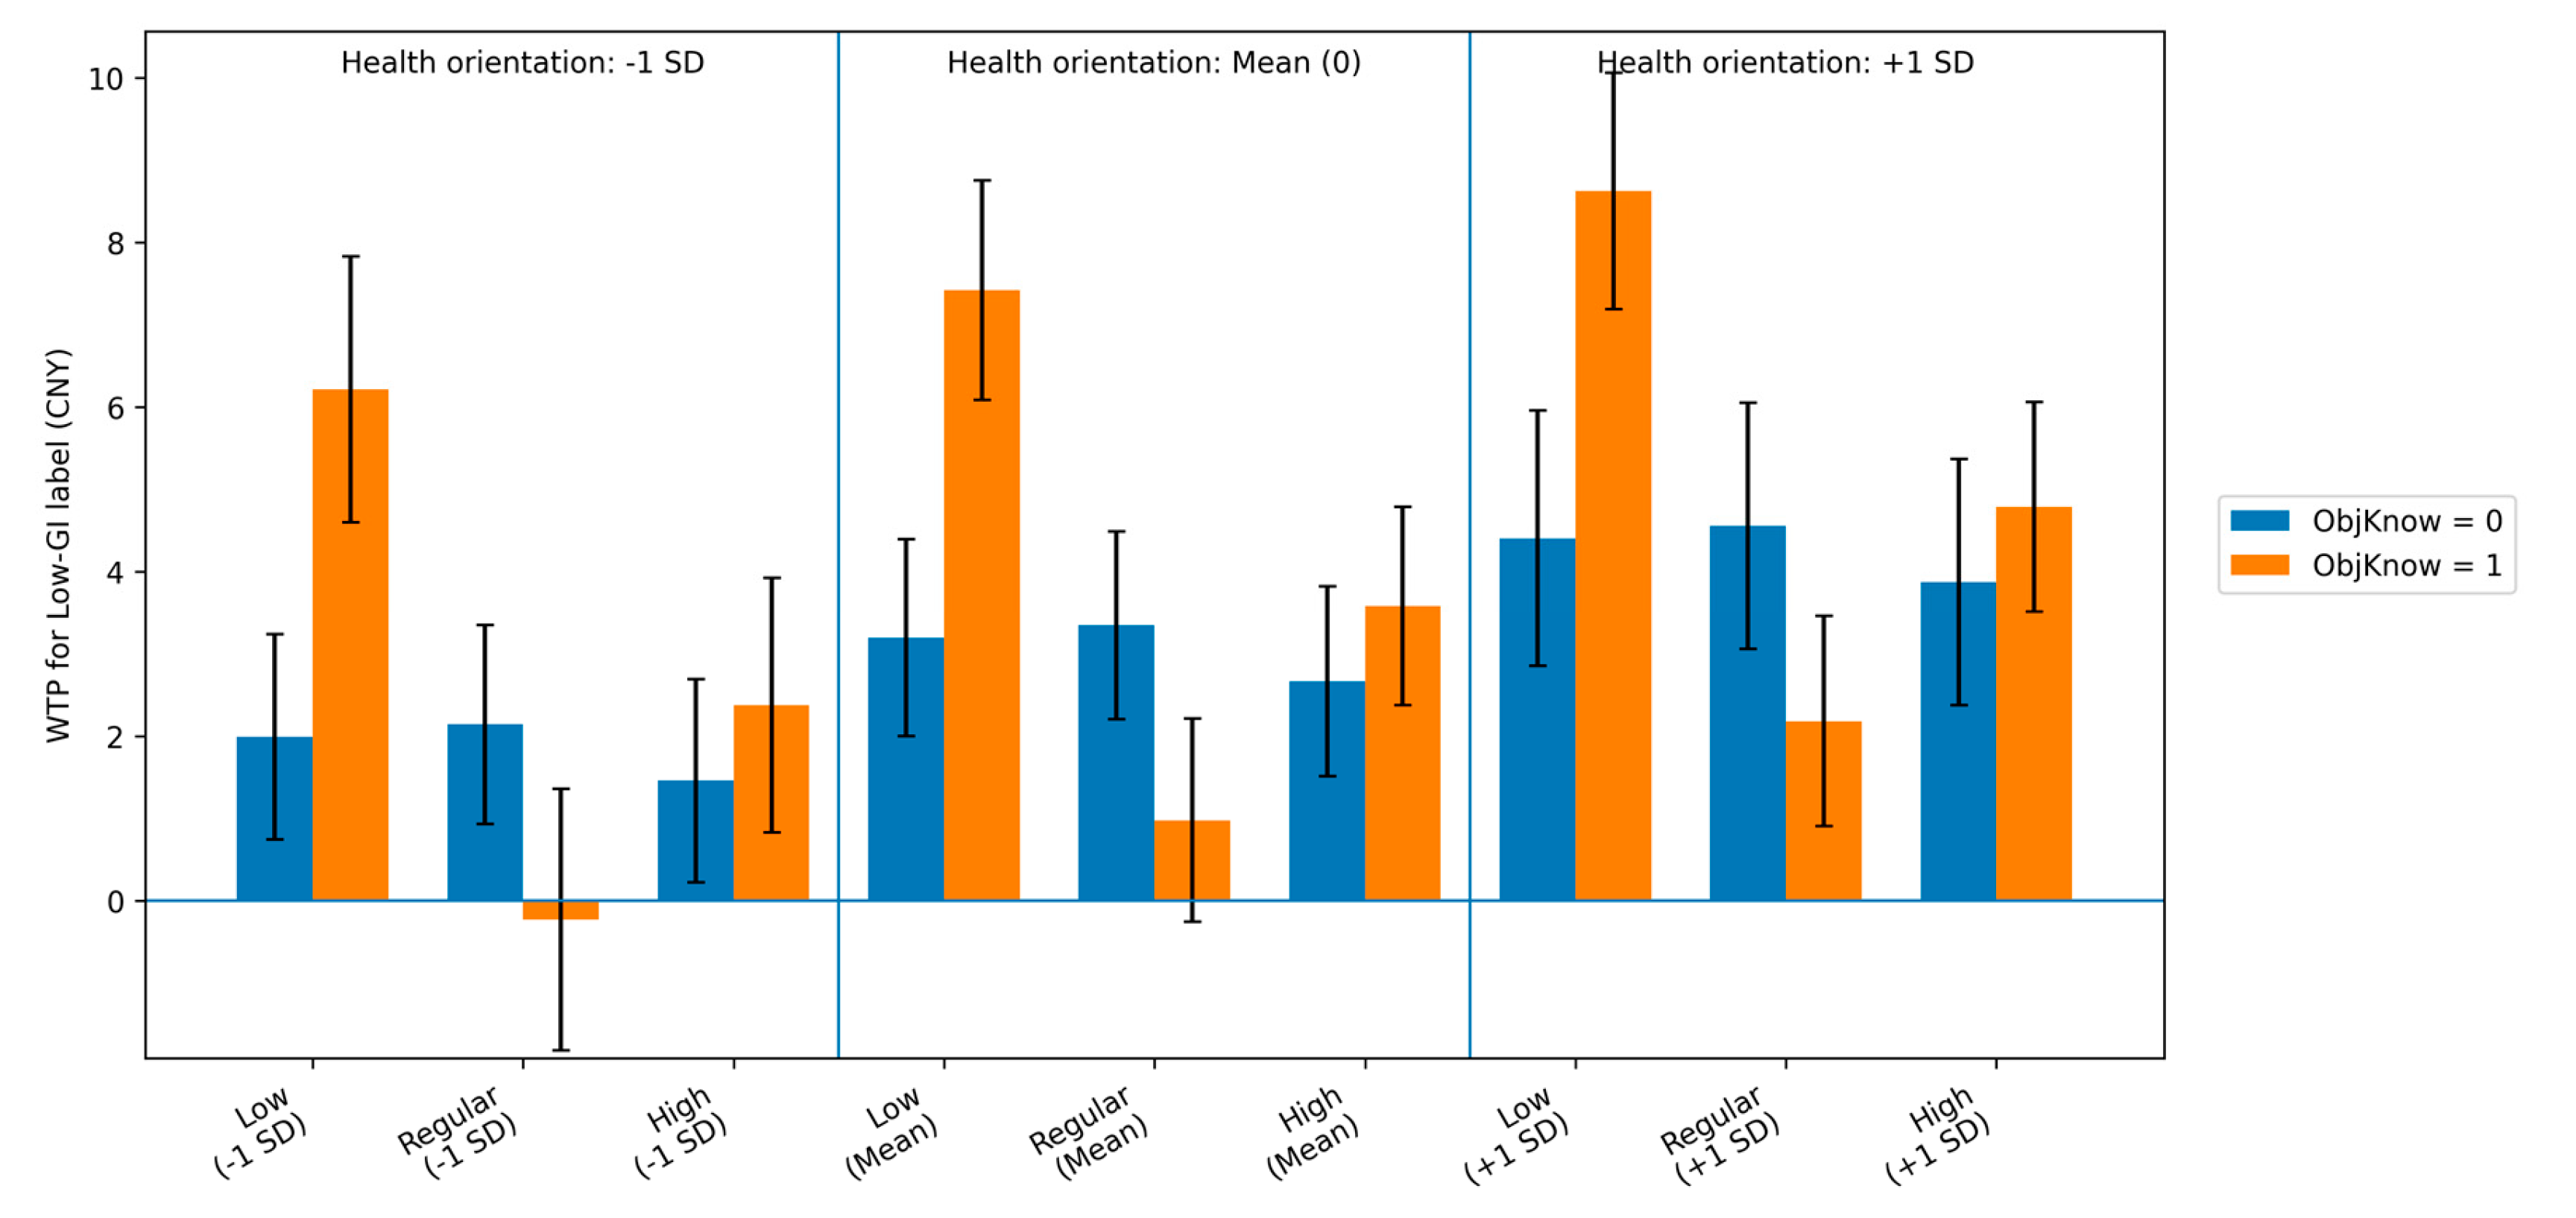

Table 1.
Attributes and levels used in the discrete choice experiment (DCE).
| Attribute | Levels | Unit / description |
| Low-GI label | Absent; Present | Front-of-pack label shown as an icon. In the questionnaire, the items were presented as follows: Prior to the DCE, respondents were shown the Low-GI logo and informed that it denotes a Low-GI label; no additional information about health benefits was provided. |
| Carbohydrate content | Low; Regular; High | Values per 100 g of yogurt (auxiliary numeric information). |
| Fat content | Skim; Low-fat; Whole-fat | Values per 100 g of yogurt (auxiliary numeric information). |
| Organic label | Absent; Present | Certification label shown as an icon. In the questionnaire, the items were presented as follows: Before the DCE began, we showed respondents this image and informed them that it represents an Organic label. |
| Price | 2; 4.5; 8 | CNY per 135 g serving. |
Notes: Approximate nutrition values were provided as auxiliary information on the choice cards to facilitate interpretation of the attribute profiles. Specifically, carbohydrate content was shown as Low (~6 g/100 g), Regular (~9 g/100 g), and High (~12 g/100 g), and fat content was shown as Skim (0 g/100 g), Low-fat (~3 g/100 g), and Whole-fat (~6 g/100 g). The attribute levels for price and nutritional content (carbohydrate and fat) were derived from a market survey of plain yogurt products on major Chinese e-commerce platforms to ensure market realism.
Table 2.
Sample characteristics and opt-out behavior (N = 910).
| Characteristic | Category | n | % |
| Gender | Male | 456 | 50.110 |
| Female | 454 | 49.890 | |
| Age | 18–25 | 267 | 29.341 |
| 26–35 | 197 | 21.648 | |
| 36–45 | 191 | 20.989 | |
| 46–55 | 185 | 20.330 | |
| 56–65 | 29 | 3.187 | |
| > 65 | 41 | 4.505 | |
| Education | Middle school or below | 147 | 16.154 |
| High school / Vocational school | 276 | 30.330 | |
| Associate degree | 254 | 27.912 | |
| Bachelor’s degree | 180 | 19.780 | |
| Master’s degree | 24 | 2.637 | |
| Doctoral degree | 13 | 1.429 | |
| Other / Prefer not to say | 16 | 1.758 | |
| Residence | Tier-1 city | 140 | 15.385 |
| New Tier-1 city | 134 | 14.725 | |
| Tier-2 city | 155 | 17.033 | |
| Tier-3 or below / County-level | 164 | 18.022 | |
| Town / Rural area | 162 | 17.802 | |
| Other regions | 155 | 17.033 | |
| Monthly Income (CNY) | < 5,000 | 488 | 53.626 |
| 5,000–9,999 | 235 | 25.824 | |
| 10,000–19,999 | 93 | 10.220 | |
| 20,000–29,999 | 34 | 3.736 | |
| 30,000–49,999 | 34 | 3.736 | |
| ≥ 50,000 | 13 | 1.429 | |
| Prefer not to say | 13 | 1.429 | |
| Purchase Frequency (past month) |
Never | 105 | 11.538 |
| Once | 250 | 27.473 | |
| 2–3 times | 471 | 51.758 | |
| ≥ 4 times | 84 | 9.231 | |
| Objective Low-GI knowledge | Selected the scientifically correct definition: a more gradual blood glucose rise given the same carbohydrate intake (ObjKnow=1) | 423 | 46.484 |
| Interpreted Low-GI as having lower carbohydrate or sugar content | 256 | 28.132 | |
| Interpreted Low-GI as involving less carbohydrate or sugar absorption by the body | 182 | 20.000 | |
| Reported not knowing the definition | 49 | 5.385 | |
| Mean | SD | ||
| Opt-out behavior | Opt-out rate | 0.074 | 0.134 |
| Health orientation | Index score | 4.201 | 1.510 |
| ObjKnow=1 | ObjKnow=1 (correct definition) | 0.465 | 0.499 |
Notes: Percentages are computed at the respondent level (N = 910). For the last two rows, columns report the mean and SD. Health orientation is the mean of three items on a 1–7 scale. Objective Low-GI knowledge was measured using a multiple-choice item; ObjKnow=1 indicates selecting the scientifically correct definition. Opt-out rate is computed across respondents (12 choice tasks each).
Table 3.
Mixed logit estimates for original-flavored yogurt choice.
| Variable | Model 1 | Model 2 | Model 3 |
| Panel A. Mean coefficients | |||
| ASC_buy | 1.859*** (0.051) |
1.907*** (0.054) |
1.900*** (0.054) |
| Price | -0.094*** (0.004) |
-0.094*** (0.005) |
-0.094*** (0.005) |
| Low-GI label | 0.331*** (0.028) |
0.192*** (0.050) |
0.313*** (0.053) |
| Organic label | 0.152*** (0.024) |
0.150*** (0.024) |
0.150*** (0.024) |
| Fat: skim | -0.193*** (0.026) |
-0.199*** (0.026) |
-0.202*** (0.026) |
| Fat: whole | -0.324*** (0.027) |
-0.327*** (0.027) |
-0.330*** (0.027) |
| Carb: low | 0.175*** (0.034) |
0.035 (0.044) |
0.030 (0.043) |
| Carb: high | -0.034 (0.033) |
-0.074* (0.045) |
-0.081* (0.044) |
| Low-GI × Carb: low | — | 0.271*** (0.058) |
-0.014 (0.070) |
| Low-GI × Carb: high | — | 0.068 (0.058) |
-0.064 (0.070) |
| Low-GI × Health orientation | — | 0.075*** (0.023) |
0.075*** (0.023) |
| Low-GI × Objective knowledge | — | 0.063 (0.059) |
-0.222*** (0.075) |
| ObjKnow × Low-GI × Carb: low | — | — | 0.617*** (0.086) |
| ObjKnow × Low-GI × Carb: high | — | — | 0.307*** (0.085) |
| Panel B. Standard deviations of random parameters | |||
| SD: Low-GI label | 0.181*** (0.032) |
0.056 (0.045) |
0.066 (0.044) |
| SD: Fat skim | 0.194*** (0.034) |
0.205*** (0.034) |
0.199*** (0.035) |
| SD: Fat whole | 0.208*** (0.035) |
0.195*** (0.036) |
0.185*** (0.037) |
| SD: Organic | 0.265*** (0.028) |
0.257*** (0.029) |
0.256*** (0.029) |
| SD: Carb low | 0.561*** (0.038) |
0.550*** (0.038) |
0.473*** (0.040) |
| SD: Carb high | 0.507*** (0.038) |
0.495*** (0.038) |
0.446*** (0.039) |
| Model fit statistics | |||
| Respondents | 910 | 910 | 910 |
| Choice tasks | 10,920 | 10,920 | 10,920 |
| Observations | 43,680 | 43,680 | 43,680 |
| Log likelihood | -13,539.629 | -13,519.872 | -13,494.501 |
| AIC | 27137.26 | 27105.74 | 27059.00 |
| BIC | 27389.11 | 27392.34 | 27362.96 |
Notes: Standard errors are in parentheses. * p < 0.10, ** p < 0.05, *** p < 0.01.
Table 4.
Willingness-to-pay for the Low-GI label across carbohydrate contexts.
| Carbohydrate context | ObjKnow = 0 WTP (SE) [95% CI] |
ObjKnow = 1 WTP (SE) [95% CI] |
| Health orientation = -1 SD | ||
| Regular | 2.140*** (0.619) [0.927, 3.353] |
-0.233 (0.810) [-1.821, 1.356] |
| Low carb | 1.991*** (0.637) [0.742, 3.240] |
6.212*** (0.825) [4.596, 7.829] |
| High carb | 1.459** (0.630) [0.225, 2.694] |
2.373*** (0.788) [0.827, 3.918] |
| Health orientation = Mean (0, centered) | ||
| Regular | 3.346*** (0.583) [2.204, 4.487] |
0.973 (0.630) [-0.262, 2.209] |
| Low carb | 3.197*** (0.610) [2.001, 4.393] |
7.418*** (0.682) [6.082, 8.754] |
| High carb | 2.665*** (0.589) [1.511, 3.819] |
3.579*** (0.616) [2.372, 4.785] |
| Health orientation = +1 SD | ||
| Regular | 4.552*** (0.763) [3.056, 6.048] |
2.179*** (0.652) [0.902, 3.457] |
| Low carb | 4.403*** (0.791) [2.852, 5.954] |
8.624*** (0.732) [7.189, 10.059] |
| High carb | 3.871*** (0.764) [2.375, 5.368] |
4.785*** (0.651) [3.509, 6.060] |
Notes: WTP is in CNY and computed as −ΔU/β_price (delta method). Standard errors are in parentheses below point estimates; brackets report 95% confidence intervals. * p < 0.10, ** p < 0.05, *** p < 0.01.
Disclaimer/Publisher’s Note: The statements, opinions and data contained in all publications are solely those of the individual author(s) and contributor(s) and not of MDPI and/or the editor(s). MDPI and/or the editor(s) disclaim responsibility for any injury to people or property resulting from any ideas, methods, instructions or products referred to in the content. |
© 2026 by the authors. Licensee MDPI, Basel, Switzerland. This article is an open access article distributed under the terms and conditions of the Creative Commons Attribution (CC BY) license (http://creativecommons.org/licenses/by/4.0/).
Copyright: This open access article is published under a Creative Commons CC BY 4.0 license, which permit the free download, distribution, and reuse, provided that the author and preprint are cited in any reuse.


