Submitted:
10 January 2026
Posted:
12 January 2026
You are already at the latest version
Abstract
In this article, Engineer Alberto Donini presents an innovative method, the “Relative Erosion Method” (REM), which he developed to determine the construction date of ancient structures. He applies this method to the two largest pyramids on the Giza Plateau—those of Akhet Khufu (“The Luminous Spirit of Khufu”) and Khafra—as well as to two of the three smaller Queens’ pyramids located next to the pyramid of Akhet Khufu. Is it possible that the current archaeological dating of these ancient Egyptian monuments is incorrect? Is it also possible that the alternative dates proposed by various researchers are likewise incorrect? To address these questions, the author analyses the pyramids of Giza from an unconventional perspective in order to determine the most probable period of their construction. The REM is based on the ratio between two types of erosion affecting the same type of rock in the same location: one with a known date and the other with a date to be determined. This ratio is then used to calculate the age of the stone block under examination.
Keywords:
absolute dating method
; pyramids of Giza
; pyramid of Khufu
; pyramid of Khafre
; ancient civilizations
; ancient Egypt
; method for dating ancient buildings
; new dating method based on relative erosion
; unknown civilizations
; age of the Pyramids of Giza
1. Official and Alternative Theories on the Period of Construction of the Pyramids of Giza
From Wikipedia: “According to Egyptologists, the Great Pyramid was built in the 26th century B.C. Although there is no unanimous agreement on the exact date of completion, the most widely accepted estimate is around 2560 B.C. However, radiocarbon dating carried out in 2020 at the University of Aberdeen on a cedar wood wedge found at the base of the ‘Queen’s Chamber’ dates it to 3341 B.C. This result contradicts these conjectures and potentially pushes the construction date back by at least five to seven centuries, making it impossible for the pyramid to have been built by the well-known pharaoh to whom it is traditionally attributed, or even by his predecessors from earlier dynasties, predating not only the Old Kingdom but possibly even the Predynastic Period (generally considered to begin around 3100 B.C.), thus leaving the question largely unresolved”.
Despite the inconsistency with the dates obtained through C-14 testing, the absence of reliable contemporary sources or corroborating works, and the lack of a coffin, the pyramid is generally attributed to Pharaoh Cheops (the Hellenised name of Khufu) and is associated with the Pyramid of Khafre, the Great Sphinx, and the Pyramid of Menkaure.
Official theories therefore date the construction of the entire Giza complex to around 2560 B.C.”
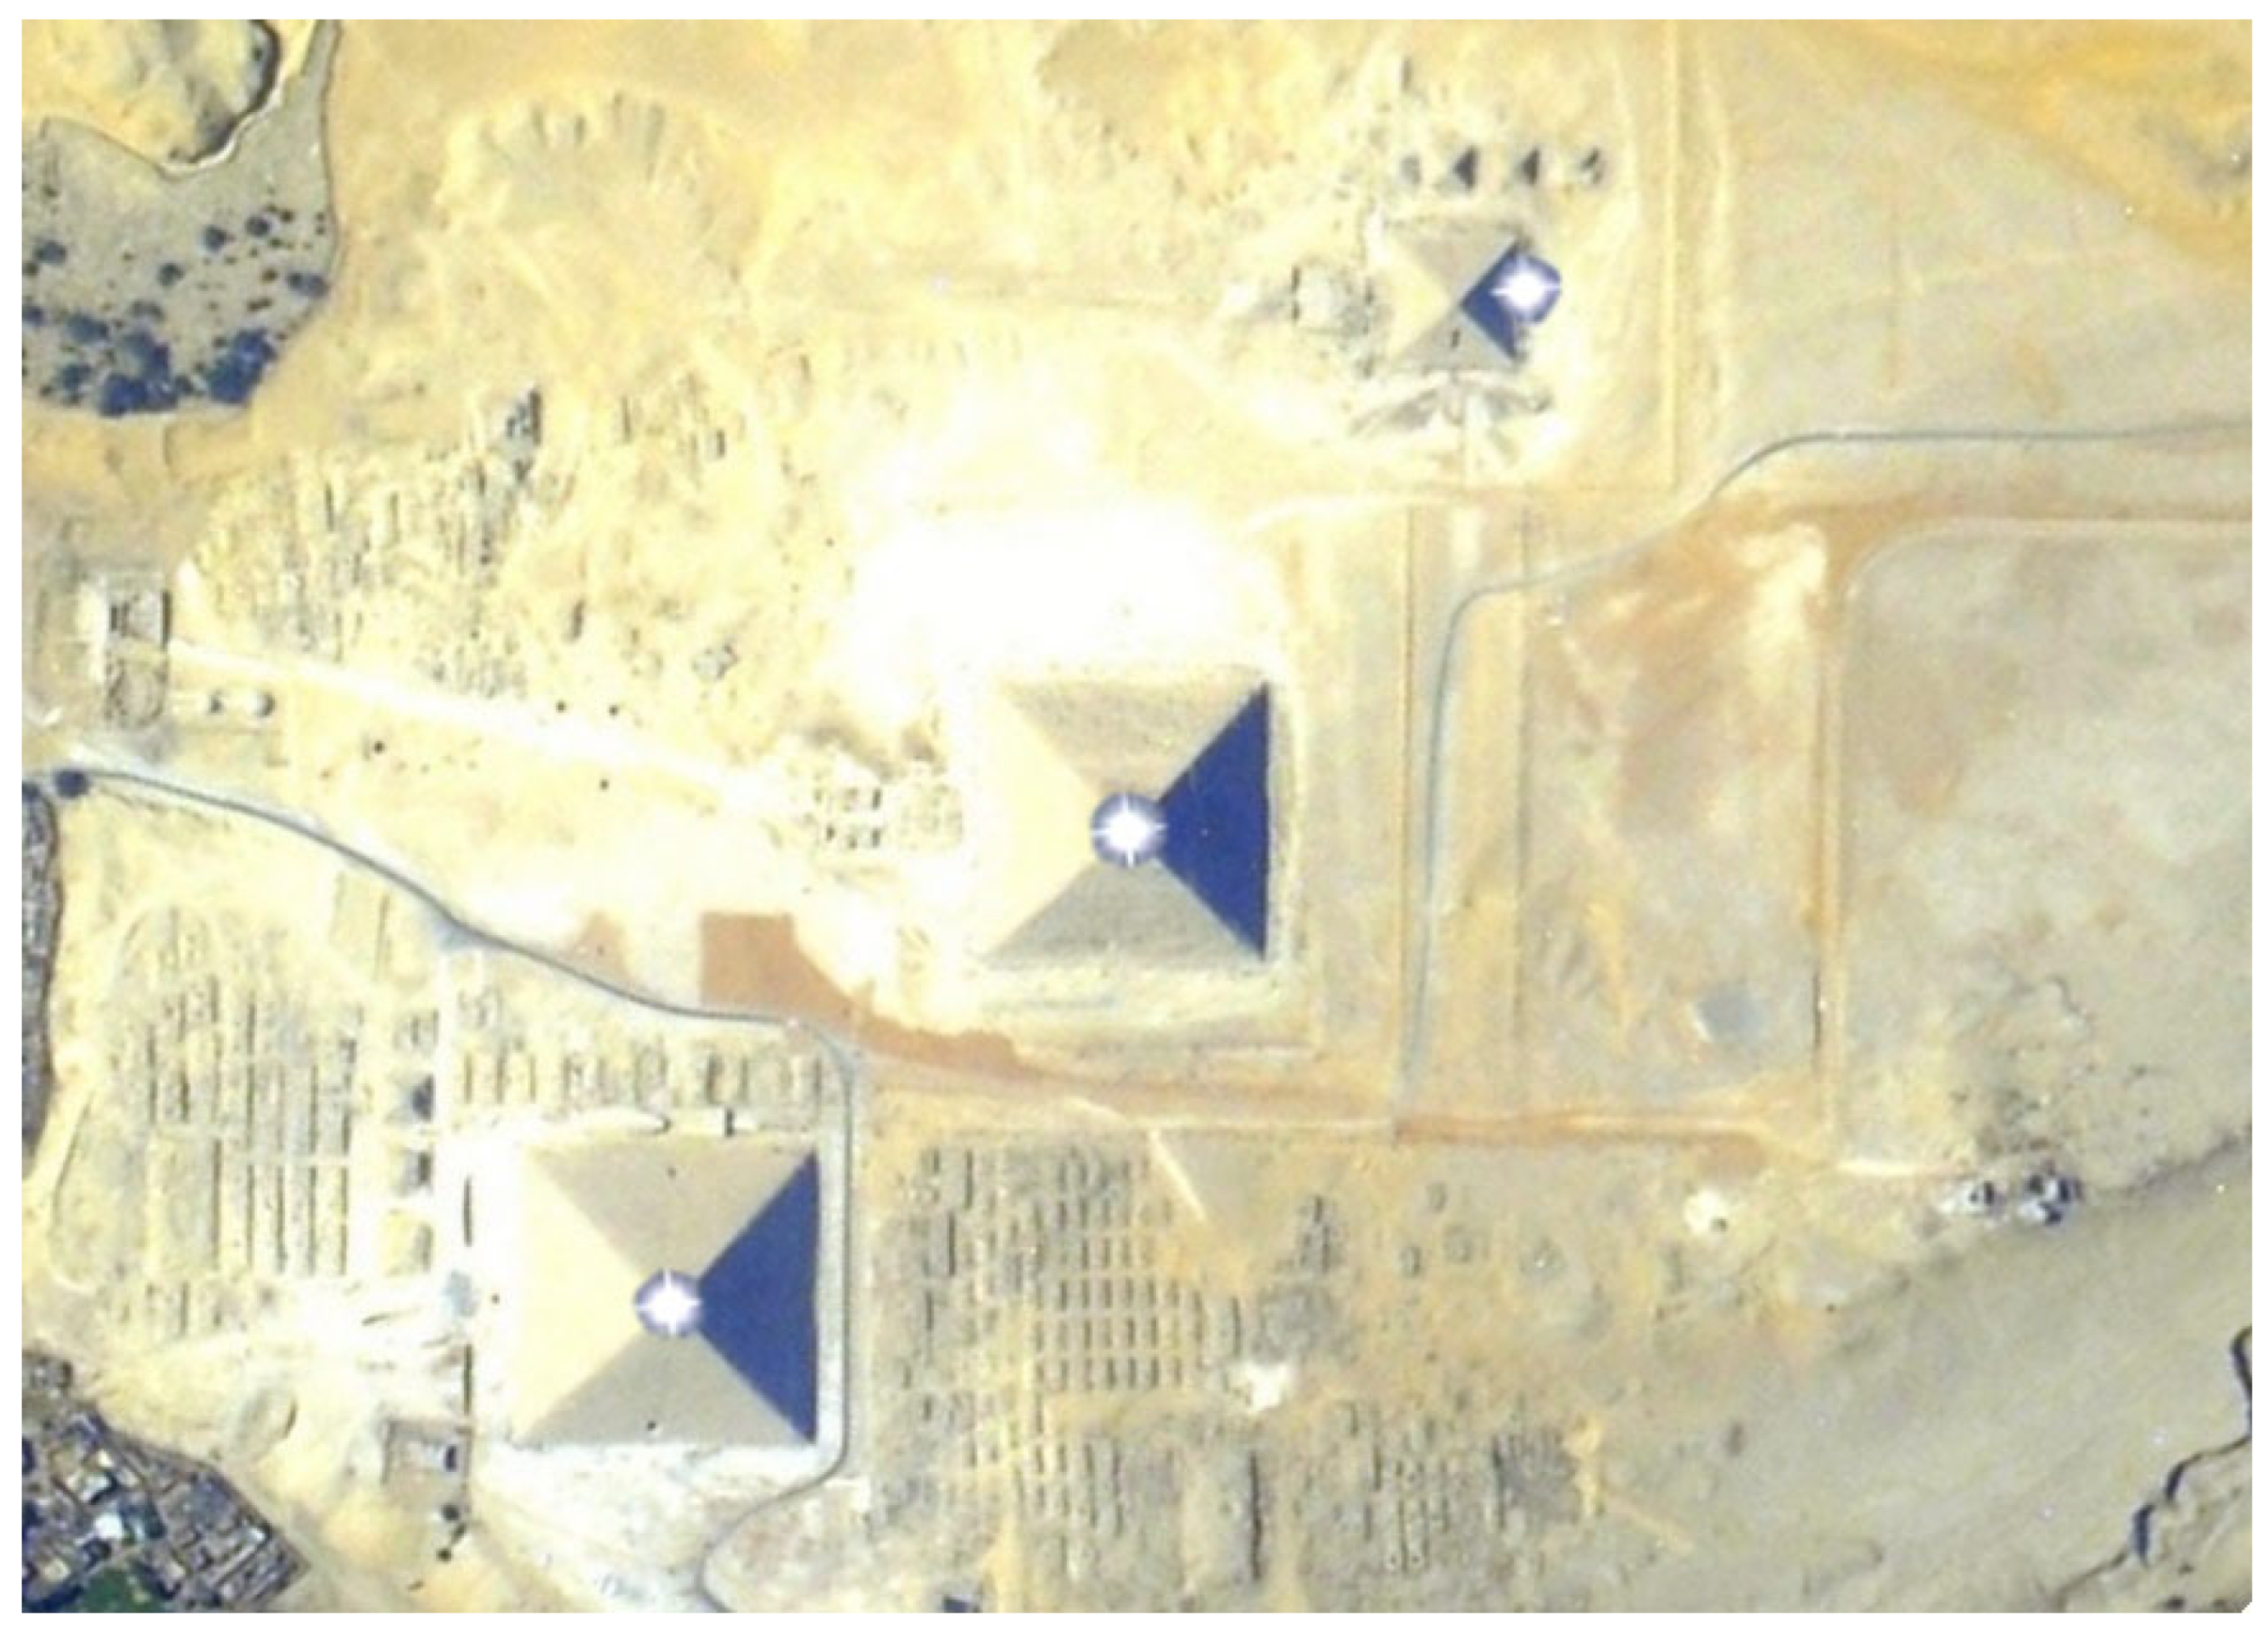
Figure 1.
The Giza Plateau with its famous pyramids. (*)Note: the small numbers in red and green refer to the sources and references listed on page 34.
Figure 1.
The Giza Plateau with its famous pyramids. (*)Note: the small numbers in red and green refer to the sources and references listed on page 34.
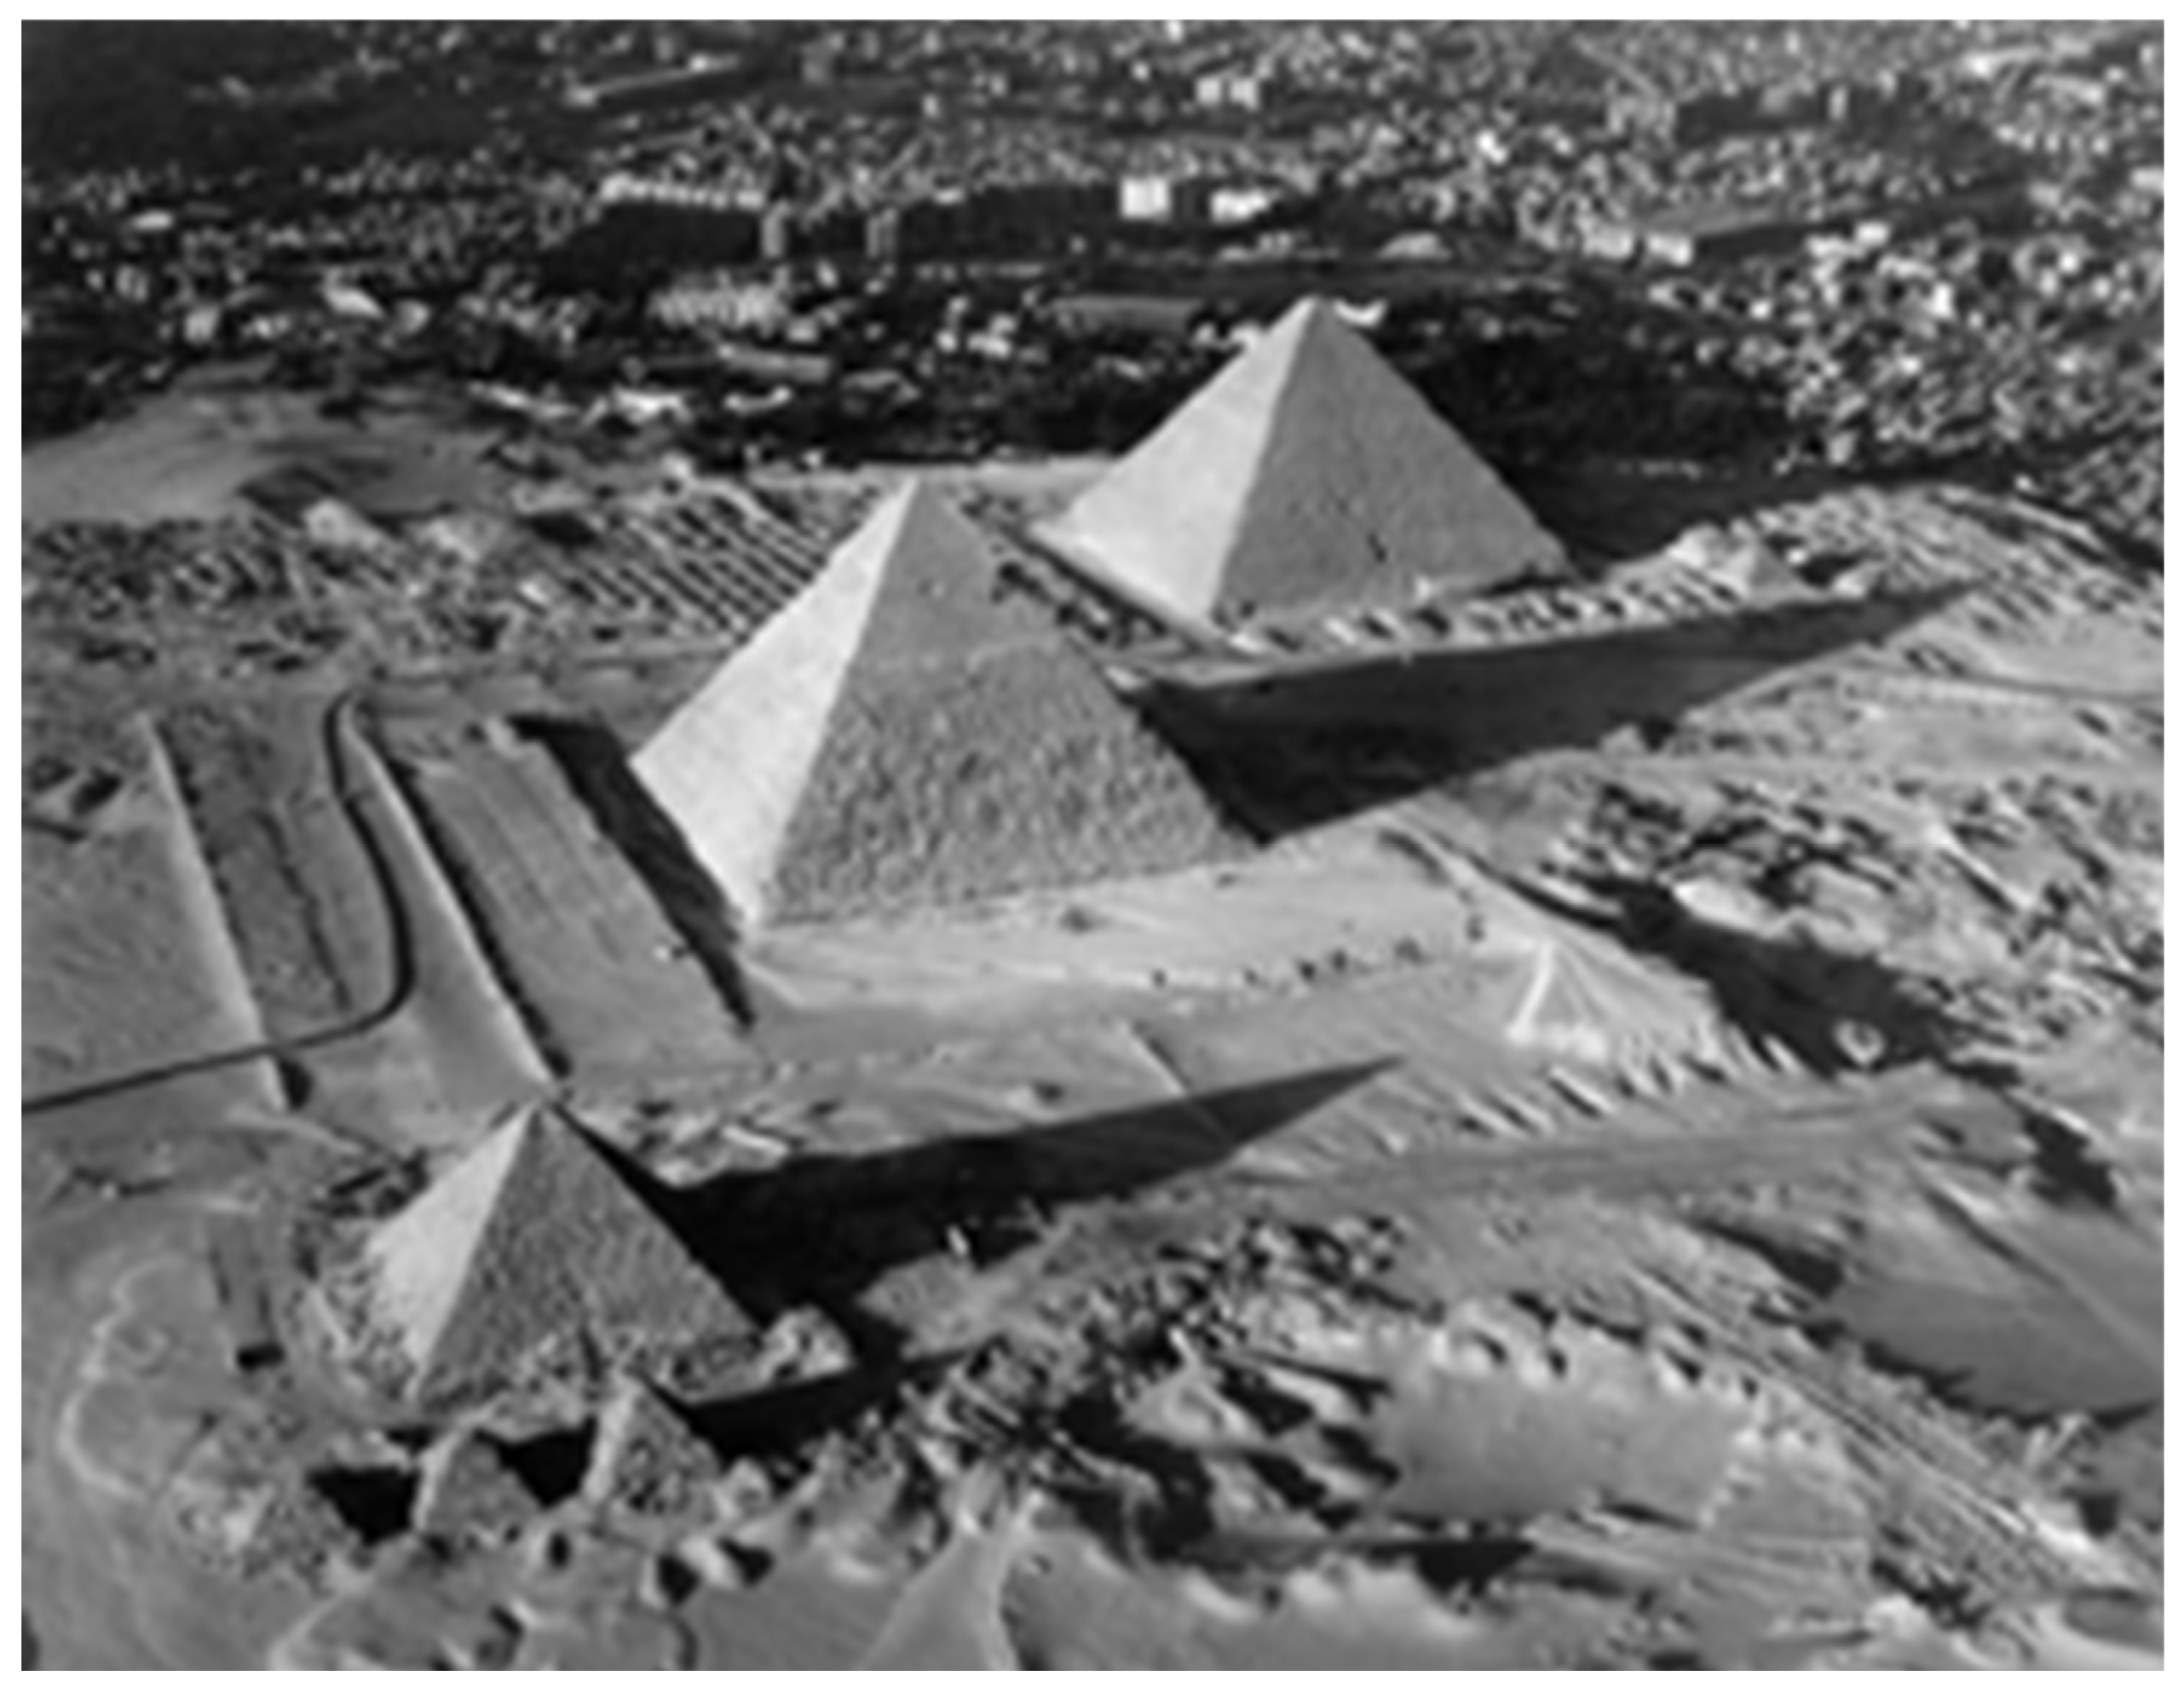
Figure 2.
Overlay of the vertices of the three pyramids of Giza with the three stars of Orion’s Belt. Note that the apex of the Menkaure pyramid is shifted relative to the star it is supposed to represent.
Figure 2.
Overlay of the vertices of the three pyramids of Giza with the three stars of Orion’s Belt. Note that the apex of the Menkaure pyramid is shifted relative to the star it is supposed to represent.
Another well-known hypothesis concerns the correlation between the layout of the three main pyramids of the Giza Necropolis and the three central stars of the Orion constellation (Orion’s Belt). This theory was first proposed in 1989 and later popularised by the book Orion’s Mystery by Robert Bauval and Adrian Gilbert in 1994 [1]
According to this hypothesis, the three pyramids of Cheops, Chephren, and Menkaure were constructed to replicate the spatial arrangement of the stars Alnitak, Alnilam, and Mintaka in Orion’s Belt. Proponents of this theory argue that the positions of the pyramids accurately reproduce the orientation of these stars as they would have appeared around 10,500 B.C.
However, the angle formed by the lines connecting the three stars of Orion’s Belt is approximately 6 degrees, whereas the angle formed by the lines connecting the vertices of the three pyramids of Giza is about 12 degrees – twice as large. Consequently, the builders, often praised for their exceptional precision, would have miscalculated the position of the Menkaure (or Menkaura) pyramid by approximately 60 metres.
According to another alternative theory, proposed by Armando Mei in his book 36,400 B.C. - The Secret of the Gods [2], the construction date should instead correspond to a precessional period [4] earlier than 10,500 B.C., specifically around 36,400 B.C. In this view, the pyramids would be the legacy of a lost and technologically advanced civilisation and would date back to the Zep Tepi, or “beginning of time” [5].
2. Brief Illustration of the ‘Relative Erosion Method’ (REM)
In order to obtain a correct order of magnitude for the construction period of ancient buildings, and in particular for the pyramids of Giza, I conceived the “Relative Erosion Method” (REM).
The idea is as follows: since some of the casing stones of the pyramids of Giza collapsed during catastrophic events, and since the time of their collapse and removal is known (on average, about 675 years ago the limestone casing of the pyramids was removed and reused to construct several buildings in Cairo), I measured the surface erosion of the stones that had been covered by the casing and compared it with that of the adjacent stones, which have remained exposed to atmospheric agents since they were laid at the time of the construction of the monument. The volume of disintegrated material should be proportional to the duration of exposure to erosive processes. From the ratio between these two types of erosion, it is therefore possible to calculate a plausible construction date for the structure.
3. Main Causes of Erosion
The principal agents of rock erosion are:
- −
- Water: surface runoff and freeze–thaw processes (water freezes in cracks, expands, and fractures the rock).
- −
- Wind: transports sand and dust, progressively abrading rock surfaces (aeolian erosion).
- −
- Temperature: thermal expansion and contraction caused by temperature fluctuations lead to rock fragmentation.
- −
- Gravity: induces landslides, collapses, and rockfalls, causing debris to move downslope.
- −
- Water and gas: slightly acidic rainwater (containing dissolved carbon dioxide) reacts chemically with rock minerals, dissolving them or transforming them into more friable compounds.
- −
- Acids: acid rain, often related to pollution, accelerates corrosion, particularly in carbonate rocks such as limestone.
- −
- Living organisms: plant roots penetrating cracks, lichens, burrowing animals, and acid-producing microorganisms contribute to rock disintegration (biological erosion).
- −
- Salt crystallisation: salts dissolved in water crystallise as evaporation occurs, generating pressure within cracks and causing the rock to fracture; this is especially common in coastal and arid environments.
- −
- Human activity: the passage of people, causing wear of pavements and stone surfaces through abrasion.
4. Morphology of Eroded Rocks
Pitting erosion
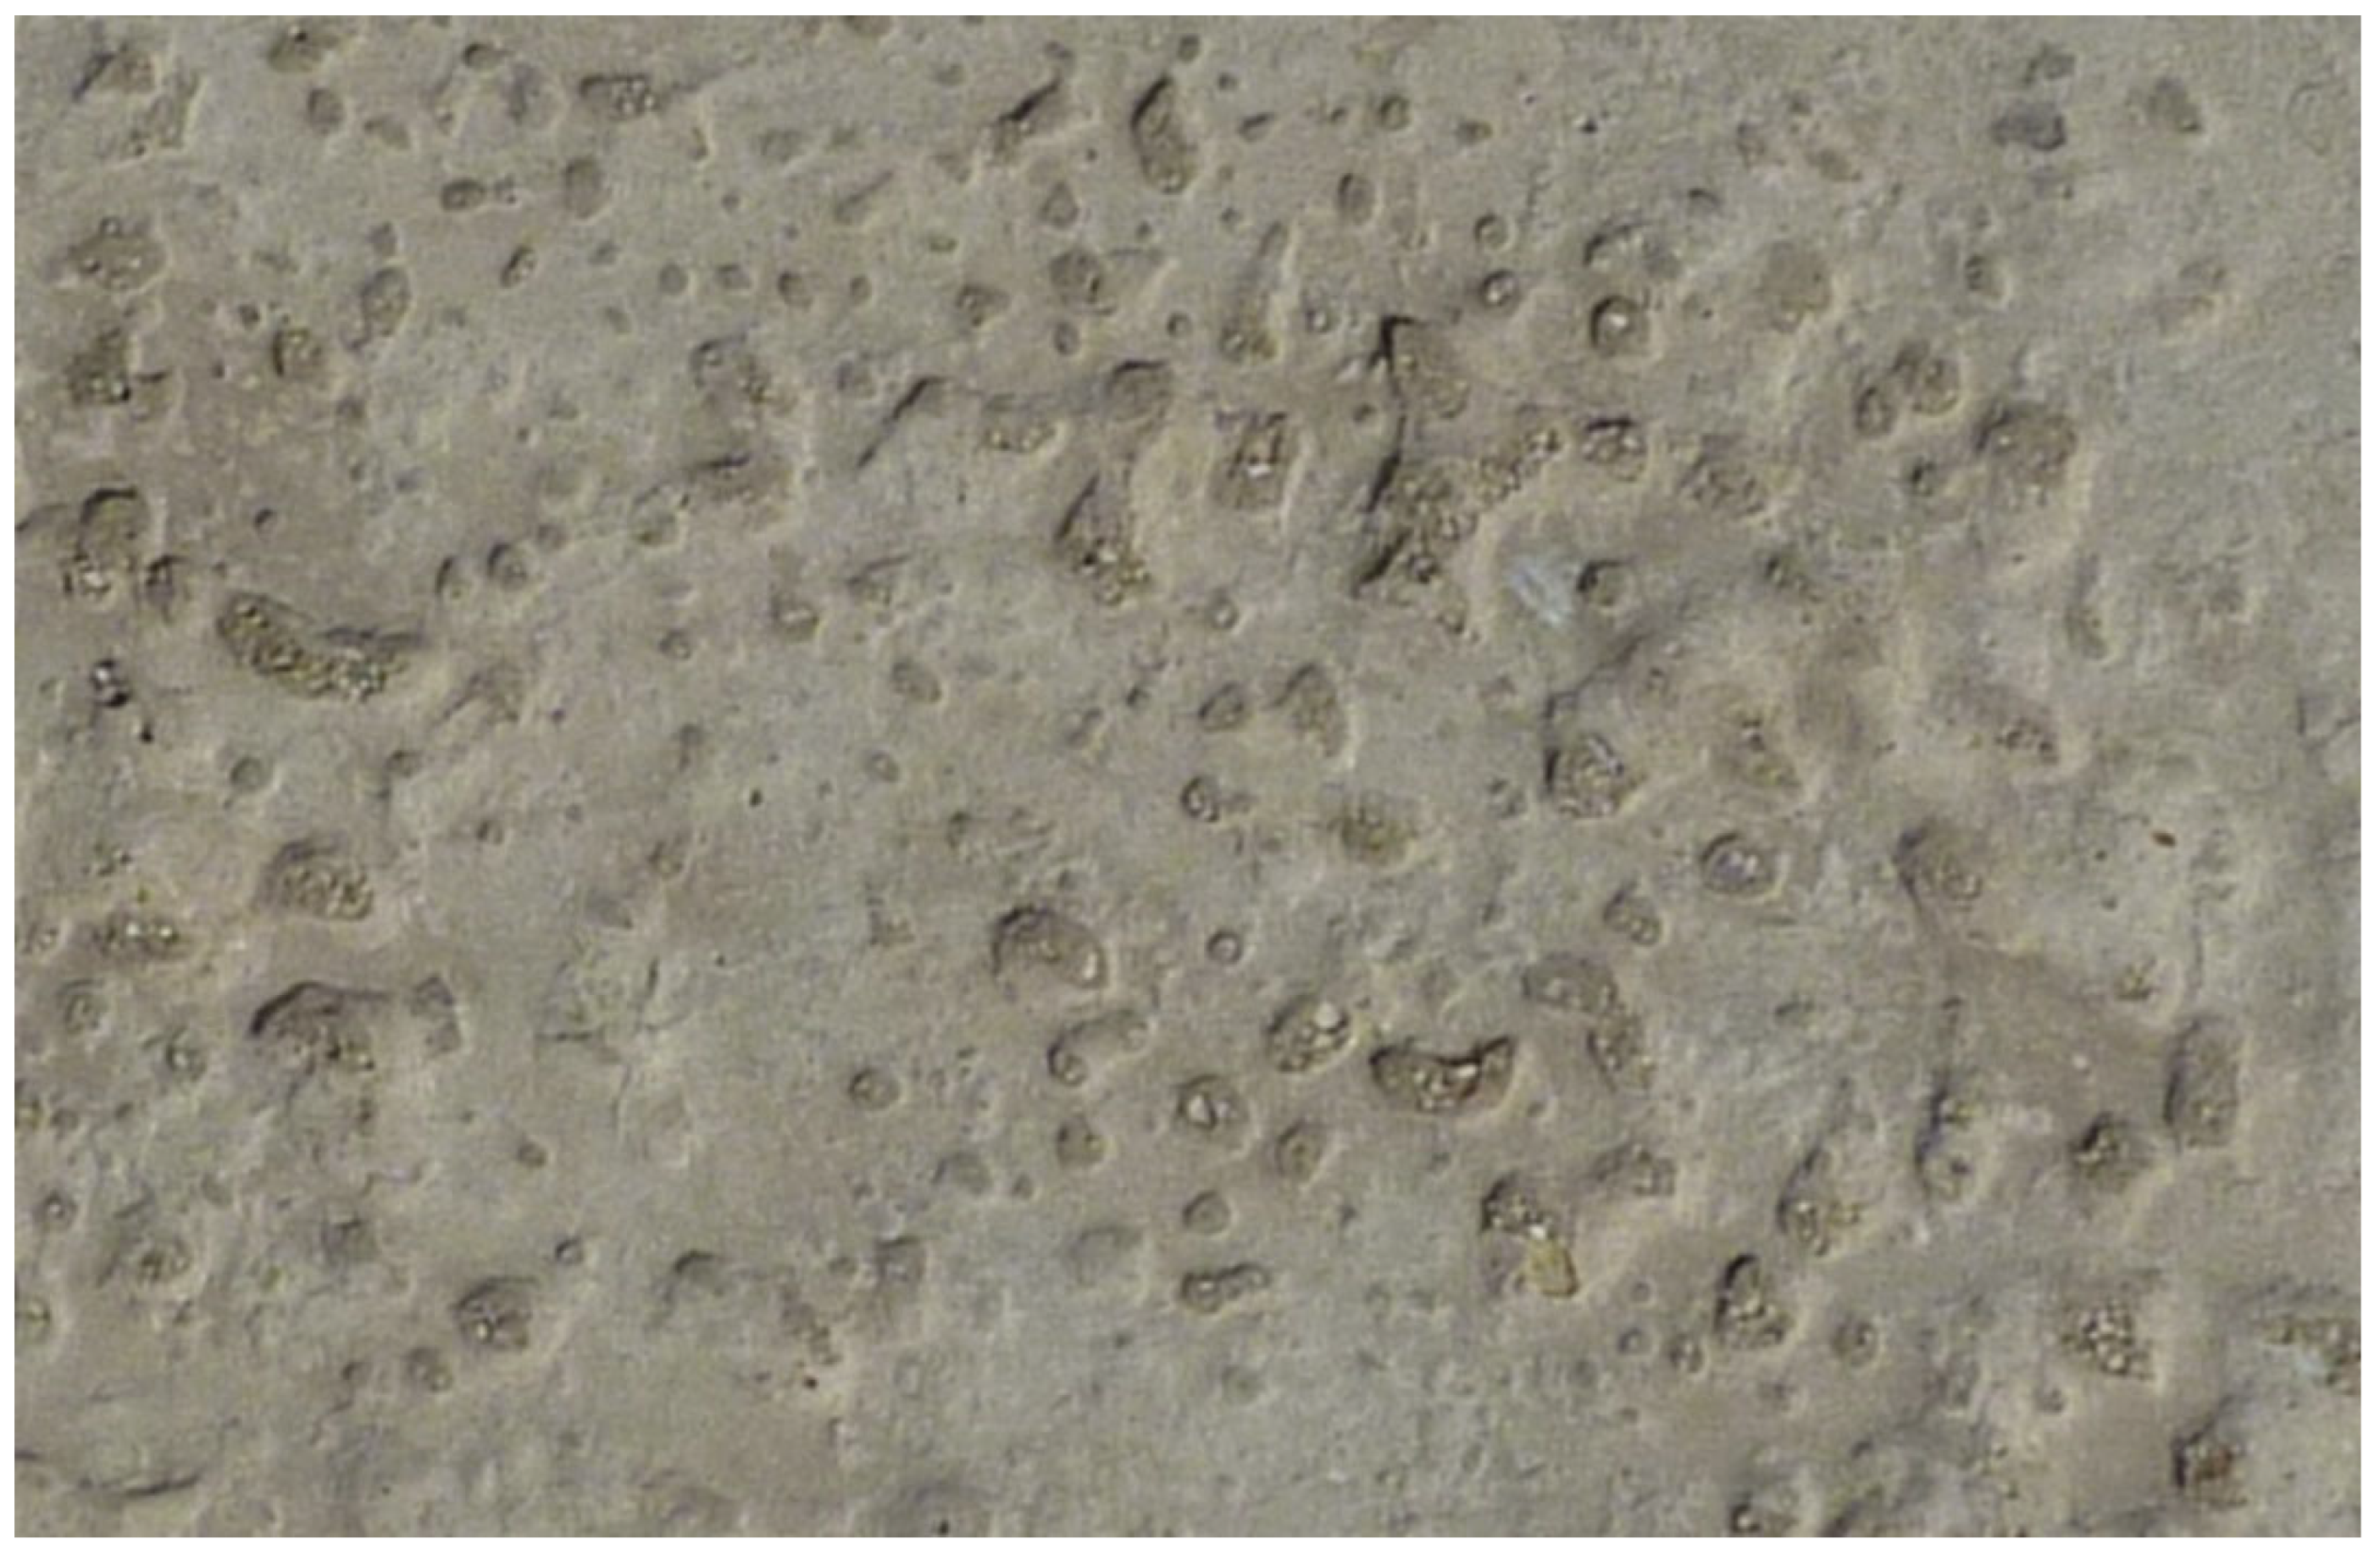
Pitting erosion (or pitting) in rock is a form of point-like degradation that produces small cavities or blind holes on the surface. It is caused primarily by chemical agents (such as salts or acids) and physical agents (including freeze–thaw cycles and plant root action), and is often promoted by the presence of water and dissolved salts. This process typically manifests as clusters of closely spaced holes that can progressively deepen, leading to significant deterioration of the stone material. Pitting erosion represents a type of localized corrosion that affects specific points on the surface, resulting in material loss, and is commonly observed in exposed marble, sandstone, and limestone, particularly in coastal or humid environments.
Figure 3.
Pitting erosion on limestone rock.
Uniform erosion
This type of erosion manifests as a smooth or polished surface, or, in some cases, as a layered appearance of the eroded or worn rock.
Figure 4.
Uniform erosion on limestone rock.
5. Erosion Rate “k”
Rock erosion is directly proportional to the time elapsed when the process occurs at a constant rate, according to the mathematical relationship
In geology and geomorphology, when exogenous agents (such as rainfall, wind, or temperature variations) act with constant intensity, the amount of material removed increases linearly with time. This relationship is expressed by an equation in which k represents the “erosion rate” or proportionality constant:
in which k represents the “erosion rate” or proportionality constant. This k constant is not universal but depends strictly on the physical properties of the rock and on the climatic context. The main influencing factors include:
- Mineral hardness: for example, rocks such as granite exhibit very low erosion rates.
- Climate: for instance, an increase in the frequency or intensity of precipitation leads to an increase in the value of k
- Exposure: the exposure of the rock surface and its orientation significantly influence the rate of erosion.
- Interpretation of the linear model: if the data are plotted on a Cartesian graph with time t on the x-axis and erosion on the y-axis, a straight line originating at the origin is obtained. The slope of this line is determined by the coefficient k. A steeper slope indicates a faster and more aggressive erosion process over time.
The degradation of a rock is therefore directly proportional to time when the erosion rate k remains constant, resulting in a linear increase in the mass or thickness of material removed, as expressed by the formula
6. Time of Demolition of the Outer Cladding of the Pyramids of Giza
Herodotus, in his Histories (Book II) (circa 450 B.C.), describes the Pyramid of Cheops (Khufu) as being covered with smooth limestone slabs that made it shine.
Diodorus Siculus, who lived shortly after the beginning of the Christian era, wrote in his Bibliotheca Historica that the polished white limestone cladding of the Great Pyramid of Cheops was still intact and in perfect condition, with smooth slabs extending down to ground level. The cladding stones were described as “complete and without the slightest decay.”
The 13th-century Arab historian Abd al-Latif al-Baghdadi wrote in his works, such as Kitab al-ifada wa al-i‘tibar (Book of the Useful and the Instructive), that the polished white limestone cladding of the Great Pyramid of Cheops was engraved with inscriptions. He described the pyramids as being covered with finely worked white limestone that shone in the sunlight, bearing engraved inscriptions.
The earthquake of Crete on 8 August 1303, an event of approximately magnitude 8.0 with its epicentre between Crete and Rhodes, also affected Cairo and Alexandria in Egypt, causing severe damage and generating a tsunami that devastated the coasts. The seismic tremors loosened and caused some of the white limestone blocks forming the smooth cladding of the pyramids to fall. Several cladding stones broke, and the local population reused these fallen stones as raw material for rebuilding Cairo.
The Mamluk sultan Al-Nasir Hasan (1334–1361) subsequently initiated the systematic removal of the facing stones of the Giza pyramids, using them as building material for palaces and for the decoration of mosques in Cairo.
There is evidence that by the reign of Sultan Barkuk (1382–1399 AD), the pyramids had already been stripped of most of their limestone cladding.
At present, only a few original casing blocks remain: at the base of the Pyramid of Khufu and near the summit of the Pyramid of Khafra.
Thus, the limestone cladding of the Giza pyramids was removed and reused as quarry stone from approximately 1303 to 1400 AD and beyond. On average, therefore, the casing blocks of the Giza pyramids were removed about 675 years ago (as of 2025 AD) and used in the reconstruction of Cairo.
7. Basic Principles of the “REM” Method and Uncertainty Factors
1) I assume linear erosion, i.e. erosion progressing proportionally with elapsed time, and therefore a constant erosion rate k. In other words, the volume of rock removed is assumed to be linearly proportional to the time of exposure to erosive agents. An analysis of the possible causes of erosion shows that this assumption may not be strictly accurate. For example, when erosion creates a small hollow, wind erosion or sand abrasion tends to be less intense at the bottom of the hollow than on the more exposed, uneroded parts of the rock, whereas water erosion, salt crystallisation, or acid rain may be more effective in the hollow. Erosion also varies locally depending on rock morphology, exposure to atmospheric agents, and chemical impurities within the rock. These sources of uncertainty are taken into account in the statistical calculation method.
2) I assume the average date of removal of the limestone casing stones of the Giza pyramids to be approximately 675 years ago. The first casing stones to be removed were those at the base of the pyramids, which are of primary interest for this analysis, followed later by those at higher levels. Clearly, the fall of upper stones onto the base could have caused damage, scratching, or partial removal of material. However, such macroscopic breakages are easily identifiable, and the points selected for analysis appear to have been affected by gradual wear and erosion due to atmospheric or chemical agents, rather than by mechanical breakage.
3) One cause of wear and erosion of the paving is foot traffic. In modern times, thousands of visitors walk on these surfaces every day. Although reliable data for earlier periods are unavailable, foot traffic was most likely far less intense in the past. Consequently, erosion caused by pedestrian activity in recent centuries may have been significantly greater than in ancient times. This factor introduces a variation in the erosion rate k and may lead to an underestimation of the age of the structure.
4) A wetter climate in ancient times, compared to the extremely arid climate of recent centuries, represents another source of uncertainty and may have led to an overestimation of the age of the building.
5) Acid rain, which is essentially a modern phenomenon, may have increased erosion rates in recent times relative to earlier periods, causing a variation in k and potentially leading to an underestimation of the age of the structure to which the method is applied.
6) Measuring average erosion at different points proved challenging, as the rock exhibited substantial variability even within the same block. This factor must therefore be accounted for by adopting a wide tolerance range in the calculated values.
7) An additional source of uncertainty is whether the rock surfaces on which erosion measurements were taken were covered by other rocks or by sand at various times in the past, which would have reduced the effectiveness of the erosive agents considered. Such coverage may have occurred during the dismantling of the limestone casing of the pyramids, i.e. in relatively recent times, but could also have taken place in much earlier periods. For example, the body of the Sphinx was buried under desert sand for many centuries. Similarly, the slopes and contours at the base of the pyramids may have been partially covered for centuries or even millennia.
8) For greater accuracy, erosion should ideally be measured at two different points on the same stone block, assuming substantial constancy or only slow and continuous variation in the physical and chemical properties of the stone subjected to SEM analysis. Relative erosion was measured on the same limestone block at all analysed points, except for points 23 and 24, which relate to the Khafra quarry and the Pyramid of Khafra. In this case, erosion may differ because of the different resistance to weathering of the two rock bodies analysed. Some of the stones used to construct the Pyramid of Khafra were extracted from the nearby quarry, leaving the quarry surface exposed immediately after extraction. Consequently, the surface of the Khafra quarry has been eroding since the time the blocks were removed for pyramid construction. For this reason, both the average erosion of the quarry surface and the average erosion of the limestone blocks of the Pyramid of Khafra were measured. As expected, erosion at the base of the quarry is significantly greater than that observed on the limestone blocks of the pyramid, whose upper surfaces have been exposed to atmospheric agents for approximately 675 years. This difference can be incorporated into the calculation of the age of the Pyramid of Khafra. All blocks on which erosion measurements were performed occupy the same horizontal position (at least originally), that is, they share the same orientation of the rock surface.
9) REM uses the ratio between two types of erosion affecting the same type of rock in the same location—one with a known exposure time and the other with an exposure time to be determined—to calculate the age of the block in question, assuming that the rock surface was initially smooth and un-eroded. In this way, the specific form or mechanism of erosion can be disregarded. Indeed, even if the dominant erosion process were chemical, for example due to dew infiltrating the pores of limestone by capillary action and, upon evaporation, leaving behind crystallising minerals capable of detaching small fragments of rock, this type of erosion—as well as erosion caused by wind, rain, or the trampling of visitors—should be distributed equally over adjacent areas of the same block. It is highly unlikely that dew would form 10 cm to the right but not 10 cm to the left, that wind would erode one side of the same block but not the other at such a small distance, or that rain and foot traffic would selectively affect only one portion of the block. Therefore, regardless of the specific erosive agent responsible for the degradation of the rock, the ratio between the erosion accumulated since the block was initially laid and the erosion accumulated since a known date (675 years ago in the case of the Giza pyramids), measured on the same block, provides a value proportional to the age of the structure under investigation. All these considerations, of course, are subject to the uncertainty factors listed in this chapter.
10) Given the presence of several imponderable factors in the REM that may have altered the erosion rate k over time, I consider the calculated results to be indicative only of the order of magnitude of the construction period, rather than of a precise date. The numerous variables involved may act either in the same direction or in opposition to one another. This implies that, at some of the analysed points, the calculated date may be significantly overestimated or underestimated (when the uncertainty factors act in concert). At other points, however, a correct order of magnitude is obtained (when the uncertainty factors act in opposition and partially cancel each other out). Consequently, a wide variability in the results between individual measurement points is to be expected. The arithmetic mean of a large number of analysed points significantly reduces this error. REM therefore does not provide an exact age, but rather indicates the order of magnitude of the construction period of a building. I also performed a statistical analysis, limited to the two largest pyramids, by determining the standard deviation of each measured value and constructing a Gaussian curve to estimate the probability that the construction date falls within a given time interval. Rather than identifying a precise date, REM is thus useful for determining the order of magnitude of the construction age of a structure with an associated probability.
8. Criteria for Selecting the Analysed Points
The points analysed using SEM were selected in such a way as to allow a direct and close comparison—preferably within the same stone block—between the erosion experienced by the rock since the time of the pyramid’s construction and the erosion experienced by the rock since a specific, known date. Where no points were selected on certain sides of the pyramid bases, this was due solely to the impossibility of performing reliable measurements in those areas. Two additional points were selected within the Khafra quarry, and the ratio between their erosion and that of the upper (horizontal) surface of the corresponding and nearest pyramid blocks was measured. In this case, the comparison does not involve the same stone block, but rather two different limestone surfaces, likely of similar composition, both originating from the Khafra quarry. Nevertheless, I consider this comparison to be meaningful and relevant for the dating of the Pyramid of Khafra.
9. The Points Analysed
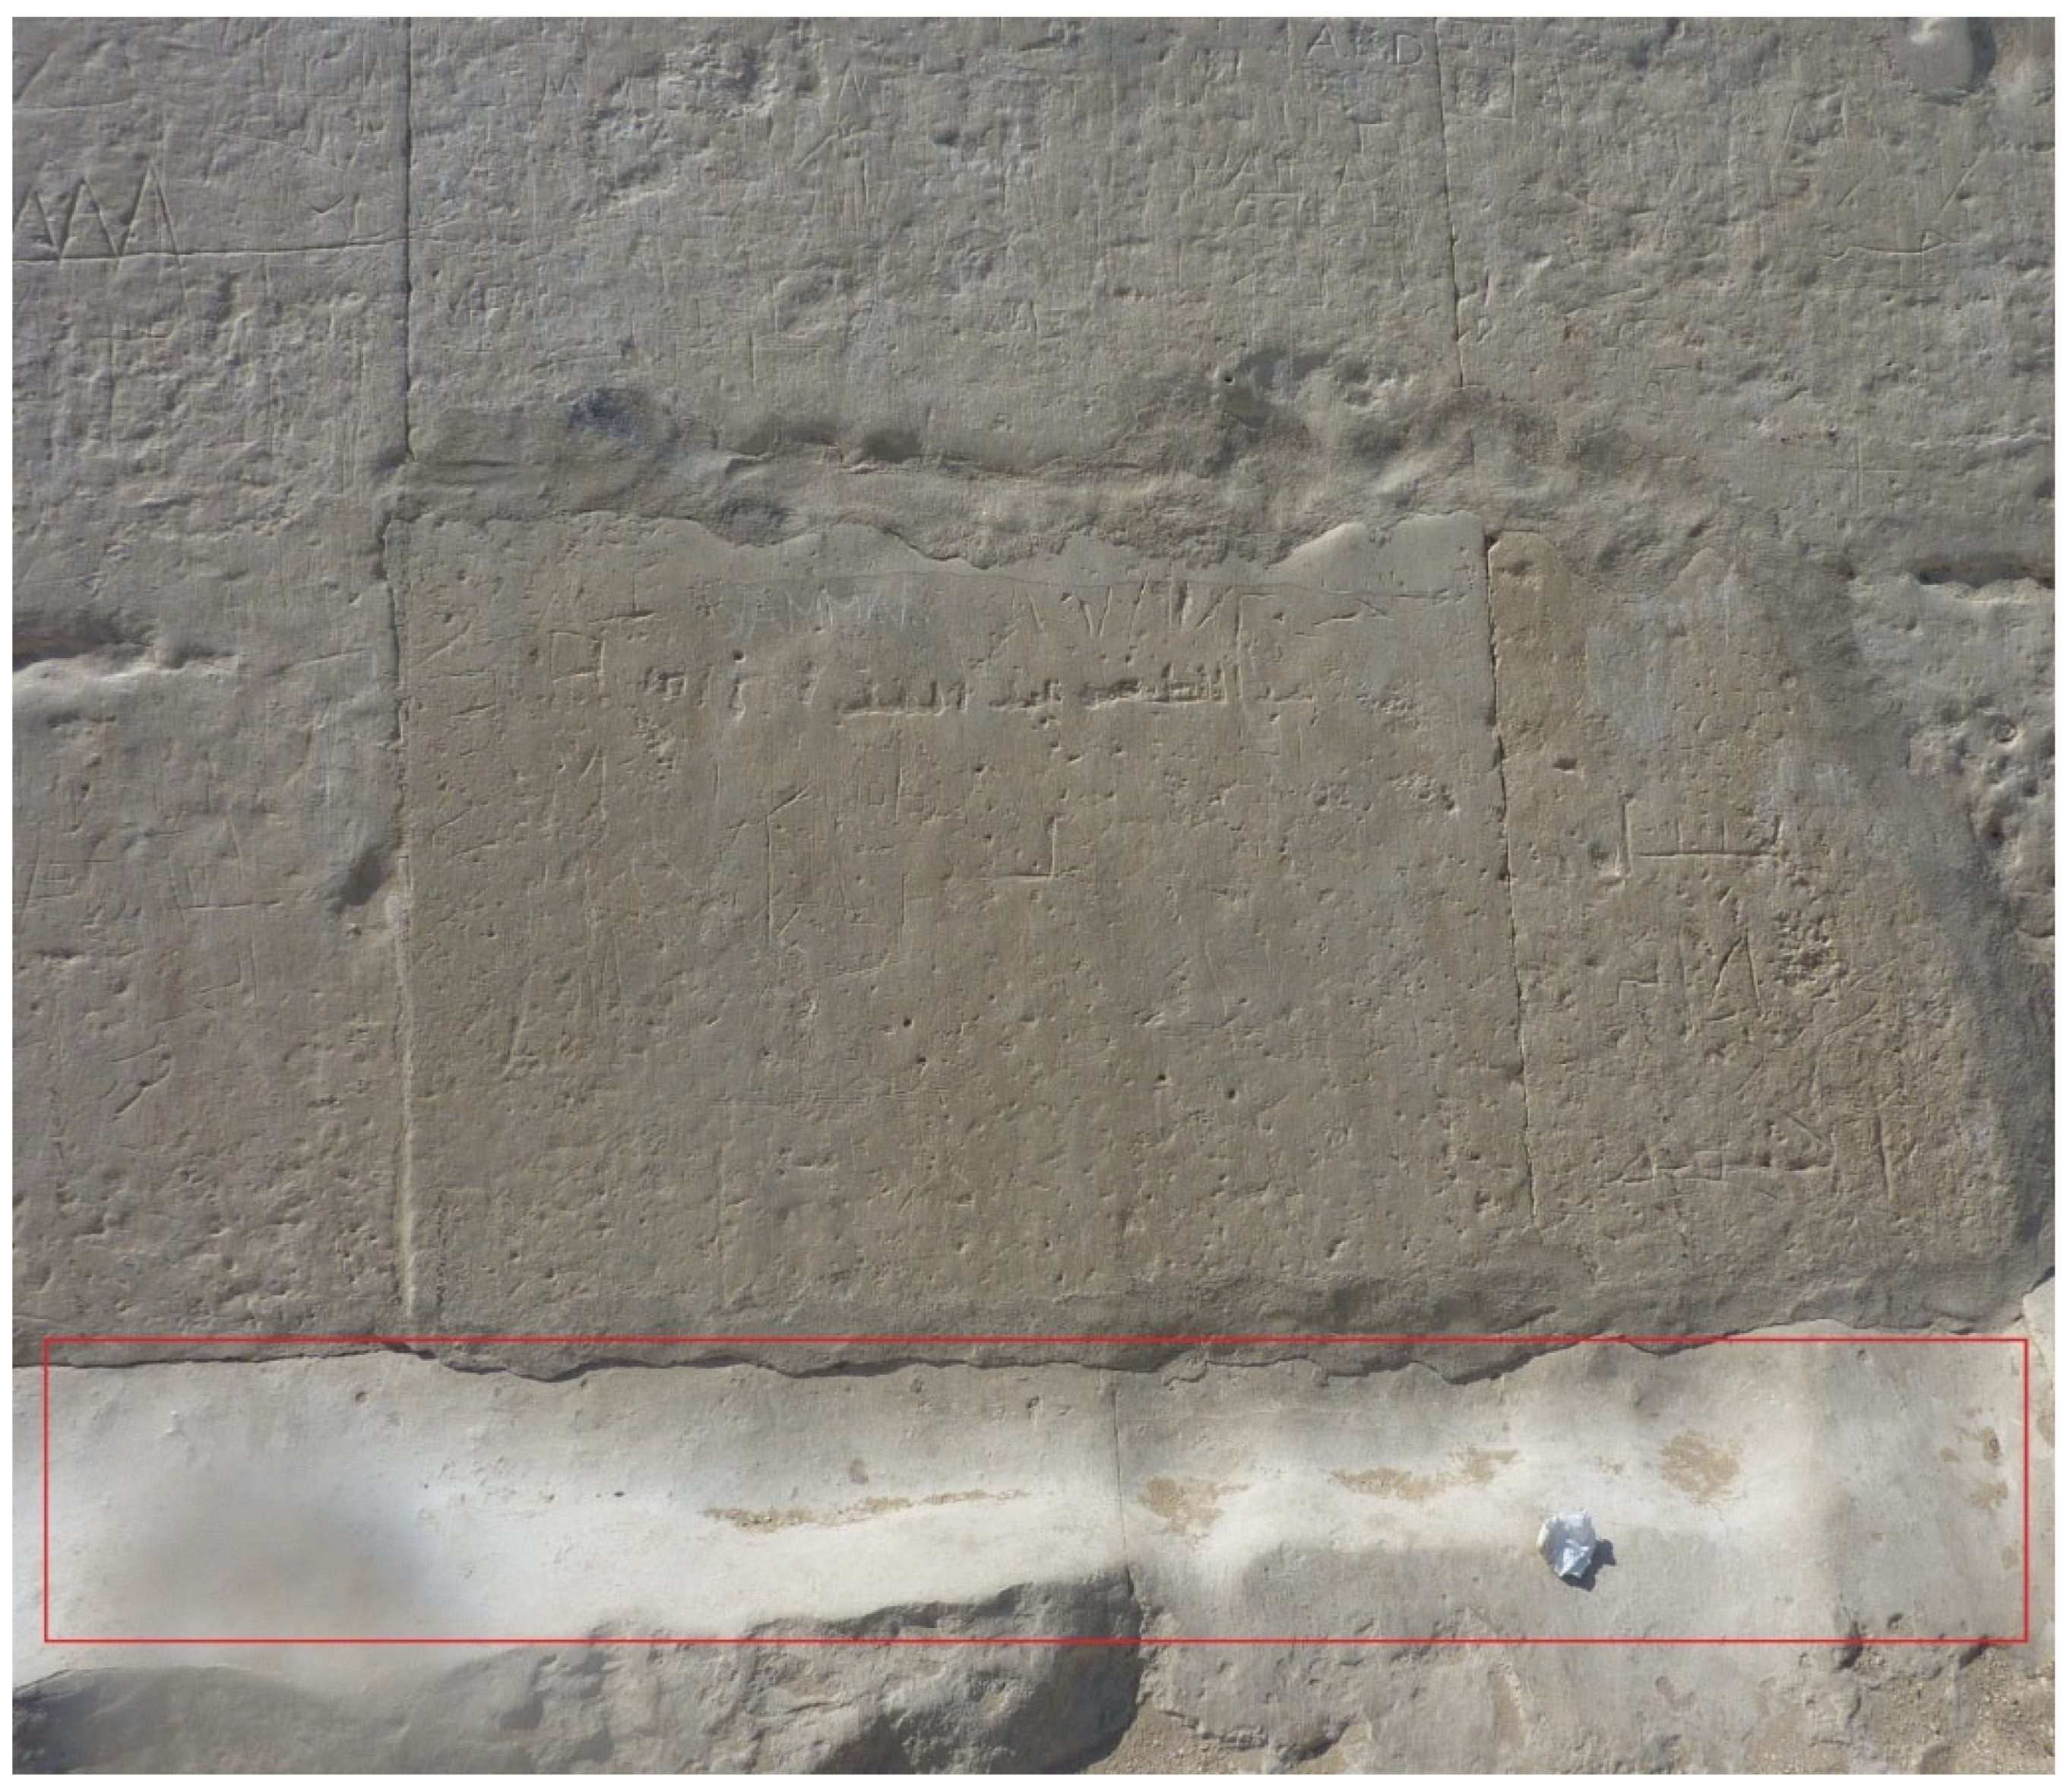
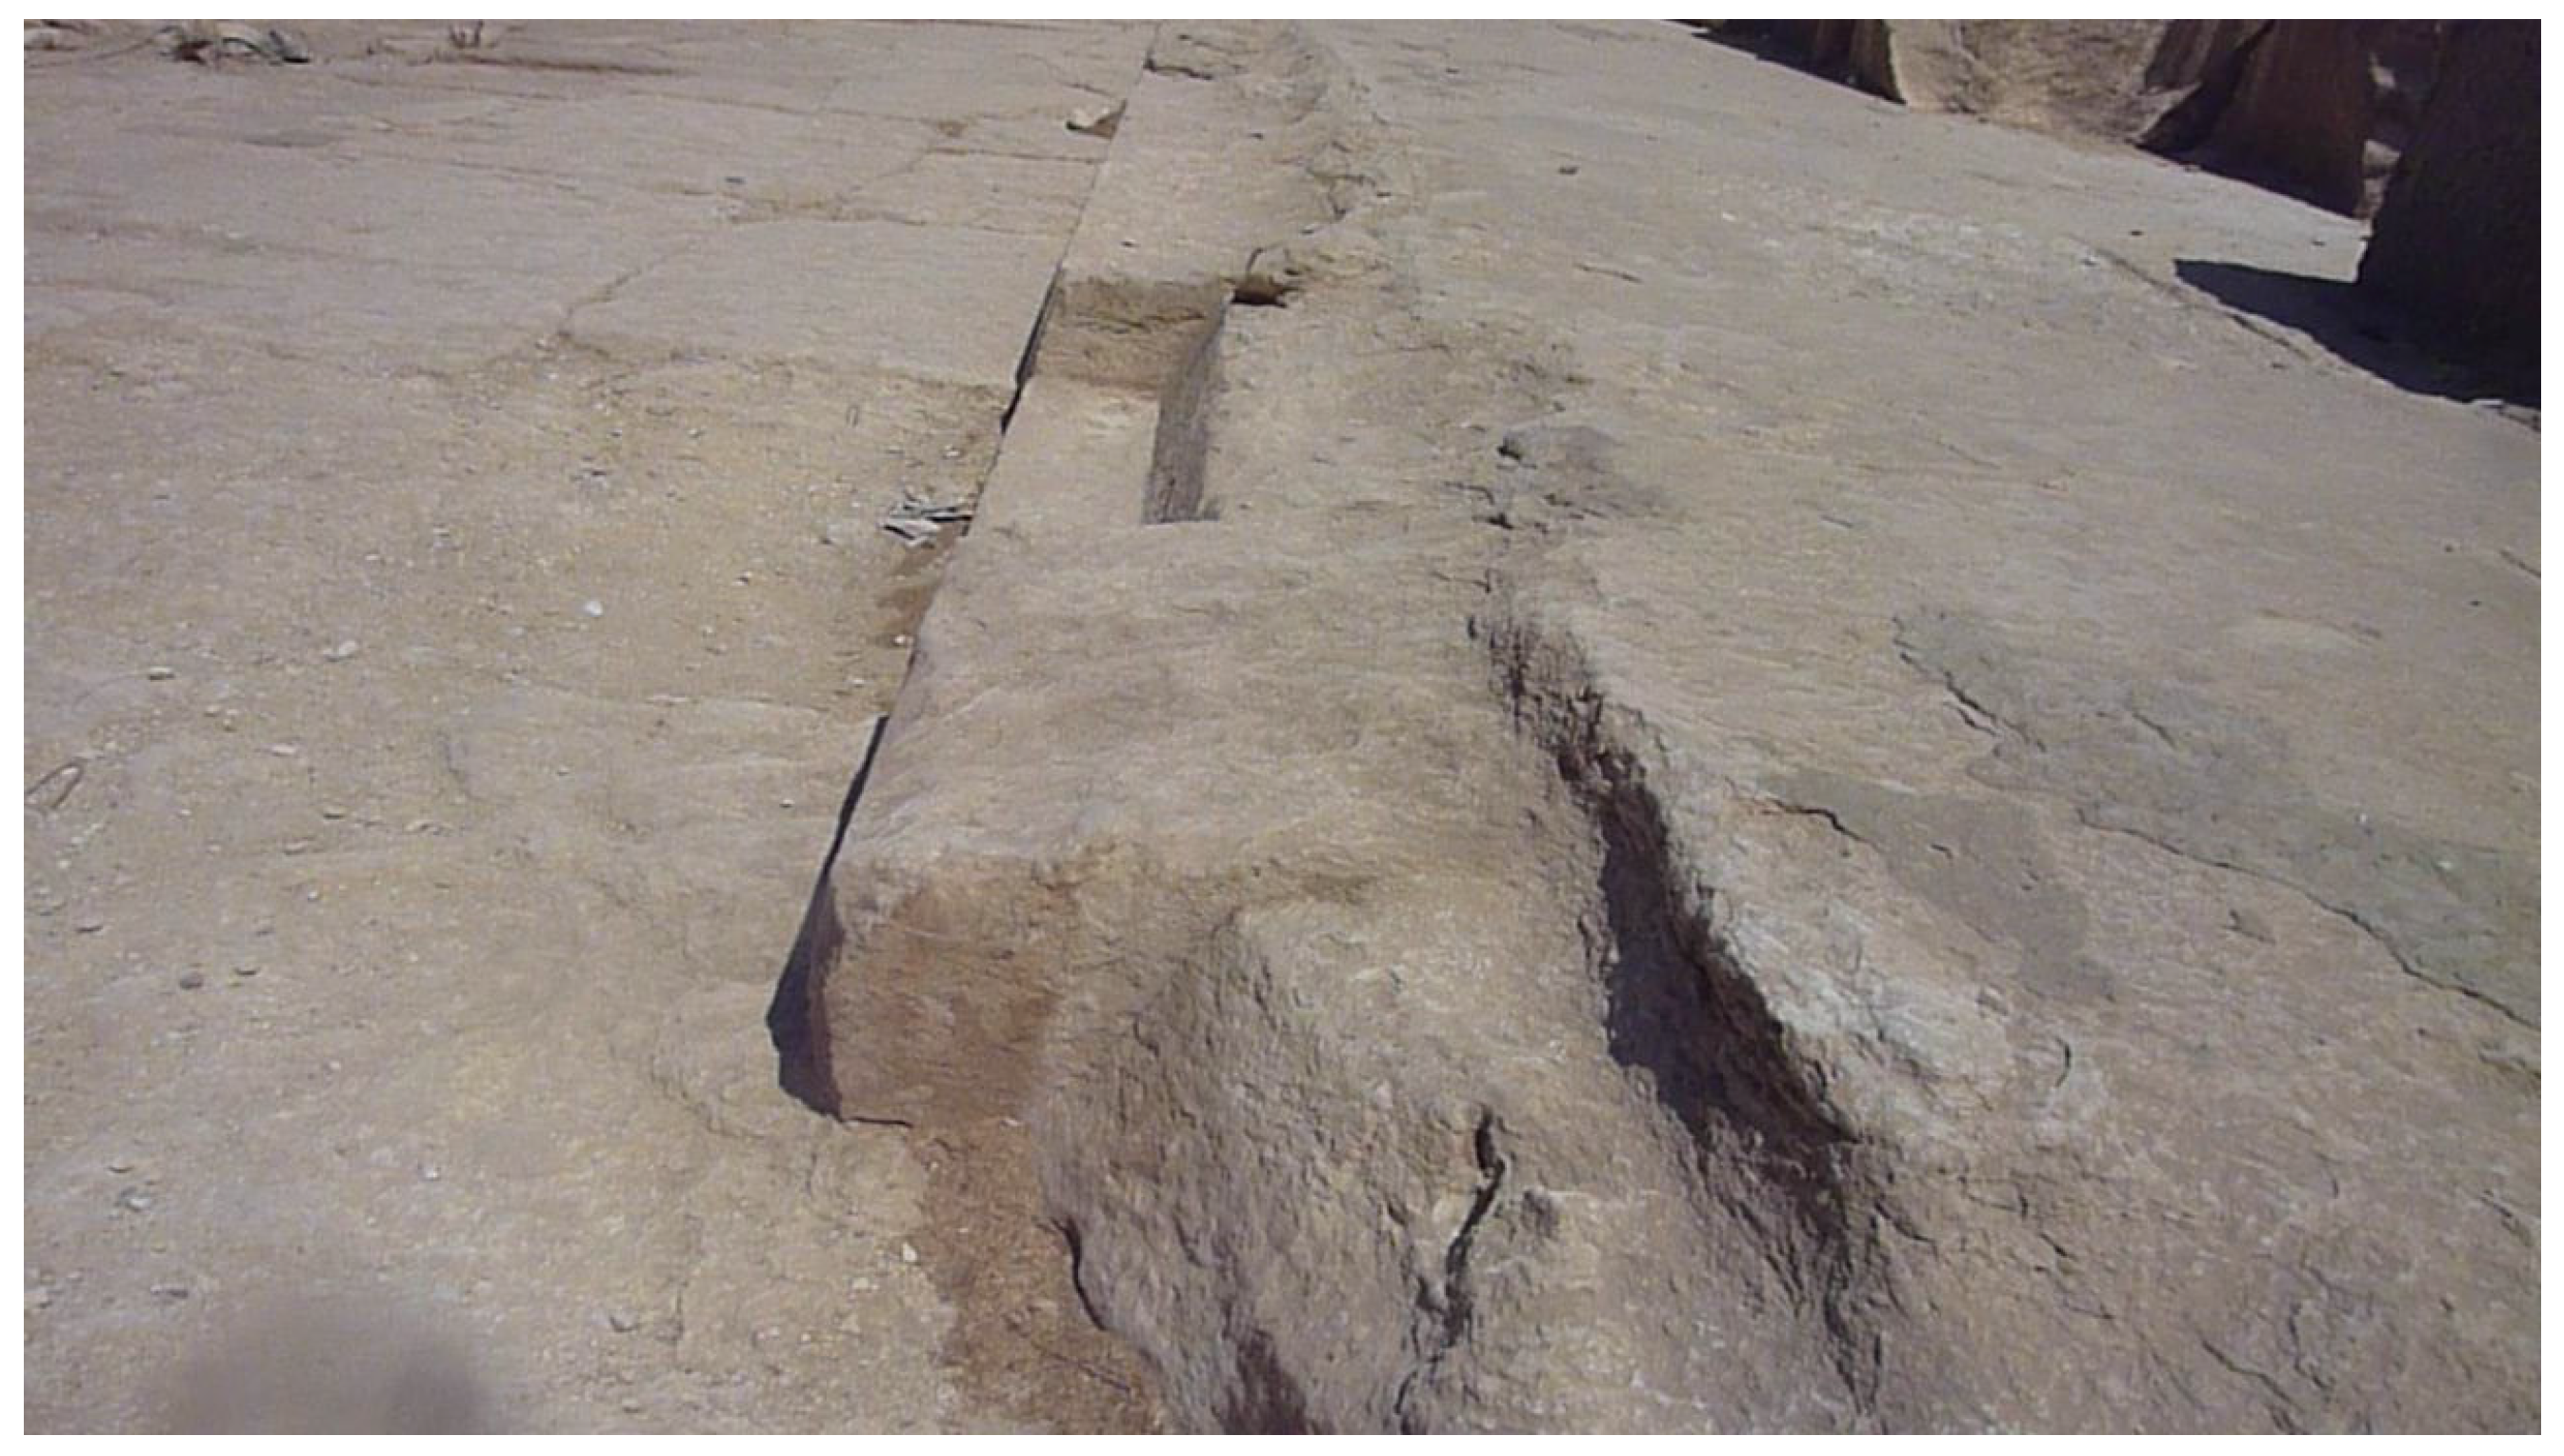
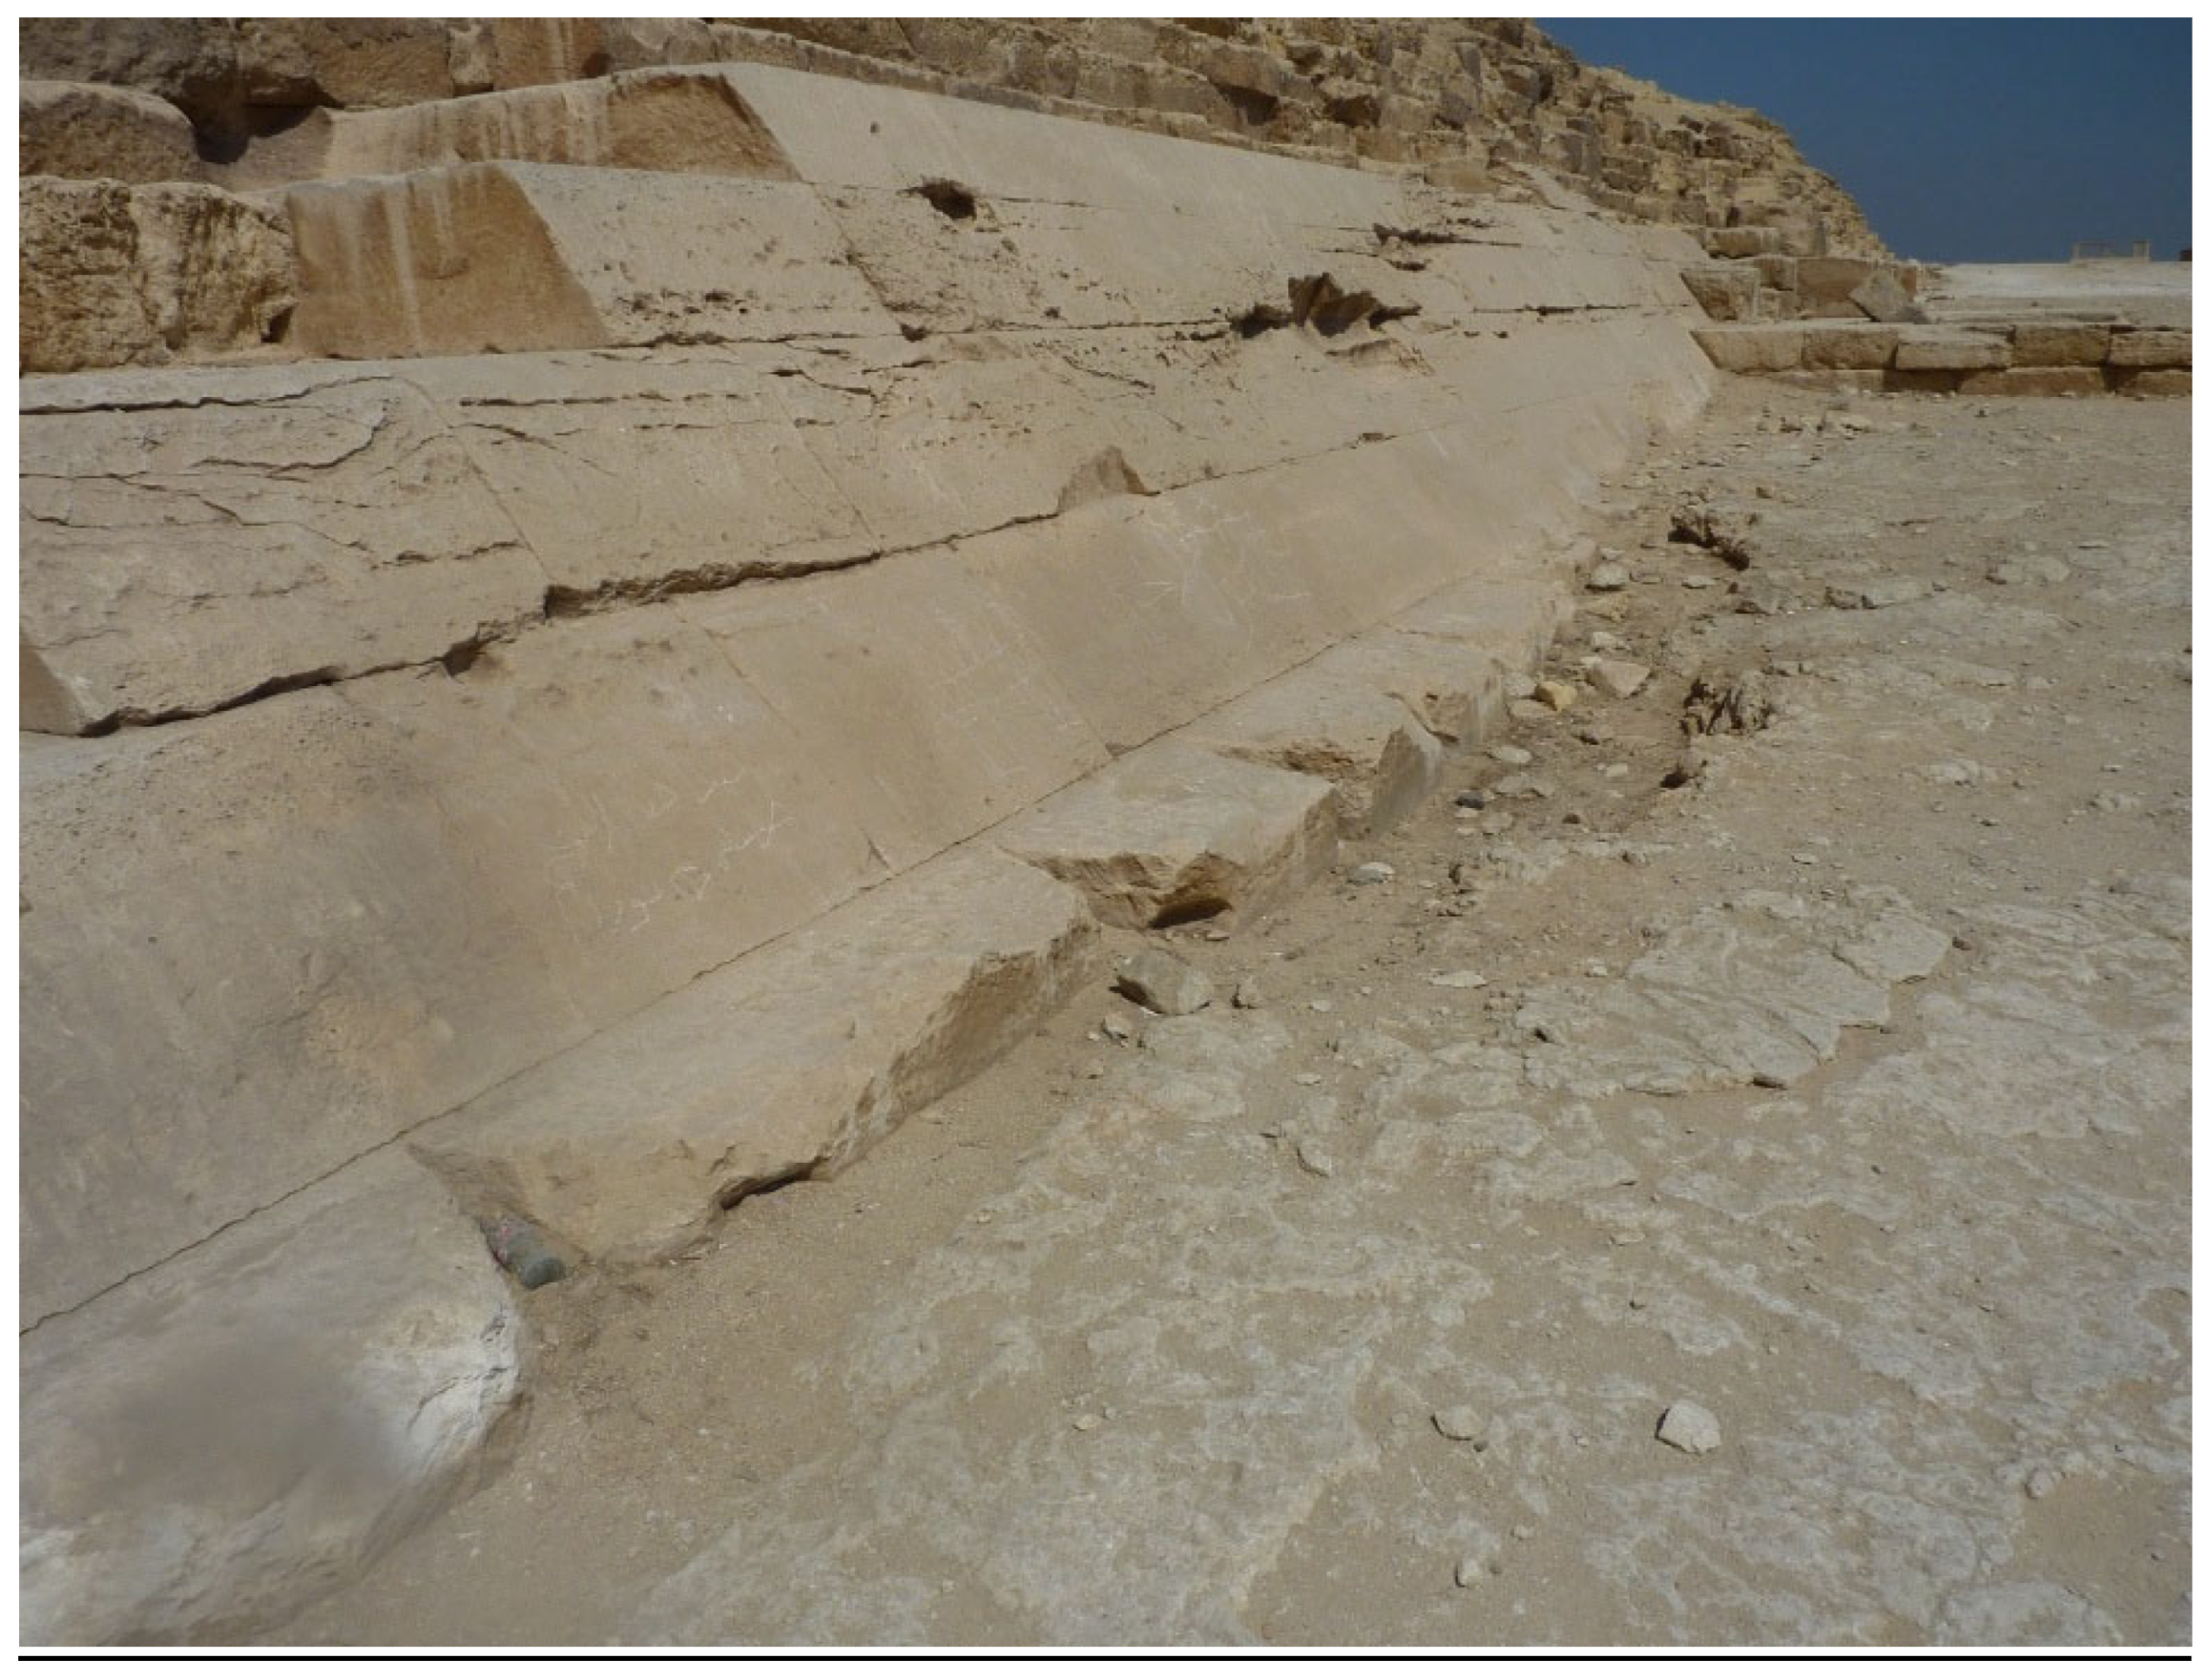
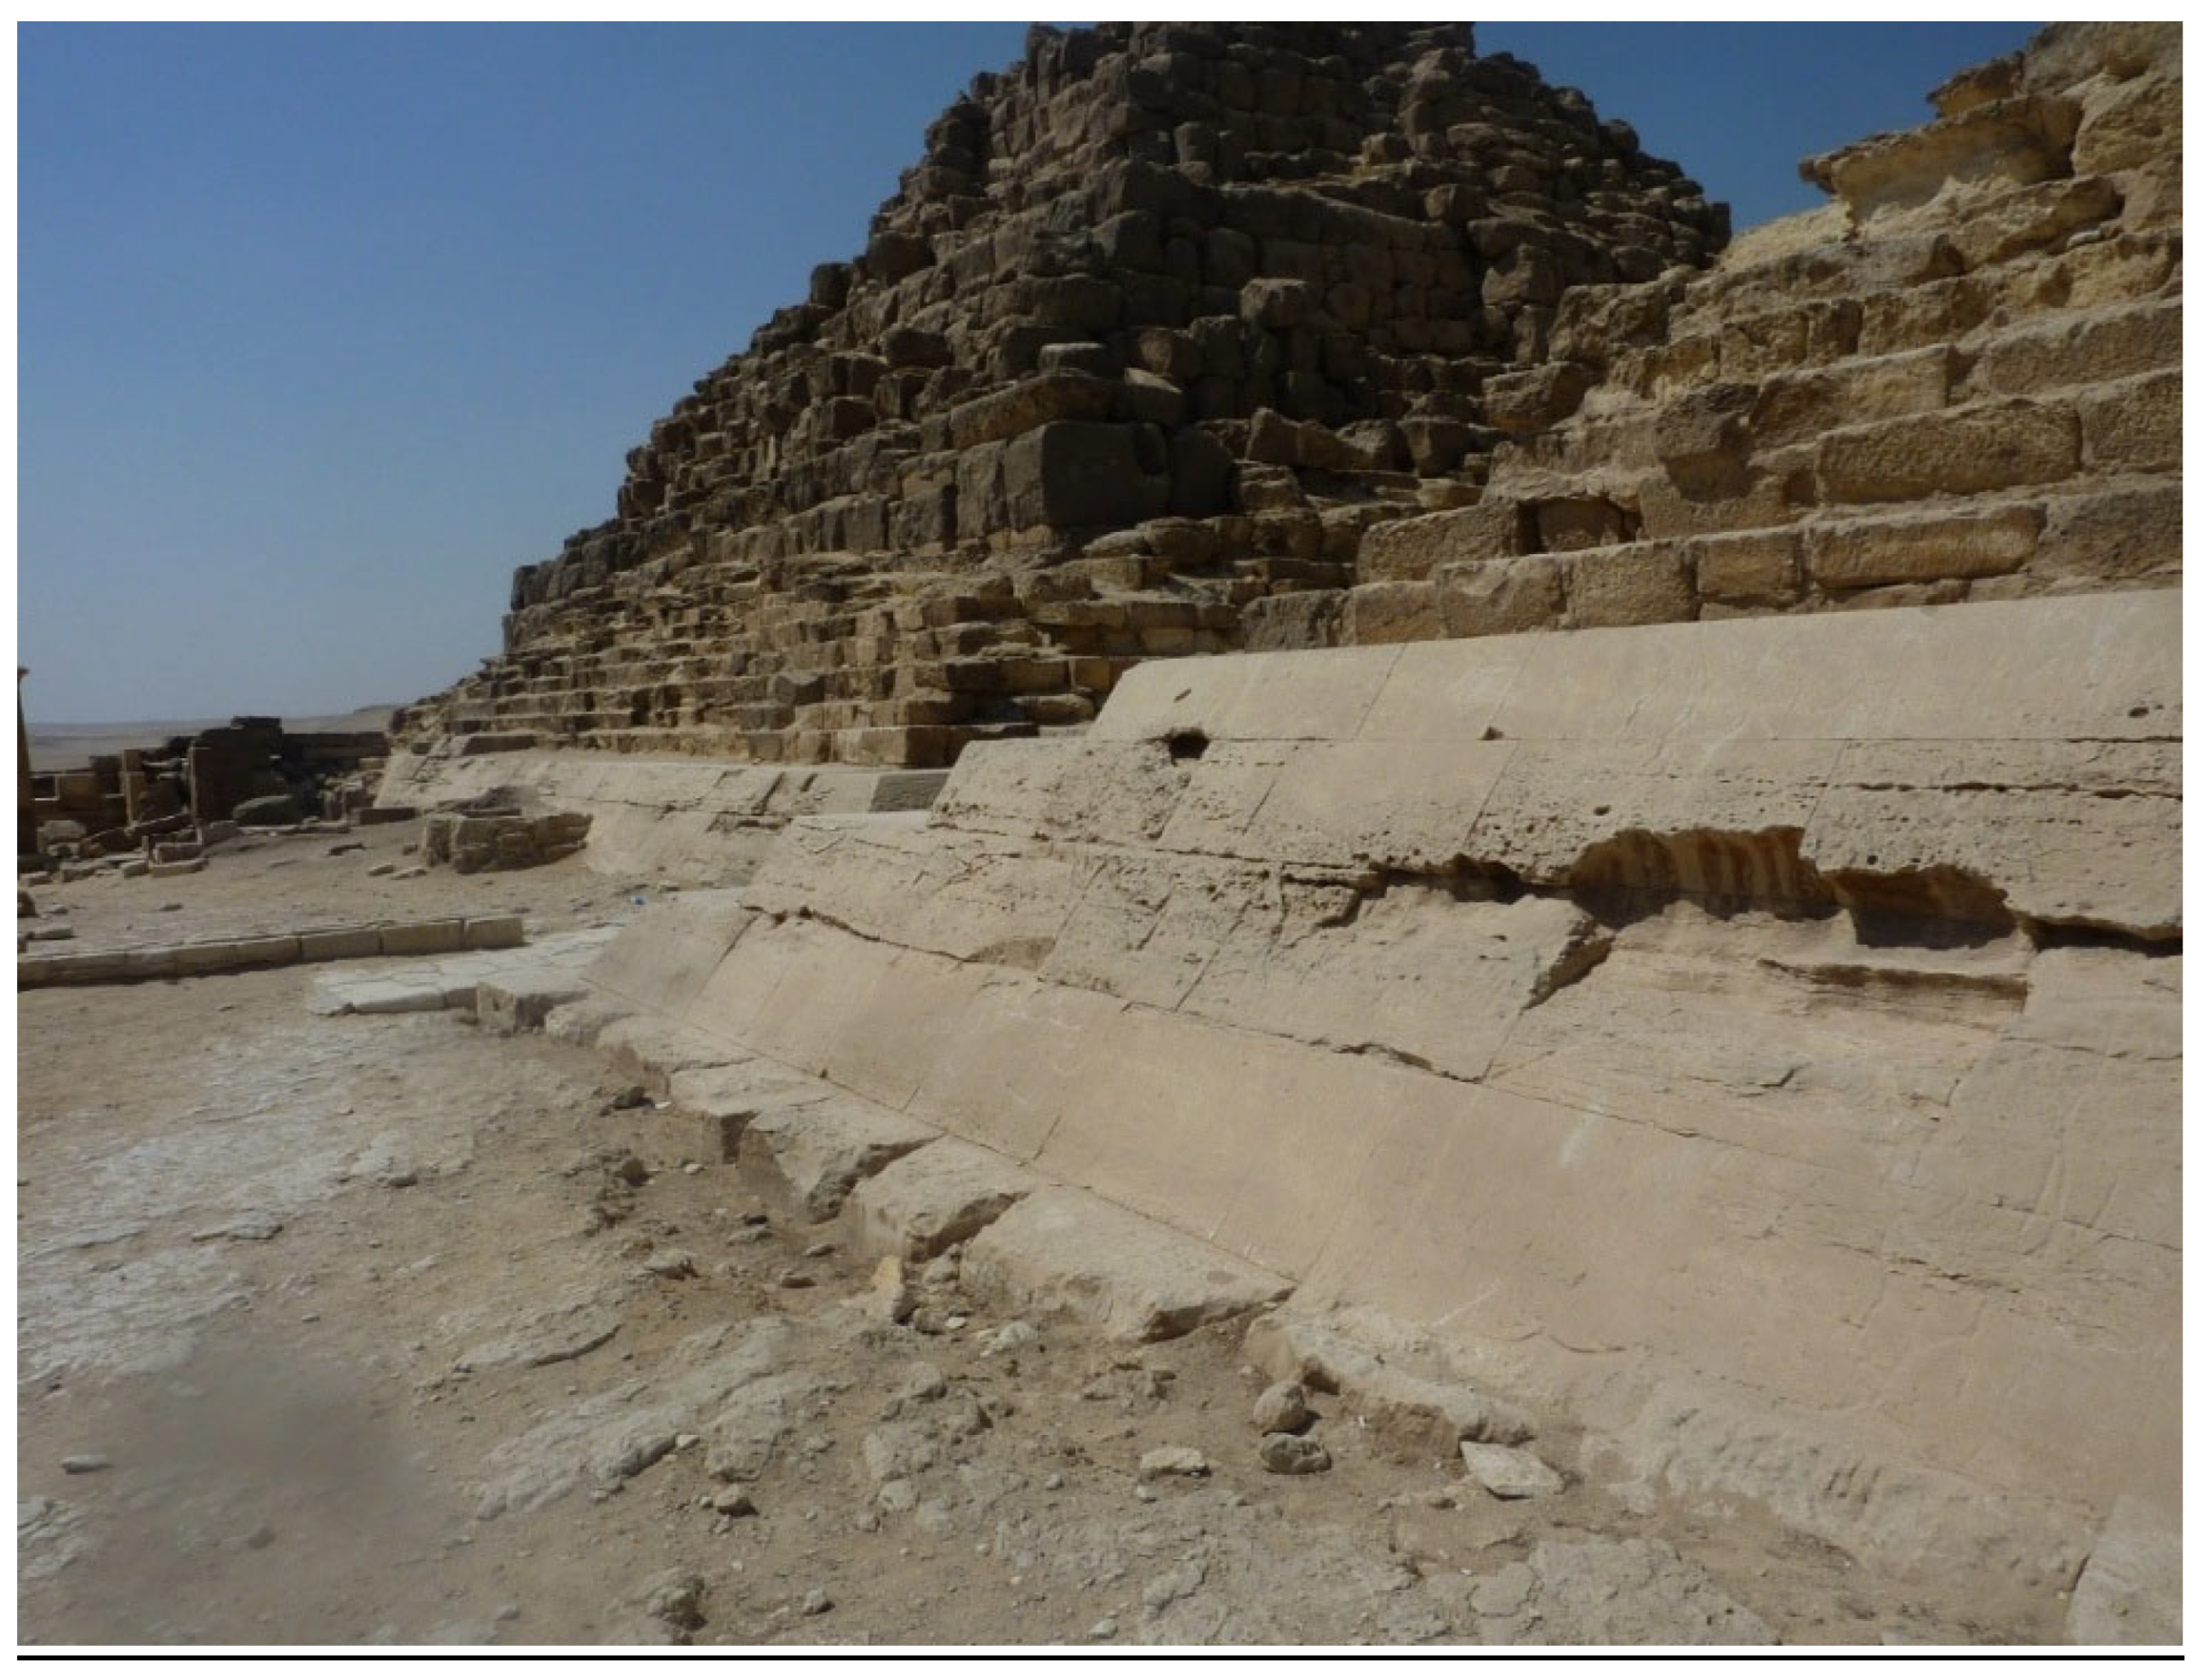
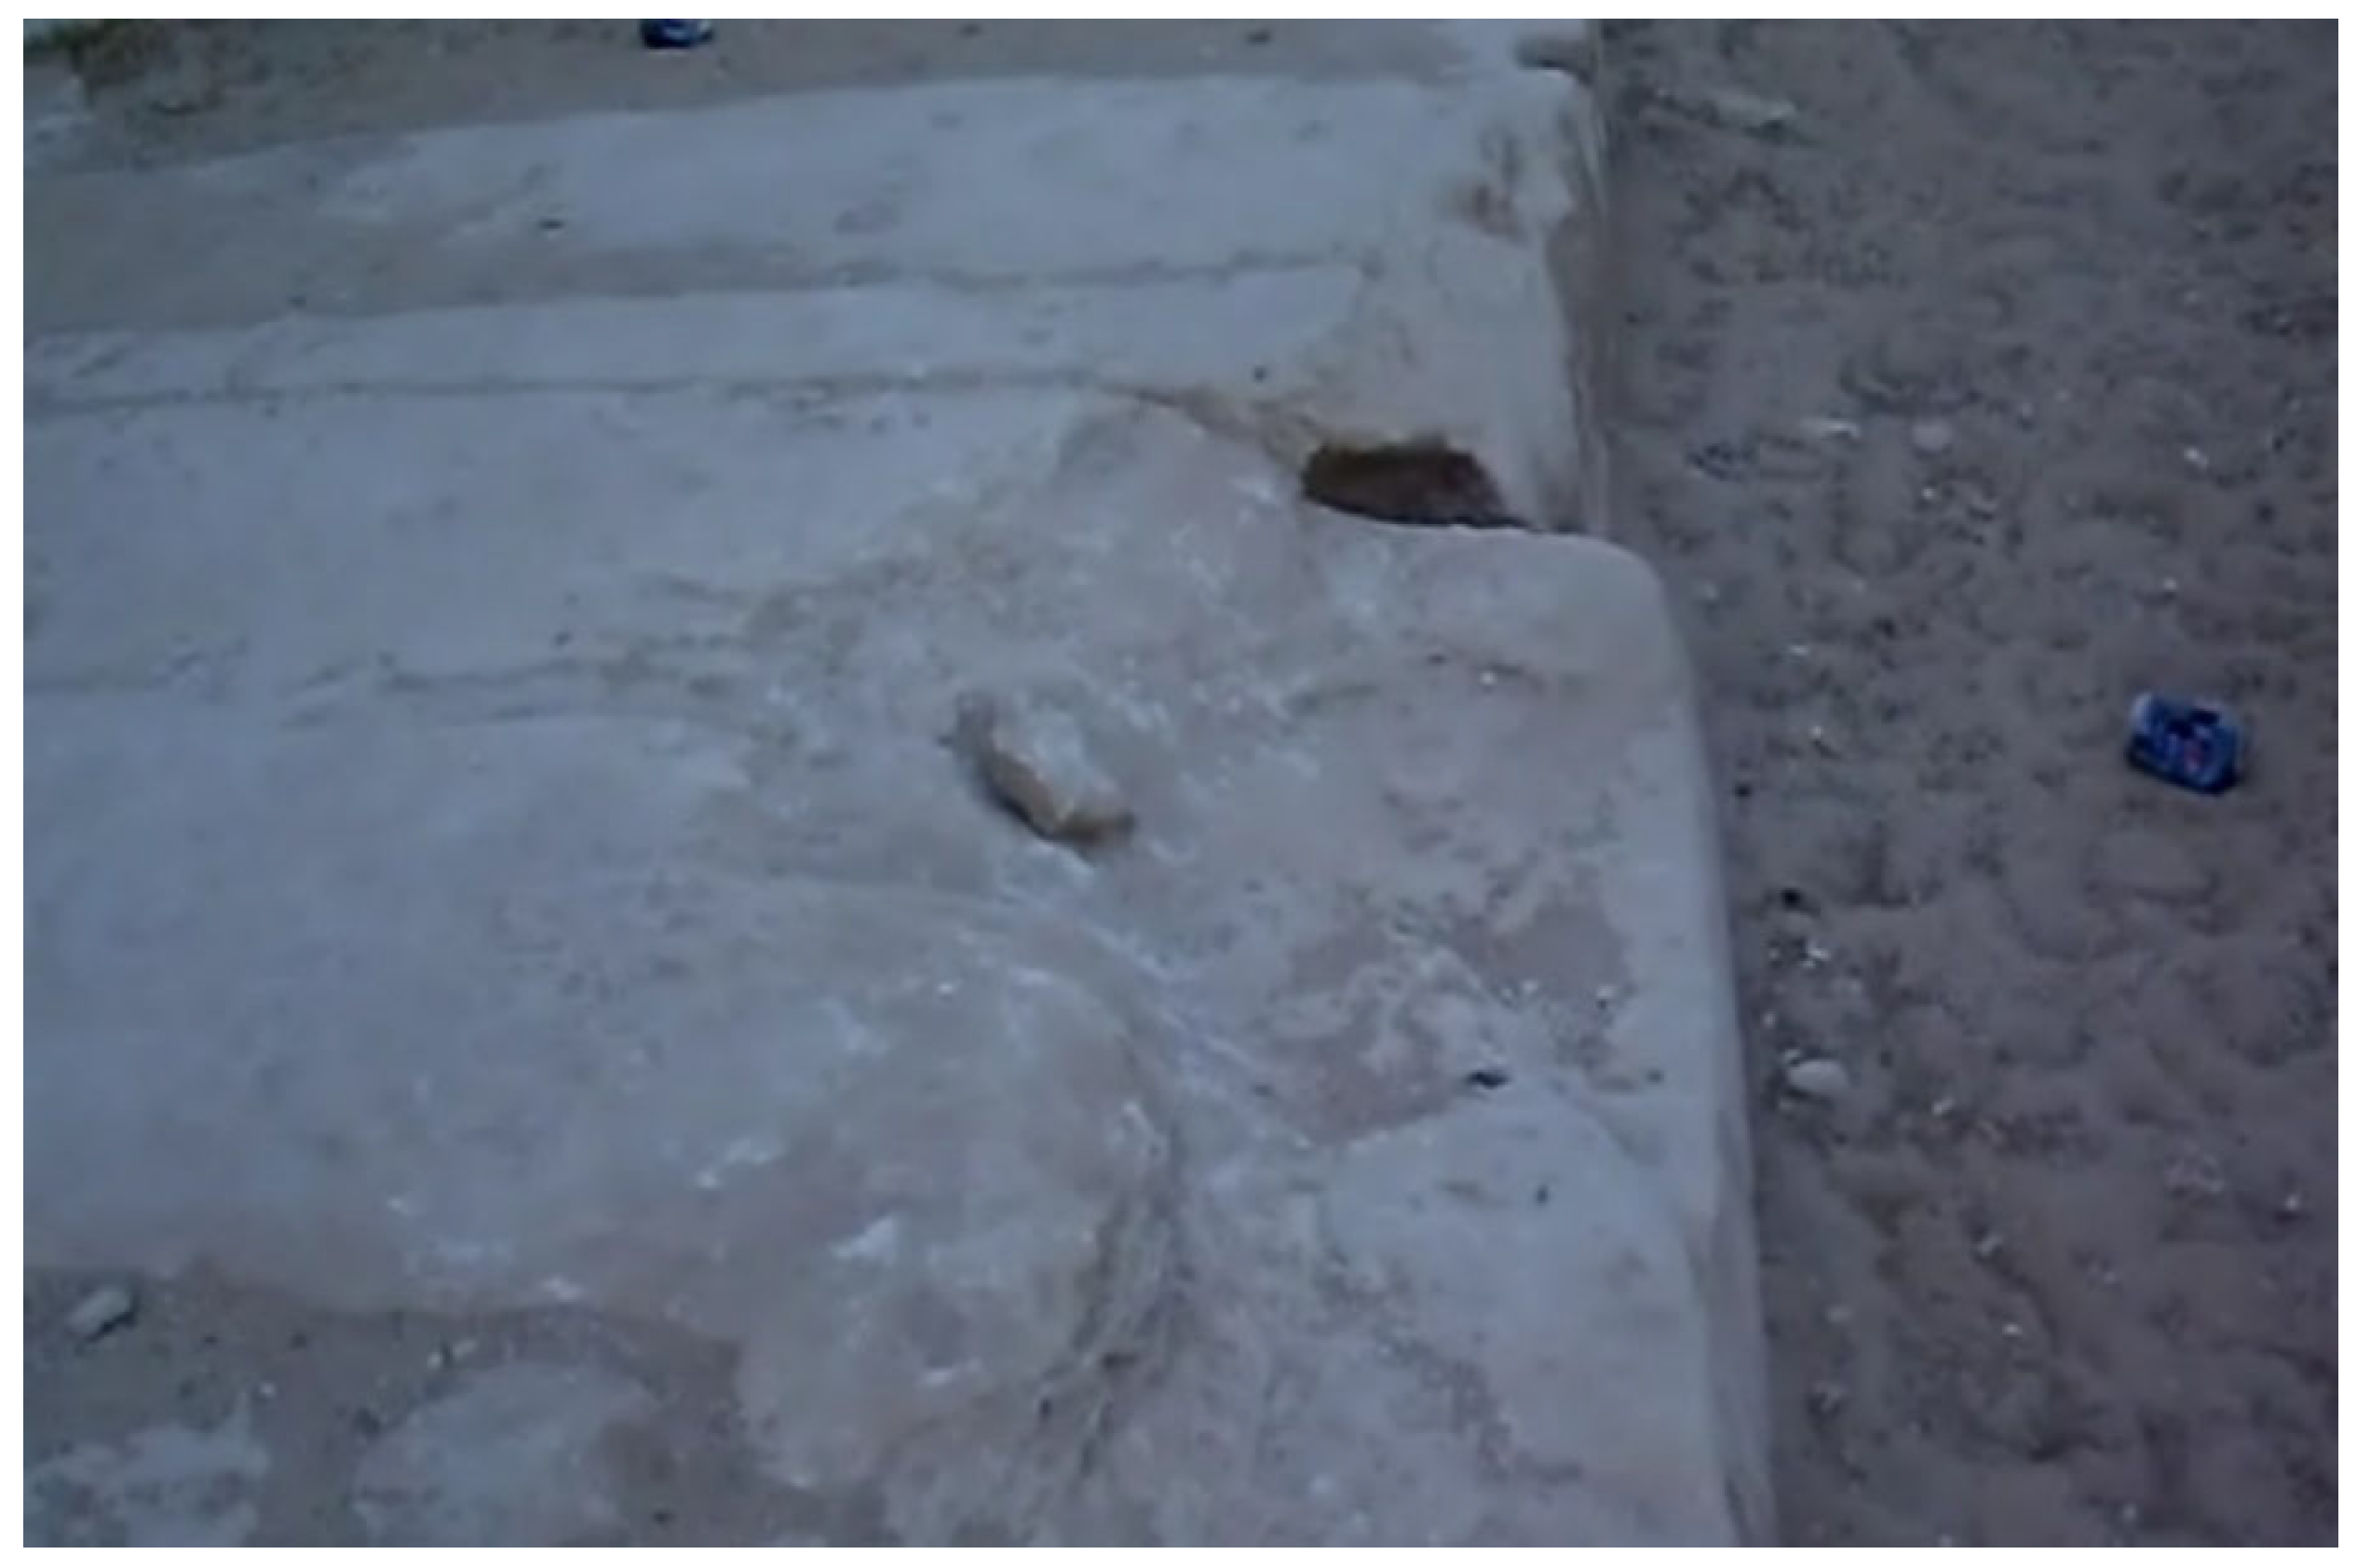
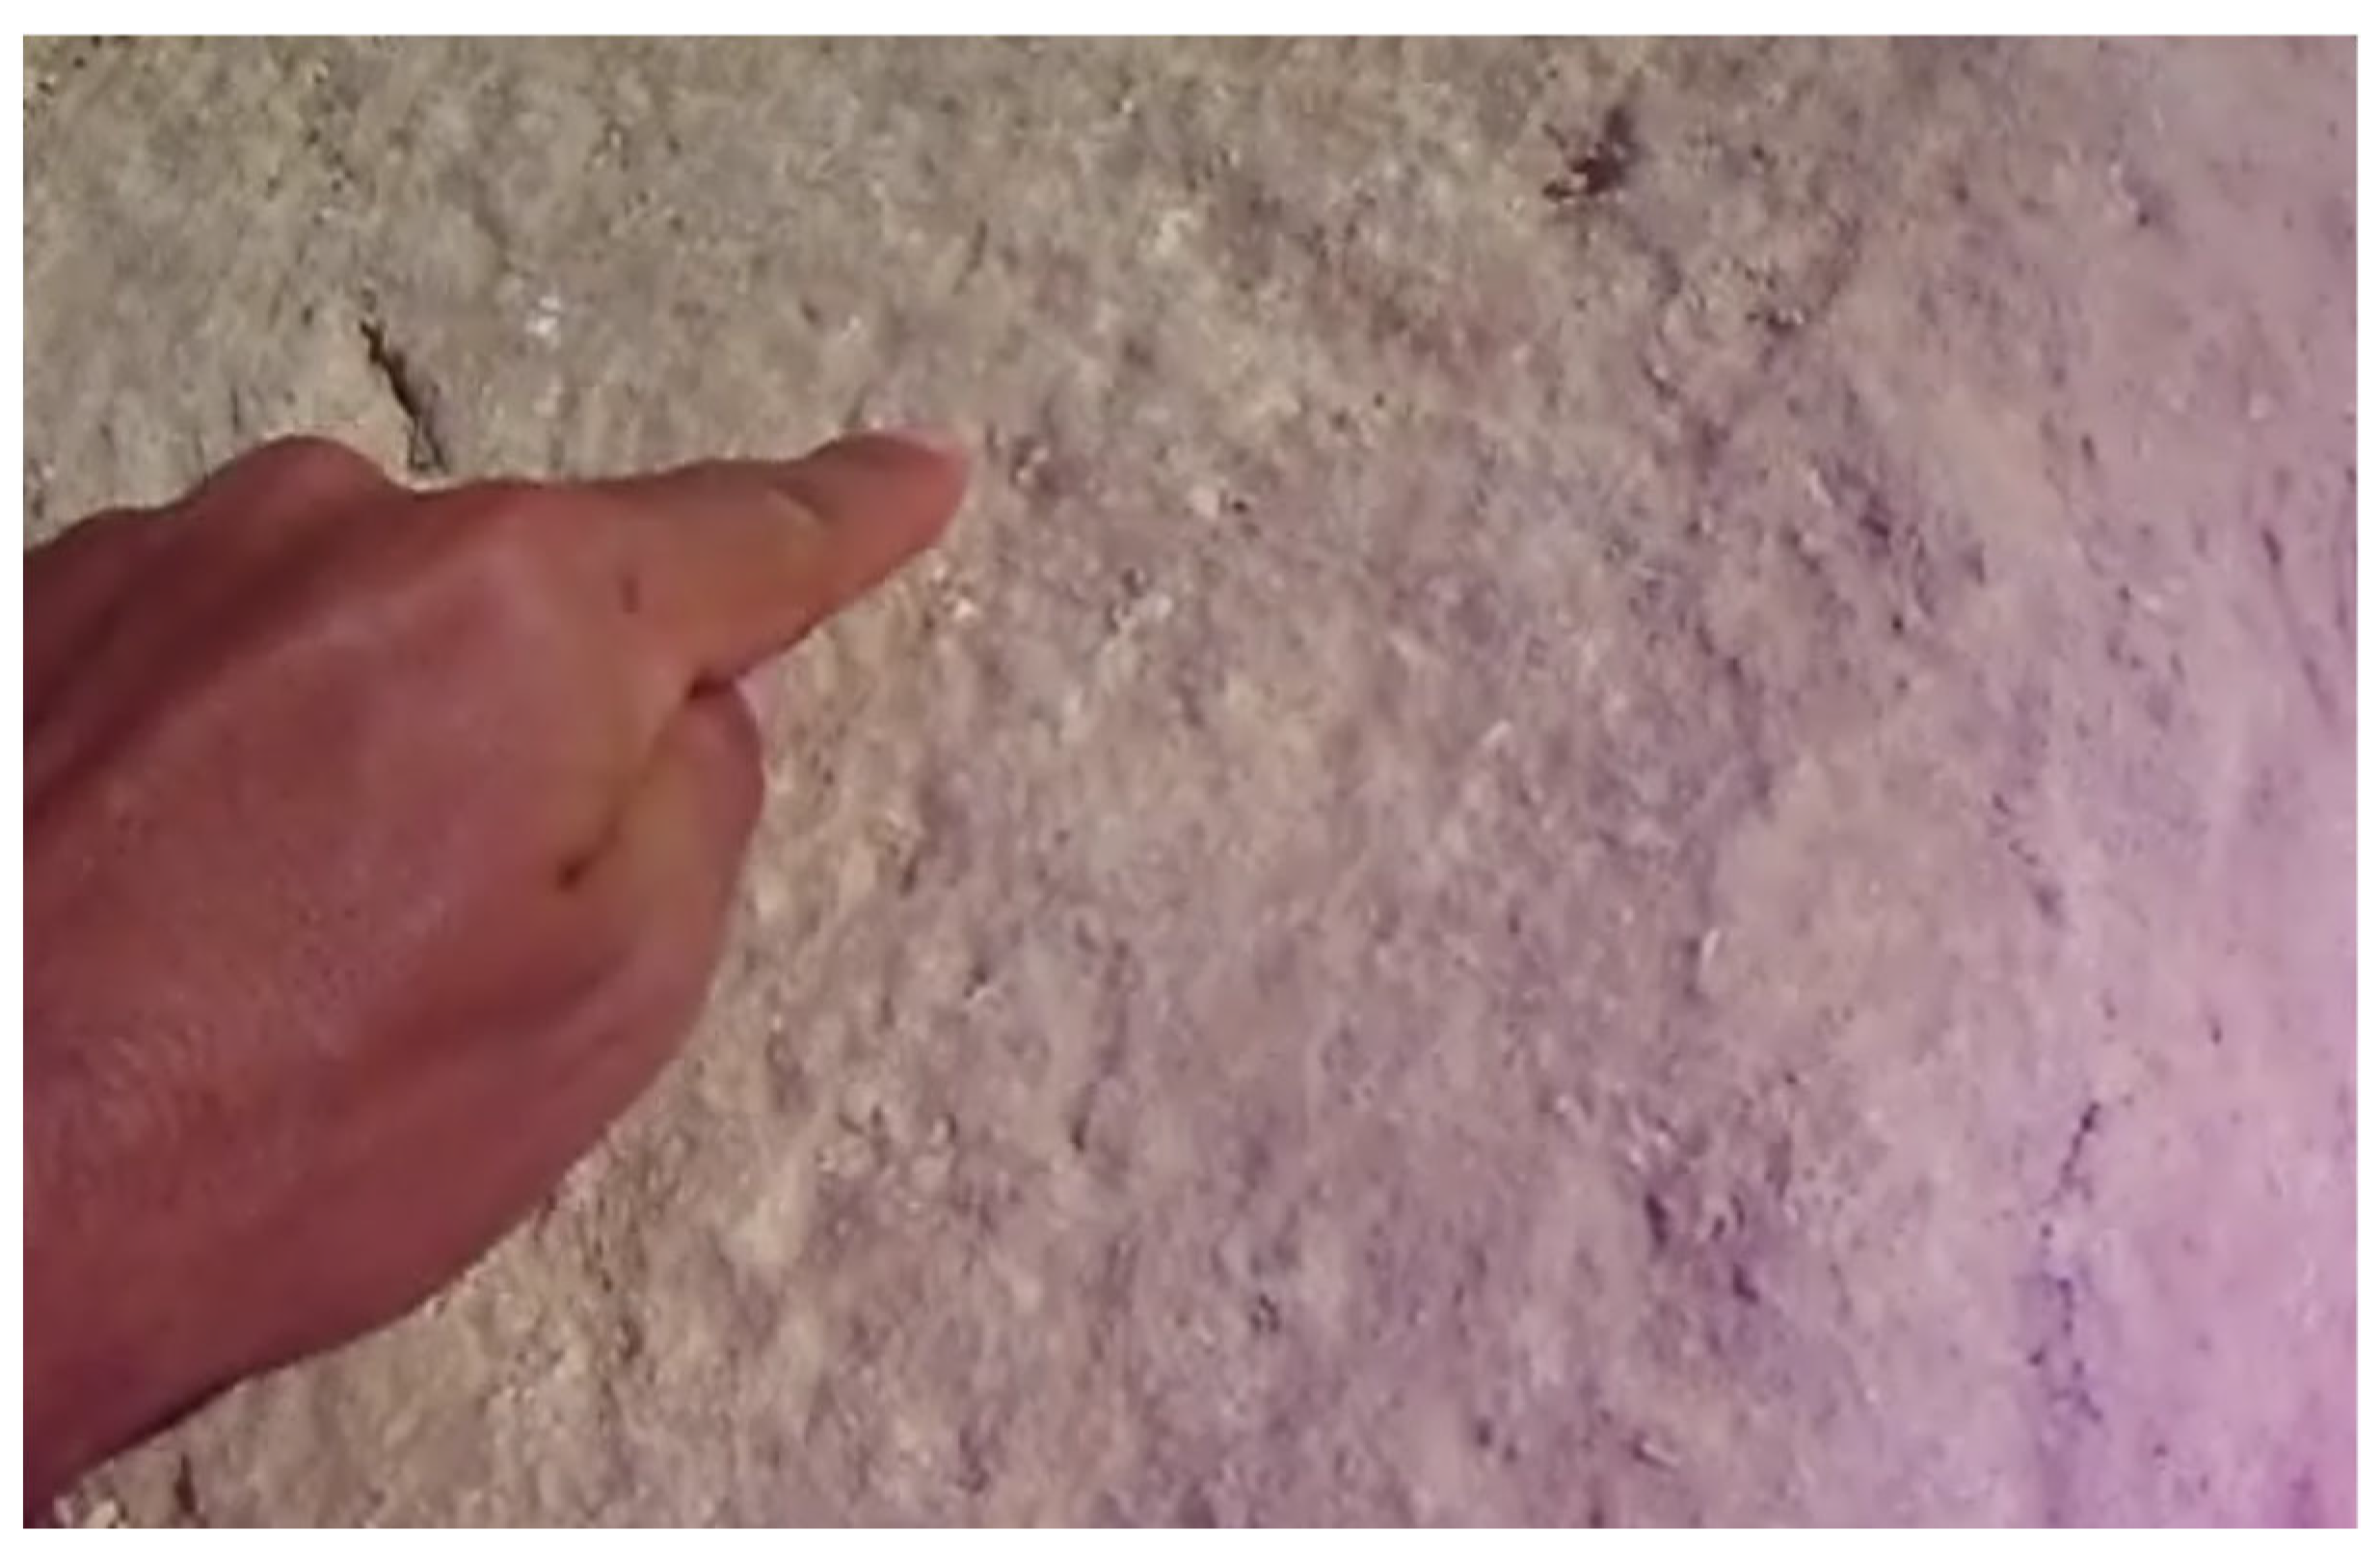
Figure 5 illustrates one of the analysed points, corresponding to a portion of the northern pavement at the base of the Pyramid of Khufu. The left-hand side of the pavement was originally covered by limestone casing blocks, which were removed approximately 675 years ago, whereas the right-hand side has remained continuously exposed to atmospheric agents since the time of construction and consequently exhibits significantly greater surface erosion. The ratio between the erosion observed on these two adjacent surfaces provides the basis for estimating the construction date of the pyramid.
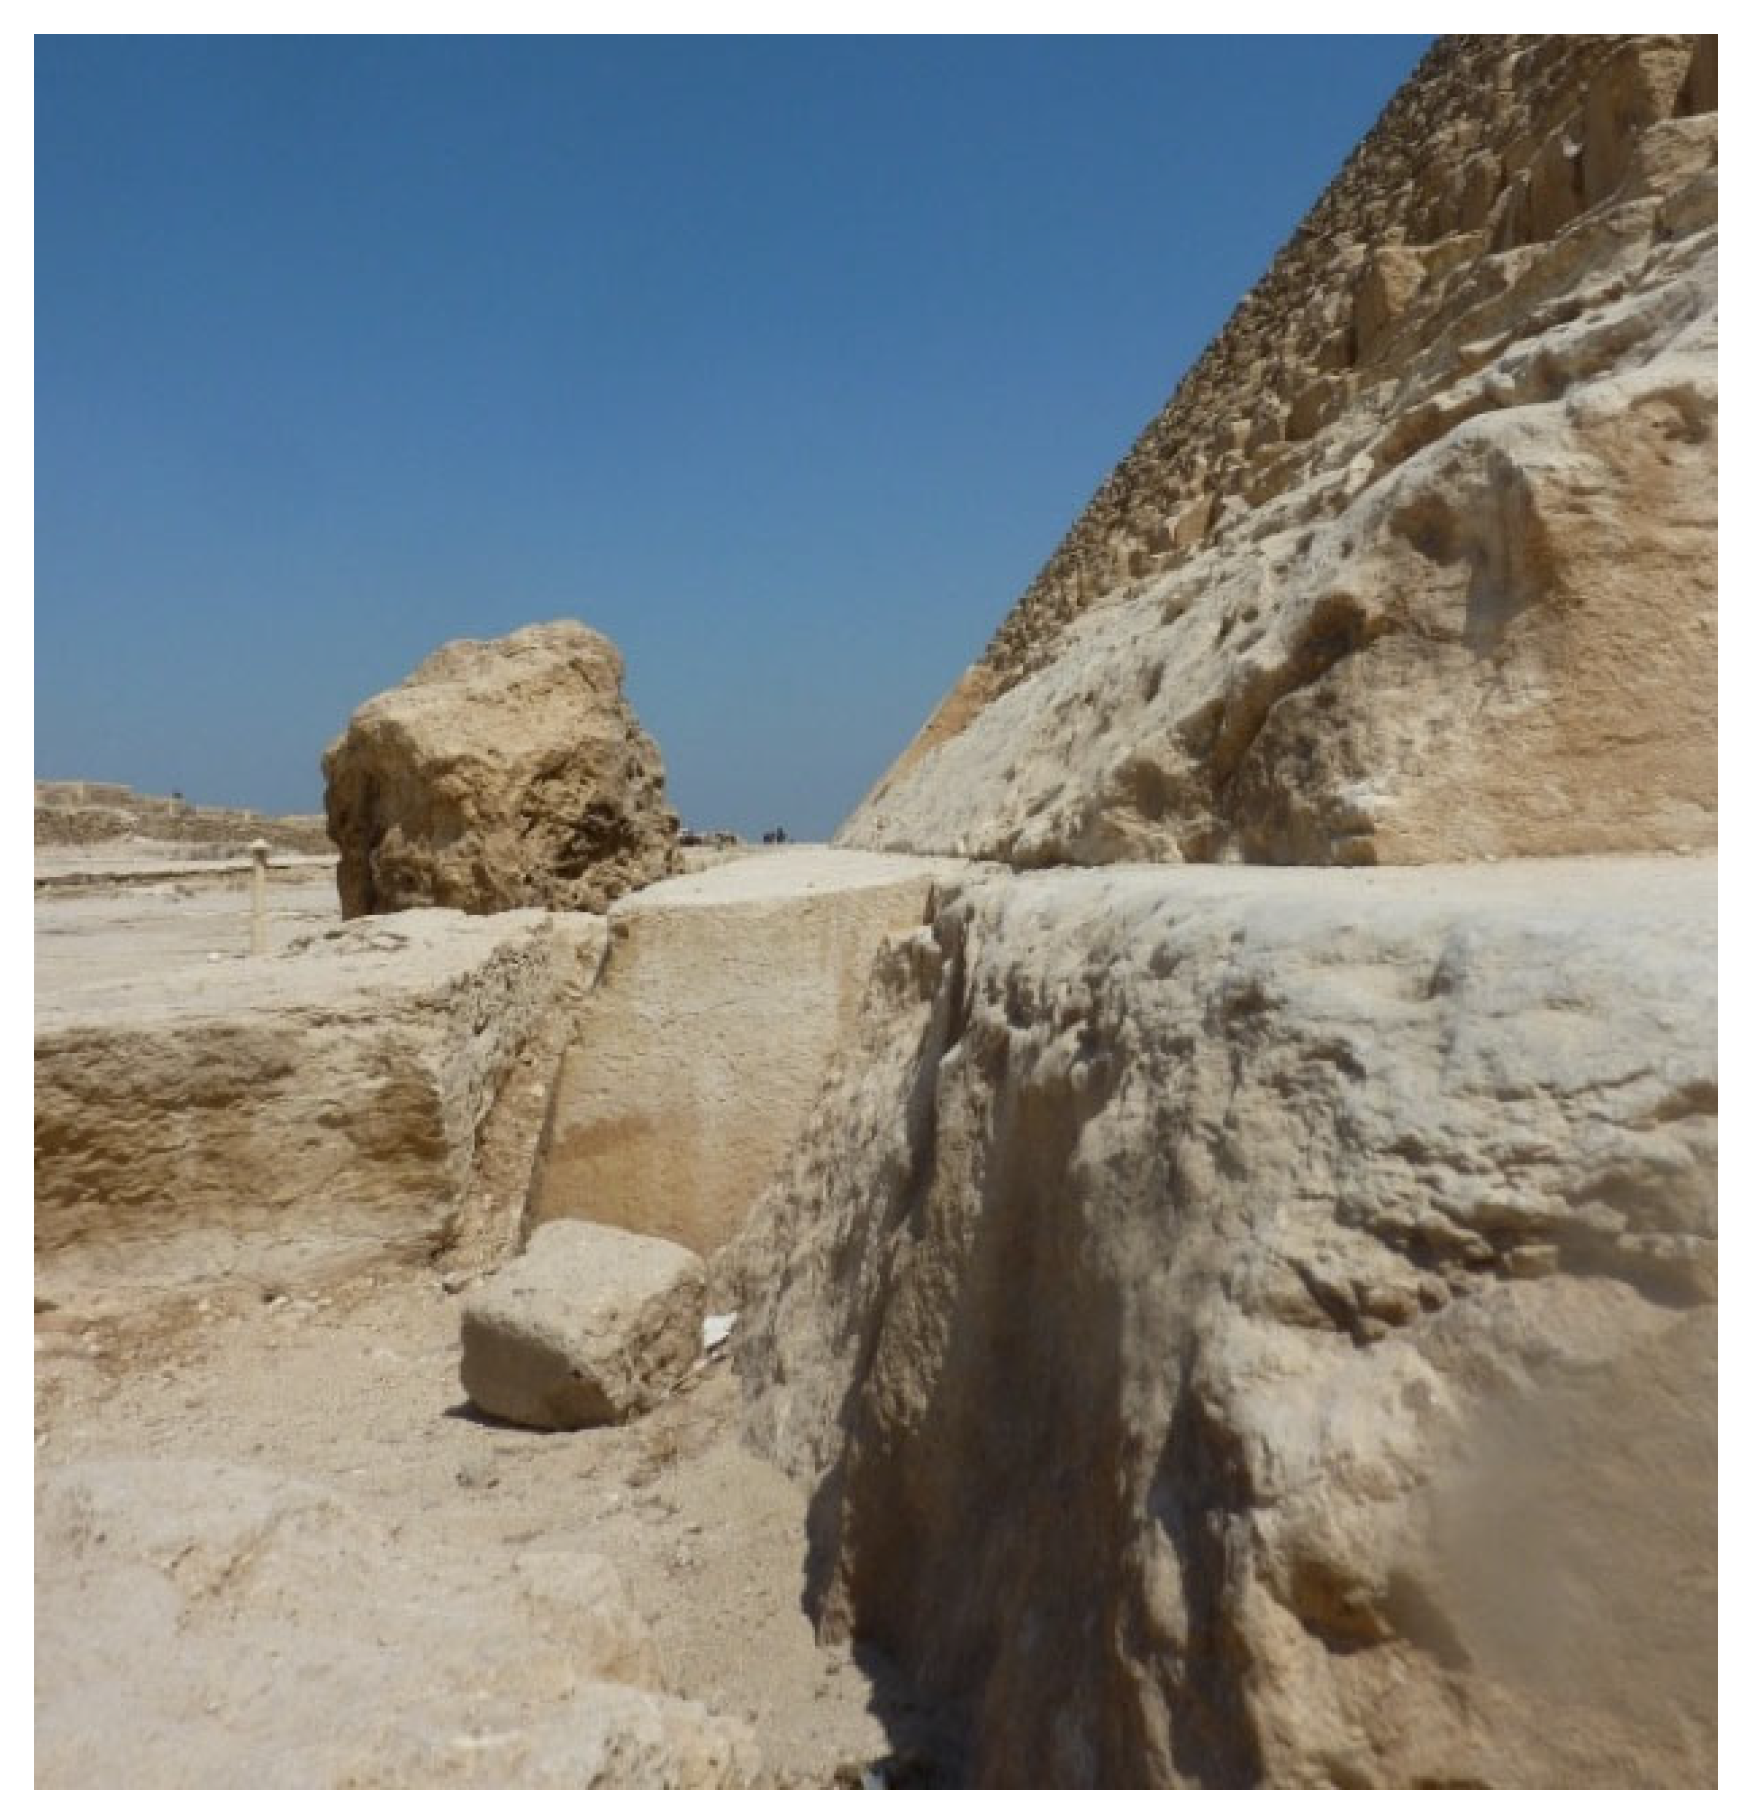
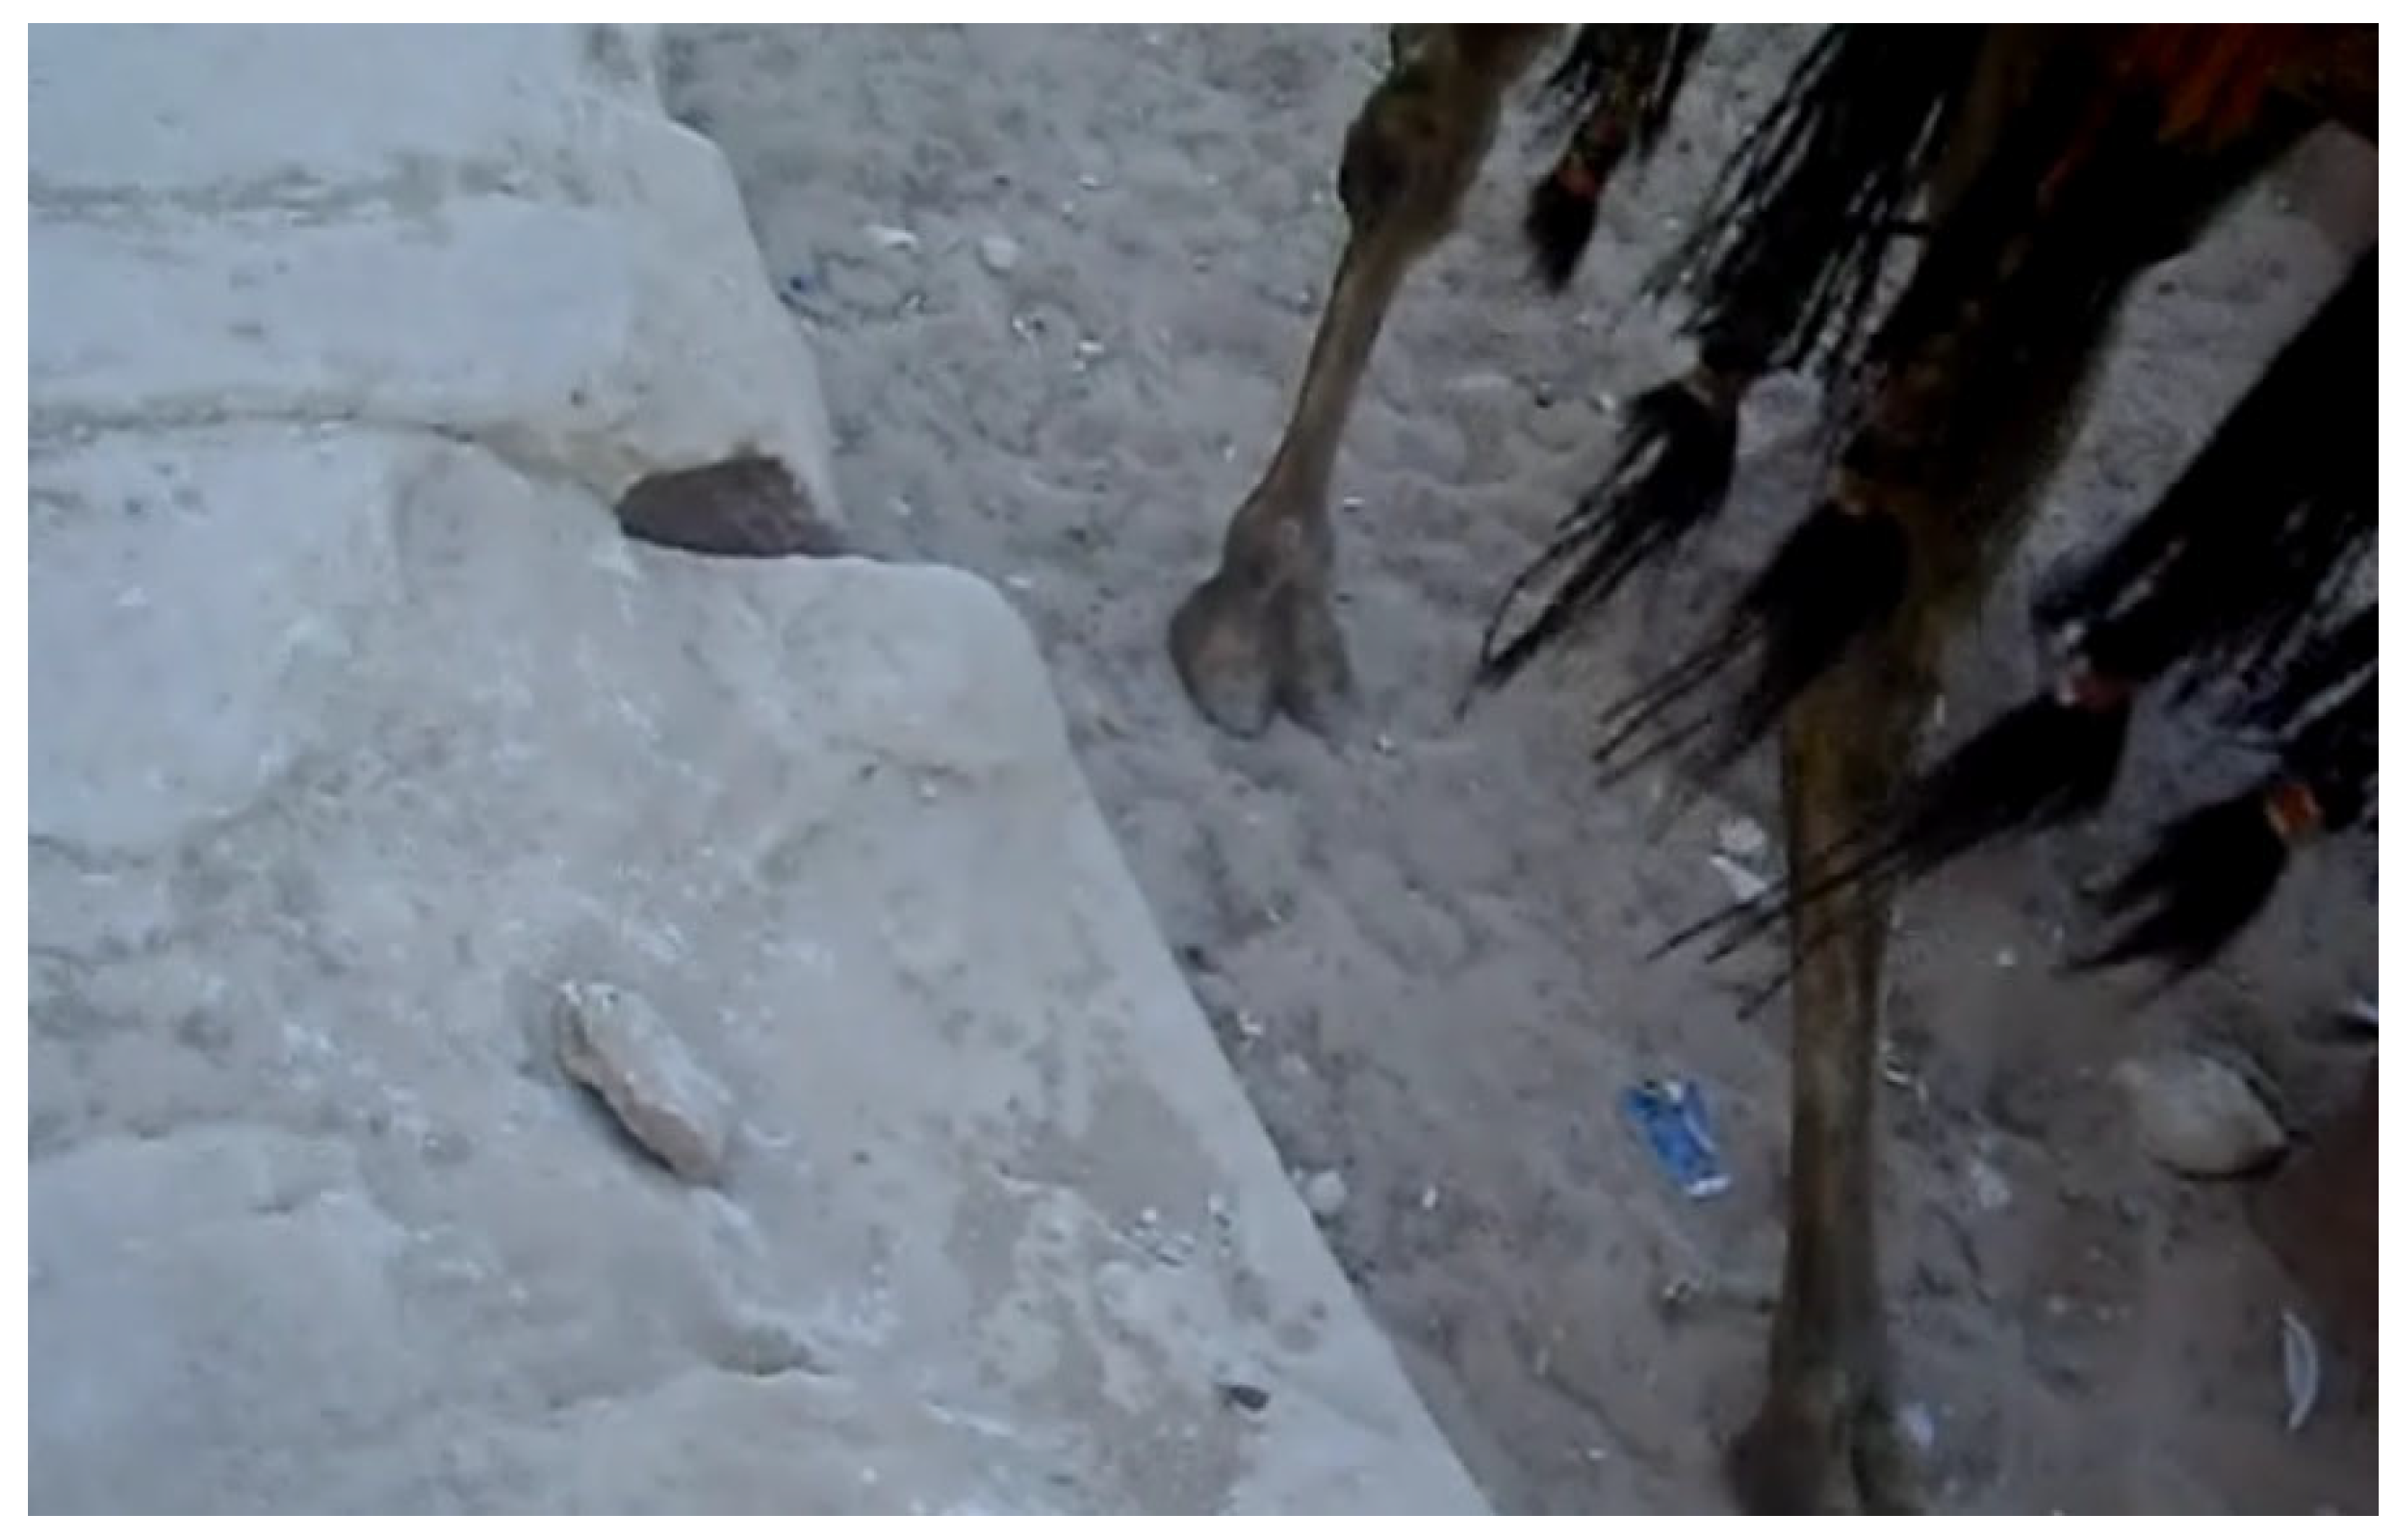
Figure 6 shows one of the points where I measured erosion beneath and outside the removed stones.
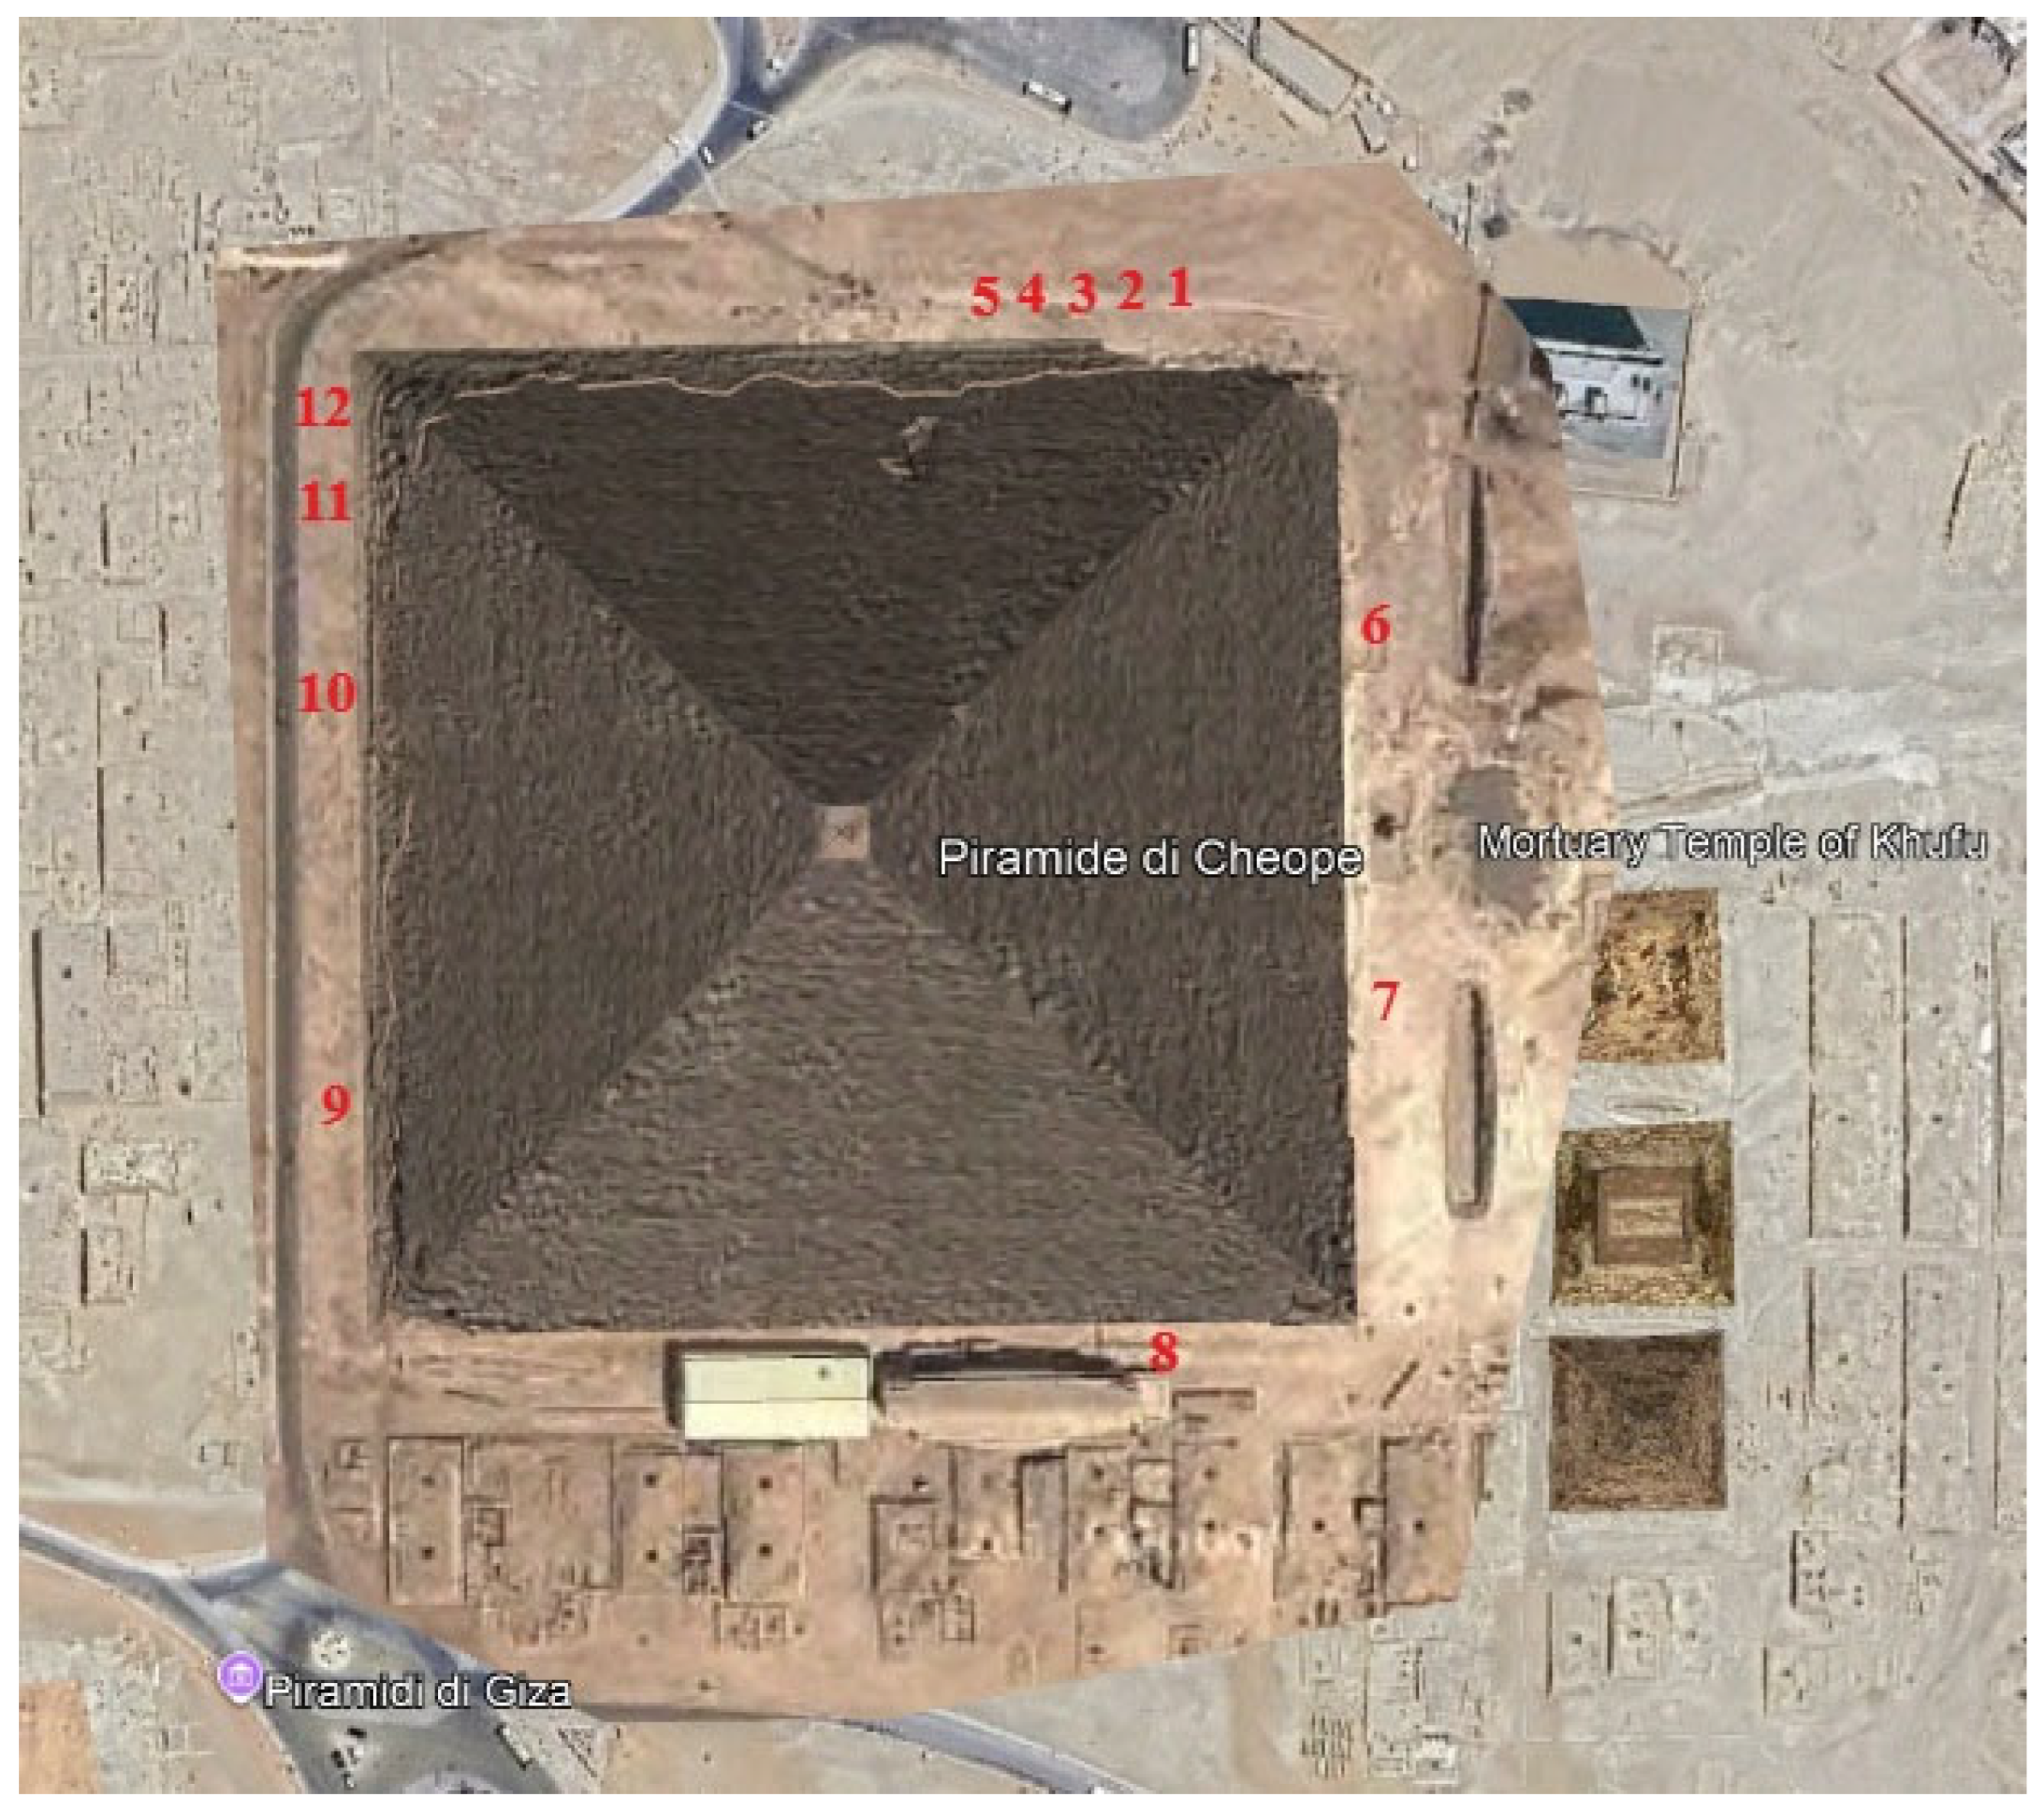
In Figure 7, the pyramid of Akhet Khufu with the position of the 12 points analysed highlighted.
10. Calculation of the Construction Period Based on the Volume Eroded at Each Point
Points of analysis in the G1 pyramid of Akhet Khufu
At analysis point no. 1 on the Pyramid of Khufu, I calculated the relative erosion of the surface characterised by pronounced roughness and pitting-type erosion by estimating the volume of the eroded recesses. This was done by taking measurements at closely spaced points, some of which had been exposed to erosive agents since the time of construction, and others that were exposed only after the removal of the limestone facing blocks.
Figure 8 and 9.
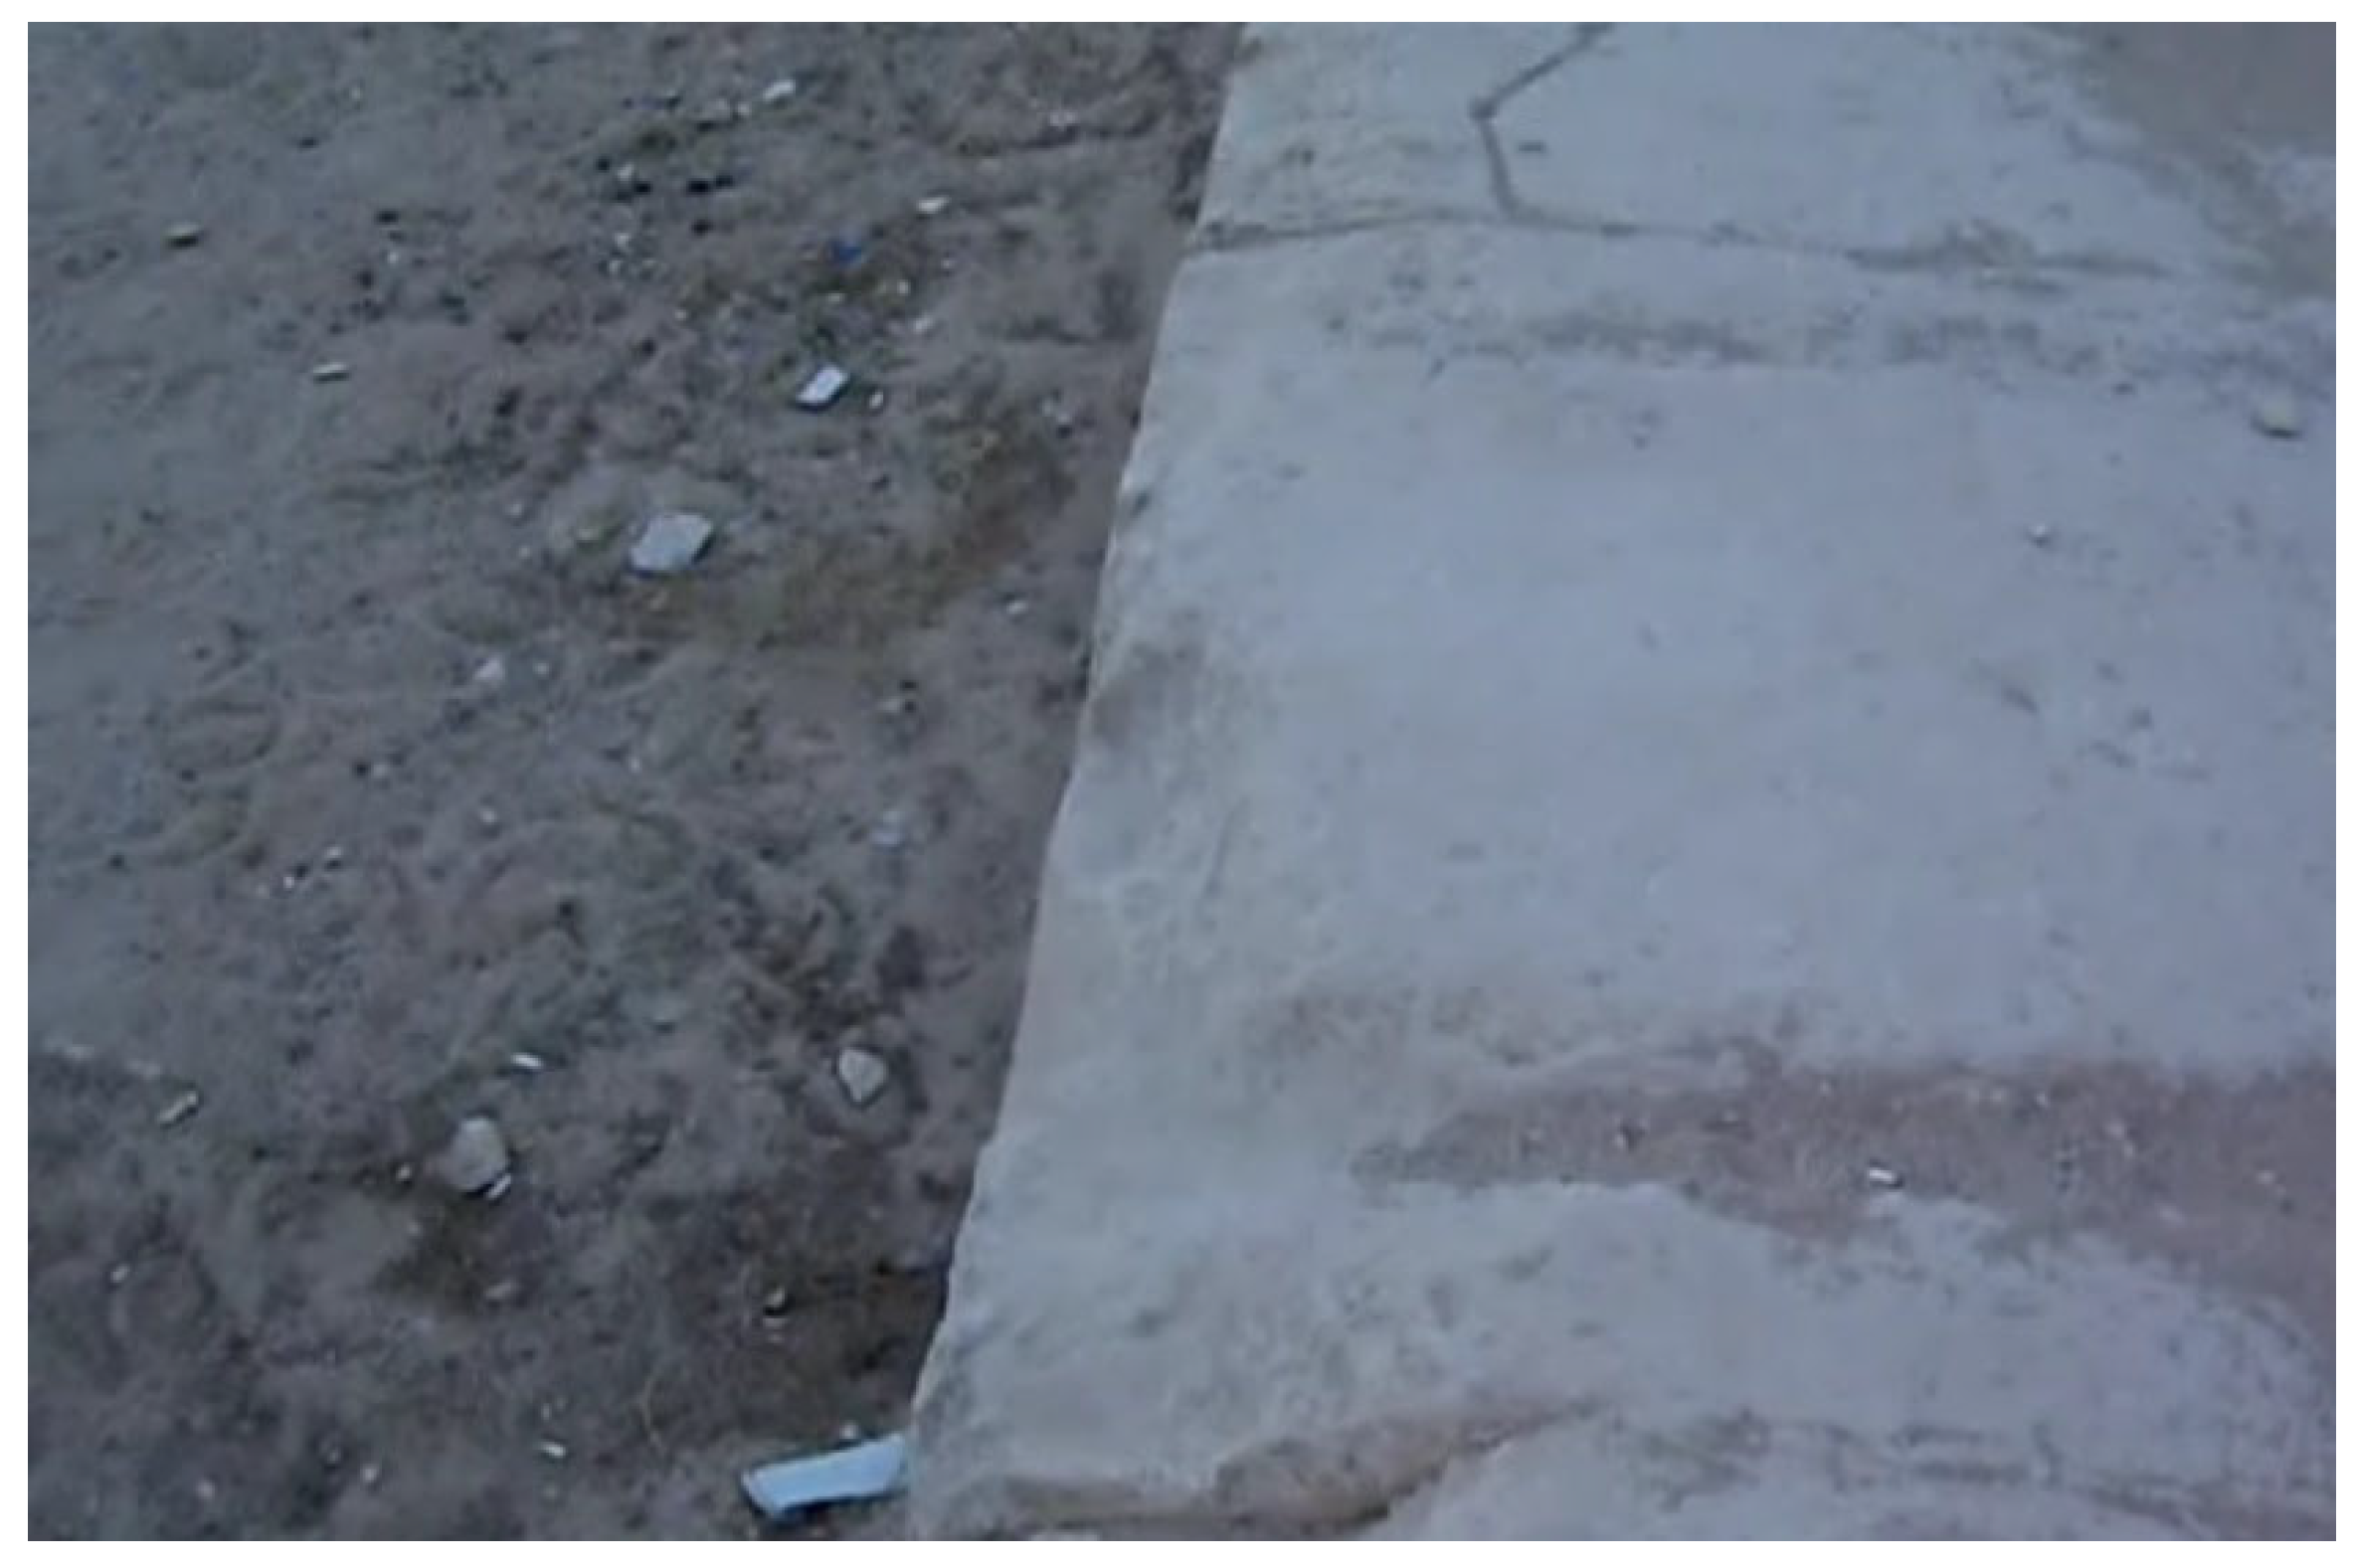
Figure 8. Detail of the Pyramid of Khufu at point 1. On the left are the only remaining limestone cladding blocks, and on the right is the clear difference in erosion between the lower part (which has been exposed since the pyramid was built) and the upper part (which has only been exposed to erosive agents for 675 years).
Figure 8 and 9.
Figure 8. Detail of the Pyramid of Khufu at point 1. On the left are the only remaining limestone cladding blocks, and on the right is the clear difference in erosion between the lower part (which has been exposed since the pyramid was built) and the upper part (which has only been exposed to erosive agents for 675 years).
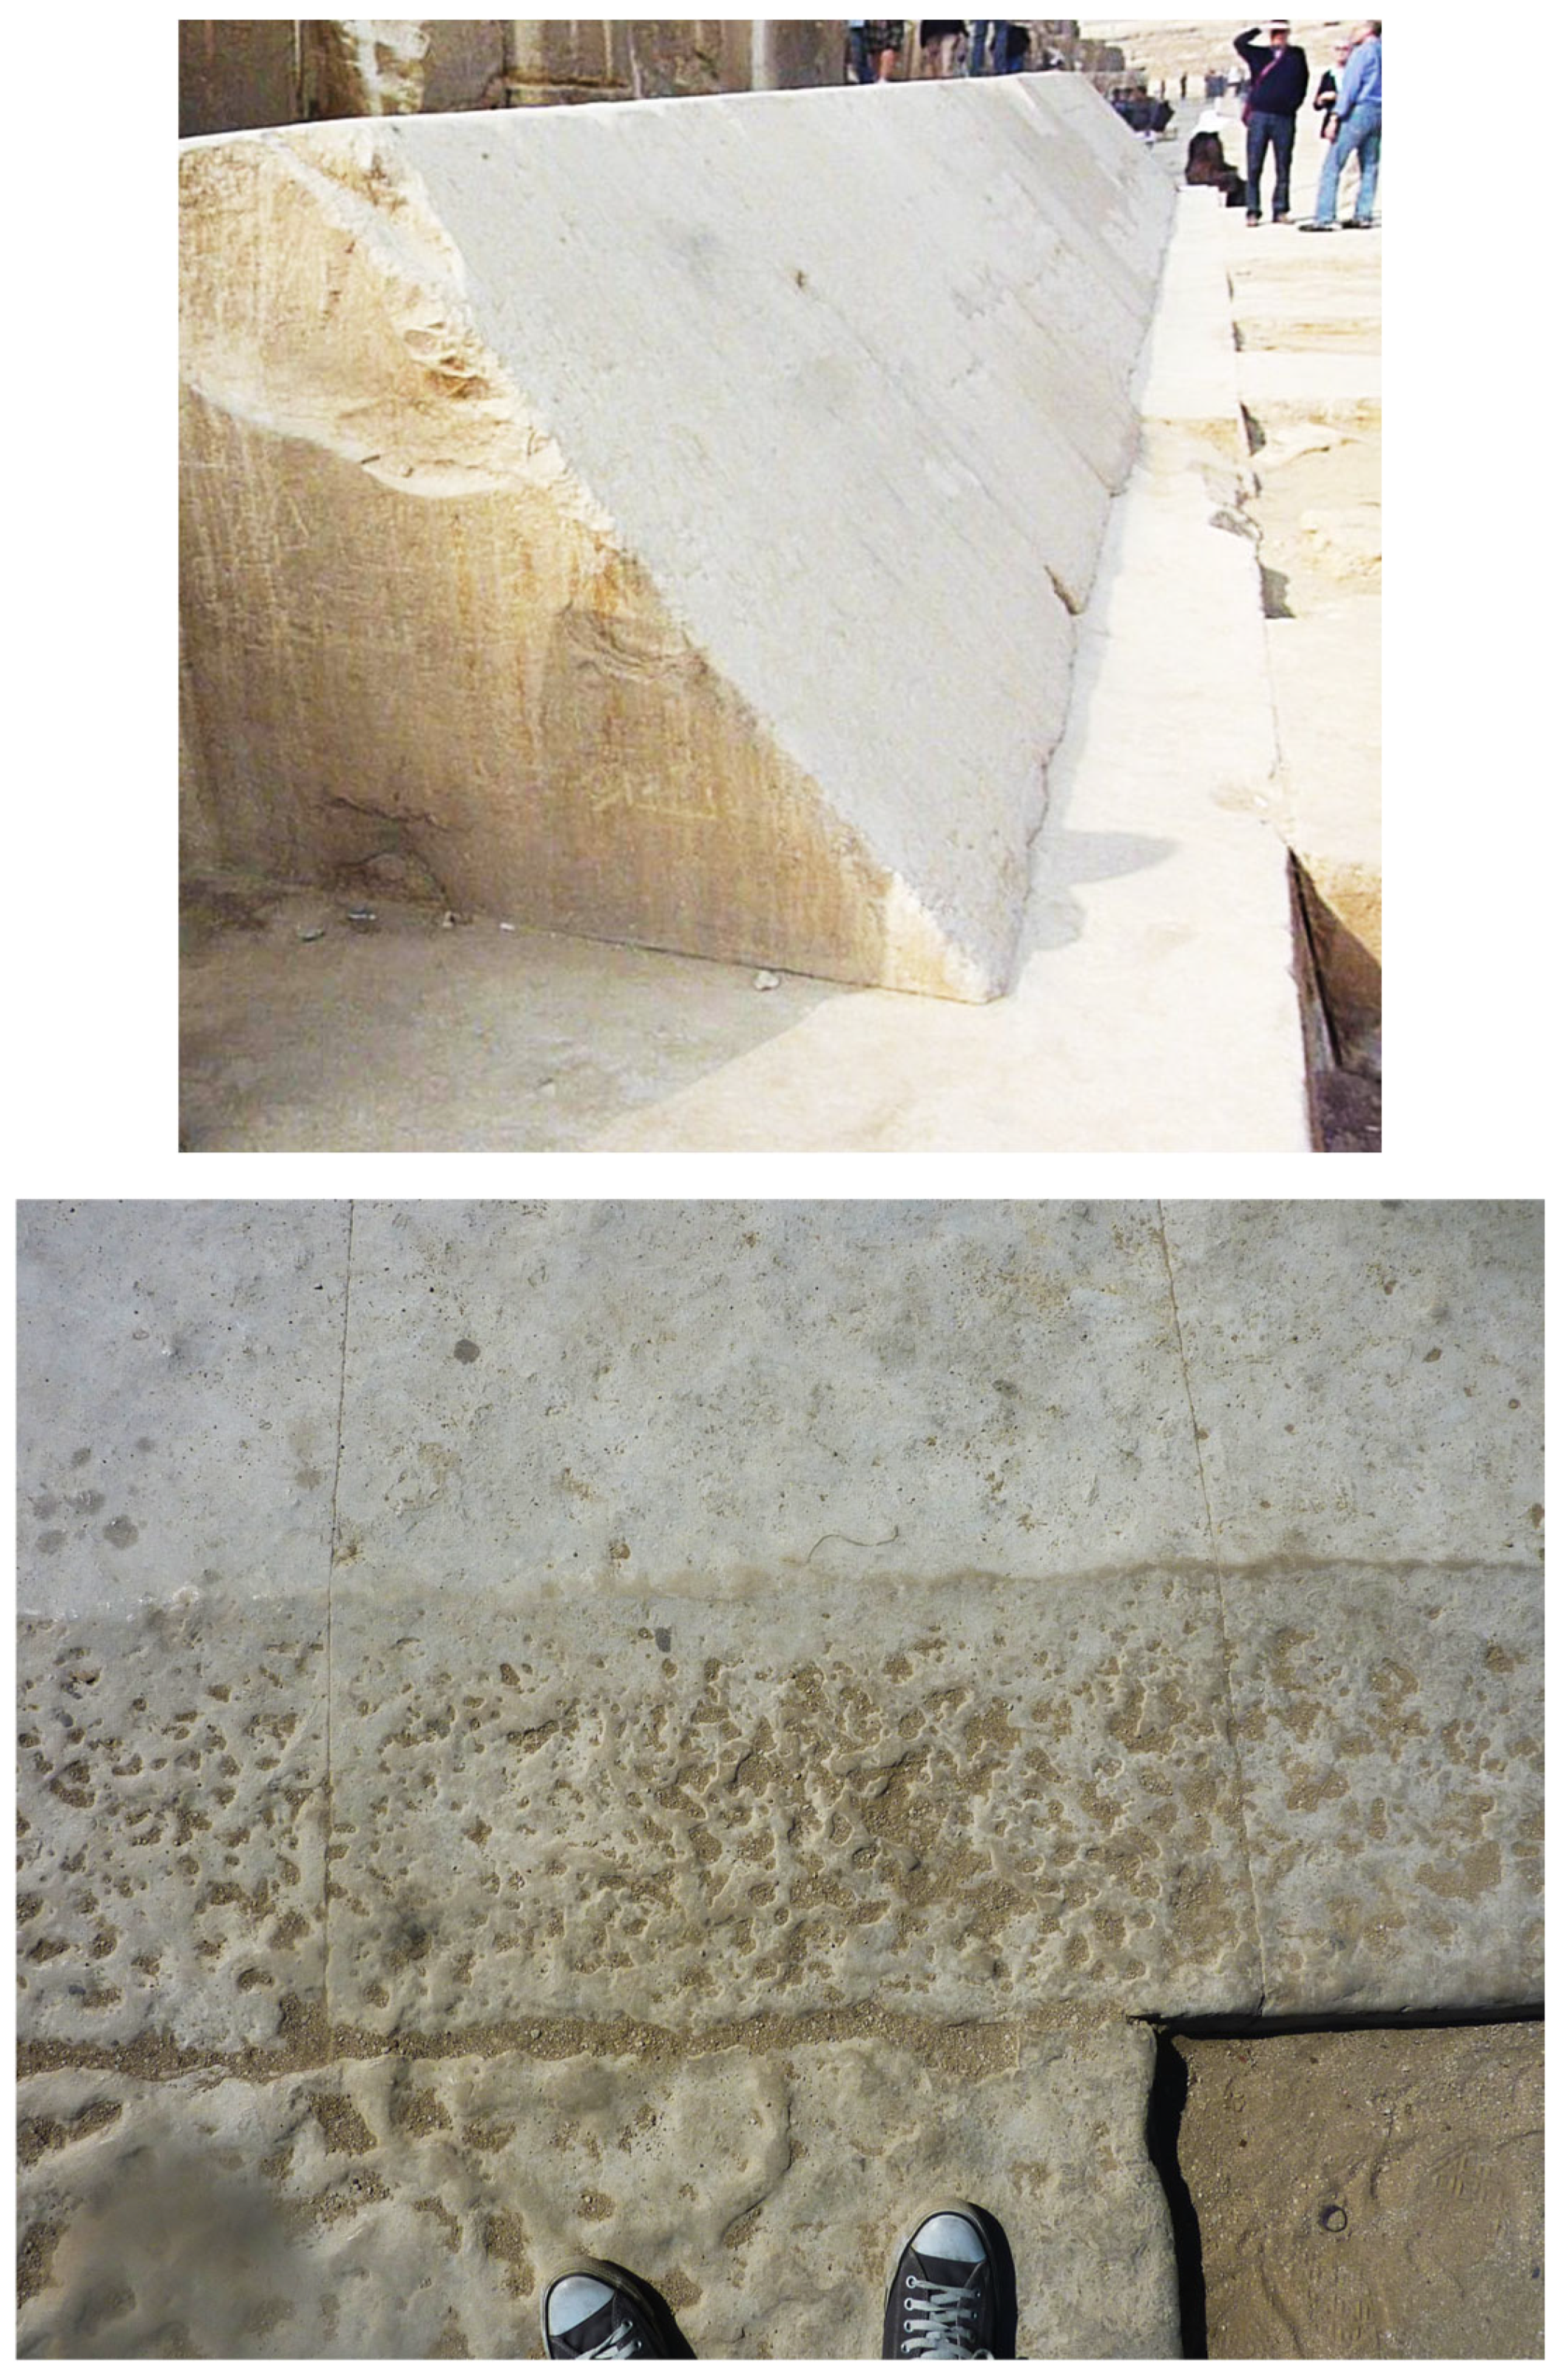
Figure 10.
Calculation of erosion (volume of holes) at point 1: on the left, the part of the limestone paving exposed to erosive agents for approximately 675 years; on the right, the part exposed since the time of construction.
Figure 10.
Calculation of erosion (volume of holes) at point 1: on the left, the part of the limestone paving exposed to erosive agents for approximately 675 years; on the right, the part exposed since the time of construction.
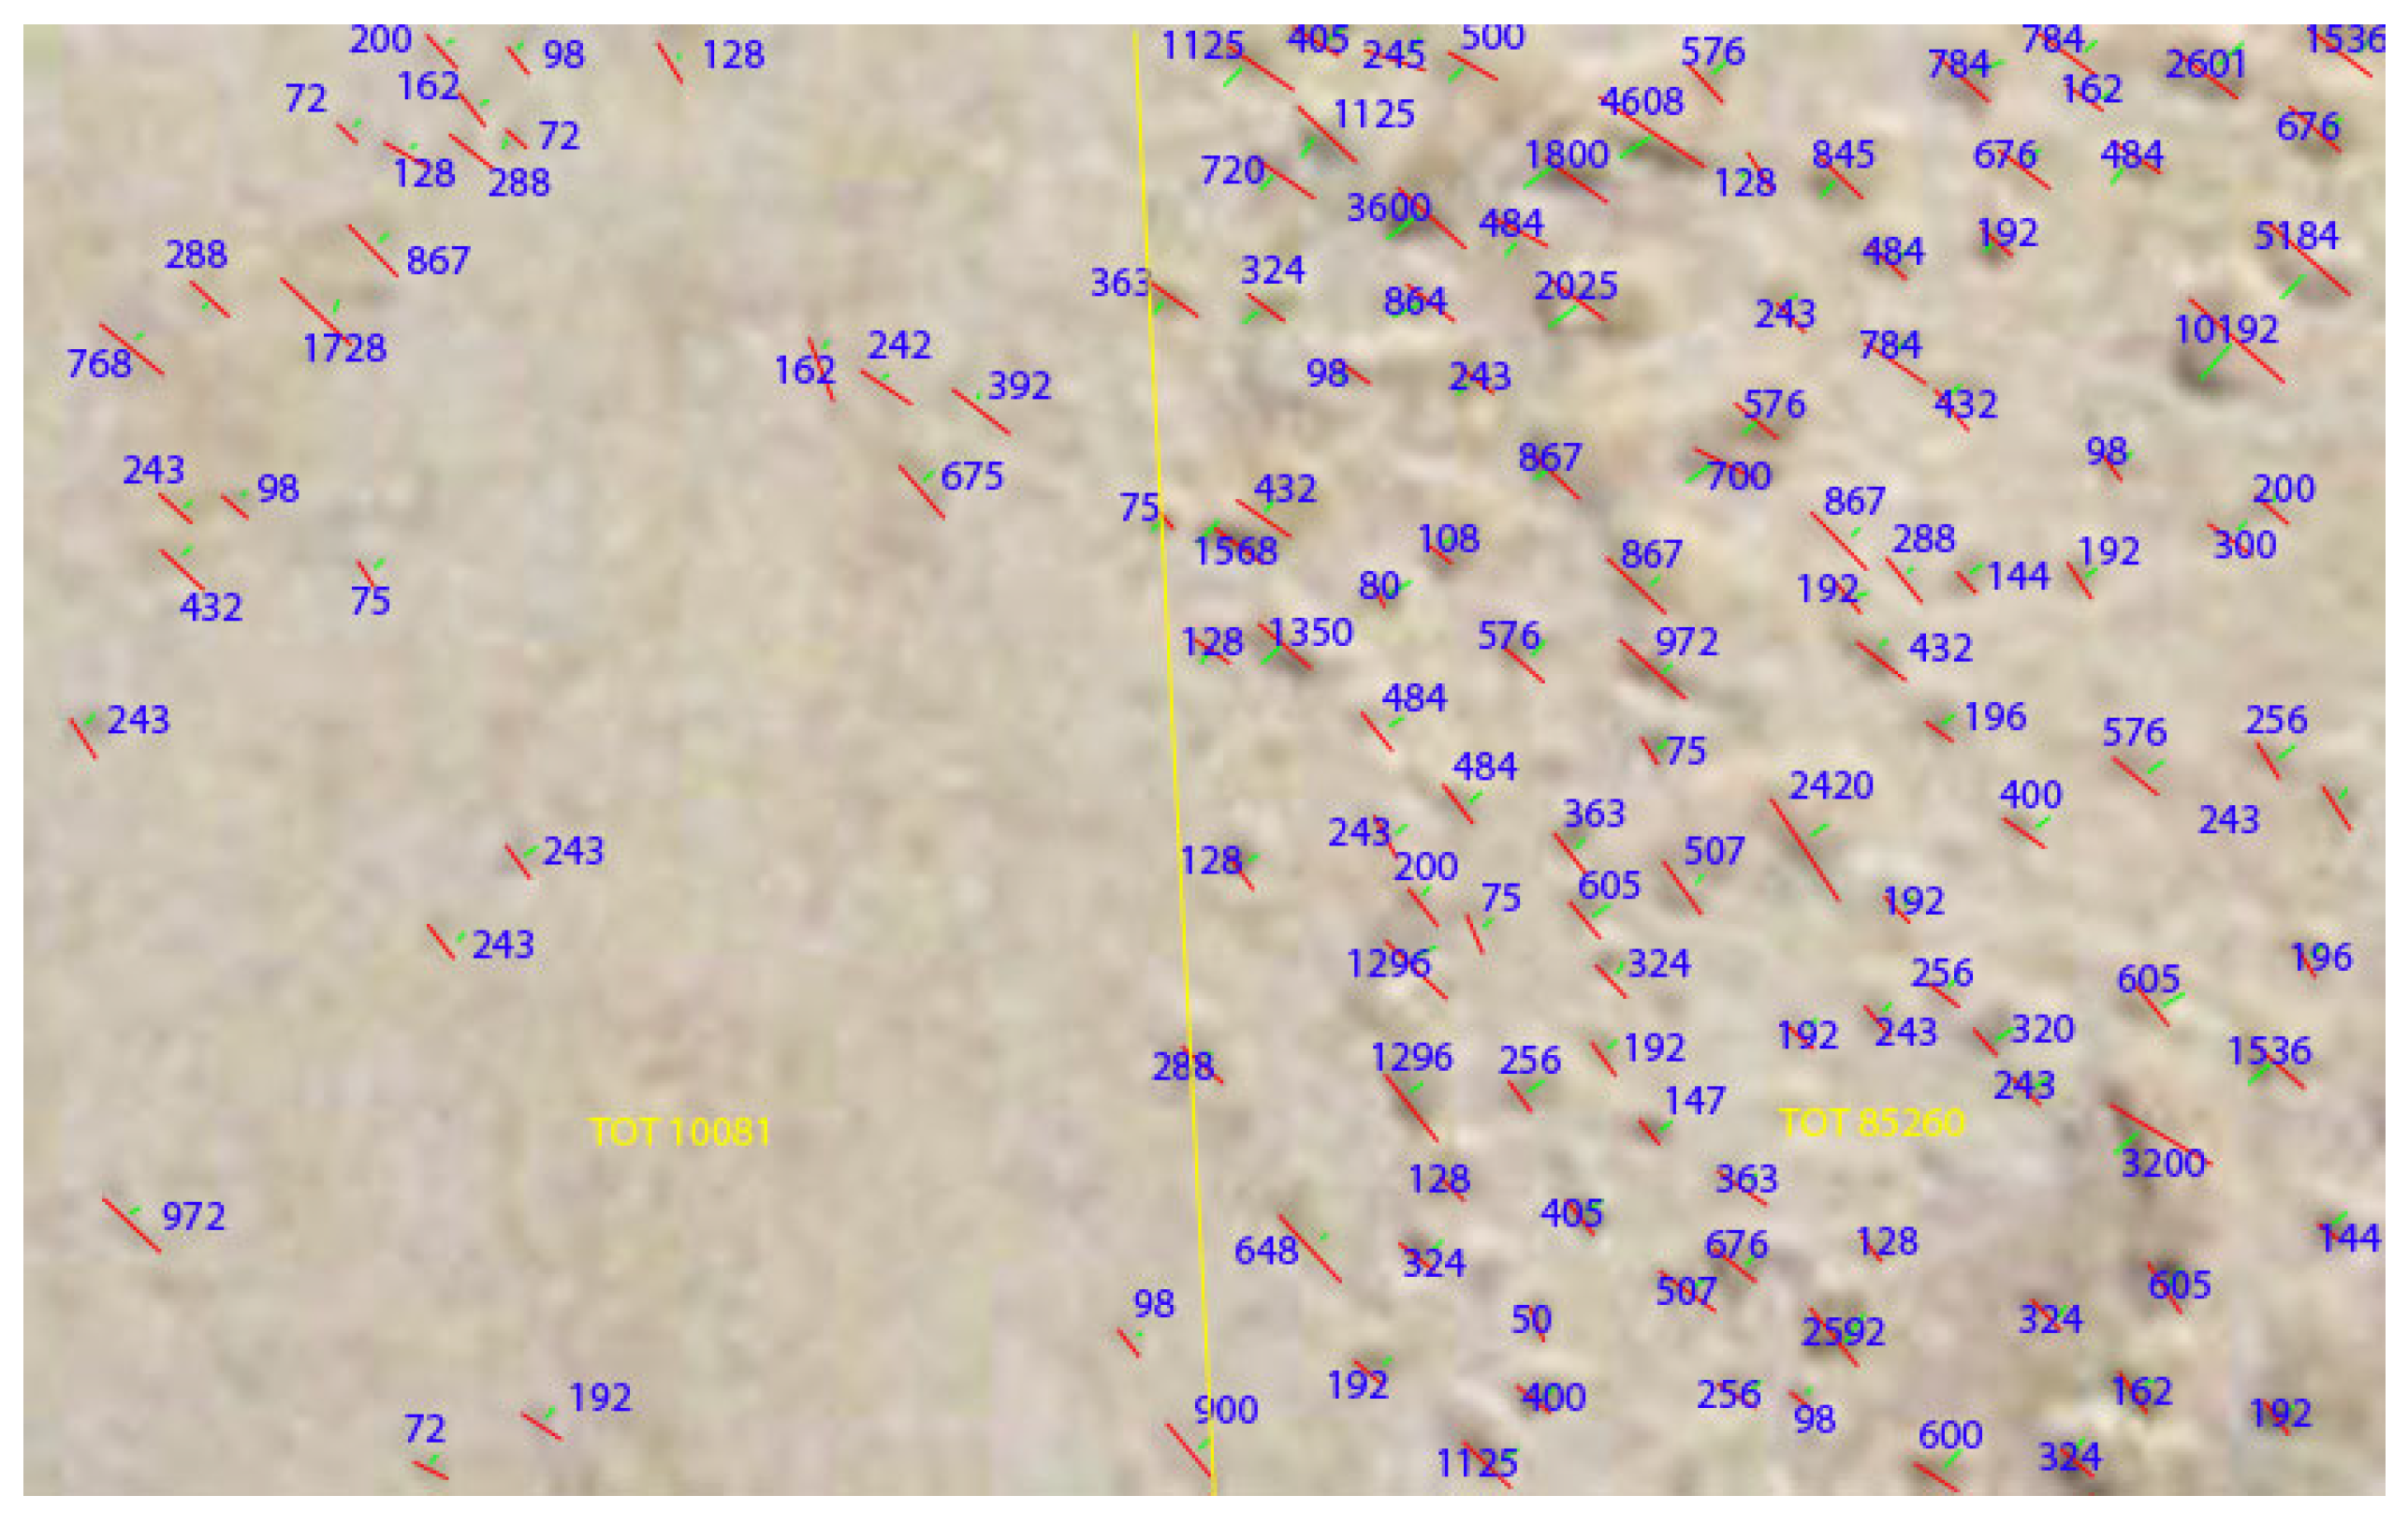
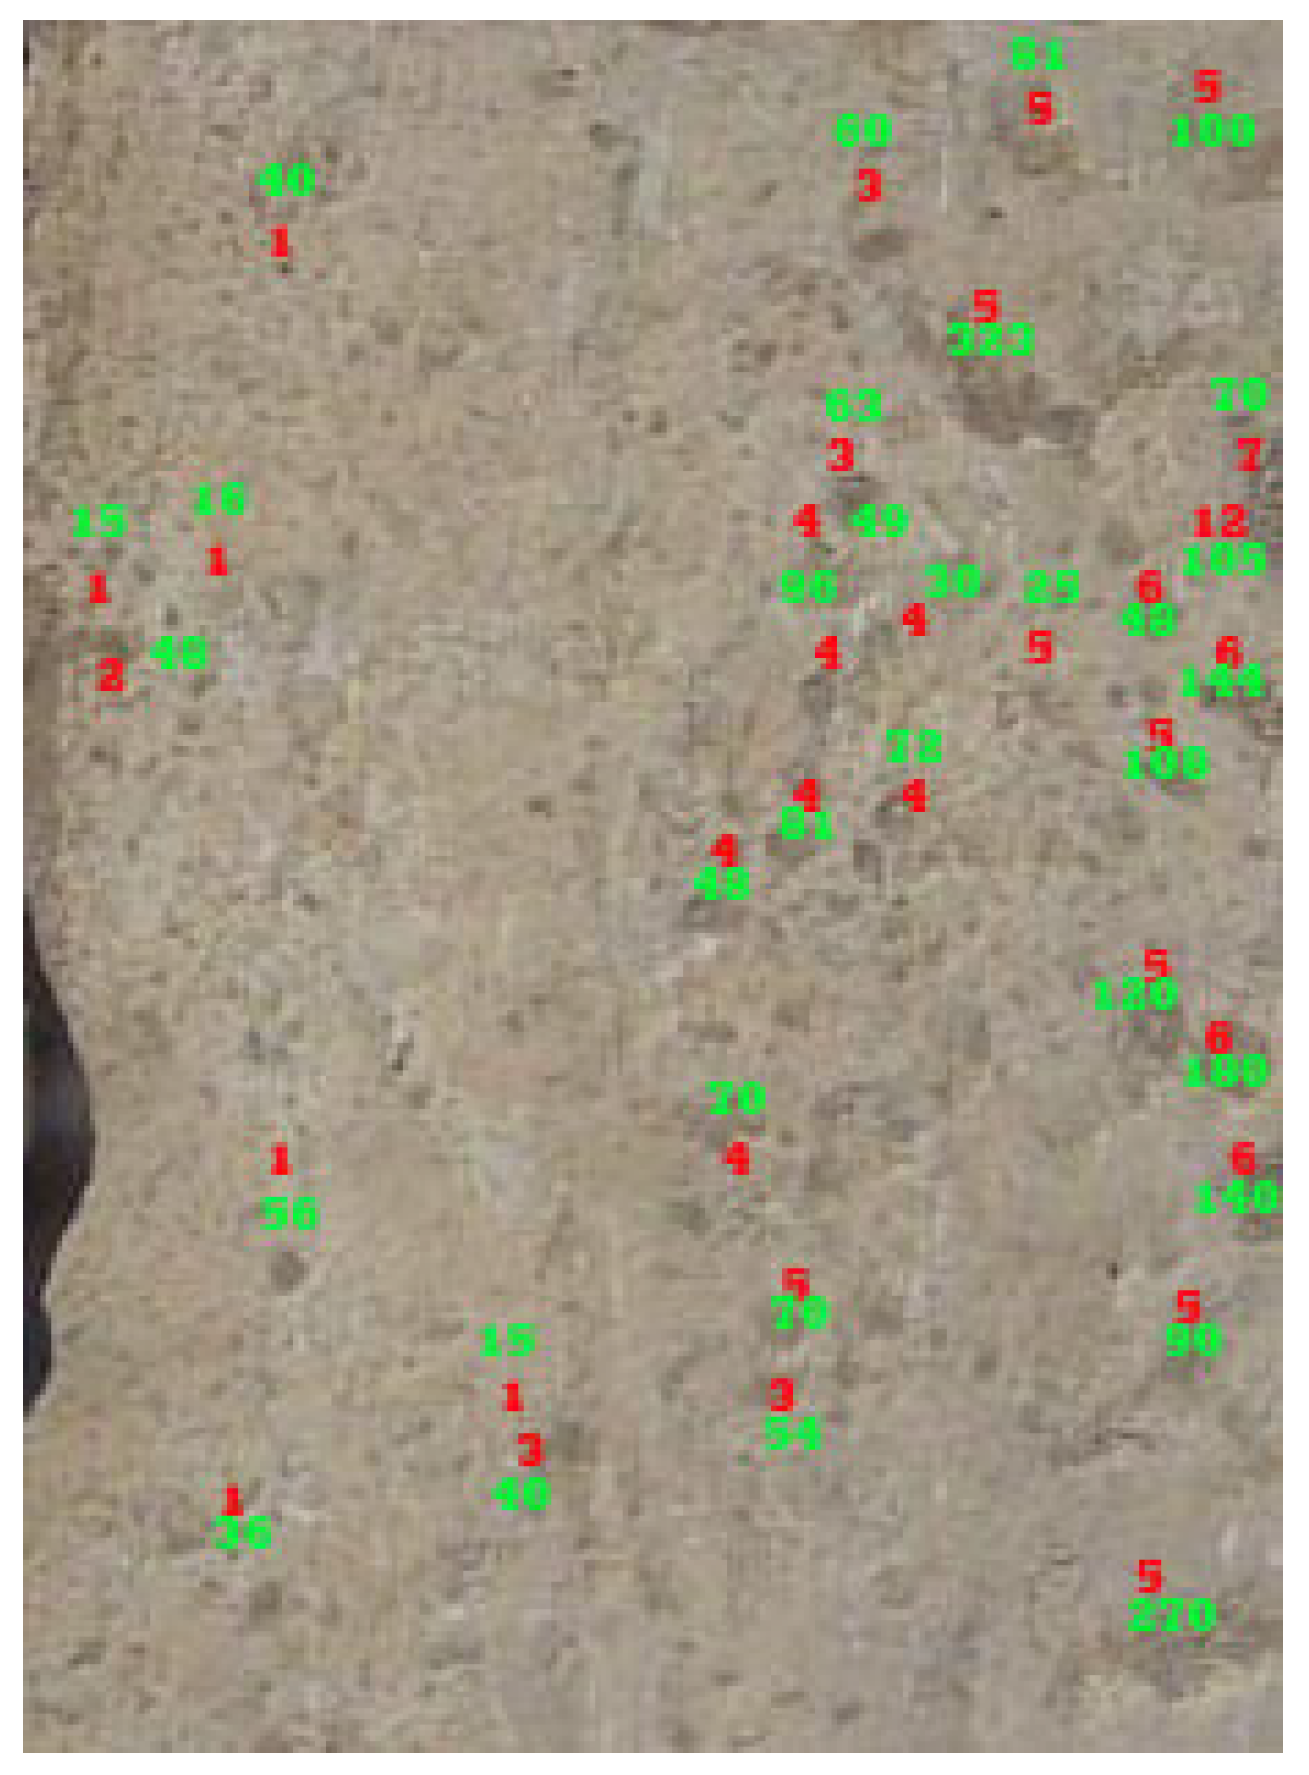
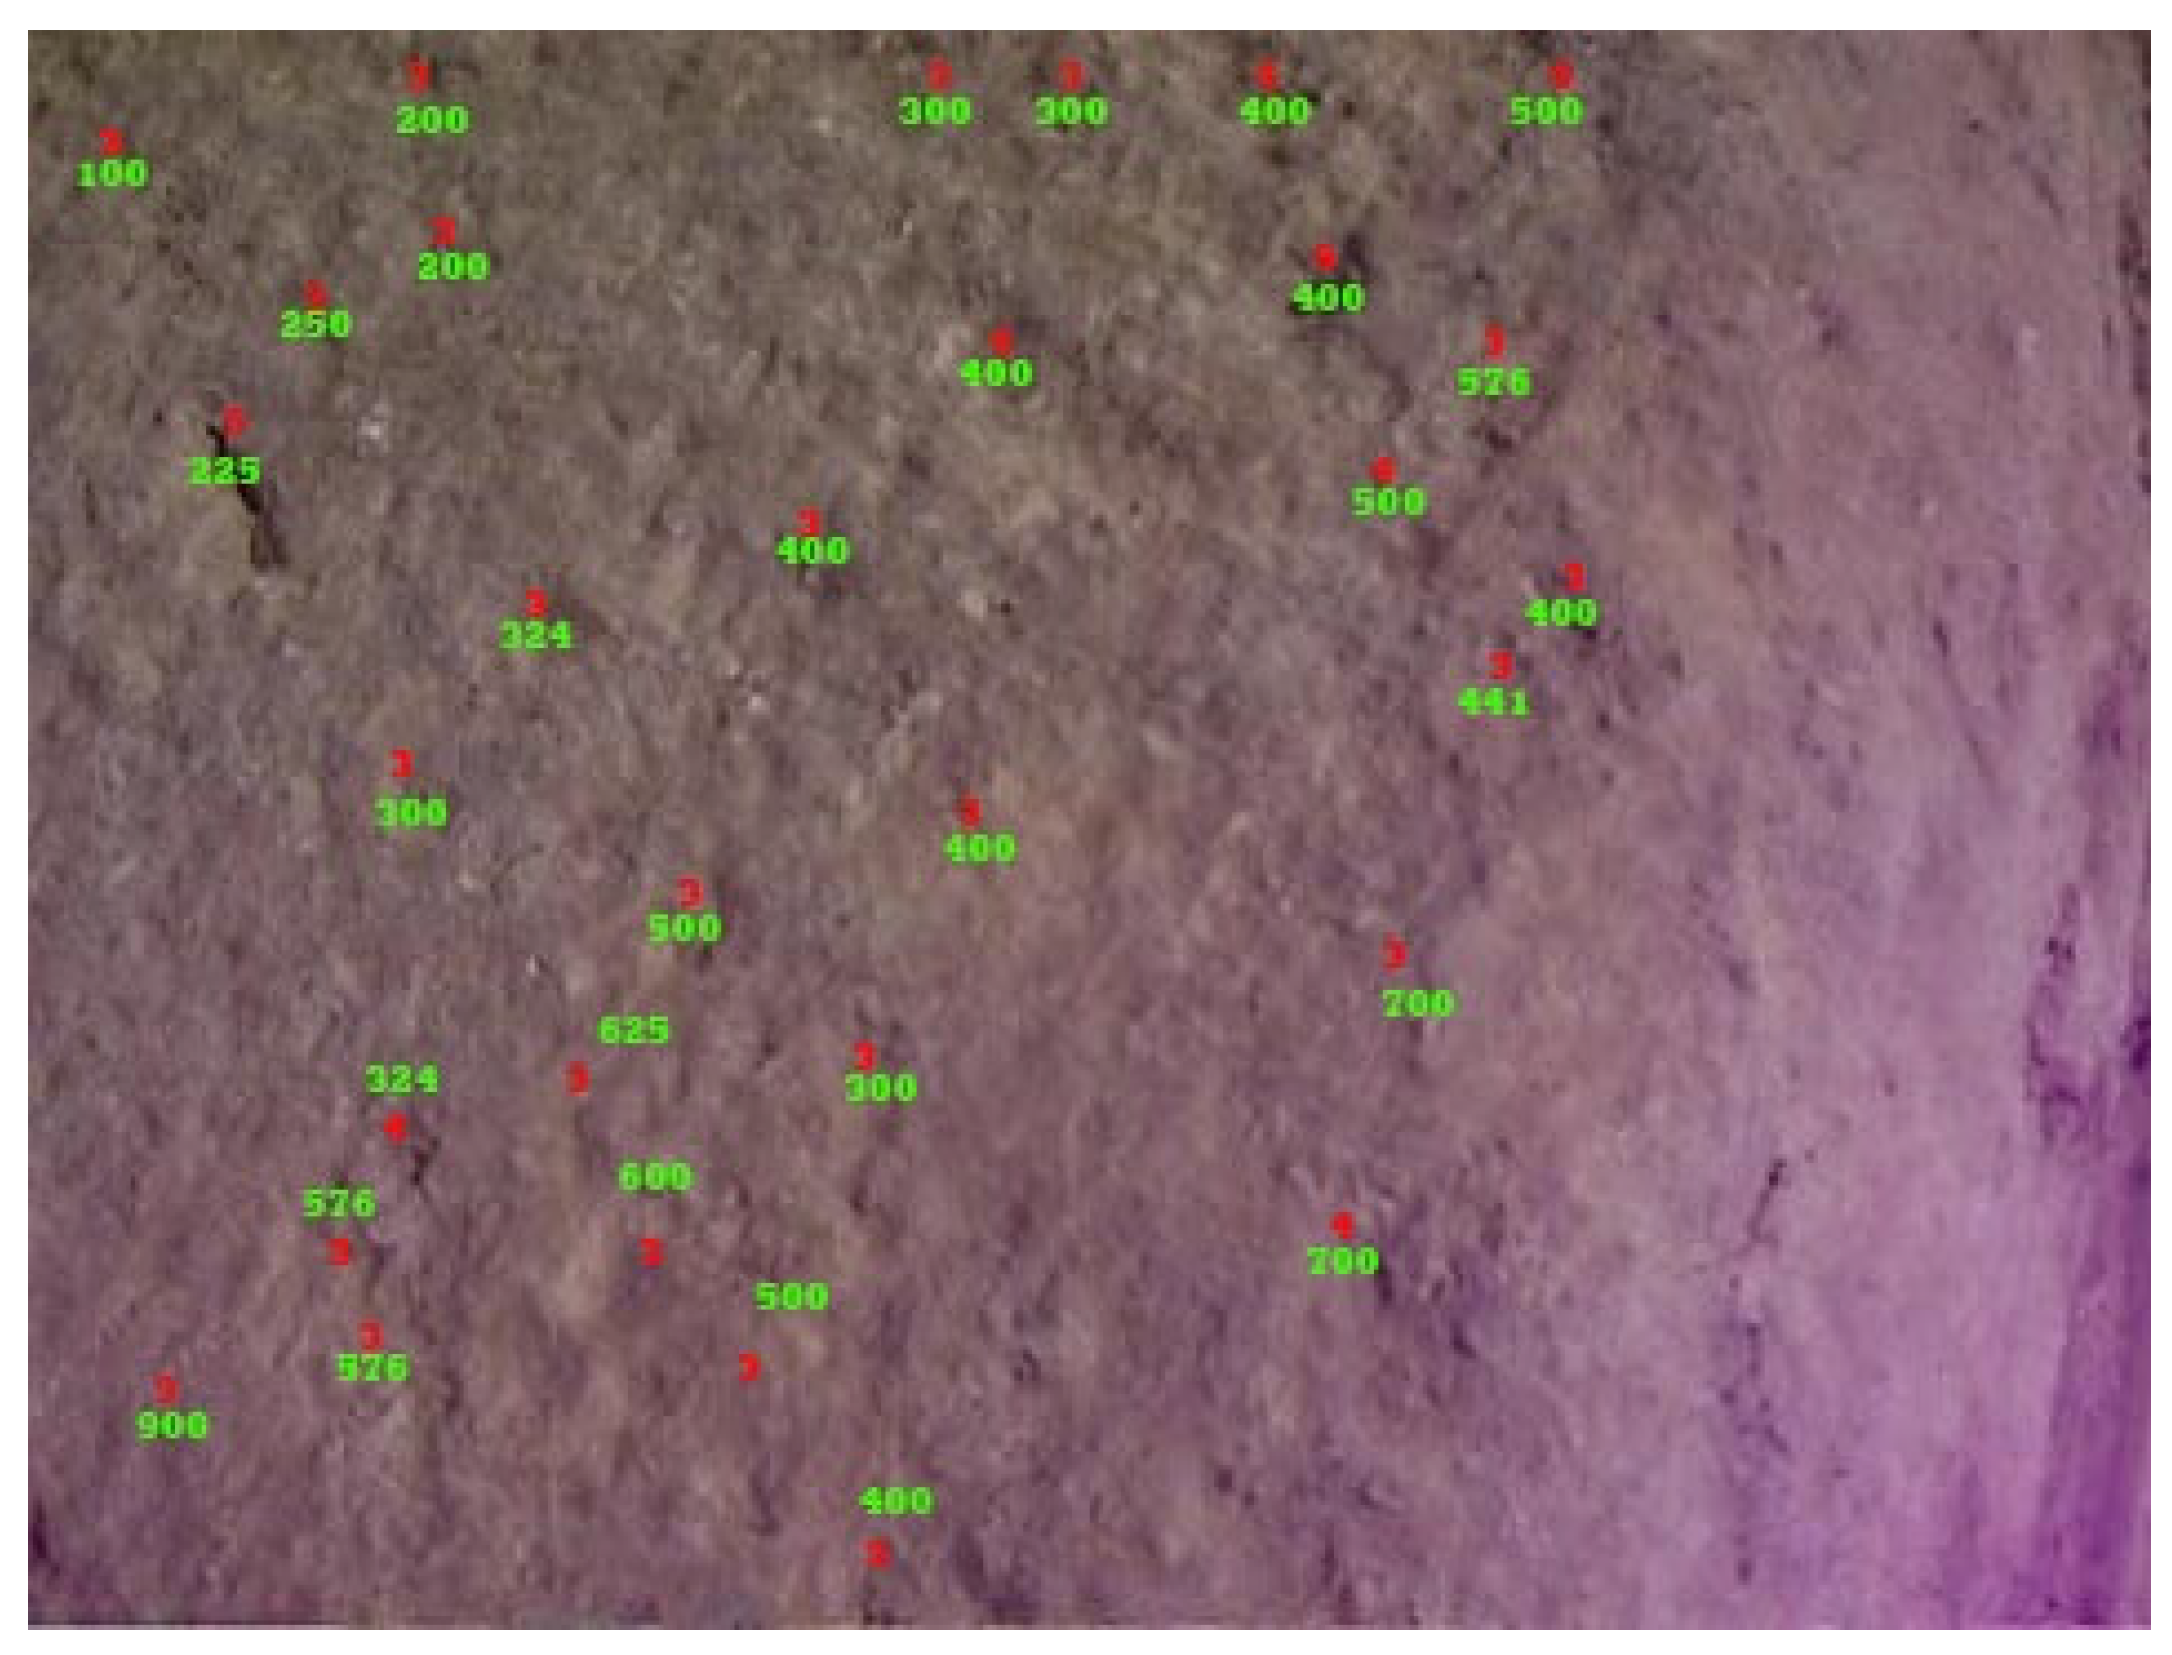
In this image, I calculated the volume, expressed in mm3, of each erosion cavity, and then the total volume of eroded rock at point 1. The right-hand side has been exposed to erosive agents since the beginning of construction, while the left-hand side has been exposed to erosive agents for approximately 675 years.
Calculation of the construction period based on the volume of eroded recesses at Point 1 (Khufu)
Total volume of eroded recesses in the continuously exposed section: 85,260 mm³
Total volume of eroded recesses exposed since 675 years B.P.: 10,081 mm³
Estimated construction date: 85,260 × 675 / 10,081 = 5,708 years B.P. [6]
Figure 11.
Calculation of erosion (volume of holes) in point 2: on the right, the part of the limestone pavement exposed to erosive agents for approximately 675 years; on the left, the part exposed since the time of construction.
Figure 11.
Calculation of erosion (volume of holes) in point 2: on the right, the part of the limestone pavement exposed to erosive agents for approximately 675 years; on the left, the part exposed since the time of construction.
In this image, the area (highlighted in green) and the depth (highlighted in red) of each recess were calculated and expressed in square millimetres and millimetres, respectively. The total volume of eroded rock at analysis point 2 was then determined. The left-hand side corresponds to the surface that has been exposed to erosive agents since the time of construction, whereas the right-hand side represents the surface that has been exposed to erosive agents for approximately 675 years.
Calculation of construction period based on volume of eroded recesses, point 2 Khufu
Total volume of eroded recesses in exposed part: 9,124 mm3
Total volume of eroded recesses in exposed part 675 years B.P.: 343 mm3
Date of construction: 9,124 x 675 / 343 = 17,955 years B.P.
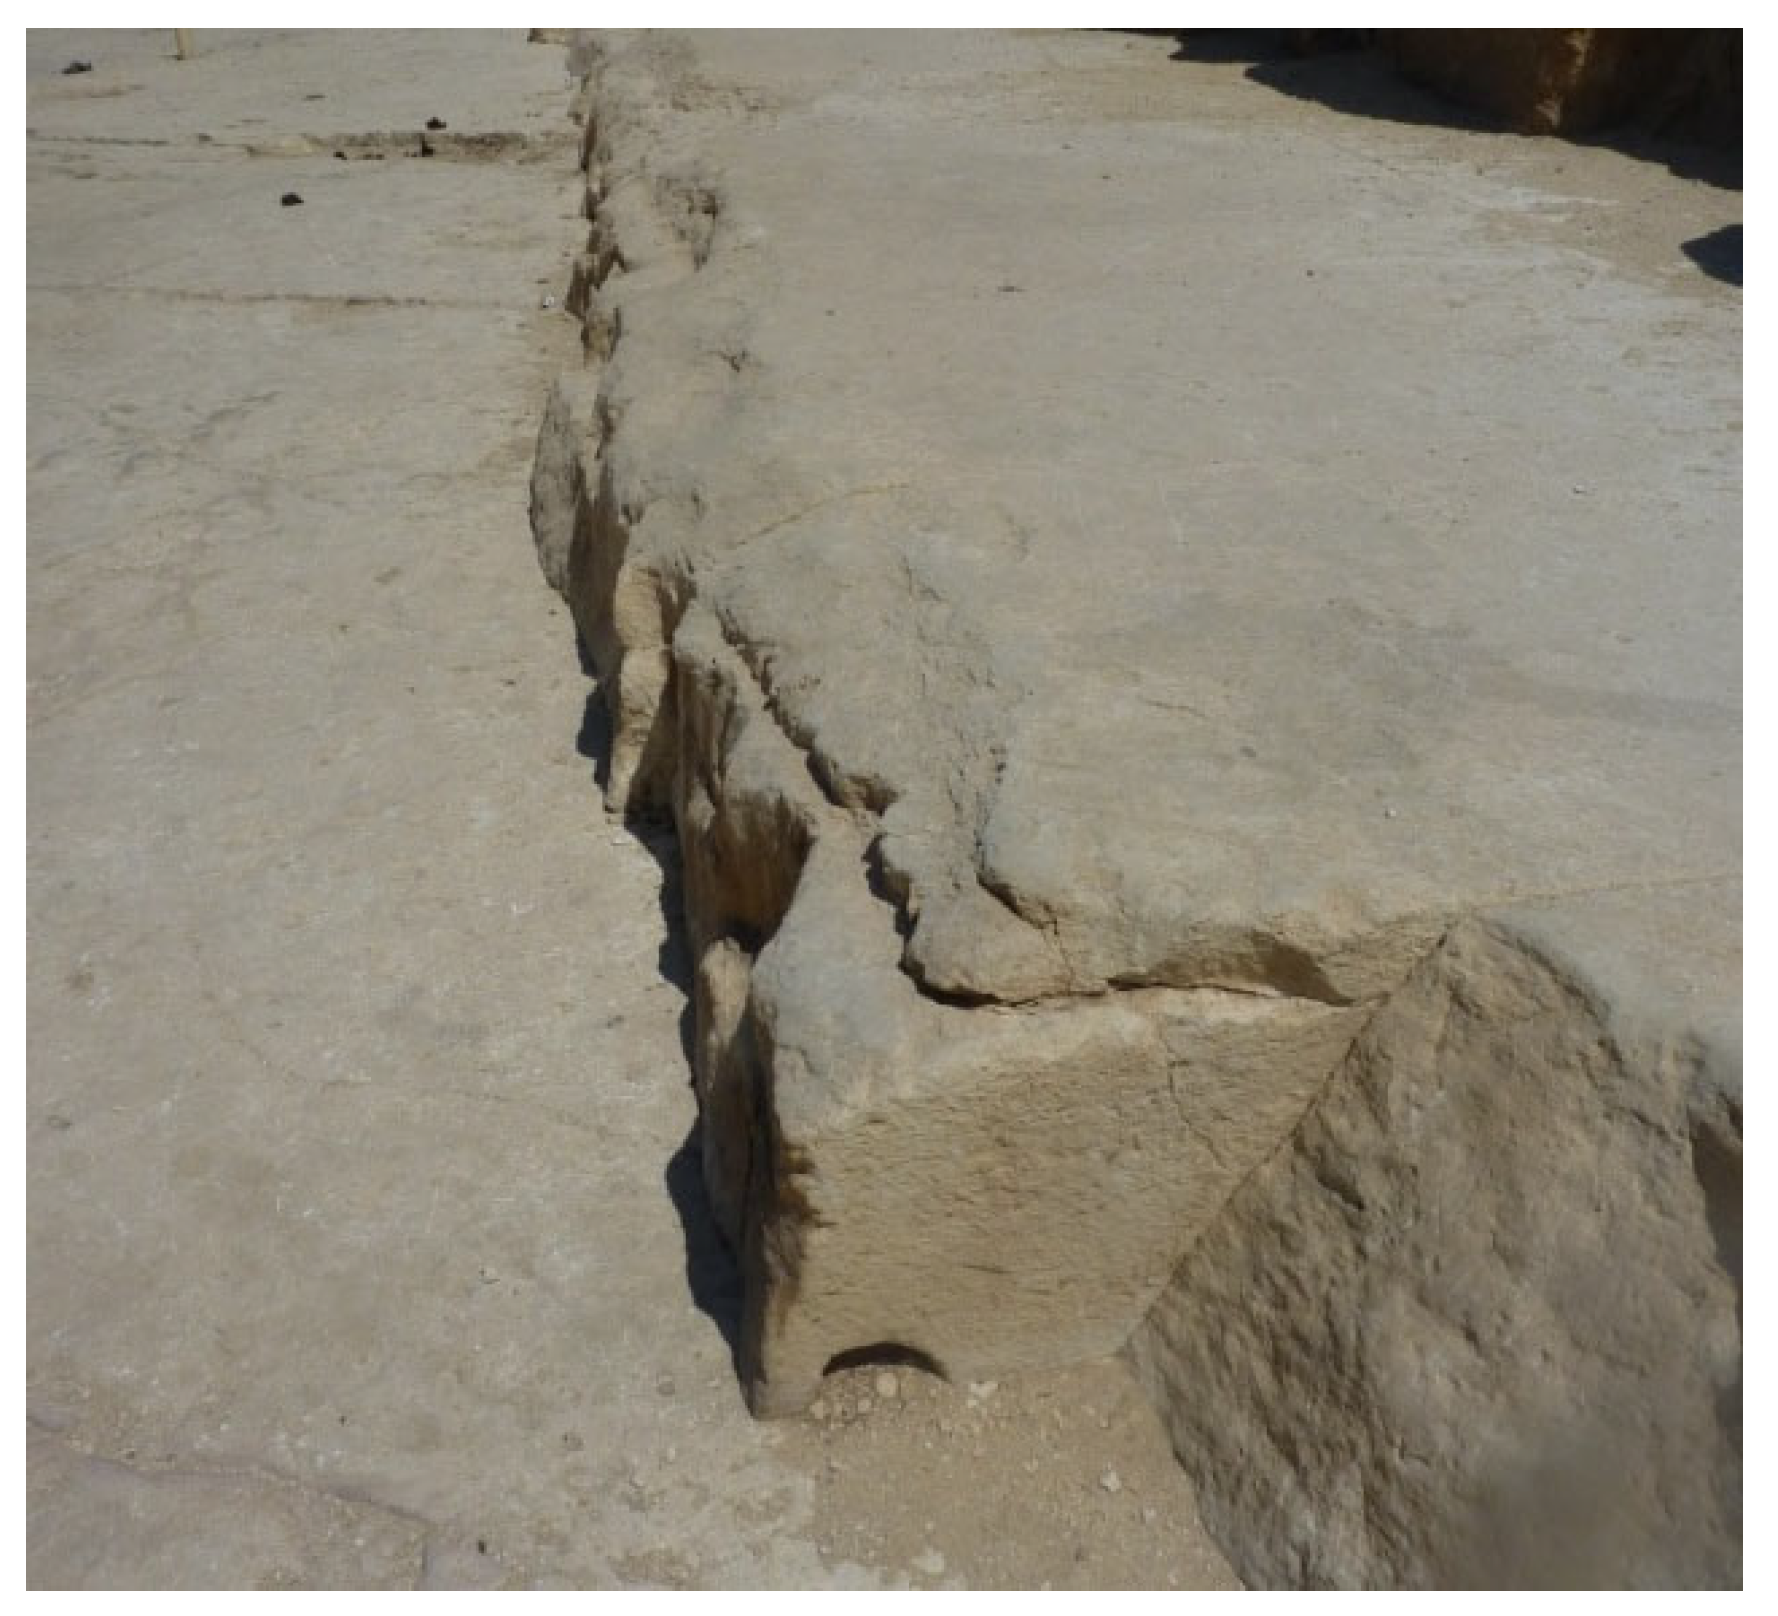
At point 3, I measured the average erosion of the pyramid paving immediately outside the area formerly covered by the removed casing blocks, and compared it with the average erosion of the paving that lay beneath the removed cladding.
Figure 12 and 13.
Wear of the paving immediately outside the cladding blocks at point 3.
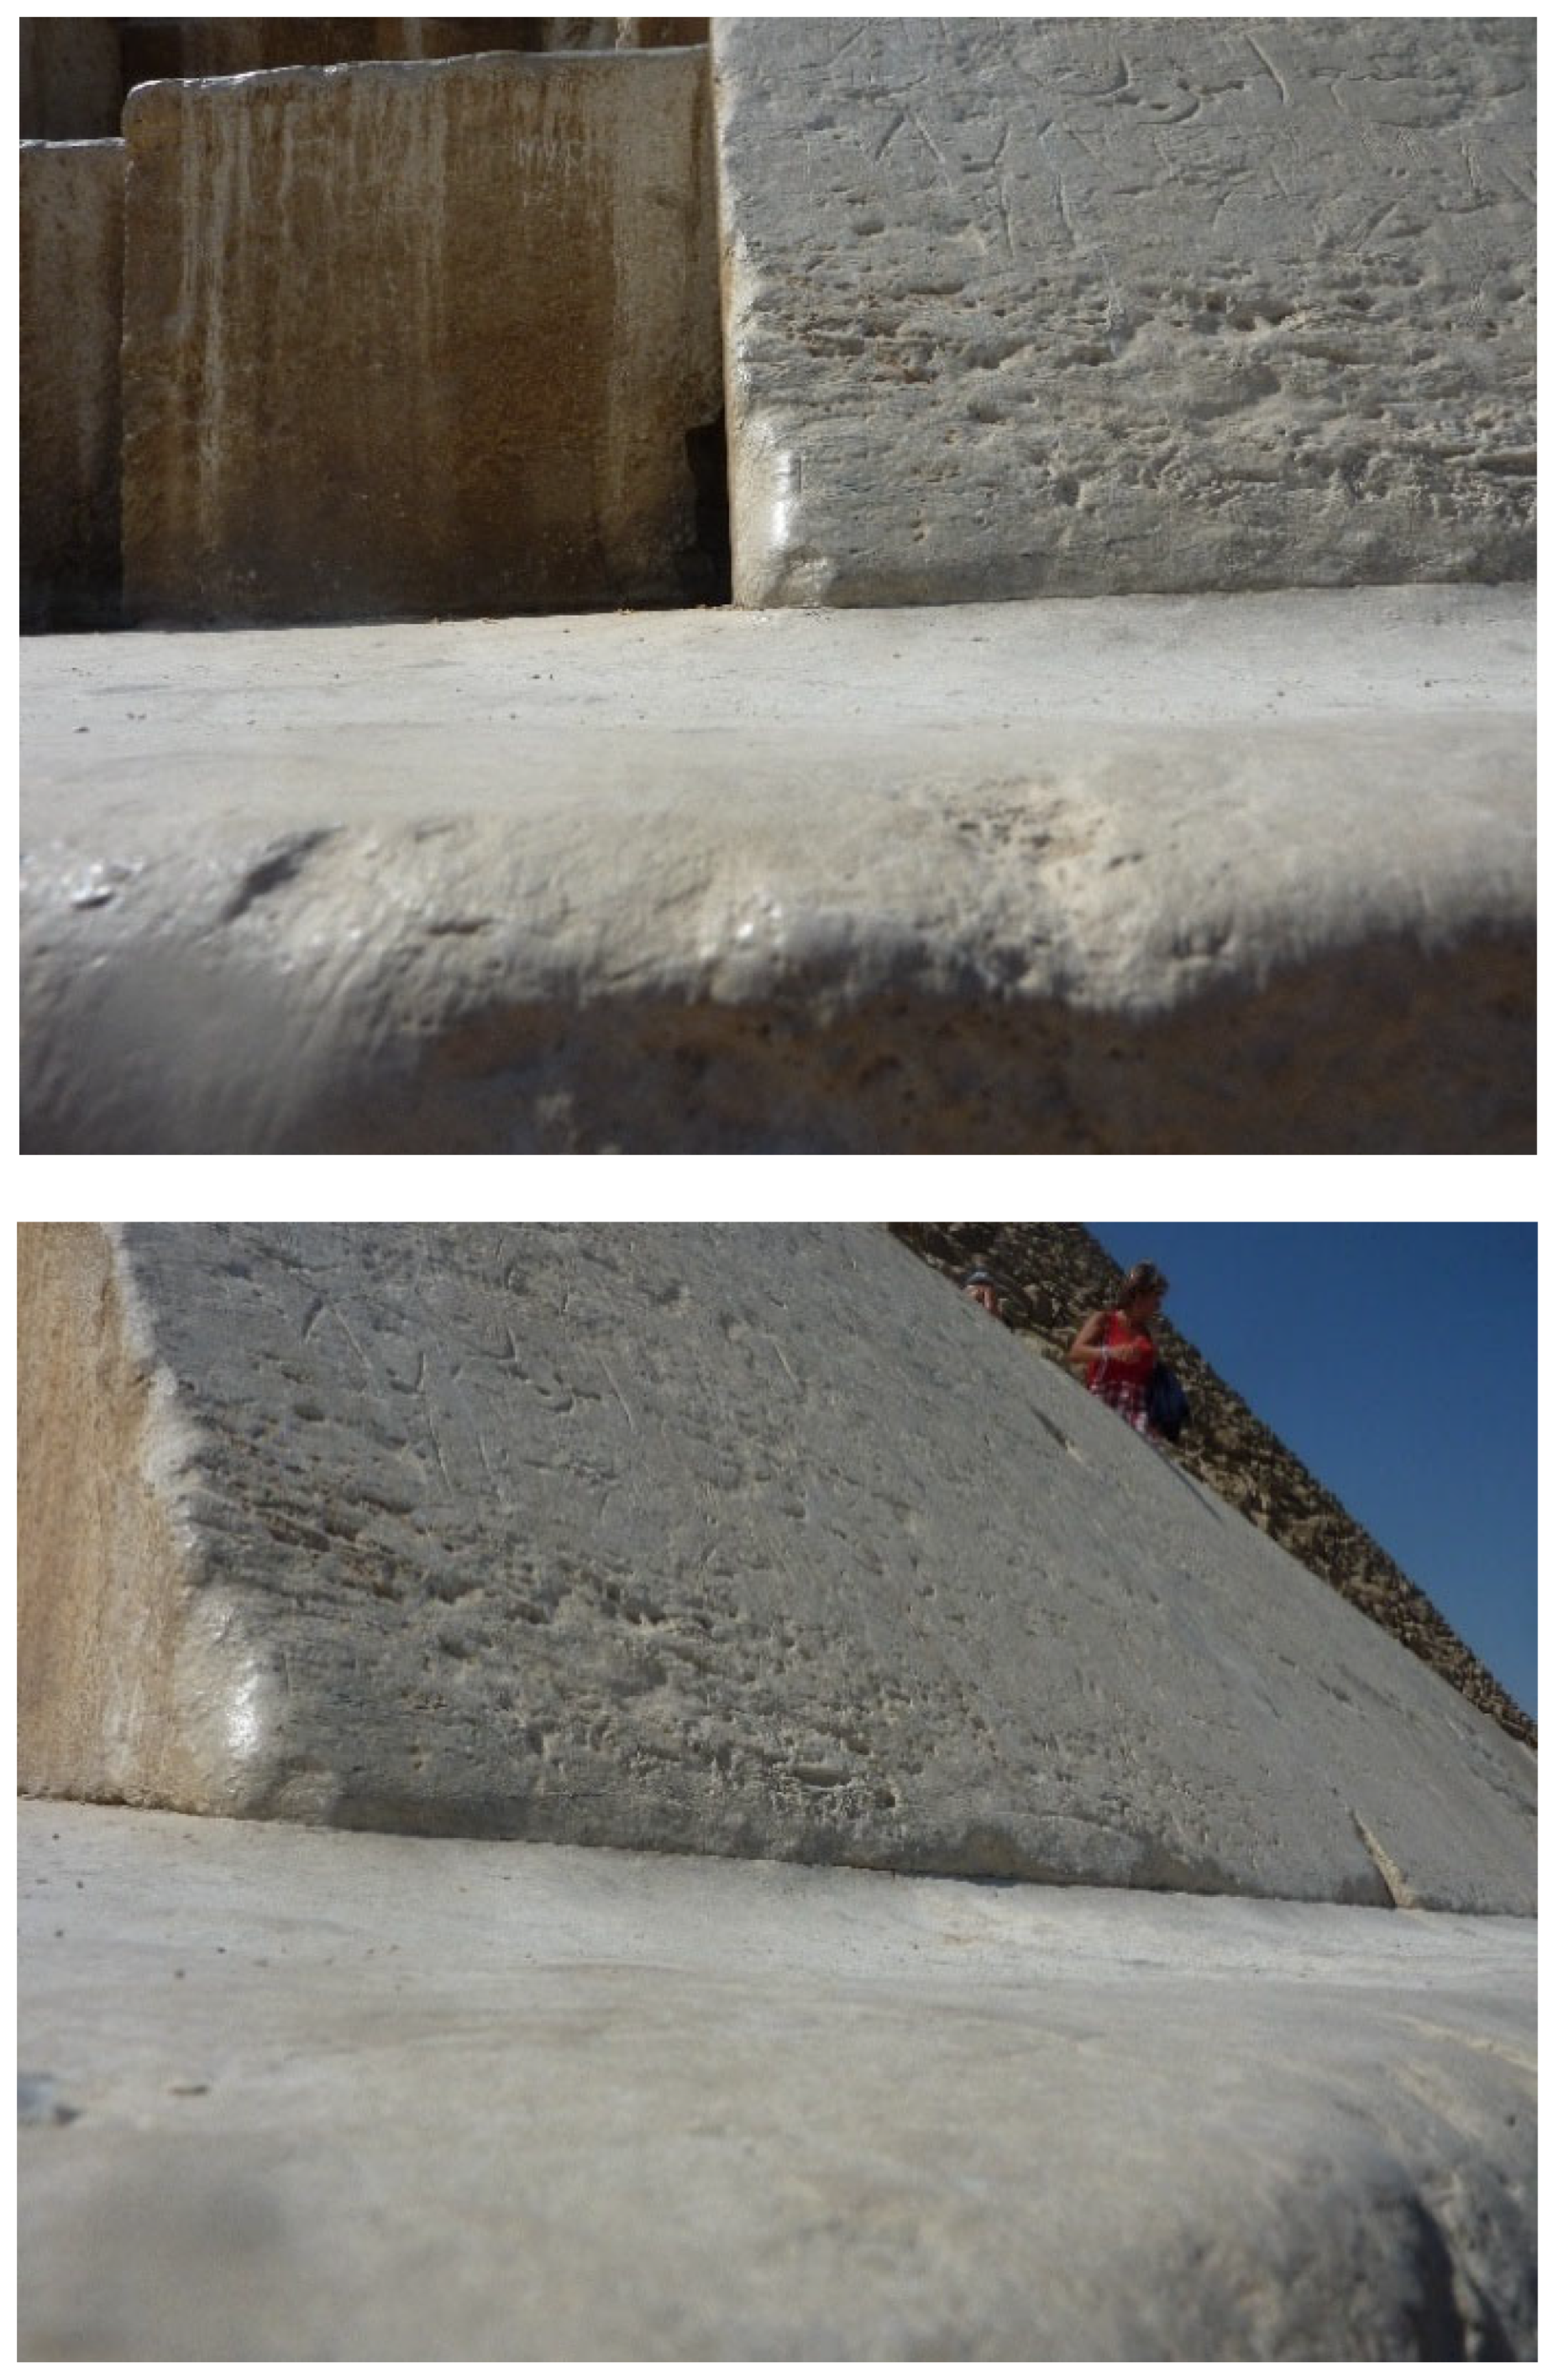
Figure 14.
Wear on the paving immediately outside the cladding blocks in point 3, highlighted in the red rectangle.
Figure 14.
Wear on the paving immediately outside the cladding blocks in point 3, highlighted in the red rectangle.
A few metres apart, points 3, 4 and 5 show uniform erosion with a smooth or undulating appearance. For these points, I considered the average decrease in thickness, noting wear or erosion of the part of the pavement immediately outside the paving blocks, varying from approximately 15 mm to approximately 45 mm.
Calculation of construction period with point 3 Khufu consumption
Average erosion over 675 years B.P.: average 1 mm
Average erosion since the beginning: 3 cm = 30 mm
Construction date: 675 x 30 / 1 = 20,250 years B.P.
Calculation of construction period with point 4 Khufu consumption
Average erosion over 675 years B.P.: average 1 mm
Average erosion since the beginning: 1.5 cm = 15 mm
Date of construction: 675 x 15 / 1 = 10,125 years B.P.
Calculation of construction period with point 5 Khufu consumption
Average erosion from 675 years B.P.: average 1 mm
Average erosion since the beginning: 4.5 cm = 45 mm
Construction date: 675 x 45 / 1 = 30,375 years B.P.
The procedure described above, together with the corresponding calculations, was applied to each of the twelve analysed points on the Pyramid of Khufu, with each point yielding different yet mutually compatible results. The arithmetic mean of these twelve values represents the most probable estimate for the age of the Pyramid of Khufu.
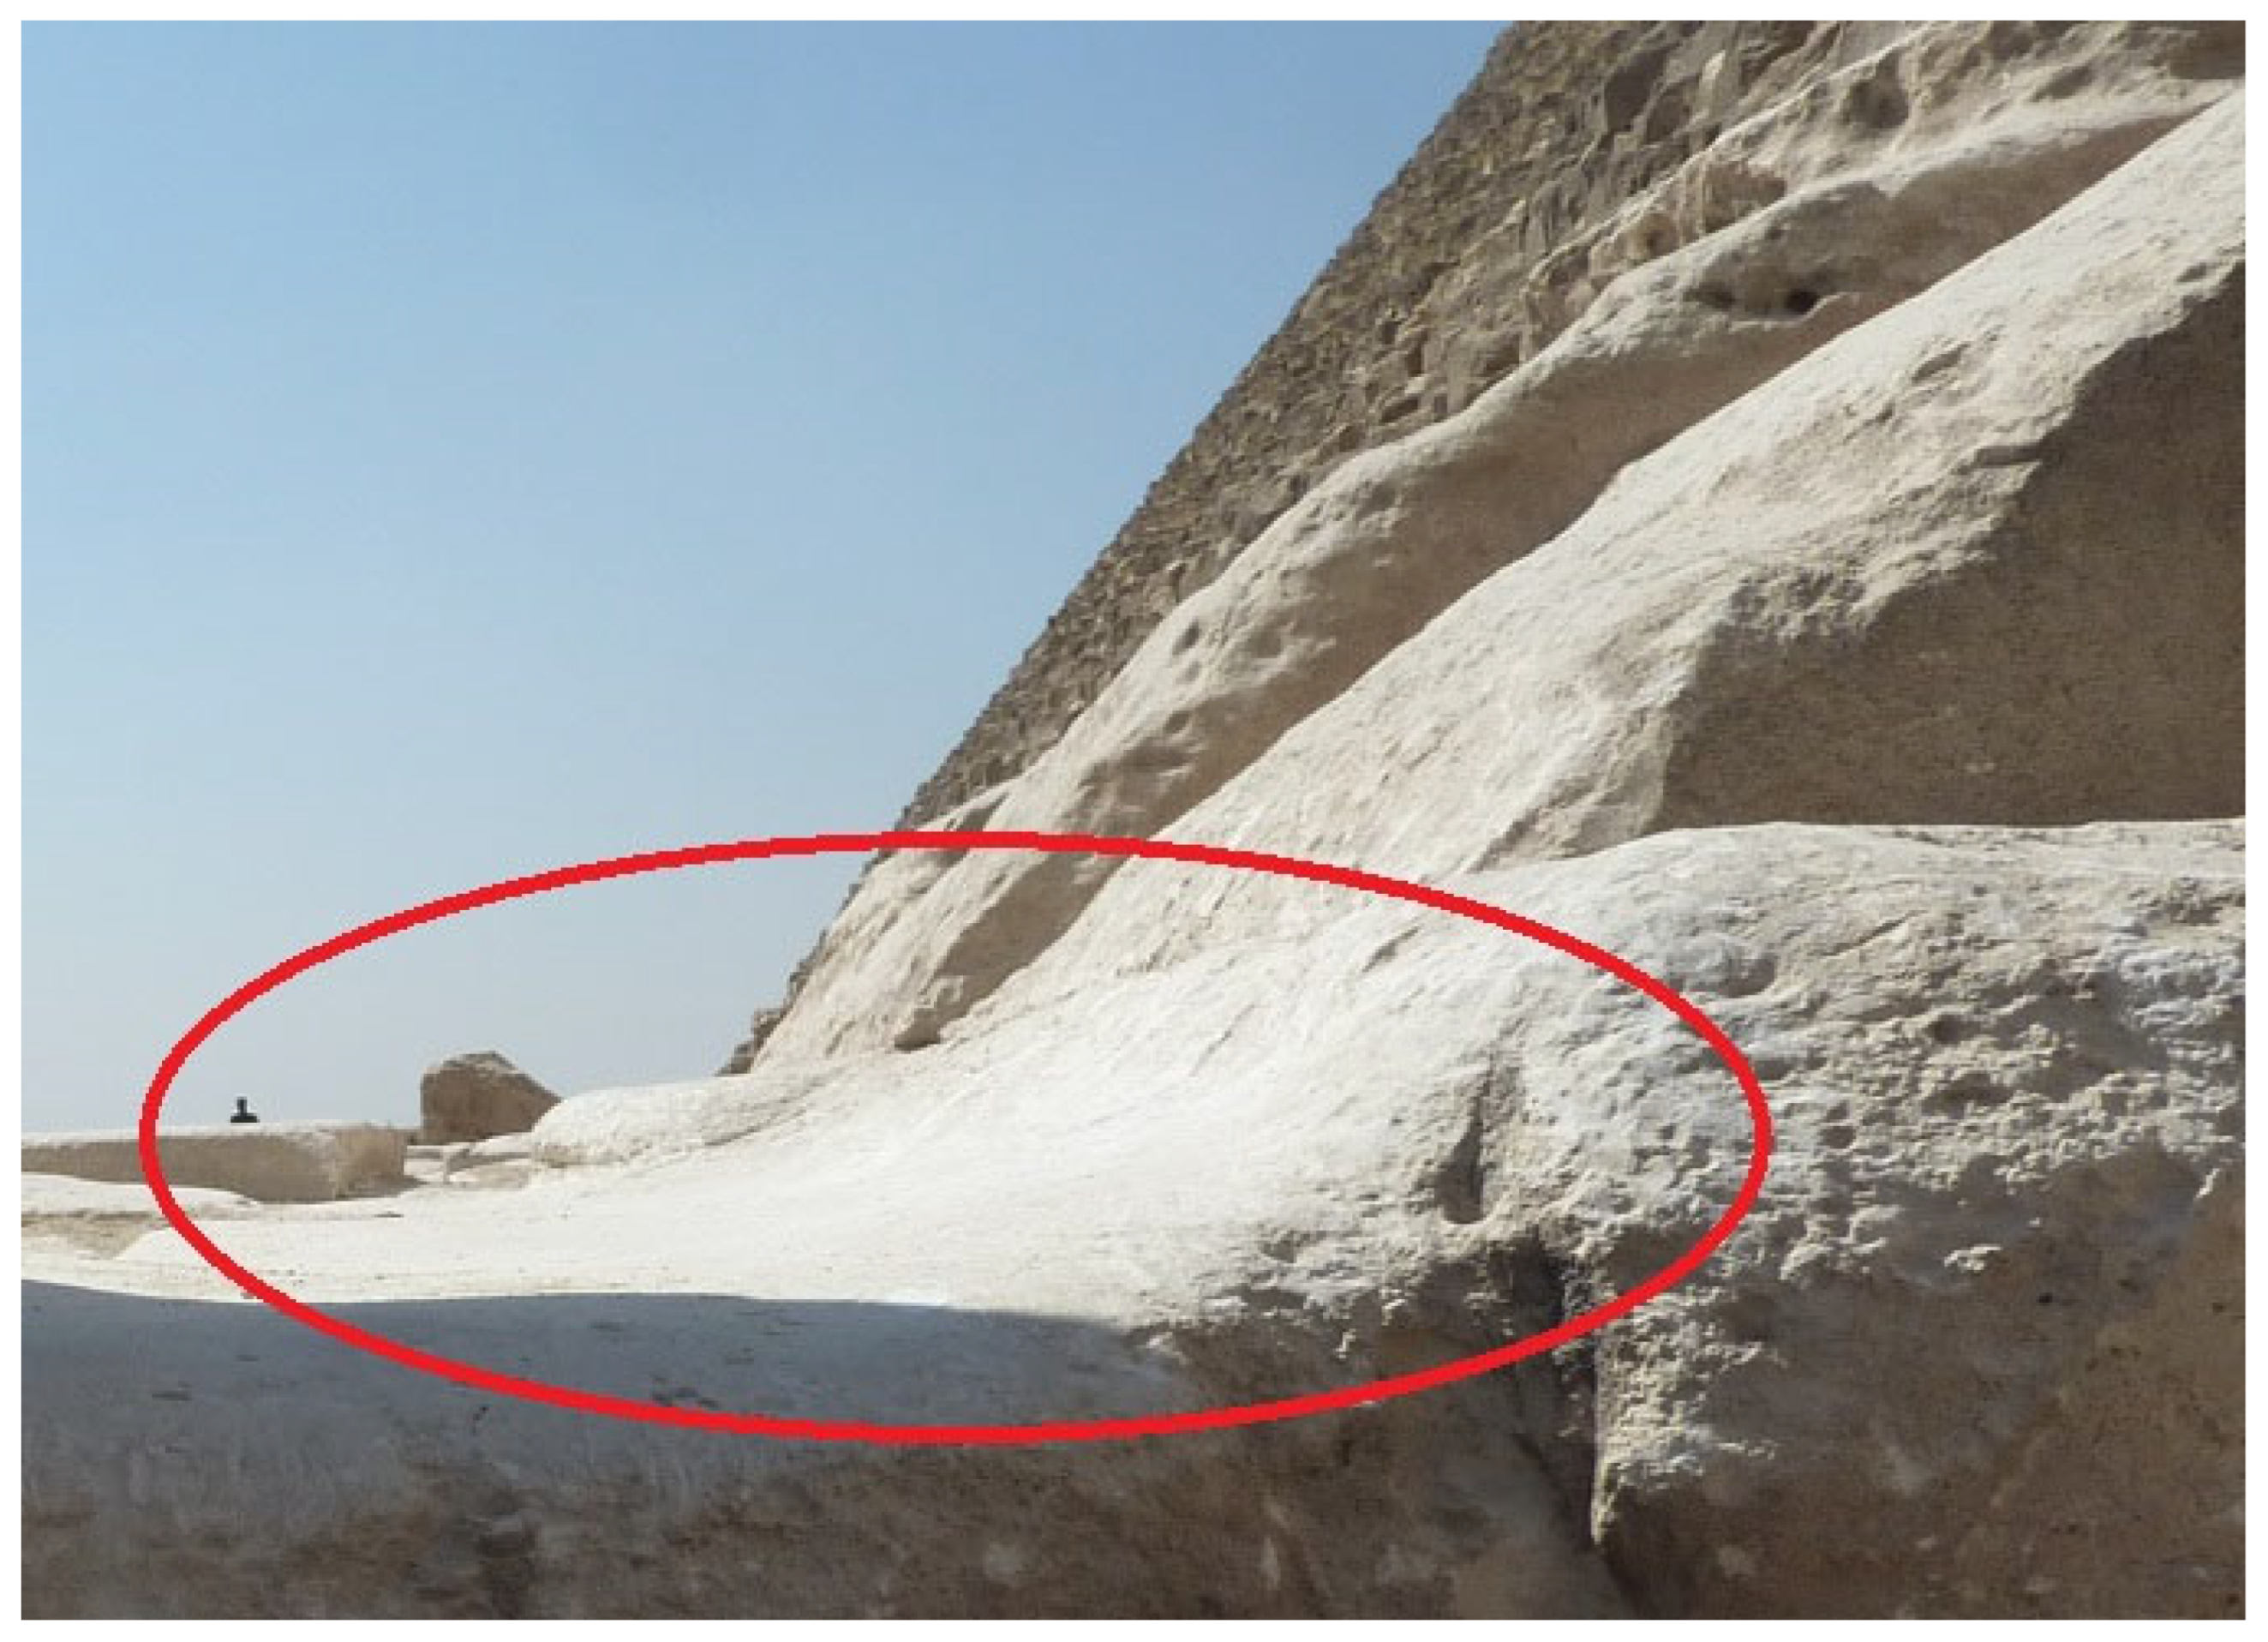
Figure 15.
Wear on the paving immediately outside the paving blocks at point 6, highlighted in the red oval.
Figure 15.
Wear on the paving immediately outside the paving blocks at point 6, highlighted in the red oval.
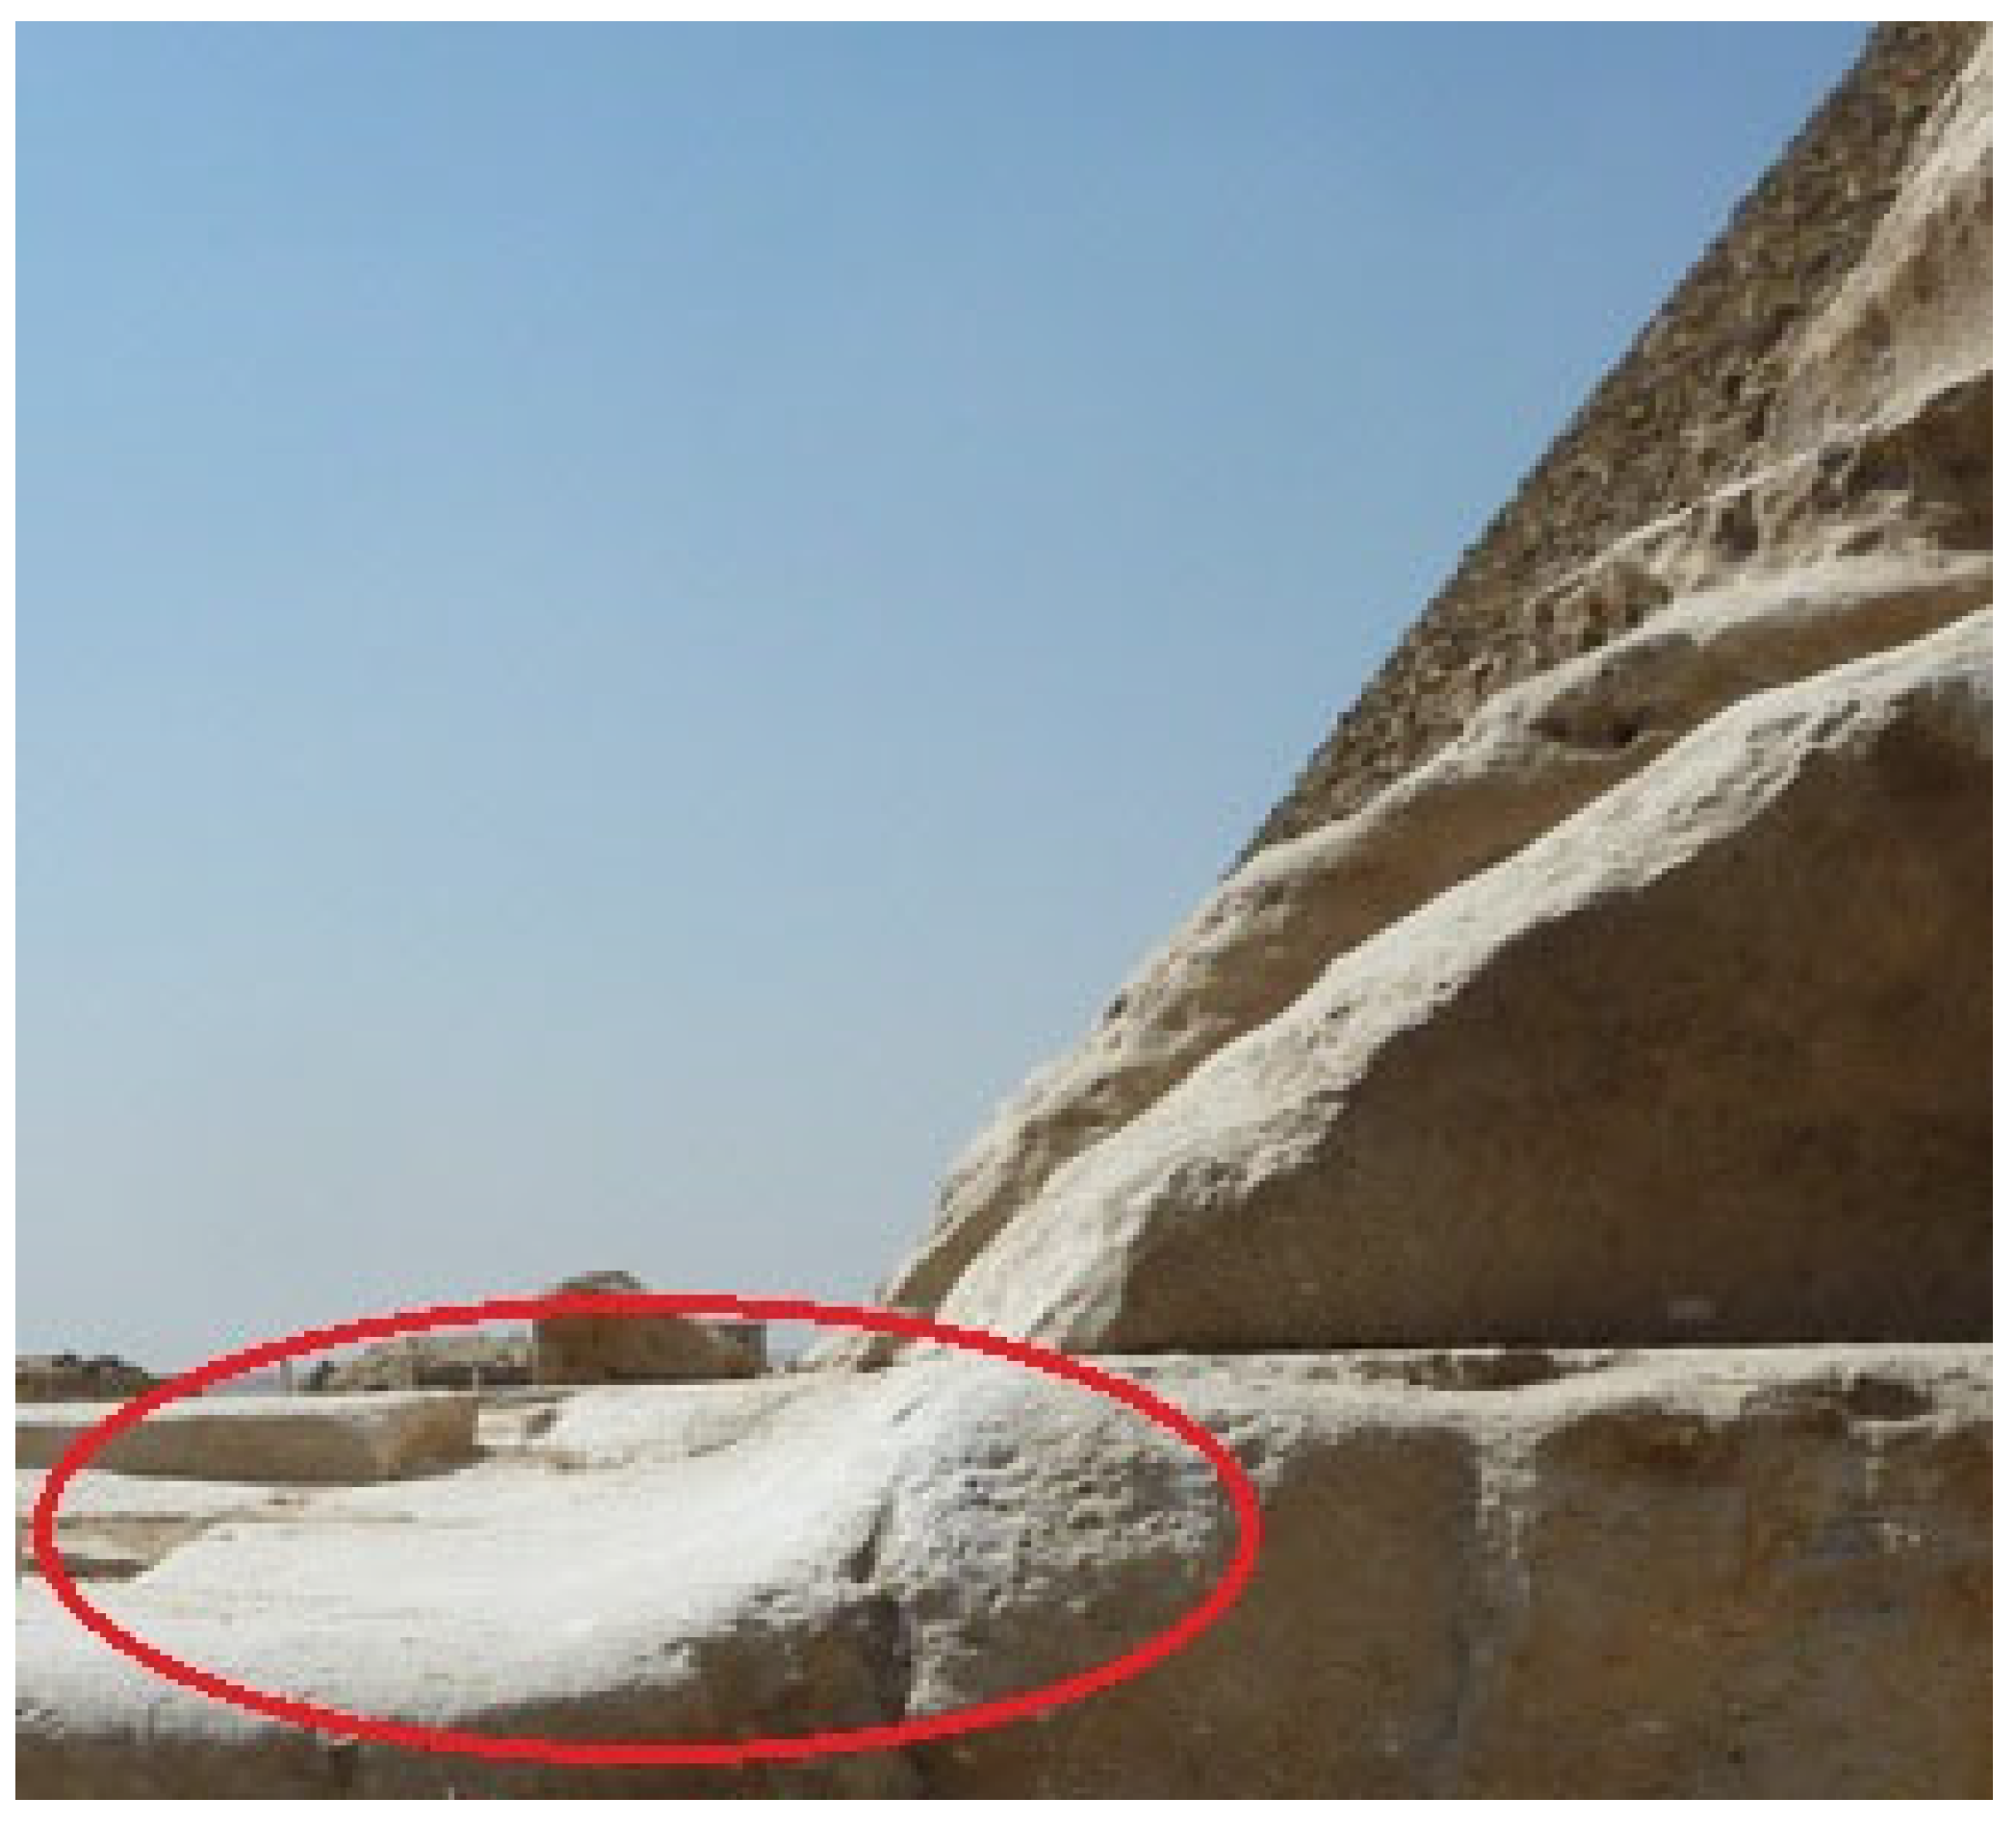
Figure 16.
Wear on the paving immediately outside the cladding blocks at point 6, highlighted in the red rectangle.
Figure 16.
Wear on the paving immediately outside the cladding blocks at point 6, highlighted in the red rectangle.

Calculation of construction period with consumption point 6 Khufu
Average erosion from 675 years B.P.: 1 – 4 mm, average 2.5 mm
Average erosion since the beginning: 11 cm = 110 mm
Construction date: 675 x 110 / 2.5 = 29,700 years B.P.
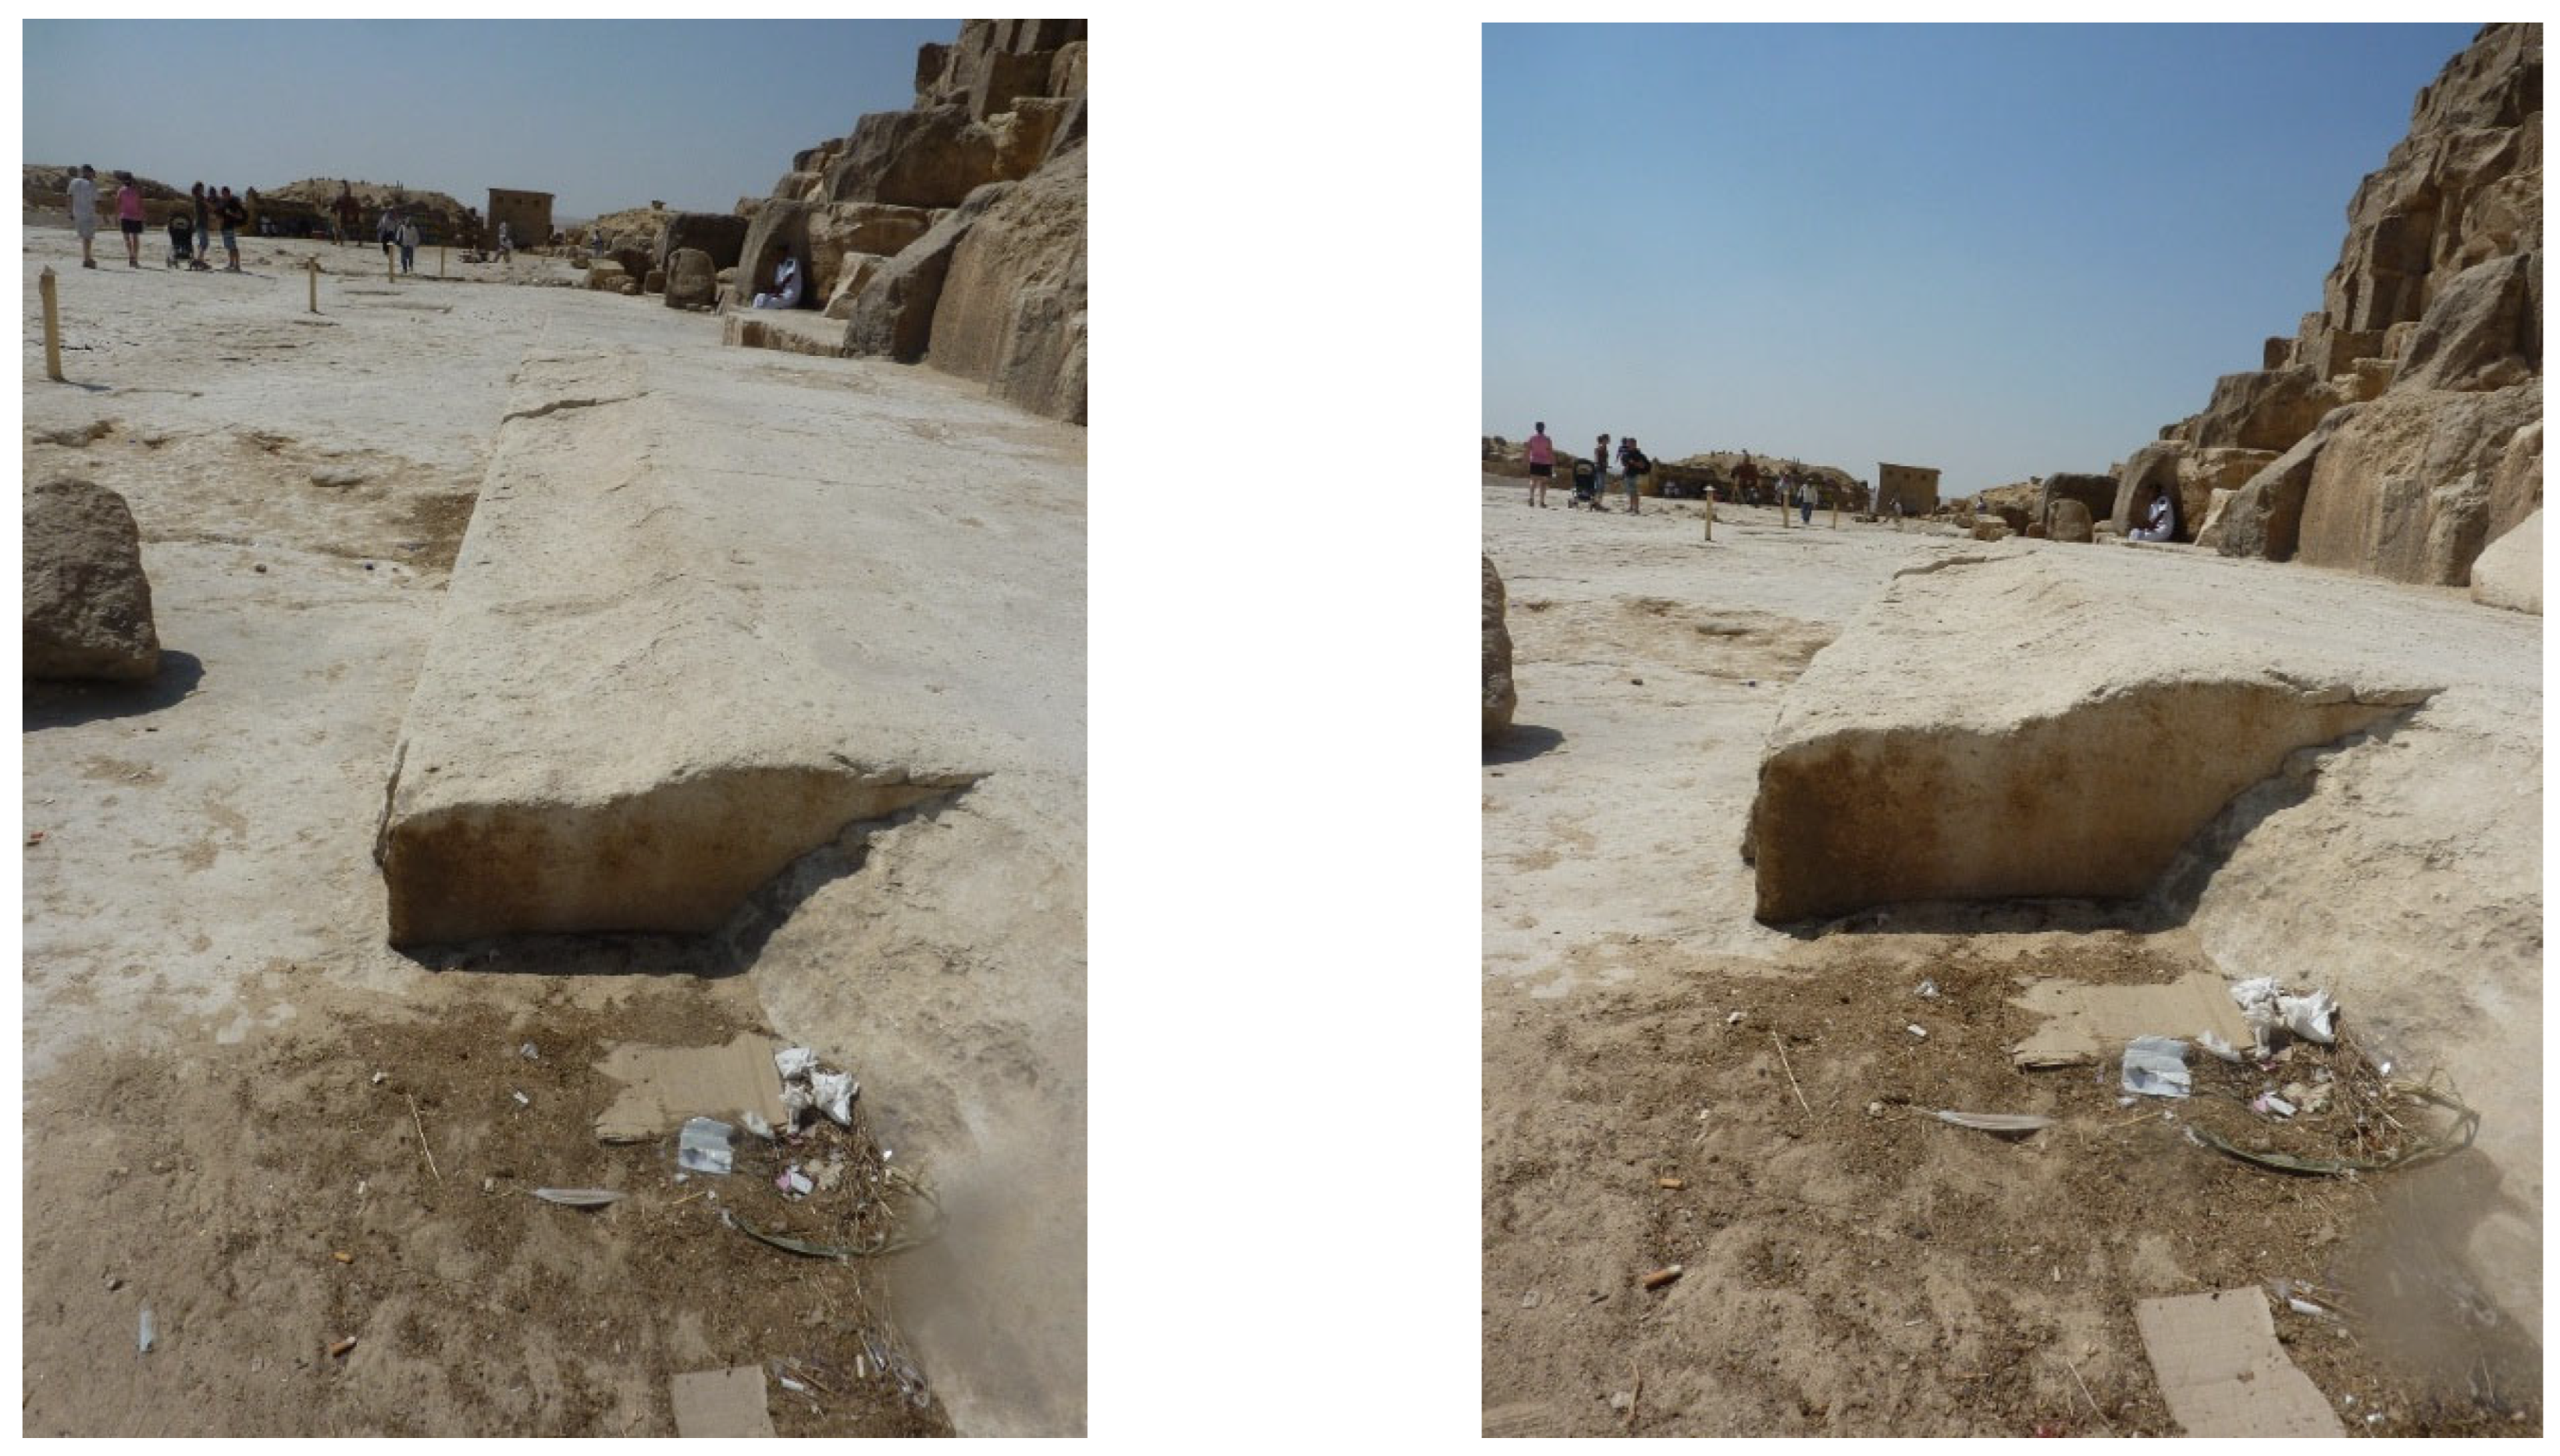
Figure 17 and 18.
Wear or erosion of the paving immediately outside the cladding blocks at point 7.
Calculation of construction period with consumption point 7 Khufu
Average erosion from 675 years B.P.: 1 – 4 mm, average 2.5 mm
Average erosion since the beginning: 10 cm = 100 mm
Date of construction: 675 x 100 / 2.5 = 27,000 years B.P.
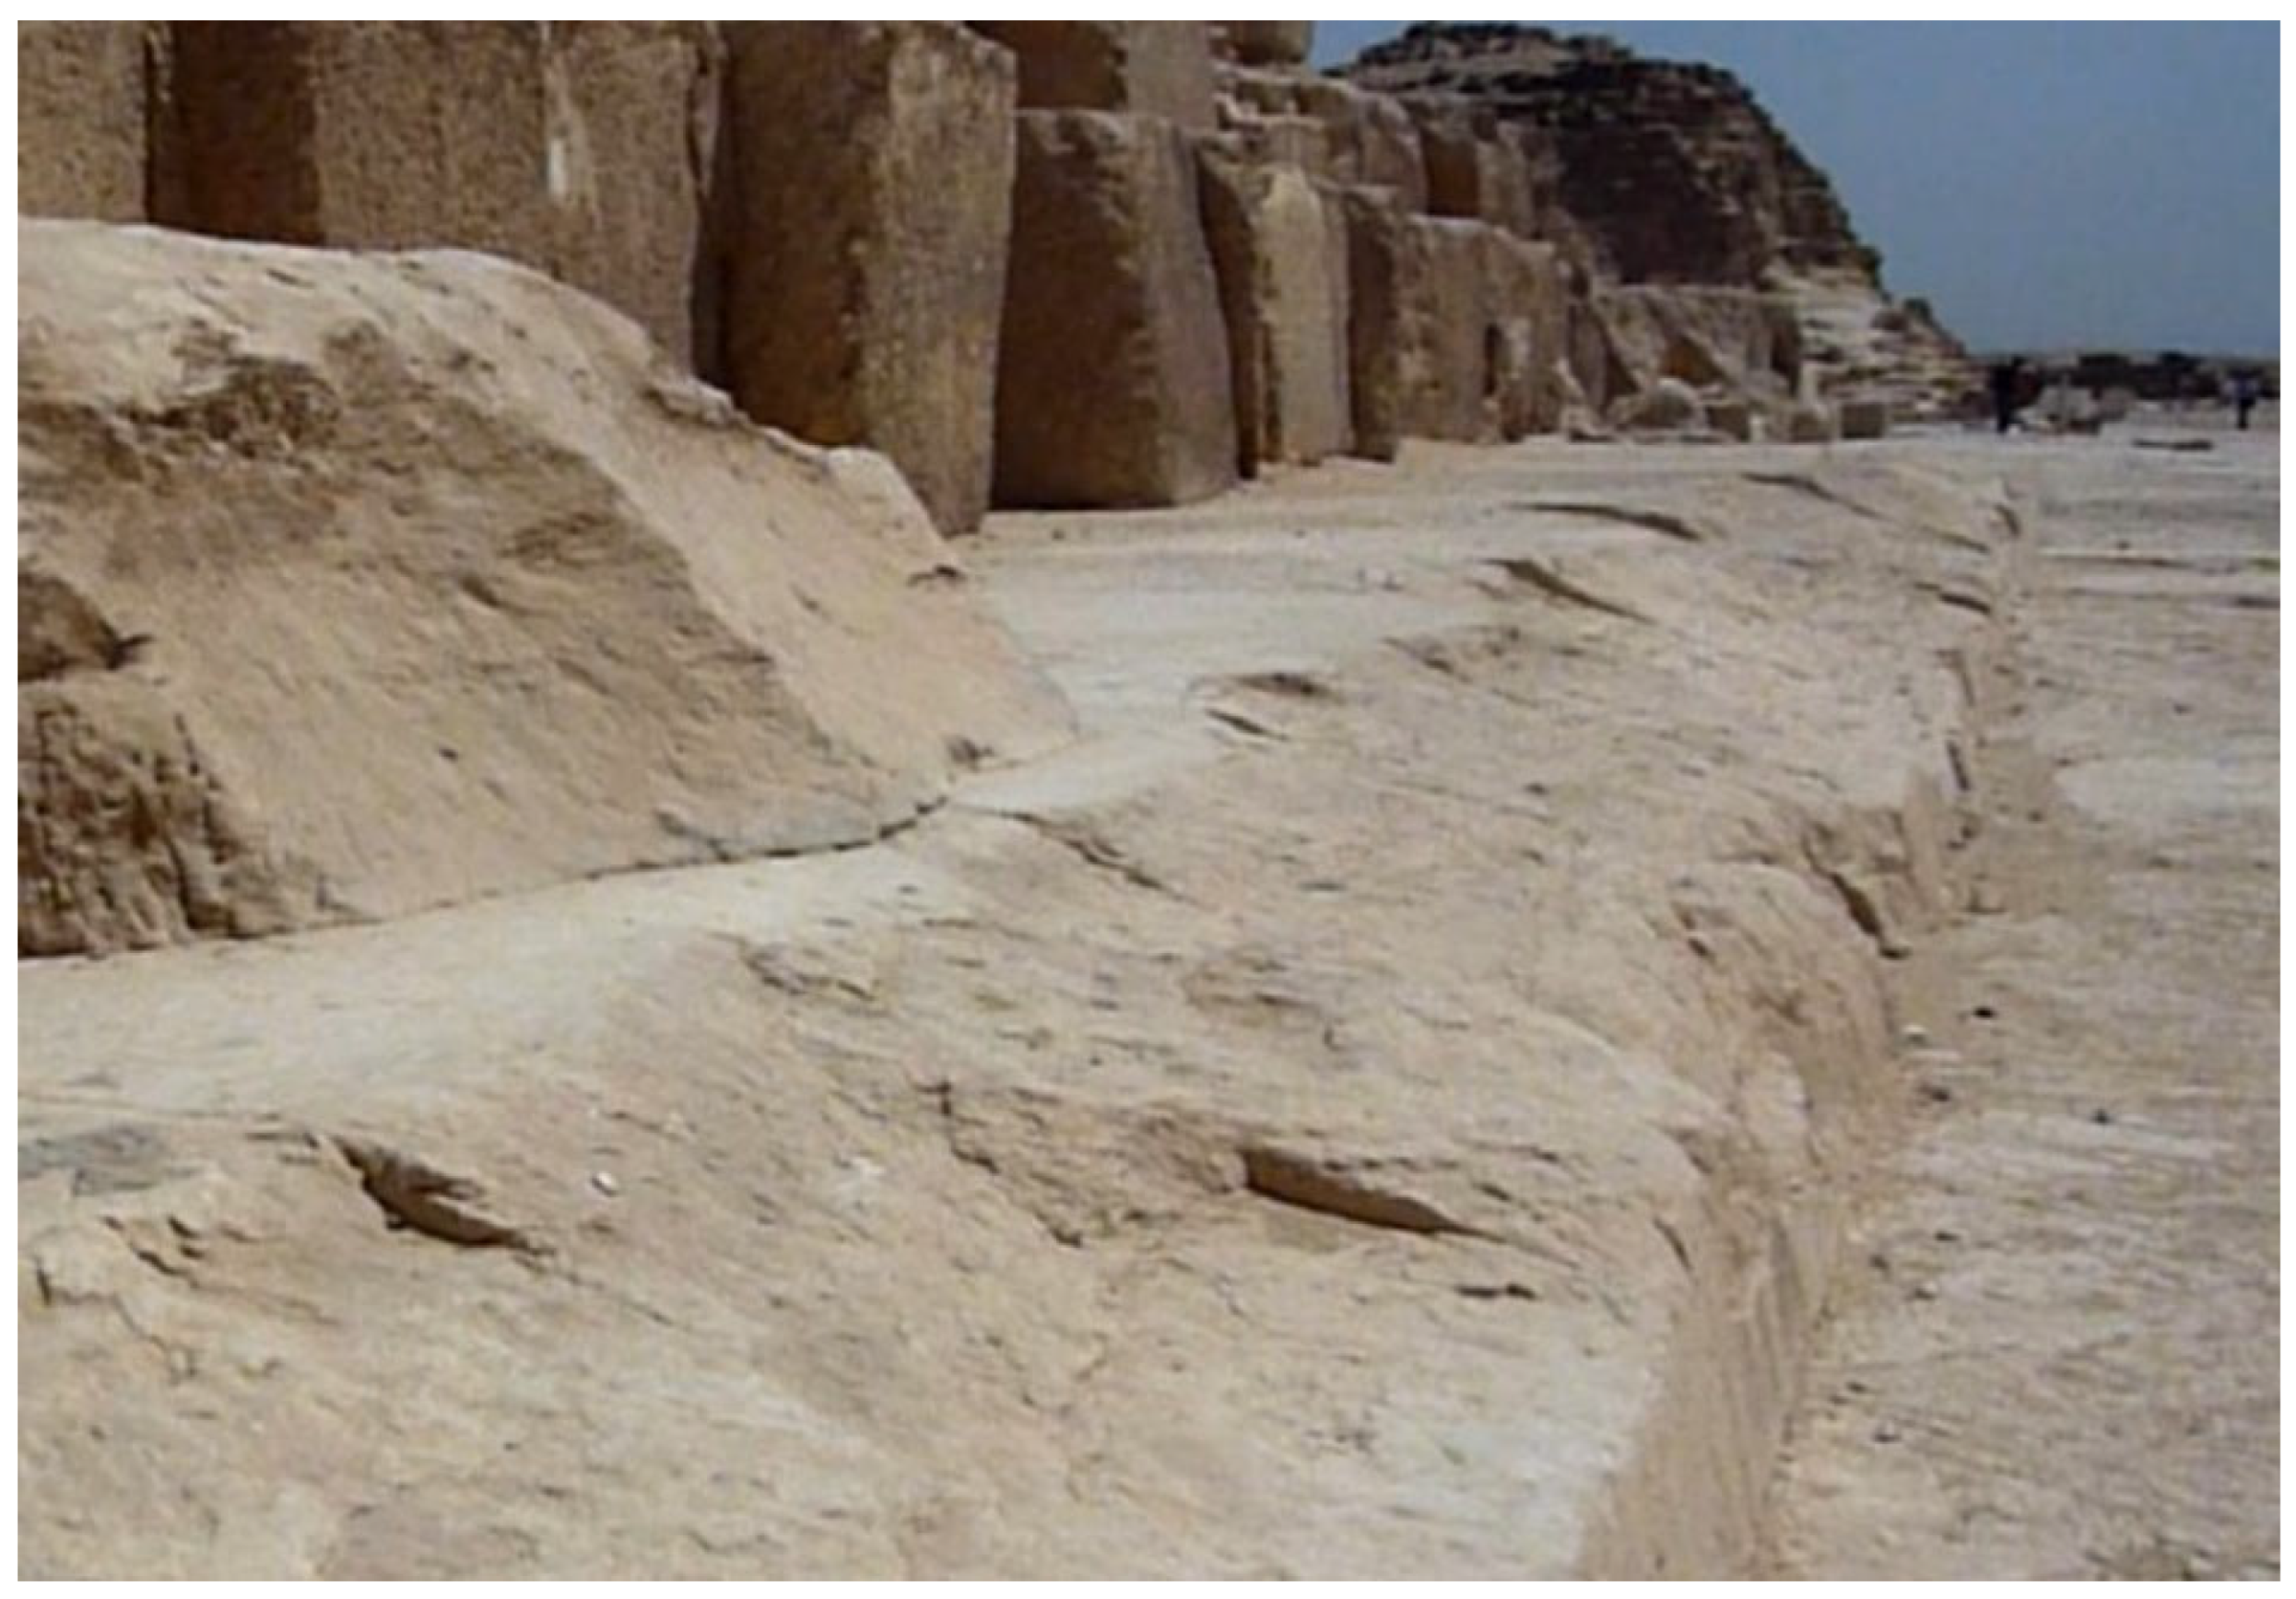
Figure 19.
Wear or erosion of the paving immediately outside the cladding blocks at point 8.
Calculation of construction period with consumption point 8 Khufu
Average erosion from 675 years B.P.: 1 – 4 mm, average 2.5 mm
Average erosion since the beginning: 17 cm = 170 mm
Date of construction: 675 x 170 / 2.5 = 45,900 years B.P.
Figure 20.
Wear or erosion of the paving immediately outside the cladding blocks at point 9.
Calculation of construction period with consumption point 9 Khufu
Average erosion from 675 years B.P.: 1 – 4 mm, average 2.5 mm
Average erosion since the beginning: 20 cm = 200 mm
Date of construction: 675 x 200 / 2.5 = 54,000 years B.P.
Figure 21.
Wear or erosion of the paving immediately outside the cladding blocks at point 10.
Calculation of construction period with consumption point 10 Khufu
Average erosion from 675 years B.P.: average 1 mm
Average erosion from the beginning: 2 cm = 20 mm
Date of construction: 675 x 20 / 1 = 13,500 years B.P.
Figure 22.
Wear or erosion of the paving immediately outside the cladding blocks at point 11.
Calculation of construction period with consumption point 11 Khufu
Average erosion from 675 years B.P.: 1–5 mm, average 3 mm
Average erosion since the beginning: 10 cm = 100 mm
Date of construction: 675 x 100 / 3 = 22,500 years B.P.
Figure 23.
The difference in erosion at point 12 between the right side (which has been exposed since the pyramid was built) and the left side.
Figure 23.
The difference in erosion at point 12 between the right side (which has been exposed since the pyramid was built) and the left side.
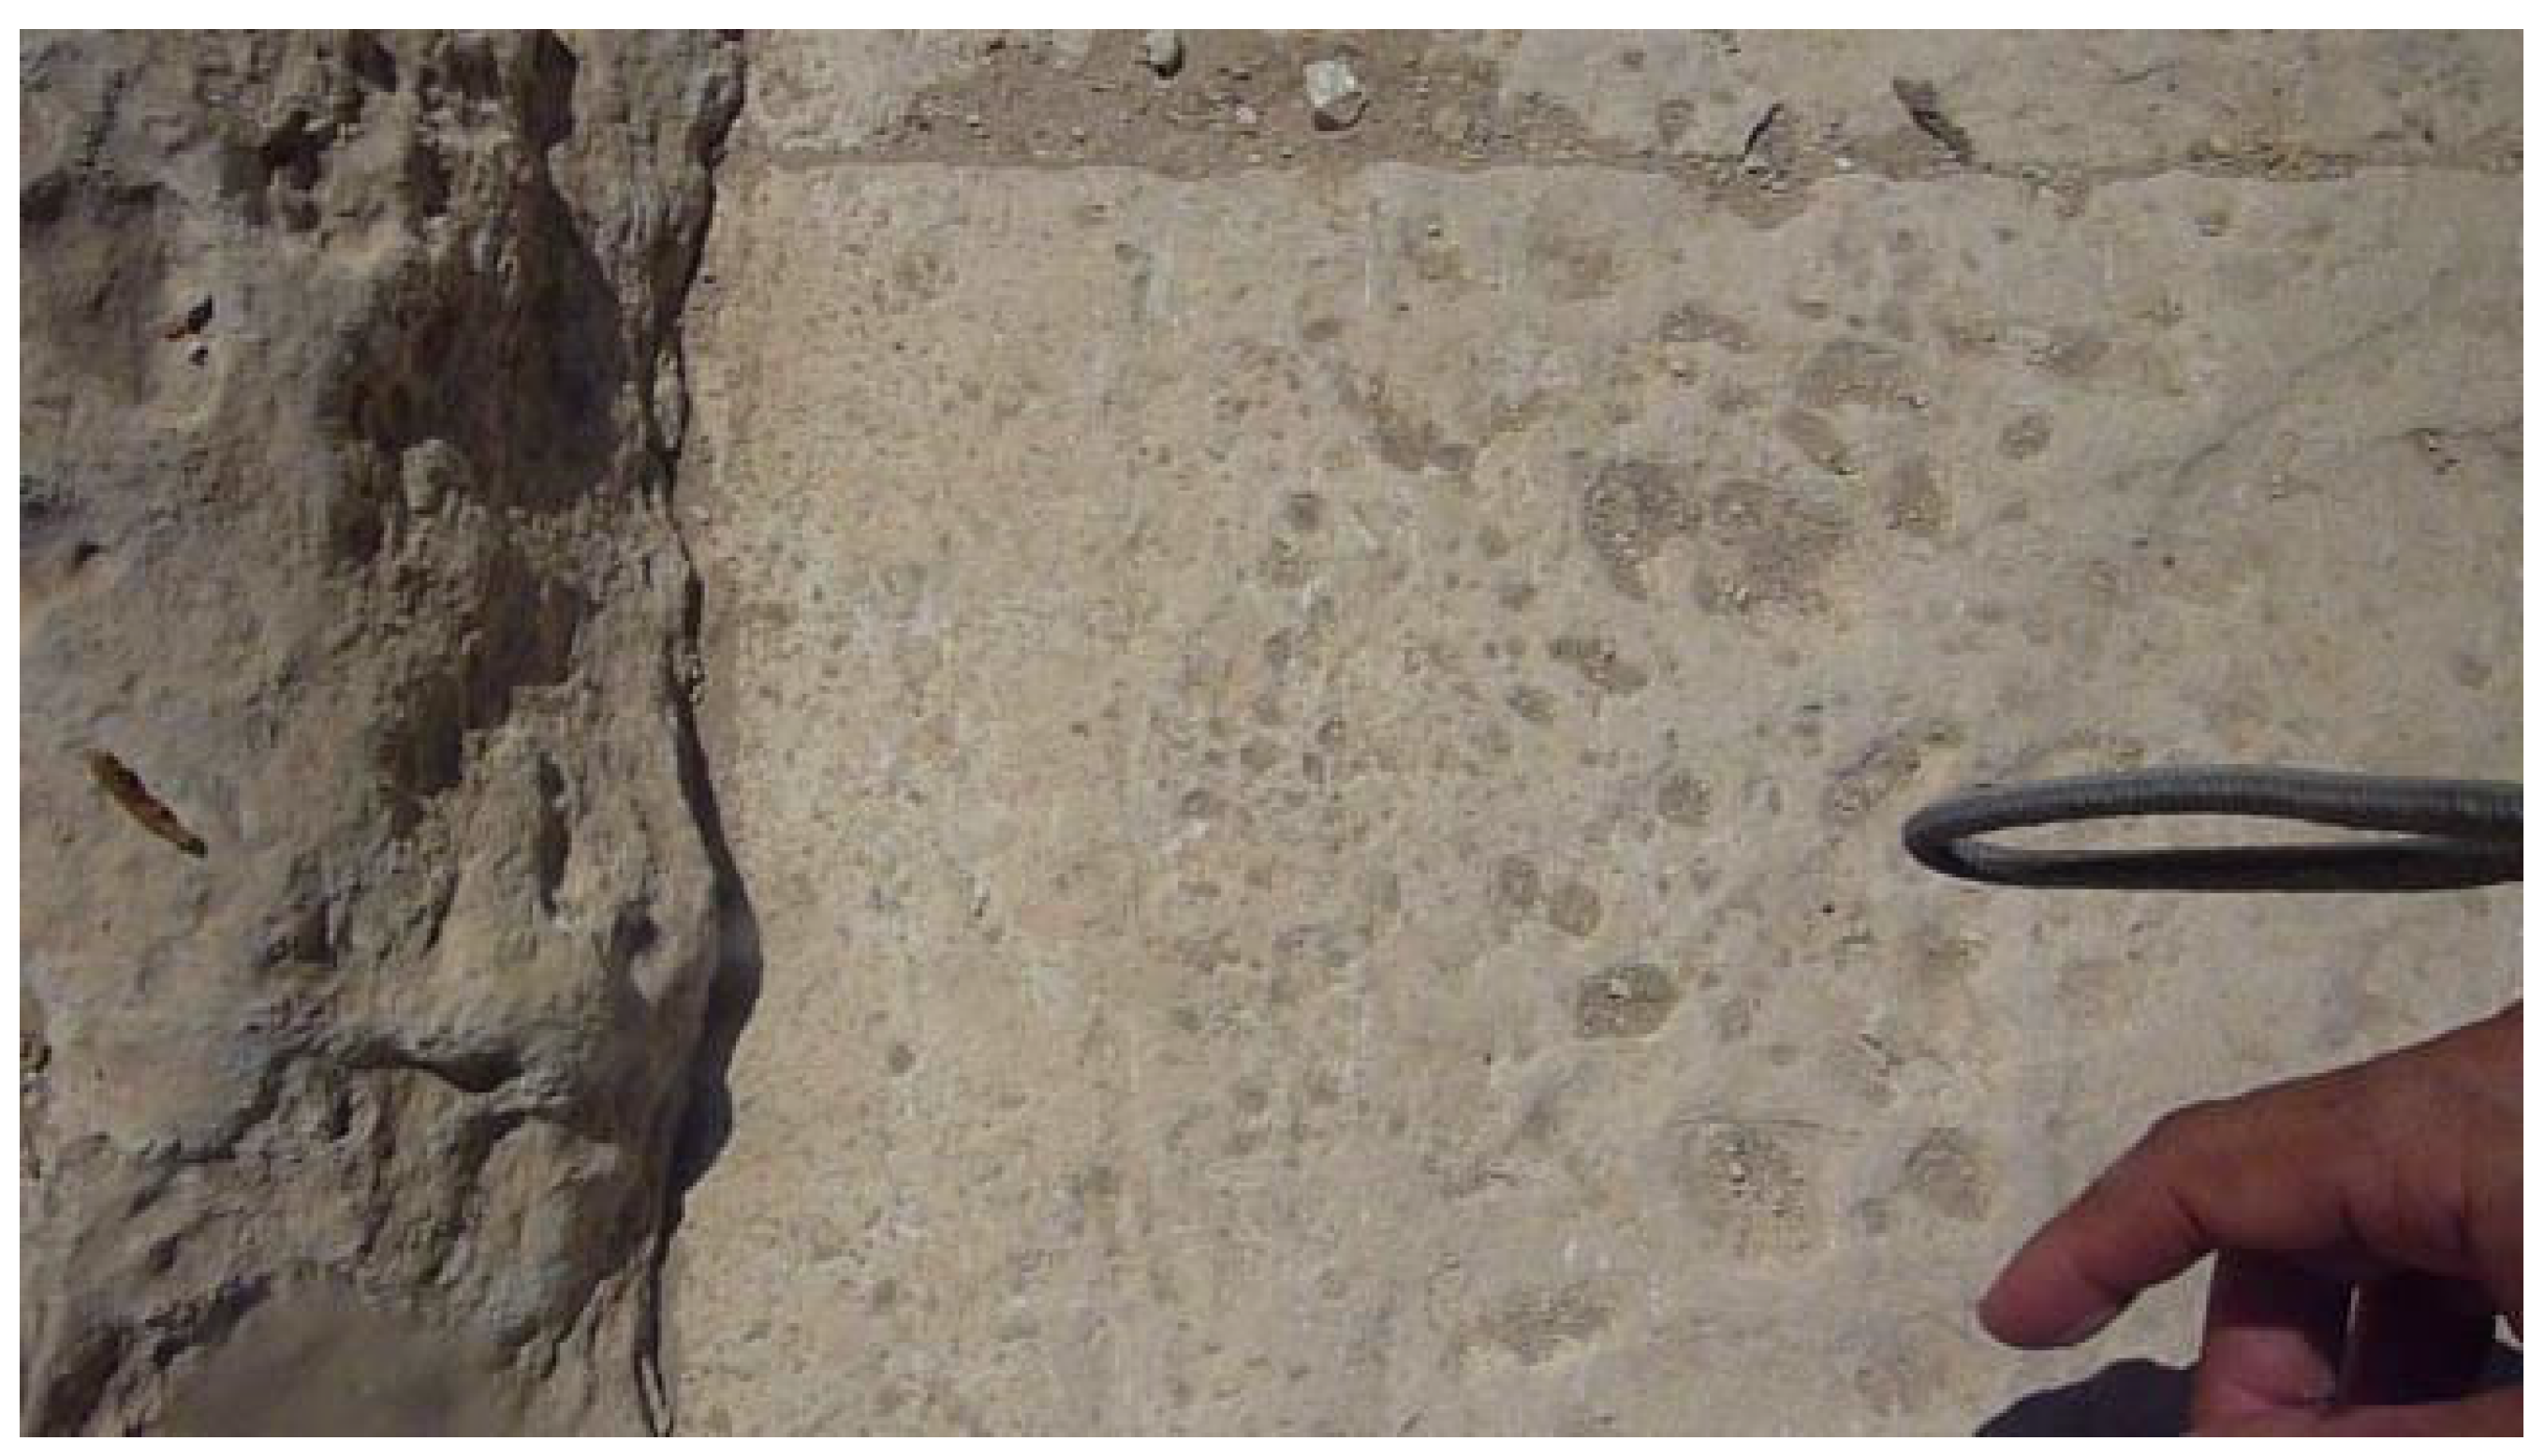
Figure 24.
Calculation of erosion (recess volume) at point 12.
Calculation of construction period based on volume of eroded recesses at point 12 Khufu
Total volume of eroded recesses in exposed part: 13,072 mm3
Total volume of eroded recesses in exposed part 675 years B.P.: 396 mm3
Date of construction: 13,072 x 675 / 396 = 22,281 years B.P.
Arithmetic mean m of the 12 values calculated for the G1 pyramid of Akhet Khufu
m = (5,708 + 17,955 + 20,250 + 10,125 + 30,375 + 29,700 + 27,000 + 45,900 + 54,000 + 13,500 +
22,500 + 22,281) / 12 = 24,941 years B.P. = 22,941 B.C.
Standard deviation
σ = 13,962
Z score: (x - m) / σ
| -1,37 | -0,50 | -0,33 | -1,06 | 0,38 | 0,34 | 0,14 | 1,50 | 2,08 | -0,81 | -0,17 | -0,19 |
Figure 25.
Gaussian curve showing the 68.2% probability that the value will fall within plus or minus one standard deviation [3].
Figure 25.
Gaussian curve showing the 68.2% probability that the value will fall within plus or minus one standard deviation [3].
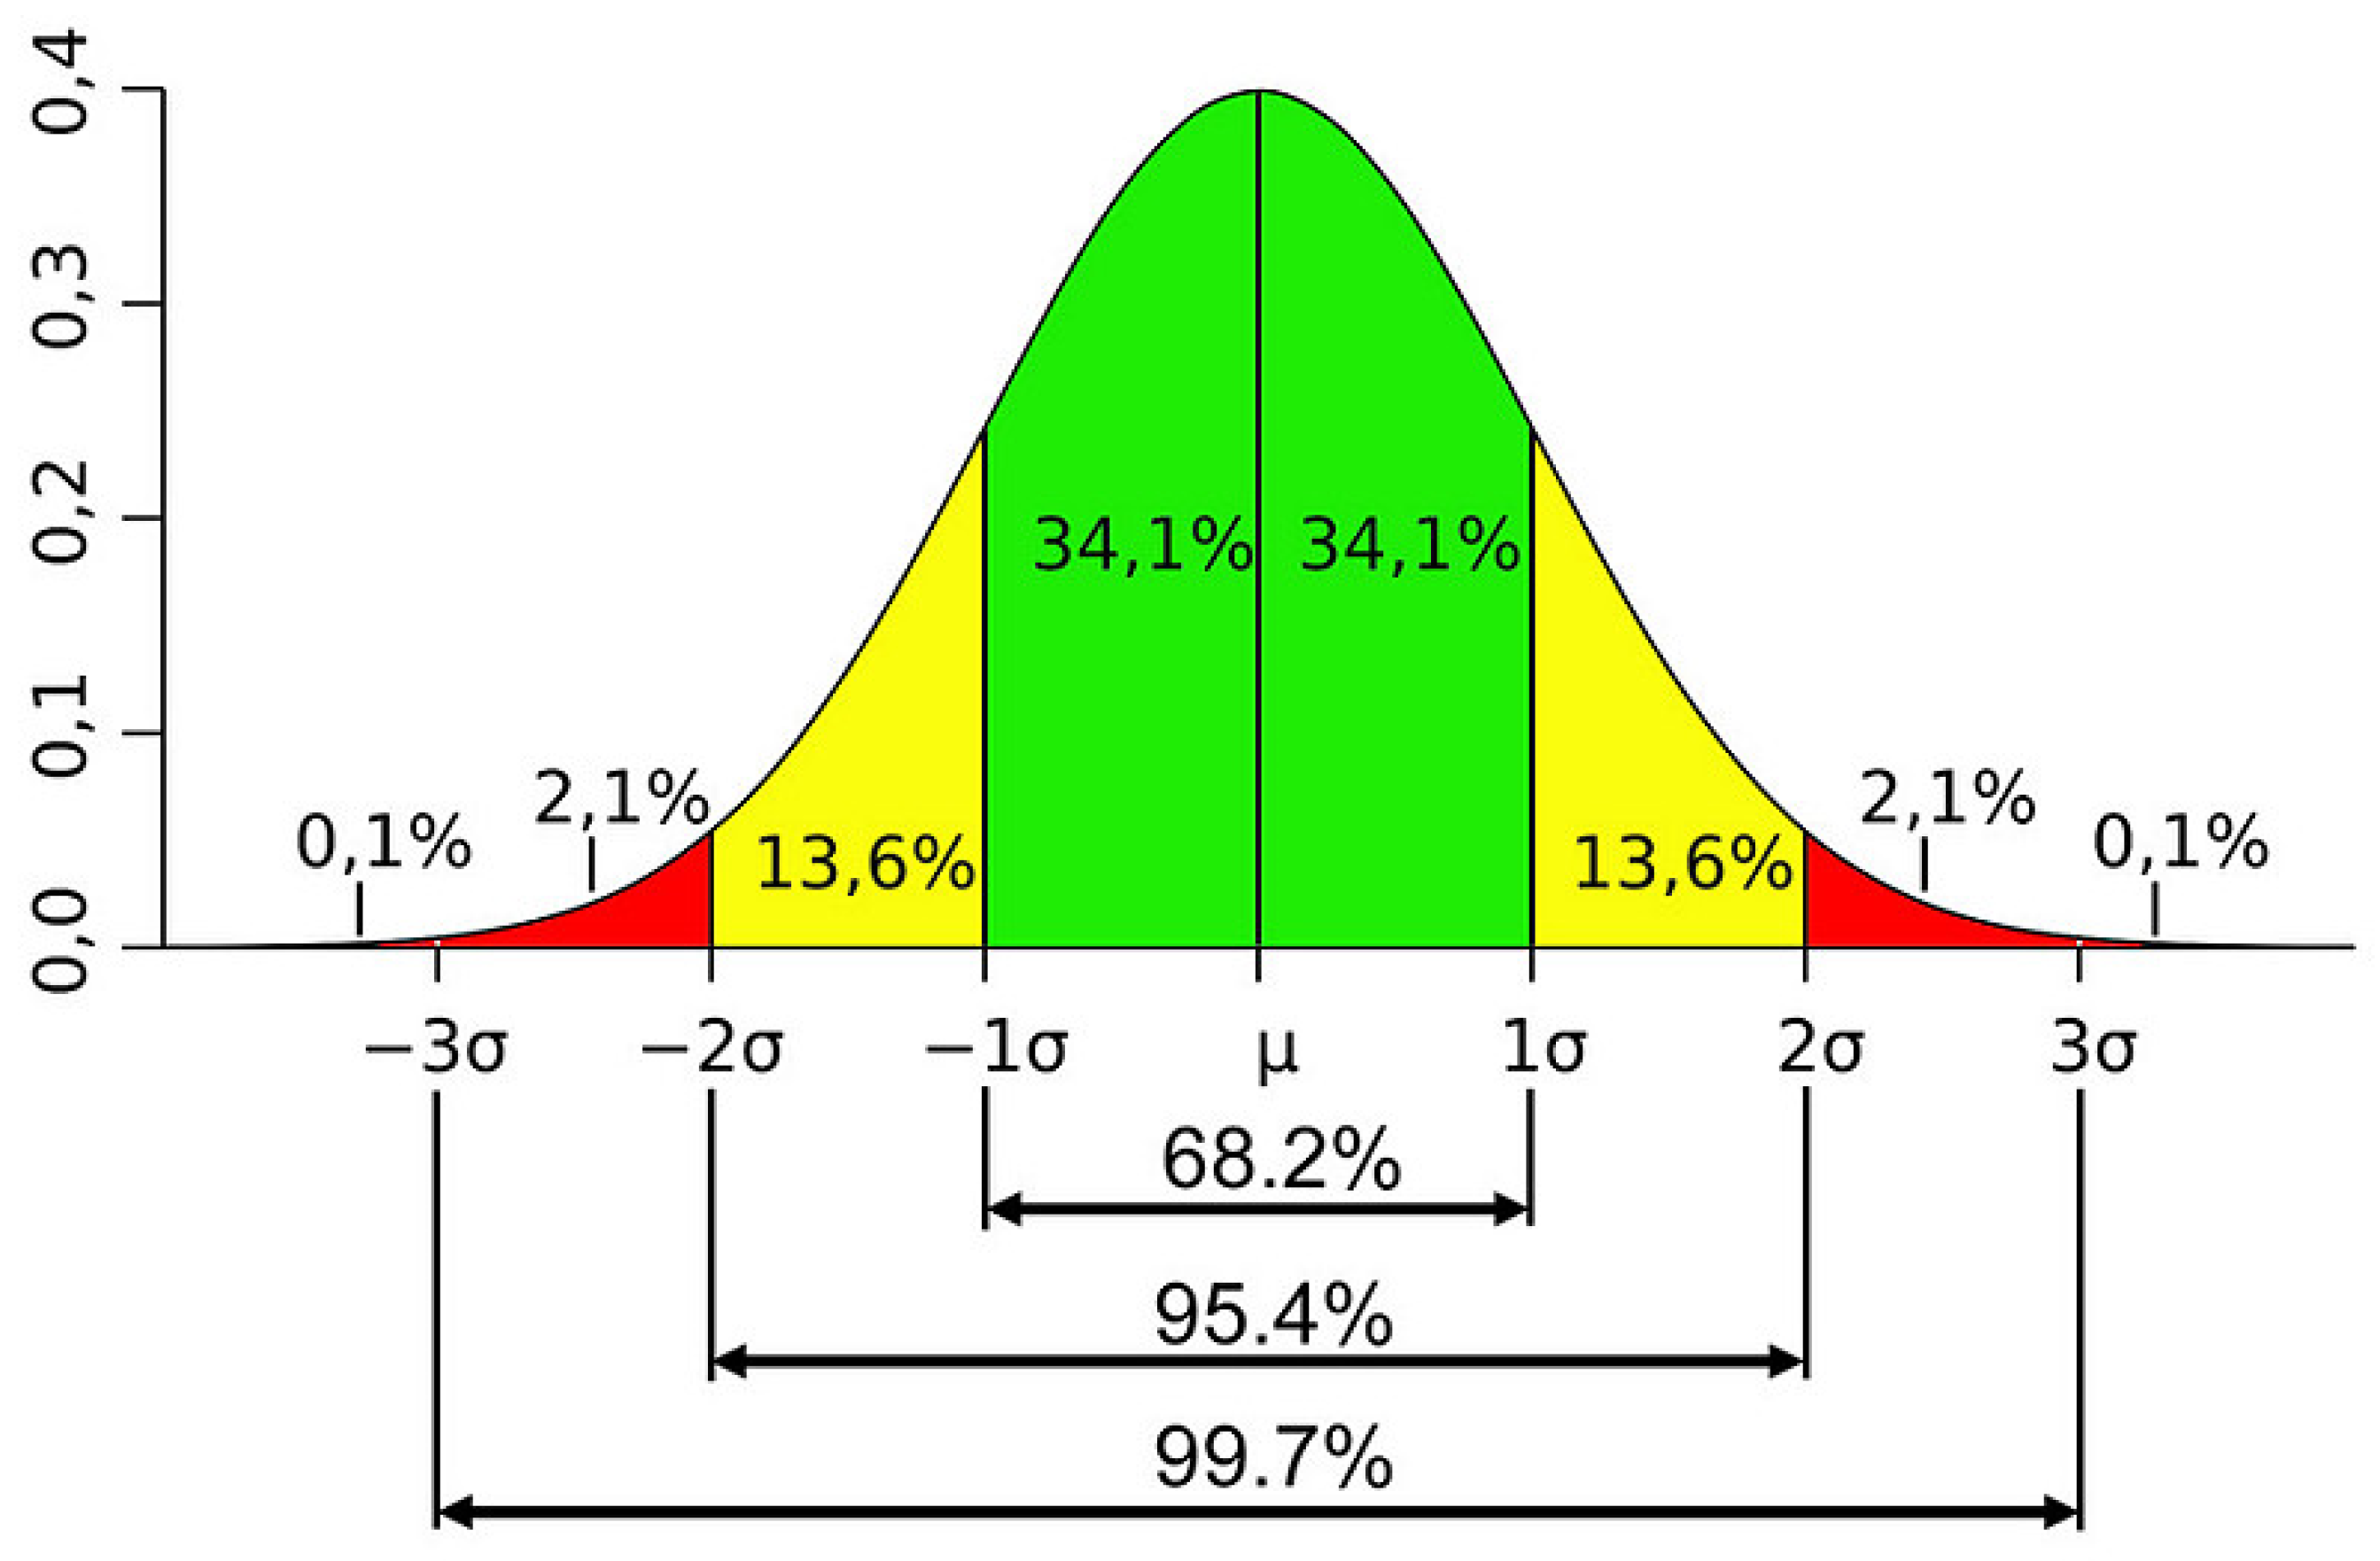
Therefore, regarding the dating of the G1 pyramid of Akhet Khufu calculated based on REM, I have a 68.2% probability that it is between (m - σ) and (m + σ), i.e. (24,941 - 13,962) and (24,941 + 13,962).
There is a 68.2% probability that the construction period of the G1 pyramid of Akhet Khufu is between 10,979 and 38,903 years B.P., with an average of 24,941 years B.P.
68.2% probability that the G1 pyramid of Akhet Khufu was built between 8,954 B.C. and 36,878 B.C., with an average of 22,916 B.C.
Points analysed in the G1b pyramid of Meritites I
Figure 26.
The pyramid G1b of Queen Meritites I, with the points where I measured the relative erosion marked in red. (picture from Googleearth).
Figure 26.
The pyramid G1b of Queen Meritites I, with the points where I measured the relative erosion marked in red. (picture from Googleearth).
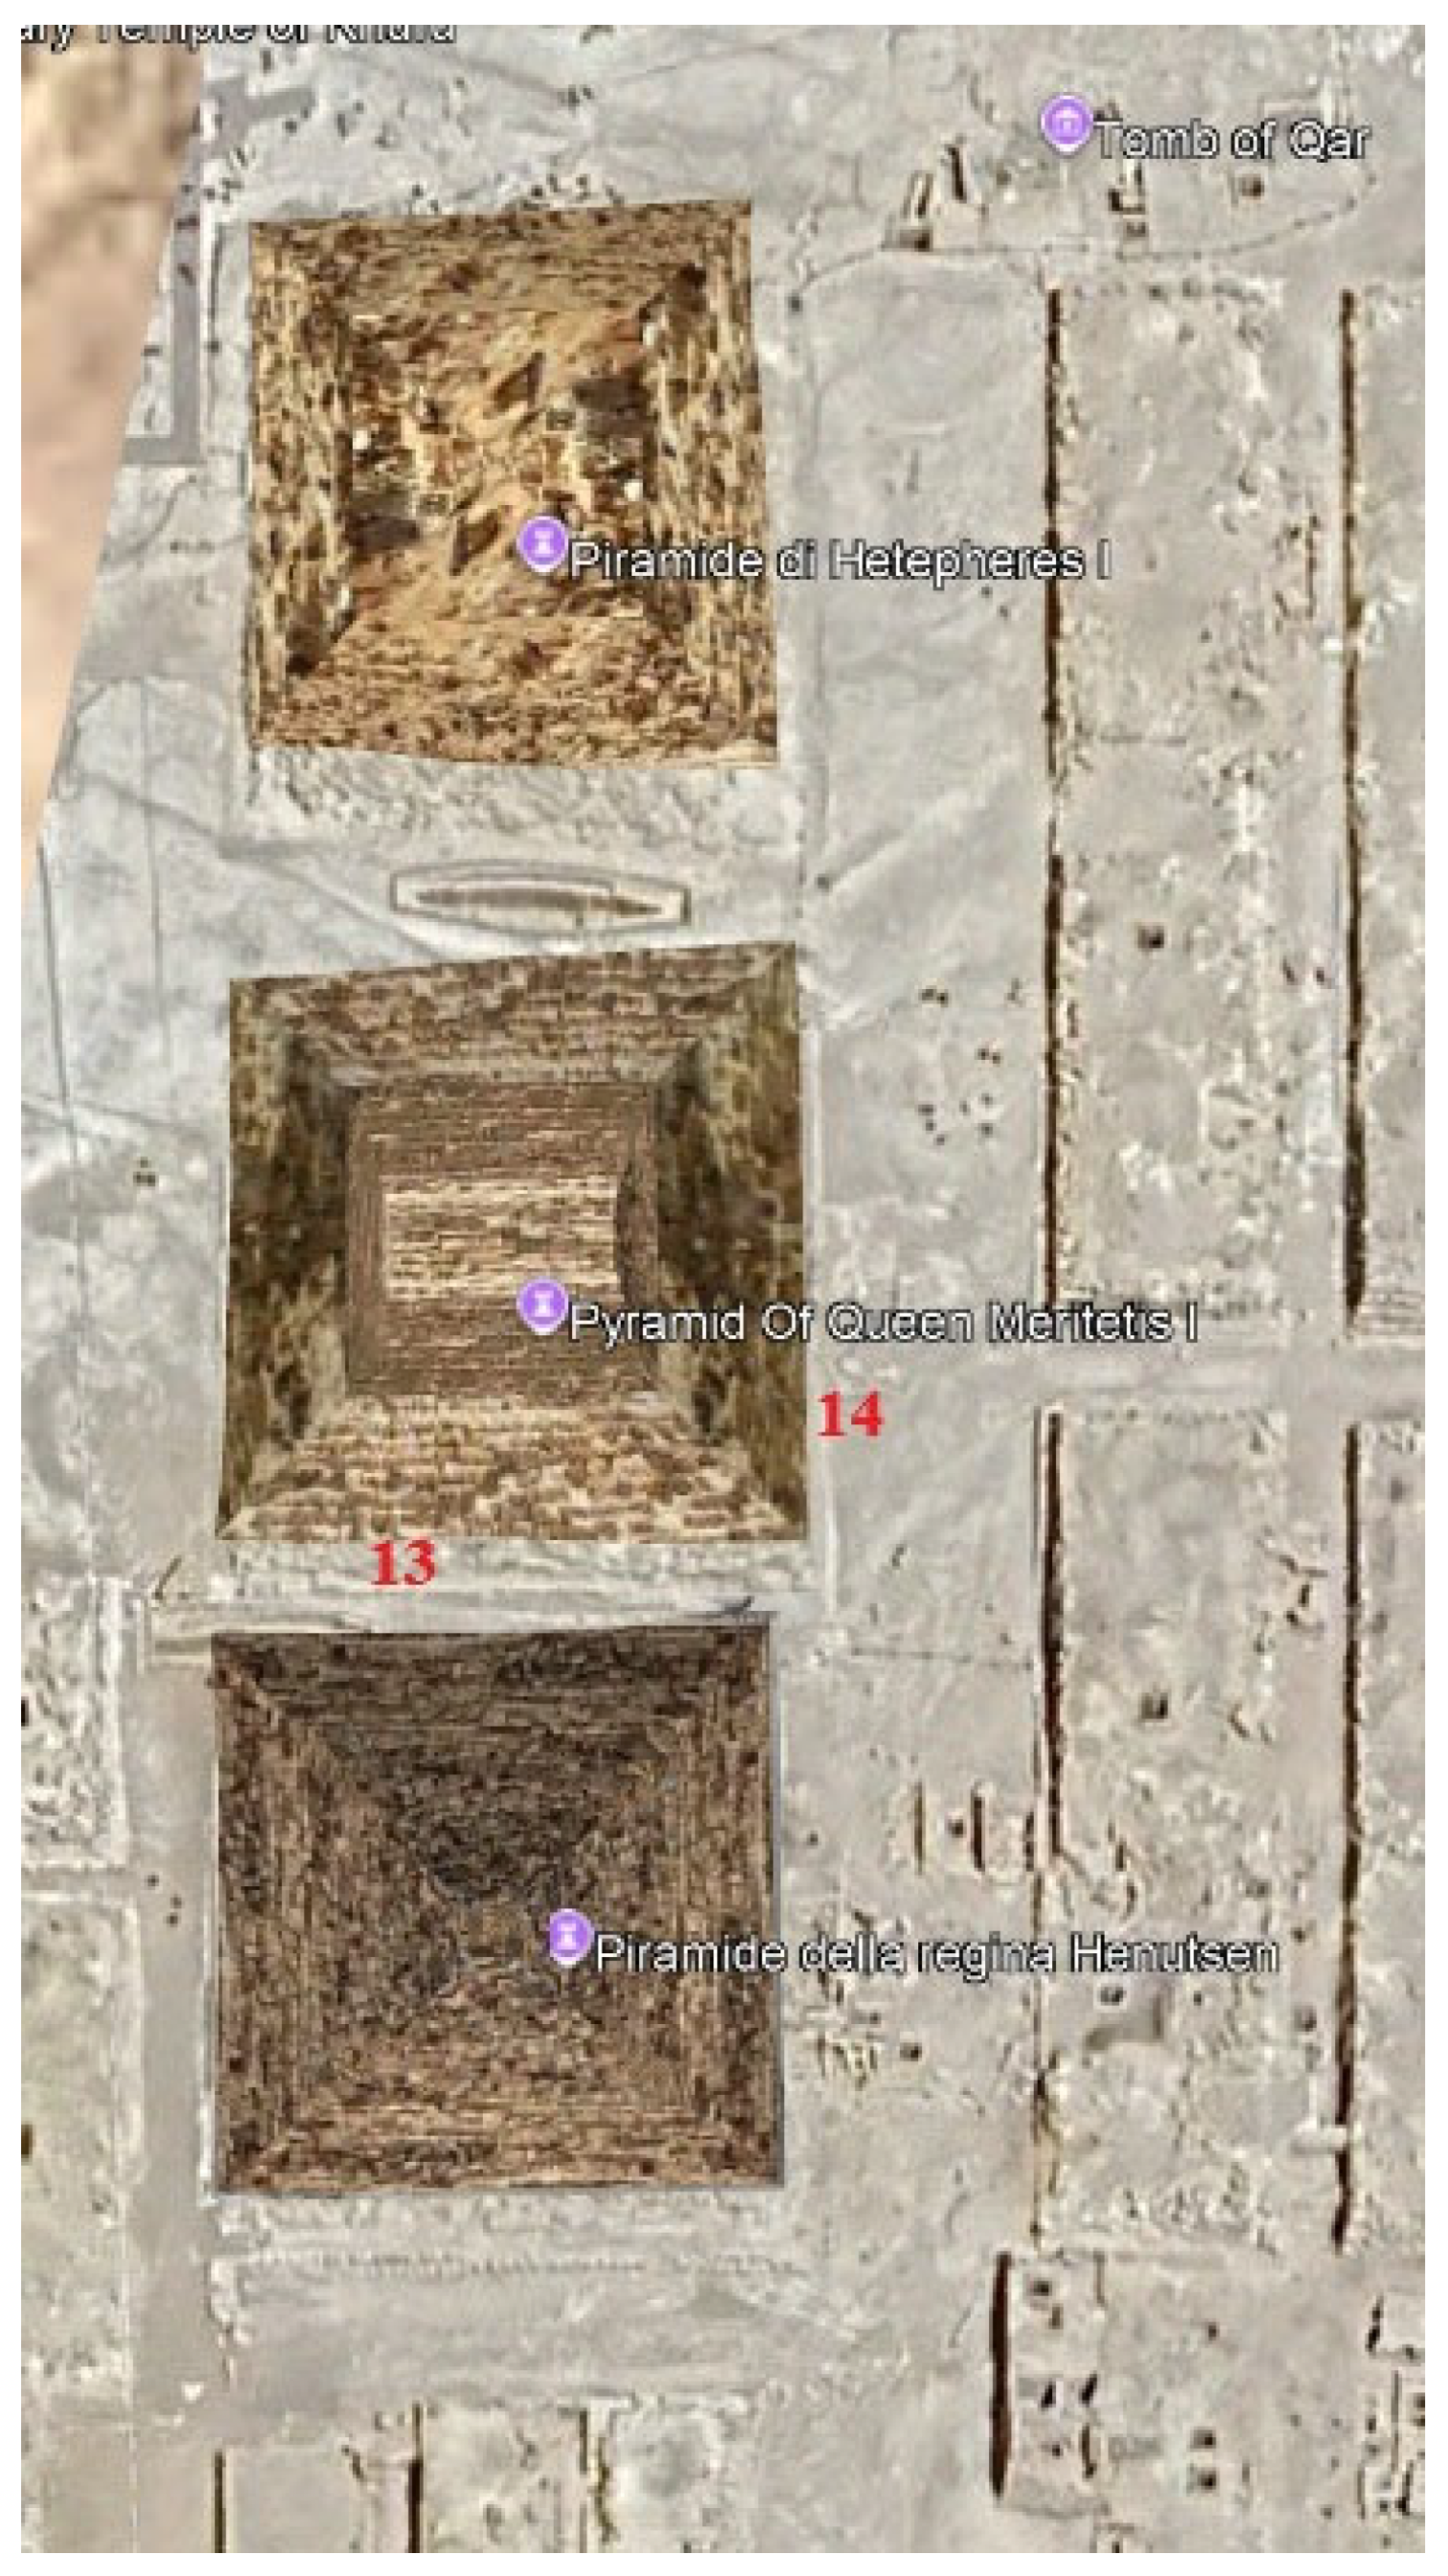
Figure 27.
Wear or erosion of the paving immediately outside the cladding blocks at point 13.
Calculation of construction period with consumption point 13 Meritites I
Average erosion from 675 years B.P.: 1 – 4 mm, average 2.5 mm
Average erosion since the beginning: 2.5 cm = 25 mm
Date of construction: 675 x 25 / 2.5 = 6,750 years B.P.
Figure 28.
Wear or erosion of the paving immediately outside the cladding blocks at point 14.
Calculation of construction period with consumption point 14 Meritites I
Average erosion from 675 years B.P.: 1 – 4 mm, average 2.5 mm
Average erosion from the beginning: 1.5 cm = 15 mm
Date of construction: 675 x 15 / 2.5 = 4,050 years B.P.
Arithmetic mean m of the 2 values calculated for the pyramid G1b of Meritites I
μ = (6,750 + 4,050) / 2 = 5,400 years B.P. = 3,375 B.C.
Points analysed in the G1c pyramid of Henutsen
Figure 29.
The G1c pyramid of Queen Henutsen, with the points where I measured relative erosion marked in red. (picture from Googleearth).
Figure 29.
The G1c pyramid of Queen Henutsen, with the points where I measured relative erosion marked in red. (picture from Googleearth).
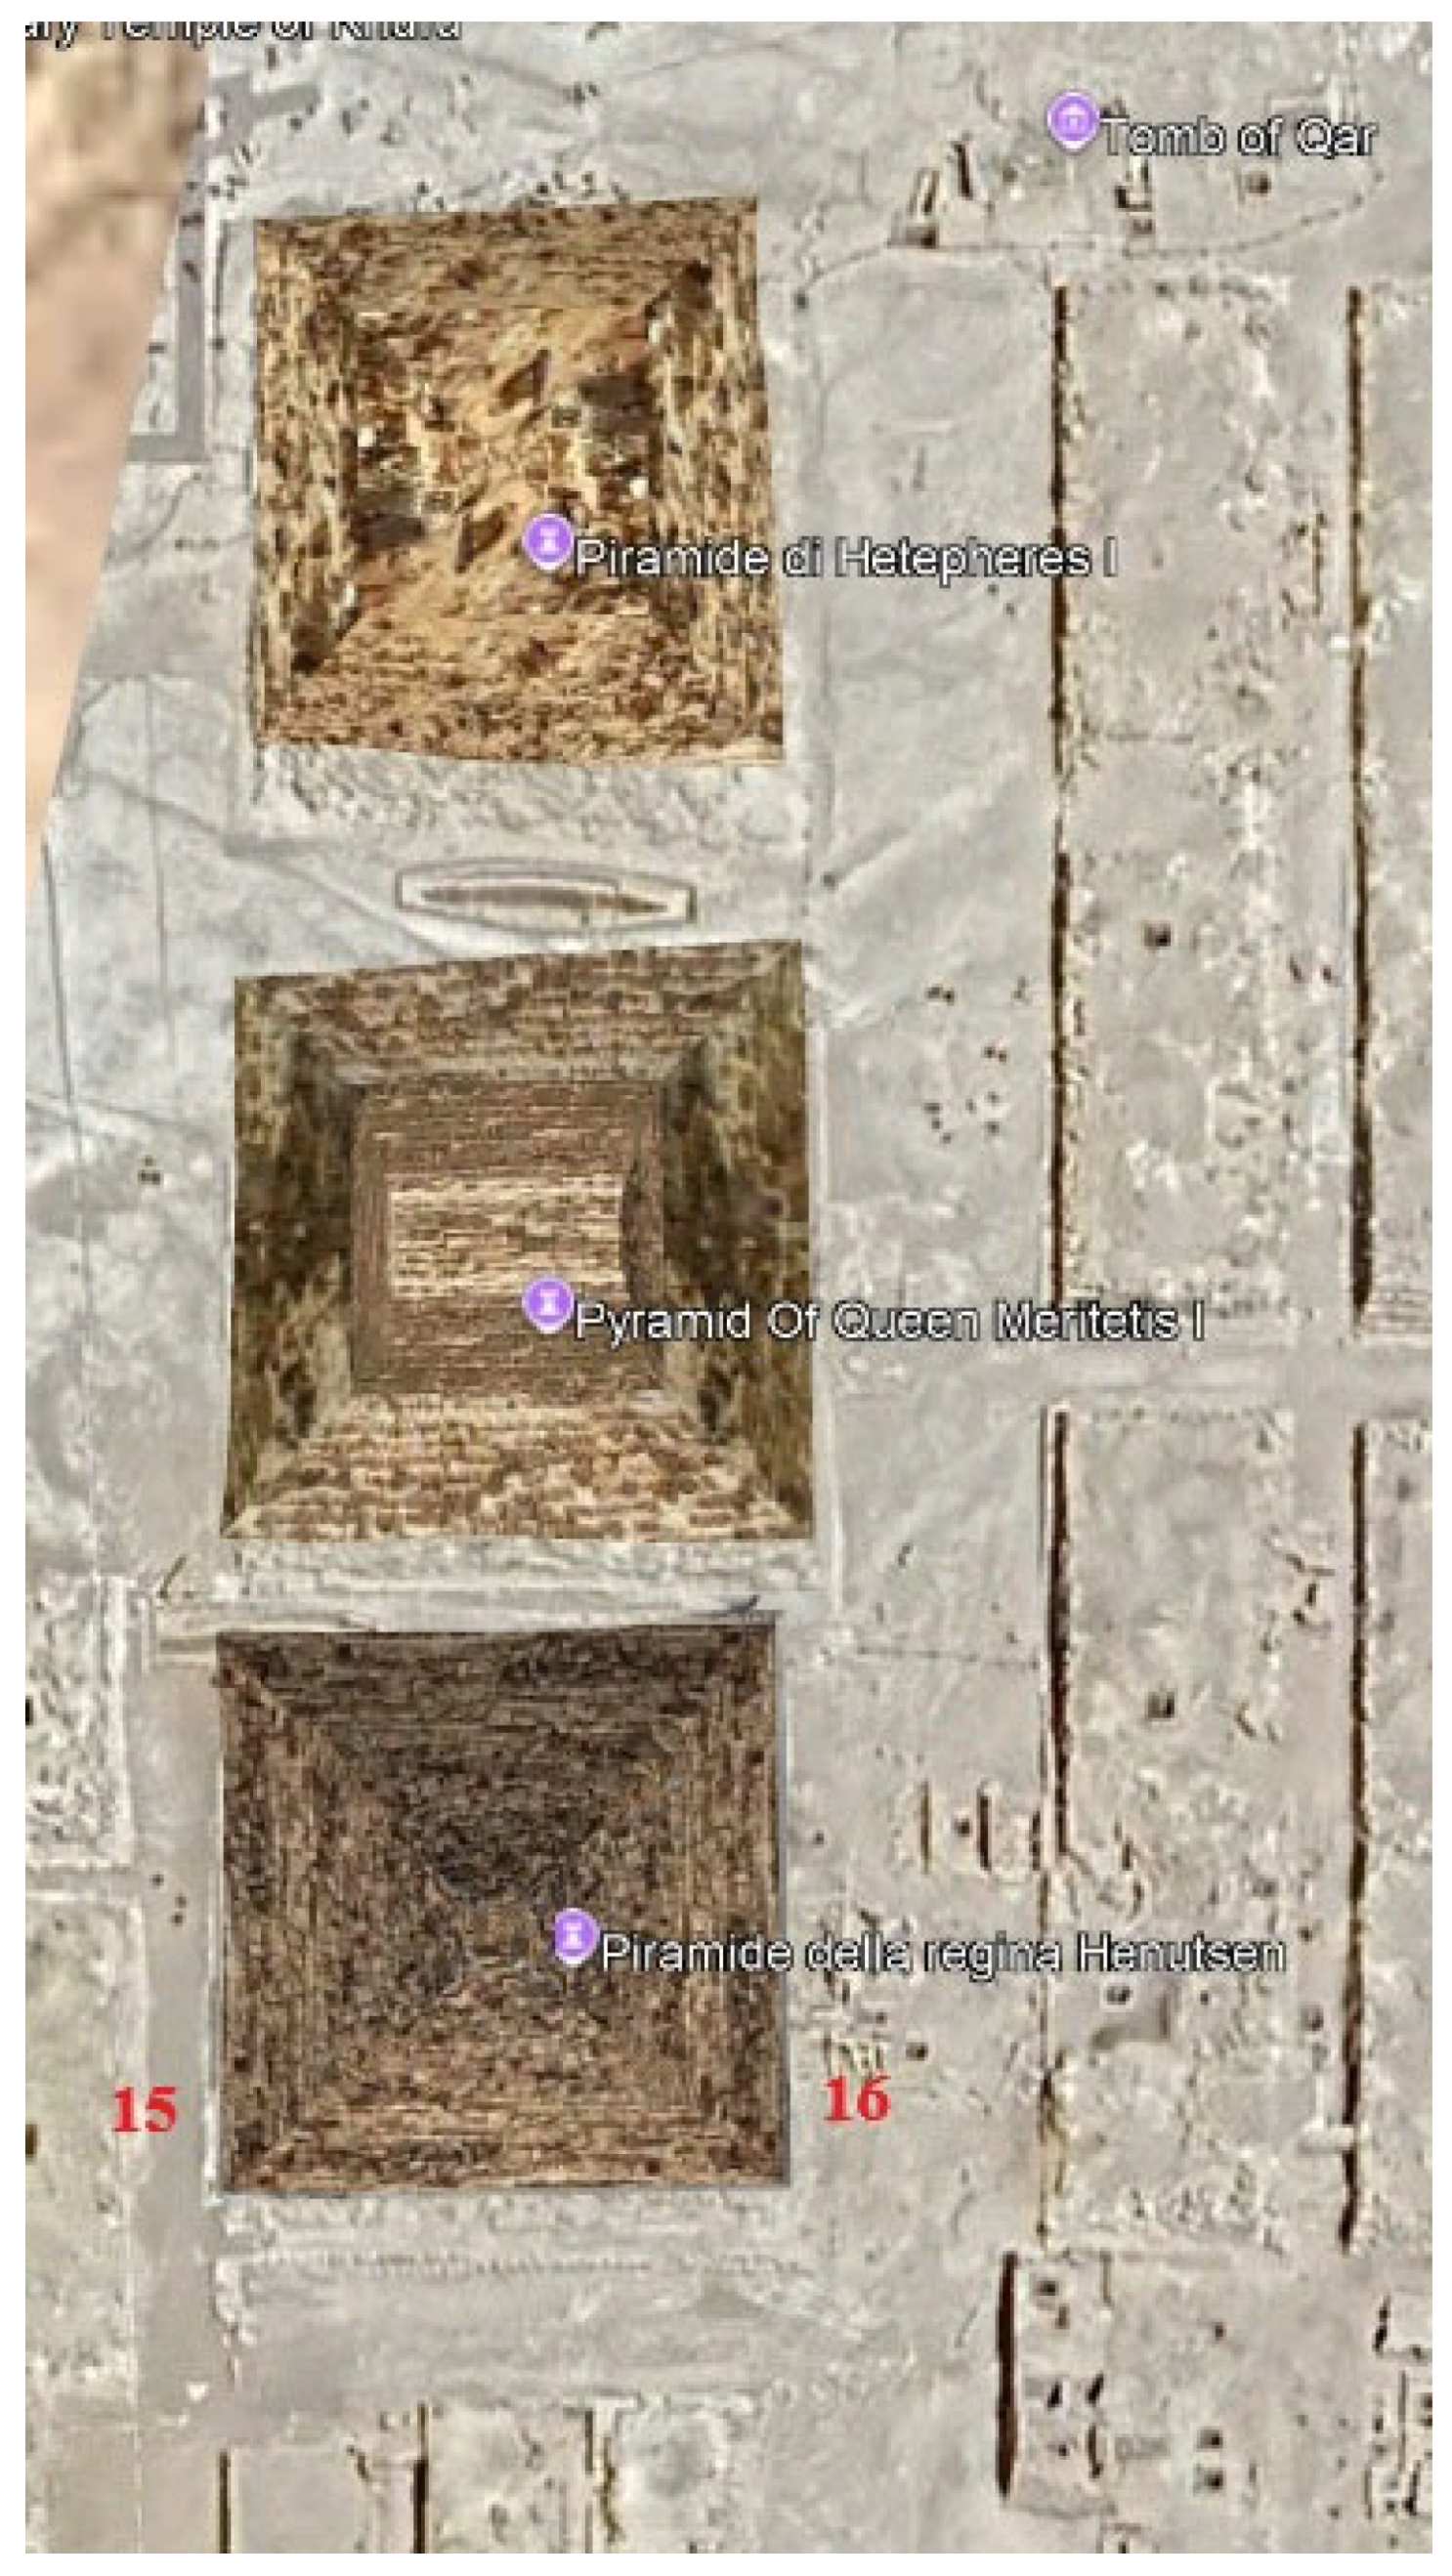
Figure 30.
Wear or erosion of the paving immediately outside the cladding blocks at point 15.
Calculation of construction period with consumption point 15 Henutsen
Average erosion from 675 years B.P.: 2–4 mm, average 3.0 mm
Average erosion since the beginning: 2.5 cm = 25 mm
Date of construction: 675 x 25 / 3.0 = 5,625 years B.P.
Figure 31.
Wear or erosion of the paving immediately outside the cladding blocks at point 16.
Calculation of construction period using point 16 Henutsen consumption
Average erosion over 675 years B.P.: 1–3 mm, average 2 mm
Average erosion since the beginning: 2 cm = 20 mm
Date of construction: 675 x 20 / 2 = 6,750 years B.P.
Arithmetic mean m of the two values calculated for Henutsen’s pyramid G1c
μ = (5.625 + 6.750) / 2 = 6,187 years B.P. = 4,162 B.C.
Points analysed in the in the G2 pyramid of Khafra
Figure 32.
The G2 pyramid of Khafra, with the points where I measured relative erosion marked in red. (picture from Googleearth).
Figure 32.
The G2 pyramid of Khafra, with the points where I measured relative erosion marked in red. (picture from Googleearth).
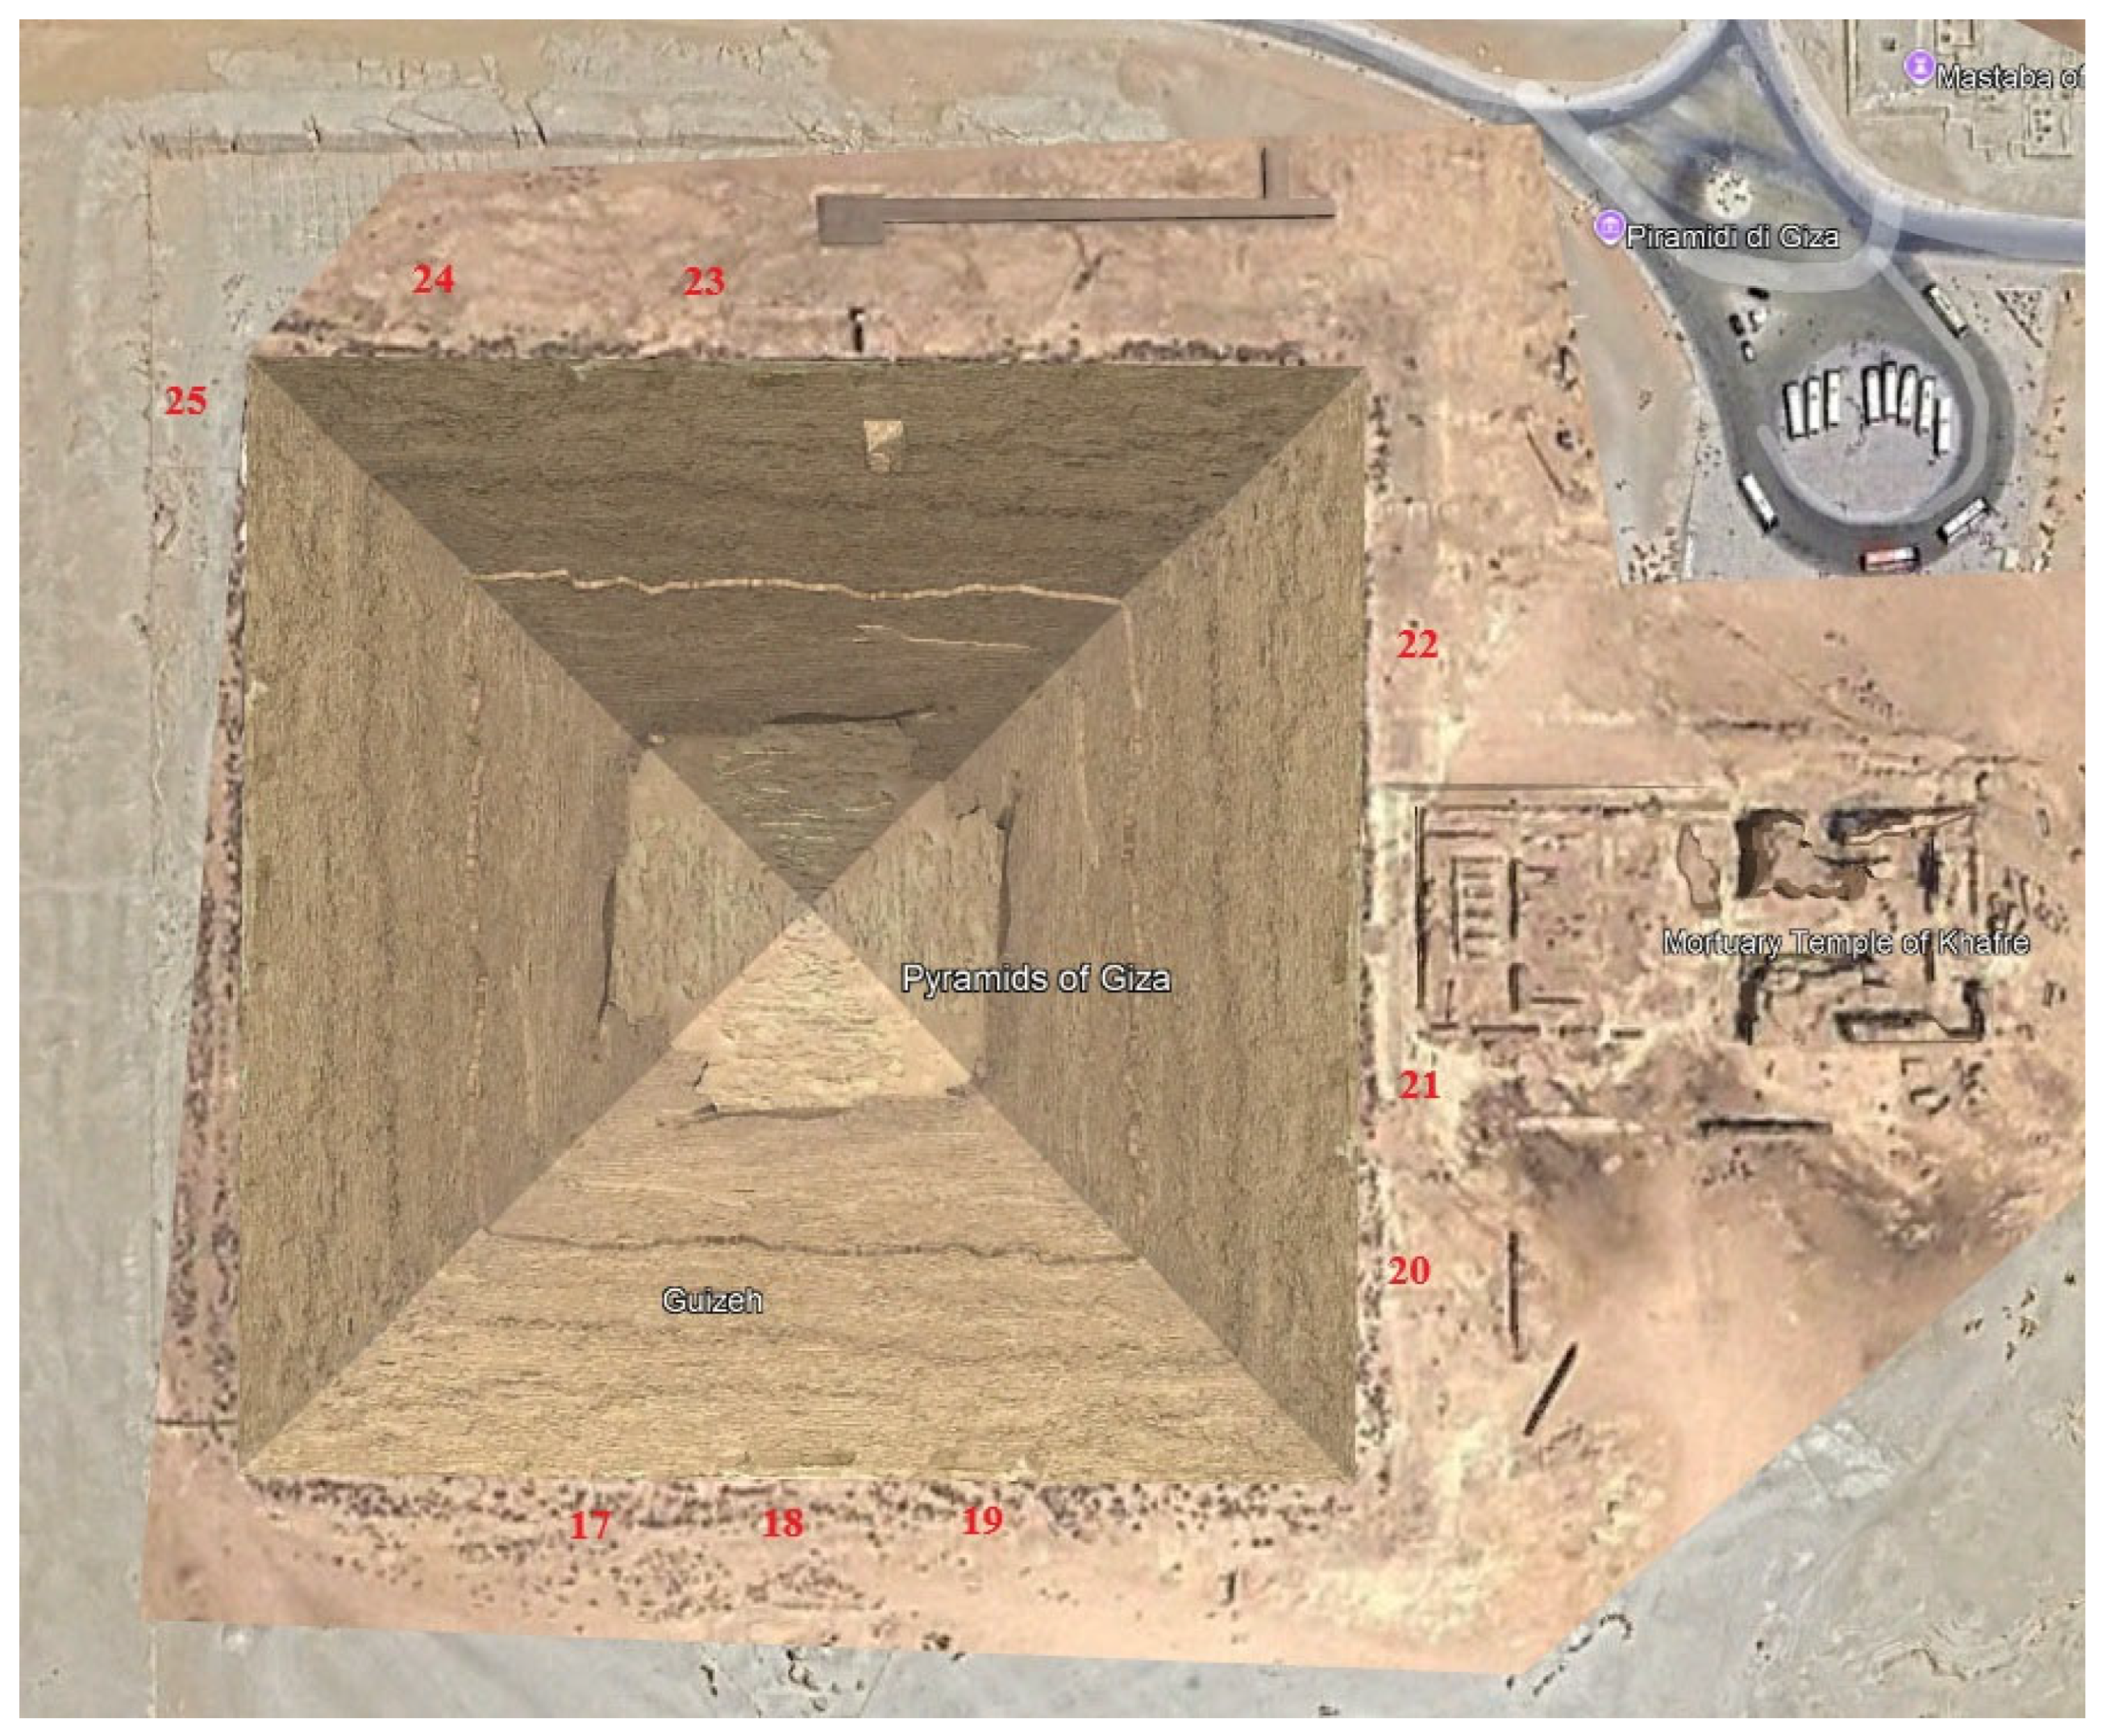
Figure 33.
Wear or erosion of the paving immediately outside the cladding blocks at point 17.
Calculation of construction period with consumption point 17 Khafra
Average erosion from 675 years B.P.: 1 – 3 mm, average 2 mm
Average erosion since the beginning: 3.5 cm = 35 mm
Date of construction: 675 x 35 / 2 = 11,812 years B.P.
Figure 34.
Wear or erosion of the paving immediately outside the cladding blocks at point 18.
Calculation of construction period with consumption point 18 Khafra
Average erosion from 675 years B.P.: 1 – 3 mm, average 2 mm
Average erosion since the beginning: 10 cm = 100 mm
Date of construction: 675 x 100 / 2 = 33,750 years B.P.
Figure 35.
Wear or erosion of the paving immediately outside the cladding blocks at point 19.
Calculation of construction period with consumption point 19 Khafra
Average erosion from 675 years B.P.: 1–2 mm, average 1.5 mm
Average erosion since the beginning: 2 cm = 20 mm
Date of construction: 675 x 20 / 1.5 = 9,000 years B.P.
Figure 36.
Wear or erosion of the paving immediately outside the paving blocks at point 20.
Calculation of construction period with consumption point 20 Khafra
Average erosion from 675 years B.P.: 1 – 4 mm, average 2.5 mm
Average erosion since the beginning: 12 cm = 120 mm
Date of construction: 675 x 120 / 2.5 = 32,400 years B.P.
Figure 37.
Wear or erosion of the paving immediately outside the cladding blocks at point 21.
Calculation of construction period with consumption point 21 Khafra
Average erosion from 675 years B.P.: 2–4 mm, average 3 mm
Average erosion since the beginning: 18 cm = 180 mm
Date of construction: 675 x 180 / 3 = 40,500 years B.P.
Figure 38.
Wear or erosion of the paving immediately outside the cladding blocks at point 22.
Calculation of construction period with consumption point 22 Khafra
Average erosion from 675 years B.P.: 1–3 mm, average 2 mm
Average erosion since the beginning: 3 cm = 30 mm
Construction date: 675 x 30 / 2 = 10,125 years B.P.
Figure 39.
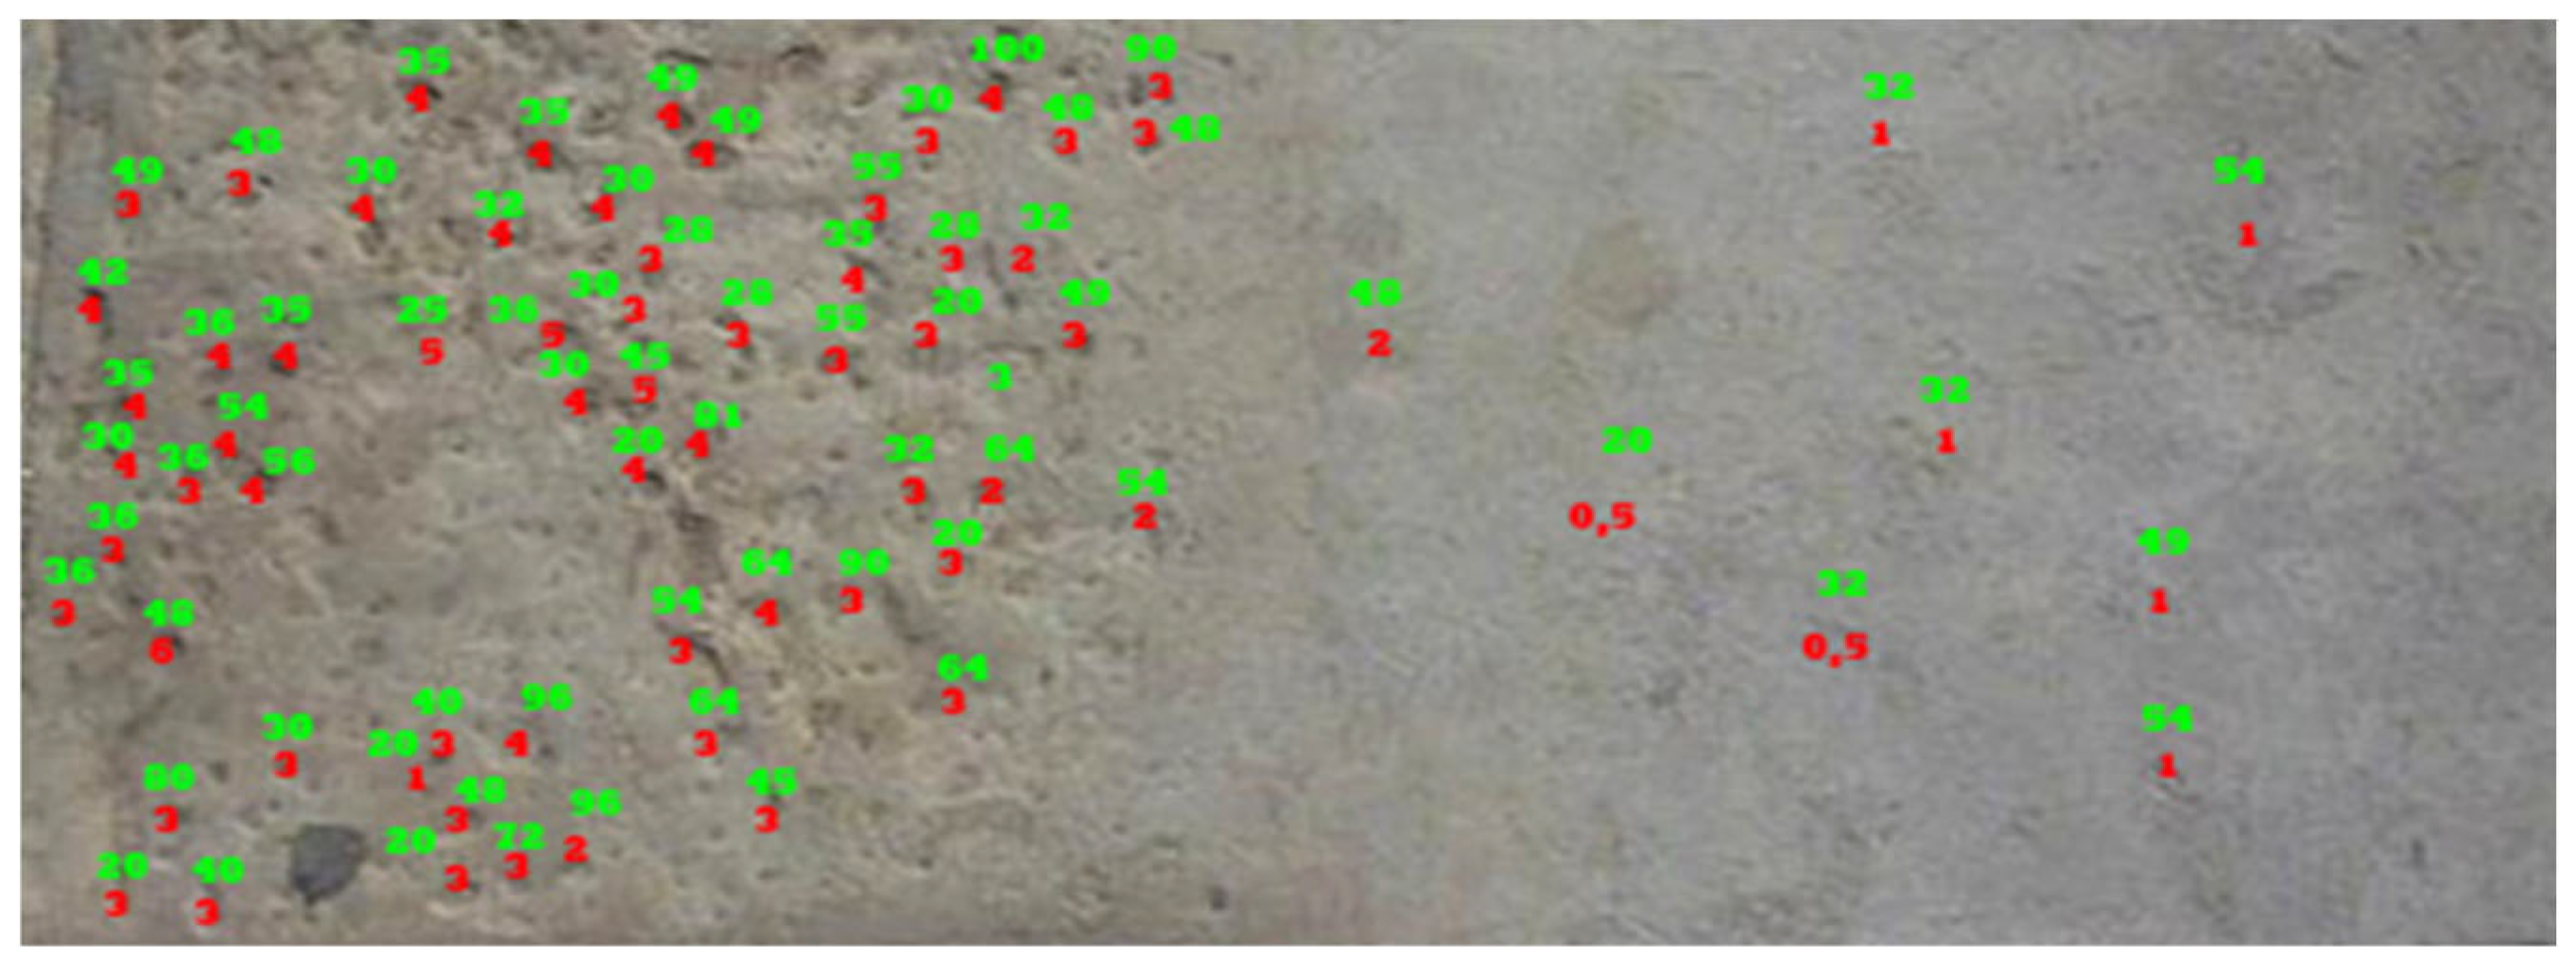
Erosion of the pavement of the Khafra quarry, at point 23. The area of the eroded cavities is shown in green and their average depth in red, in order to calculate their volume.
Figure 39.
Erosion of the pavement of the Khafra quarry, at point 23. The area of the eroded cavities is shown in green and their average depth in red, in order to calculate their volume.
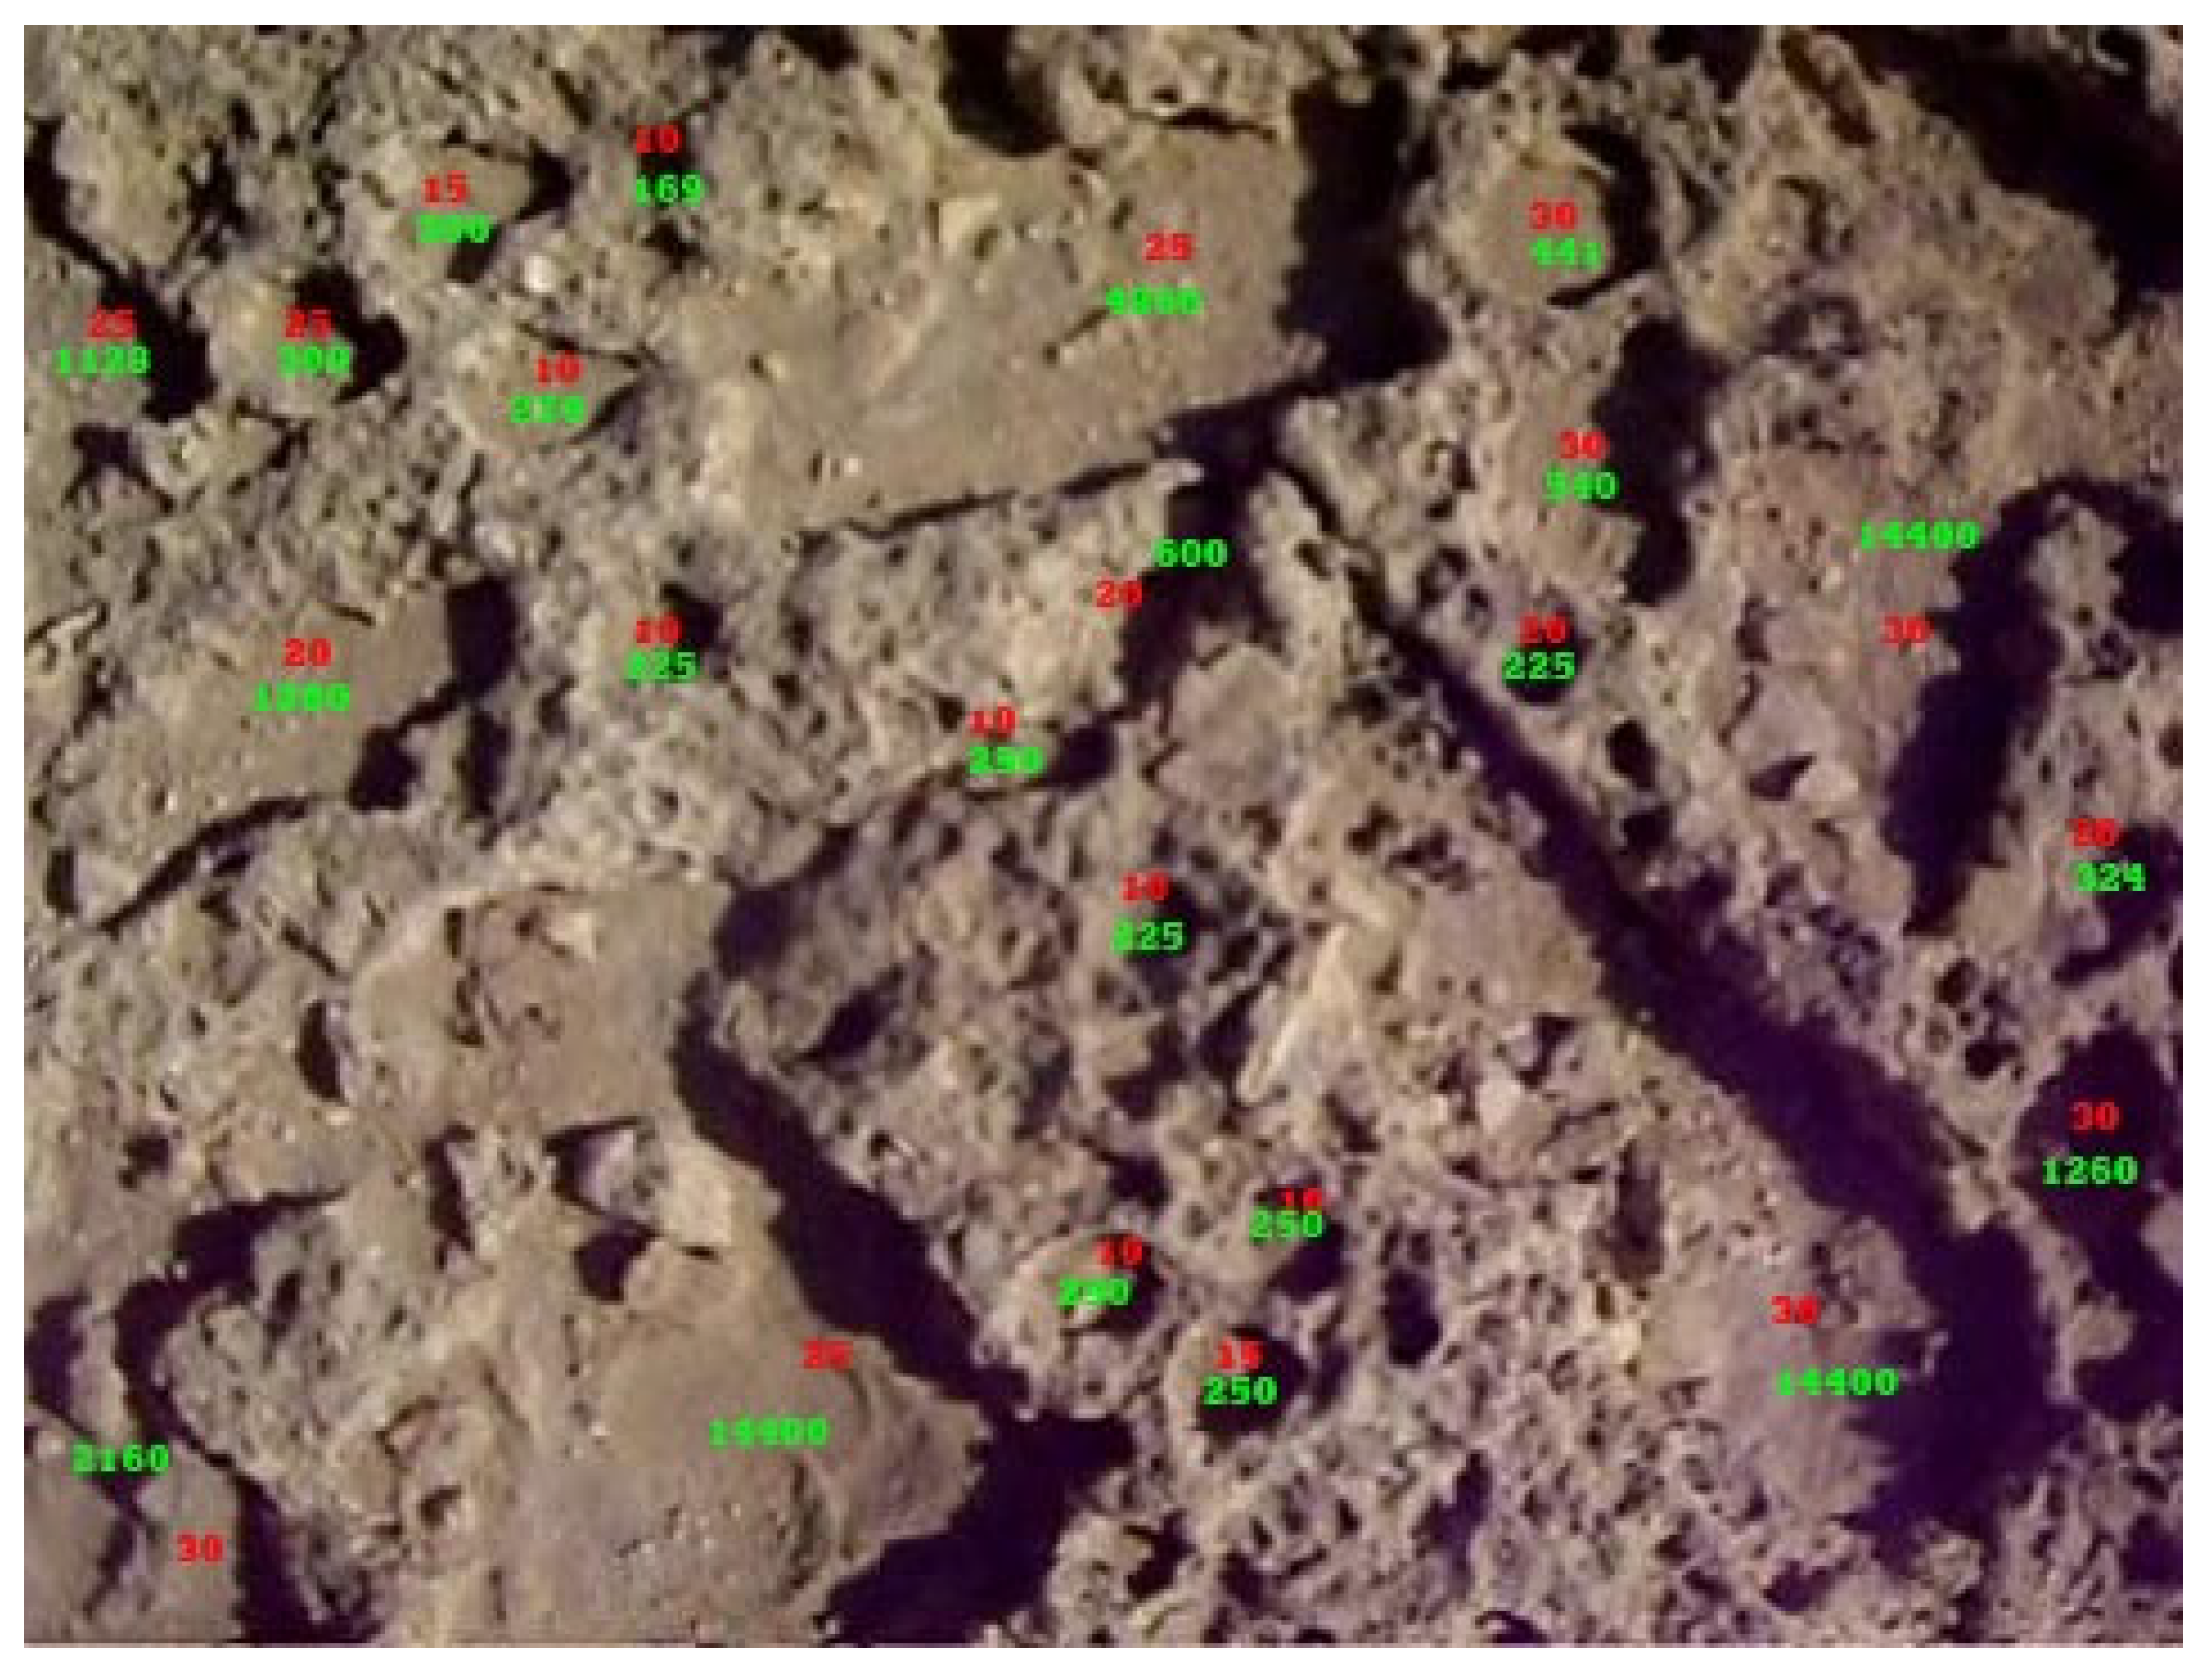
Figure 40.
Erosion of the base of the pyramid of Khafra carved into the rock, which was once covered by facing blocks, at point 23. The area of the eroded cavities is shown in green and their average depth in red, in order to calculate their volume.
Figure 40.
Erosion of the base of the pyramid of Khafra carved into the rock, which was once covered by facing blocks, at point 23. The area of the eroded cavities is shown in green and their average depth in red, in order to calculate their volume.
Calculation of construction period based on the volume of eroded cavities at point 23 Khafra
Total volume of eroded cavities in the exposed part: 1,584,850 mm³
Total volume of eroded recesses in the uncovered part 675 years B.P.: 43,701 mm3
Date of construction: 1,584,850 x 675 / 43,701 = 24,479 years B.P.
Figure 41.
Erosion of the pavement at the Khafra quarry, at point 24.
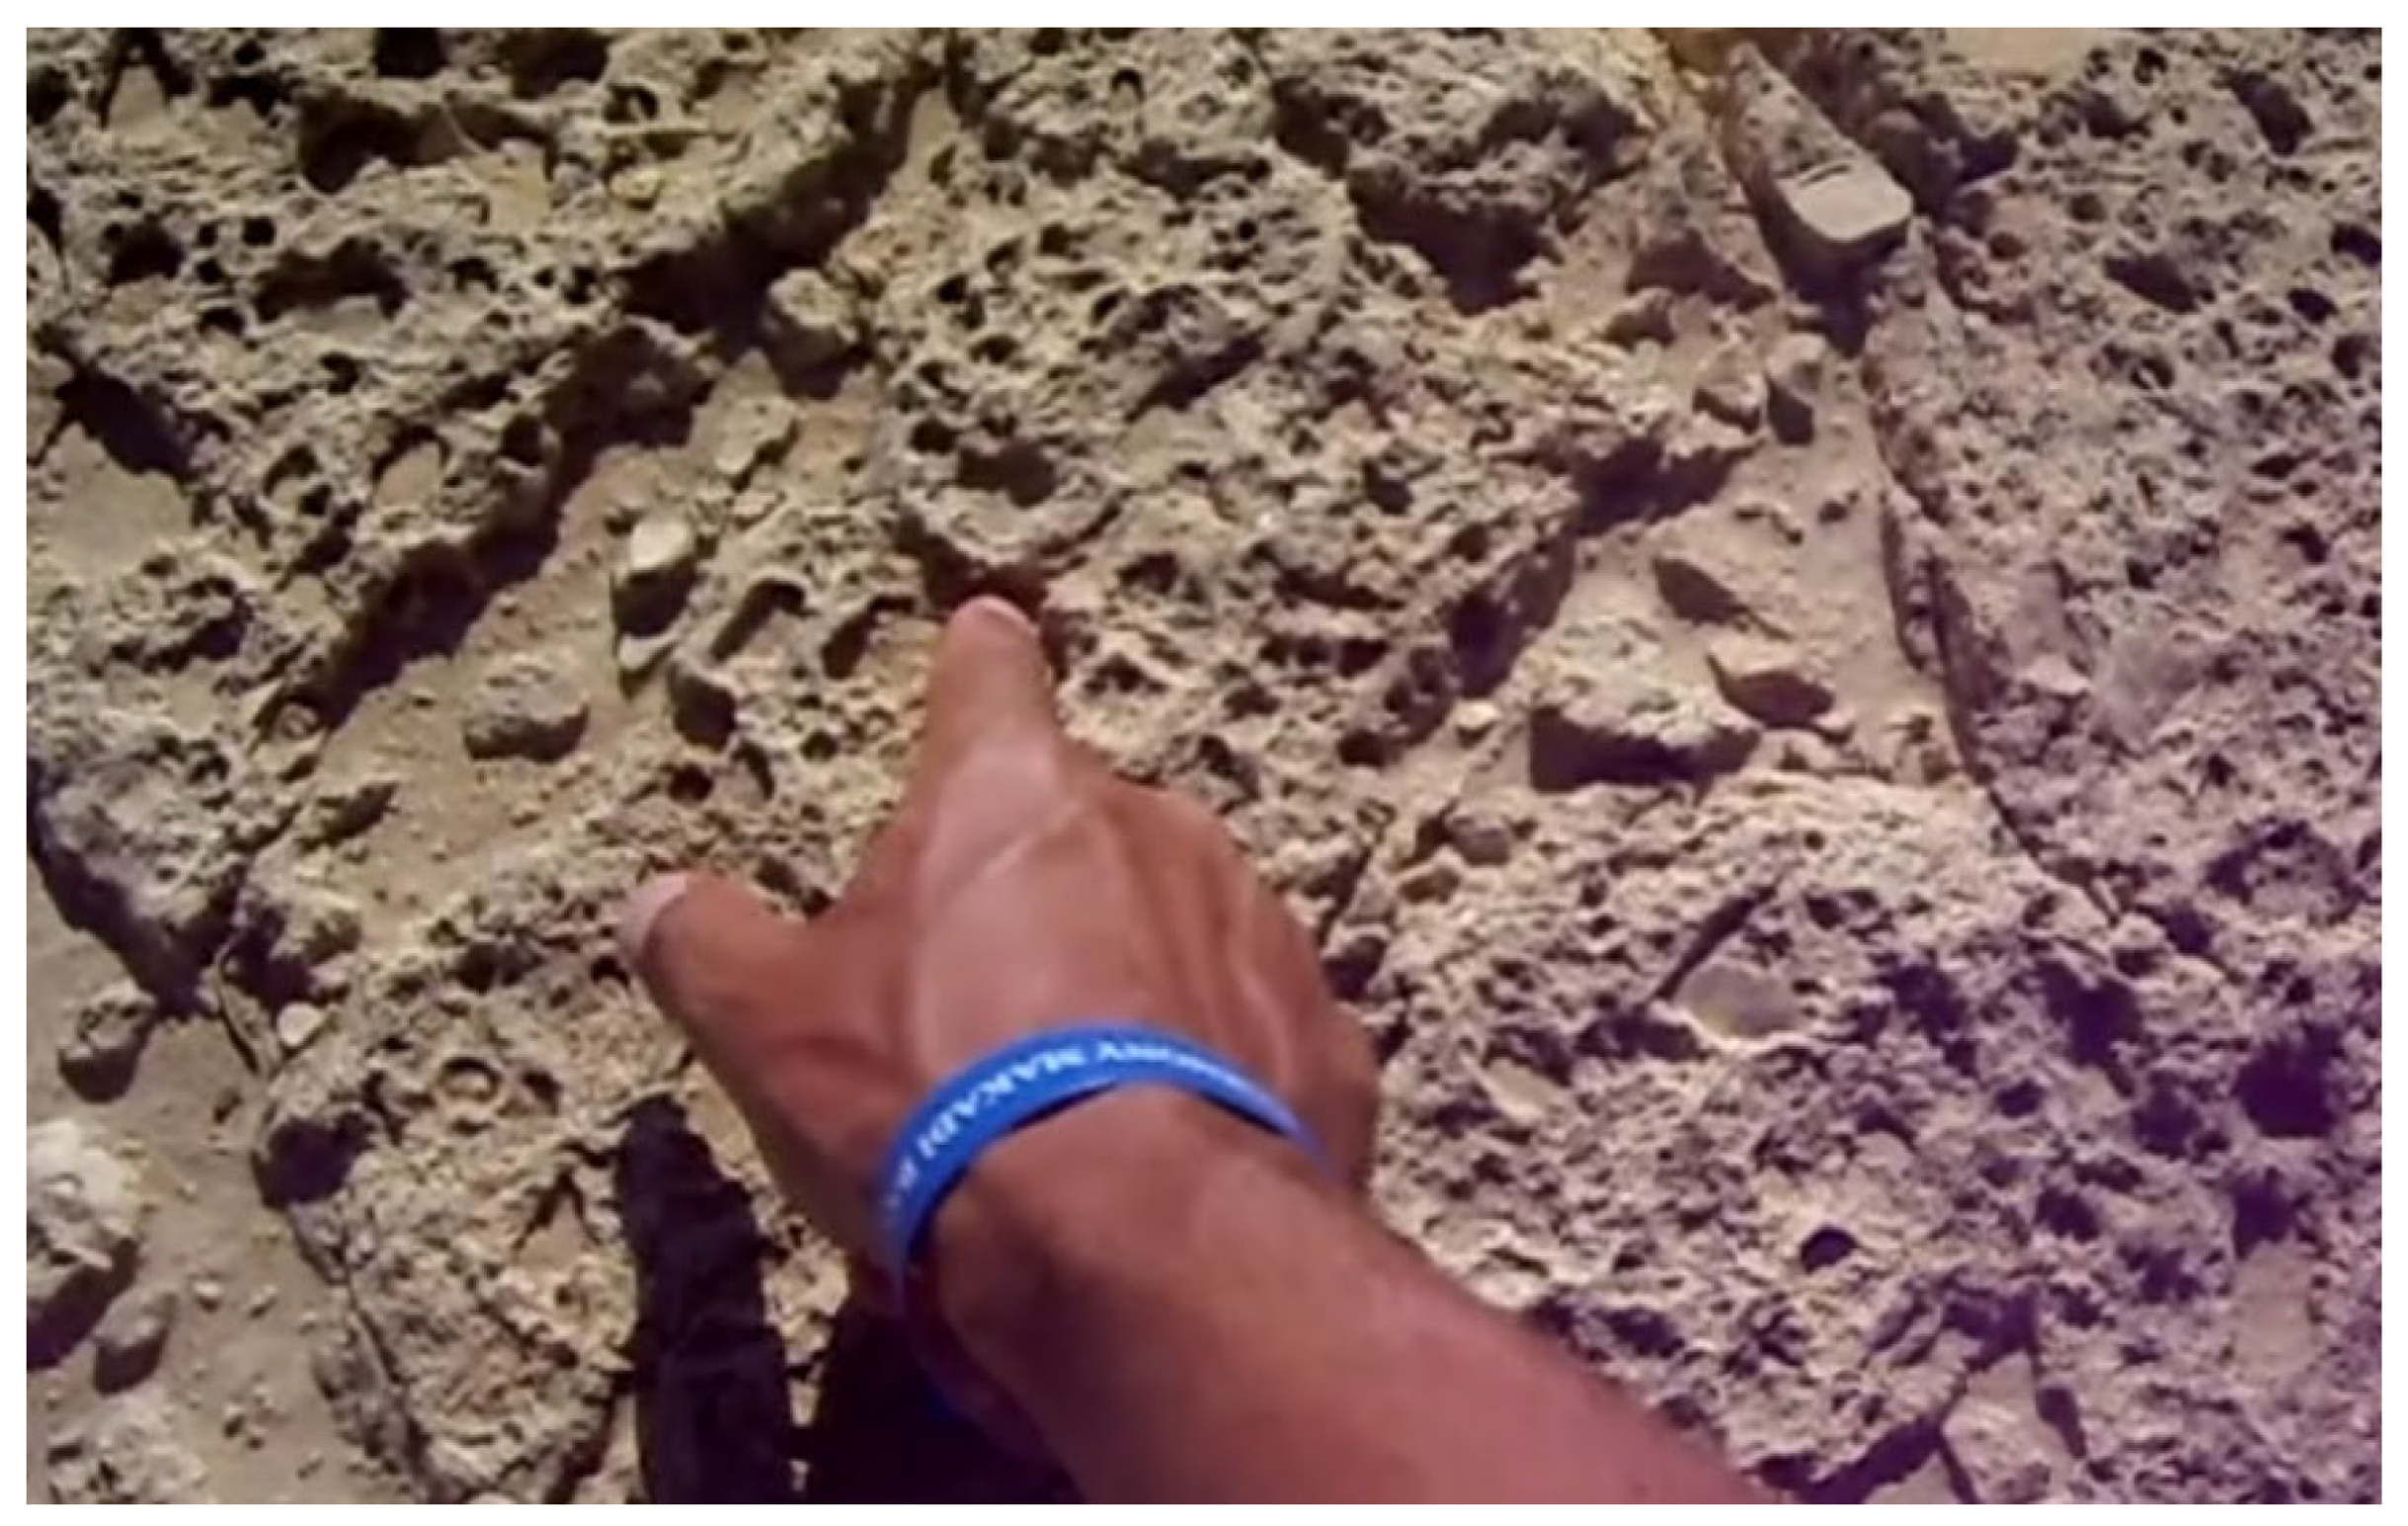
Figure 42.
Erosion of the base of the pyramid of Khafra carved into the rock, which was once covered by cladding blocks, at point 24.
Figure 42.
Erosion of the base of the pyramid of Khafra carved into the rock, which was once covered by cladding blocks, at point 24.
Calculation of construction period based on volume of eroded recesses at point 24 Khafra
Total volume of eroded recesses in exposed section: 1,273,320 mm³
Total volume of eroded recesses in the uncovered part 675 years B.P.: 39,430 mm3
Date of construction: 1,273,320 x 675 / 39,430 = 21,797 years B.P.
Figure 43.
Wear or erosion of the pavement immediately outside the paving blocks at point 25.
Calculation of construction period with consumption point 25 Khafra
Average erosion from 675 years B.P.: 1 – 3 mm, average 2 mm
Average erosion from the beginning: 4 cm = 40 mm
Date of construction: 675 x 40 / 2 = 13,500 years B.P.
Arithmetic mean μ of the 9 values calculated for the G2 pyramid of Khafra
μ = (11.812 + 33.750 + 9.000 + 32.400 + 40.500 + 10.125 + 24.479 + 21.797 + 13.500) / 9 = 21.929
years B.P. = 19.904 B.C.
Standard deviation
σ = 11.623
Z score: (x - μ) / σ
-0,87 1,01 -1,11 0,90 1,59 -1,01 0,21 -0,011 -0,72
Figure 44.
Gaussian curve showing the 68.2% probability that the value will fall within plus or minus one standard deviation [3].
Figure 44.
Gaussian curve showing the 68.2% probability that the value will fall within plus or minus one standard deviation [3].

Therefore, regarding the dating of Khafra’s pyramid G2 calculated on the basis of REM, I have a 68.2% probability that it lies between (μ - σ) and (μ + σ), i.e. (21,929 - 11,623) and (21,929 + 11,623).
68.2% probability that the pyramid G2 of Khafra was built between 10,306 and 33,552 years B.P., with an average of 21,929 years B.P.
68.2% probability that the G2 pyramid of Khafra was built between 8,281 B.C. and 31,527 B.C., with an average of 19,904 B.C.
11. Conclusions of the Preliminary Report
The REM identified a probable dating range for each analysed pyramid. The results are as follows:
- Pyramid G1 of Akhet Khufu:
24,941 years B.P. with a 68.2% probability that the construction period is between 10,979 and 38,903 years B.P.,
i.e. 22,916 B.C. with a 68.2% probability that the construction period is between 8,954 B.C. and 36,878 B.C.
- Pyramid G1b of Meritites I:
5,400 years B.P. = 3,375 B.C.
- Pyramid G1c of Henutsen:
6,187 years B.P. = 4,162 B.C.
- Pyramid G2 of Khafra:
21,929 years B.P. with a 68.2% probability that the construction period is between 10,306 and 33,552 years B.P.,
i.e. 19,904 B.C. with a 68.2% probability that the construction period is between 8,281 B.C. and 31,527 B.C.
These conclusions are preliminary and will be further investigated through additional measurements, extended to all structures and buildings on the Giza plateau. It is always possible to improve measurement accuracy, the determination of eroded volumes, and the overall precision of the results.
Alberto Donini intends to continue his research and invites archaeologists from around the world to collaborate in future studies.
REM is not intended to determine a precise construction date for an ancient building; rather, it identifies a temporal interval and assigns a probability to it. Although the resulting date ranges are wide, the conclusions indicate a low probability for the official archaeological dating of 2,560 B.C., which remains plausible only for the two Queens’ pyramids analysed (G1b of Meritites I and G1c of Henutsen).
For these reasons, it is likely that the pyramids of Akhet Khufu and Khafra (G1 and G2) date back to approximately 19,000–23,000 B.C., whereas at least two of the Queens’ pyramids (G1b and G1c), located adjacent to the Pyramid of Khufu, were constructed much later, presumably between 2,500 and 5,000 years B.C. It is therefore plausible that the pharaohs Cheops and Chefren merely renovated the two largest pyramids on the Giza plateau, attributing their authorship to themselves, and possibly built the Queens’ pyramids.
On the basis of this preliminary report on relative erosion measurements (REM) carried out on selected pyramids of the Giza plateau, it can be concluded that around 20,000 years before Christ there existed a civilisation in Egypt capable of constructing at least the two main pyramids (G1 and G2).
Funding
The entire project was funded exclusively by the author of this report, A. Donini.
References
- https://www.amazon.it/mistero-Orione-scoperta-segreti-piramidi/dp/8879722190.
- https://www.amazon.it/Segreto-Degli-Dei-Armando-Mei/dp/1505317282.
- https://www.senhormercado.com.br/bolsa-de-valores-e-videogames/curva-de-gauss-bovespa/.
- The Earth’s axis undergoes precession (a rotation of the axis around the perpendicular to the ecliptic), completing a full rotation approximately every 25,772 years.
- Zep Tepi: ‘The first day’, ‘the beginning’, ‘the golden age’, a mythical age. It represents the time when the world was created and the gods established order (Ma’at).
- B.P. = Before Present.
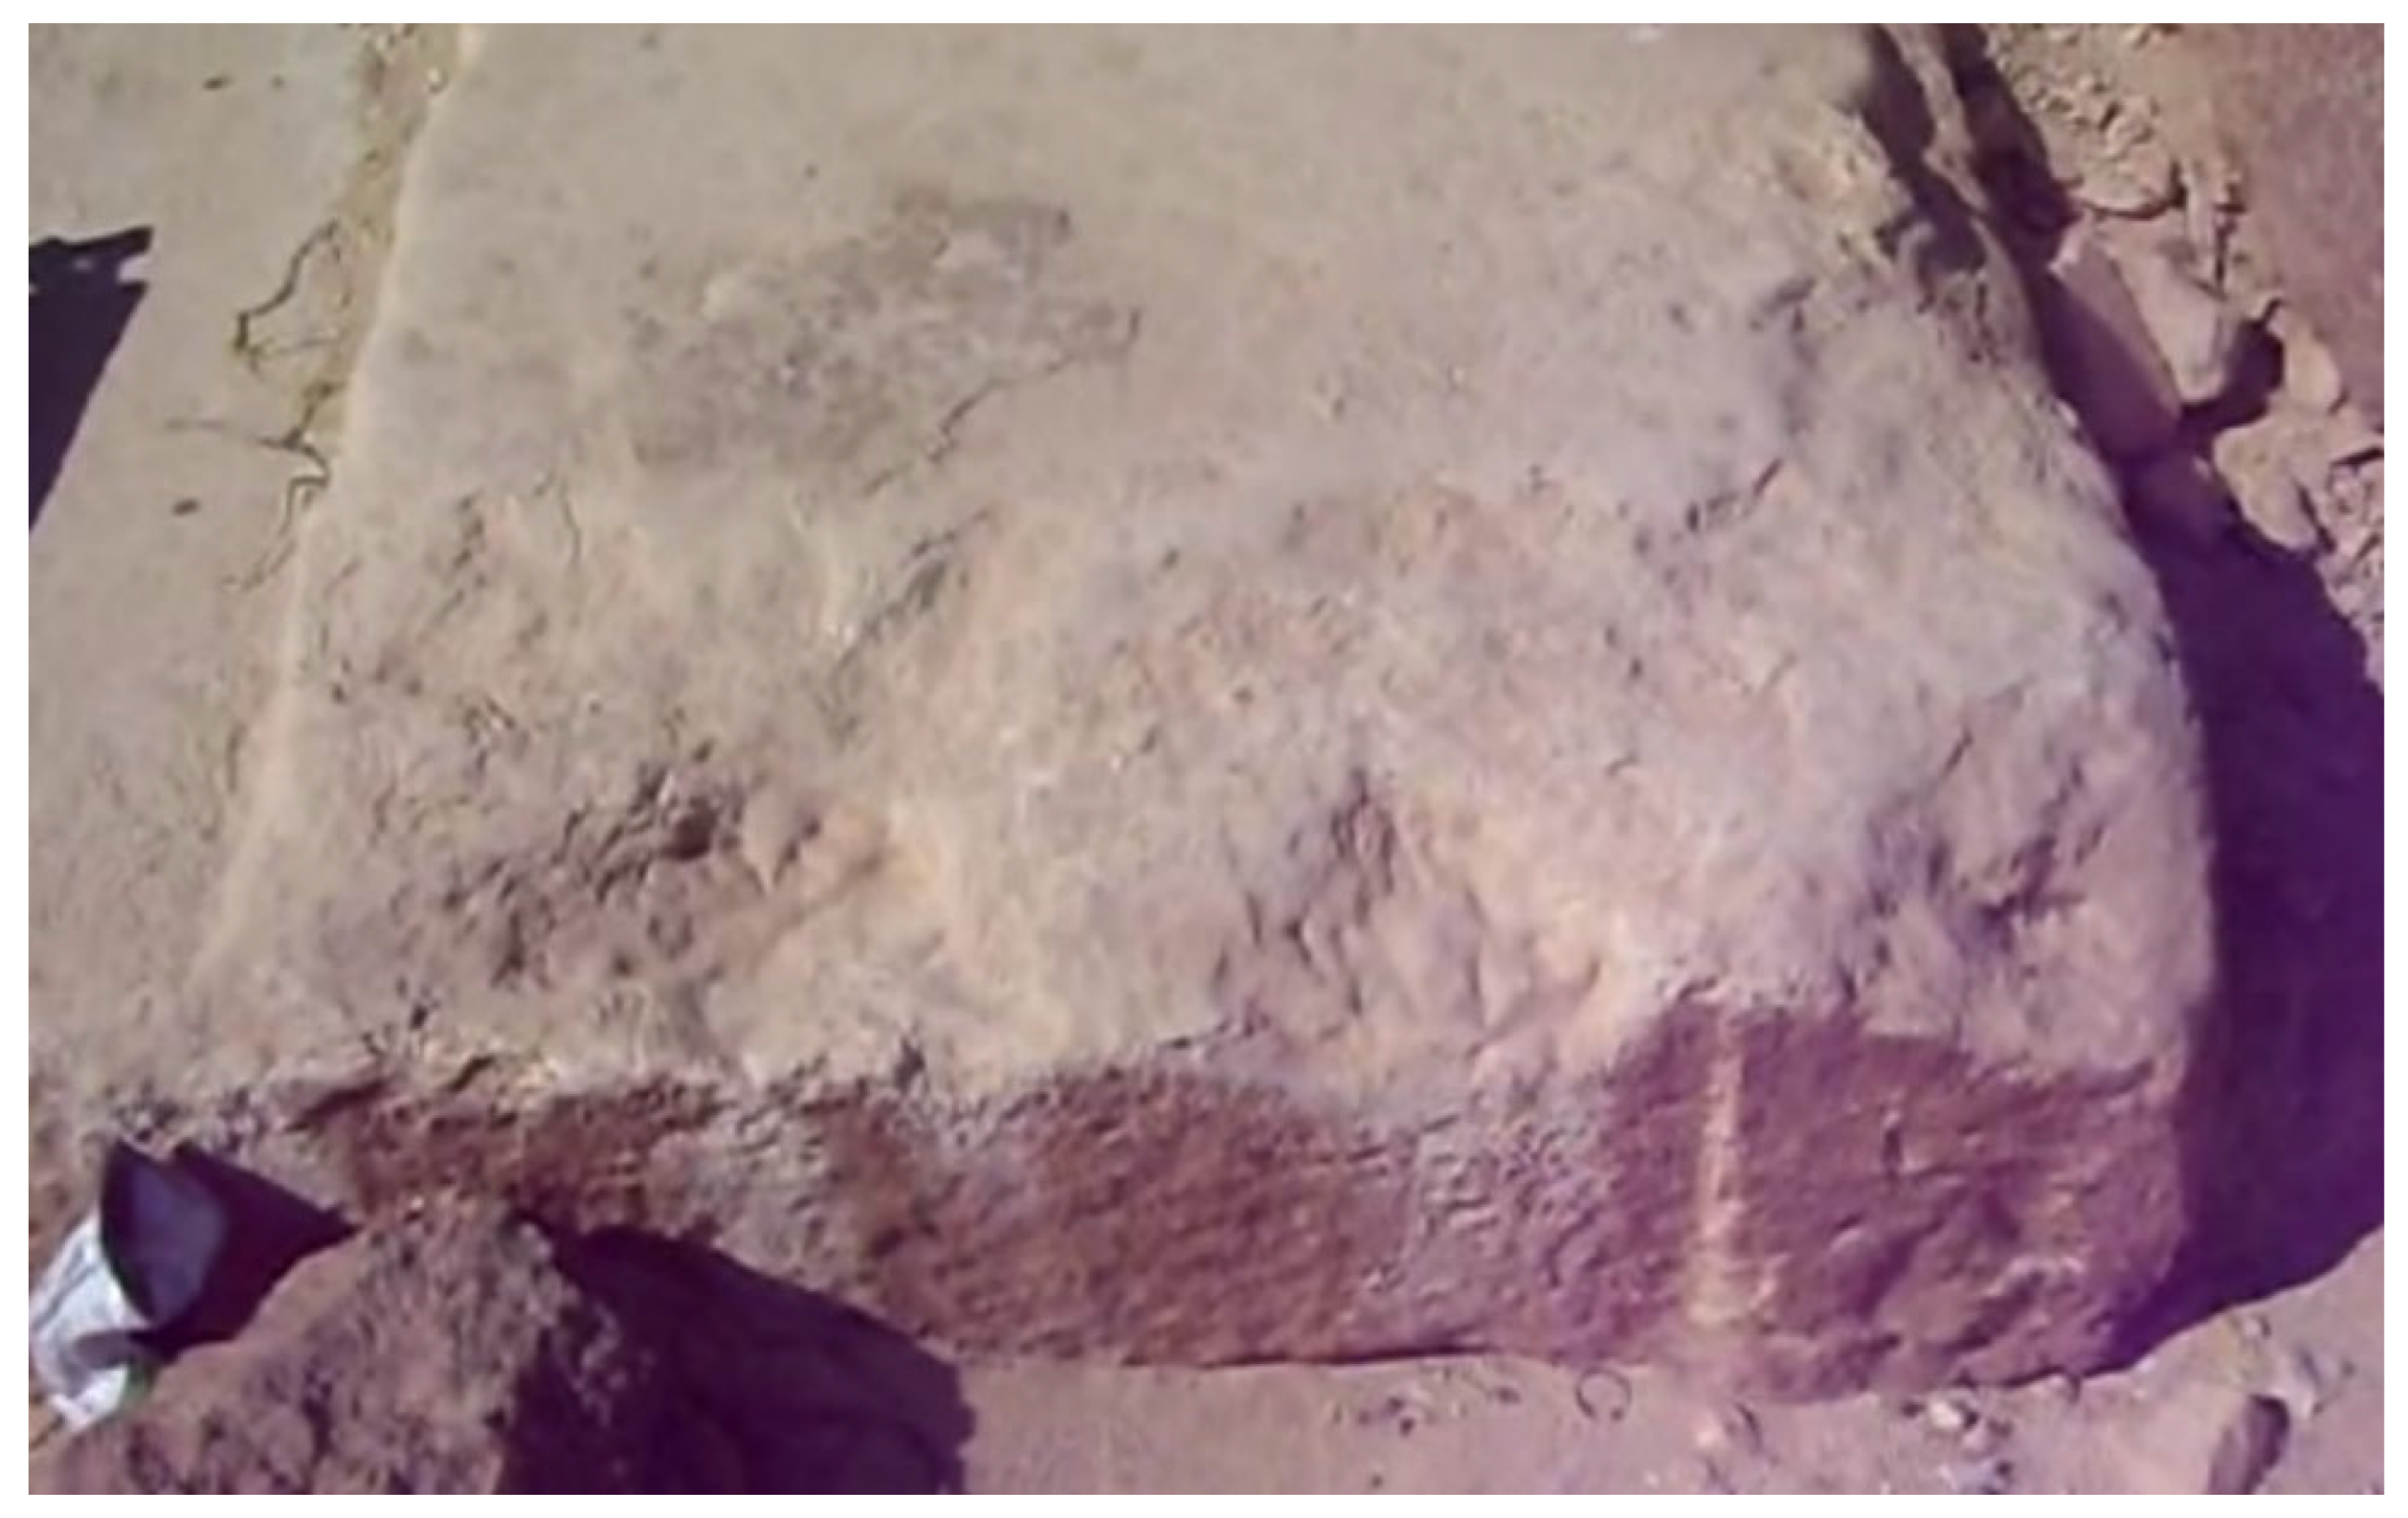
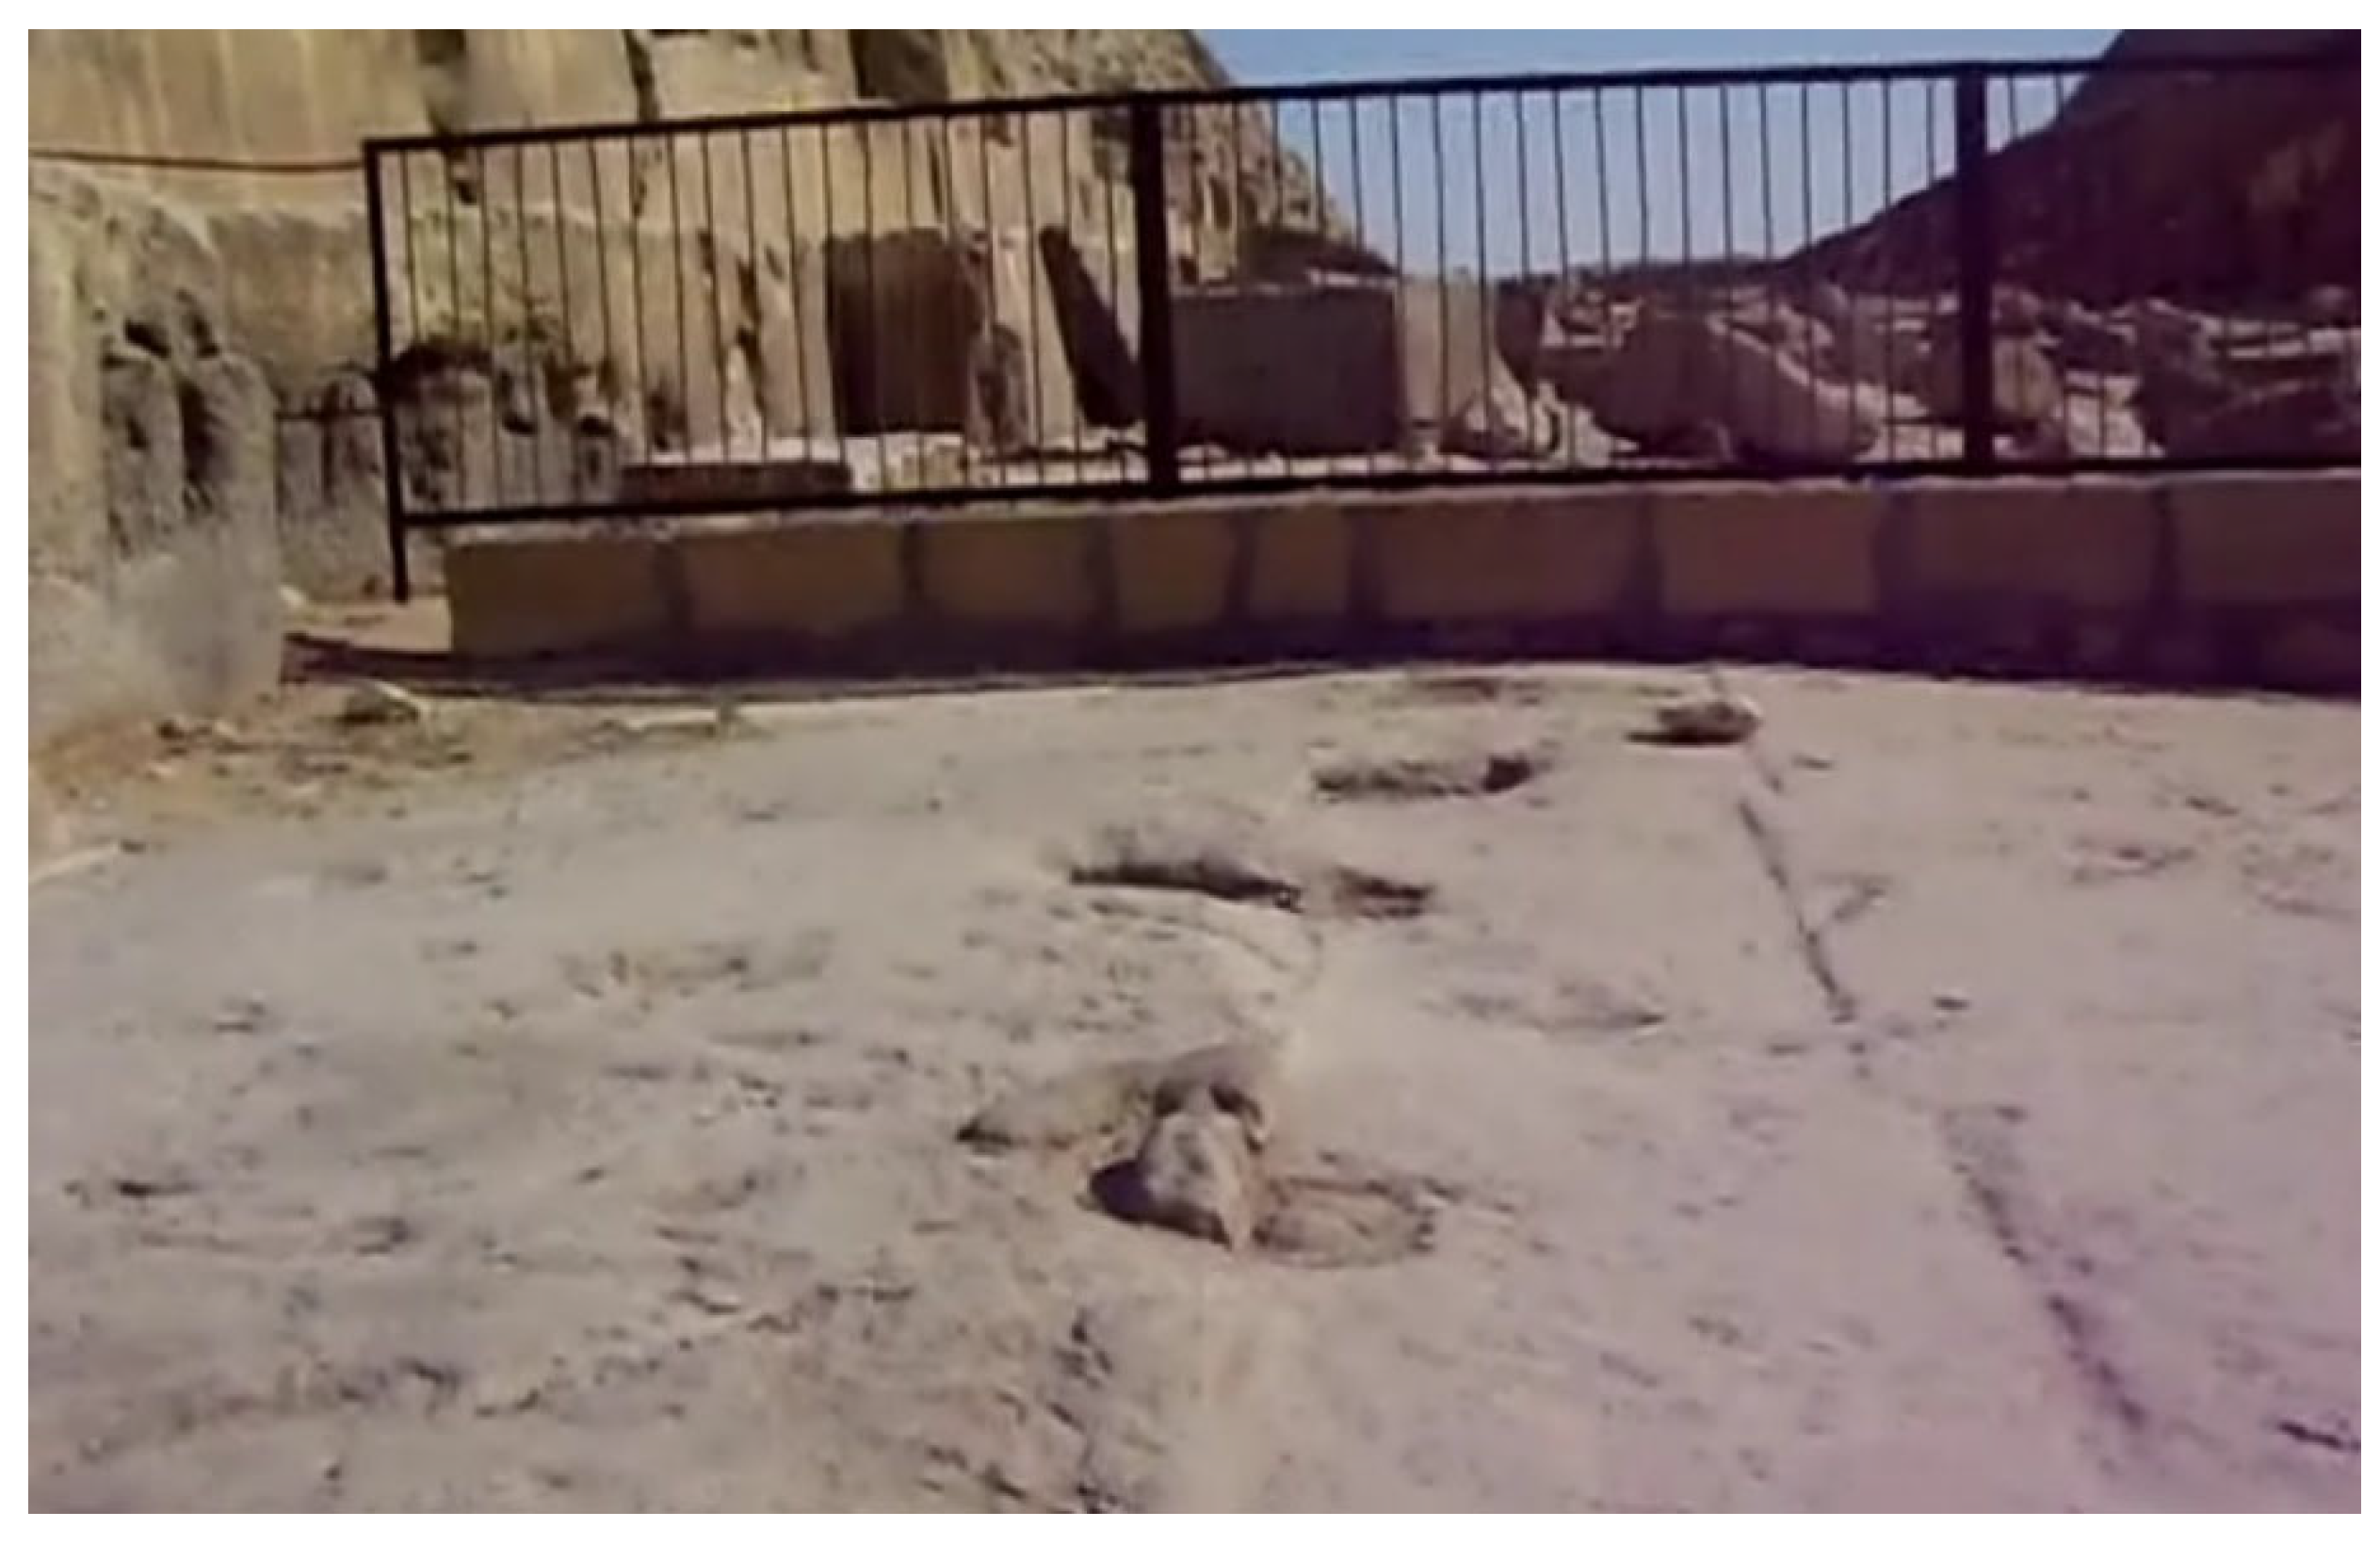
Figure 5.
Paving at the base of the Pyramid of Khufu.
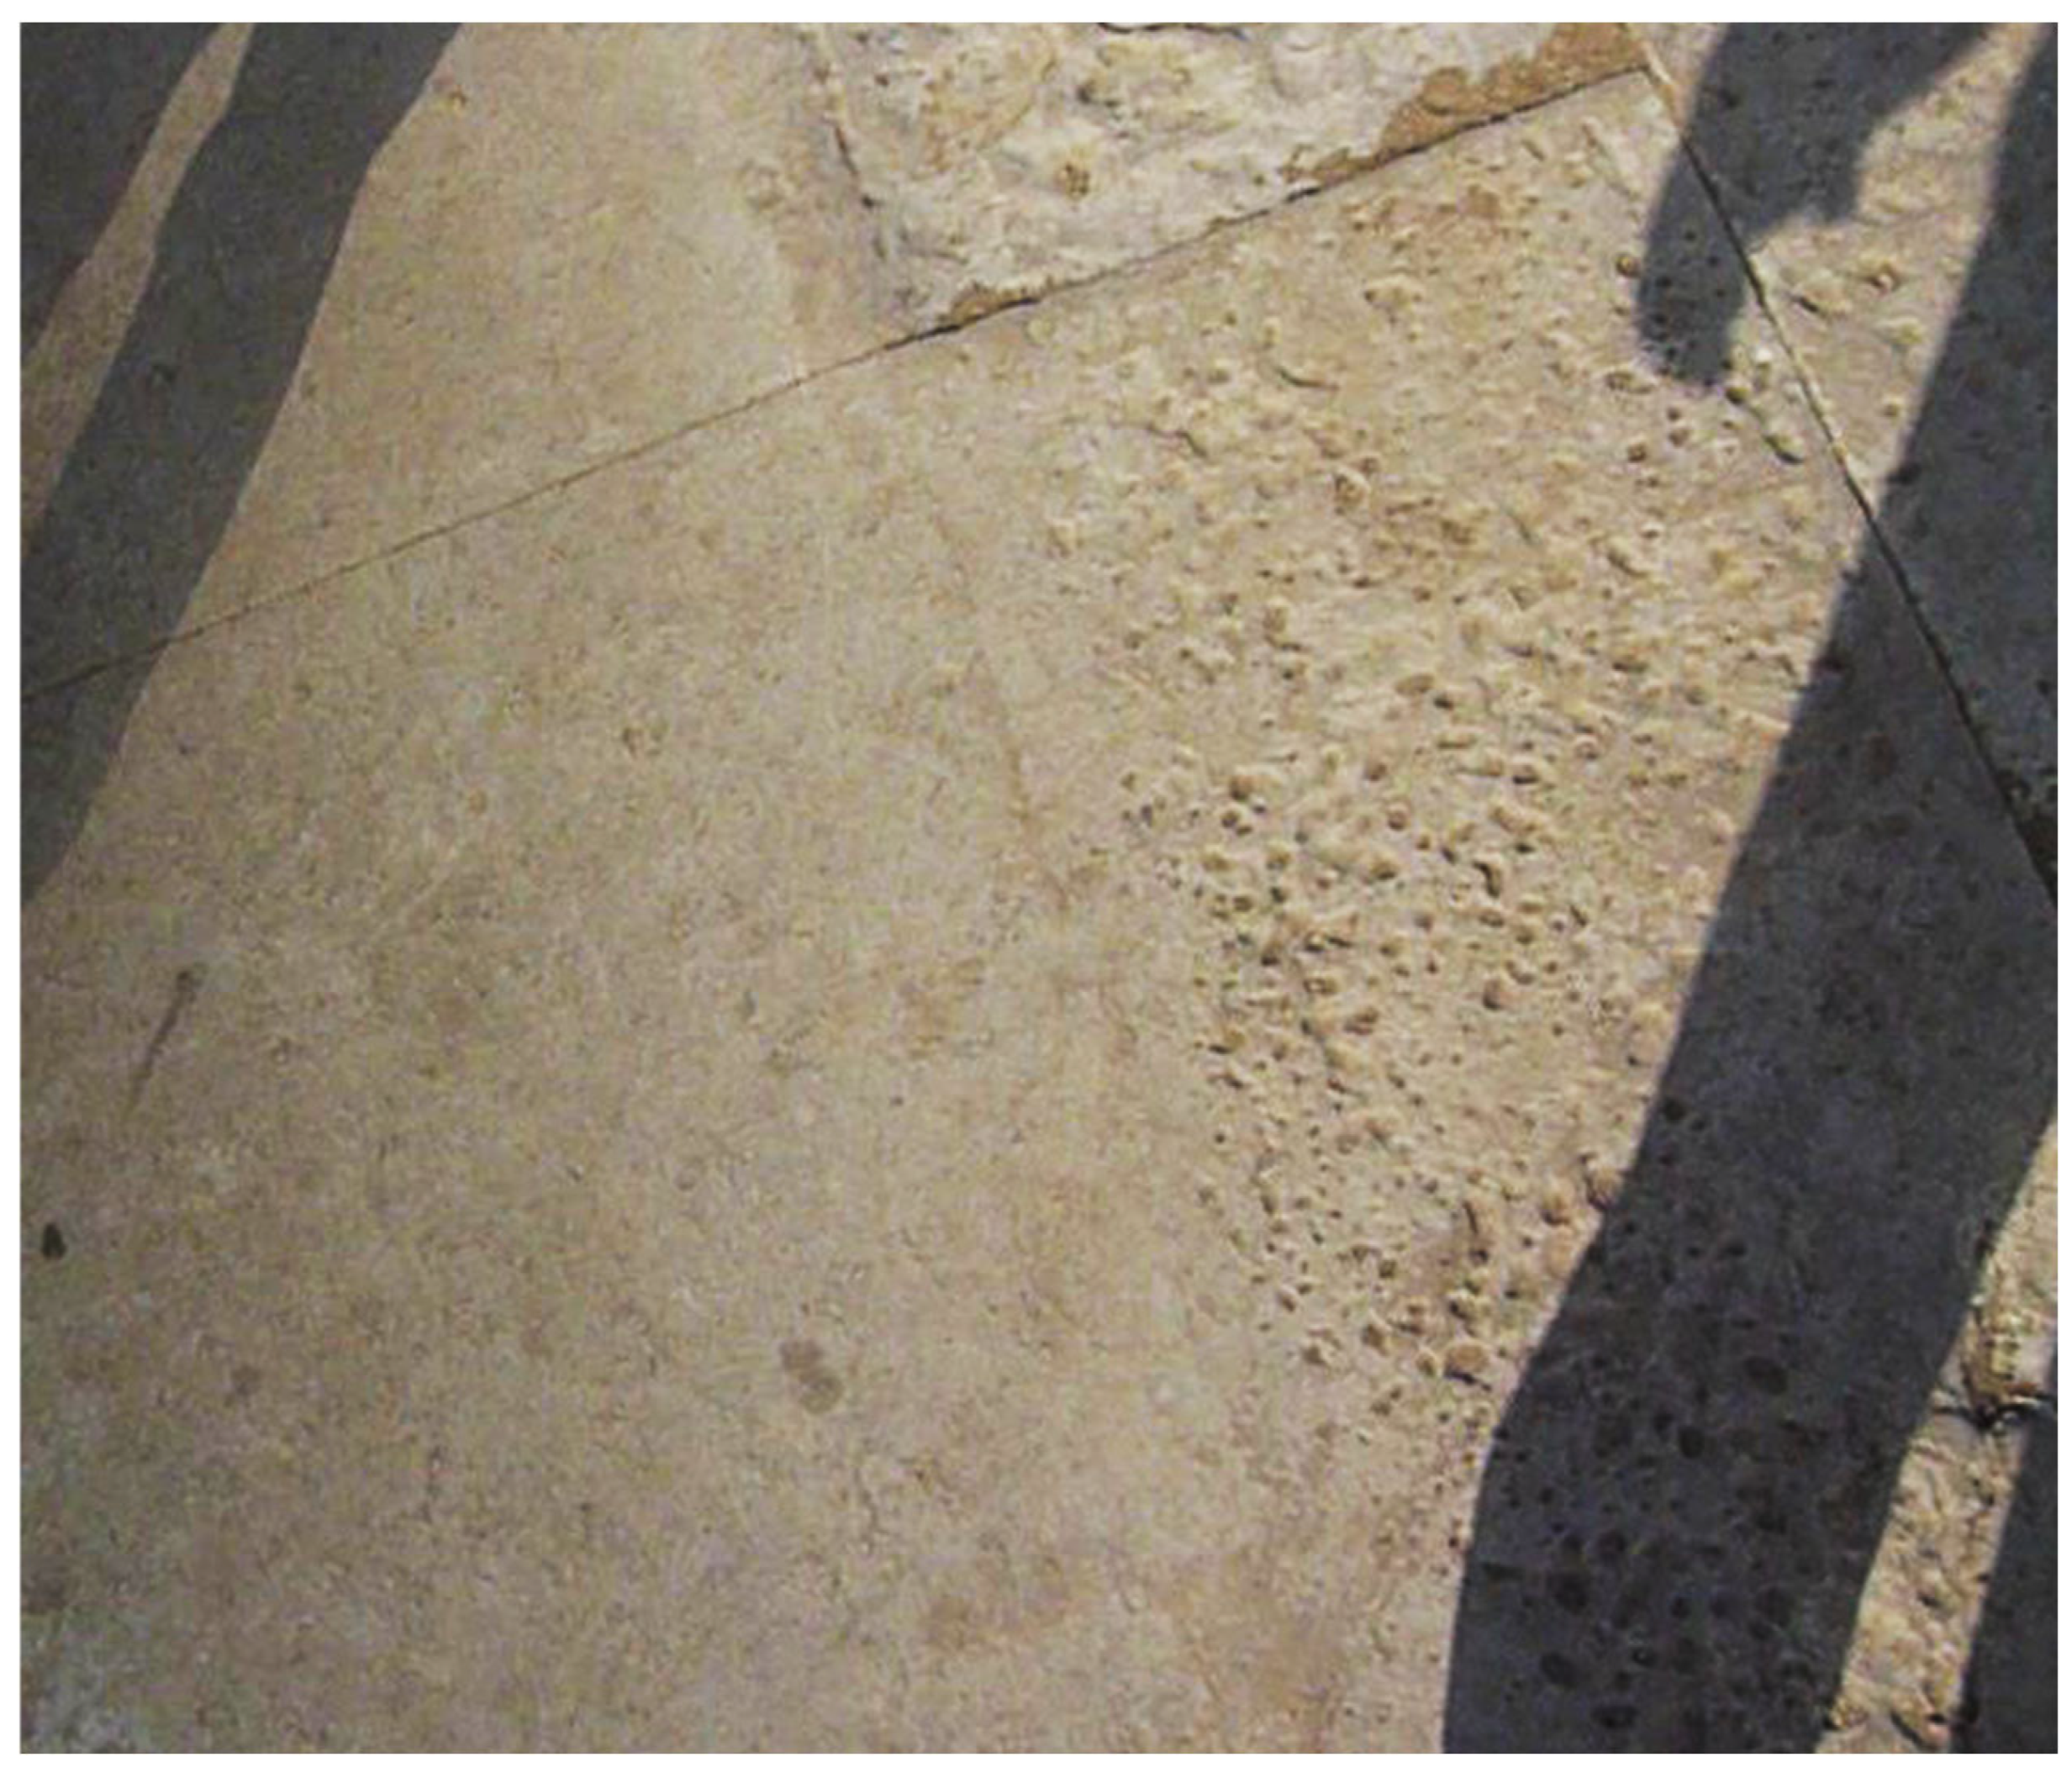
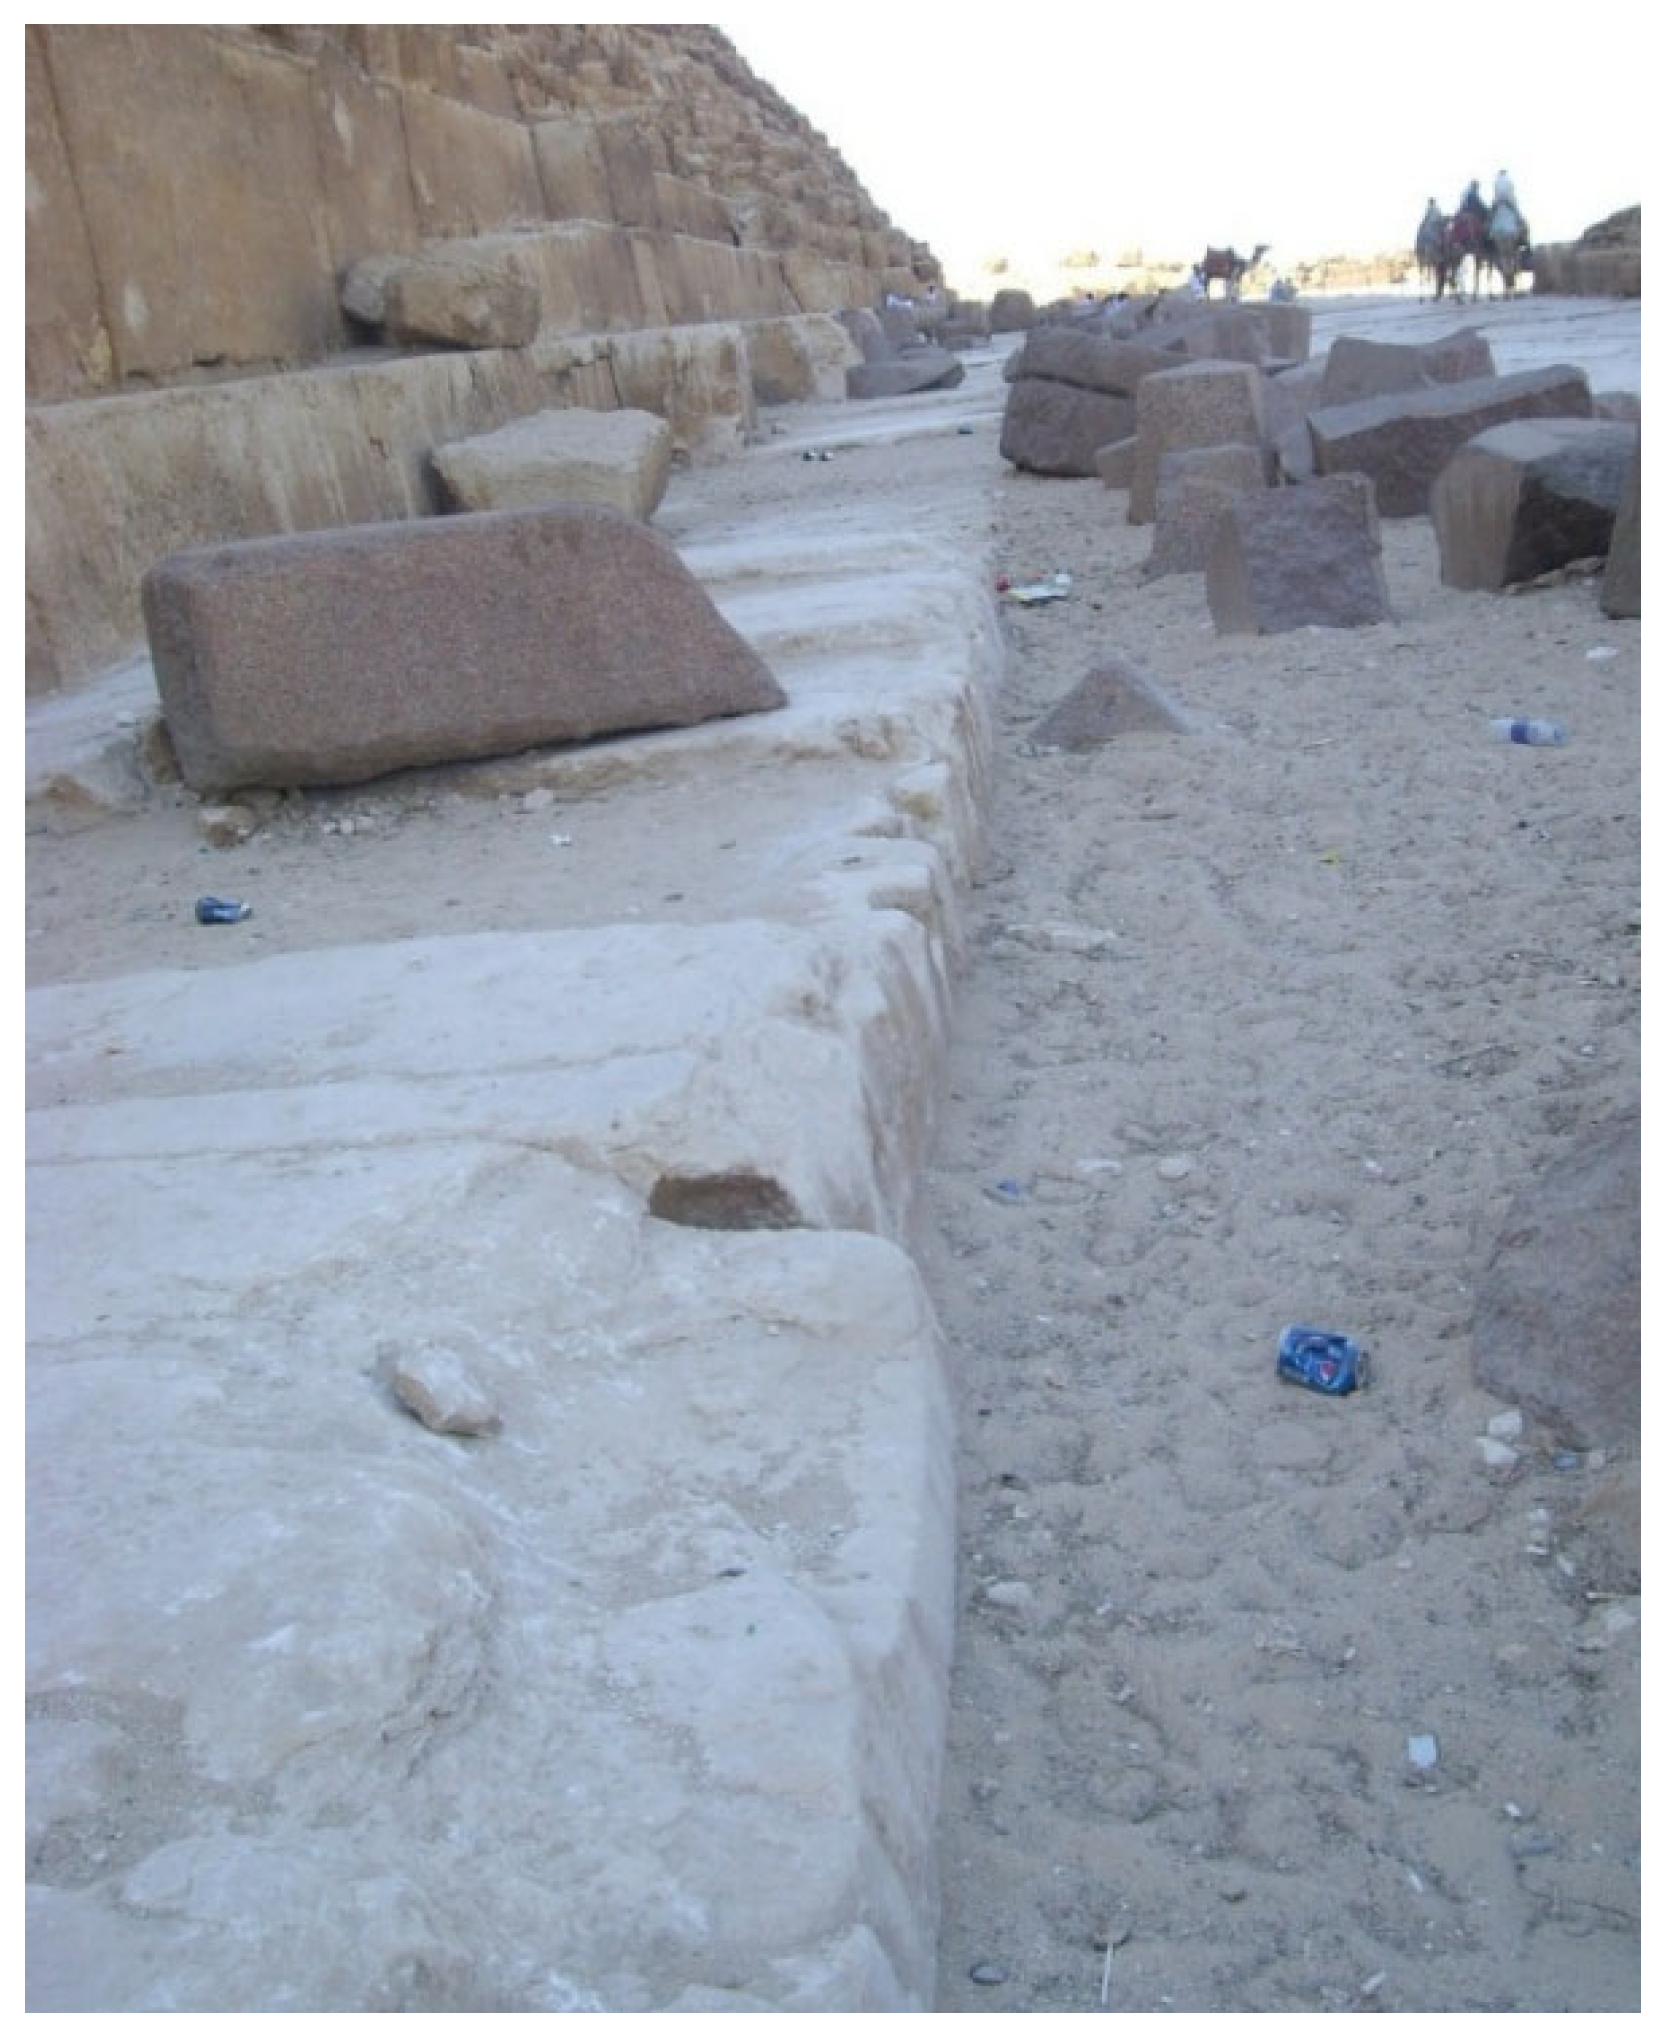
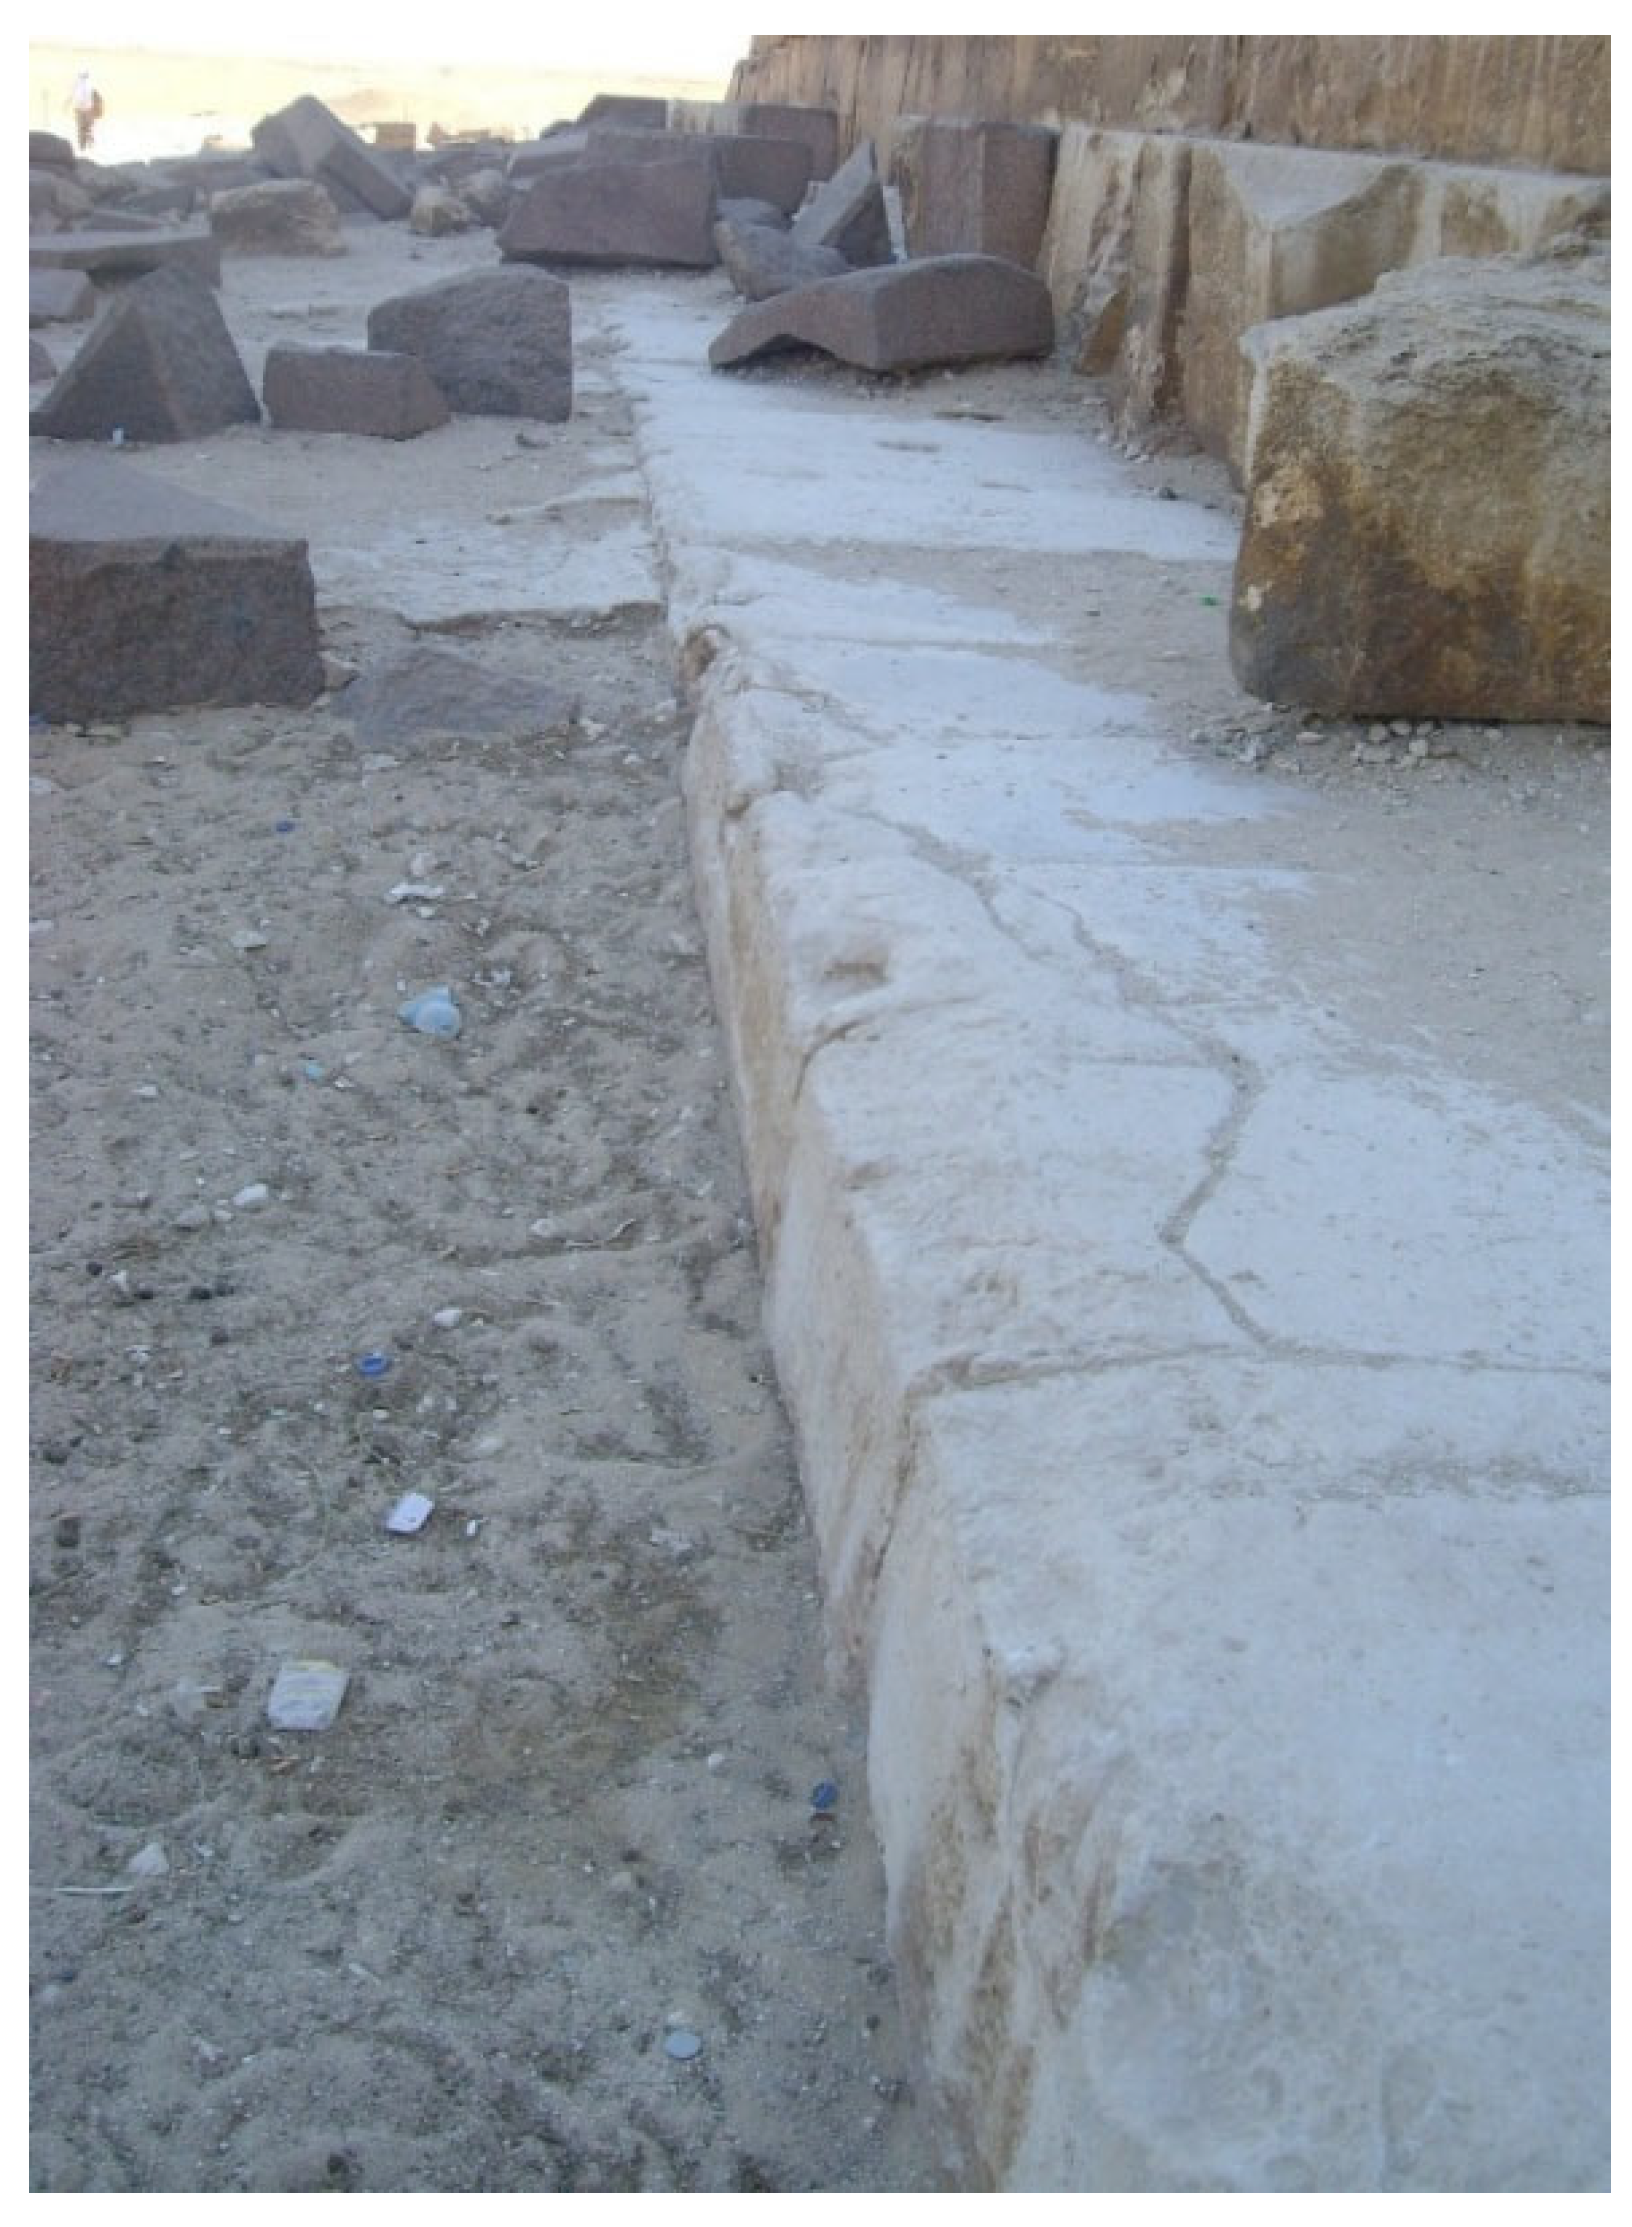
Figure 6.
Base of the pyramid of Akhet Khufu with the few remaining limestone blocks of the cladding.
Figure 6.
Base of the pyramid of Akhet Khufu with the few remaining limestone blocks of the cladding.
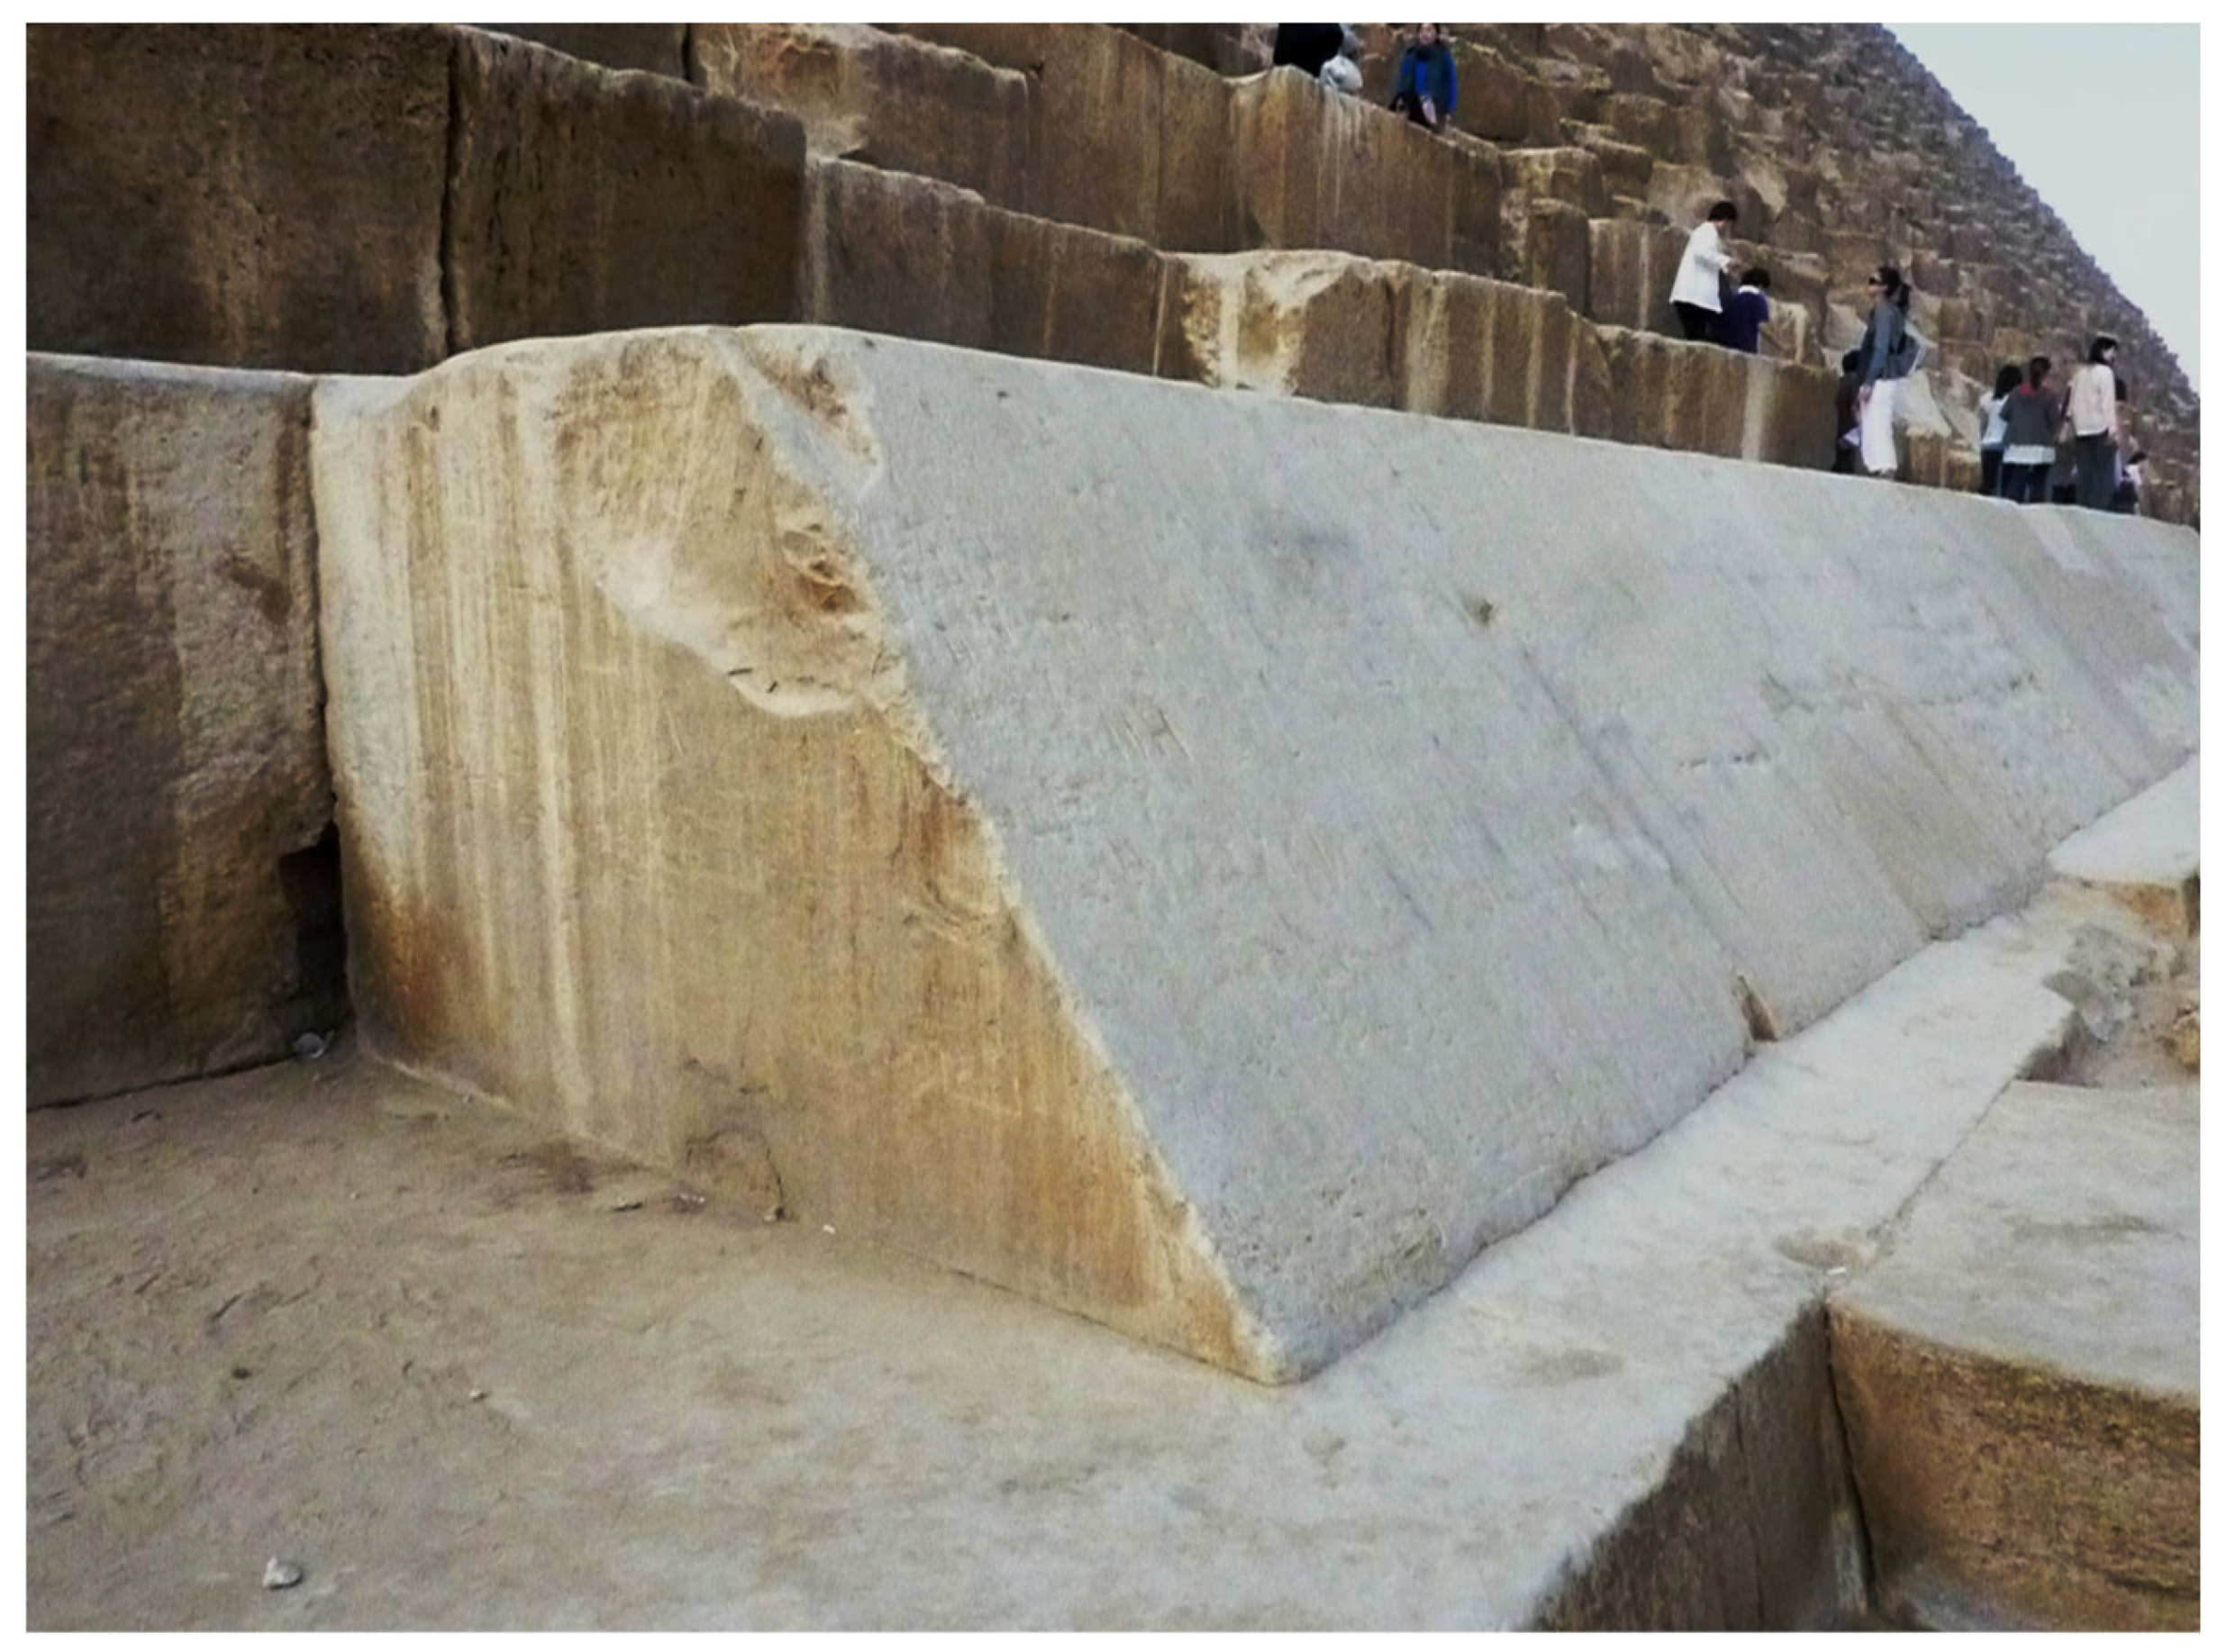
Figure 7.
The G1 pyramid of Akhet Khufu, with the points where I measured relative erosion marked in red (picture from Googleearth).
Figure 7.
The G1 pyramid of Akhet Khufu, with the points where I measured relative erosion marked in red (picture from Googleearth).
Disclaimer/Publisher’s Note: The statements, opinions and data contained in all publications are solely those of the individual author(s) and contributor(s) and not of MDPI and/or the editor(s). MDPI and/or the editor(s) disclaim responsibility for any injury to people or property resulting from any ideas, methods, instructions or products referred to in the content. |
© 2026 by the authors. Licensee MDPI, Basel, Switzerland. This article is an open access article distributed under the terms and conditions of the Creative Commons Attribution (CC BY) license (http://creativecommons.org/licenses/by/4.0/).
Copyright: This open access article is published under a Creative Commons CC BY 4.0 license, which permit the free download, distribution, and reuse, provided that the author and preprint are cited in any reuse.


