
Submitted:
12 January 2026
Posted:
13 January 2026
You are already at the latest version
Abstract
This study investigates factors influencing public-sector employees’ acceptance of an EDRMS in Saint Vincent and the Grenadines by extending the Technology Acceptance Model (TAM) with organisational and information-systems quality factors. A quantitative, cross-sectional survey was conducted among government employees with prior EDRMS experience (N = 122). Structural equation modelling using AMOS tested relationships among system quality, service quality, subjective norm, top management support, trust, perceived ease of use, perceived usefulness, and behavioural intention. Behavioural intention was mainly driven by perceived usefulness (β = 0.58, p < .001) and perceived ease of use (β = 0.17, p = .043), explaining 47.8% of the variance. Service quality positively influenced perceived usefulness (β = 0.45, p < .001) and ease of use (β = 0.32, p < .001), while system quality positively affected ease of use (β = 0.49, p < .001). Subjective norm was positively related to perceived usefulness (β = 0.27, p = .002). Top management support and trust were not significant predictors. The study contributes evidence from a small-island developing-state public sector, highlighting the importance of service support and usability beyond classic TAM. Policymakers should emphasise system usability, reliability, and responsive training and support services to enhance EDRMS adoption.
Keywords:
technology acceptance model
; electronic document and records management
; public sector
; behavioural intention
; 8
1. Introduction
Development and modernisation are inevitable realities of a changing world, requiring organisations to be flexible. Thus, government departments must embrace new opportunities, particularly technological advancements. Information management (IM) research, which focuses on the use and impact of information and knowledge, highlights the importance of electronic document and records management systems (EDRMSs) in the digital age. For this reason, information technology (IT) and information systems (ISs) are vital for government efficiency. The Government of Saint Vincent and the Grenadines (SVG), recognising the need for a digital government, has emphasised reliability and information security. A report from Taiwan ICDF revealed issues with manual processes in SVG’s government departments, prompting the adoption of EDRMSs [1]. A thorough literature review revealed that studies have yet to be conducted on the acceptability of IS in the public sector of SVG. However, several scholars [2,3,4] suggested that IS acceptance and usage are influenced by national cultures, and many of the studies on IS adoption were primarily conducted in developed countries [5,6]. As a result, the conclusions drawn from these studies may not apply to SVG. Some arguments suggest that the private and public sectors use IT/IS differently, as several previous studies used samples from private sector employees or college students [7,8]. The present study explored the factors influencing EDRMS adoption in SVG’s public sector, employing the technology acceptance model (TAM) to align with Taiwan ICDF’s project goals.
The Government of SVG aims to enhance administrative efficiency, information transparency, and decision-making through its NICTSAP initiative. However, despite its introduction over a decade ago, full implementation of this initiative remains challenging. Thus, this study investigated the factors influencing the adoption and use of EDRMSs in SVG’s public sector. Many organisations, including governments, face difficulties in implementing ISs, especially in developing countries [9]; hence, policymakers require a deeper understanding of information technology innovations and adoption patterns to develop effective intervention programmes.
Studying the use of ISs in government back-office functions can significantly enhance operational efficiency [10]. This study aimed to assess the status of EDRMSs in SVG, benefiting government departments, professionals, and researchers. Identifying and strengthening electronic records will support the SVG government policymakers in EDRMS implementation, technology adoption, and workforce efficiency. This study fills a knowledge gap in the EDRMS field within the public sector, as limited literature is available concerning this topic [11]. Moreover, the study adds value to the existing body of literature on technology acceptance in three ways. First, it presents empirical test results on the acceptance of EDRMSs in a small-island government environment, where adoption choices are frequently informed by centralised IT delivery and institutional limitations rather than by choice in the marketplace. Second, the study explicitly aligns system quality and service quality as upstream conditions of implementation that modify the fundamental TAM beliefs, perceived ease of use (PEOU) and perceived usefulness (PU), thus combining TAM with IS-quality logic widely found in IS success scholarship. Third, the results narrow the expectations of organisational drivers in this respect: the IS-quality factors and social influence – but not top management support and trust – are supported as direct predictors of PU in this sample, which may imply that the latter moderates the former (e.g., through service quality) or controls the former (e.g., through voluntariness/mandated use).
2. Problem Formulation
Effective information management is vital for organisations globally, particularly those affiliated with the government. In SVG, government information processing still relies on paper-based and manual methods, leading to inefficiencies and loss of files. To address this, the SVG government seeks to implement an EDRMS with the help of Taiwan’s expertise in e-government. EDRMS adoption in the SVG public sector is crucial as digital document volumes grow. TAM highlights the significance of software acceptance and usage, with PEOU and PU being key factors. This literature review examined EDRMS adoption in SVG using TAM, exploring factors influencing adoption and usage. The findings will benefit policymakers, IT professionals, and stakeholders involved in EDRMS implementation in SVG.
2.1. EDRMS
Electronic document management systems are computer software designed to manage business information, including creation, storage, retrieval, and distribution [12]. Records management encompasses handling information within an organisation, from creation to disposition [13]. In recent years, EDRMSs have evolved significantly and are crucial for effective digital document and record management. EDRMSs offer several benefits, such as improved information retrieval, collaboration, efficiency, compliance, and reduced information risks [14,15]. Implementing EDRMSs can lead to cost savings and better decision-making, but challenges such as resistance to change, user acceptance, training, and data security must be addressed for successful adoption. User acceptance, which is key to effective EDRMS implementation, is influenced by factors like PEOU, PU, training, and user involvement [16,17]. Therefore, integrating EDRMSs with emerging technologies like AI, machine learning, and blockchain can enhance their efficiency, security, and functionality. However, challenges in user acceptance and system integration must be managed [18].
2.2. TAM
TAM describes the intentions to use technology as having two core beliefs: PU (the degree to which a given system improves job performance) and PEOU (the degree to which the use will not be effortful). PEOU is affected by PU in TAM, and both beliefs determine the intention to use a system [19]. TAM has found extensive application in organisational settings since it provides a parsimonious explanation of the beliefs that support acceptance. Nevertheless, within much of the institutional context, especially in the public sector, the implementation of PU and PEOU is conditioned by upstream implementation factors (e.g., system performance and user support) and the social/institutional context, which encourages theoretically based extensions.
2.3. TAM with EDRMS
The implementation of EDRMS differs from most voluntary consumer technologies in that it is integrated within a formal workflow, compliance mandates, and records integrity assumptions [20]. The perceptions of usefulness and ease of use in an EDRMS environment are usually influenced by (i) the capacity of the system to provide reliable support for record creation, retrieval, and processing and (ii) the training and support that facilitate users’ daily work and minimise mistakes and errors. Therefore, the current state of EDRMS acceptance research typically complements TAM with some implementation and organisational aspects that describe the formation of PU and PEOU in operational contexts (e.g., quality of system performance, service support, and workplace social influence) [21].
2.4. Positioning Relative to TAM3 and IS Success Literature
In this study, the extension of TAM was positioned at the boundary between TAM3 and IS success literature. TAM3 builds upon TAM, hypothesising other determinants of PU and PEOU (e.g., experience-based anchors and interventions) [13], while IS success studies (e.g., works inspired by DeLone and McLean) are based on the idea that system quality and service quality are preconditions that influence user judgements and downstream system performance [14,15]. Since these constructs have been previously present in acceptance studies, the contribution here is not the introduction of new variables per se but a situational-specific theoretico-implementation combination in which system quality and service quality occur as upstream implementation conditions that organise PU and PEOU formation in a public-sector EDRMS setting.
2.4.1. Top-down Justification of EDRMS in the Public Sector
In a centralised implementation of government, users are often not allowed much leeway to make alternative system choices; therefore, use is sometimes compulsory. In such cases, perceptions of usefulness and ease of use would tend to capture the realities of day-to-day operations: reliability, accessibility, and workflow fit (system quality) would make operations less strenuous and frictional, which, in turn, would reinforce PEOU and, indirectly, PU. Moreover, timely training, responsiveness, and problem resolution (service quality) would make the learning process less costly and disruptive, thus reinforcing PEOU and PU [22]. This upstream framing is particularly fitting for EDRMS, where records’ purity, traceability, and inter-departmental procedures render performance and support services pertinent to employee perception and effort.
2.4.2. Top Management Support and Trust
Trust and top management support are conceptually applicable to institutional ISs; however, in centralised public-sector settings, they might have an indirect effect (e.g., as they are believed to increase service quality, provide training, or clarify policy) or a conditional effect (e.g., a stronger effect in situations where use is voluntary, when perceived risk is high, or among inexperienced users) [23]. In line with this, the study saw non-significant direct paths with open eyes and relied on them to narrow down the contribution of the same in EDRMS acceptance rather than rejecting it entirely.
2.5. EDRMS in the Public Sector
Factors influencing EDRMS adoption in SVG government departments include government policies and regulations, which can mandate EDRMS use. Reliable internet, computing resources, and supporting technologies play a role here. Additionally, budget constraints may limit adoption due to high costs, and resistance to change among employees, particularly those accustomed to paper-based systems, may require training. Legal agreements related to records management and regulatory compliance can drive EDRMS adoption, as can enhanced security features. Further, interoperability with existing government systems, such as financial and procurement systems, can also encourage EDRMS adoption.
2.6. TAM in SVG
Although TAM is not widely used in SVG due to a lack of relevant literature, some studies have employed it to understand technology adoption in the public sector. For instance, Celoza et al. [22] used TAM to analyse the adoption of the Caribbean Court of Justice’s electronic filing system, emphasising the importance of PU, PEOU, trust, and security. This study also investigated EDRMS adoption in SVG’s public sector and highlighted the relevance of TAM in the country’s technology adoption research. However, while some factors affecting technology acceptance have been identified, further research is needed to fully understand the status of TAM in SVG.
2.7. EDRMS in SVG
SVG has pursued digital government as part of a broader modernisation agenda, including initiatives aimed at improving administrative efficiency, information transparency, and the security and reliability of government operations. In this direction, the Government of SVG selected an EDRMS, along with public key infrastructure (PKI), as a practical step towards reducing paper-based processing, improving cross-agency document handling, and strengthening information assurance in government workflows. This institutional setting also intersects with a legal environment that emphasises public access to government information and formal recognition of electronic information and transactions. For example, the Freedom of Information Act 2003 frames a statutory objective of expanding public access to information held by public authorities, while the Electronic Transactions Act 2007 provides a legal basis for electronic transactions and electronic information handling. Together, these policies and legal conditions make records of integrity, reliability, and service support salient considerations for public-sector employees’ acceptance of EDRMS. In a small public administration implementing an EDRMS/PKI programme, employees’ perceptions of usefulness and ease of use may, therefore, be shaped not only by interface and functionality but also by the perceived quality of support services and the degree to which the system is seen as trustworthy for managing official records [1].
2.8. Research Constructs
2.8.1. Top Management Support
In TAM, top management support refers to how senior managers provide resources, guidance, and support for adopting and implementing new technology. Top management support is defined as “the degree of support provided by senior executives to facilitate the adoption and use of a new technology by employees” [23] and “the degree to which top management provides the necessary resources, guidance, and support to enable the successful adoption and implementation of a new technology” [24].
2.8.2. Subjective Norm
Davis et al. [25] introduced subjective norms as a key construct in TAM, which is defined as “the perceived social pressure to perform or not to perform the behaviour”. Subjective norms were further explained by [21] as “the degree to which an individual perceives that important others believe he or she should use the new system”.
2.8.3. Trust
Trust is defined as “belief in the reliability, integrity, and competence of a system or person” [26]. Trust contributes to users’ behavioural intention to use an IS [27]. It is “the extent to which an individual believes that the use of a particular system will be consistent with their expectations and that the system will behave in a predictable manner”.
2.8.4. Service Quality
Service quality represents users’ perceptions of the support services surrounding the system (e.g., sufficiency of the training, timeliness of the helpdesk/support service, problem-solving, and the availability of guidance). Within the context of organisational IS, service quality is theorised as a condition of implementation that reduces the costs and disruption in learning, thereby enhancing PEOU and, in cases where support enhances continuity and task completion, PU [19]. It also positively influences users’ attitudes towards using technology [28,29]. Davis et al. [25] demonstrated that PEOU and PU impact users’ acceptance of technology, and service quality is a critical determinant of these perceptions.
2.8.5. System Quality
System quality refers to users’ perceptions of the performance attributes of the EDRMS, such as reliability, accessibility, response time, usability, and functional fit to work tasks. The quality of the system reduces breakdowns and cognitive labour, reinforcing PEOU and indirectly and/or directly PU in work environments where performance outcomes are related to stable system functioning. Wu and Wang [30] identified “system quality as an essential determinant of user satisfaction and technology adoption”, defining it as “the degree to which the system is perceived to be easy to use, efficient, and effective in supporting user tasks”. As Venkatesh and Bala [23] stated, “System quality encompasses ease of use, ease of learning, system reliability, responsiveness, and customisability.” Moreover, Hong et al. [31] noted, “System quality refers to the extent to which the system meets the requirements and expectations of the user.” Furthermore, according to Davis [19], “In the technology acceptance model, system quality refers to the perceived characteristics of a technology that affect its ease of use and usefulness, including its efficiency, reliability, responsiveness, and customisation.” Additionally, the quality of a system may be evaluated based on its capability to meet its users’ specific needs and requirements.
2.8.6. PEOU
PEOU, a critical component of TAM, explains users’ technology acceptance and usage. PEOU can be defined as “the extent to which a user believes that using a particular technology will be free of effort” [19]. Users tend to show greater receptivity to new technologies when they find them simple to employ. Previous studies have extensively investigated the influence of PEOU on users’ intentions and attitudes towards technology adoption, determining that PEOU positively influences users’ attitudes towards using technology and directly and positively affects technology users’ behavioural intention [19,27]. Moreover, PEOU strongly predicts actual technology usage by users.
2.8.7. PU
The PU of the EDRMS has been a critical focus of previous research, as it is a determinant of individual acceptance and adoption. PU, a key TAM construct, is assessed through self-reported measures such as Likert scales and is considered a central predictor of technology adoption and usage. Davis [19] defined PU as “the degree to which a person believes that using a particular system would enhance his or her job performance.” Expanding on this definition, Venkatesh and Davis [21] stated, “PU is the degree to which a person believes that using a particular system would enhance his or her effectiveness in performing the tasks for which the system is designed.” PU significantly predicts user technology acceptance and usage, including online shopping [32] and mobile apps [33].
2.8.8. Behavioural Intention (BI)
Behavioural intention (BI) to use an IS is an essential element in TAM, as it “is a function of an individual’s attitudes towards using the technology (i.e., perceived usefulness and perceived ease of use) and their subjective norms (i.e., the perceived social pressure to use the technology)” [19]. Taylor and Todd [34] proposed that PEOU, social influence, PU, cognitive instrumental processes, and affective reactions affect BI. Researchers and practitioners can design and implement more effective technology adoption strategies by comprehending the issues that affect BIs. Therefore, BI provides a measure of a user’s likelihood to accept and use a system, on which technology implementation success relies. Many researchers have also studied BI and technology usage. Bhattacherjee and Premkumar [35] found that BI strongly and positively affects actual system usage. Moreover, Al-Gahtani [36] found that BI significantly influences the actual usage of e-learning systems. Besides, other studies have found that gender [37] and age [21] moderate the relationships between BI and actual usage.
3. Hypotheses
3.1. Research Framework and Hypotheses
This study explored the impact of an EDRMS on employees in various government departments, particularly those involved in the EDRMS pilot project in SVG. The study aimed to examine factors associated with employees’ acceptance and BI to continue using EDRMS. Additionally, the study addressed the concern that many users of ISs do not fully utilise them, leading to suboptimal performance in government technology investments. To achieve its objectives, this research employed a quantitative questionnaire survey approach. The goal was to understand the factors influencing the acceptance or rejection of ISs and to encourage greater utilisation among public sector managers. By doing so, the study sought to enhance workers’ efficiency, effectiveness, and productivity.
Figure 1.
Research Framework.
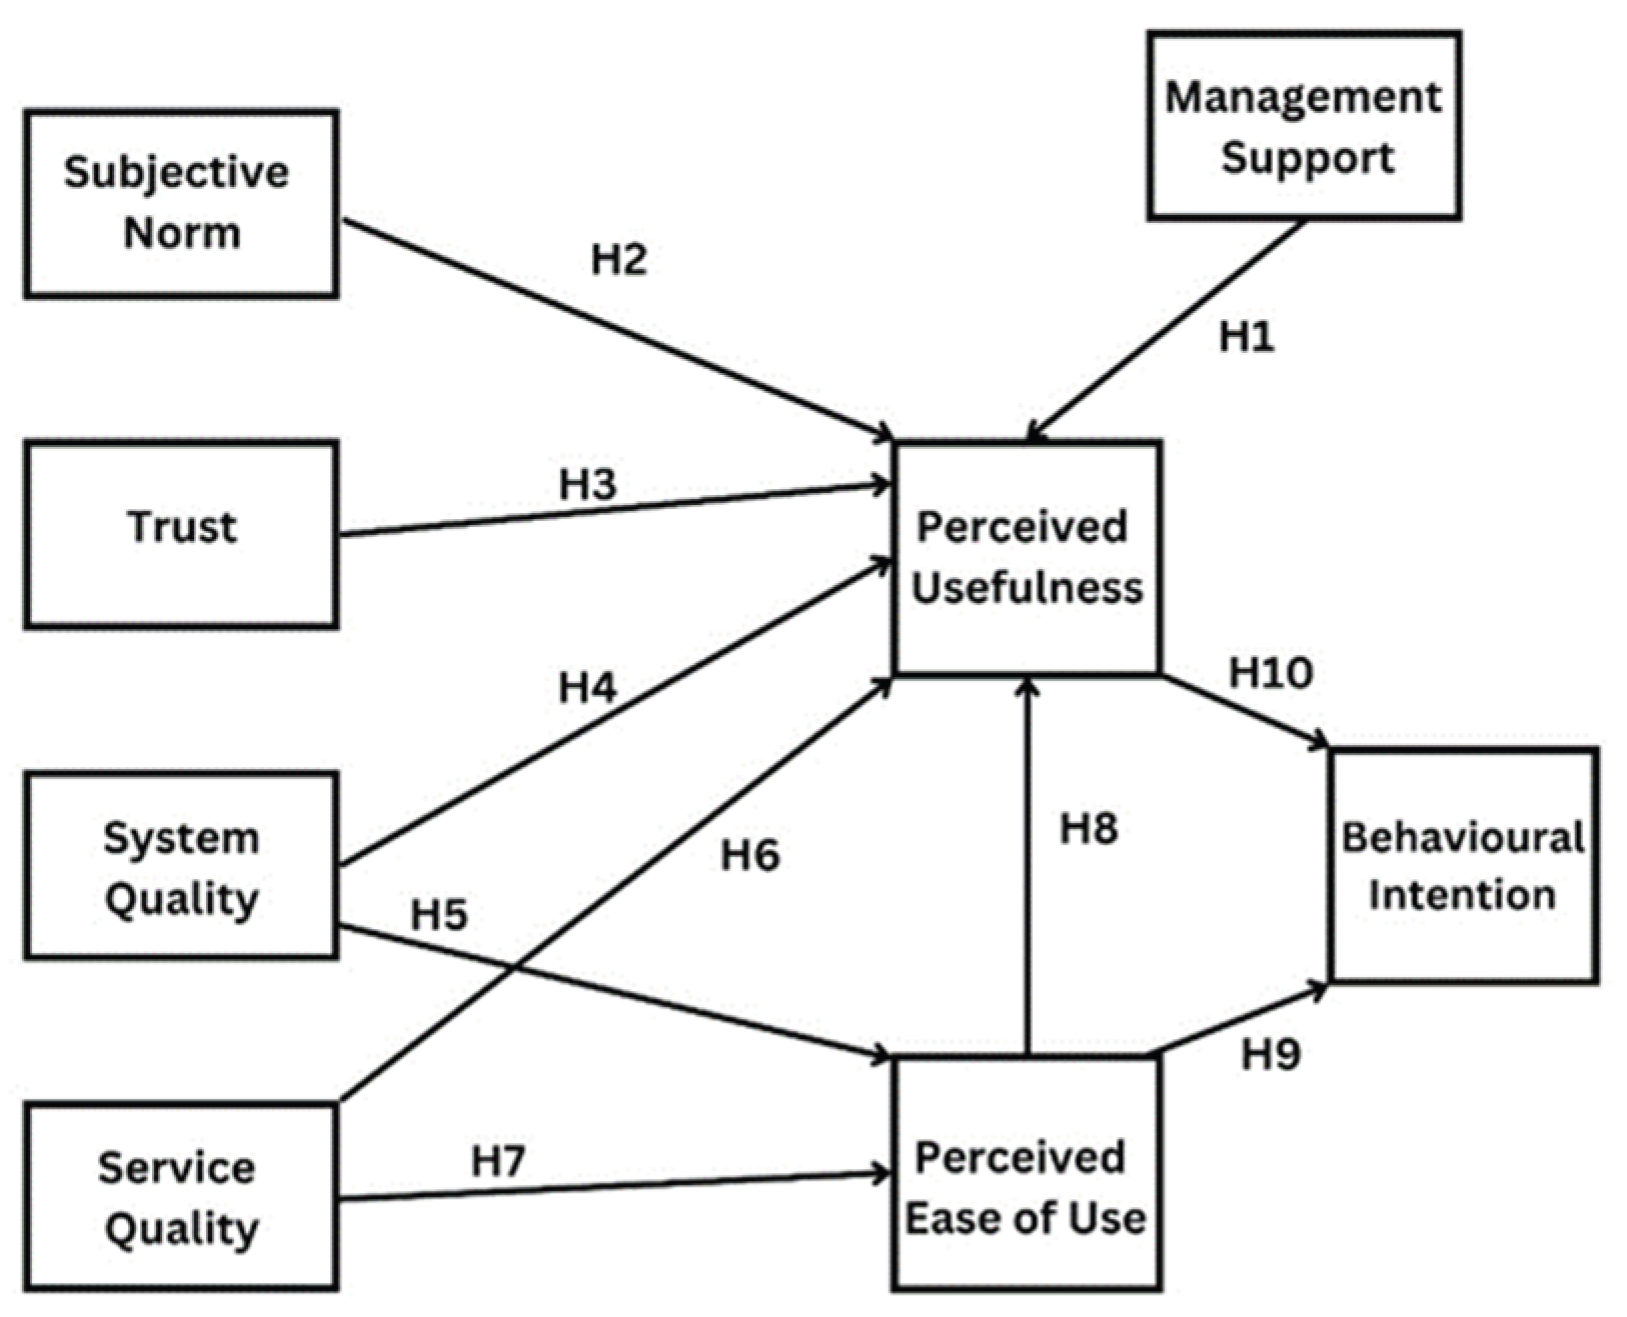

Table 1.
Research Hypotheses.
| H1 | “Top management support is positively associated with PU.” |
| H2 | “Subjective norm is positively related to PU.” |
| H3 | “Trust is positively related to PU.” |
| H4 | “System quality is positively related to PU.” |
| H5 | “System quality is positively related to PEOU.” |
| H6 | “Service quality is positively related to PU.” |
| H7 | “Service Quality is positively related to PEOU.” |
| H8 | PEOU is positively related to PU.” |
| H9 | “PEOU is positively related to BI.” |
| H10 | “PU is positively associated with BI.” |
3.2. Research Measures and Questionnaire Design
Research designs refer to plans or guidelines for collecting and interpreting data, which aid the researcher in conceptualising and examining the problem being studied [38]. It guides the researcher in scheduling and executing it efficiently and effectively. Three types of research designs are described in international literature: qualitative, quantitative, and mixed methods. A researcher’s study requires an assortment of appropriate research designs. This selection must be based not only on the researcher’s experience but also on the nature of the problem and the target audience [39]. Using a quantitative approach, the present study examined the factors influencing the adoption and use of EDRMSs in SVG’s public sector using the technology acceptance model. A questionnaire survey was used as the study instrument. The researcher selected questions previously examined to ensure validity and reliability. An in-depth quantitative survey was developed using previous literature to investigate EDRMS adoption and use. Several EDRMS users from government departments participated in this study. Due to confidential business reasons, all participants remained anonymous in this paper. This research adopted a quantitative approach to observe the relationship between specific constructs, including top management support, subjective norm, system quality, PU, service quality, trust, PEOU, and BI.
A comprehensive list was developed based on research on previous scales. Accordingly, measurement items were adapted from previous research. We adapted the measurement items for top management support from [40]. For the subjective norm, items were adapted from [34] and [41]. System quality items were adapted from [42]. Adapted items for service quality were taken from [43]. The trust items were adapted from [44,45].
Previously validated items were used for testing TAM. A set of measurement items for BI was adapted from [13,46,47]; PEOU was adopted from [13]; and PU was adapted from [33,48]. Table 3.2 defines the constructs, while Table 3.3 presents the items of measurement related to each construct. This survey has two sections: the respondent’s perceptions of the variables in the model and the respondent’s demographic information.
Demographic variables, including gender, age, education, job position, general computer knowledge, and job period, were analysed. Finally, the questionnaire was composed of eight measurement items. Participants were asked in the first section of the survey to rate their agreement with each statement. Likert-type scales were used to collect data, anchored from strongly disagree (1) to strongly agree (7). Table 2 presents the measurement items used in this research.
Table 2.
Measurement Items.
| Construct | Source | Items |
|---|---|---|
| System Quality | Mukred and Yusof (2018) | 1. “I believe EDRMS quality will improve the management of records in my organisation.” 2. “I think EDRMS would run easily.” 3. “I think EDRMS is accessible for authorised personnel.” 4. “I think EDRMS will provide the information when required by concerns.” 5. “I think EDRMS will run without crashing.” |
| Service Quality | Kim and Kim (2019) | 1. “I believe EDRMS helps me provide timely services.” 2. “I think EDRMS assists me in providing accurate services.” 3. “I think EDRMS helps me provide the right services.” 4. “I believe EDRMS helps me provide complete services.” 5. “I think EDRMS helps me provide trusted services.” |
| PU | Gursoy et al. (2019), Venkatesh et al. (2012) | 1. “Using EDRMS enables me to accomplish job tasks more quickly.” 2. “Using EDRMS improves my job performance.” 3. “Using EDRMS on the job increases my productivity.” 4. “Using EDRMS makes it easier to do my job.” 5. “Using EDRMS improves my ability to make good decisions.” |
| PEOU | Mukred et al. (2019b) Mukred et al. (2019b) |
1. “I would find EDRMS easy to accomplish tasks more quickly.” 2. “I believe EDRMS is easy to use.” 3. “I think it would be easy for a user to become skilled at using EDRMS.” 4. “I would like to adopt EDRMS in my work.” 5. “I think it is easy to detect and correct errors in organisational records using EDRMS.” |
| Subjective Norm | Taylor and Todd (1995) Fishbein and Ajzen (1977) |
1. “People who influence my behaviour think that I should use the system.” 2. “People who are important to me think that I should use the system.” 3. “The senior management of this organisation has been helpful in the use of the system.” 4. “In general, the organisation has supported the use of the system.” |
| BI to Use | An and Wang (2010); An and Ellis (2014), Hidalgo (2013), Mukred et al. (2019b) |
1. “I intend to use EDRMS because it supports the continuity of my work.” 2. “I intend to adopt EDRMS because it will improve the quality of my work.” 3. “I intend to use EDRMS because it can reduce the time spent on doing routine tasks.” 4. “I intend to adopt EDRMS because it reduces the risk of losing vital information.” 5. “I will intend to use EDRMS because it supports the security of my records.” 6. “I predict I will use EDRMS because it gives me greater control over my work.” |
4. Methodology
4.1. Data Collection
Target population and sampling descriptions are detailed in this section.
4.1.1. Target Population
This study used TAM to explore factors influencing the adoption and use of the EDRMS in SVG’s public sector. The study targeted employees within the Government of SVG. Specifically, the study targeted Government of SVG employees who have used EDRMS before.
4.1.2. Data Sampling
Data were collected using an online survey. Thus, data collection instruments (i.e., questionnaires) were created using Google Forms and emailed to each department involved in the study. This method allowed for wide dissemination in a short period. Each statement was rated on a seven-point Likert scale. The questionnaires were sent to about 600 employees within the government departments, and a total of 122 employees participated. The data were collected over approximately two and a half months, from December 2022 to February 2023.
4.1.3. Method
About 600 employees were contacted, and 122 valid responses were received (with a response rate estimated at 20%). Due to the sample size, the analysis could reliably detect the occurrence of moderate-to-large associations; however, smaller effects could be underpowered and, thus, might not be statistically significant.
4.1.4. Data Analysis
Structured equation modelling (SEM) was estimated in AMOS. Since the item-level model contains numerous indicators compared to N = 122, a complete item-level CFA/SEM would yield a large parameter-to-sample ratio and probably produce unstable estimates. To enhance the stability of estimation, we employed a parcel-based CFA and SEM. The number of items used to measure the same latent variable was averaged, and the parcels were built into each construct. In keeping with a balanced-content approach, no construct had more than two parcels, and top management support had three due to the number of items to be used. The items were assigned to parcels to maintain the breadth of content in the parcel instead of consolidating too similar items in the same parcel.
The parcelling technique can conceal item-level misspecification and can overstate a fit statistic; hence, the parcel-based strategy is seen as a pragmatic modelling choice when there are restrictions on the size of the sample. Future studies need to re-test the measurement model with the full item-level specification, test measurement levels across departments/roles, and assess whether any item-level cross-loadings or correlated errors can influence inferences.
4.1.5. Descriptive Statistical Analysis
Descriptive statistics were utilised to outline sample characteristics such as gender, age, education, job position, computer knowledge, and job duration. This information was presented through frequency distribution and percentages.
4.1.6. Reliability Analysis
Reliability and validity tests were conducted to ensure the quality of the quantitative research. Reliability assesses the consistency of test results, which was achieved through factor loading and Cronbach’s alpha. Factor loading measures the strength of the relationship between variables and latent constructs, with a common threshold of 0.3 or 0.4 considered meaningful. Cronbach’s alpha above 0.7 indicates internal consistency.
4.1.7. Validity Analysis
Validity ensures that the measurement aligns with the intended concepts. To ensure content validity, about 600 employees were contacted, and 122 valid responses were received (with a response rate estimated at 20%). Due to the sample size, the occurrence of moderate-to-large associations could be reliably detected. Moreover, the smaller effects could be underpowered and, thus, could not be statistically significant. Measurement items from prior studies ensured that the instrument adequately covered the concept of interest. Further, construct validity was evaluated using convergent and discriminant validity. Convergent validity examines whether variables share a significant portion of variance, assessed through the average variance extracted, with a threshold of 0.5 or higher indicating acceptable convergence.
4.2. Common Method Variance
This study employed questionnaires, a commonly used tool for systematically measuring variables of interest. The study employed a two-stage approach to mitigate potential bias caused by common method variance. The first stage involved procedural analysis before data collection, while the second stage employed statistical analysis to assess common method variance. Efforts to reduce common method variance primarily focused on procedural remedies during questionnaire development. Items were drawn from prior studies to diversify sources and reduce common method variance [49]. The study used Harman’s single factor test [50] to assess common method variance. If the variance extracted for the first factor was less than 50%, common method variance was considered absent in this study [51].
4.3. Sample Characteristics
Responses were obtained from 122 public-sector employees, out of which females comprised 59.0% (n = 72) and males 41.0% (n = 50) of the sample. The most represented age group was 26–35 years (n = 44, 36.1%), followed by 36–45 years (n = 27, 22.1%) and 18–25 years (n = 23, 18.9%). Most respondents held a bachelor’s degree (n = 47, 38.5%) or a postgraduate qualification (n = 40, 32.8%).
4.4. Ethics and Consent Section
This study involved an anonymous questionnaire administered to adult public-sector employees. Participation was voluntary, and respondents were informed about the study’s purpose, confidentiality, and their right to discontinue at any time without penalty. No directly identifying information was collected. Informed consent was obtained electronically before survey completion.
4.4.1. Data Availability Statement
The dataset generated and analysed during the current study is not publicly available due to confidentiality and organisational sensitivity, but it is available from the corresponding author on reasonable request, subject to the approval of an appropriate data-sharing agreement.
4.4.2. Originality and Contribution
This research contributes to the literature on technology acceptance in three aspects. First, it offers empirical data concerning EDRMS acceptance within a small-island developing state in a public-sector environment, which can rarely be found in TAM literature, as administrative capacity, training assets, and support services of ICT can significantly influence user experience. Second, instead of a personalised perception of outcomes, the model incorporates IS quality mechanisms – system quality and service quality – as upstream factors of PEOU and PU that aid in explaining how the implementation conditions are converted into core TAM beliefs. Third, the results elucidate the discernible salience of drivers in such a case: service quality and system quality are consistently linked with a set of PEOU and PU, and the beliefs clarify a high percentage of variance in BI; however, top management support and trust were not affirmed to be direct predictors of PU in the current sample. This trend streamlines anticipations regarding the levers that can deliver the highest possible real-world gains in EDRMS projects undertaken by the government.
Table 3.
Sample Characteristics.
| Variable | Category | n | pct |
|---|---|---|---|
| Gender | Female | 72 | 59.0 |
| Gender | Male | 50 | 41.0 |
| Age | 26–35 | 44 | 36.1 |
| Age | 36–45 | 27 | 22.1 |
| Age | 18–25 | 23 | 18.9 |
| Age | 46–55 | 17 | 13.9 |
| Age | 56+ | 11 | 9.0 |
| Education | Bachelor | 47 | 38.5 |
| Education | Post Graduate | 40 | 32.8 |
| Education | College | 30 | 24.6 |
| Education | High School | 5 | 4.1 |
| Job Position | Junior Work/Profession Line Staff | 45 | 36.9 |
| Job Position | Middle Management | 22 | 18.0 |
| Job Position | First-Level Supervisor | 22 | 18.0 |
| Job Position | Senior Management | 20 | 16.4 |
| Job Position | Temporary Worker | 13 | 10.7 |
| Working Years | 2–6 Years | 34 | 27.9 |
| Working Years | Less than 2 years | 25 | 20.5 |
| Working Years | 20+ Years | 23 | 18.9 |
| Working Years | 13–20 Years | 22 | 18.0 |
| Working Years | 7–12 Years | 18 | 14.8 |
| Computer Skills | Very Good | 66 | 54.1 |
| Computer Skills | Good | 41 | 33.6 |
| Computer Skills | Moderate | 13 | 10.7 |
| Computer Skills | Poor | 2 | 1.6 |
Table 4.
Common Method Variance: Exploratory Analysis.
| Component | Total | Percent Variance Explained | Cumulative Percentage Total Variance Explained |
|---|---|---|---|
| 1 | 3.082 | 38.524 | 38.524 |
| 2 | 1.238 | 15.470 | 53.994 |
| 3 | .984 | 12.306 | 66.300 |
| 4 | .765 | 9.563 | 75.863 |
| 5 | .594 | 7.425 | 83.288 |
| 6 | .487 | 6.083 | 89.371 |
| 7 | .446 | 5.580 | 94.950 |
5. Results
The current research was conducted with the help of AMOS and SEM to assess the measurement model (CFA) and test the hypotheses regarding the relationships between the constructs of the study. The presentation of results is as follows: sample characteristics and descriptive statistics, a test of common method bias, model fit, and hypothesis testing.
5.1. Sample Characteristics and Descriptive Statistics
A set of 122 employees representing the public sector constituted the sample. The predominant gender of the respondents was female (59%), and the 26–35 years age group was the largest (36.1%), followed by the 36–45 years age group (22.1%). The level of education was comparatively high, with 32.8% respondents indicating that they had a postgraduate qualification and 38.5% stating that they held a bachelor’s degree. The vast majority of participants belonged to either the category of junior/professional line staff (36.9%) or managerial positions (middle management = 18.0%, senior management = 16.4%). The self-rated computer knowledge was generally high, with 54.1% rating it as very good and 33.6% as good. Moreover, the distribution of work experience was widely spread across tenure bands, with 27.9% reporting 2–6 years of experience and 18.9% reporting over 20 years of experience. All these traits suggest that the workforce is highly prepared in terms of educational background and confidence in digital skills, which can be applied to the analysis of the impacts of PEOU and service support.
Table 5 indicates construct means (on a seven-point scale), standard deviations, and internal consistency. All constructs were above the recommended level of Cronbach’s alpha, which stood at 0.70, indicating that the constructs are sufficiently reliable for further modelling.
5.2. Common Method Bias and Design Limitations
Since the study used self-reported survey data at a single point in time, common method bias was a concern. An assessment with Harman’s single factor showed that the first unrotated factor accounted for 38.5% of the total variance, which was not much more than the standard heuristic of 50%, suggesting that common method variance might not be a significant issue in this study. However, the cross-sectional design cannot be used to make causal inferences; thus, all the relationships can only be termed as associations with BI but not causal effects.
Table 5.
Descriptive Statistics and Internal Consistency.
| Construct | Mean | SD | Cronbach alpha |
|---|---|---|---|
| System Quality (SyQ) | 5.505 | 0.848 | 0.741 |
| Service Quality (SQ) | 5.826 | 0.836 | 0.891 |
| PEOU (PEOU) | 5.877 | 0.732 | 0.771 |
| PU (PU) | 5.997 | 0.775 | 0.874 |
| Subjective Norm (SN) | 4.867 | 1.223 | 0.791 |
| BI (BI) | 6.004 | 0.814 | 0.898 |
| Trust | 4.701 | 1.236 | 0.885 |
| Top Management Support (TMS) | 4.854 | 1.303 | 0.947 |
5.3. Measurement and Structural Model Fit
Table 5 presents fit indices for the parcel-based measurement (CFA) and structural (SEM) models. Overall, incremental fit indices (CFI/TLI) indicate an acceptable fit. However, RMSEA values (~0.092) exceeded commonly cited “close fit” thresholds (≤ 0.08), suggesting that the fit is acceptable but not optimal. SRMR values were within or near conventional cut-offs, providing additional support that misfit is not severe. Given the applied public-sector survey context, modest sample size, and model complexity, the model was judged adequate for hypothesis testing; however, conclusions are presented conservatively and interpreted as associations rather than causal effects.
5.4. Model Fit
Table 6 presents fit indices for the parcel-based measurement (CFA) and structural (SEM) models. Overall, comparative fit indices (CFI/TLI) indicate an acceptable fit. However, the RMSEA values (~0.092) exceeded commonly referenced “close fit” thresholds (≤0.08), indicating that the fit is acceptable but not optimal. SRMR values were within or near conventional cut-offs, providing additional support for model adequacy. Given the applied public-sector survey context and the constraints posed by sample size and model complexity, the model fit was judged sufficient for hypothesis testing, but results should be interpreted cautiously. Therefore, we avoid overstating model adequacy and treat the findings as evidence of associations rather than definitive structural confirmation.
Table 6.
Indices for Measurement and Structural Models (Parcel-Based CFA/SEM).
| Model | Chi-square | df | Chi2/df | CFI | TLI | RMSEA | SRMR |
|---|---|---|---|---|---|---|---|
| Measurement model (parcel CFA) | 183.572 | 91 | 2.017 | 0.939 | 0.909 | 0.092 | 0.08 |
| Structural model (parcel SEM) | 199.271 | 99 | 2.013 | 0.934 | 0.909 | 0.092 | 0.084 |
5.5. Hypothesis Testing
Structural paths were tested using standardised regressions on construct scores. The model explained 53.6% of the variance in PEOU, 55.1% in PU, and 47.8% in BI. Table 6 summarises the path coefficients and hypothesis decisions. PEOU further supported PU, indicating that usability-related perceptions indirectly reinforce intention through usefulness beliefs. Among the antecedents, service quality emerged as a consistent predictor of both PU and PEOU, highlighting the importance of training, user support, and responsiveness for successful EDRMS acceptance. Moreover, system quality showed a significant association with PEOU, suggesting that reliable performance and usability are central to users’ ease-of-use evaluations. Subjective norm was positively associated with PU, indicating that social influence mechanisms (e.g., supervisors’ expectations and peer practices) are relevant in public-sector EDRMS contexts. Conversely, top management support and trust were not statistically supported as direct predictors of PU in this sample, implying that their effects may be indirect, context-contingent, or insufficiently strong to detect with the current sample size.
Table 7.
Hypothesis Testing Results (Standardised Coefficients).
| Hypothesis | Path | Std. β | p-value | Decision |
|---|---|---|---|---|
| H1 | TMS → PU | -0.0736 | 0.4383 | Not supported |
| H2 | SN → PU | 0.2122 | 0.0023 | Supported |
| H3 | Trust → PU | -0.0142 | 0.8542 | Not supported |
| H4 | SyQ → PU | -0.0724 | 0.5601 | Not supported |
| H5 | SyQ → PEOU | 0.5193 | <0.001 | Supported |
| H6 | SQ → PU | 0.4878 | <0.001 | Supported |
| H7 | SQ → PEOU | 0.3082 | <0.001 | Supported |
| H8 | PEOU → PU | 0.2318 | 0.0076 | Supported |
| H9 | PEOU → BI | 0.1957 | 0.0433 | Supported |
| H10 | PU → BI | 0.6837 | <0.001 | Supported |
5.6. Reliability and Validity Analysis
Reliability analysis is a statistical method used to assess the consistency and stability of research measurements. This study employed reliability analysis to evaluate the internal consistency of survey question items, measured using each measurement item’s factor loadings. The construct reliability was assessed using Cronbach’s Alpha. The results are presented in Figure 5. All values exceed 0.7, which is considered acceptable reliability in social research, according to [52]. Even the value for system quality at 0.658 is deemed acceptable according to [53]. Figure 2 shows the reliability analysis and convergent validity.
Figure 2.
Reliability Analysis and Convergent Validity.
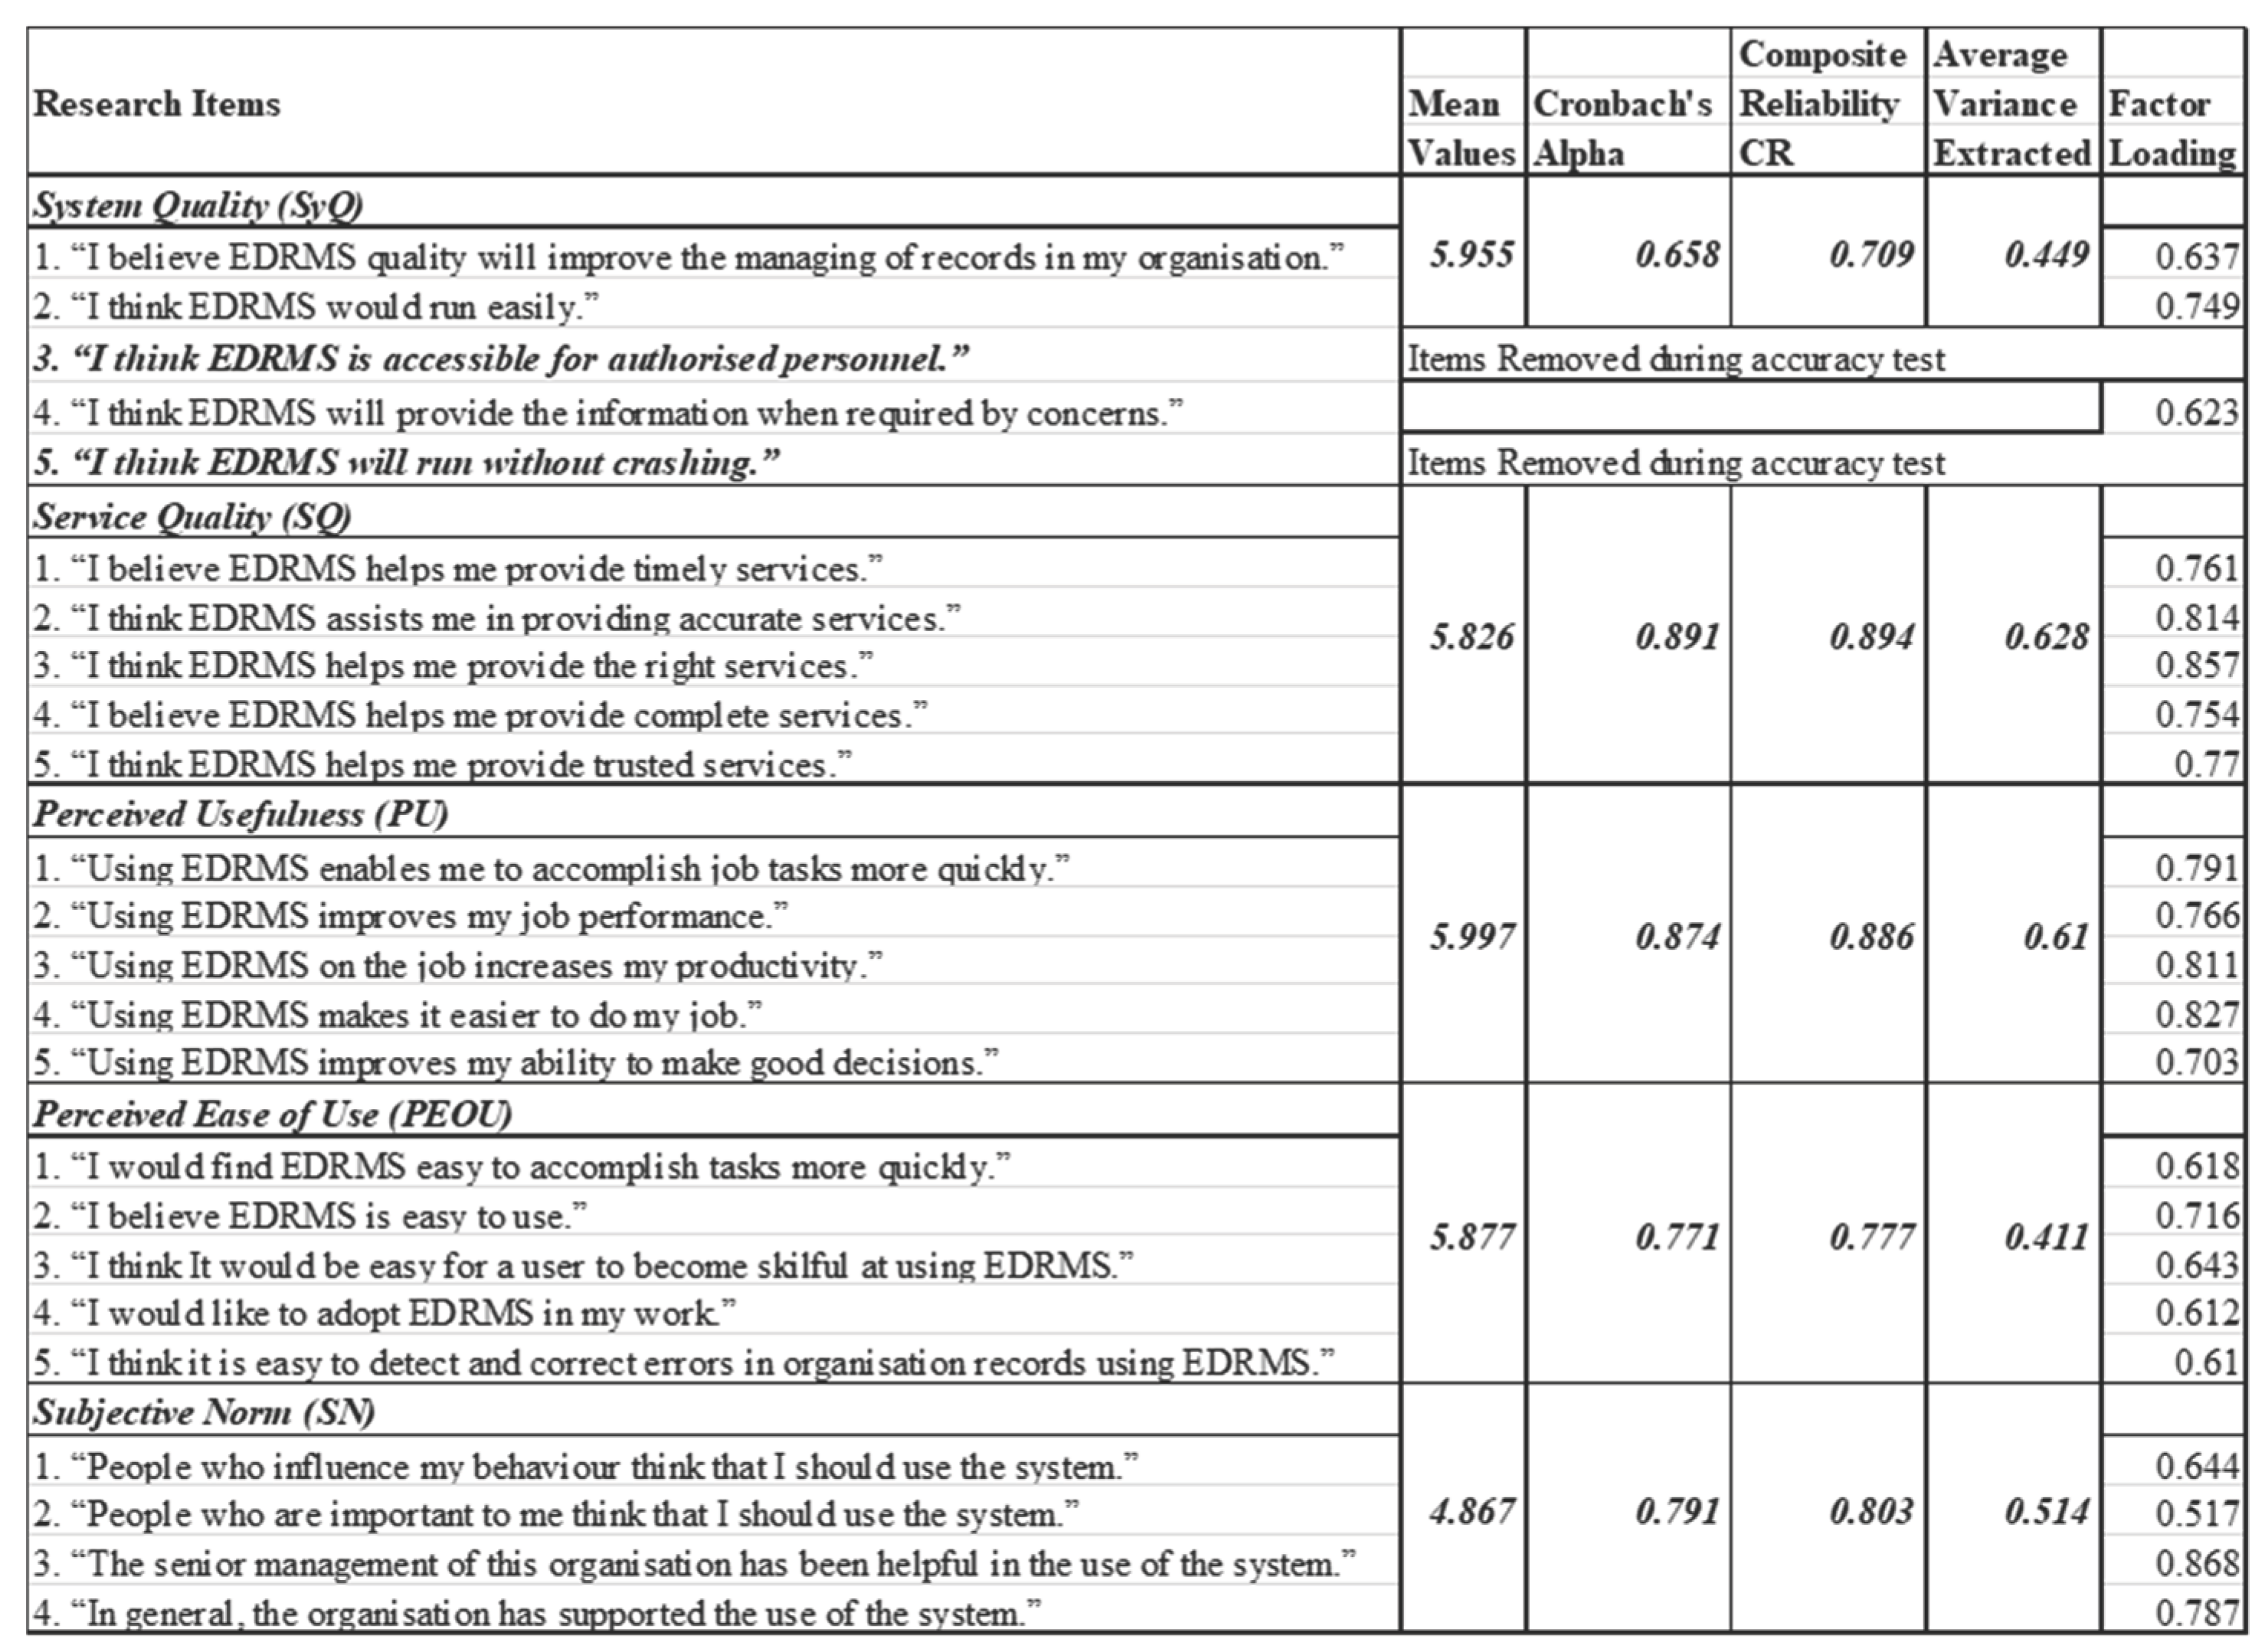
Additionally, most constructs’ composite reliability exceeds 0.60, indicating acceptable item reliability. The average variance extracted is generally above 0.05 for most constructs, except for PEOU and system quality. Fornell and Larcker [53] suggest that researchers should also consider composite reliability in evaluating convergent validity. If composite reliability exceeds 0.6, even if over 50% of the variance is attributable to error, the convergent validity of the construct may still be considered adequate. This study’s composite reliability for the two constructs was significantly higher than recommended levels, indicating acceptable internal reliability. While the average variance extracted ideally should be higher than 0.5, the values of 0.449 for system quality and 0.411 for PEOU obtained in this study were still considered acceptable according to [53] recommendations. Factor loadings for each measurement ranged from 0.517 to 0.943, indicating strong convergent validity after two items were removed from system quality. Figure 5 displays these results, and the excluded items were not analysed further. These validity and reliability assessments were conducted using SPSS and AMOS. To test for discriminant validity in a confirmatory factor analysis model, a common method is to compare the square roots of the average variance extracted of each construct to the correlations between the constructs [53]. As Figure 6 shows, the square roots of average variance extracted exceeded the minimum threshold of 0.50 (0.641 to 0.856). This points to discriminant validity for all constructs. Table 7 shows the constructs’ correlation matrix.
5.7. Interpreting Unsupported Relationships (Trust and Top Management Support)
No statistically significant direct predictors of PU were found in this sample, which included top management support and trust. These findings do not imply that trust or leadership are insignificant; rather, they may reflect contextual aspects of centralised systems in the public sector. In contexts where the use of the EDRMSs is contemporary or operationally required, helpfulness convictions can be induced by the practical execution and management of the system rather than ad hoc checks of leadership approval. Similarly, trust can be institutional (trust in government IT and in government records processes), where there is little variation among respondents, making it harder to detect in a cross-sectional survey design. Both constructs can also have indirect effects (e.g., through service quality or available training) or conditional effects (e.g., more with novice users, riskier record types, or departments with weaker ICT support). Future research should, therefore, test mediation (e.g., top management support to service quality to PEOU/PU) and moderation (e.g., voluntariness of use, experience, perceived risk) rather than merely direct paths.
Table 8.
Constructs Correlation Matrix.
| Construct | SyQ | PEOU | SQ | PU | SN | BI | T | TMS |
|---|---|---|---|---|---|---|---|---|
| SyQ | 0.670 | |||||||
| PEOU | 0.668** | 0.641 | ||||||
| SQ | 0.537** | 0.626** | 0.792 | |||||
| PU | 0.494** | 0.583** | 0.686** | 0.781 | ||||
| SN | 0.377** | 0.324** | 0.495** | 0.512** | 0.716 | |||
| BI | 0.603** | 0.505** | 0.626** | 0.678** | 0.497** | 0.781 | ||
| T | 0.305** | 0.423** | 0.490** | 0.393** | 0.446** | 0.380** | 0.826 | |
| TMS | -0.016 | -0.079 | 0.168 | 0.117 | 0.459** | 0.140 | 0.187* | 0.856 |
**. “Correlation is significant at the 0.01 level (2-tailed).” *. “orrelation is significant at the 0.05 level (2-tailed).” Note. “Diagonal elements with red background are the AVE square roots values, and other elements are the Pearson correlations.”.
6. Conclusion
This study examined factors linked to the intention of public sector employees to use an EDRMS in SVG, employing a comprehensive TAM framework. The results indicate that BI is primarily related to PU, while PEOU serves as a complementary factor. System quality and service quality, as upstream implementation conditions, enhance beliefs about ease of use and usefulness, and the subjective norm is positively correlated with PU, reflecting the importance of social influence in the institutional context.
In practice, the findings suggest that policy and implementation initiatives should focus on enhancing usability and reliability (system quality) and investing in training, responsiveness, and support services (service quality) to improve users’ perceptions of ease and value. The non-significant direct impacts of trust and top management support on PU should be interpreted cautiously in such a centralised public sector context, as they may indicate indirect or contingent effects which have to be tested further.
The study’s limitations include the use of self-reported cross-sectional data and a small sample size, which may reduce sensitivity to small effects and preclude causal conclusions. Future research should utilise longitudinal or multi-source data (e.g., usage logs and departmental performance indicators) and explore mediation/moderation pathways to better understand how organisational context influences EDRMS acceptance over time.
6.1. Research Limitations
The study had a small sample size of 122 public sector employees, which may represent only a fraction of public sector employees in SVG. This research relied on self-reported data, which may be biased, as participants might have over-reported or under-reported their perceptions and attitudes towards EDRMS technology, potentially impacting the accuracy of the results. Data were gathered at one point in this cross-sectional study, which may limit the ability to establish causality and draw conclusions about the long-term impact of EDRMS adoption and use. A survey was the sole research method of research used in this study. While surveys are effective for collecting data on attitudes and perceptions, they do not provide a complete understanding of the factors influencing the adoption and use of EDRMS. Limited contextual information about the public sector in SVG was also presented in the study, which may hinder the generalisation of findings to other countries or contexts.
6.2. Future Research
Future studies should focus on increasing the sample size and diversifying subjects to enhance representativeness and generalisability. Expanding the demographic range and including representatives from different public sector departments will provide a more comprehensive approach to the issue. Additionally, implementing a longitudinal research design will facilitate the analysis of the long-term impact of EDRMS adoption in the public sector and outline its sustainability and long-term consequences on organisational performance and employee productivity. Employing qualitative methods, such as focus groups and in-depth interviews, can yield a profound and more detailed understanding of the motivations behind EDRMS introduction and adoption, revealing underlying motivations, challenges, and benefits. Furthermore, it is essential to provide more contextual information on the public sector of SVG to enable generalisation of the study findings to other areas with a similar context. Moreover, future research should consider comparing EDRMS implementation in SVG with other regions to highlight context-specific differences and similarities, thereby contributing to the overall literature on technology adoption in the government sector and providing insight into how regional peculiarities can impact the success and challenges of EDRMS implementation.
Conflicts of Interest
The authors declare no conflicts of interest regarding the publication of this paper.
References
- Taiwan ICDF. Electronic document and records management system (EDRMS) project for Saint Vincent and the Grenadines. n.d. Available online: https://www.icdf.org.tw/wSite/ct?xItem=37408&ctNode=31795&mp=2.
- Chen, Q.; Chen, H. M.; Kazman, R. Investigating antecedents of technology acceptance of initial eCRM users beyond Generation X and the role of self-construal. Electron. Commer. Res. 2007, 7, 315–339. [Google Scholar] [CrossRef]
- Gallivan, M.; Srite, M. Information technology and culture: Identifying fragmentary and holistic perspectives of culture. Inf. Organ. 2005, 15, 295–338. [Google Scholar] [CrossRef]
- Lippert, S. K.; Volkmar, J. A. Cultural effects on technology performance and utilization: A comparison of U.S. and Canadian users. J. Glob. Inf. Manag. 2007, 15, 56–90. [Google Scholar] [CrossRef]
- Alshare, F. B.; Alkhateeb, K. A. Predicting students’ usage of the internet in two emerging economies using an extended technology acceptance model (TAM). Acad. Educ. Leadersh. J. 2008, 12, 109. [Google Scholar]
- Fusilier, M.; Durlabhji, S. An exploration of student internet use in India: The technology acceptance model and the theory of planned behaviour. Campus-Wide Inf. Syst. 2005, 22, 233–246. [Google Scholar] [CrossRef]
- Almutairi, H. Is the ‘Technology Acceptance Model’ universally applicable?: The case of the Kuwaiti ministries. J. Glob. Inf. Technol. Manag. 2007, 10, 57–80. [Google Scholar] [CrossRef]
- Alshawaf, A.; Knalil, O. E. M. IS success factors and IS organizational impact. Int. J. Enterp. Inf. Syst. 2008, 4, 13–33. [Google Scholar] [CrossRef]
- Al-Gahtani, S. S. Computer technology acceptance success factors in Saudi Arabia: An exploratory study. J. Glob. Inf. Technol. Manag. 2004, 7, 5–29. [Google Scholar] [CrossRef]
- Read, M. Back office operations and IT, operational efficiency programme final report; London, 2009. [Google Scholar]
- Wickramasinghe, V.; Wickramasekara, J. Putting public services into enterprise system- predicting employees’ acceptance of transformational government technology in an expanded technology acceptance model. Public Organ. Rev. 2022, 22. [Google Scholar] [CrossRef]
- ISO. 15489-1: Information and documentation–records management–Part 1: General; Geneva, 2001. [Google Scholar]
- Mukred, M.; Yusof, Z. M.; Alotaibi, F. M.; Mokhtar, U. A.; Fauzi, F. The key factors in adopting an electronic records management system (ERMS) in the educational sector: A UTAUT-based framework. IEEE Access 2019, 7, 35963–35980. [Google Scholar] [CrossRef]
- Hawash, B.; Yusof, Z. M.; Mokhtar, U. A.; Mukred, M. Enhancing business continuity in the oil and gas industry through electronic records management system usage to improve off-site working: A narrative review. J. Inf. Sci. Theory Pract. 2022, 10, 30–44. [Google Scholar] [CrossRef]
- Elaturoti, B. Impact of the cloud and social platforms on records management. Handb. Res. Rec. Inf. Manag. Strateg. Enhanc. Knowl. Coord. 2021, 316–332. [Google Scholar] [CrossRef]
- Ayaz, A.; Yanartaş, M. An analysis on the unified theory of acceptance and use of technology theory (UTAUT): Acceptance of electronic document management system (EDMS). Comput. Hum. Behav. Reports 2020, 2, 100032. [Google Scholar] [CrossRef]
- Hawash, U. Mokhtar; Yusof, Z. Users’ acceptance of an electronic record management system in the context of the oil and gas sector in Yemen: An application of ISSM-TAM. Int. J. Manag. Enterp. Dev. 2021, 20, 75–98. [Google Scholar] [CrossRef]
- Vyas, S.; Shabaz, M.; Pandit, P.; Parvathy, L. R.; Ofori, I. Integration of artificial intelligence and blockchain technology in healthcare and agriculture. J. Food Qual. 2022, 2022. [CrossRef]
- Davis, F. Perceived usefulness, perceived ease of use, and user acceptance of information technology. MIS Q. 1989, 13, 319. [Google Scholar] [CrossRef]
- Ajzen, I. The theory of planned behavior. Organ. Behav. Hum. Decis. Process. 1991, 50, 179–211. [Google Scholar] [CrossRef]
- Venkatesh, V.; Davis, F. A theoretical extension of the technology acceptance model: Four longitudinal field studies. Manage. Sci. 2000, 46, 186–204. [Google Scholar] [CrossRef]
- Celoza, D. Oliveira; Leite, F. Qualitative analysis of the impact of contracts on information management in aec projects. J. Constr. Eng. Manag. 2023, 149. [Google Scholar] [CrossRef]
- Venkatesh, V.; Bala, H. Technology acceptance model 3 and a research agenda on interventions. Decis. Sci. - Decis. SCI 2008, 39, 273–315. [Google Scholar] [CrossRef]
- Wu, Y. M.; Wang, J. H. “Measuring KMS success: A respecification of the DeLone and McLean’s model,”. Inf. Manag. 2006, 43, 728–739. [Google Scholar] [CrossRef]
- Davis, F.; Bagozzi, R.; Warshaw, P. User acceptance of computer technology: A comparison of two theoretical models. Manage. Sci. 1989, 35, 982–1003. [Google Scholar] [CrossRef]
- McKnight, H.; Cummings, L. L.; Chervany, N. L. Initial trust formation in new organizational relationships. Acad. Manag. Rev. 1998, 23, 473–490. [Google Scholar] [CrossRef]
- Venkatesh, V.; Morris, M.; Davis, G.; Davis, F. User acceptance of information technology: Toward a unified view. MIS Q. 2003, 27, 425–478. [Google Scholar] [CrossRef]
- Agarwal, R.; Prasad, J. A conceptual and operational definition of personal innovativeness in the domain of information technology. Inf. Syst. Res. 1998, 9, 204–215. Available online: http://www.jstor.org/stable/23010927. [CrossRef]
- Koufaris, M.; Hampton-Sosa, W. The development of initial trust in an online company by new customers. Inf. Manag. 2004, 41, 377–397. [Google Scholar] [CrossRef]
- Wu, J.-H.; Wang, S.-C. What drives mobile commerce?: An empirical evaluation of the revised technology acceptance model. Inf. Manag. 2005, 42, 719–729. [Google Scholar] [CrossRef]
- Hong, S.; Thong, J.; Tam, K. Understanding continued information technology usage behavior: A comparison of three models in the context of mobile Internet. Decis. Support Syst. 2006, 42, 1819–1834. [Google Scholar] [CrossRef]
- Chiu, C.; Chang, C.; Cheng, H.; Fang, Y. Determinants of customer repurchase intention in online shopping. Online Inf. Rev. 2009, 33, 761–784. [Google Scholar] [CrossRef]
- Venkatesh, V.; Thong, J. Y. L.; Xu, X. Consumer acceptance and use of information technology: Extending the unified theory of acceptance and use of technology. MIS Q. 2012, 36, 157–178. [Google Scholar] [CrossRef]
- Taylor, P. A.; Todd, S. Understanding information technology usage: A test of competing models. Inf. Syst. Res. 1995, 6, 144–176. [Google Scholar] [CrossRef]
- Bhattacherjee, A.; Premkumar, G. Understanding changes in belief and attitude toward information technology usage: A theoretical model and longitudinal test. MIS Q. 2004, 28, 229–254. [Google Scholar] [CrossRef]
- Al-Gahtani, S. S. Empirical investigation of e-learning acceptance and assimilation: A structural equation model. Appl. Comput. Informatics 2016, 12, 27–50. [Google Scholar] [CrossRef]
- Igbaria, M.; Guimaraes, T.; Davis, G. Testing the determinants of microcomputer usage via a structural equation model. J. Manag. Inf. Syst. 1995, 11, 87–114. [Google Scholar] [CrossRef]
- Buckingham, P.; Saunders, A. The survey methods workbook: From design to analysis; 2004. [Google Scholar]
- Stadtländer, C. T. K.-H. Qualitative, Quantitative, and mixed-methods research. Microbe Mag. 2009, 4, 485–485. [Google Scholar] [CrossRef]
- Nathan, R.; Apigian, C.; Ragu-Nathan, T.; Tu, Q. A path analytic study of the effect of top management support for information systems performance. Omega 2004, 32, 459–471. [Google Scholar] [CrossRef]
- Fishbein, M.; Ajzen, I. Belief, attitude, intention and behaviour: An introduction to theory and research; 1975; Volume 27. [Google Scholar]
- Mukred, M.; Yusof, Z. The DeLone-McLean information system success model for electronic records management system adoption in higher professional education institutions of Yemen; 2017. [Google Scholar] [CrossRef]
- Kim, Y.; Kim, S. A Study on transferring electronic records from record production system to record management system using cloud storage. J. Korean Soc. Arch. Rec. Manag. 2019, 19, 1–24. Available online: https://api.semanticscholar.org/CorpusID:199581278.
- Duranti, L.; Rogers, C. Trust in online records and data; 2014; pp. 203–216. [Google Scholar]
- Hussin, N.; Johare, R. Functional requirements for an electronic records management system for court records; 2014; pp. 73–90. [Google Scholar] [CrossRef]
- An, X.; Wang, W. The integrated use of business continuity management systems, records management systems and knowledge management systems 2010. [CrossRef]
- Hidalgo, R. How cloud computing (SaaS) supports an electronic document and records management system (EDRMS). 2013, 1277. [Google Scholar]
- Gursoy, D.; Chi, O. H.; Lu, L.; Nunkoo, R. Consumers acceptance of artificially intelligent (AI) device use in service delivery. Int. J. Inf. Manage. 2019, 49, 157–169. [Google Scholar] [CrossRef]
- MacKenzie, S. B.; Podsakoff, P. M. Common method bias in marketing: Causes, mechanisms, and procedural remedies. J. Retail. 2012, 88, 542–555. [Google Scholar] [CrossRef]
- Jakobsen, M.; Jensen, R. Common method bias in public management studies. Int. Public Manag. J. 2015, 18. [Google Scholar] [CrossRef]
- Podsakoff, P. M.; Organ, D. W. Self-reports in organizational research: Problems and prospects. J. Manage. 1986, 12, 531–544. [Google Scholar] [CrossRef]
- Thompson, R.; Compeau, D.; Higgins, C. Intentions to use information technologies: An integrative model. JOEUC 2006, 18, 25–46. [Google Scholar] [CrossRef]
- Fornell, C.; Larcker, D. F. Evaluating structural equation models with unobservable variables and measurement error. J. Mark. Res. 1981, 18, 39–50. [Google Scholar] [CrossRef]
- Venkatesh, V. Determinants of perceived ease of use: Integrating control, intrinsic motivation, and emotion into the technology acceptance model. Inf. Syst. Res. 2000, 11, 342–365. [Google Scholar] [CrossRef]
Disclaimer/Publisher’s Note: The statements, opinions and data contained in all publications are solely those of the individual author(s) and contributor(s) and not of MDPI and/or the editor(s). MDPI and/or the editor(s) disclaim responsibility for any injury to people or property resulting from any ideas, methods, instructions or products referred to in the content. |
© 2026 by the authors. Licensee MDPI, Basel, Switzerland. This article is an open access article distributed under the terms and conditions of the Creative Commons Attribution (CC BY) license (http://creativecommons.org/licenses/by/4.0/).
Copyright: This open access article is published under a Creative Commons CC BY 4.0 license, which permit the free download, distribution, and reuse, provided that the author and preprint are cited in any reuse.


