
Submitted:
09 January 2026
Posted:
12 January 2026
You are already at the latest version
Abstract
The use of virtual reality for pilot flight training, whether as a stand-alone device, or to augment or replace a conventional simulator, has gained significant attention in recent years. The primary purported benefit of virtual reality is its increased ability to achieve immersion of the trainee, which has particular benefits for visuospatial awareness. This benefit of the technology would appear to offer little advantage in the training of instrument-flying skills, where only the aircraft’s instrumentation needs to be accurately rendered in order that the status of the ownship can be known. However, given the wide-scale intention toward the adoption of the technology, it is likely that instrument flight training will be one of its uses at flight schools. In order that the effectiveness of the VR Simulator can be evaluated, for instrument flight training, a quasi-randomised separate-sample pretest–posttest design study was completed. The ability of this low-cost VR simulator to transfer the flying skills required to conduct an ILS approach, after establishment on approach, was evaluated with 44 participants. Results indicate significant improvement in participants’ flying skills based on operational (rrb = 0.508) and synthetic (g = 0.844) performance metrics. The findings indicate that the VR simulator appears effective for the training of these skills, and that the immersion and presence are not detrimental, even when the primary focus is the instrument panel. The idea that VR is an effective tool for training instrument flight skills has not previously been demonstrated. Due consideration must, however, be given to the context of this study and the noted limitations of the VR technology.
Keywords:
flight training
; pilot
; virtual reality
; visual flight
; human–machine interaction
; skill transfer
; aviation training technology
1. Introduction
The use of flight simulators to prepare pilots for training airborne, or even in displacing the aircraft as a training device entirely, is well established in the literature [1]. Within the airlines, simulators have largely displaced initial type-rating training in the aircraft [2]. However, in order that a simulator can achieve certification to that level of fidelity, as deemed necessary by regulators, significant capital investments are generally required [3]. For most of the rest of the aviation industry, and particularly for General Aviation (GA), the use of simulators is as a means to prepare the trainee for the learning activity to be conducted airborne [4,5]. Flight simulators used for this purpose, regardless of the technologies they employ, must therefore enable the transfer of the “right” kinds of skills to the trainee. Instruction in a flight simulator for the purpose of achieving the ability to maintain the aircraft within predefined, and legislated [6], tolerances is not without value. Training of hand flying skills is, however, largely about cognitively priming the trainee, rather than developing specific fine-motor skills [7]. Yet, teaching only this procedure of flight as a preparatory step prior to airborne training leaves the more important part of piloting – the technique - to be learned only in the air.
The technique can be viewed in the narrower conception as simply the means by which the procedure is achieved [8]; or it can be viewed as part of the broader ‘art’ of flying. In this latter conception, the technique incorporates matters of situational awareness, decision activities, and mission projection. The pilot maintains an awareness of the present state of the ownship, projects this state into the near future time-space, judges the projection, and adjusts the control actions to achieve the mission [9]. Perfect procedure is then not the goal, but rather adequate procedure that achieve mission success [10,11]. Of course, the technique is predicated on the procedure, and particularly perceptual-motor activities. The skill and long-acknowledged need for “ingenuity” on the part of the flight instructor [5] could enable better preparatory training of technique in the flight simulator. Nonetheless, the incorporation of technologies that allow for better immersion and understanding of ownship state would be of great benefit – such a technology is Virtual Reality (VR).
The development of ubiquitous Virtual Reality in recent years, and particularly the emergence of consumer-grade VR-HDMs (head-mounted display), has resulted in an increased interest in the technology for education. Interest in this use of VR for education has, of course, included applications within [12,13], and without [14], aviation. In considering VR for aviation education applications, and more specifically pilot training, its benefits can be viewed in relation to the conventional flight simulator that would otherwise be used. Compared to the conventional flight simulators or procedure trainers that are common in GA, VR is considered more immersive, interactive, and more engaging [14]. Each of these traits is of value in the training context directly and also by enhancing the cognitive [15] or motivational fidelity [16,17].
The interactivity and immersion of VR may also work synergistically, to enable greater spatial awareness [18,19]. Improving these aspects of flight simulation may prove especially beneficial for the training of those tasks and phases of flight that require the pilot to coordinate their aircraft with regards to external visual reference (e.g., circuits). These tasks require both accurate flight control input (i.e., procedure), and anticipation and projection of the relative motion of the aircraft (i.e., technique) [20]. Conventional simulators are known to be less effective at the training of this kind of “formation” flying [21], as compared to simpler flying tasks [9]. While the exact cause of this differential in training between tasks in unknown, it may well be related to the tunnel vision caused by truncations of the visual field, resulting from the necessarily limited dimensions of a two-dimensional monitor [22]. The simpler perceptual-motor coordination skills – which are critical for aircraft control – must also be trained, or cognitively primed, effectively if the VR Flight Simulator is to replace the conventional.
The use of flight simulators to train perceptual-motor skills, particularly the fine motor movements required for aircraft control, is not fully resolved in the existing literature. Training in flight simulators can result in improved airborne performance, even when the inputs used in the simulator exhibit little resemblance to those in the aircraft. For instance, even using a keyboard to control the flight simulator can have benefits [7]. The mechanism by which this improvement occurs may be related to cognitive priming, where the trainee is mentally prepared for the airborne experience [23]. This suggests that the trainee has developed related skills, though not necessarily the “muscle memory” of control. In true-transfer studies, this is a primary matter for consideration, although the practical aspect of whether the use of simulators—regardless of design—reduces actual time in the aircraft may be of greater concern [5]. In a study of his kind, and in real-world flight training that uses flight simulators in this way, Thorndike’s law of readiness [24] would apply. In quasi-transfer studies, where a second simulator is used as an analogue for the aircraft, identical controls can be implemented. As a result, there is no need for the trainee to learn new perceptual-motor skills, since the controls are the same between simulators. In this context, both perceptual-motor skills and cognitive priming are trained simultaneously. Therefore, for a quasi-transfer study, and indeed a sufficiently high-fidelity simulator (e.g., those used by the airlines), the law of recency and the law of readiness [24] would apply. This skill of aircraft control can be directly quantified. The metric, which would be classified as a Type 1 metric per Lysaght, et al. [25], can represent the error [26] or accuracy [27] of, for example, the flight path for a given manoeuvre.
Training the technique of flight in the simulator, including the situational and mission projection skills, relies on the same educational techniques as would otherwise be employed airborne. The skills that form the technique would, in the Australian context, be covered by multiple standards of the Non-Technical Skills (NTS) contained in Schedule 2 of the Manual of Standards Instrument for Part 61 of the CASR [28]. The technique can be directly encouraged by the flight instructor, but will also begin to develop as the mechanics of control are developed [29]. The simulator can be given preference in some circumstance (e.g., instrument flying) due to its lower cost, and ease of ease of repetition. Conventional simulators in GA are, however, limited by two-dimensional displays and lack of immersive, situated experience [30,31] . As such, those part of the technique that rely of maintaining an effective external lookout (NTS1.1), and using this to assess the situation and make proper decision (NTS1.3) – that is, mission projection – are necessarily inhibited by the tunnel vision of the display. A simulator that allowed for an understanding of three-dimensional spatial relationships would, theoretically, achieve training of the technique as readily as training of the procedure. In order to measure the technique in an objective manner, a metric other the error in the control of the aircraft is needed [9]. These measures of procedure can show “poor” performance in a circumstance that a flight instructor would judge performance to be adequate. The goal not being perfection, but competent completion of the mission [10,11]. To quantify this, some meaningful measure of the mission outcome should be calculated.
The efficacy of VR to transfer both perceptual-motor coordination and mission projection skills, within the flight simulator paradigm, remains open to debate. Present literature on the use of VR for flight simulation, and the use of other Extended-Reality spectrum technologies for this purpose, inadequately addresses these areas of pilot training. Where such areas have been examined, the transfer observed is both varied and accompanied by substantial uncertainty. Present research, for various reasons, is focussed on the use of the technology in the earlier stages of pilot training (i.e., ab initio), which is precisely the time when the development of these skills must begin. The assumed benefits of VR, in comparison to conventional simulators, such as increased immersion, should be of benefit in the transfer of both of these flight critical skills. Considering the importance, the question guiding the present research is: ‘Does the use of a Virtual Reality flight simulator develop participants’ perceptual-motor coordination skills, mission projection skills, or both, as evaluated by two measures (one measuring a proxy of procedure, and one a proxy of technique) of their performance during a single flight task?’ In order to answer this question, empirical evidence will be provided on the efficacy of the VR flight simulator.
2. Materials and Methods
The present study utilises a quasi-experimental separate-sample pretest-posttest design. This design, which was popularised by Campbell and Stanley [32], assesses performance or status of one group prior to receipt of the trial intervention, and assesses the same metric for a second, separate group following the intervention. In such a design all participants are subject to the intervention, with the intervention effect being measured between the pretest and posttest scores of the two groups. Separate-sample pretest-posttest designs eliminate the need for a control group, allowing use in circumstances where the creation of a control group is impractical, impermissible, or both [27]. The design can also be used in situations where researchers would otherwise use pre-experimental designs, such as the one-shot case study, but without the numerous risks to internal and external validity. The underlying theoretical framework of the research supposes that experience of the simulation, and therefore practice of the skills, would increase performance (i.e., expertise) in the simulation [33].
The researchers were provided with anonymised activity and flight [simulator] data, that was the result of, and originally for the sole purpose of, an undergraduate education activity for a course at an Australian university. The creation of a disparity in educational outcomes would not have been permitted in this context. The structure of the data was not a result of choice, but of limited hardware, software, and time. This resulted in a group making use of a PCATD (personal-computer aviation training device) prior to use of the VR-HDM based simulator (i.e., the pretest group), and a group making use of the VR-HMD prior to use of a PCATD (i.e., the posttest group). Data were available for 46 participants (n = 41, three excluded due invalid data), of which 17 (n = 17) were pretested for their flying skills on a PCATD, and 24 (n = 24) that were posttested on the PCATD. The data provided to the researchers did not contain any demographic information (e.g., age, sex, etc.), nor where such data subsequently sought. During the original educational activity, all participants had been briefed to discontinue use of the simulator[s] if they experienced discomfort as a result of such use. The nature of this data and activity preclude the establishment of true randomisation of group allocation. However, the circumstance of insufficient hardware meant that the order in which participant arrived (i.e., random to an extent), determined whether they were tested before or after the intervention.
The hardware used for the simulator was a computer, a computer monitor, a VR-HMD, and a set of flight specific peripherals. The computer used for both the assessment PCATD and the VR Simulator was equipped with an Intel i7 (2.5 GHz) CPU, a Nvidia RTX 3060 (16GB) GPU, and 16GB (DDR4) of RAM. The computer monitor used for the PCATD was 27-inch flatscreen, with a resolution of 1920x1080 pixels, and a refresh rate of 60Hz. The VR-HMD used for the VR Simulator, which ultimately served as the visual display medium, was a Meta Quest 2 (formerly known as the Oculus Quest 2). The Meta Quest 2 contains two display panels, one per eye, with a resolution of 1832x1920p at a maximum refresh rate of 90Hz. The headset generally conforms to the definition of “virtual reality” as given by Phillips [34]. The flight specific peripheral used for both simulators was a Thrustmaster T.16000 HCS HOTAS [35] for roll, pitch, and engine control, and associate T.Flight rudder pedals [36] for yaw control.
The software used for both simulators was the Windows 11 OS (operating system) for the computer, the X-Plane 11 flight simulator [37], the VR-HMDs onboard OS (Version: v61), and the associated software packages required to establish a link between the VR-HMD and computer. All graphics setting within the X-Plane software were set to medium. Post hoc the testing indicates that this computer and software combination would achieve a simulator framerate of at least 60Hz. Though, the particular environmental conditions during the original lab activity, the link to the VR-HMD, and other unknown factors, may have reduced the actual refresh rate. The researchers are unable to unambiguously confirm this based upon provided data. The simulated aircraft for both simulators was a Cessna 172 that was equipped with a Garmin G1000-style flightdeck and traditional standby instruments.
The flight task to be flown in all situations, and therefore in both simulators, was a left downwind. The aircraft was preestablished at a [very] early left downwind position (-35.26662, 149.17899) for Canberra International airport (ICAO: YSCB) Runway 35, at circuit altitude (2900ft AMSL, ~1000ft AGL), and at cruise speed (105KIAS). The goal of the activity was to track parallel to the runway (RWY 17), by visual reference only, to a position abeam the threshold of that runway (the “mission”). Figure 1 shows the ‘ideal’ flight path (white) overlayed on a map, with several example flight paths (black) also shown. The end of the ‘ideal’ flight path (-35.31385717, 149.1784932) shown in Figure 1 is correct, as Runway 35 at YSCB has a displaced threshold [38]. The downwind leg can be examined for procedural correctness (the “procedure”) with reference to the tolerances of straight and level (S&L), at the private level, as specified in the MOS [6] and shown in Table 1. In order that the flight would primarily be conducted with regards to visual reference to the ground and horizon, the [simulated] AHRS (Attitude Heading Reference System) was failed. In order that the relative position of the aircraft in relation to the runway could be determined during use of the PCATD, a button on the HOTAS was mapped to the “glance left” function. Unlike the year-round prevailing conditions at YSCB, the wind was set to nil. All participants flew this task on both simulators, with the pretest group flying on the PCATD before the VR Simulator, and the posttest group flying on the VR Simulator before the PCATD. Assessment of the independent group metrics on the PCATD then enables the assessment of the quasi-transfer of flying skills, as attributable to the VR intervention.
For the purpose of evaluating participant procedural correctness, flight simulator data for altitude, heading, and airspeed were measured against the MOS tolerances in Table 1 for the whole downwind leg. The time that was flown while in conformance with all of these tolerances was calculated as a proportion of the total flight time, to provide the percentage of time in tolerance (PTiT) metric. The assessment of the ability of participant to achieve the mission required the extract of latitude, longitude, and altitude data for the final point of their flight path. The distance from the end of the ‘ideal’ flight path to the end of each participant’s flight path was by use of the haversine formula. Use of the haversine formula is preferable for evaluation of short distances and is simple to use [39]. This distance information was then combined with the Δaltitude using basic trigonometry, to provide the absolute displacement (AD) metric in feet. In the interest of preserving the directional alignment of the measures, the absolute displacement metric was reverse scored. That is, an increase in the PTiT (i.e., more time within the specified flight tolerances) or the AD (i.e., an increase towards zero displacement from target) is indicative of better performance. The PTiT metric is the measure of procedure, and the AD metric is the measure of technique.
The null hypothesis (H0) for this research was that there would be no significant difference between the participants’ flight performance, based upon the PTiT and AD, between the pretest and posttest. That is, there would be no transfer that resulted from the use of the VR Simulator. Conversely, the first alternate hypothesis (H1) was that the posttest PTiT or AD would be greater, indicating improved flight performance. The null hypothesis is therefore,
where ΔμPTiT and ΔμAD represent the change in the mean between pretest and posttest of the PTiT and the AD, respectively. The first alternate hypothesis being,
where the expectation is that the posttest mean of at least one metric will be higher than pretest. If the null hypothesis is rejected, and there is evidence of improvement, the second alternative hypothesis (H2) is that transfer will improve both metrics equally. That is,
where, owing to the potential superiority of VR Simulators over conventional simulators, performance is equally improved for both mission and procedure.
H0: ΔμPTiT ≤ 0 and ΔμAD ≤ 0
H1: ΔμPTiT > 0 or ΔμAD > 0
H2: ΔμPTiT = ΔμAD > 0
In advance of statistical testing, which would always have made use of some form of independent samples t-test, data were checked for to validate underlying assumptions of normality and homoskedasticity. The equality of variances was checked by Levene’s test, and normality of the distributions was checked by the Shapiro-Wilk test. The PTiT data were found to be homoscedastic and normally distributed, but the AD data had both distributional and variance issues. In order that statistical power could be retain for both measures, and direct comparison between tests kept, the AD data were transformed using the Yeo-Johnson transformation. Unlike other data transformation, such as the Box-Cox transformation, the Yeo-Johnson transformation can handle negative values [40,41] - this being necessary as all AD data were negative. The lambda (λ) value was determined for the pretest data only, and then applied via the transformation to all AD data. Normality of the distributions and homoskedasticity was then rechecked by the same tests, with the data found to now be suitable for parametric statistical testing.
Following data extraction, calculations, and assumption checking, the t-test was used to check the difference in flight performance between the pretest and the posttest, for both metrics. The Hedge’s g effect size [42] was calculated for each measure, to enable understanding of the mean difference between the pretest and posttest, and therefore the intervention effect. Hedge’s g was more suitable than Cohen’s d due to the incorporation of a correction factor for small sample sizes, and better handling of unequal group sizes [43]. The mean differences between performance measures for the pretest and posttest groups being divided by the pooled standard deviation, as opposed to the maximum likelihood estimator [42].
So as to allow statistical comparison of the outcomes of the two metrics, and to allow calculation of the combined effect size, the correlation of the effect sizes was calculated. The sum of the cross-products of the deviations from the means, for each measure, approximates the covariance. The covariance was then normalised by dividing by the total degrees of freedom across the pretest and posttest groups. Dividing by the pooled standard deviation resulted in an estimate of the linear correlation (r) between the intervention effects on the two measures. A z-test of the effect sizes that incorporated the correlation, as per the difference method of Cohen [44] as cited by Lakens [45], was used to assess whether any change in the measures was equal. The overall effect size was then calculated by the method recommended by Borenstein, et al. [46].
In combination, these measures assess the statistical significance of the intervention, the relationship between the measures, and the practical significance of the change[s]. Owing to the characteristics of the “experiment” that created the data, a priori calculation of power was not possible. Post hoc power calculations were not computed, as they provide no additional information that is not already provide by confidence intervals, and can risk misinterpretation of the results [47].
3. Results
The PTiT metric for the pretest group (M = 33.3%, SD = 19.1%, Md = 35.1%) and the posttest group (M = 51.7%, SD = 21.7%, Md = 48.9%), and the AD metric for the pretest group (M = -2707.5ft, SD = 768.2ft, Md = -2319.2ft) and the posttest group (M = -2262.4ft, SD = 540.7ft, Md = -2146.2ft), required assumption checking prior to statistical test. Levene’s test for Equality of Variance showed homoskedasticity between the pretest and posttest data for both the PTiT metric (F(1,39) = 0.322, p = 0.564), but the AD metric was heteroskedastic (F(1,39) = 5.496, p = 0.025). The Shapiro-Wilk test showed that the PTiT data was normally distributed for both the preset group (W = 0.957, p = 0.568) and the posttest group (W = 0.978, p = 0.852). The Shapiro-Wilk test showed that for the AD metric, the pretest data were non-normally distributed (W = 0.864, p = 0.018), and the posttest data were normally distributed (W = 0.926, p = 0.08). The Yeo-Johnson transformation was applied to the AD pretest data, and the optimal lambda value determine (λ = 3.521). AD posttest data were also transformed using this lambda value. Retesting of the AD data showed that the AD pretest data were now normally distributed (W = 0.914, p = 0.115), without producing a non-normal distribution in the AD posttest data (W = 0.936, p = 0.133). The AD data were now also homoscedastic (F(1,39) = 0.005, p = 0.942). Figure 2 shows the means of the untransformed PTiT data and transformed AD data, for the pretest and posttest groups.
The results of the Independent Samples t-test, shown in Table 2, comparing the separate pretest and posttest groups percentage time in tolerance (PTiT), shows a significant (t(39) = 2.813, p = .008) mean difference of 18.43 (95% CI[5.20,31.65]). This indicates that the VR Simulator intervention improved the PTiT, allowing the posttest group to maintain within tolerance for, on average, 18.43 percentage points more of their specific time [sic]. The results of the Independent Samples t-test between the groups for absolute displacement (AD), shows a significant (t(39) = 2.126, p = .040) mean difference of 1.24×10⁻⁶ (95% CI[0.06×10⁻⁶,2.42×10⁻⁶]). Though less directly interpretable due to the data transformation, this result would indicate that the VR Simulator intervention reduced the distance to the “mission” target, for the posttest group, thereby improving their flight skills. Both t-test results indicate a significant difference between the participants’ flight performance, based upon the PTiT and AD, between the pretest and posttest. The null hypothesis (H0) is rejected.
The calculated Hedge’s g effect sizes, between the pretest and posttest, as shown in Table 2, indicated positive transfer for both the PTiT metric (g = 0.875, 95% CI[0.219,1.531]) and the AD metric (g = 0.661, 95% CI[0.024,1.298]). As per the convention set forth by Cohen [44], this would indicate a large training effect for the PTiT, and a moderate training effect for the AD. When considering these effect sizes, it is important to consider that they are dependant, and they have a moderate positive correlation (r = 0.563). Despite the usual interpretation of the effect sizes suggesting a difference between improvements in the two metrics, the z-score (z = 0.693) indicates that, at the 95% confidence level for a two-tail test, they are not significantly different (p = 0.488). The first alternative hypothesis (H1) is rejected. The results support the second alternative hypothesis (H2) that both metrics improved equally.
4. Discussion
The use of VR Simulators in pilot training requires proper consideration of their efficacy in developing flight critical skills, particularly in circumstances where such simulators will displace conventional simulators. The percentage of time in tolerance (PTiT), here representing the portion of the manoeuvre during which the participant was accurately performing the procedure of flight, and the absolute displacement (AD), representing the accuracy of their mission project, were both significantly improved by the VR intervention. The PTiT data, which can be readily interpreted in raw form, show significant improvement between pretest and posttest—an increase from a mean of 33.3% for the pretest group to a mean of 51.7% for the posttest group. The standard deviation, which represents the variability of the PTiT data within the pretest and posttest groups, shows a small increase. The substantial improvement in group performance makes the small change in SD inconsequential. The Absolute Displacement (AD) data is more readily interpreted in its pre-transformed state. In that state, the posttest group's mean AD was -2,362.ft, whereas the pretest group’s mean AD was -2,707.5ft. Unlike the small increase in the variability of performance for the posttest group in the PTiT metric, the AD metric shows less variability, based on the SD. The underlying data are reflected in the large positive effect size (g = 0.875, 95% CI[0.219,1.531]) for the PTiT, the moderate positive effect size for the AD (g = 0.661, 95% CI[0.024,1.298]), and the large positive combined effect size (g = 0.845, 95% CI[0.275,1.416]). When examining these improvements, due consideration must be given to the wholly artificial environment (i.e., quasi-transfer) in which they occurred.
The significant improvement in the PTiT, which is taken to represent the improvement in the procedure, would indicate that a VR simulator may adequately substitute for a PCATD, within the limited scope of what was examined. A large positive effect size (g = 0.875, 95% CI[0.219,1.531]) indicates that the intervention was able to transfer, or suitably cognitively prime, the participants prior to the aircraft analogue. This improvement used the same flight control peripherals in both the PCATD and the VR Simulator. As such, the exact mechanism by which the improvement occurred is unclear. Though, both the law of recency and the law of readiness would most likely be applicable. That the flight was conducted in VMC (visual meteorological condition) may have also given advantage to the VR Simulator, by means of its immersive exterior visual scene. These factors in combination likely led to the improvement. Of course, no participant achieved a perfect score (i.e., 100%), but perfection is not the goal of flight training [48]–competent completion of the mission is the goal. That is only possible with suitable mission projections skills.
The significant improvement in the AD, which is taken as denoting an improvement in the participants’ technique through improved mission projection, would support the use of VR to prepare for training these skills airborne. A moderate positive effect size (g = 0.661, 95% CI[0.024,1.298]) indicates that the intervention has improved those underlying non-technical skills, through some combination of the technologies inherent characteristics. The posttest group (i.e., those participants that had received the intervention but were now being tested on the PCATD), despite no longer having the advantaged of the VR Simulator (e.g., increased immersion and such), had been advantage in flying skills by the intervention. That is, without the immersions of the VR Simulator, they were still able to maintain a better external lookout (NTS1.1) and use this to properly assess the situation and make appropriate decisions (NTS1.3). The claimed immersive and situated experience could have improved the general consideration of the relative spatial relationships. It is possible that, as with the PTiT, the law of recency and the law of readiness are applicable. Importantly, the improvement in the proxy measure of technique was not significantly different from the proxy measure of procedure. Unlike conventional simulators, there would appear to be evidence to support the training of those more visuospatial skills and manoeuvres in VR.
In consideration of the possibility that the two measures are not perfect representations of their skills, it is also important to consider the more general training effect. The combined effect size (g = 0.845, 95% CI[0.275,1.416]), which indicates a large positive transfer, suggests that whatever the VR Simulator intervention is transferring improves subsequent performance. This combined effect size, as well as the two other effect sizes, are broadly comparable to existing xR Simulator literature [13]. The only VR Simulator transfer research with which both design and measure (i.e., PTiT specifically) are shared, cannot be readily statistically compared. In that research [27], the underlying data were non-normal, and the Hedge’s g effect size was calculate from the results of a Mann-Whitney U test, by use of the method of Tak and Ercan [49]. Nonetheless, the large positive training effect of the research (0.946, 95% CI[0.56, 1.37]) is comparable to the training effect in the present research. Finally, the AD training effect, which is clearly dependent upon improved understanding of visuospatial relationships, can be compared to previous VR Simulator training of formation flying [50]. That research showed a far larger positive effect size (g = 1.819, 95% CI[0.08, 3.56]), but this has far wider confidence intervals, reflecting greater uncertainty in the estimate. The effect size from the present research is adequately consistent with that of the previous research, as it is within the confidence intervals of that earlier effect size.
The present research differs in many ways from previous research on the use of VR Simulators, and indeed conventional simulators, and this should be considered when interpreting the results. The research design of this research, and the method of training efficacy within a quasi-transfer framework, are the two most distinguishing differences. The somewhat unusual structure of the data, and their origin, effectively necessitated the use of quasi-experimental, separate-sample pretest-posttest design. This design is common in other areas of education research (e.g., ongoing medical education), but is rarely use in pilot education. Whilst the data could have been interpreted through use of several kinds of pre-experimental design, the actual process of its generation, and sources of internal and external invalidity made the design used most suitable. Further, owing again to the origins of the data, history, maturation, instrumentation, and mortality, which are the inherent sources of invalidity for this design [32], are largely minimised. For example, maturation posses little to validity, due to the short length of the intervention, the testing, and the combined time. It is unlikely whether sufficient time had past to resulted in and increase in the participants’ age, hunger, tiredness, or the like. That the time between all pretests and posttests was less than two hours reduces the likelihood that the remaining sources of invalidity could impact the outcome.
Within quasi-transfer research, and indeed within true-transfer research, it is most common to train the participant to a set level of proficiency in the experimental simulator, then train them to the same level of proficiency in the aircraft [or aircraft analogue], and then quantify the instruction saved in the aircraft. The instruction saved generally being calculated as the training effectiveness ratio [51]. The activity that originated this data did not train to a level of proficiency, but for a set length of time. Furthermore, in examining the results of the present research, the outcomes must also be considered within the larger context of transfer literature, and with due regard as the means of quantification and interpretation. The use of a quasi-transfer study means that, particularly as regard the perceptual-motor skills, the effect sizes are likely an overestimate of the transfer [49]. The combined effect size (g = 0.845), as well as the two internal metrics from which it was derived (i.e., PTiT and AD), are liable to overestimate the true-transfer that is achievable between a VR Simulator and the aircraft. Additionally, the that these internal metrics are not commonly used, and that they have been interpreted in the manner in which they have, may constitute a reasonable question as to their authority. Finally, the posttest group scores are ultimately based on as portion of flying, and the end of the test, in which they are approaching twice the exposure as the pretest group. That is, they are continuing to learn during the posttest, as such learning is inherent [9,52]. Despite the various limitations, the research shows great promise for VR Simulators for this kind of pilot training.
5. Conclusions
The research presented here supports that a VR Simulator, which herein was constitute by a VR-HMD deployed as the visual system, can be used for improving both the procedure and the technique of trainees. Between the pretest and the posttest, both the procedure performance and the technique performance, as well as the combined performance, were significantly improved. The answer to the question, ‘Does the use of a Virtual Reality flight simulator develop participants’ perceptual-motor coordination skills, mission projection skills, or both, as evaluated by two measures (one measuring a proxy of procedure, and one a proxy of technique) of their performance during a single flight task?’ is that VR improves both the participants’ perceptual-motor coordination and mission projection skills equally. The improvement in performance was achieved using [relatively] inexpensive hardware, short intervention exposure time, and without either an instructor or formal flight training. When the noted limitations of the technology are given due consideration, and the assignment and task are carefully evaluated, this research would be in support of the use of a VR Simulator. Additional research on the true-transfer achievable, the advantages attainable with more modern VR-HMDs, and the use of the VR Simulator in other flight training domains would each be of great value.
Author Contributions
Conceptualization, A.S. and G.W..; methodology, A.S and G.W.; validation, A.S., G.W. and K.J.; formal analysis, A.S. and G.W.; investigation, A.S. and G.W.; resources, G.W.; data curation, A.S.; writing—original draft preparation, A.S.; writing—review and editing, A.S., G.W. and K.J.; visualization, A.S. and G.W.; supervision, G.W., T.L., and K.J.; project administration, G.W. All authors have read and agreed to this version of the manuscript.
Funding
This research received no external funding.
Institutional Review Board Statement
The study was approved by the Human Research Advisory Panel of the University of New South Wales (Approval HC220421 on the 31st of August, 2022).
Informed Consent Statement
Participant consent was waived by the Human Research Advisory Panel of the University of New South Wales as the data and the task upon which this research are based was part of, and originally solely for the purpose of, an undergraduate laboratory course. All data were deidentified prior to provision to the researchers.
Data Availability Statement
The datasets presented in this article are not readily available because of restrictions on their distribution to parties external to the original research, as imposed by the ethics approval. Requests to access the datasets should be directed in the first instance to the corresponding author.
Conflicts of Interest
The authors declare no conflict of interest.
References
- Somerville, A.; Lynar, T.; Wild, G. The nature and costs of civil aviation flight training safety occurrences. Transportation Engineering 2023, 12, 100–182. [Google Scholar] [CrossRef]
- Vidakovic, J.; Lazarevic, M.; Kvrgic, V.; Vasovic Maksimovic, I.; Rakic, A. Flight Simulation Training Devices: Application, Classification, and Research. International Journal of Aeronautical and Space Sciences 2021, 22, 874–885. [Google Scholar] [CrossRef]
- Lee, A.T. Flight simulation: virtual environments in aviation; Ashgate: Aldershot, England, 2005. [Google Scholar]
- Allerton, D.J. The impact of flight simulation in aerospace. The Aeronautical Journal 2010, 114, 747–756. [Google Scholar] [CrossRef]
- Povenmire, H.K.; Roscoe, S.N. Incremental transfer effectiveness of a ground-based general aviation trainer. Human Factors 1973, 15, 534–542. [Google Scholar] [CrossRef]
- Part 61 Manual of Standards Instrument 2014. (Cth) sched 8. (Austl.).
- Dennis, K.A.; Harris, D. Computer-based simulation as an adjunct to ab initio flight training. The International Journal of Aviation Psychology 1998, 8, 261–276. [Google Scholar] [CrossRef]
- Reiser, R.; Brecke, F.; Gerlach, V. On the Difference between Procedure and Technique in Pilot Instruction; Instructional Resources Laboratory: Temp, 1972. [Google Scholar]
- Eddowes, E.E.; Waag, W.L. The use of simulators for training in-flight and emergency procedures; AGARD, 1980. [Google Scholar]
- Campbell, R.D.; Aircraft, O.; Pilots, A. Flight instructor's manual, 5th ed.; Campbell Partnership: Guildford, Eng, 1994. [Google Scholar]
- Air Services Branch. Elementary Flying Training Manual and Instructor's Handbook, First ed.; Department of Transport: Ottowa, Canada, 1944. [Google Scholar]
- Cross, J.I.; Boag-Hodgson, C.; Ryley, T.; Mavin, T.; Potter, L.E. Using Extended Reality in Flight Simulators: A Literature Review. IEEE Transactions on Visualization and Computer Graphics 2022, 1–1. [Google Scholar] [CrossRef]
- Somerville, A.; Joiner, K.; Lynar, T.; Wild, G. Applications of extended reality in pilot flight simulator training: a systematic review with meta-analysis. Visual Computing for Industry, Biomedicine, and Art 2025, 8, 1–30. [Google Scholar] [CrossRef]
- Kavanagh, S.; Luxton-Reilly, A.; Wuensche, B.; Plimmer, B. A systematic review of virtual reality in education. Themes in Science and Technology Education 2017, 10, 85–119. [Google Scholar]
- Marougkas, A.; Troussas, C.; Krouska, A.; Sgouropoulou, C. How personalized and effective is immersive virtual reality in education? A systematic literature review for the last decade. Multimedia Tools and Applications 2024, 83, 18185–18233. [Google Scholar] [CrossRef]
- Huddleston, H.; Rolfe, J. Behavioural factors influencing the use of flight simulators for training. Applied Ergonomics 1971, 2, 141–148. [Google Scholar] [CrossRef]
- Hopkins, C.O. How much should you pay for that box? Human Factors 1975, 17, 533–541. [Google Scholar] [CrossRef]
- Azarby, S.; Rice, A. Understanding the Effects of Virtual Reality System Usage on Spatial Perception: The Potential Impacts of Immersive Virtual Reality on Spatial Design Decisions. Sustainability 2022, 14, 10326. [Google Scholar] [CrossRef]
- Uz-Bilgin, C.; Thompson, M. Processing presence: how users develop spatial presence through an immersive virtual reality game. Virtual Reality 2022, 26, 649–658. [Google Scholar] [CrossRef]
- Langewiesche, W. Stick and rudder: An explanation of the art of flying; McGraw-Hill: New York, 1944. [Google Scholar]
- Woodruff, R.R. Full mission simulation in undergraduate pilot training: An exploratory study. American Psycholog. Ass. Journal Suppl. Abstract Service 1977. [Google Scholar]
- Bradley, D.R.; Abelson, S.B. Desktop flight simulators: Simulation fidelity and pilot performance. Behavior Research Methods, Instruments, & Computers 1995, 27, 152–159. [Google Scholar]
- Li, Q.; Li, B.; Wang, N.; Li, W.; Lyu, Z.; Zhu, Y.; Liu, W. Human-Machine Interaction Efficiency Factors in Flight Simulator Training Towards Chinese Pilots. In Proceedings of the Advances in Simulation and Digital Human Modeling, Cham, 2021//, 2021; pp. 26–32. [Google Scholar]
- Thorndike, E.L. The fundamentals of learning; Teachers College Bureau of Publications, 1932. [Google Scholar]
- Lysaght, N.R.J.; Hill, S.G.; Dick, A.; Plamondon, B.D.; Linton, P.M.; Wierwille, W.W.; Zaklad, A.L.; Bittner, A.C. Operator Workload: Comprehensive-Review and Evaluation of Operator co Norkloaed Methodologies. 1989. [Google Scholar]
- Smith, J.K.; Caldwell, J.A. Methodology for evaluating the simulator flight performance of pilots. Brooks City Base, TX: Air Force Research Laboratory 2004. [Google Scholar]
- Somerville, A.; Lynar, T.; Joiner, K.; Wild, G. Virtual Reality Flight Simulation: A Quasi-Transfer of Training Study. 2024. [Google Scholar]
- Part 61 Manual of Standards Instrument 2014. (Cth) sched 2. (Austl.).
- Civil Aviation Safety Authority. Flight Instructor Manual - Aeroplane; Department of Infrastructure, Transport, Regional Development, Communications and the Arts: Canberra, 2006. [Google Scholar]
- Hanks, W.F. Foreword. In Situated Learning: Legitimate Peripheral Participation; Learning in Doing: Social, Cognitive and Computational Perspectives; Learning in Doing: Social, Cognitive and Computational Perspectives; Cambridge University Press: Cambridge, 2012; pp. 13–24. [Google Scholar]
- Cardenas, I.S.; Letdara, C.N.; Selle, B.; Kim, J.H. ImmersiFLY: Next generation of immersive pilot training. 2017 International Conference on Computational Science and Computational Intelligence (CSCI); IEEE Computers: Las Vegas, 2017; pp. 1203–1206. [Google Scholar]
- Campbell, D.T.; Stanley, J.C. Experimental and quasi-experimental designs for research. 2015. [Google Scholar]
- Ericsson, K.A.; Krampe, R.T.; Tesch-Römer, C. The role of deliberate practice in the acquisition of expert performance. Psychological review 1993, 100, 363. [Google Scholar] [CrossRef]
- Phillips, J. Development of a low-cost virtual reality workstation for training and education. In Research Reports: 1995 NASA/ASEE Summer Faculty Fellowship Program; Marshall Space Flight Center: Hunstville, 1996. [Google Scholar]
- Guillemot Corporation S.A. THRUSTMASTER T.16000M FCS Hotas. Available online: https://www.thrustmaster.com/products/t-16000m-fcs-hotas/ (accessed on 10/02).
- Guillemot Corporation S.A. THRUSTMASTER T.Flight Ruder Pedals. Available online: https://www.thrustmaster.com/products/t-flight-rudder-pedals/ (accessed on 10/02).
- X-Plane 11 (Version 11.20). Computer software; Laminar Research, 2023.
- Airservice Australia. ERSA FAC YSCB; Airservice Australia: Canberra, Australia, 2024. [Google Scholar]
- Lawhead, J. Python and Geospatial Algorithms; Packt Publishing: United Kingdom, 2023. [Google Scholar]
- Yeo, I.K.; Johnson, R.A. A new family of power transformations to improve normality or symmetry. Biometrika 2000, 87, 954–959. [Google Scholar] [CrossRef]
- Weisberg, S. Yeo-Johnson power transformations. Department of Applied Statistics, University of Minnesota. 2001. [Google Scholar]
- Hedges, L.V. Statistical methods for meta-analysis; Academic Press: Orlando; Orlando, 1985. [Google Scholar]
- Hoyt, W.T.; Del Re, A. Effect size calculation in meta-analyses of psychotherapy outcome research. Psychotherapy Research 2018, 28, 379–388. [Google Scholar] [CrossRef] [PubMed]
- Cohen, J. Statistical power analysis for the behavioral sciences; Routledge, 1988. [Google Scholar]
- Lakens, D. Calculating and reporting effect sizes to facilitate cumulative science: a practical primer for t-tests and ANOVAs. Frontiers in Psychology 2013, 4. [Google Scholar] [CrossRef]
- Borenstein, M.; Hedges, L.V.; Higgins, J.P.; Rothstein, H.R. Introduction to meta-analysis; John Wiley & Sons: Chichester, 2021. [Google Scholar]
- Hoenig, J.M.; Heisey, D.M. The abuse of power: the pervasive fallacy of power calculations for data analysis. The American Statistician 2001, 55, 19–24. [Google Scholar] [CrossRef]
- Schneider, W. Training High-Performance Skills: Fallacies and Guidelines. Human Factors 1985, 27, 285–300. [Google Scholar] [CrossRef]
- Tak, A.Y.; Ercan, I. Comprehensive Evaluation of Reference Values of Parametric and Non-Parametric Effect Size Methods for Two Independent Groups. International Journal of Statistics in Medical Research 2022, 11, 88–96. [Google Scholar] [CrossRef]
- Redei, A. Applications and Evaluation of a Motion Flight Simulator. Ph.D, University of Nevada, Reno, Ann Arbor, 2019. [Google Scholar]
- Roscoe, S.N.; Williams, A.C. Aviation psychology, 1st ed.; Iowa State University Press: Ames, 1980. [Google Scholar]
- Kozak, J.; Hancock, P.A.; Arthur, E.; Chrysler, S.T. Transfer of training from virtual reality. Ergonomics 1993, 36, 777–784. [Google Scholar] [CrossRef]
Figure 1.
Map with overlay of ideal flight path (white), and several example flight paths (black).
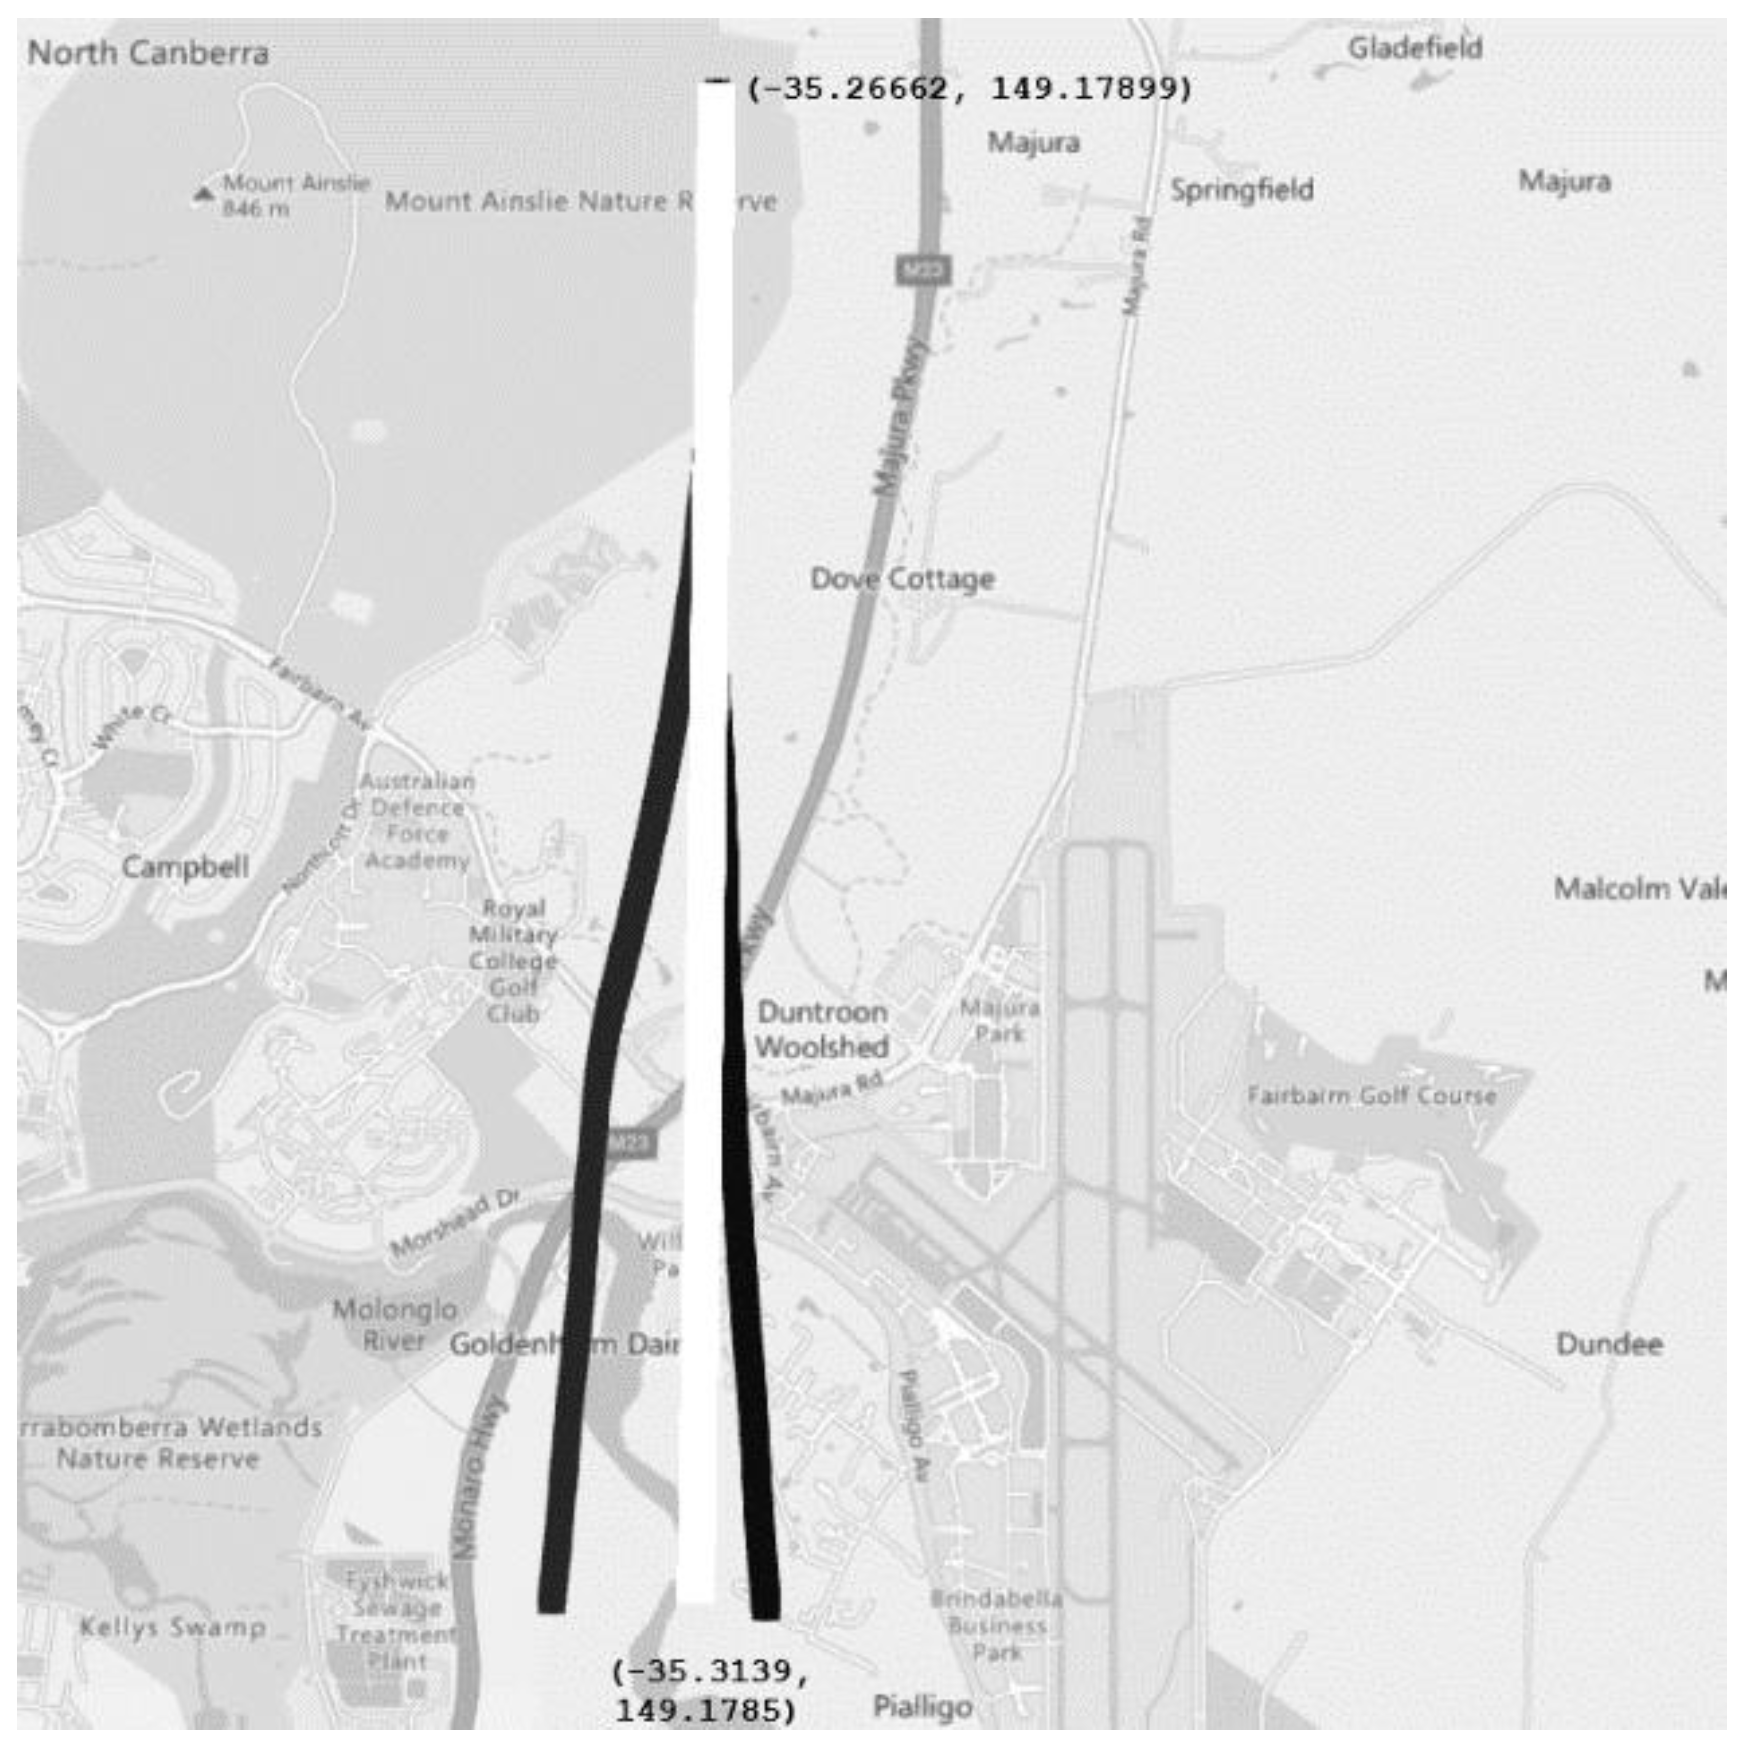
Figure 2.
(a) Mean percentage time in tolerance (PTiT) for pretest and posttest groups with 95% confidence intervals; (b) Box–Cox-transformed absolute displacement (AD; feet) for pretest and posttest groups with 95% confidence intervals.
Figure 2.
(a) Mean percentage time in tolerance (PTiT) for pretest and posttest groups with 95% confidence intervals; (b) Box–Cox-transformed absolute displacement (AD; feet) for pretest and posttest groups with 95% confidence intervals.
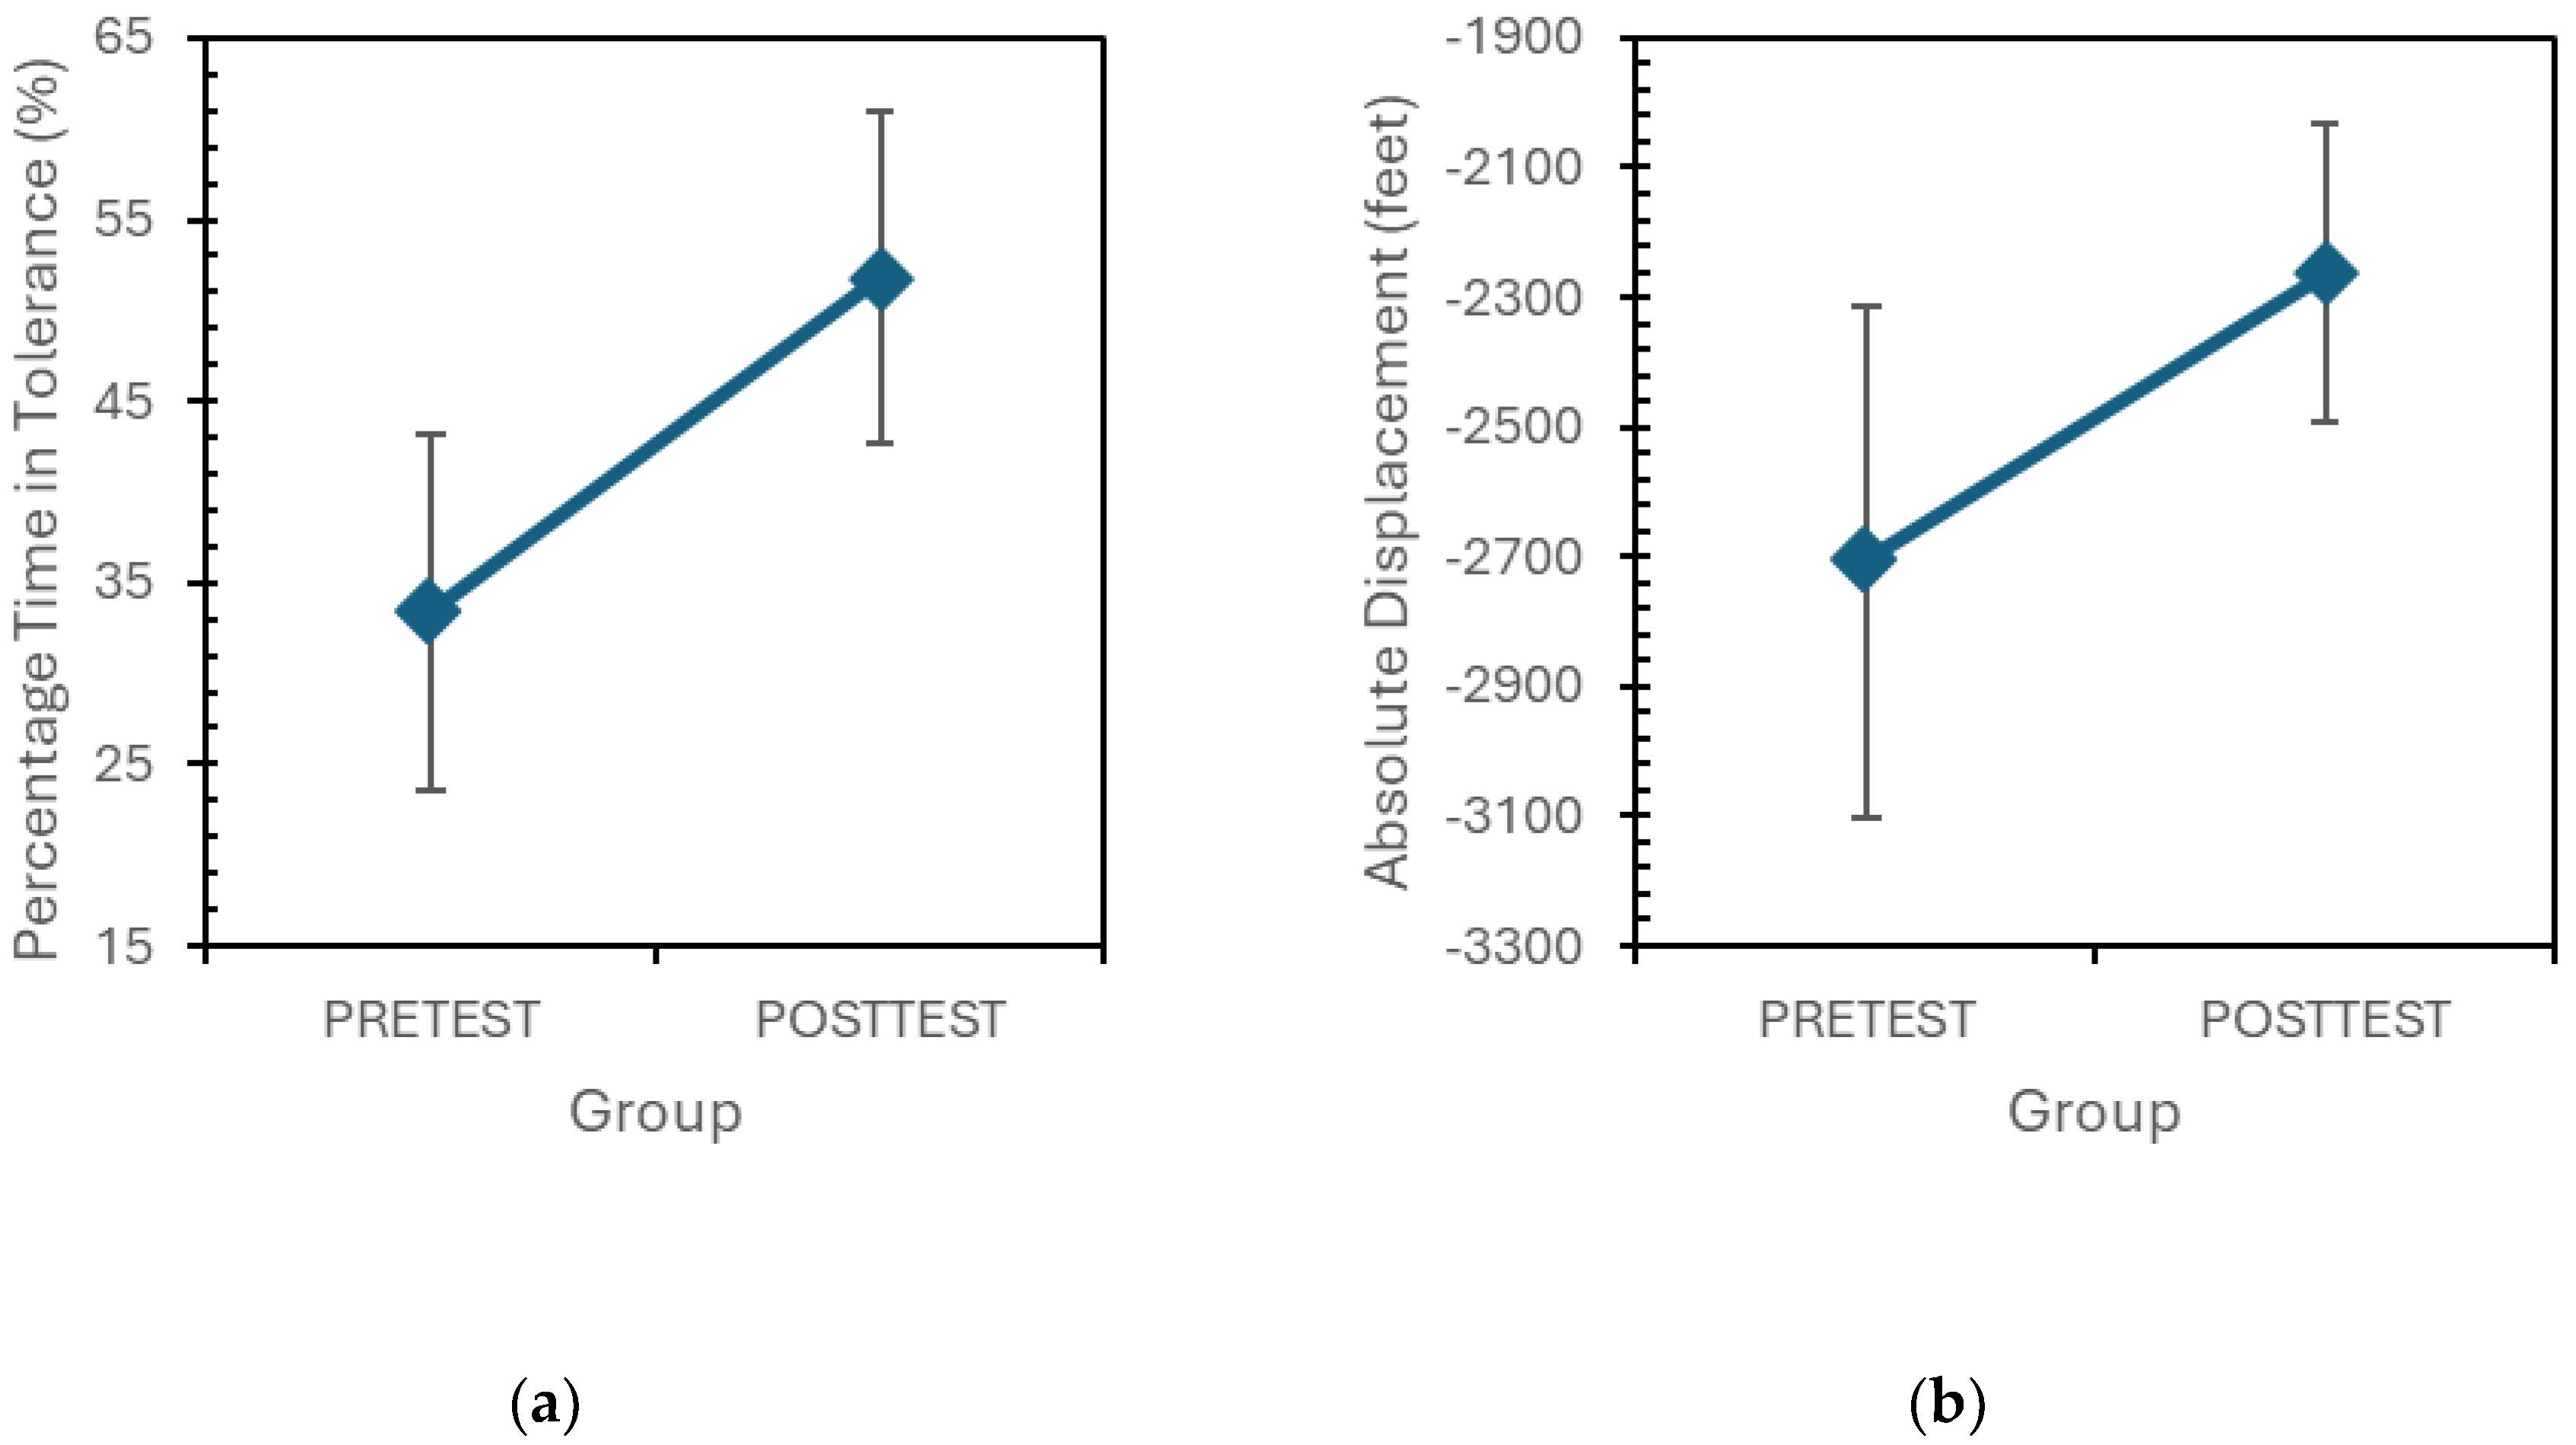

Table 1.
This is a table. Tables should be placed in the main text near to the first time they are cited.
Table 1.
This is a table. Tables should be placed in the main text near to the first time they are cited.
| Flight Path or Manoeuvre | Flight Tolerance | |
|---|---|---|
| Nominated heading | ±10° | |
| Straight and level | Altitude | ±150 ft |
| Airspeed | ±10 kts |
Table 2.
This is a table. Tables should be placed in the main text near to the first time they are cited.
Table 2.
This is a table. Tables should be placed in the main text near to the first time they are cited.
| T | df | p | Mean Difference | SE Difference | Hedge’s g | SE Hedge’s g | |
|---|---|---|---|---|---|---|---|
| PTiT | 2.813 | 39 | 0.008 | 18.426 | 6.549 | 0.875 | 0.335 |
| AD | 2.126 | 39 | 0.040 | 1.241×10⁻⁶ | 5.837×10⁻⁷ | 0.661 | 0.325 |
Disclaimer/Publisher’s Note: The statements, opinions and data contained in all publications are solely those of the individual author(s) and contributor(s) and not of MDPI and/or the editor(s). MDPI and/or the editor(s) disclaim responsibility for any injury to people or property resulting from any ideas, methods, instructions or products referred to in the content. |
© 2026 by the authors. Licensee MDPI, Basel, Switzerland. This article is an open access article distributed under the terms and conditions of the Creative Commons Attribution (CC BY) license (http://creativecommons.org/licenses/by/4.0/).
Copyright: This open access article is published under a Creative Commons CC BY 4.0 license, which permit the free download, distribution, and reuse, provided that the author and preprint are cited in any reuse.


