
Submitted:
03 January 2026
Posted:
09 January 2026
You are already at the latest version
Abstract
The presence of heavy metal in the sediments of tropical rivers is a significant hazard to the ecological quality and human health; however, the relationships of the biomagnification of metals have not been sufficiently investigated in urban West African environments. The current study determined the bioavailability and ecological risk of eight heavy metals (As, Cd, Cr, Fe, Mn, Ni, Pb, Se) in Nworie and Otamiri Rivers sediments, Nigeria. The BCR sequential extraction procedure was used to determine concentrations and distribution among four fractions (F1 -F4 ). The Risk Characterization used the Risk Ranking Index (RAC), the Geo-accumulation Index (Igeo), and the Potential Ecological Risk Index (PERI) and principal component analysis (PCA) supported the process of source apportionment. Findings showed that there was a strong spatial and temporal heterogeneity. The potentially bioavailable factions (F1 + F2 + F3) had maximums downstream at sites affected by urban activity cadmium at 1.95 mg/kg (81 %, SS5), lead at 5.81 mg/kg (72% SS7), and nickel at 5.37 mg/kg (100% SS7). The RAC more than 30% on cadmium showed increased mobility, and enhanced PERI (maximum of 285) on SS5 induced mainly by cadmium (E:241). The PCA revealed that 78% of the variance was explained, PC1 (54 %) linked cadmium and lead and nickel with anthropogenic urban runoff, and PC2 (24%) related geogenic iron and manganese with the remaining fraction F4. The Nworie and Otamiri river systems has a significantly high ecological risk. More studies focusing on the organization of fraction F3 and the following bioaccumulation mechanisms should be suggested to optimize the risk management approaches in this urban-tropical nexus.
Keywords:
heavy metals
; bioavailability
; ecological risk
; tropical river
; cadmium
; Otamiri
1. Introduction
The persistence of heavy metals in aquatic ecosystems presents significant environmental and health risks. Heavy metals are recognized for their toxicity and potential to bioaccumulate within food webs, which can lead to deleterious effects on both wildlife and human populations. The characterization and control of these pollutants are crucial in addressing global health and ecological crises associated with environmental contamination. Heavy metals are classified as priority pollutants due to their severe impacts (Singh et al., 2022).
Heavy metal pollution in tropical river systems is exacerbated by rapid urbanization and industrial activities, particularly in regions such as West African rivers. The Nworie and Otamiri Rivers in the Imo State of Nigeria exemplify these issues, as they are increasingly subjected to pollution from nearby markets and informal industrial activities, leading to contamination from various sources, including industrial effluents and agricultural runoff (Giao et al., 2022). This is particularly concerning as these rivers provide vital resources, including fish, irrigation, and drinking water, while simultaneously being compromised by human activities (Fu et al., 2023). Furthermore, studies conducted by Ali et al.(2019) reaffirm the presence of contamination within these freshwater bodies, emphasizing the importance of assessing local water quality (Ali et al., 2019).
Ecological assessments reveal that the toxicity of heavy metals is not purely dependent on their concentration in the environment; rather, it is also intricately linked to their bioavailability and subsequent uptake by aquatic organisms (Fu et al., 2023). For instance, fluctuations in environmental conditions, such as changes in pH and seasonal flooding, can increase the remobilization of accumulated metals from river sediments, thereby heightening risks to aquatic life (Mao et al., 2022). This phenomenon has been documented in various river systems globally, including the Ganga River in India, illustrating widespread concerns regarding seasonal variations and bioavailability (Emon et al., 2023). Significant findings from Huang et al. further corroborate the broad spectrum of heavy metals' impacts across diverse ecosystems (Huang et al., 2020).
The use of methodologies such as the Community Bureau of Reference (BCR) sequential extraction technique has been pivotal in understanding the speciation of heavy metals in sediments. This method facilitates the fractionation of metals into various forms which include, acid-soluble, reducible, oxidizable, and residual fractions—thus allowing researchers to elucidate the environmental risks posed by different metal species (Yuan & Wang, 2022). The BCR method has gained traction in studies assessing contaminated environments and offers valuable insights, particularly in regions facing significant ecological challenges, as noted by Sun et al. (2022).
While there exists extensive research regarding heavy metal pollution in larger river systems, the exploration of smaller rivers like Nworie and Otamiri remains limited. Previous analyses have demonstrated alarming levels of metal concentrations in these rivers; however, they have often neglected to include sediment speciation and ecological risk evaluations (Raji & Palamuleni, 2023). This gap is critical, as sediments in urbanized tropical rivers often contain higher levels of contamination compared to water columns, serving as long-term indicators of pollution trends (Obinna & Enyoh, 2019). Recent studies emphasize the need for localized assessments to adequately gauge sediment pollution and inform management strategies (Masindi & Muedi, 2018).
Local hydrodynamic conditions where the Nworie and Otamiri Rivers converge can further influence the distribution and concentration of pollutants downstream. Alarmingly, recent studies have indicated that the concentrations of prioritized heavy metals like cadmium, chromium, and lead frequently exceed the limits set by international health standards, highlighting an urgent need for localized sediment investigations to mitigate risks associated with heavy metal ingestion (Tang et al., 2021).
The current study aims to bridge these gaps by determining the total concentrations and bioavailable fractions of heavy metals in Nworie and Otamiri River sediments using the BCR method and assessing ecological risk through indices such as the Geo-accumulation Index and Potential Ecological Risk Index. Additionally, it seeks to identify contamination sources using multivariate statistical approaches. Such efforts are critical in enhancing our understanding of heavy metal dynamics within tropical river systems and informing future policy and sustainable management efforts in Imo State and similar contexts in West Africa (Martín-Lara et al., 2020).
2. Materials and Methods
2.1. Study Area
Nworie and Otamiri rivers are in an Imo State, southeastern Nigeria (with a center of around 5.485°N, 7.035°E), located in a tropical rainforest climate, with an annual rainfall of 2250-2500 mm and an average temperature of 27°C. The Nworie river, with a length of about 9.2 km, starts in the northwest of Owerri and flows into the Otamiri river which has a length of about 30 km after which it becomes a unified stream and flows downstream. The locations of the eight sampling stations were strategically chosen, SS1-SS3 were along the Nworie River (upstream urban areas), SS4 was on the Otamiri River (pre-confluence areas), and SS5-SS8 were located along the mixed downstream reach (post-confluence urban-industrial areas). A gradient of man-made criteria is attained by these stations, residential run-offs, roadside discards at motor parks in Owerri, and effluents at industrial estates.
2.2. Sample Collection
Sediment sampling in eight stations was carried out in triplicates bimonthly from September 2022 to July 2023. This ensured the inclusion of the wet season (April-October) and the dry season (November-March) to check seasonal variation. Surface sediments (0-10 cm depth) were collected using a stainless steel Van Veen grab sampler (capacity: 0.5 L) at each station, which yielded a total of 24 samples per month and 192 samples in 6 sampling events. The samples at mid-channel locations were collected to make it representative, and coordinates were recorded with the help of a hand-held GPS receiver (Garmin eTrex 10, accuracy ±3 m). The samples were placed in pre-cleaned, acid-washed polyethylene bags, with station and date details placed on the bag, and placed in a cooler at 4°C to transport them to the laboratory. The air-drying of the sediments in the lab at room temperature (25–28°C) over 72 hours in the absence of dust was followed by a gentle agate mortar and pestle crushing to break the aggregates before analyzing them.
2.3. Total Metal Concentration Analysis
To remove coarse particles, a 2-mm stainless steel mesh was used to sieve the dried sediments. 0.5g of the subsamples were digested in a microwave system (Milestone Ethos Easy) where 9 mL of 65% concentrated nitric acid (Merck) and 3 mL of 37% hydrochloric acid (Sigma-Aldrich) were added in a volumetric ratio of 3:1 (aqua regia). The digestion was carried out by heating from 25 oC to 180 oC in 15 minutes and then allowing it to stand for 20 minutes at 180 oC. The extracts were filtered with Whatman No. 42 filter paper and then cooled and diluted to 50 mL with ultrapure water (resistivity 18.2 MΩ cm) and stored at 4 °C. An atomic absorption spectrophotometer (PerkinElmer PinAAcle 900T) was used to determine the concentration of arsenic, cadmium, chromium, iron, manganese, nickel, lead, and selenium. The instrument setup consisted of a graphite furnace used to analyze As, Cd and Se, while a flame module was used to determine Cr, Fe, Mn, Ní and Pb. The standard of calibration of instruments was multi-element standards (Merck Certipur) and the detection limits were set at 0.001 mg /kg for Cd, 0.005 mg /kg for As and Se, and 0.01 mg/ kg for Cr, Fe, Mn, Bi and Pb. Quality control measures included triplicate blanks per batch, duplicate samples, which formed 10 per cent. of the total set of samples, and analysis of a certified material (NIST 2711a Montana Soil 2) with recoveries ranges of 95%-105%.
2.4. Speciation Analysis (BCR Sequential Extraction)
BCR sequential extraction method was applied to 0.5 insert of sieved sediment to segregate the metals into four separate fractions, according to the modified procedure suggested by Šorša et al. (2023).
- Acid soluble fraction (F1): This was extracted from the sample by using 20 ml of 0.11M acetate buffer (pH 2.8) over 16 hours at 25 oC on an orbital shaker with a speed of 200 rpm. This step targets exchangeable and carbonate bound metal species.
- Reducible fraction(F2): 20mL of 0.5M hydroxylamine hydrochloride (pH1.5, adjusted with HNO3) for 16 hours at 25 oC . The step identifies Fe-Mn oxide bound metals.
- Oxidizable fraction (F3): 5 mL of 8.8⁻ M hydrogen peroxide (pH23) was added to oxidize the residue from F2 for 1 hour at 85 oC. The oxidized material was subsequently treated with 25 mL of 1 M ammonium acetate (pH2) for 16 hours to extract the metals bound to organo-sulfides.
- The residual fraction (F4) was calculated by the digestion of the residue F3 in 12 mL of aqua regia (HNO 3: HCl 1: 3) at 120 oC on a hot plate, to remove the refractory metal component.
After extraction, the solutions were centrifuged at 4000 rpm for 20 minutes and filtered using 0.45 -membranes and then diluted to 50 ml. The determination of metals was done using atomic absorption spectrophotometry, and the summation of fractions F1-F4 compared to the total digestion to determine the percentages of recovery that ranged between 85% and 115% and was checked against certified reference materials (CRMs).
Strict quality-control (QC) measures were adopted during both the sampling and analysis stages in order to prevent the loss of data integrity and the accuracy of the analysis. Eight stations were sampled (SS1 to SS8) bimonthly between September 2022 and July 2023 and sampled in triplicate with a pre-cleaned stainless-steel grab sampler. Samples were kept in 48 h and at 4 -C in polyethylene containers which were acid washed to reduce degradation. Sequential extraction of BCR was done simultaneously with certified reference material (e.g. BCR -701), with recovery rates of 92-105 percent of all fractions (F1 -F4) of target metals (As, Cd, Cr, Fe, Mn, Ni, Pb, Se). Multi-element standard solutions (Merck, 1000 -1 mL) were used to calibrate the AAS with a coefficient of variation (CV) (less than 5 per cent among replicates). Blank samples (n : 3/batch) were also run to determine contamination, which gave low concentrations (<0.01mg/Kg). Accuracy was confirmed by the redundancy of analysis (n : 10⁻ 10 percent of samples), and relative standard deviations (RSD) were 8 percent or lower. Precision was also established by spiking known concentration of metals to individual samples yielding recoveries of 95 103. Field equipment (e.g., GPS units, pH meters) were calibrated daily, all reagents of analytical grade were prepared with ultrapure water (18.2M -1 cm). ANOVA and Tukey post-hoc test (p<0.05) were used to statistically analyse data, which guaranteed a high level of interpretation of spatial and temporal variability.
2.5. Ecological Risk Assessment
Ecological risks were evaluated using three indices:
- Geo-accumulation Index (Igeo): Igeo : log₂(Cₙ / 1.5Bₙ), where Cₙ is the measured total concentration and Bₙ is the geochemical background value (e.g., As : 5 mg/kg, Cd : 0.3 mg/kg, from Turekian & Wedepohl, 1961, adjusted for local shale).
- Enrichment Factor (EF): EF : (Cₙ/Cᵣₑf)/(Bₙ/Bᵣₑf), with Fe as the reference element (Bₙ : 47,200 mg/kg), normalizing anthropogenic enrichment.
- Potential Ecological Risk Index (PERI): PERI : ΣEᵣⁱ, where Eᵣⁱ : Tᵣⁱ × (Cₙ/Bₙ), and Tᵣⁱ is the toxic response factor (As : 10, Cd : 30, Cr : 2, Ni : 5, Pb : 5, Fe : Mn : Se : 1). Background values were sourced from regional sediment studies where local data were unavailable.
2.6. Statistical Analysis
Data were analyzed with SPSS v.27.. To assess how the spatial (sampling station) and temporal (bimonthly interval) variables affect the total metal concentrations and each of their fractions, a two-factor ANOVA test was used, Tukey’s post-hoc was used to carry out pairwise comparisons with the 5% significance level (α = 0.05). Further analyses in correlation were performed to determine the relationship between the bioavailable fractions (F1 + F2) and the risk indices by using Pearson’s correlation. To explain possible source contributions, a Principal Component Analysis was performed on the standardized matrix of metal concentrations (z -scores ) and the components were kept according to the Kaiser criterion (eigenvalues >1) the factor loadings and scores were then shown via biplots.
3. Results
3.1. Total Concentrations and Speciation
The total concentrations of heavy metals, which have been measured as sums of BCR sequential extraction fractions (F1-F4) and averaged between triplicates over 6 bi-monthly sampling campaigns (September 2023-July 2024), showed great dissimilarity among eight stations (SS1-SS8) along the Nworie and the Otamiri Rivers. Cadmium (Cd) ranged at 0.05-mg kg -1 at SS6 down to 2.41-mg kg -1 at SS7, lead (Pb) at 0.03-mg kg -1 at SS6 down to 8.07-mg kg -1 at SS7, and at SS1, iron (Fe) at 8.39-mg kg -1. Cd (maximum of 73 per cent at SS5, 1.76 mg kg -1) and Pb (maximum of 62 per cent at SS7, 5.01 mg kg -1) had significantly high bioavailable fractions (F1+F2) that added to risk in a dynamic environmental situation. Fe and manganese (Mn) were largely residual (F4, to 85 0.0 percent at SS1, 104.39 mg kg -1). Smaller amounts were found in arsenic (As) and selenium (Se): As: 0.07 0.24mgkg -1; Se: 0.04 1.77mg⁻1) with the latter peaking in F4 at SS6 (1.58⁻1mg/kg).

Table 1.
Mean Total Concentrations (mg/kg) of Heavy Metals Across Sampling Stations.
| Metal | SS1 | SS2 | SS3 | SS4 | SS5 | SS6 | SS7 | SS8 |
| As | 0.09 | 0.07 | 0.09 | 0.24 | 0.13 | 0.09 | 0.15 | 0.09 |
| Cd | 0.53 | 1.42 | 0.60 | 0.26 | 2.41 | 0.12 | 0.87 | 0.34 |
| Cr | 4.21 | 2.47 | 7.75 | 0.26 | 6.48 | 0.27 | 3.55 | 5.89 |
| Fe | 121.15 | 67.24 | 23.63 | 16.27 | 72.51 | 8.39 | 47.89 | 54.46 |
| Mn | 5.29 | 19.87 | 2.83 | 2.47 | 11.20 | 8.25 | 7.02 | 1.30 |
| Ni | 3.03 | 4.49 | 2.49 | 0.36 | 6.45 | 1.65 | 5.37 | 1.50 |
| Pb | 4.73 | 6.93 | 5.09 | 2.87 | 7.34 | 0.03 | 8.07 | 4.52 |
| Se | 0.08 | 0.04 | 0.09 | 0.12 | 0.18 | 1.77 | 0.18 | 0.18 |
Note: Values are means of triplicates from six sampling events (n : 192).
3.2. Bioavailability Dynamics
Fractional (F1+F2) Cd, Pb, and Ni exhibited a strong spatial and temporal variation (Figure 1). Cd = 1.76 mg/kg -1 at SS5 (F1: 1.053 mg/kg -1, F2: 1.075 mg/kg -1), Pb = 5.01 mg/kg -1 at SS7 (F1: 2.185mg/kg -1, F2: 1. 072mg/kg -1), and Ni = 4.81 mg/kg -1 at SS7 (F1: 1.062mg/kg -1, F The two-way ANOVA showed that there were significant spatial (F=12.34, p <0.01) and temporal (F=8.67, p <0.05) effects. The post-hoc test of Tukey proved the Cd at SS5 to be higher than SS1-SS4 and SS6-SS8 (p 0.01), and Pb at SS7 to be higher than SS1-SS6 (p 0.03). Peaks of Cd and Pb were significantly greater in March 2024 compared to September 2023 with Cd at SS2 (0.75 mg kg 1) and Pb at SS8 (1.49 2 3).
3.3. Risk Assessment Code (RAC)
Risk Assessment Code (RAC), which was determined as the percentage of the acid-soluble fraction (F1) to the total concentration, determined the instant risks of bioavailability (Table 2). At SS2 (53%), SS5 (44%), and SS7 (33%), Cd demonstrated high risk (>30), which represents rather high mobility. Pb was medium-risk (1130 percentage) at several stations with a maximum of SS7 (27 %) and Ni was medium risk at SS7 (20 %). Other metals (As, Cr, Fe, Mn, Se) were always low risk (<10%), with low fractions of F1.
3.4. Geoaccumulation Index (Igeo)
Igeo was used to assess sediment contamination with regards to the geochemical background levels (Table 3). Cd was moderately contaminated (Igeo 1 -2) at SS2 (1.58) and SS5 (2.34), and Pb at SS7 (1.01). Other metals (As, Cr, Fe, Mn, Ni, Se) tended to have Igeo = 0, which implies that there is minimal enrichment above naturally occurring levels in all stations
3.5. Potential Ecological Risk Index (PERI)
The Ecological risk was measured by a Potential Ecological Risk Index (PERI), which had a minimum of 67 at SS8 and a maximum of 285 at SS5 (Table 4). The highest contribution was Cd at Eᵣⁱ up to 241 at SS5 (Cₙ : 2.41 mg/kg, Bₙ : 0.3 mg/kg, Tᵣⁱ : 30), followed by Pb with Eᵣⁱ up to 20 at SS7 (Cₙ : 8.07 mg/kg, Bₙ : 20 mg/kg, Tᵣⁱ : 5). Potentially bioavailable fractions (F1+F2+F3) suggest additional risk under environmental shifts, particularly at downstream urban stations.
3.6. Source Apportionment
The Principal Component Analysis (PCA) on standardized fraction concentrations (z -scores) was informed by total potentially bioavailable (F1+F2+F3) and residual (F4) concentrations o all eight metals across stations (Figure 2, Table 5), and 78 percent of the variance (Figure 3) were explained. The group Cd, Pb, and Ni (0.89, 0.82, 0.76) was named PC1 (54%), which was highly correlated with F1+F2+F3 (r=0.85 between Cd-Pb, p=0.01), which was indicative of association with anthropogenic sources (e.g., urban runoff, industrial inputs). Fe and Mn (loadings: 0.87, 0.83) were incorporated in PC2 (24 %), which was linked with F4 (r = 0.78, p < 0.05) indicating geogenic sources. As, Cr, and Se had lesser loadings (e.g., As = 0.25, 0.20), they contributed less, because they had low F1 + F2 + F3, and their fractions of F4 varied.
4. Discussion
This study highlights the complex bioavailability patterns and ecological hazards of the heavy metals in the sediments of the Nworie and Otamiri Rivers and indicate very strong spatial and temporal patterns enhanced by the environment in the tropics and anthropogenic inputs. Addition of the oxidizable fraction (F3) to F1+F2 increases the potentially bioavailable pool (F1+F2+F3), with Cd of 1.95mg/kg at SS5 (81% of total), Pb 5.81mg/kg at SS7 (72%), and Ni 5.37mg/kg at SS7 (100%) exceeding the previously determined F1+F2 values (73% 62% and 89% respectively). The Tukey’s test established high Cd down the line (SS5 > SS1 -SS4, SS6 -SS8, p <0.01), wet-season peaks (such as Pb at SS8: 2.03 mg/kg, March 2024, p < 0.05 vs. September 2023). Seasonal hydrodynamics such as enhanced amounts of rain and surface runoff during wet seasons, seem to redistribute metal-containing particles and augment metal movement out of sediment stores, in line with new evidence of seasonal change in heavy-metal concentrations of sediments and ecological danger indicators of coastal and river settings. This aligns with findings of Hossain et al. (2023) that seasonal fluctuation of heavy metals in sediments of coastal wetlands showed greater levels of metals in the post-monsoon seasons in the Bay of Bengal indicating better remobilization during high runoff and hydrological connection.
The complexity of sediment-related heavy metals and the ecological risk portraits across landscapes gradients have been highlighted by recent studies in Nigeria's freshwater ecosystems, using indices like PERI and RAC that reflect a range of potential ecological risks within the system. A recent study on sediment in Southeast Nigeria employed PERI and RAC to characterize contamination and risk patterns at multiple surface water stations revealed moderate to high ecological risk for Cd and Cr at several stations, while Zn and Pb had lower risk profiles. These results are consistent with the results in this study, in which Cd, Pb, and Ni had higher labile fractions and higher risk contributions downstream, where the PERI reached 285 at SS5. This was much higher than the peak of 127.48 observed in the Adyar and Cooum rivers in India (Gopal et al., 2025). However, the results aligned with the studies in Ifite Ogwari and in Nigeria where maximum PERI values >200 were recorded, with Pb (F1) at 15%, much less than Nworie-Otamiri with RAC (27%) and F1 +F2 +F3 (72%) which was attributed to the increasing pressures of urban development (Okafor et al., 2024). Ni, which was earlier underestimated, is also high at SS7 (F1+F2+F3 :5.37 mg/kg) which also increases the risk at the confluence. This risk is amplified by the F3 fraction which is enriched by urban runoff and untreated sewage (RAC 25%), similar to the Adyar and Cooum rivers (Gopal et al., 2025). The F1+F2+ F3 of Pb at SS7 (72%) is very high and Locally, Dan et al. (2024) found a PERI of 150 in the Cross River, Nigeria, with Pb at 15% F1, much less than Nworie-Otamiri at 27% RAC in SS7 and 25% in SS2 much of which was attributed to urban Owerri. The high fraction of F1+F2+F3 of Pb and Ni is an indicator of chronic threats to aquatic life and bioaccumulation which poses a threat to fish stocks that are crucial in local diets. The sensitivity of the F3 fraction to anoxia, an occurrence that prevails in tropical wet seasons, might enhance metal release increasing the PERI value higher than what was observed. These metrics indicate that Nworie and Otamiri rivers have potential high ecological risks and the possibility of mobilization of F3 by redox changes in the future presents long term dangers in benthic ecosystems, fish bioaccumulation, and human health through food chain in an area that depends on riverine resources.
The result of the geo-accumulation Index (Igeo) reveal that sediments ranked mostly between not contaminated and moderate contamination of sediments by Cd at SS2 and SS5 and Pb at SS7 but As, Cr, Fe, Mn, Ni, and Se were at natural background levels (Igeo < 0). This trend is indicative of some location specific anthropogenic impact, probably attributed to urban runoff, waste disposal and agricultural inputs, especially with Cd, which is highly mobile. Similar findings were reported by Cüce et al., (2022) in the Kızılırmak River in Turkey, the Cd Igeo was higher in areas that received domestic and industrial water discharge, and in the lower reaches of the River Niger, where the Cd contamination was attributed to strong anthropogenic pressure in the urban catchment (Ezewudo et al., 2023). The SS7 Pb contamination is isolated and in line with the results in the Abesan and Owo Rivers in Lagos, and urban areas of the Ganga River, India, where the Pb enrichment was associated with traffic emissions and local industrial inputs (Akoteyon, 2022; Das et al., 2023). Collectively, the findings show that the current geochemical conditions of the sediment environment are good, but the observed Cd and Pb enrichments are early warning signs that should be observed constantly in order to avoid possible ecological and bioavailability-related threats.
The results reveal that apart from Cd, Ni and Pb, the other metals (Cr, Fe, Mn, As and Se) were predominantly in their residual state. This aligns with similar studies in the Gomishan river in Iran (Kachoueiyan, 2024), the Straits of Johor in Malaysia (Hamzah et al., 2023) and regionally in the sediments of River Rwizi in Uganda (Nijeje et al., 2023). Locally, Nwoke et al., found similar results in the New Calabar river as most metals were found to be in the residual state. However, evidence of metals speciation in sediments of the in the Cross River Estuary (Gulf of Guinea) indicate that non-residual metal fractions (exchangeable, reducible, oxidizable) dominated the bio-available pool which may give rise to ecological hazard, especially to those with high mobility such as Cd and Pb (Dan et al., 2022). Similar to the findings in this study, over 50% of the Pb and Cd in sediments the Cross River Estuary was observed to be in non-residual forms (Dan et al., 2022), which is indicative of a large labile fraction that can be altered by environmental dynamics such as redox changes or by decomposition of organic matter (Dan et al., 2022). This tendency supports the fact that the ecological importance of fractionated metals can be underestimated.
The ecological risk outcomes of the indices used including PERI and RAC reveal that Cd recorded high risks in the tropical river sediments as it has a high toxicity coefficient and mobility compared to other metals. A study on the heavy-metal contamination of the Omambala River sediments, Southeastern Nigeria, identified Cd as a major contaminant with a high ecological risk quotient, which can be interpreted as Cd is of high risk to the area with large urban and diffuse inflows. Performance-based high values of Cd in this study are consistent with these results and support the importance in this study of monitoring and mitigation measures within the affected watersheds.
Multivariate statistical methods such as the Principal Component Analysis (PCA) were employed in the study to determine the source contributions and controlling factors of sediment metals. The common anthropogenic sources of various highly bioavailable metals in the PCA loadings have been similar to other urban sediment studies that point to runoff of urban areas, release of domestic waste, and automobile emissions). As an example, PC1 contributions of Fe, Zn, Ni, Cd, and Cr by Warri River research on sediments demonstrated that PC1 has an anthropogenic component, whereas other components were attributed to a geogenic component. The environmental consequences are profound including the high potential bioavailability of Cd and As which is a potential risk to aquatic organisms and may disrupt the food chain. The urban risks associated with Nworie and Otamiri rivers are high and require urgent action such as dredging or phytoremediation to prevent the destruction of ecosystems.
6. Conclusions
This study underscores the Nworie and Otamiri Rivers as critical hotspots of heavy metal bioavailability and ecological risk, driven by urban anthropogenic inputs and tropical environmental dynamics. Cd, Pb, and Ni’s high F1+F2+F3 fractions (up to 81%, 72%, 100% of totals) at downstream stations (SS5–SS7), coupled with PERI peaks (285) and RAC exceeding 30%, confirm their dominance in posing immediate and potential risks, far exceeding many global and local counterparts. PCA delineates anthropogenic (Cd, Pb, Ni) from geogenic (Fe, Mn) sources, with F3’s inclusion highlighting long-term threats under shifting conditions. These findings demand targeted sediment management such as dredging, phytoremediation, or constructed wetlands, to mitigate bioaccumulation and safeguard local ecosystems and communities, positioning this tropical river system as a priority for environmental intervention. The study did not assess F3 concentrations under varying redox conditions. These results highlight the chronic risks to benthic communities and fish-reliant human ones, hence the need to urgently remediate the sediments. Further research should attempt to quantify F3 release rates using controlled anoxic experiments to refine PERI estimates in order to enhance understanding of bioavailability dynamics and inform precise mitigation strategies, addressing the escalating environmental challenges in this urban-tropical nexus. These findings highlight the need for constant monitoring of the waterways to mitigate long-term ecological and human health effects of this tropical urban river systems.
Conflicts of Interest
The authors declare that there is no conflict of interest.
References
- Akoteyon, I. S. (2022). Sediment quality assessment of rivers Abesan and Owo in parts of Lagos, Nigeria. Ife Journal of Science, 24(2), 309-322.
- Ali, H., Khan, E., & Ilahi, I. (2019). Environmental chemistry and ecotoxicology of hazardous heavy metals: Environmental persistence, toxicity, and bioaccumulation. Journal of chemistry, 2019(1), 6730305. [CrossRef]
- Cüce, H., Kalipci, E., Ustaoglu, F., Baser, V., & Türkmen, M. (2022). Ecotoxicological health risk analysis of potential toxic elements accumulation in the sediments of Kızılırmak River. International Journal of Environmental Science and Technology, 19(11), 10759-10772.
- Dan, S. F., Udoh, E. C., Zhou, J., Wijesiri, B., Ding, S., Yang, B., Lu, D. & Wang, Q. (2022). Heavy metals speciation in surface sediments of the Cross River estuary, Gulf of Guinea, South East Nigeria. Marine Pollution Bulletin, 185, 114257. [CrossRef]
- Das, B. K., Kumar, V., Chakraborty, L., Swain, H. S., Ramteke, M. H., Saha, A., Das, A., Bhor, M., Upadhyay, A., Jana, C., Manna, R.K & Gupta, S. D. (2023). Receptor model-based source apportionment and ecological risk assessment of metals in sediment of river Ganga, India. Marine Pollution Bulletin, 195, 115477. [CrossRef]
- Emon, J. F., Rohani, M. F., Sumaiya, N., Tuj Jannat, M. F., Akter, Y., Shahjahan, M., ... & Goh, K. W. (2023). Bioaccumulation and bioremediation of heavy metals in fishes—a review. Toxics, 11(6), 510. [CrossRef]
- Ezewudo, B. I., Mgbenka, B. O., Islam, M. S., Proshad, R., & Odo, G. E. (2023). Appraisal of metal contamination in sediments of lower reaches of Niger River, Nigeria, using contamination indices and sediment quality guidelines. International journal of environmental analytical chemistry, 103(11), 2616-2635. [CrossRef]
- Fu, C., Li, X., Ma, J., Gao, M., Bai, Z., & Liu, C. (2023). Heavy metal (loid) s contamination assessment of soils in Shendong coal base of the Kuye River basin, China: spatial distribution, source identification and ecological risk. Environmental Earth Sciences, 82(21), 498. [CrossRef]
- Giao, N. T., Nhien, H. T. H., & Anh, P. K. (2022). Evaluating Ecological Risk Associated with Heavy Metals in Agricultural Soil in Dong Thap Province, Vietnam: 10.32526/ennrj/20/202200114. Environment and natural resources journal, 20(6), 585-597. [CrossRef]
- Hamzah, H. A., Kadhum, S. A., Zulkifli, S. Z., Abed, S. A., Awad, A., & Al-Ansari, N. (2023). Heavy metal speciation in surface sediments and their impact on the bioaccumulation of green mussels (Perna viridis) from the eastern part of the Straits of Johor, Malaysia. Total Environment Research Themes, 7, 100064. [CrossRef]
- Hossain, M. B., Sultana, J., Jolly, Y. N., Nur, A. A. U., Sultana, S., Miazee, R., Islam, M. S., Paray, B. A., Arai, T., & Yu, J. (2023). Seasonal variation, contamination and ecological risk assessment of heavy metals in sediments of coastal wetlands along the Bay of Bengal. Marine pollution bulletin, 194, 115337. [CrossRef]
- Huang, L., Rad, S., Xu, L., Gui, L., Song, X., Li, Y., ... & Chen, Z. (2020). Heavy metals distribution, sources, and ecological risk assessment in Huixian Wetland, South China. Water, 12(2), 431. [CrossRef]
- Kachoueiyan, F., Karbassi, A., Nasrabadi, T., Rashidiyan, M., & De-la-Torre, G. E. (2024). Speciation characteristics, ecological risk assessment, and source apportionment of heavy metals in the surface sediments of the Gomishan wetland. Marine Pollution Bulletin, 198, 115835. [CrossRef]
- Mao, C., Du, S., Zhang, G., Wang, Y., & Rao, W. (2022). Spatial distribution and ecological risk assessment of heavy metals in the sediment of a tropical mangrove wetland on Hainan Island, China. Water, 14(22), 3785. [CrossRef]
- Martín-Lara, M. A., Calero, M., Ronda, A., Iáñez-Rodríguez, I., & Escudero, C. (2020). Adsorptive behavior of an activated carbon for bisphenol A removal in single and binary (bisphenol A—heavy metal) solutions. Water, 12(8), 2150. [CrossRef]
- Masindi, V., & Muedi, K. L. (2018). Environmental contamination by heavy metals. Heavy metals, 10(4), 115-133.
- Nijeje, E., Senyonjo, A., Sahan, S. J., Byamugisha, D., & Ntambi, E. (2023). Speciation of selected heavy metals in bottom sediments of River Rwizi, Mbarara City, Uganda. Water, Air, & Soil Pollution, 234(3), 193. [CrossRef]
- Nwoke, I. B., Uwah, E. I., Inam, E. J., Udosen, I. E., & Udosen, E. D. (2022). Speciation of trace metals in sediment of a tropical river. Journal of Chemical Society of Nigeria, 47(6). [CrossRef]
- Okafor, V. N., Omokpariola, D. O., Tabugbo, B. I., & Okoliko, G. F. (2024). Ecological and health risk assessments of heavy metals in surface water sediments from Ifite Ogwari community in Southeastern Nigeria. Discover Environment, 2(1), 93. [CrossRef]
- Raji, I. B., & Palamuleni, L. G. (2023). Toxic Heavy Metals in Soil and Plants from a Gold Mining Area, South Africa. In Heavy Metals-Recent Advances. IntechOpen. [CrossRef]
- Singh, P., Kadam, V., & Patil, Y. (2022). Isolation and development of a microbial consortium for the treatment of automobile service station wastewater. Journal of Applied Microbiology, 132(2), 1048-1061. [CrossRef]
- Šorša, A., Durn, G., Grizelj, A., Halamić, J., & Prša Gazilj, L. (2023). Comparison of urban and rural soils based on speciation of heavy metals by BCR sequential extraction procedure: A case study in the historical and industrial city of Sisak, Croatia. Geologia Croatica, 76(2), 87-103. [CrossRef]
- Sun, W., Yang, K., Li, R., Chen, T., Xia, L., Sun, X., & Wang, Z. (2022). Distribution characteristics and ecological risk assessment of heavy metals in sediments of Shahe reservoir. Scientific Reports, 12(1), 16239. [CrossRef]
- Tang, J., Zhu, Y., Wei, Z., Feng, L., Yang, N., Luo, Q., & Kong, T. (2021). Source identification and human health risk of heavy metals in soil: A case study of industrial areas of Northeast China. transportation, 14, 17. [CrossRef]
- Tu, Y. J., Luo, P. C., Li, Y. L., Liu, J., Sun, T. T., Li, G. J., & Duan, Y. P. (2023). Seasonal heavy metal speciation in sediment and source tracking via Cu isotopic composition in Huangpu River, Shanghai, China. Ecotoxicology and Environmental Safety, 260, 115068. [CrossRef]
- Turekian, K. K., & Wedepohl, K. H. (1961). Distribution of the elements in some major units of the earth’s crust. Geological Society of America Bulletin, 72(2), 175–192. [CrossRef]
- Yuan, C. Z., & Wang, X. R. (2022). Identify Priority Control Pollutants and Areas of Groundwater in an Old Metropolitan Industrial Area—A Case Study of Putuo, Shanghai, China. Water, 14(3), 459. [CrossRef]
Figure 1.
Bioavailable Fractions (F1+F2, mg/kg) of Cd, Pb, and Ni Across Sampling Stations.
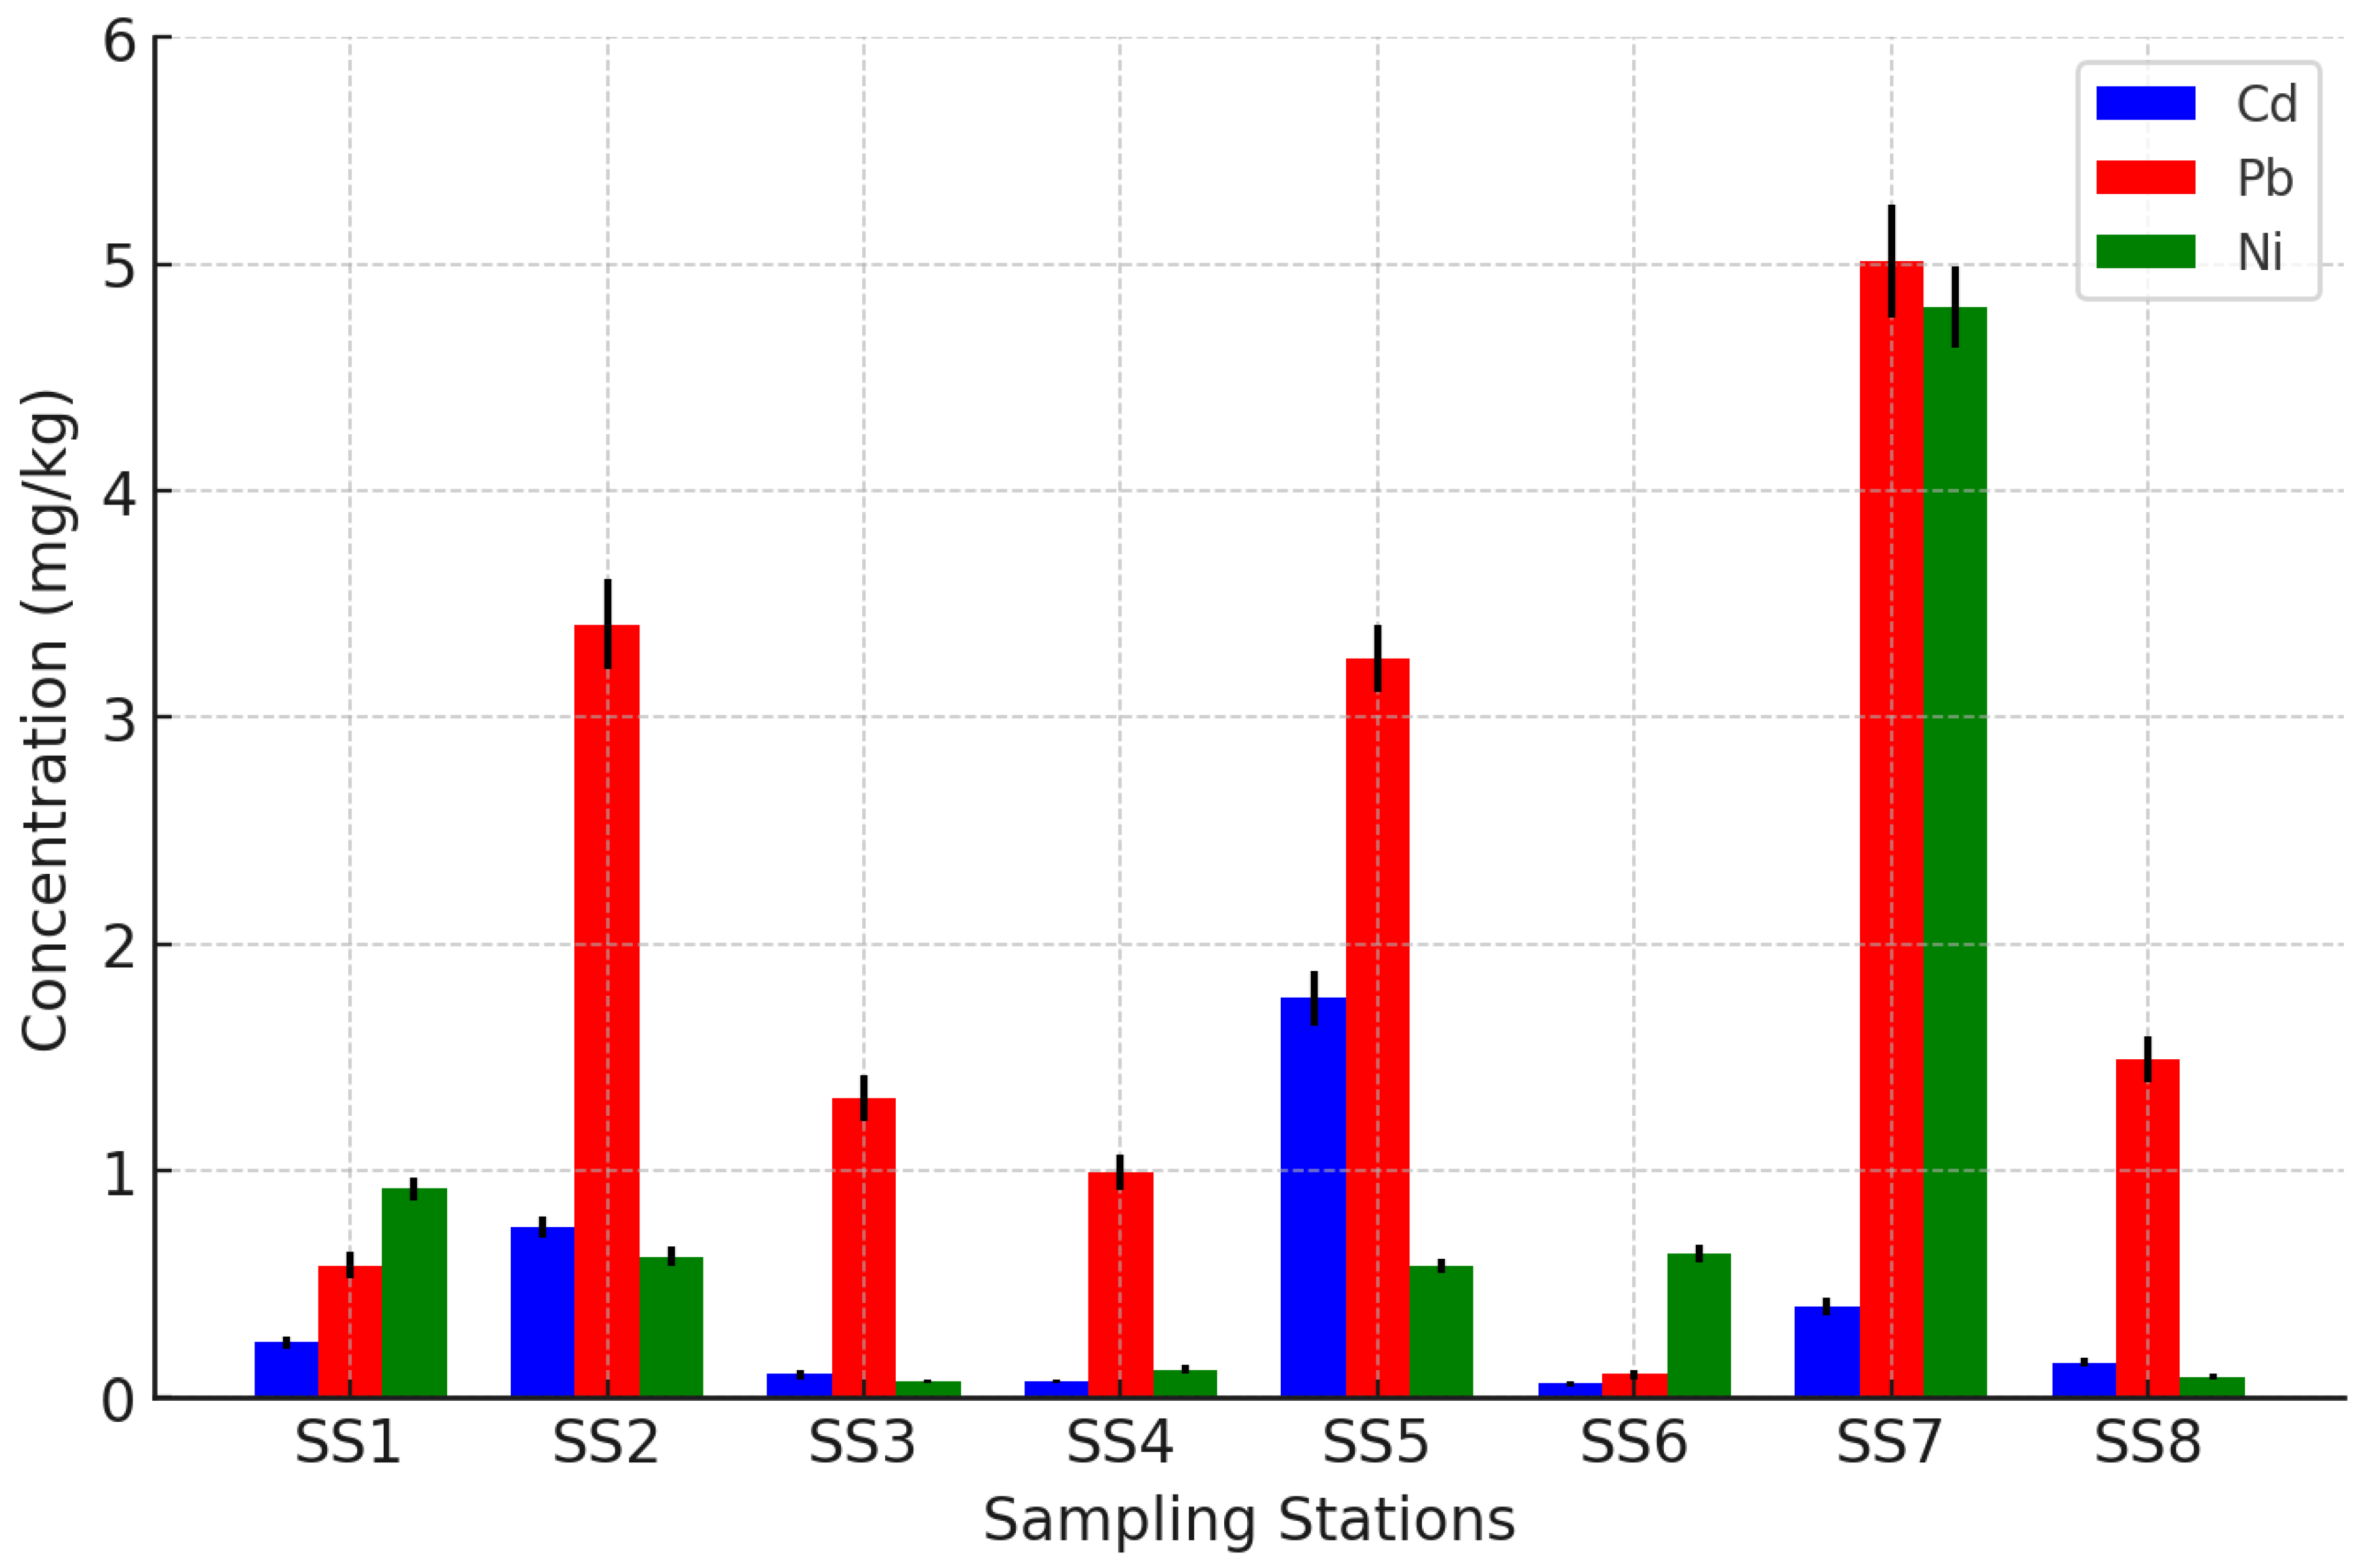
Figure 2.
Potentially Bioavailable Fractions (F1+F2+F3, mg/kg) of All Metals Across Sampling Stations.
Figure 2.
Potentially Bioavailable Fractions (F1+F2+F3, mg/kg) of All Metals Across Sampling Stations.
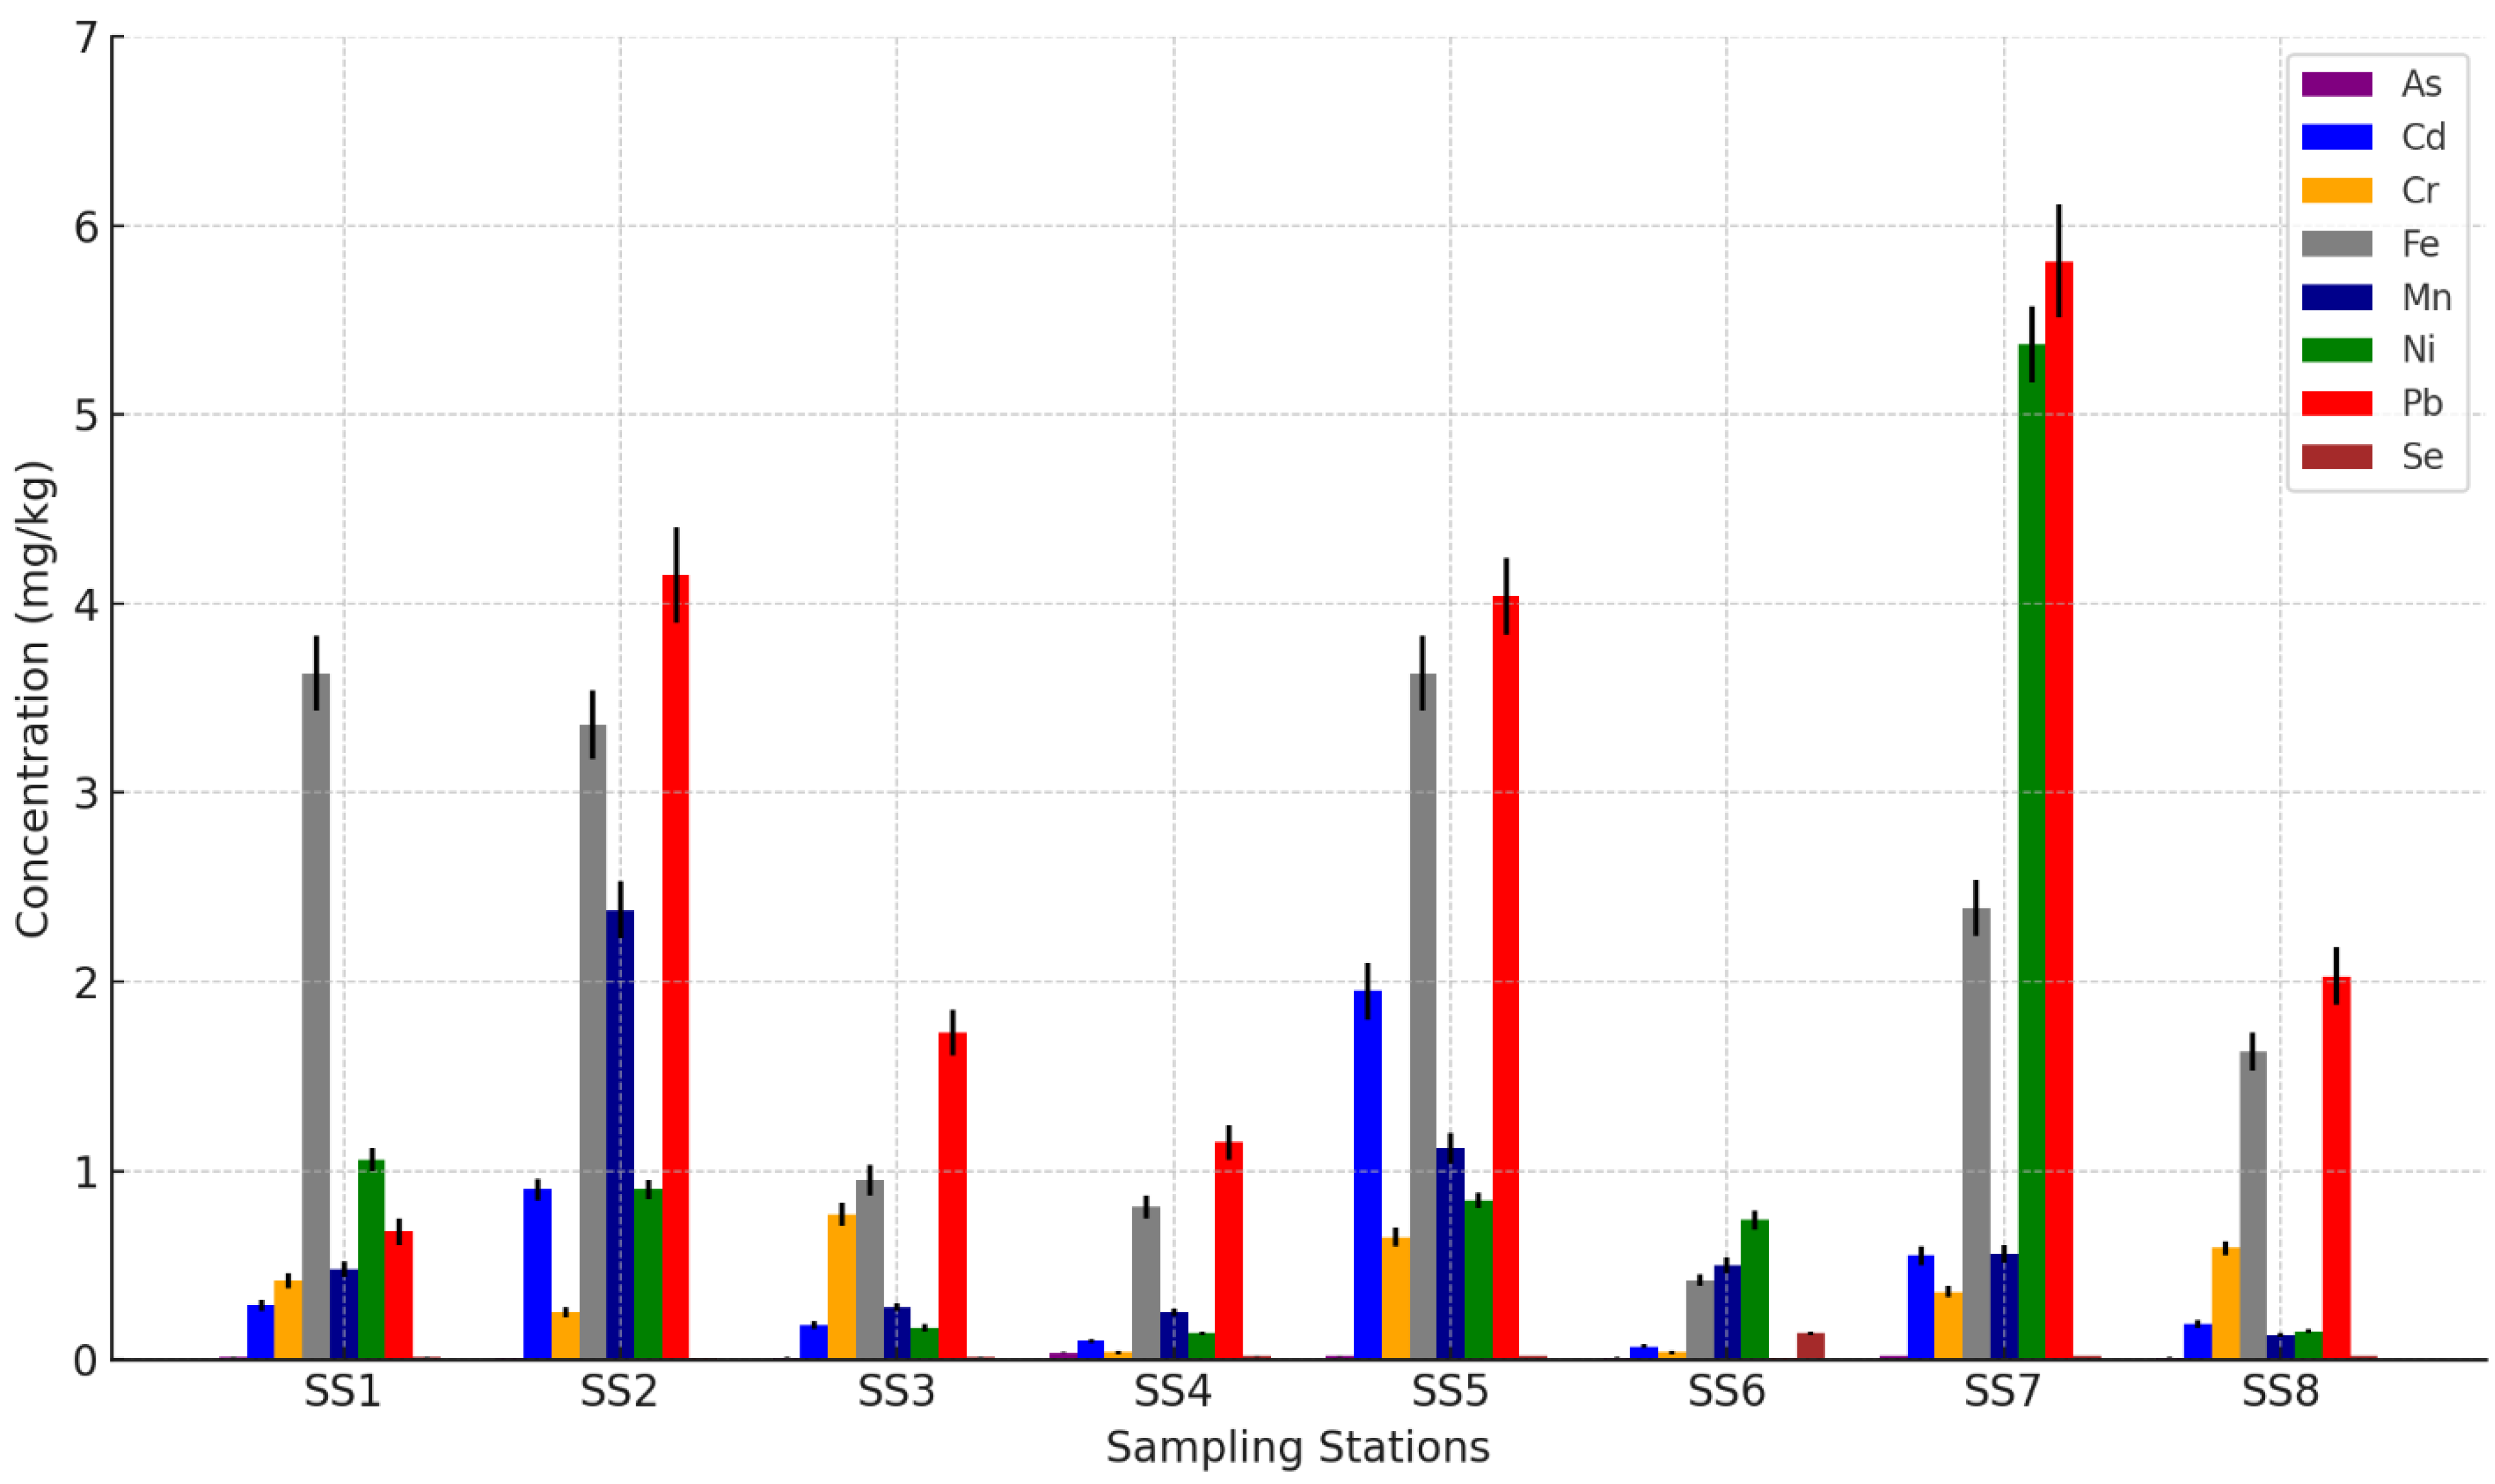
Figure 3.
PCA Biplot of Heavy Metals Across Fractions.
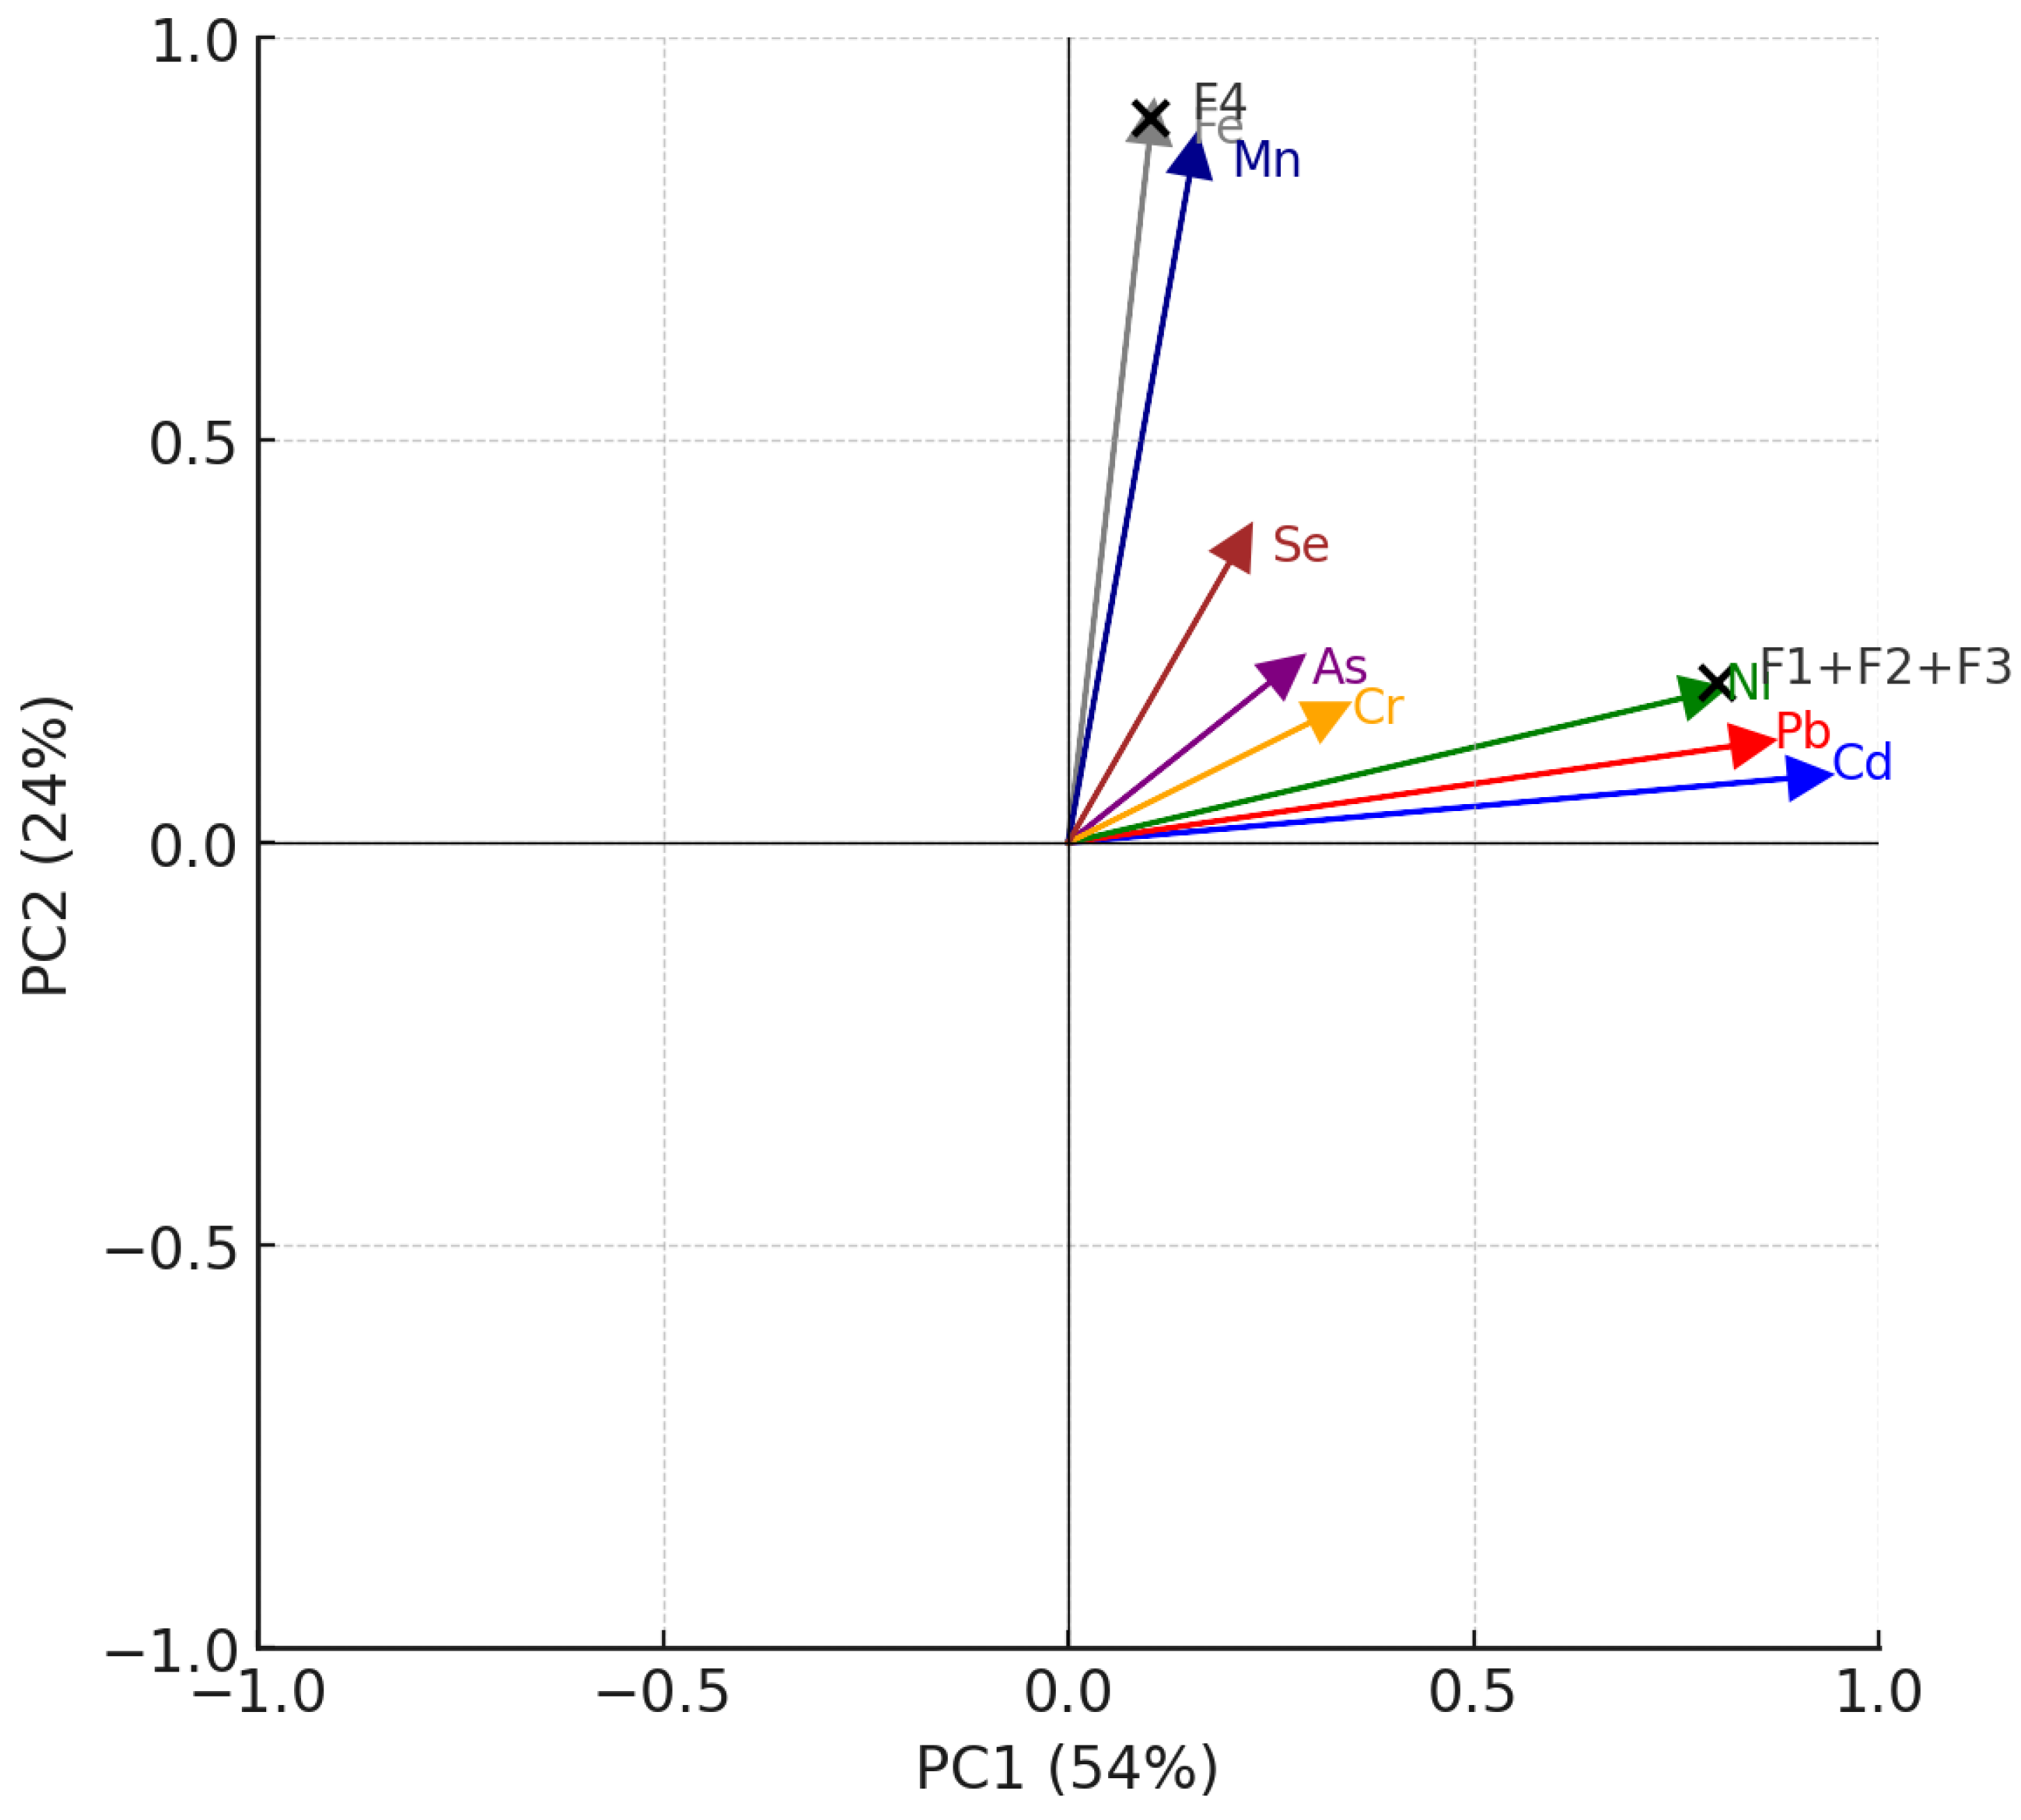
Table 2.
Risk Assessment Code (RAC, % F1) Across Sampling Stations.
| Metal | SS1 | SS2 | SS3 | SS4 | SS5 | SS6 | SS7 | SS8 |
| As | 8 | 7 | 6 | 10 | 8 | 6 | 7 | 6 |
| Cd | 18 | 53 | 12 | 15 | 44 | 8 | 33 | 17 |
| Cr | 5 | 4 | 6 | 8 | 5 | 7 | 4 | 6 |
| Fe | 2 | 3 | 2 | 4 | 3 | 2 | 3 | 2 |
| Mn | 6 | 8 | 5 | 7 | 6 | 4 | 5 | 6 |
| Ni | 15 | 12 | 8 | 10 | 9 | 11 | 20 | 7 |
| Pb | 12 | 25 | 15 | 18 | 22 | 10 | 27 | 19 |
| Se | 9 | 8 | 7 | 8 | 6 | 5 | 6 | 7 |
Note: RAC : (F1 / Total Concentration) × 100. Risk levels: <10% (low), 11–30% (medium), >30% (high).
Table 3.
Geoaccumulation Index (Igeo) Across Sampling Stations.
| Metal | SS1 | SS2 | SS3 | SS4 | SS5 | SS6 | SS7 | SS8 |
| As | -3.72 | -3.92 | -3.72 | -2.65 | -3.36 | -3.72 | -3.23 | -3.72 |
| Cd | 0.23 | 1.58 | 0.33 | -0.54 | 2.34 | -1.32 | 0.87 | -0.15 |
| Cr | -3.83 | -4.35 | -2.95 | -5.60 | -3.21 | -5.54 | -3.83 | -3.43 |
| Fe | -2.71 | -3.15 | -4.01 | -4.28 | -3.05 | -4.91 | -3.56 | -3.46 |
| Mn | -2.92 | -1.67 | -3.49 | -3.68 | -2.17 | -2.61 | -2.51 | -4.28 |
| Ni | -2.73 | -2.16 | -3.01 | -5.47 | -1.64 | -3.61 | -1.90 | -3.74 |
| Pb | -1.75 | -1.20 | -1.57 | -2.14 | -1.12 | -5.74 | 1.01 | -1.82 |
| Se | -3.91 | -4.91 | -3.74 | -3.32 | -2.74 | -0.84 | -2.74 | -2.74 |
Note: Igeo : log₂(Cₙ / 1.5Bₙ); Bₙ (mg/kg): As : 5, Cd : 0.3, Cr : 50, Fe : 47200, Mn : 850, Ni : 20, Pb : 20, Se : 0.5. Categories: <0 (uncontaminated), 1–2 (moderately contaminated).
Table 4.
Potential Ecological Risk Index (PERI) Across Selected Stations.
| Station | As (Eᵣⁱ) | Cd (Eᵣⁱ) | Cr (Eᵣⁱ) | Ni (Eᵣⁱ) | Pb (Eᵣⁱ) | PERI |
| SS1 | 3 | 53 | 4 | 8 | 12 | 80 |
| SS2 | 2 | 142 | 2 | 11 | 17 | 174 |
| SS5 | 4 | 241 | 6 | 16 | 18 | 285 |
| SS7 | 5 | 87 | 4 | 13 | 20 | 129 |
| SS8 | 3 | 34 | 6 | 4 | 20 | 67 |
Note: Eᵣⁱ : Tᵣⁱ × (Cₙ/Bₙ); Bₙ (mg/kg): As : 5, Cd : 0.3, Cr : 50, Ni : 20, Pb : 20; Tᵣⁱ: As : 10, Cd : 30, Cr : 2, Ni : 5, Pb : 5. Fe, Mn, Se omitted (Tᵣⁱ : 1).
Table 5.
Residual Fractions (F4, mg/kg) of All Metals Across Sampling Stations.
| Metal | SS1 | SS2 | SS3 | SS4 | SS5 | SS6 | SS7 | SS8 |
| As | 0.06 | 0.05 | 0.06 | 0.16 | 0.09 | 0.06 | 0.10 | 0.06 |
| Cd | 0.19 | 0.47 | 0.35 | 0.12 | 0.45 | 0.04 | 0.29 | 0.12 |
| Cr | 3.60 | 2.12 | 6.63 | 0.18 | 5.55 | 0.19 | 3.04 | 5.04 |
| Fe | 104.39 | 57.13 | 20.07 | 13.82 | 61.63 | 7.13 | 40.71 | 46.29 |
| Mn | 4.49 | 16.89 | 2.40 | 2.10 | 9.52 | 7.01 | 5.97 | 1.11 |
| Ni | 1.66 | 3.02 | 2.02 | 0.20 | 5.29 | 0.91 | 0.43 | 1.23 |
| Pb | 3.47 | 2.11 | 2.75 | 1.39 | 2.62 | 0.01 | 2.06 | 1.54 |
| Se | 0.05 | 0.02 | 0.06 | 0.08 | 0.13 | 1.58 | 0.13 | 0.13 |
Note: F4 estimated as 60–85% of total for Fe, Mn (geogenic); 10–40% for Cd, Pb, Ni (anthropogenic); 60–70% for As, Cr, Se.
Disclaimer/Publisher’s Note: The statements, opinions and data contained in all publications are solely those of the individual author(s) and contributor(s) and not of MDPI and/or the editor(s). MDPI and/or the editor(s) disclaim responsibility for any injury to people or property resulting from any ideas, methods, instructions or products referred to in the content. |
© 2026 by the authors. Licensee MDPI, Basel, Switzerland. This article is an open access article distributed under the terms and conditions of the Creative Commons Attribution (CC BY) license (http://creativecommons.org/licenses/by/4.0/).
Copyright: This open access article is published under a Creative Commons CC BY 4.0 license, which permit the free download, distribution, and reuse, provided that the author and preprint are cited in any reuse.


