
Submitted:
09 January 2026
Posted:
12 January 2026
You are already at the latest version
Abstract
Background/objectives: Diagnostic methods for minimally invasive disease are needed worldwide; Raman spectroscopy is a promising technology. In this study aiming to improve diagnostic technology using Raman spectroscopy, we evaluated a Raman spectroscopic substrate made of a quartz glass fiber sheet to obtain high sensitivity Raman spectra with a high signal-to-noise ratio. Methods: We investigated methods to amplify the intensity of Raman scattered light from humoral biological samples such as serum and urine. We evaluated two methodologies: 1) the needle method (NM) [for capturing Raman spectra by irradiating a droplet of liquid sample at the tip of a fine stainless-steel needle with a laser]; and 2) the quartz sheet method (QSM) [a quartz glass fiber sheet is saturated with a liquid sample, and the sheet surface is irradiated with a laser to obtain Raman spectra]. The Raman spectra of sodium benzoate, sodium sulfate, human serum, and human urine were recorded. Results: The samples crystallized and became concentrated in the quartz glass fiber sheet, allowing Raman spectra with highly intense scattered light to be recorded even from low-concentration samples. The QSM produced scattered light intensity ~7.3 and ~7.8 times higher for serum and urine, respectively, than the NM, which obtains spectra while the sample is still in liquid form. Conclusions: Our QSM enables quick and convenient acquisition of Raman spectra from samples using a very low-cost quartz glass fiber sheet and a standard Raman microscope. The QSM may be useful for obtaining Raman spectra from liquid biological samples with low analyte concentrations.
Keywords:
Raman spectroscopy
; serum
; urine
; quartz glass fiber
; coffee ring
1. Introduction
Raman spectroscopy, a nondestructive analytical technique, can infer the composition and structure of a sample by analyzing the Raman spectrum contained in the scattered light [1]. It is based on a phenomenon first reported in 1928 [2] and is used for component analysis. Although methods for detecting trace substances in liquid samples include antigen–antibody reactions [3], polymerase chain reaction [4], and liquid chromatography [5], Raman spectroscopy is advantageous owing to its ability for quick analysis without sample pretreatment [6], and comprehensive analysis [7], including unknown substances [8]. However, a drawback of typical Raman spectroscopy is its relatively low detection sensitivity [9].
To record the Raman spectrum of a liquid sample, the sample is typically placed in a small container such as a glass bottle [10], a glass [11], or quartz glass [12] and irradiated with a laser. For samples with low concentrations of components, increasing the laser power or prolonging the irradiation time increases the risk of thermal damage to the sample. As the intensity of Raman scattered light is inversely proportional to the square of the wavelength of the excitation light, using shorter wavelength excitation light can produce a Raman spectrum with higher scattered light intensity [13]. However, using shorter wavelength excitation light can result in strong autofluorescence from the sample, resulting in increased noise in the Raman spectrum [14]. Another method involves placing a droplet of the sample onto a surface of glass plate [15] or metal surface such as stainless steel [15] or aluminum [16], and drying it to concentrate it. However, dried samples are often thin, making it difficult to focus the laser on the sample, which can make it difficult to obtain a Raman spectrum with a high signal-to-noise ratio (S/N). Apart from glass and metals, calcium fluoride [17] is also used; however, it generates Raman scattered light, raising concerns that it may affect the Raman spectrum of the sample. Silicon is also used as a substrate for Raman spectroscopy [18], but because silicon also emits Raman scattered light, it is often used in combination with other materials such as silver. Techniques such as surface-enhanced Raman spectroscopy [19], resonance Raman spectroscopy [20], and tip-enhanced Raman spectroscopy [21] have been developed to improve detection sensitivity. Noble metals such as gold [22] and silver [23] are sometimes used as substrates for Raman spectroscopy simply as metals, but they can also be used to obtain surface-enhanced Raman scattering light. It is thought to amplify Raman scattering through the electric field effect caused by surface plasmon resonance [24] and the charge transfer effect caused by charge transfer between adsorbed molecules and the metal surface [25]. However, the extent to which Raman scattering is enhanced is unstable and difficult to control. In resonance Raman spectroscopy, Raman scattering is significantly enhanced when the wavelength of the excitation light approaches or coincides with the electronic absorption band of a molecule. This method can increase the detection sensitivity of specific molecules, but the types of molecules that can be targeted are limited [26]. Tip-enhanced Raman spectroscopy utilizes the electric field enhancement that occurs at the tip of a plasmon-responsive metal tip to achieve nanometer spatial resolution, exceeding the diffraction limit of light. However, it requires specialized equipment and is technically difficult to perform, making its practical application limited [27].
Recently, Raman spectroscopy using blood has been applied for the diagnosis of colorectal cancer [28], lung cancer [29], breast cancer [30], endometrial cancer [31], and head and neck cancer [32]. The use of Raman spectroscopy to analyze urine for prostate cancer diagnosis has also been reported [33]. However, a standard cancer diagnostic technique using Raman spectroscopy has yet to be established. We have been developing disease screening techniques using Raman spectroscopy [34,35]. Our goal was to develop a simple and quick diagnostic technique for several major diseases, including cancer, using biological fluid samples such as serum and urine, overcoming the effects of autofluorescence and low detection sensitivity without compromising the advantages of Raman spectroscopy, such as speed and simplicity [15]. To achieve this, obtaining high-quality Raman spectra with high sensitivity and low noise are necessary. Therefore, we proposed a quartz glass fiber sheet as a substrate for Raman spectroscopy, based on the hypothesis that the sheet will retain the liquid biological sample and that drying will concentrate the components in the sample, increasing the intensity of the Raman scattered light.
2. Materials and Methods
2.1. Test Sample Preparation
In this study, we selected sodium benzoate [36,37] and sodium sulfate [38] as test samples to confirm the changes in the properties of components in a sample applied onto a sheet using quartz sheet method (QSM). These compounds have distinct Raman spectra and demonstrate Raman shift changes between the solid and aqueous solutions. Sodium benzoate (C7H5NaO2, molecular weight 144.1, Wako Special Grade, FUJIFILM Wako Pure Chemical Corporation, Tokyo, Japan) and sodium sulfate (Na2SO4, molecular weight 142.04, Wako Special Grade, FUJIFILM Wako Pure Chemical Corporation, Tokyo, Japan) were used as test samples for developing the measurement methods. To prepare an aqueous solution (1 mol/dm3), each component was dissolved in pure water (Ambion® Nuclease-Free Water, Thermo Fisher Scientific Inc., MA, USA). As verification samples, we used the following: human serum that was collected from a 45-year-old man patient who was determined free from any malignant disease (blood collected on October 20, 2020, before endoscopic treatment for sigmoid adenoma at Showa Medical University Koto Toyosu Hospital) and was stored in a deep freezer (MDF-DC102VH-PJ, PHC Corporation, Tokyo, Japan) at −80 °C; and urine sample that was collected from a 57-year-old male patient treated for transverse colon adenoma at Showa Medical University Koto Toyosu Hospital (determined to be cancer-free, collected on January 12, 2025). The patients (including these two patients with identifiable data) provided written informed consent for participation in this study and for publication of their clinical information in this article.
2.2. Raman Microscope Configuration
The Raman microscope (BaySpec, Inc., San Jose, CA, USA), which contains the excitation light source, had a laser with a wavelength of 1064 nm, an output of 200 mW and a 2048 × 64 pixel thermoelectric cooled charge-coupled device detector (grating resolution, 2 cm-1; range, 105–1711 cm-1; 10× objective lens [LMPlan N 10X IR, numerical aperture: 0.30, Olympus Corporation, Tokyo, Japan]). In our previous study [15], we recorded serum Raman spectra using two laser wavelengths, 785 nm and 1064 nm. The 1064 nm laser spectrum was less affected by autofluorescence and showed reduced noise. Therefore, in this study, the 1064-nm laser was used as the excitation light source. The Pathologic System Software Version 1.0.1.0 (BaySpec, Inc., San Jose, CA, USA) [15] was used for the measurement. When the measurement of the sample began, the Raman spectra of the polypropylene ((C3H6)n) plate (Hikari Co. Ltd., Osaka, Japan) and polystyrene ((C8H8)n) plate (Hikari co. ltd., Osaka, Japan) were recorded as standard substances for calibration. Background and baseline correction were performed without smoothing of the waveform.
2.3. Measurement Procedure
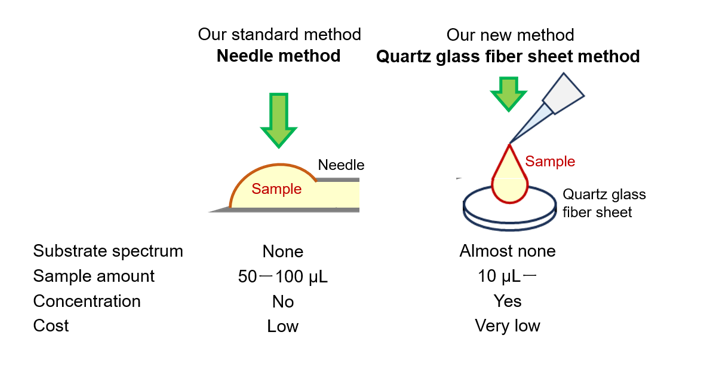
Raman spectra of all samples were recorded by irradiating them with a 1064 nm laser at 200 mw power for 10 seconds. The test sample in the solid state was placed on a stainless-steel plate with a depression (Figure 1a). For both sodium benzoate and sodium sulfate, five spectra were recorded from a single laser focus point on the surface. This measurement was performed four times at positions more than 500 μm apart, and a total of 20 spectra were obtained and averaged. For the liquid samples, two types of methods were verified: a method where the Raman spectra were recorded while the sample was in liquid form (Figure 1b, needle method, NM; Japan Patent No. 7129732), and a method where the Raman spectrum was recorded at the surface of a quartz glass fiber sheet after the sample was dropped onto the sheet (Figure 1c, QSM; patent PCT pending, application number: PCT/JP2024/038092). With the NM, Raman spectra were recorded by irradiating a laser onto a droplet of a sample at 1 mm from a reference point prepared at the tip of a stainless-steel injection needle with an outer diameter of 1.20 mm (NN-1838R, Terumo Corporation, Tokyo, Japan). The laser focus was adjusted between the droplet surface and center. Five spectra were recorded from one droplet and averaged. The NM method requires a relatively large amount of sample, approximately 100 μl, to record a single Raman spectrum, so sodium benzoate and sodium sulfate were measured 20 times, while serum and urine, which have limited amounts, were measured only five times each. With the QSM, a quartz glass fiber sheet (99.6% SiO2, weight 170 g/m 2, thickness 0.95 mm, retention efficiency 98% for liquid particles of size 2.8 μm, retention efficiency 99.9% in 0.3-μm diameter particles in gas) was used. To evaluate the properties of quartz glass fiber sheet in Raman spectroscopy, the Raman spectra of crown glass (Micro Slide Glass, S1111, Matsunami Glass Ind., Ltd., Osaka, Japan), quartz glass (Labo-Slide, 415201-500057-0, Daico MFG Co., Ltd., Kyoto, Japan), and quartz glass fiber sheet were compared. The laser was focused on the glass surface and five Raman spectra were acquired from one point. This measurement was performed five times at positions at least 1 mm apart, and a total of 25 spectra obtained from each measurement were averaged. We designed the shape of the quartz glass fiber sheet to be used for the measurement. We examined a sheet shape on which 10 μL of the sample could reach the edge of the sheet without spilling out, and we decided to apply a quartz glass fiber sheet that was molded into a circle with a diameter of 4 mm. After the quartz glass fiber sheet was placed on a stainless-steel plate, the sample was dropped into the center of the sheet and allowed to dry for 30 min; then, the sample was irradiated using an excitation light laser focused on the sheet surface, and the Raman spectrum was recorded. To confirm the additive effect on scattered light intensity, we also attempted to drop the sample onto the sheet multiple times. When dropping the sample multiple times, the interval between drops was 15 min, and Raman spectra were recorded 30 min after the last drop. For sodium benzoate and sodium sulfate, 20 Raman spectra were recorded from the center of the quartz glass fiber sheet and averaged. For serum and urine, Raman spectra were recorded at positions 0.1, 0.3, 0.5, 1.0, 1.5, and 2.0 mm from the edge of the sheet toward the center to confirm whether there were any differences in the Raman spectra depending on the position on the sheet. The edges of the sheets were determined visually under a microscope. For each measurement point, 50 spectra were recorded consecutively (a total of 300 per sheet) (Figure 1d). The details of the sample types, measurement methods, number of measurement locations, and number of recorded Raman spectra mentioned above are summarized in Table 1. The concentrations of the test samples, sodium benzoate aqueous solution (1 mol/dm3) and sodium sulfate aqueous solution (1 mol/dm3), were calculated when dropped onto a quartz glass fiber sheet. It was assumed that the dropped sample was uniformly distributed on the sheet, that all components in the sample remained within the sheet, and that all water molecules in the sample evaporated. The weight and volume of a quartz glass fiber sheet with a diameter of 4 mm were calculated to be 2.1352 mg and 11.932 mm3, respectively. For the sodium benzoate and sodium sulfate aqueous solutions, the weight percentages for all QSMs exceeded those for NMs. The concentration of sample in three drops measured by QSM is five times more than that measured by NM. Only the weight/volume percentage of sample in one drop measured by QSM was below that measured by NM. The concentration of sample in three drops measured by QSM is approximately two-and-a-half times that measured by NM. (Table 2)
2.4. Data Acquisition and Processing
All the sample preparation and measurements were carried out in a temperature-controlled laboratory at 22–24 °C. The sample was irradiated with a 200-mW laser at 1064 nm wavelength for 10 s. All recorded Raman spectra were averaged.
2.5. Verification of Spreading of Serum on Quartz Glass Fiber Sheet and Quartz Glass Slides
To visually confirm the spreading of serum, serum was dropped onto quarts glass fiber sheets and a quartz glass slide (Labo-Slide, 415201-500057-0, Daico MFG Co., Ltd., Kyoto, Japan). One drop of 10 μL of serum was dropped onto a quartz glass and a quartz glass fiber sheet and allowed to dry. After the serum dried, another 10 μL of serum was dropped onto the dried serum. This process was continued until a total of 10 drops were observed. The quartz glass was observed with the naked eye, and the quartz glass fiber sheet was observed under a microscope.
2.6. Statistical Analysis
We calculated the mean and standard deviation of the scattered light intensity for representative Raman shifts to assess the quality of the data in this study. We also performed statistical tests to confirm differences in the scattered light intensity for specific Raman shifts. We decided to use the parametric Tukey-Kramer test when the measurements are normally distributed and have equal variances. When the measurements are not normally distributed or have unequal variances, we decided to use the non-parametric Steel-Dwass test. For calculations, we used JMP Student Edition, Version 19.0.3 (JMP Statistical Discovery LLC, Cary, NC, USA).
2.7. Using Artificial Intelligence to Proofread Text
To improve clarity and accuracy, artificial intelligence (Google Gemini) was used to correct linguistic errors and to enhance English expressions throughout the manuscript. The manuscript was then checked by an English proofreading expert, and all authors ultimately approved the content of the manuscript.
3. Results
3.1. Evaluation of Substrates for Raman Acquisition
Crown glass exhibited peaks at ~450 cm-1 owing to the symmetric Si-O-Si stretching motion, at ~560 cm-1 owing to the symmetric Si-O-Si bending motion, and at ~990 and 1100 cm-1 owing to the O-Si-O stretching motion of SiO4 tetrahedra. The following peaks were observed in the quartz glass: near 440 cm-1 owing to Si-O-Si bending motion, near 495 cm-1 owing to Si-O-Si bending motion or a four-membered ring, near 604 cm-1 owing to the three-membered ring, near 800 cm-1 owing to Si-O-Si symmetric bond stretching motion or a four-membered ring, and near 1060 cm-1 and a small one near 1200 cm-1 owing to Si-O-Si asymmetric bond stretching motion. In contrast, the Raman spectrum of the quartz glass fiber sheet showed a slight peak of ~200 a.u. owing to Si-O-Si bending motion near 495 cm-1, but no other clear peaks were observed (Figure 2). For QSM, although the Raman spectrum intensity of the quartz glass fiber sheet itself was negligibly weak, background correction using the Raman spectrum was performed to obtain more accurate measurements.
3.2. Numerical Features of Scattered Light Intensity in the Measured Raman Spectrum
The mean values and standard deviations of the scattered light intensity of the Raman spectra of crown glass, quartz glass, quartz glass fiber sheet, sodium benzoate, and sodium sulfate are summarized in Table 3. The mean values and standard deviations of the scattered light intensity of the Raman spectra of serum and urine are summarized in a separate table (Table 4).
3.3. Test Samples
Raman spectra showing characteristic peaks were recorded for each of the solid-state sodium benzoate [32,33] (Figure 3a) and sodium sulfate [34] (Figure 3b). The peaks in the Raman spectra of sodium benzoate (Figure 3a) and sodium sulfate (Figure 3b) recorded by QSM overlapped with the peaks in the Raman spectra of the solids, and no peak shifts were observed, unlike those recorded by NM. For sodium benzoate, the skeletal vibration peak of the benzene ring at 1007 cm-1 had almost identical scattered light intensity in the Raman spectra of the solid and the sample added with three drops by QSM, suggesting saturation of the detection system. For both sodium benzoate and sodium sulfate, the scattered light intensities of the spectra recorded by NM were lower than those recorded by QSM after adding a single drop of the sample. Comparing the spectra recorded by QSM, a positive correlation was observed between the number of added sample drops and the scattered light intensity for both sodium benzoate and sodium sulfate. The Raman spectrum of the sodium benzoate solution did not peak around 1435 cm-1 observed in the solid state but showed a peak around 1393 cm-1 that was not observed in the solid state. Comparing the scattered light intensity of the benzene ring resonance vibration peak around 844 cm-1 for sodium benzoate, the scattered light intensity ratios for the NM, QSM one drop, QSM two drops, QSM three drops, and the solid were approximately 1:3:5:8:12 (Figure 3a). The Raman spectrum of the sodium sulfate solution did not show the peak around 994 cm-1 observed in the solid state but did show a peak around 980 cm-1 that was not observed in the solid state. The scattered light intensity ratio of the peak of symmetric stretching motion of sulfate ion at 1101 cm-1 for NM, QSM one drop, QSM two drops, QSM three drops, and solid was 1:2:4.5:8:13. (Figure 3b).
3.4. Serum Samples
The Raman spectra recorded by the four methods (NM method, QSM method (1 drop of 10 μL), QSM method (5 drops of 10 μL), and QSM method (10 drops of 10 μL) were averaged and compared (Figure 4a). The scattered light intensity of the Raman spectrum recorded by the QSM method was higher than that of the spectrum recorded by the NM method, and the scattered light intensity increased depending on the number of sample drops. The scattered light intensity ratio of the benzene ring vibration peak around 1004 cm-1 [35] for NM, QSM one drop, QSM five drops, and QSM ten drops was 1:1.9:3.7:7.3. After both one drop and five drops of serum, the highest scattering intensity was obtained at 0.1 mm from the edge. The scattered light intensity of the Raman spectra after ten drops of serum increased, but the location on the sheet where the scattered light intensity was high varied. The scattered light intensity increased mainly at positions 0.3, 0.5, 1.0, 1.5, and 2.0 mm from the sheet edge, with the highest intensity being obtained at 1.5 mm. The scattered light intensity at 0.1 mm from the edge was almost the same after 5 and 10 drops. (Figure 4b). The scattered light intensity at the measurement site of the Raman shift of 1004 cm-1, which showed the highest scattered light intensity in the serum Raman spectrum, was statistically compared for each number of serum drops. Because the values were not normally distributed or had equal variance, a nonparametric Steel-Dwass test was used. However, because the measured Raman spectra were averaged in this study, the graphs show the mean and standard deviation (Figure 4c). The scattered light intensity increased with the number of serum drops applied, and the position showing the highest scattered light intensity tended to move from the periphery to the center (supplementary materials 1–3).
3.5. Urine Sample
As with serum, the Raman spectra recorded by the four methods (NM method, QSM method (1 drop of 10 μL), QSM method (5 drops of 10 μL), and QSM method (10 drops of 10 μL) were averaged and compared (Figure 5a). As with serum, Raman spectra were recorded at multiple locations on the sheet. The scattered light intensity of the QSM Raman spectra was higher than that of the NM Raman spectra. The ratio of the scattered light intensity of the C-N stretching peak [39] around 1000 cm-1 (a peak was observed at 1000 cm-1 for NM and QSM one drop; a peak at 1007 cm-1 was observed at most locations for QSM five and ten drops, and a peak at 1004 cm-1 was observed at a few locations) was 1:1.5:5.9:7.8 for NM, QSM one, five, and ten drops. The scattered light intensities of the Raman spectra of urine using QSM were higher than that of the NM spectrum. The scattered light intensity of the Raman spectrum recorded with QSM was higher than that recorded with NM, and the scattered light intensity increased significantly after 5 or 10 drops of urine were added. When comparing the Raman spectra after dropping 5 or 10 drops of urine in QSM, there was a large overlapping area except for the peak around 1000 cm-1 (Figure 5a). When we examined the differences in the spectrum and scattered light intensity depending on the position on the sheet, we found that after one drop of urine was applied, the scattered light intensity was almost equally high from 0.1 mm to 1.0 mm from the edge of the sheet, with no significant difference between 1.5 mm and 2.0 mm. After five drops of urine were applied, the scattered light intensity increased across the entire sheet, with a particularly large increase at 1.0 mm from the edge. After 10 drops of urine were applied, the scattered light intensity increased further across the entire sheet, with the scattered light intensity being higher closer to the center (Figure 5b). The scattered light intensity at the measurement site of around 1000 cm-1 Raman shift, which showed the highest scattered light intensity in the urine Raman spectrum, was statistically compared for each urine drop count using the nonparametric Steel-Dwass test (Figure 5c). The graph shows the mean and standard deviation. After one drop of 10 μL of urine was dispensed, there was a significant difference in the average scattered light intensity between all combinations of positions (p-values less than 0.05 for both 0.1 mm and 0.3 mm, and 0.5 mm and 1.0 mm; p-values less than 0.01 for all other combinations). After five drops were dispensed, the scattered light intensity was significantly higher at a position 1.0 mm from the edge. After 10 drops were dispensed, there was a significant difference in scattered light intensity between all combinations of positions (p-values less than 0.01), but the scattered light intensity tended to be higher closer to the center (Figure 5c) (supplementary materials 4–6).
3.6. Microscopic Confirmation of the Surface Structure of Quartz Glass Fiber Sheets After Serum Dropping
The surface condition of a quartz glass fiber sheet (4 mm in diameter, the same as that used to record Raman spectra) after serum application was examined under a microscope. Here, 10 μL of serum was applied one, three, five, or ten times. For multiple applications, a 15-min interval was allowed between applications. Thirty minutes after the final application, the surface of the sheet was observed using the same 10x objective lens used for Raman spectroscopy. Observations were performed at three locations: the edge, the middle (1.0 mm from the edge toward the center), and the center (2.0 mm from the edge). For comparison, a sheet without serum application was also observed (Figure 6).
An initial visual inspection revealed that the color (light yellow) of the sheet darkened with the number of serum applications. Furthermore, serum oozed from the edge to the outside of the sheet when it was applied three, five, or ten times. Under microscopic observation, a fine fibrous structure was observed on the surface of the sheet without serum. A very fine granular structure was observed on the surface of the sheet with one drop of serum. A coarse granular structure was observed from the edge to the center on the surface of the sheet with three drops of serum. In the center, a mixture of fine and coarse granular structures was observed. A slightly uneven rock-like structure was observed on the surface of the sheet with five drops of serum from the edge to the center. A rock-like structure with a relatively uniform height was observed on the surface of the sheet with ten drops of serum from the edge to the center.
3.7. Verification of Spreading Using Quartz Glass Slides and Serum
The 10 μL of serum formed a slightly flat bump after being dropped onto the quartz glass plate (Figure 7a). A similar drop of serum was allowed to rest in a room maintained at 22–24 °C and almost dried within approximately 25 min after dropping. Observation of the dried serum showed high permeability in the outermost and central regions, and low permeability in the outer periphery (Figure 7b). An additional 10 μL of serum was dropped onto this dried serum (a total of 20 μL of serum) and allowed to rest at 22–24 °C. Approximately 25 min after the second drop, the serum had almost dried, and a third drop of serum (30 μL in total) was placed onto the center of the dried serum. After the serum dried, the permeability at the outermost periphery remained unchanged, but the thickness of the sample increased from the center to the outermost periphery, and the permeability decreased (Figure 7c). After waiting for the dropped serum to dry, 10 μL of serum was dropped in each drop, and the sample was left standing at 22–24 °C. When the fifth drop of serum (50 μL in total) was observed in its dried state, the permeability of the outermost area was almost unchanged from that of the first three drops, but the thickness of the sample clearly increased from the center to the middle, and the permeability significantly decreased. Moreover, a region of slightly higher permeability was observed between the outermost area and the area where the thickness had clearly increased (Figure 7d). Similarly, 10 μL of serum was added, and the state after the tenth drop (100 μL in total) of serum had dried was similar to that after five drops, but the thick area had spread from the center to the periphery (Figure 7e).
4. Discussion
We are currently investigating the use of Raman spectroscopy in human body fluid samples, such as serum and urine, to aid in the early diagnosis of diseases [34,35]. We aimed to establish a simple method for obtaining high-S/N Raman spectra from human serum and urine containing relatively low concentrations of components. Two measurement methods, NM and QSM, were evaluated using test samples (sodium benzoate and sodium sulfate), as well as human serum and human urine. Thus, we successfully obtained a Raman spectrum with a high S/N ratio from a small sample volume of 10 μL in a short time of 10 seconds. Furthermore, we succeeded in increasing the intensity of the Raman scattered light by increasing the number of times the sample was dropped onto the quartz glass fiber sheet. In summary, the quartz glass fiber sheet used as the Raman spectroscopy substrate in QSM has the following advantages: the Raman spectrum of the material itself is almost invisible; the concentration of components can be increased by repeatedly dropping samples onto the sheet, thereby improving detection sensitivity; comprehensive analysis is possible because there are no restrictions on the target to be detected; the technique is simple; it is quick and inexpensive.
Raman spectra of sodium benzoate and sodium sulfate were successfully recorded using both NM and QSM. Although the Raman shifts of the peaks in the solid and aqueous spectra recorded with NM were different, the shapes of the Raman spectra recorded with QSM matched those of both solid samples of sodium benzoate and sodium sulfate. In aqueous solution, sodium benzoate exhibits a peak at approximately 1390 cm-1, which is attributed to the symmetric stretching motion of the carboxylate group (COO-) dissociated from the carboxylic acid group (-COOH). In the solid state, peaks at approximately 1435 cm-1 are attributed to the symmetric bending vibration of the methyl group (CH3), the bending vibration of the methylene group (CH2), the skeletal vibration of the benzene ring, and the C-O stretching motion. However, no peak near 1390 cm-1 was observed [31,32]. In this study, a peak was observed at 1393 cm-1 using the NM, whereas in the solid state and using the QSM it appeared at 1435 cm−1. The peak due to the symmetric stretching motion of the sulfate ion (SO42-) in sodium sulfate shifts based on the concentration of the sulfate ion (SO42-), appearing at approximately 981 cm-1 in aqueous solution and at approximately 994 cm-1 in the solid state [37]. In this study, a peak was observed at 980 cm-1 using the NM, and at 994 cm-1 in the solid state and using the QSM. These findings suggest that samples measured using QSM crystallize within the quartz glass fiber sheet. Consequently, each drop of sample concentrates the components, increasing the scattered light intensity in the Raman spectra. We recorded the Raman spectrum of the serum using QSM. A positive correlation was observed between the number of drops and the scattered light intensity, and a similar trend was observed in urine. Compared with NM, QSM was obtained ~7.3 times the scattered light intensity in serum and ~7.8 times the scattered light intensity in urine. Our QSM substrate does not cause strong Raman scattering light but rather crystallizes and concentrates sample components within the fiber structure. Therefore, compared to Raman spectra of serum and urine samples obtained using substrates such as glass plates [15], stainless steel [15], aluminum [16], calcium fluoride [17], and silicon [18], the scattered light intensity is sufficiently high, and noise is low. Furthermore, the QSM substrate is less susceptible to autofluorescence, resulting in no baseline rise. Furthermore, compared to surface-enhanced Raman spectra obtained using substrates such as gold [22] and silver [23], the QSM substrate offers advantages such as comprehensive detection without target restriction, simple and easy handling, and low cost. These features make it an excellent substrate for Raman spectroscopy, suitable for a wide range of applications.
In our measurements, the scattered light intensity of the serum or urine Raman spectra varied depending on the position on the sheet, and the position of maximum scattered light intensity changed depending on the number of drops of serum or urine (Figure 4a–c, 5a–c). To understand the distribution of ingredients on the sheet, Raman spectra were recorded at multiple locations on the sheet, and the scattered light intensity of the Raman spectrum varied depending on the location on the sheet. As a result, as the amount of sample added increased, the area with the highest scattered light intensity shifted from the edge toward the center. This tendency was also common to both serum and urine. When serum or urine is dropped onto a quartz glass fiber sheet, it spreads horizontally owing to surface tension, as shown by Young’s equation [40] and moves vertically owing to adsorption. The spreading of serum or urine is influenced by the surface tension of the liquid and the surface tension (surface free energy) of the solid (the quartz glass fiber sheet). The magnitude of surface free energy and the magnitude of spreading are correlated [41]. In liquid samples, the “coffee ring” phenomenon [42] occurs; components migrate outward due to convection caused by evaporation from the sample surface. When serum was dropped onto a quartz slide glass, the sample was observed to be thicker at the edges and thinner at the center, suggesting that the “coffee ring” phenomenon occurred on the quartz slide glass. Raman spectra obtained using a quartz glass fiber sheet showed that when the number of drops of serum was small (one and five drops), the Raman scattered light intensity tended to be slightly higher at the outer edge of the sheet. With increasing drops (five and ten drops), the position where the maximum Raman scattered light intensity was recorded tended to shift toward the center. A similar phenomenon was observed for urine, but the position at which the maximum Raman scattered light intensity was recorded tended to easily shift toward the center with increasing number of drops than with serum. This result can be explained by the “coffee ring” phenomenon. When a single drop of sample was applied to a quartz glass fiber sheet, the components in the sample migrated outward. However, due to the high adsorption capacity of the quartz glass fiber sheet (the first drop was absorbed almost instantly), the components may have been adsorbed to the sheet before they could migrate sufficiently outward, resulting in no significant difference in Raman scattered light intensity at the sheet position. When a sample is dropped onto the sheet multiple times, in addition to the components in the newly dropped sample, some of the components adsorbed to the sheet may redissolve and move again on the sheet. In this way, the components repeat a cycle of adsorption, redissolution, movement, and adsorption on the sheet, which may gradually lead to a more uniform distribution of components on the sheet. Dropping a drop of sample followed by a drop of water or other solvent and analyzing the change in Raman scattered light intensity with position on the sheet may reveal the adsorption and movement of components. However, serum components are diverse, and it is assumed that they move in a very complex manner. The surface of the quartz glass fiber sheet was observed under a microscope after serum application, and a fine granular structure relatively similar to the original quartz glass fiber sheet was observed after the application of one drop of serum. After three drops of serum were applied, a clear change was observed, with a slightly coarse granular structure observed from the edge to the middle, but the center was a mixture of fine and slightly coarse granules. After five and ten drops of serum were applied, a rock-like structure was observed from the edge to the center in both cases (Figure 6). The area with the maximum scattered light intensity on the quartz glass fiber sheet shifted from the edge to the center depending on the number of serum drops applied and the state of the sheet surface. This indicates that the amount of serum components adsorbed and solidified on the fibers increased, the structure changed from fine granular to coarse granular to rock-like, and that this change progressed from the edge to the center. Experiments using a quartz slide and serum suggested that serum spreads in a circular shape, but with a single 10-μL drop, components concentrated between the center and the outermost periphery, and with increasing drop counts, components also concentrated toward the center (Figure 7a–d). This phenomenon coincides with the phenomena in which the shape of the sheet surface and the position on the sheet showing the highest Raman scattering light intensity moves from the edge toward the center depending on the number of times the sample is dropped. As in this experiment we focused on permeability changes, determining the differences in the migration patterns of individual serum components was not possible. However, inverse correlation existed between the number of drops of serum and spreading. As the surface tension of serum and urine does not change, increasing the number of serum and urine drops is speculated to change the surface conditions of the quartz glass fiber sheet and quartz glass slide, resulting in a decrease in the surface free energy. The presence of organic matter decreases surface free energy [43]. Therefore, the surface free energy of the quartz glass fiber sheet and quartz glass slide may decrease with an increasing number of drops of serum and urine. In contrast, the rougher the surface and the larger the surface area, the higher the surface free energy, whereas the smoother the surface and the smaller the surface area, the lower the surface free energy [44]. In the case of the quartz glass fiber sheet, the drops of serum and urine fill the gaps between the fibers, making the surface smoother and reducing the surface area, which is thought to decrease the surface free energy. Serum or urine droplets placed at the center of a quartz glass fiber sheet are thought to pass through the sheet owing to surface tension and adsorption according to Young’s equation [40,41]. It is also assumed that components move within the sample droplets due to the “coffee ring phenomenon” [42] or the like. However, the migration of serum and urine components is thought to be affected by various factors, including molecular weight, size, and charge. Serum contains a variety of components, including proteins such as albumin and globulin, amino acids, glucose, lipids, electrolytes, and hormones. Meanwhile, urine has a simpler composition than serum, with its main components being urea, creatinine, uric acid, sodium, potassium, magnesium, and urobilin. Differences in serum and urine components are thought to affect the relationship between the number of sample droplets and scattered light intensity. Adjusting the properties of the quartz glass fiber sheet, such as its density and thickness, it is possible to achieve a uniform distribution of components on the sheet, while at the same time controlling the heterogeneity may enable selective detection of components in the sample.
Serum and urine contain disease-related proteins, amino acids, glycans, and nucleic acids. Therefore, high-S/N Raman spectra obtained using comprehensive Raman spectroscopy may provide valuable information for disease diagnosis. Morasso et al. analyzed the Raman spectra of dried plasma from 120 patients and reported that by focusing on peaks representing tryptophan, tyrosine, phenylalanine, lipids, carotenoids, and disulfide bonds, colon cancer patients could be identified and monitored with 87.5% accuracy [28]. Jo K et al. revealed the possibility of identifying colorectal cancer patients using spectral data obtained from colonic mucus using a plasmonic gold nanopolyhedron-coated needle-based surface-enhanced Raman scattering sensor [45]. Xu et al. reported that detecting lung cancer-associated circular RNA using surface-enhanced Raman spectroscopy and a unique optical biosensor is useful for lung cancer screening and prognosis prediction [29]. Hajab et al. claimed that analyzing proteins contained in specific fractions obtained by serum centrifugation using surface-enhanced Raman spectroscopy was able to diagnose breast cancer patients with 81% sensitivity and 76% specificity [30]. Furthermore, Schiemer et al. compared the accuracy of endometrial cancer detection using ATR-FTIR and Raman spectroscopy using plasma and dried plasma, reporting a 78% accuracy for ATR-FTIR, 82% accuracy for Raman spectroscopy, and 86% accuracy for the combined method [31]. Koster et al. reported that the combined Raman spectral analysis of plasma and saliva had diagnostic sensitivity and specificity of 96.3% and 85.7%, respectively, for head and neck cancer patients [32]. Li et al. analyzed the plasma of 199 patients with esophageal cancer and 135 healthy individuals using resonance Raman spectroscopy and reported that it was useful for diagnosing esophageal cancer and assessing its progression [46]. Yang J et al. reported an in vitro cancer cell detection technique using surface-enhanced Raman spectroscopy and silver nanoprobes [47]. Mitura et al. analyzed the Raman spectrum of urine and stated that the scattered light intensity of the Raman shift peaks at 1009 cm-1 and 2937 cm-1 was strongly related to prostate cancer [33]. Desroches J et al. reported that they developed a quick cancer cell detection system using high-wavenumber Raman spectroscopy and were able to evaluate cancerous lesions in pig brain tissue in real time [48]. Uckermann et al. demonstrated the possibility of detecting brain tumors by simultaneously acquiring and analyzing Raman scattered light and near-infrared autofluorescence from the brain during brain surgery [49]. Chen et al. also presented a needle-type Raman spectroscopy system with near-infrared autofluorescence imaging capabilities for distinguishing between breast cancer and normal breast tissue [50]. Although applying Raman spectroscopy in the medical field is gradually progressing, standard methods for disease diagnosis have yet to be established, and many techniques require complex procedures. Our QSM technique is characterized by its relatively simple nature and is advantageous in that it is easy, quick, and provides highly reproducible Raman spectra.
In this study, we used the QSM too quickly and easily obtain high-S/N Raman spectra from serum and urine samples. However, it should be noted that this QSM method dries the measurement sample, so it may not be possible to accurately evaluate volatile substances or substances that change due to temperature changes, drying, or light exposure. Using a circular quartz glass fiber sheet as a substrate for Raman spectroscopy measurements, we found that components in the sample can crystallize within the quartz glass fiber structure, that the Raman scattered light intensity increases as the amount of sample dropped increases, that the Raman scattered light intensity changes depending on the measurement position on the sheet, and that the peak of Raman scattered light intensity tends to move from the edge of the sheet toward the center depending on the amount of sample dropped. However, we have not been able to confirm whether the change in scattered light intensity results in a change in the proportions of the Raman spectrum. To use our QSM in clinical testing, we need to fully understand, control, and utilize the mechanisms underlying the changes in the Raman spectrum on the sheet. In this study, we found that the Raman scattering intensity changes with position on the sheet, but it is not yet clear whether the spectral shape also changes. If the spectral shape itself changes, it would indicate that components in the sample move along the sheet according to different rules. We need to decide whether to make the QSM sheet uniform or to control its heterogeneity for selective detection. Of course, we can also achieve both uniformity and heterogeneity (selective component detection) by increasing the variety of sheets. We are investigating the migration patterns of compounds with basic structures on the quartz glass fiber sheet and are also working on developing methods to precisely control the measurement position on the sheet. Furthermore, we are investigating the compatibility of various biological samples (including serum, urine, pleural effusion, ascites, cerebrospinal fluid, bile, and pancreatic juice) with various quartz glass fiber sheets with different properties (including shape, size, thickness, and fiber density), including the optimal sample volume and the optimal time from instillation to measurement. We have also begun the basic design of a microdevice for measurement. Despite the limitations to be resolved, the QSM has potential for use in screening for diverse diseases, including cancer, metabolic diseases, neurodegenerative diseases, congenital disorders, and infectious diseases. Compared to other materials used for Raman spectroscopy, the QSM we developed does not emit Raman scattered light, and can crystallize and concentrate components, resulting in high scattered light intensity and low noise. Furthermore, it is an excellent substrate for Raman spectroscopy, with features such as ease of handling and extremely low cost, making it a cost-effective method. Furthermore, as no additional equipment beyond a Raman microscope is required, this simple and affordable novel technique can be implemented in setting with limited medical resources.
5. Conclusions
In this study, we investigated a method for easily and quickly obtaining Raman spectra with a high S/N from biological fluid samples such as serum and urine. Compared to the NM method, which records Raman spectra of liquid samples, the QSM method concentrates the components in the sample, thereby increasing the scattered light intensity of the obtained Raman spectrum and improving the detection sensitivity of the components within the sample. Specifically, QSM can obtain scattered light intensity that is approximately 7.3 times higher for serum and approximately 7.8 times higher for urine compared to NM, which obtains spectra while the sample is still in liquid form. These results suggest that QSM is an effective method for obtaining Raman spectra of target analytes from liquid biological samples containing trace components. Furthermore, QSM possesses the advantages of Raman spectroscopy—simple, quick, and comprehensive—and offers low cost because only a quartz glass fiber sheet is required per measurement. The quartz glass fiber sheet after serum application is lightweight and highly portable. Furthermore, today’s AI technology allows for highly accurate spectral analysis and the development of evaluation algorithms. Therefore, QSM has the potential to be applied to the diagnosis and prediction of a wide range of diseases, including cancers in various organs as well as neurodegenerative diseases, metabolic diseases, and infectious diseases. To further refine this QSM technique, we have begun detailed investigations into the properties of quartz glass fibers (sheet thickness, sheet size, fiber diameter, and density), sample dispensing volume, and component spreading on the sheet.
Author Contributions
Conceptualization, H.I.; methodology, H.I.; software, W.Y.; validation, T.M., W.Y., and K.I.; formal analysis, H.I. and Y.I.; investigation, H.I. and Y.I.; resources, N.U., T.Y., S.K., M.K., T.F., T.N., and J.T.; data curation, H.I. and Y.I.; writing—original draft preparation, H.I.; writing—review and editing, H.I.; visualization, H.I.; supervision, H.I.; project administration, H.I.; funding acquisition, H.I. All authors have read and agreed to the published version of the manuscript.
Funding
This research was funded by MEXT KAKENHI, grant number: JP17K09022 and MEXT KAKENHI, grant number JP20K07643. The cost of constructing the Raman microscope used in this study was provided by JSR Corporation.
Institutional Review Board Statement
This study was conducted in accordance with the Declaration of Helsinki and approved by the Institutional Review Board of Showa Medical University Koto Toyosu Hospital (Approval Number: 18T5005; date of approval: September 14, 2018). The study protocol was registered in the University Hospital Medical Information Network clinical trial registry (UMIN-CTR, No. UMIN000034306).
Informed Consent Statement
The patients (including the two patients with identifiable data) provided written informed consent for participation in this study and for publication of their clinical information in this article.
Data Availability Statement
The original dataset of Raman spectra analyzed in this study was uploaded to Figshare database (https://doi.org/10.6084/m9.figshare.30171217.v1). All other data in this study are available upon reasonable request to the corresponding author.
Acknowledgments
To ensure appropriate expression and accurate understanding of the research content, the authors revised the wording throughout the manuscript using “Google Gemini.” We would also like to thank Editage (www.editage.jp) for English language editing. All authors have approved the completed manuscript content.
Conflicts of Interest
Author Tomokazu Miyazaki was employed by the company JSR Corporation, author Kenji Issha was employed by the company Fuji Technical Research Inc., and author William Yang runs the company BaySpec Inc., United States. The remaining authors declare that the research was conducted in the absence of any commercial or financial relationships that could be construed as a potential conflict of interest. The funders had no role in the design of the study; in the collection, analyses, or interpretation of data; in the writing of the manuscript; or in the decision to publish the results.
Abbreviations
The following abbreviations are used in this manuscript:
| NM | Needle method |
| QSM | Quartz glass fiber sheet method |
| S/N | Signal-to-noise ratio |
References
- Votteler, M.; Carvajal Berrio, D.A.; Pudlas, M.; Walles, H.; Stock, U.A.; Schenke-Layland, K. Raman spectroscopy for the non-contact and non-destructive monitoring of collagen damage within tissues. J Biophotonics 2012, 5, 47–56. [Google Scholar] [CrossRef]
- Raman, C.V.; Krishnan, K.S. A new type of secondary radiation. Nature 1928, 121, 501–502. [Google Scholar] [CrossRef]
- Isoda, T.; Urushibara, I.; Sato, M.; Uemura, H.; Sato, H.; Yamauchi, N. Development of a sensor-array chip with immobilized antibodies and the application of a wireless antigen-screening system. Sens Actuators B 2008, 129, 958–970. [Google Scholar] [CrossRef]
- Sreejith, K.R.; Gorgannezhad, L.; Jin, J.; Ooi, C.H.; Stratton, H.; Dao, D.V.; Nguyen, N.T. Liquid marbles as biochemical reactors for the polymerase chain reaction. Lab Chip 2019, 19, 3220–3227. [Google Scholar] [CrossRef]
- Muhammad, N.; Hussian, I.; Ali, A.; Hussain, T.; Intisar, A.; Ul Haq, I.; Subhani, Q.; Hedar, M.; Zhong, J.L.; Asif, M.; et al. A comprehensive review of liquid chromatography hyphenated to post-column photoinduced fluorescence detection system for determination of analytes. Arab J Chem 2022, 15, 104091. [Google Scholar] [CrossRef]
- Mao, J.; Huang, L.; Fan, L.; Chen, F.; Lou, J.; Shan, X.; Yu, D.; Zhou, J. 60-nt DNA direct detection without pretreatment by surface-enhanced Raman scattering with polycationic modified Ag microcrystal derived from AgCl cube. Molecules 2021, 26, 6790. [Google Scholar] [CrossRef]
- Sun, X.; Yan, S.; Liu, C.; Zhang, S.; Hu, Y.; Zhang, H. Advancing water quality assurance: A comprehensive investigation into quantitative bentazone detection in drinking water through surface-enhanced Raman spectroscopy and chemometric insights. Spectrochim Acta A Mol Biomol Spectrosc 2025, 337, 126067. [Google Scholar] [CrossRef]
- Griffen, J.; Owen, A.; Matousek, P. Comprehensive quantification of tablets with multiple active pharmaceutical ingredients using transmission Raman spectroscopy—A proof of concept study. J Pharm Biomed Anal 2015, 115, 277–282. [Google Scholar] [CrossRef]
- Mizushima, K.; Kumamoto, Y.; Tamura, S.; Yamanaka, M.; Mochizuki, K.; Li, M.; Egoshi, S.; Dodo, K.; Harada, Y.; Smith, N.I.; et al. Raman microscopy of cryofixed biological specimens for high-resolution and high-sensitivity chemical imaging. Sci Adv 2024, 10, eadn0110. [Google Scholar] [CrossRef]
- Mosca, S.; Montgomery, W.; McKibbin, C.; Stokes, R.; Conti, C.; Matousek, P. Noninvasive characterization of preservation fluids through glass container using spatially offset Raman spectroscopy: Potential in heritage science. ACS Omega 2025, 10, 8658–8664. [Google Scholar] [CrossRef] [PubMed]
- Lönartz, M.I.; Stausberg, L.; Trapp-Müller, G.; Dohmen, L.; Lenting, C.; Fritzsche, M.B.K.; Geisler, T. Fluid-cell Raman spectroscopy for operando studies of reaction and transport phenomena during silicate glass corrosion. J Vis Exp 2025, (219). [Google Scholar] [CrossRef]
- Sun, Z.; Yang, J.; Yao, Y.; Hu, D.; Ying, Y.; Guo, J.; Xie, L. Knowledge-guided temperature correction method for soluble solids content detection of watermelon based on Vis/NIR spectroscopy. Artif Intell Agric 2025, 15, 88–97. [Google Scholar] [CrossRef]
- Kopal, I.; Smeliková, V. Silver-surface-enhanced Raman spectra of berberine: Analyte-induced surface changes, variable concentration correlation, and excitation wavelength dependence. Langmuir 2025, 41, 16725–16735. [Google Scholar] [CrossRef] [PubMed]
- Panghal, A.; Das, S.; Thapa, P.; Meenakshi, M.; Kumar, A.; Nagpal, P.; Dubey, S.K.; Perumal, V.; Mehta, D.S. Surface plasmon enhanced auto-fluorescence and Raman spectroscopy for low-level detection of biological pathogens. Methods Appl Fluoresc 2024. [Google Scholar] [CrossRef]
- Ito, H.; Uragami, N.; Miyazaki, T.; Yokoyama, N.; Inoue, H. Raman spectroscopic evaluation of human serum using metal plate and 785- and 1064-nm excitation lasers. PLOS One 2019, 14, e0211986. [Google Scholar] [CrossRef]
- Dogan, G.Y.; Halimoglu, G.; Kaplanoglu, D.; Aksoy, U.M.; Kandeger, A.; Yavuz, E.; Kartal, S.; Fausto, R.; Ildiz, G.O. Raman Spectra of Blood Serum as Holistic Biomarker for Differential Auxiliary Diagnoses of Attention Deficit and Hyperactivity Disorder (ADHD) in Adults. Spectrosc 2024, 2, 53–67. [Google Scholar] [CrossRef]
- Hu, D.; Wang, J.; Cheng, T.; Li, H.; Zhang, F.; Zhao, D.; Xu, X.; Yu, R.; Wen, P.; Cheng, Y.; Xu, J.; Jin, L.; Yao, J. Comparative analysis of serum and saliva samples using Raman spectroscopy: a high-throughput investigation in patients with polycystic ovary syndrome and periodontitis. BMC Women’s Health 2023, 23, 522. [Google Scholar] [CrossRef]
- Yang, J.; Chen, X.; Luo, C.; Li, Z.; Chen, C.; Han, S.; Lv, X.; Wu, L.; Chen, C. Application of serum SERS technology combined with deep learning algorithm in the rapid diagnosis of immune diseases and chronic kidney disease. Scientific reports 2023, 13, 15719. [Google Scholar] [CrossRef]
- Boudries, R.; Williams, H.; Paquereau-Gaboreau, S.; Bashir, S.; Hojjat Jodaylami, M.; Chisanga, M.; Trudeau, L.É.; Masson, J.F. Surface-enhanced Raman scattering nanosensing and imaging in neuroscience. ACS Nano 2024, 18, 22620–22647. [Google Scholar] [CrossRef]
- Wang, N.; Yang, A.; Tian, X.; Liao, J.; Yang, Z.; Pan, Y.; Guo, Y.; He, S. Label-free analysis of the β-hydroxybutyricacid drug on mitochondrial redox states repairment in type 2 diabetic mice by resonance raman scattering. Biomed Pharmacother 2024, 172, 116320. [Google Scholar] [CrossRef]
- Stepanenko, T.; Sofińska, K.; Wilkosz, N.; Dybas, J.; Wiercigroch, E.; Bulat, K.; Szczesny-Malysiak, E.; Skirlińska-Nosek, K.; Seweryn, S.; Chwiej, J.; et al. Surface-enhanced Raman scattering (SERS) and tip-enhanced Raman scattering (TERS) in label-free characterization of erythrocyte membranes and extracellular vesicles at the nano-scale and molecular level. Analyst 2024, 149, 778–788. [Google Scholar] [CrossRef] [PubMed]
- Basu, B.; Rana, N.; Morgan, D.; Sen, K. Gold Nanoparticle Incorporated Graphene Oxide as a SERS Platform for Ultratrace Antibody Free Sensing of the Cancer Biomarker CEA. Langmuir 2025, 41, 7886–7901. [Google Scholar] [CrossRef]
- Dixon, K.; Bonon, R.; Ivander, F.; Ebrahim, S.A.; Namdar, K.; Shayegannia, M.; Khalvati, F.; Kherani, N.P.; Zavodni, A.; Matsuura, N. Using Machine Learning and Silver Nanoparticle-Based Surface-Enhanced Raman Spectroscopy for Classification of Cardiovascular Disease Biomarkers. ACS Appl Nano Mater. 2023, 6, 15385−15396. [Google Scholar] [CrossRef]
- Nanda, B.P.; Rani, P.; Paul, P.; Aman, G.; Ganti, S.S.; Bhatia, R. Recent trends and impact of localized surface plasmon resonance (LSPR) and surface-enhanced Raman spectroscopy (SERS) in modern analysis. J Pharm Anal 2024, 14, 100959. [Google Scholar] [CrossRef]
- Wang, S.; Wei, Y.; Zheng, S.; Zhang, Z.; Tang, X.; Liang, L.; Zang, Z.; Qian, Q. Beyond the charge transfer mechanism for 2D materials-assisted surface enhanced Raman scattering. Anal Chem 2024, 96, 9917–9926. [Google Scholar] [CrossRef]
- Jain, R.; Berkane, Y.; Ajenu, E.O.; Nguyen, K.T.; Shamlou, A.A.; Muzikansky, A.; Cornacchini, J.; Lellouch, A.G.; Uygun, B.E.; Cetrulo, C.L.; et al. Non-invasive resonance Raman spectroscopy provides an early estimation of depth in a pig model of multi-depth burns. Res Sq 2025, rs.3.rs–6805519. [Google Scholar] [CrossRef] [PubMed]
- He, X.; Scarabelli, L.; Chiang, N. Construction of a scanning ion-conductance microscope for tip-enhanced Raman spectroscopy. Anal Chem 2025, 97, 16098–16103. [Google Scholar] [CrossRef]
- Morasso, C.; Daveri, E.; Bonizzi, A.; Truffi, M.; Colombo, F.; Danelli, P.; Albasini, S.; Rivoltini, L.; Mazzucchelli, S.; Sorrentino, L.; et al. Raman spectroscopy on dried blood plasma allows diagnosis and monitoring of colorectal cancer. MedComm 2024, 5, e774. [Google Scholar] [CrossRef]
- Xu, L.; Chen, Y.; Ye, J.; Fan, M.; Weng, G.; Shen, Y.; Lin, Z.; Lin, D.; Xu, Y.; Feng, S. Optical nanobiosensor based on surface-enhanced Raman spectroscopy and catalytic hairpin assembly for early-stage lung cancer detection via blood circular RNA. ACS Sens 2024, 9, 2020–2030. [Google Scholar] [CrossRef]
- Hajab, H.; Anwar, A.; Nawaz, H.; Majeed, M.I.; Alwadie, N.; Shabbir, S.; Amber, A.; Jilani, M.I.; Nargis, H.F.; Zohaib, M.; et al. Surface-enhanced Raman spectroscopy of the filtrate portions of the blood serum samples of breast cancer patients obtained by using 30 kDa filtration device. Spectrochim Acta A Mol Biomol Spectrosc 2024, 311, 124046. [Google Scholar] [CrossRef]
- Schiemer, R.; Grant, J.; Shafiee, M.N.; Phang, S.; Furniss, D.; Boitor, R.; Seddon, A.B.; Notingher, I.; Atiomo, W.; Jones, N.W.; et al. Infrared and Raman spectroscopy of blood plasma for rapid endometrial cancer detection. Br J Cancer 2025, 133, 194–207. [Google Scholar] [CrossRef]
- Koster, H.J.; Guillen-Perez, A.; Gomez-Diaz, J.S.; Navas-Moreno, M.; Birkeland, A.C.; Carney, R.P. Fused Raman spectroscopic analysis of blood and saliva delivers high accuracy for head and neck cancer diagnostics. Sci Rep 2022, 12, 18464. [Google Scholar] [CrossRef]
- Mitura, P.; Paja, W.; Młynarczyk, G.; Kowalski, R.; Bar, K.; Depciuch, J. Urine-based Raman markers for prostate cancer diagnosis: A machine learning approach using fingerprint and lipid spectral region. Spectrochim Acta A Mol Biomol Spectrosc 2026, 344, 126661. [Google Scholar] [CrossRef]
- Ito, H.; Inoue, H.; Hasegawa, K.; Hasegawa, Y..; Shimizu, T.; Kimura, S.; Onimaru, M.; Ikeda, H.; Kudo, S. Use of surface-enhanced Raman scattering for detection of cancer-related serum-constituents in gastrointestinal cancer patients. Nanomed Nanotech Biol Med 2014, 10, 599–608. [Google Scholar] [CrossRef] [PubMed]
- Ito, H.; Uragami, N.; Miyazaki, T.; Yang, W.; Issha, K.; Matsuo, K.; Kimura, S.; Arai, Y.; Tokunaga, H.; Okada, S.; et al. Highly accurate colorectal cancer prediction model based on Raman spectroscopy using patient serum. World J Gastrointest Oncol 2020, 12, 1311–1324. [Google Scholar] [CrossRef]
- de Veij, M.; Vandenabeele, P.; De Beer, T.; Remon, J.P.; Moens, L. Reference database of Raman spectra of pharmaceutical excipients. J Raman Spectrosc 2009, 40, 297–307. [Google Scholar] [CrossRef]
- Lopez-Ramirez, M.R.; Ruano, C.; Castro, J.L.; Arenas, J.F.; Soto, J.; Otero, J.C. Surface-enhanced Raman scattering of benzoate anion adsorbed on silver nanoclusters: Evidence of the transient formation of the radical dianion. J Phys Chem C 2010, 114, 7666–7672. [Google Scholar] [CrossRef]
- Xu, Y.; Dou, Z.; Xing, L.; Li, Z.; Men, Z.; Sun, C.; Wang, S. Efficient frequency conversion and the crossing-pump effect of stimulated Raman scattering in an aqueous sodium sulfate solution. Opt Express 2022, 30, 45043–45053. [Google Scholar] [CrossRef] [PubMed]
- Saatkamp, C.J.; de Almeida, M.L.; Bispo, J.A.M.; Pinheiro, A.L.B.; Fernandes, A.B.; Silveira, L. Quantifying creatinine and urea in human urine through Raman spectroscopy aiming at diagnosis of kidney disease. J Biomed Opt 2016, 21, 37001. [Google Scholar] [CrossRef] [PubMed]
- Schrader, M.E. Young-Dupre revisited. Langmuir 1995, 11, 3585–3589. [Google Scholar] [CrossRef]
- Stammitti-Scarpone, A.; Acosta, E.J. Solid-liquid-liquid wettability and its prediction with surface free energy models. Adv Colloid Interface Sci 2019, 264, 28–46. [Google Scholar] [CrossRef]
- Liamtsau, V.; Liu, G.; Morozov, A.N; Mebel, A.M.; Cai, Y. Chromatographic framework for coffee ring effect-driven separation of small molecules in surface enhanced Raman spectroscopy analysis. Talanta 2022, 250, 123688. [Google Scholar] [CrossRef]
- Tran, C.T.H.; Gilmour, A.D.; Boumelhem, B.B.; Fraser, S.T.; Bilek, M.M.M. Plasma-activated coated glass: A novel platform for optimal optical performance and cell culture substrate customization. Small Sci 2024, 4, 2300228. [Google Scholar] [CrossRef]
- Leroy, F.; Müller-Plathe, F. Solid-liquid surface free energy of Lennard-Jones liquid on smooth and rough surfaces computed by molecular dynamics using the phantom-wall method. J Chem Phys 2010, 133, 044110. [Google Scholar] [CrossRef] [PubMed]
- Jo, K.; Linh, V.T.N.; Yang, J.Y.; Heo, B.; Kim, J.Y.; Mun, N.E.; Im, J.H.; Kim, K.S.; Park, S.G.; Lee, M.Y.; et al. Machine learning-assisted label-free colorectal cancer diagnosis using plasmonic needle-endoscopy system. Biosens Bioelectron 2024, 264, 116633. [Google Scholar] [CrossRef] [PubMed]
- Li, X.; Chen, H.; Zhang, S.; Yang, H.; Gao, S.; Xu, H.; Wang, L.; Xu, R.; Zhou, F.; Hu, J.; et al. Blood plasma resonance Raman spectroscopy combined with multivariate analysis for esophageal cancer detection. J Biophotonics 2021, 14, e202100010. [Google Scholar] [CrossRef] [PubMed]
- Yang, J.; Ye, Z.; Xue, Q.; Li, D.; Liang, M.; Li, G.; Liu, H.; Yi, L.; Hu, B.; Yin, P.; et al. Dynamic liquid integrated single-cell SERS platform based on the twisted mixing microfluidic chip and multi-modified nanoprobe for the label-free detection of cancer cells. Anal Chem 2025, 97, 7789–7798. [Google Scholar] [CrossRef]
- Desroches, J.; Jermyn, M.; Pinto, M.; Picot, F.; Tremblay, M.A.; Obaid, S.; Marple, E.; Urmey, K.; Trudel, D.; Soulez, G.; et al. A new method using Raman spectroscopy for in vivo targeted brain cancer tissue biopsy. Sci Rep 2018, 8, 1792. [Google Scholar] [CrossRef]
- Uckermann, O.; Ziegler, J.; Meinhardt, M.; Richter, S.; Schackert, G.; Eyüpoglu, I.Y.; Hijazi, M.M.; Krex, D.; Juratli, T.A.; Sobottka, S.B.; et al. Raman and autofluorescence spectroscopy for in situ identification of neoplastic tissue during surgical treatment of brain tumors. J Neurooncol 2024, 170, 543–553. [Google Scholar] [CrossRef]
- Chen, S.; Chen, Q.; Zhang, R.; Yang, H.; Xie, F.; Wang, S.; Liu, L.; Schmitt, M.; Popp, J.; Wang, J. Autofluorescence imaging guided needle-type Raman spectroscopy system for breast tumor margin assessment. Opt Lett 2024, 49, 6733–6736. [Google Scholar] [CrossRef]
Figure 1.
Microdevices fabricated to record Raman spectra depending on the state of the sample, such as solid or aqueous solution. (a) Stainless-steel plate with depression for measuring the Raman spectrum of solid-state samples. (b) Needle method (NM; Japan Patent No. 7129732) for measuring the Raman spectrum of liquid samples. Raman spectra were recorded by irradiating a laser on a droplet of a sample prepared at the tip of a stainless-steel injection needle having an outer diameter of 1.20 mm. (c) Quartz sheet methods (QSM; Patent PCT pending; Application number: PCT/JP2024/038092) for the measurement of the Raman spectrum of liquid samples. (d) Raman spectra were recorded at six points at distances of 0.1, 0.3, 0.5, 1.0, 1.5, and 2.0 mm from the edge.
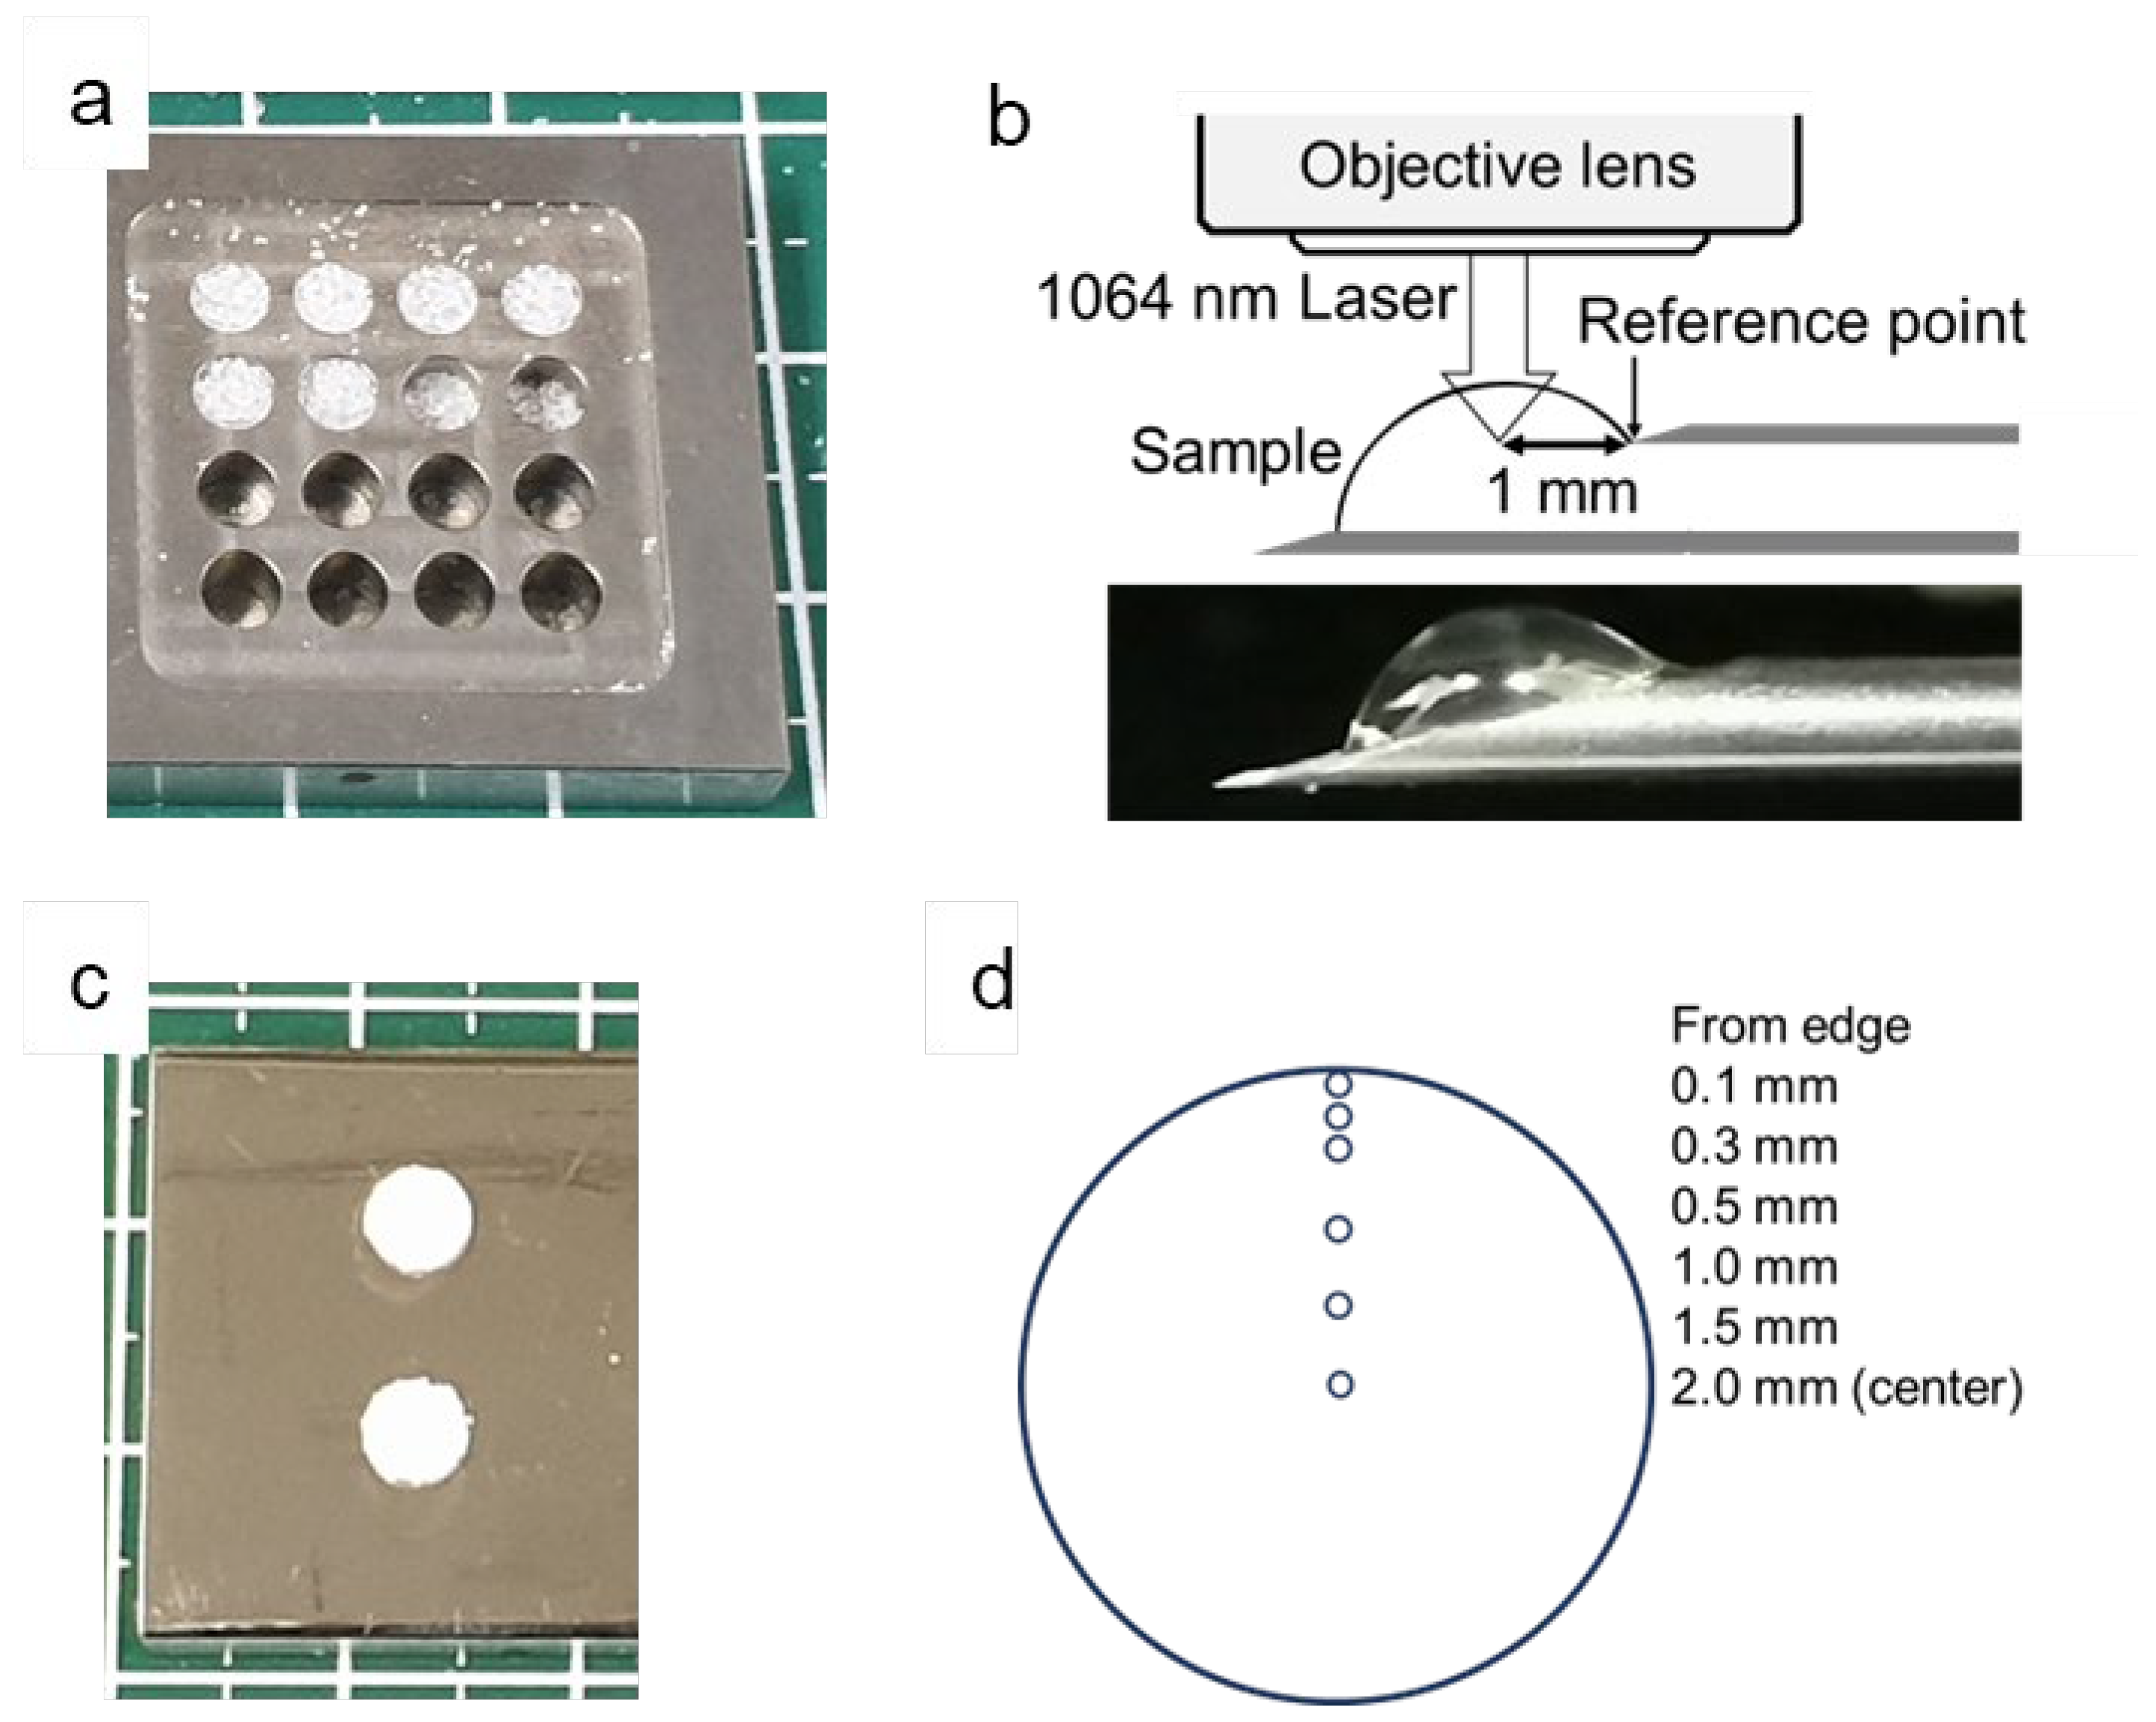
Figure 2.
Comparing the Raman spectra of crown glass, quartz glass slide, and quartz glass fiber sheet, peaks were observed in the crown glass and quartz glass, but in the Raman spectrum of the quartz glass fiber sheet, a slight peak due to the bending motion of Si-O-Si was observed around 495 cm-1, but no other clear peaks were observed.
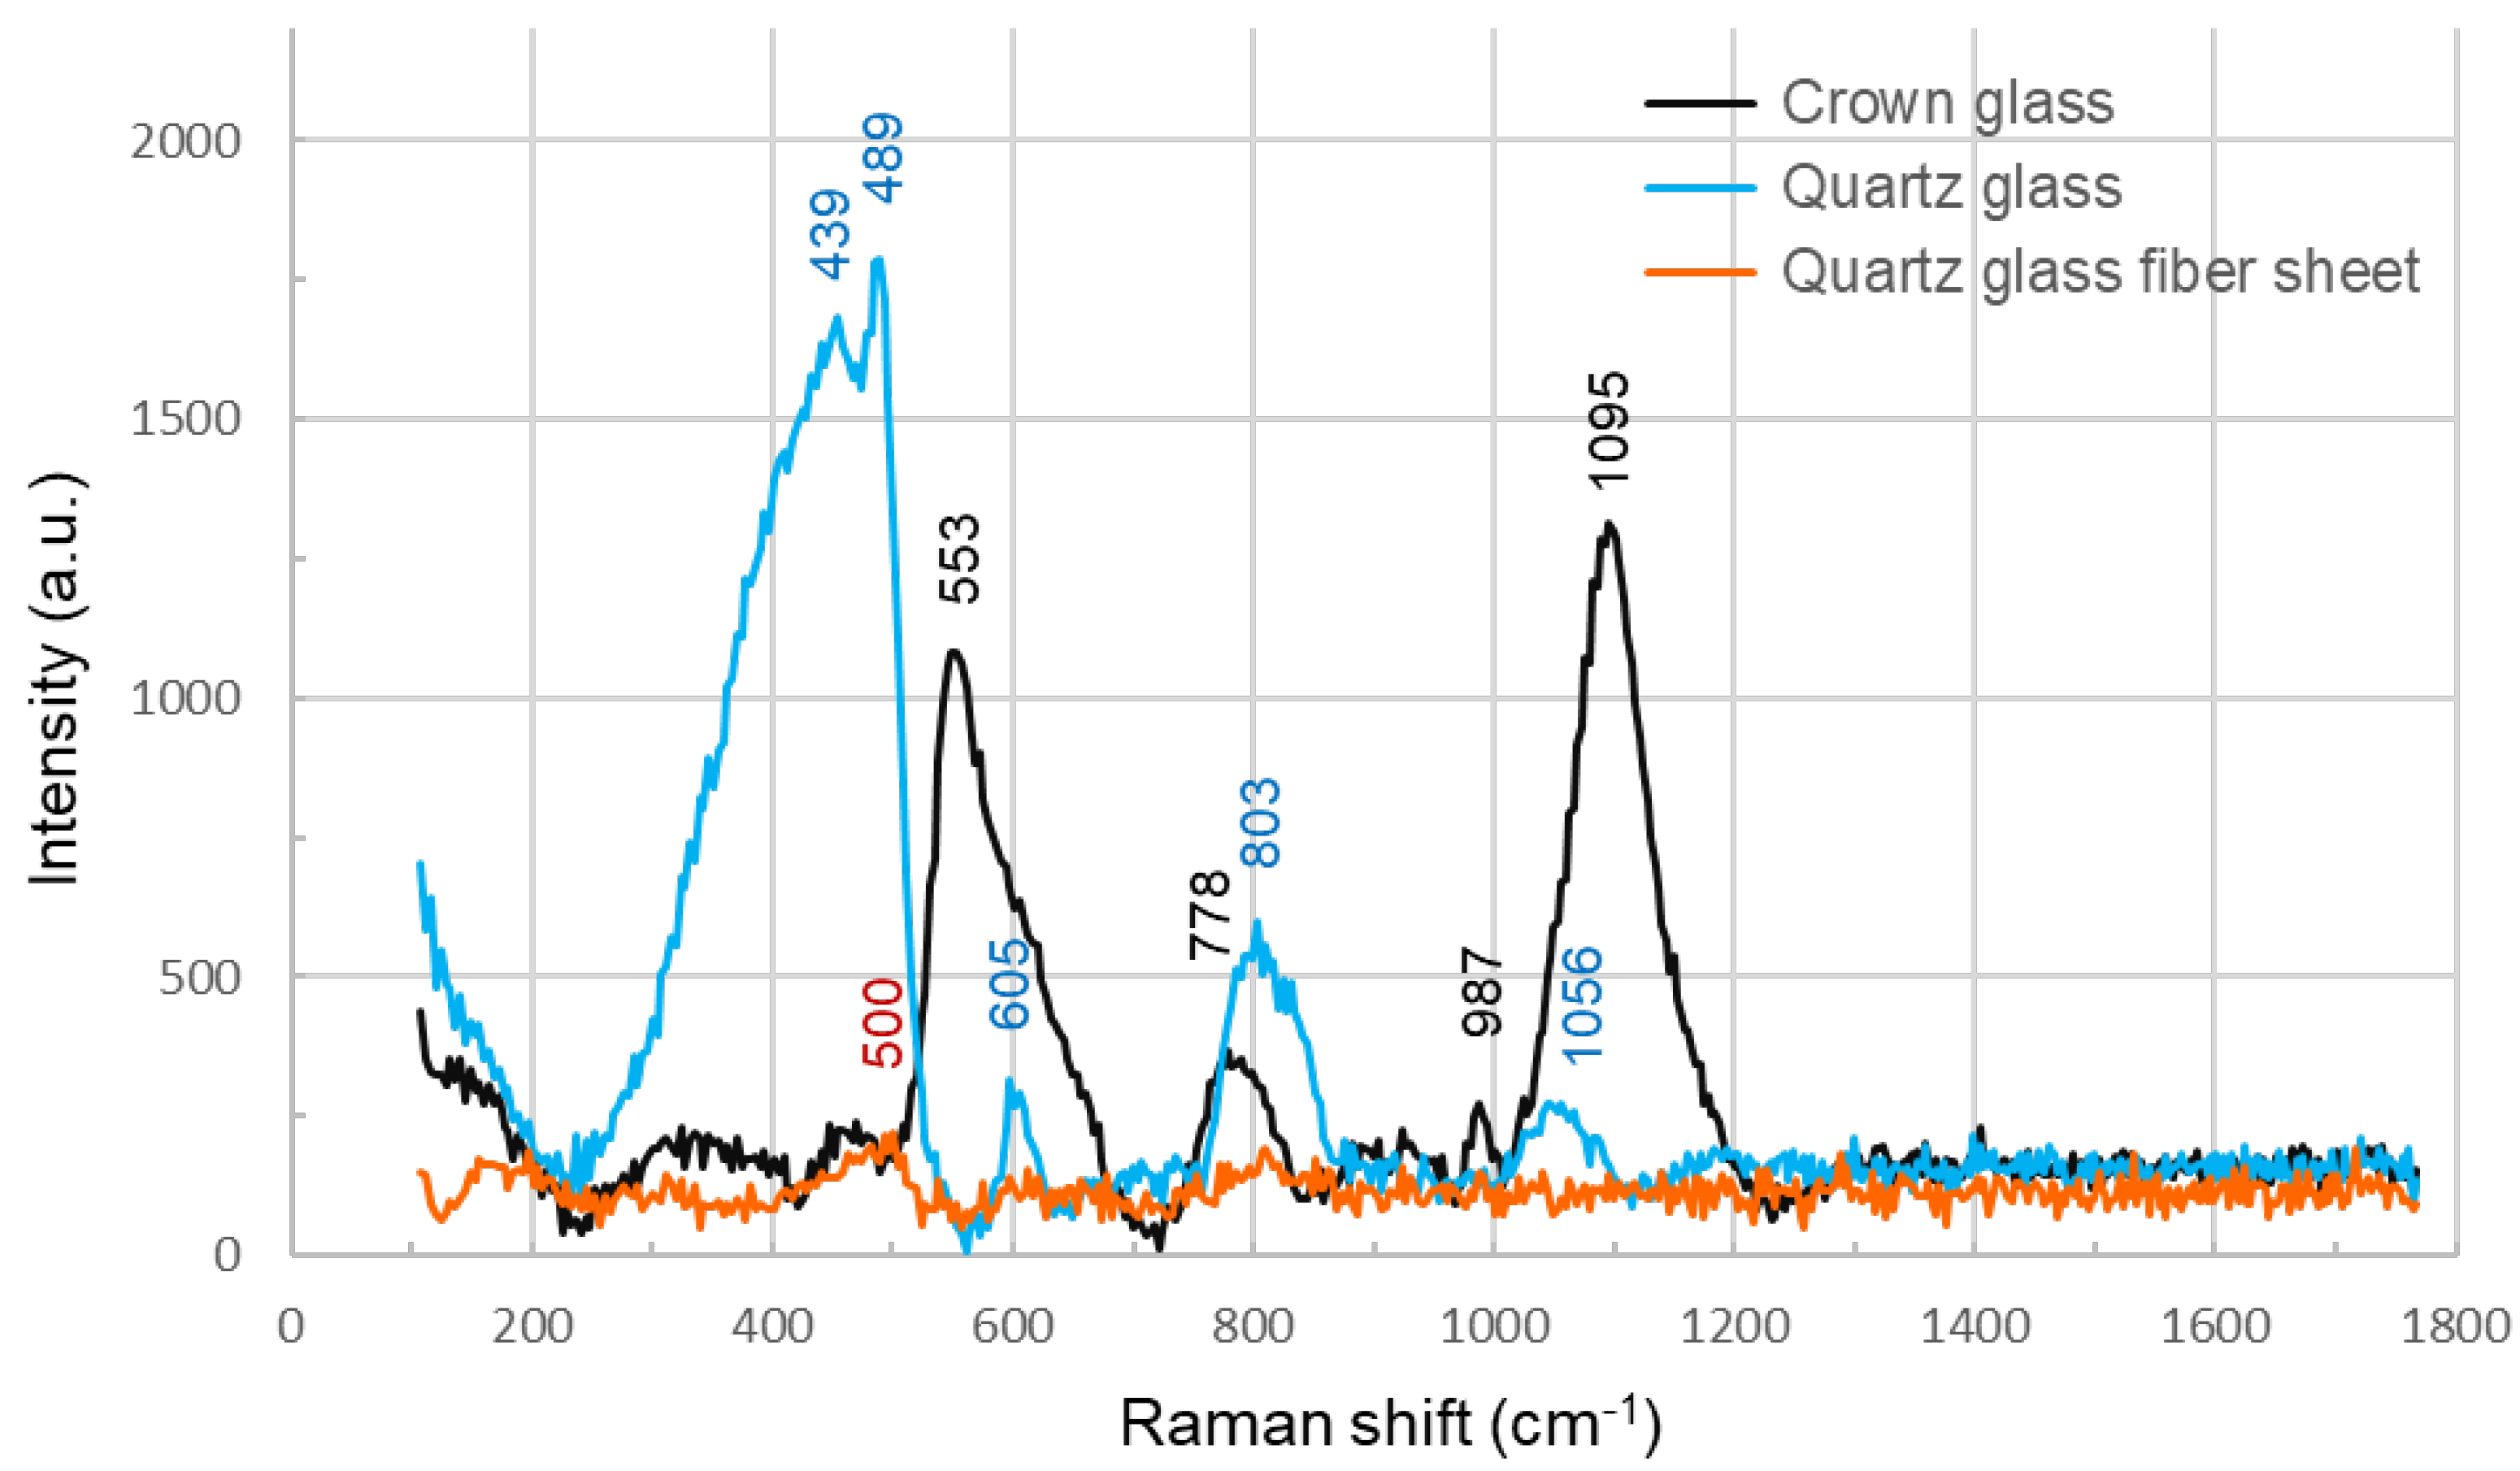
Figure 3.
Raman spectra of the test sample in solid and aqueous solution (1 mol/dm3). Raman spectra of the aqueous test sample were recorded using two methods: needle method (NM) and quartz sheet method (QSM). (a) Raman spectra of sodium benzoate (C7H5NaO2, molecular weight: 144.1). Spectra of the solid state and the aqueous solution recorded by QSM had the same Raman shift, but the Raman spectra of the aqueous solution recorded by NM had different Raman shifts, e.g., no peak was observed at 1435 cm-1, whereas a peak was observed at 1393 cm-1 (red numbers). Scattered light intensity of the Raman spectra recorded by QSM increased in a positive correlation with the number of drops. (b) Raman spectra of sodium sulfate (Na2SO4, molecular weight: 142.04). Spectra of the solid state and the spectra of the aqueous solution recorded by QSM had the same Raman shift, but the Raman spectra of the aqueous solution recorded by NM had different Raman shifts, e.g., no peak was observed at 994 cm-1, whereas a peak was observed at 980 cm-1 (red numbers). Scattered light intensity of the Raman spectra recorded by QSM increased in a positive correlation with the number of drops.
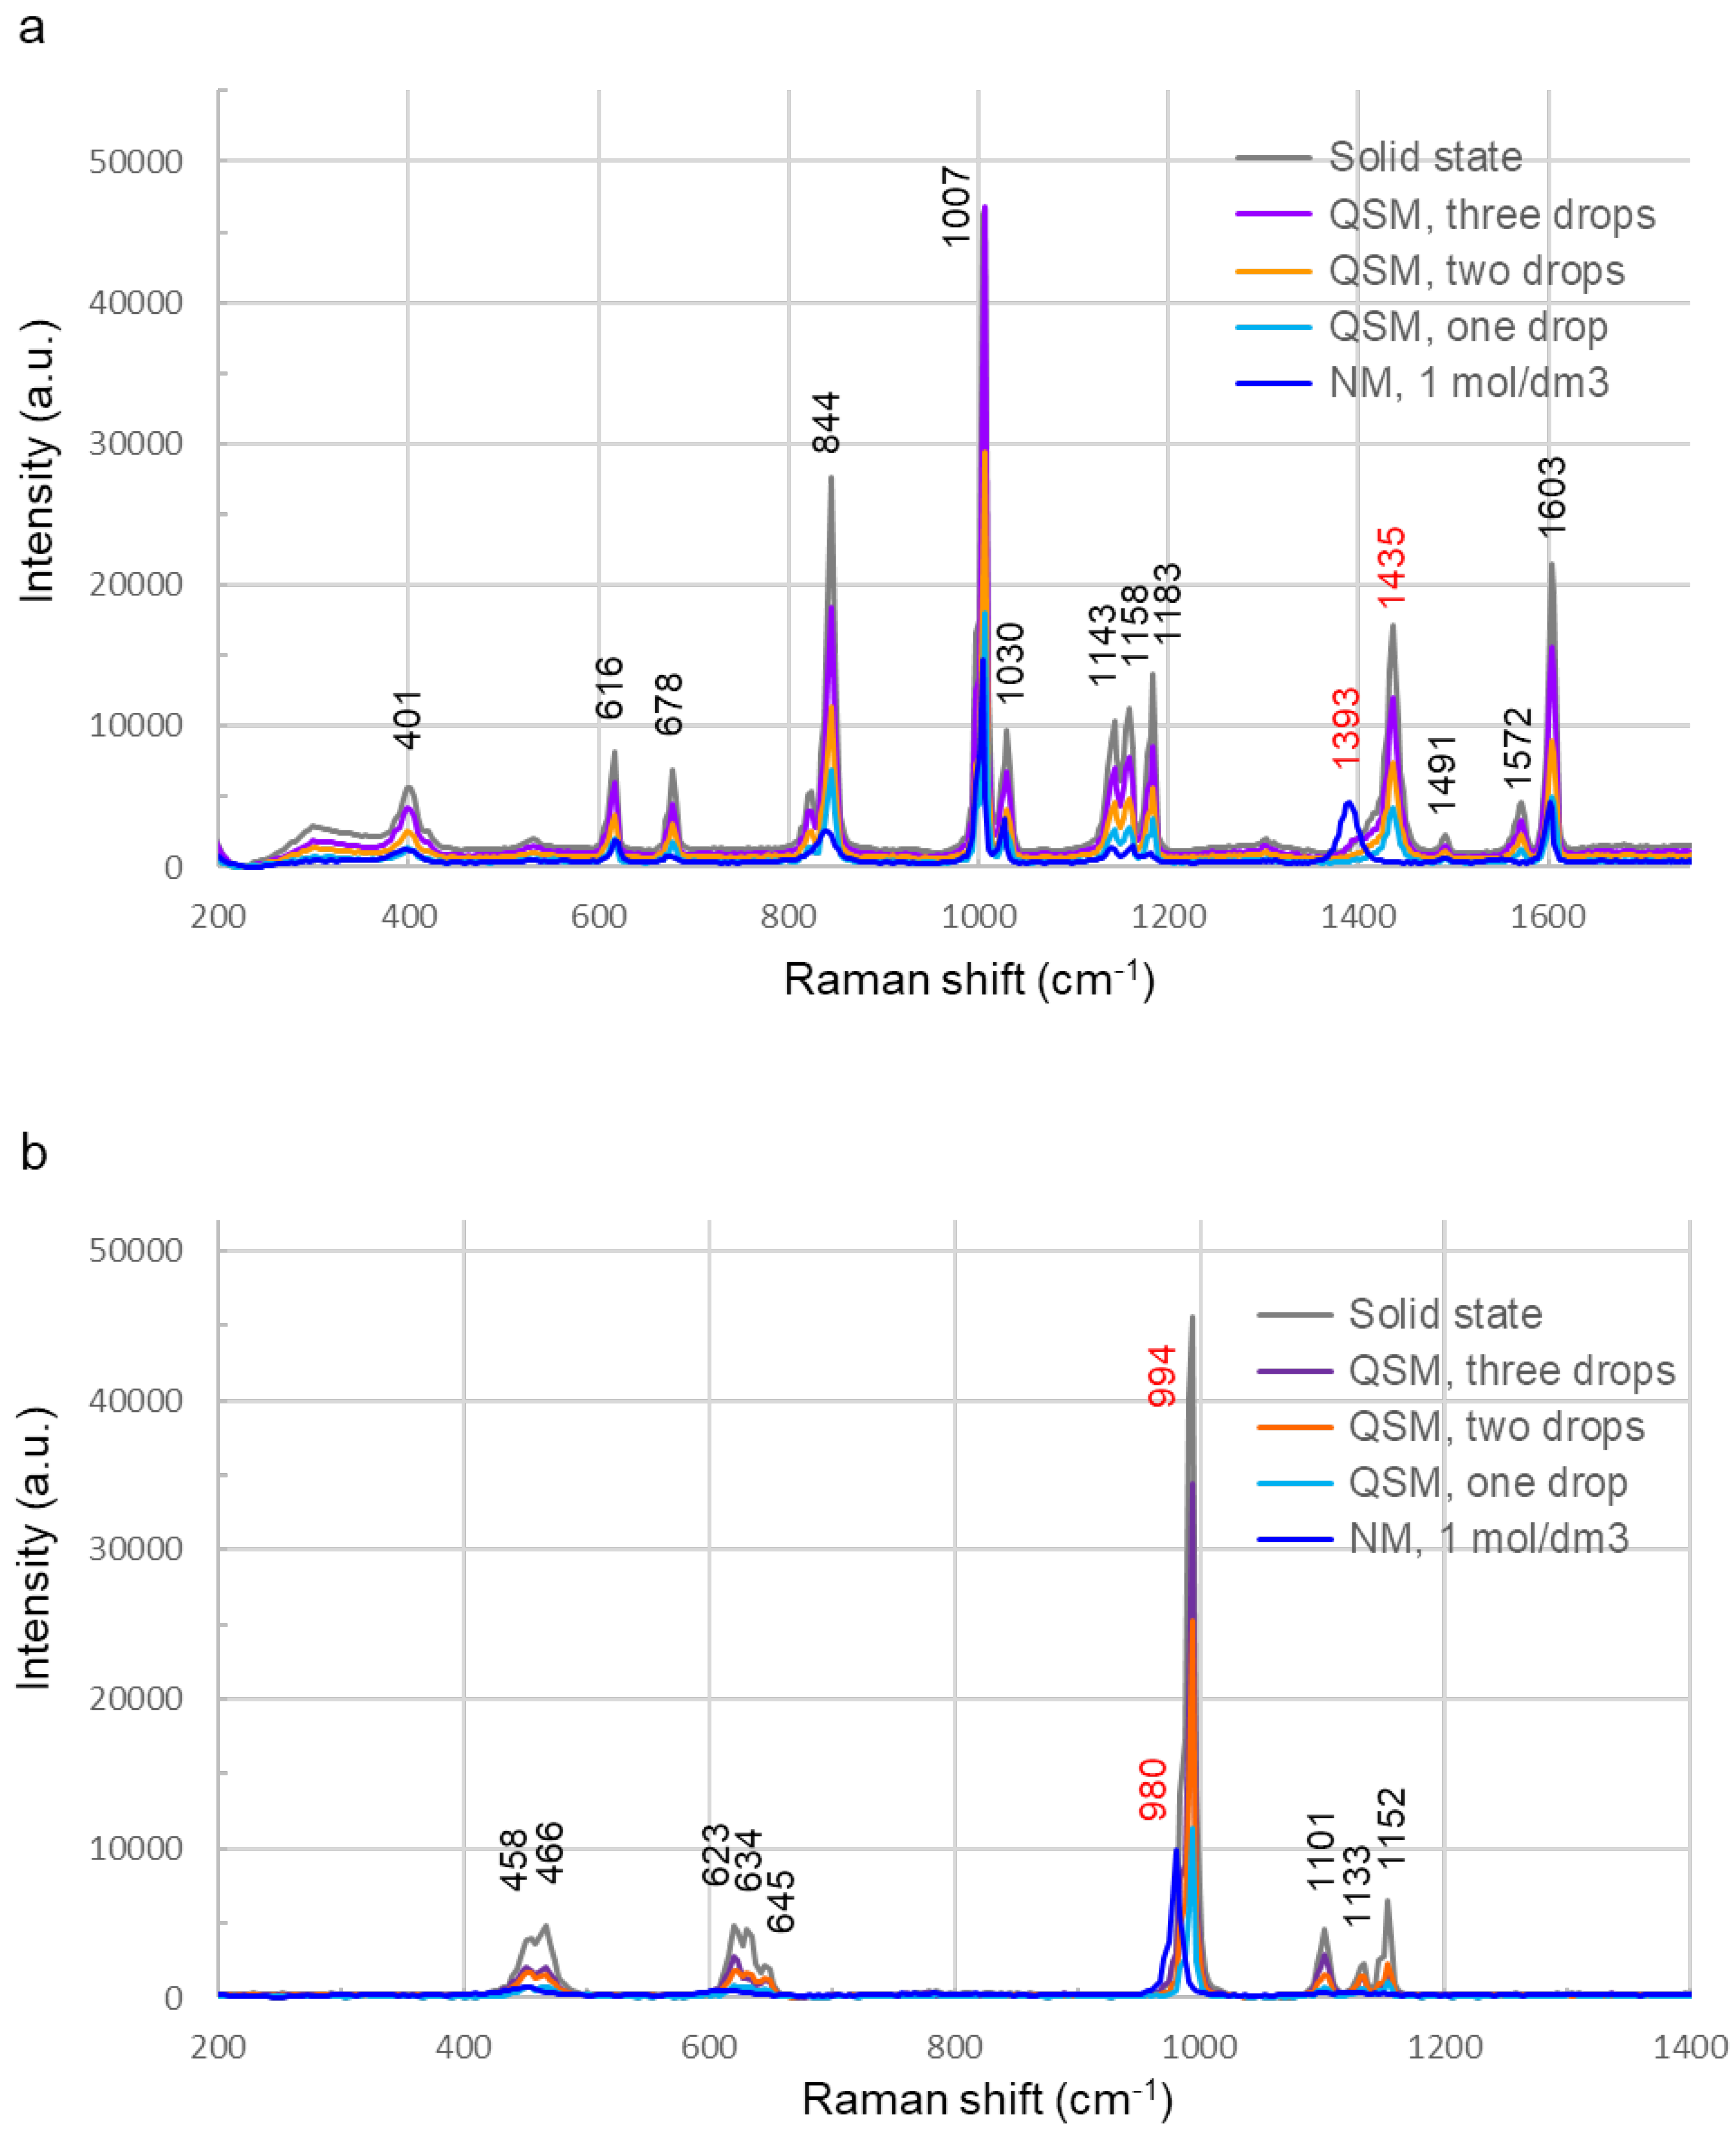
Figure 4.
Averaged Raman spectra of the serum. (a) The Raman spectra recorded by the QSM method had higher scattered light intensity than the spectra recorded by the NM method, and the scattered light intensity increased with the number of serum drops. (b) In QSM, the position showing the highest scattered light intensity shifted from the periphery to the center as the number of serum drops increased. (c) As the number of serum drops increased, the scattered light intensity increased, and the position showing the highest scattered light intensity tended to shift from the periphery toward the center. After five drops of serum were dropped, significant differences were observed for all combinations of positions, with p values less than 0.01. After 10 drops of serum were dropped, significant differences were observed for the 0.1 mm and 0.5 mm combinations, with p values less than 0.01 for all other combinations.
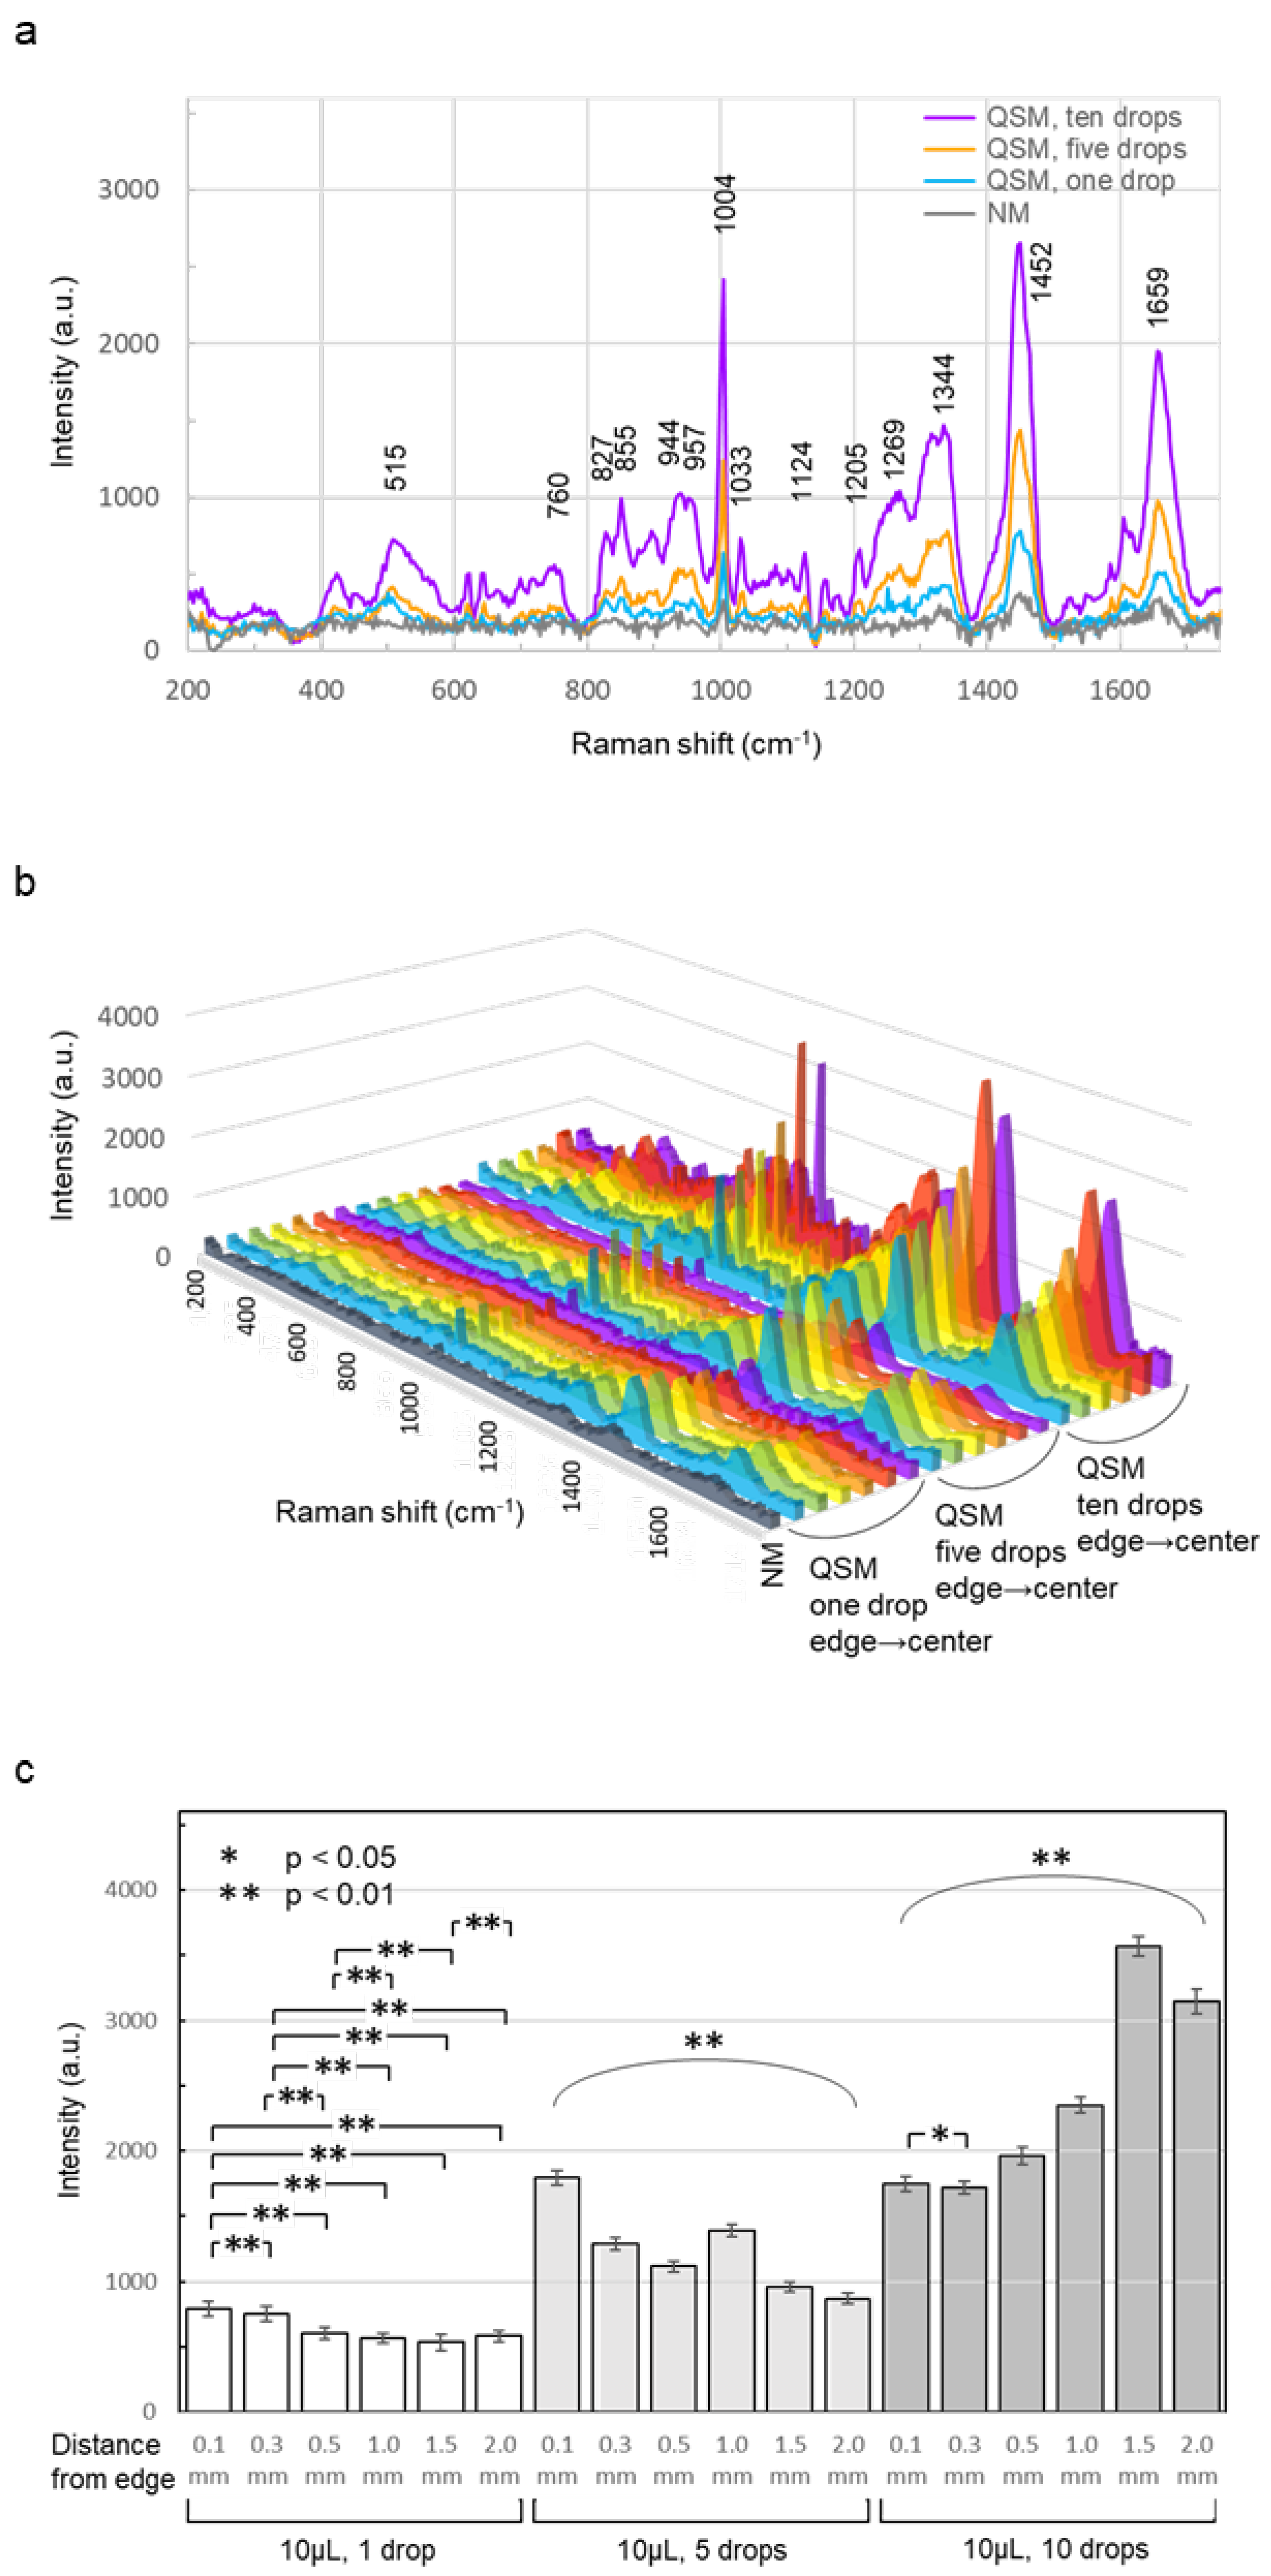
Figure 5.
Averaged Raman spectra of urine. (a) The scattered light intensity of the Raman spectrum obtained by QSM was higher than that obtained by NM, and increased with the number of drops of sample. However, there was no clear difference between the 5-drop and 10-drop samples except for the peak at 1000 cm-1. (b) When the scattered light intensity was examined according to the position on the sheet, the scattered light intensity was highest at 1.0 mm from the edge after 5 drops and at 2.0 mm (center) after 10 drops. (c) When the Raman scattered light intensity of the peak around 1000 cm-1 was compared, the scattered light intensity was similar between the 0.1 mm and 1.0 mm positions from the edge after 5 and 10 drops of urine. The scattered light intensity at 1.5 mm and 2.0 mm positions increased significantly after 10 drops.
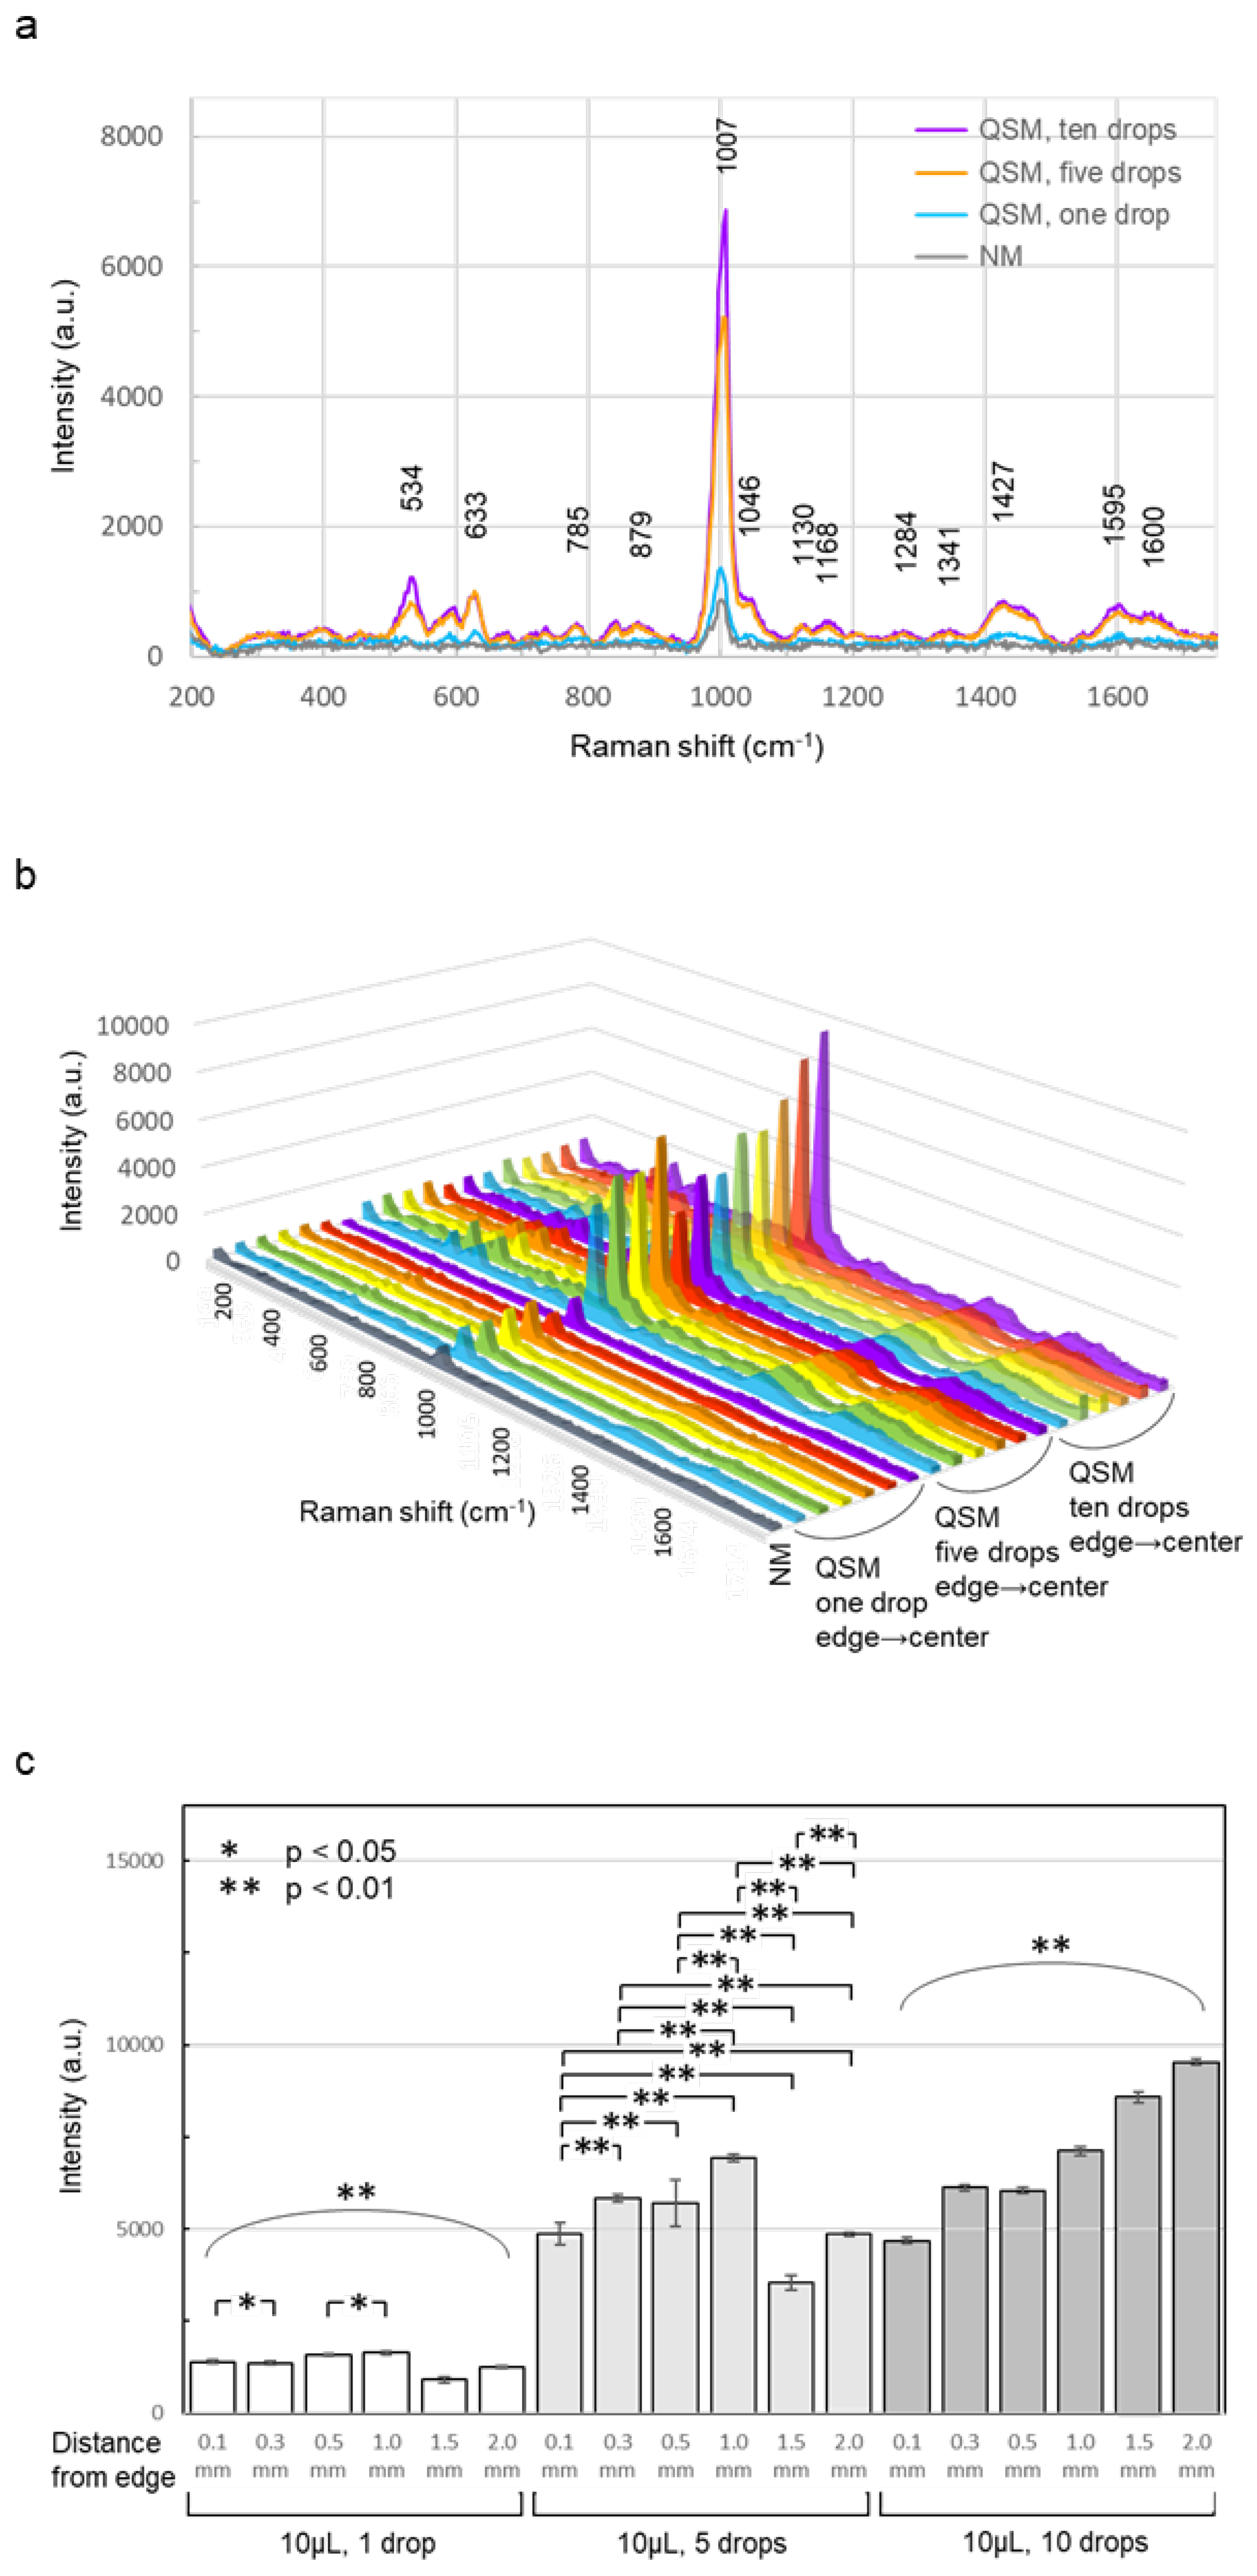
Figure 6.
Surface condition of a quartz glass fiber sheet after serum application. A 4 mm diameter, quartz glass fiber sheet (same as that used to record Raman spectra) was examined under a microscope after serum application. Serum (10 μL) was applied as five treatments: (a) no serum, (b) one drop, (c) three drops, (d) five drops, and (e) ten drops, with a 15-min interval between applications. A sheet without serum application served as control. A fine fibrous structure was observed on the surface of the sheet without serum application. A very fine granular structure was observed on the surface of the sheet with one serum application. A coarse granular structure was observed from the edge to the center on the surface of the sheet with three serum applications. In the center, a mixture of fine- and coarse-grained structures was observed. On the surface of the sheet with five drops of serum applied, a slightly uneven, rock-like structure was observed from the edge to the center. On the surface of the sheet with ten drops of serum applied, a relatively uniform, rock-like structure was observed from the edge to the center.
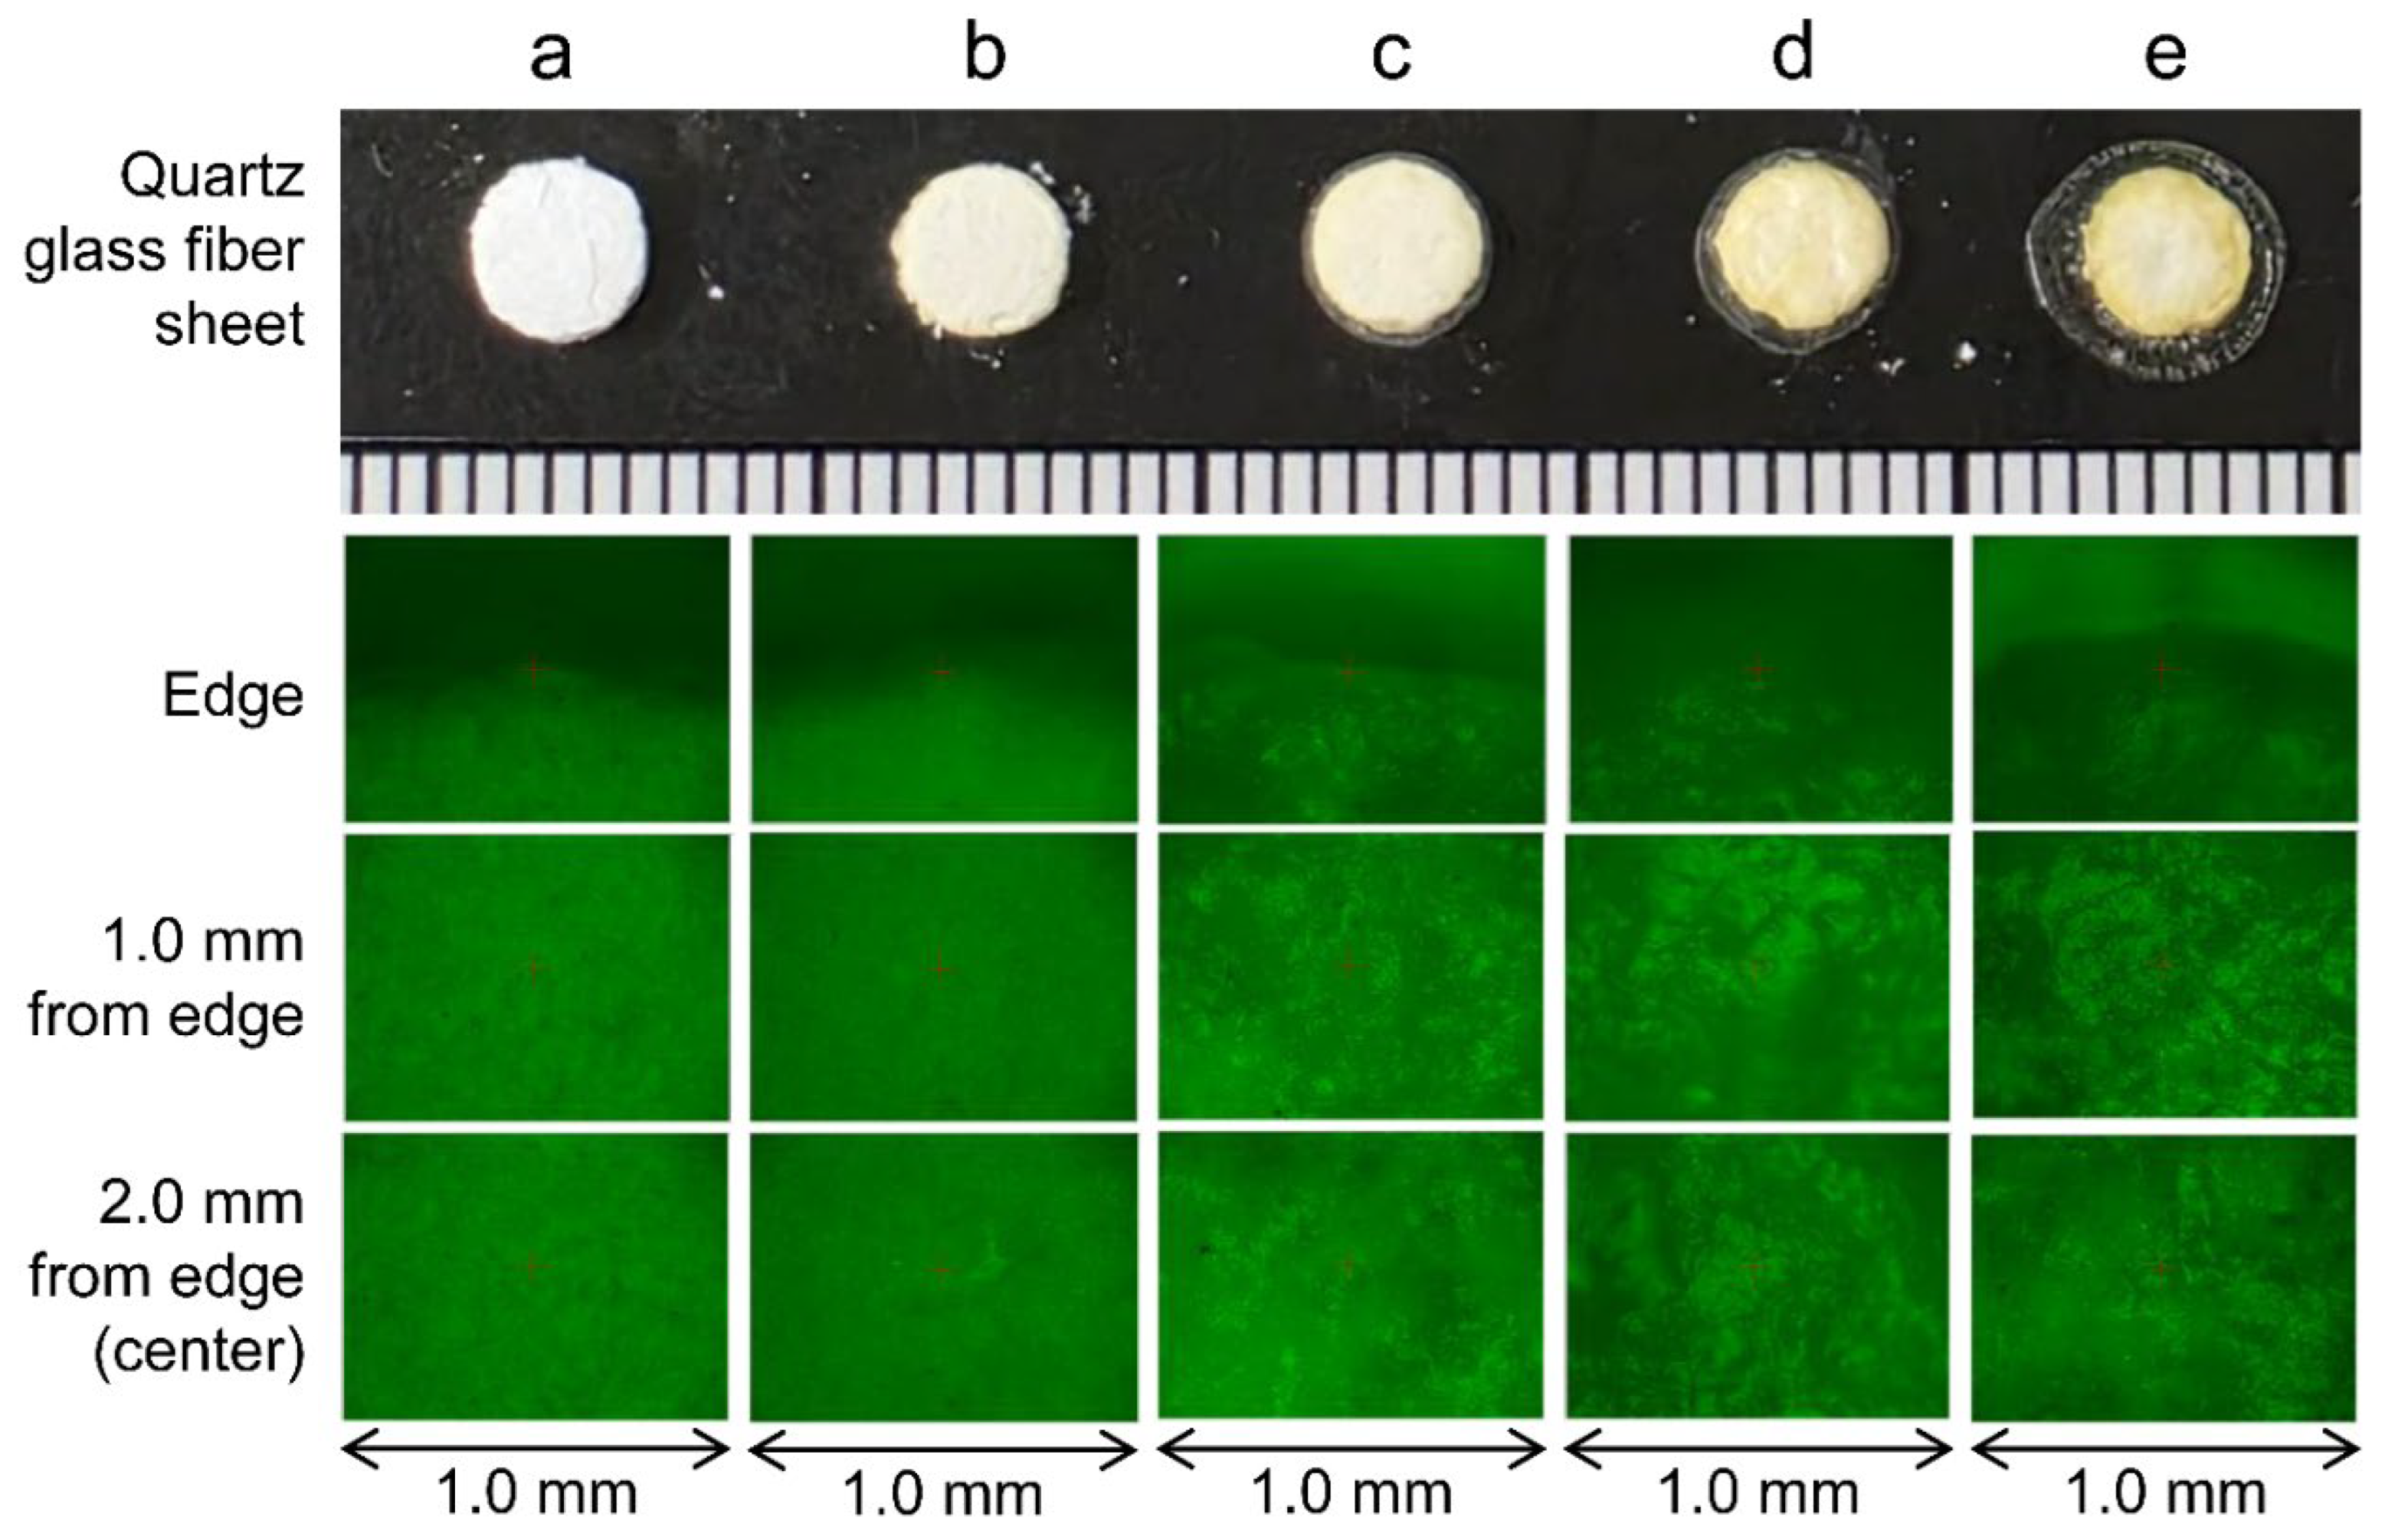
Figure 7.
Verification of spreading using quartz slides and serum. (a) Immediately after 10 μL of serum was dropped onto a glass slide. (b) Twenty-five minutes after 10 μL of serum was dropped onto a glass slide, the serum had almost completely dried. Visual observation revealed that the permeability of the dried serum decreased at the periphery, while the permeability from the center to the middle was relatively high. (c) An additional 20 μL of serum was dropped onto the dried serum (30 μL in total). After the serum dried, the permeability at the outermost periphery remained unchanged, but the thickness of the sample increased from the center to the outermost periphery, and the permeability decreased. (d) When the fifth drop of serum (50 μL in total) was observed in its dried state, it was possible to distinguish three regions based on their transparency characteristics: the outermost periphery, the center to the middle, and a region between the two. (e) An additional 50 μL of serum was dropped onto the dried serum (100 μL in total). The thickened area spread from the center to the periphery.
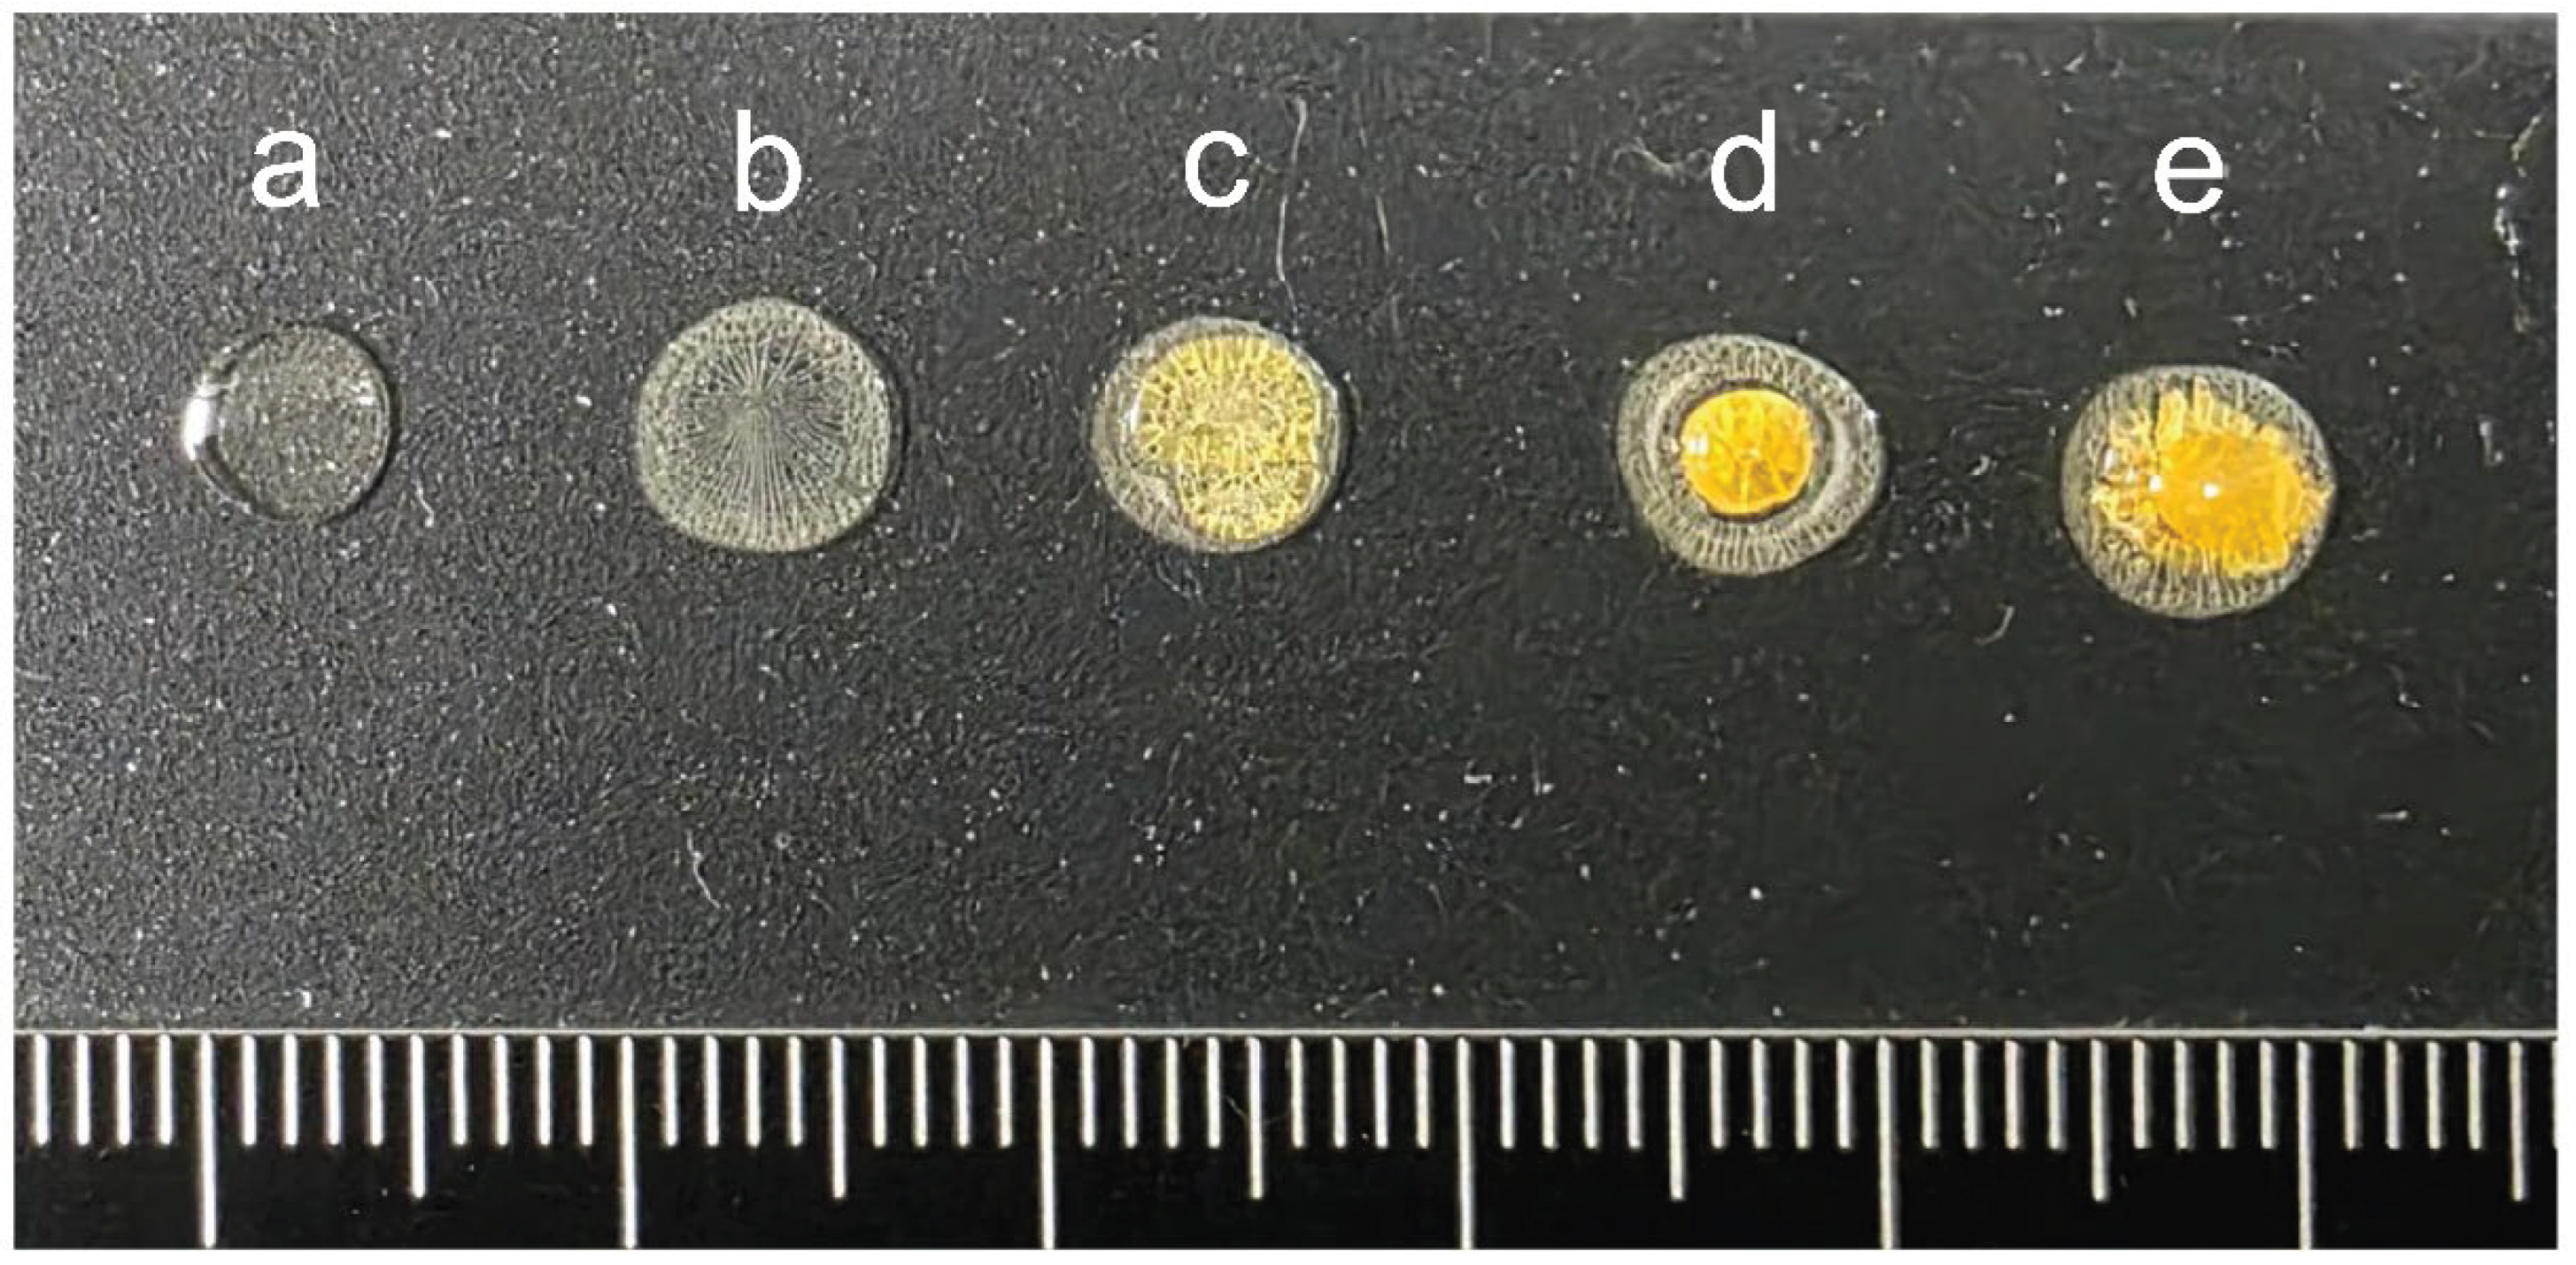

Table 1.
Summary of sample types, measurement methods, number of measurement locations, and number of recorded Raman spectra.
Table 1.
Summary of sample types, measurement methods, number of measurement locations, and number of recorded Raman spectra.
| Crown and quartz glass, and quartz glass fiber sheet | ||
|---|---|---|
| Sample | Number of measurement points | Number of total spectra |
| Crown glass | 5 | 25 |
| Quartz glass | 5 | 25 |
| Quartz glass fiber sheet | 5 | 25 |
| Sodium benzoate and sodium sulfate | ||
| Method | Number of measurement points | Number of total spectra |
| Solid state | 4 | 20 |
| NM | 1 (4 sets) | 20 |
| QSM, one drop | 1 | 20 |
| QSM, two drops | 1 | 20 |
| QSM, three drops | 1 | 20 |
| Serum and urine | ||
| Method | Number of measurement points | Number of total spectra |
| NM | 1 | 5 |
| QSM, one drop | 6 | 300 |
| QSM, five drops | 6 | 300 |
| QSM, ten drops | 6 | 300 |
Table 2.
Comparison of sample concentrations between NM and QSM.
| Sodium benzoate (molecular weight 144.1) | Sodium sulfate (molecular weight 142.04) | |||
|---|---|---|---|---|
| Weight percent | Weight/volume percent (g/100 mL) | Weight percent | Weight/volume percent (g/100 mL) | |
| NM (1 mol/dm3) | 12.60% | 14.41% | 12.436% | 14.204% |
| QSM with one drop (1 mol/dm3, 10 μL) | 40.29% | 12.08% | 39.945% | 11.902% |
| QSM with two drops (1 mol/dm3, 20 μL) | 57.44% | 24.15% | 57.087% | 23.805% |
| QSM with three drops (1 mol/dm3, 30 μL) | 66.93% | 36.23% | 66.616% | 35.707% |
Table 3.
Scattered light intensity of the Raman spectra of crown glass, quartz glass, quartz glass fiber sheet, sodium benzoate, and sodium sulfate.
Table 3.
Scattered light intensity of the Raman spectra of crown glass, quartz glass, quartz glass fiber sheet, sodium benzoate, and sodium sulfate.
| Slide glass and quartz glass fiber sheet | |||
|---|---|---|---|
| Sample | Raman shift (cm-1) | Intensity (a.u.), mean (standard deviation) | |
| Crown glass | 1095 | 1601.60 (394.48) | |
| Quartz glass | 489 | 1788.22 (177.29) | |
| Quartz glass fiber sheet | 501 | 217.94 (83.72) | |
| Sodium benzoate | |||
| Method | Intensity at 844 cm-1 (a.u.), mean (standard deviation) | ||
| Solid state | 27626.93 (341.00) | ||
| NM | 2330.58 (506.48) | ||
| QSM, one drop | 6841.43 (164.55) | ||
| QSM, two drops | 11434.46 (95.09) | ||
| QSM, three drops | 18355.08 (537.99) | ||
| Sodium sulfate | |||
| Method | Intensity at 1101 cm-1 (a.u.), mean (standard deviation) | ||
| Solid state | 4551.01 (43.01) | ||
| NM | 351.62 (103.64) | ||
| QSM, one drop | 753.76 (47.22) | ||
| QSM, two drops | 1589.95 (46.51) | ||
| QSM, three drops | 2869.23 (47.31) | ||
Table 4.
Scattered light intensity of the Raman spectra of serum and urine.
| Serum | ||
|---|---|---|
| Method | Intensity at 1004 cm-1 (a.u.), mean (standard deviation) | |
| NM | 231.88 (39.66) | |
| QSM, one drop | Overall | 638.15 (109.91) |
| 0.1 mm from edge | 790.37 (52.77) | |
| 0.3 mm from edge 0.5 mm from edge |
753.95 (54.12) | |
| 604.36 (48.05) | ||
| 1.0 mm from edge | 566.56 (40.62) | |
| 1.5 mm from edge | 533.17 (62.15) | |
| 2.0 mm from edge | 580.49 (41.86) | |
| QSM, five drops | Overall | 1236.82 (309.75) |
| 0.1 mm from edge | 1794.66 (53.33) | |
| 0.3 mm from edge 0.5 mm from edge |
1288.61 (50.58) | |
| 1117.50 (40.85) | ||
| 1.0 mm from edge | 1390.06 (48.04) | |
| 1.5 mm from edge | 960.55 (38.50) | |
| 2.0 mm from edge | 869.57 (45.07) | |
| QSM, ten drops | Overall | 2417.79 (710.31) |
| 0.1 mm from edge | 1750.64 (53.99) | |
| 0.3 mm from edge 0.5 mm from edge |
1720.49 (46.24) | |
| 1965.77 (63.71) | ||
| 1.0 mm from edge | 2352.48 (61.82) | |
| 1.5 mm from edge | 3569.55 (76.74) | |
| 2.0 mm from edge | 3147.82 (94.89) | |
| Urine | ||
| Method | Intensity around 1000 cm-1 (a.u.), mean (standard deviation) | |
| NM | 754.45 (121.16) | |
| QSM, one drop | Overall | 1357.38 (248.37) |
| 0.1 mm from edge | 1394.70 (51.53) | |
| 0.3 mm from edge 0.5 mm from edge |
1362.09 (55.91) | |
| 1595.20 (31.53) | ||
| 1.0 mm from edge | 1636.66 (58.85) | |
| 1.5 mm from edge | 902.98 (73.73) | |
| 2.0 mm from edge | 1252.66 (31.93) | |
| QSM, five drops | Overall | 6254.91 (707.35) |
| 0.1 mm from edge | 4858.71 (94.01) | |
| 0.3 mm from edge 0.5 mm from edge |
6035.36 (94.12) | |
| 6500.81 (128.92) | ||
| 1.0 mm from edge | 7054.76 (154.24) | |
| 1.5 mm from edge | 6375.96 (67.03) | |
| 2.0 mm from edge | 6703.86 (159.59) | |
| QSM, ten drops | Overall | 6871.53 (1766.02) |
| 0.1 mm from edge | 4687.70 (96.28) | |
| 0.3 mm from edge 0.5 mm from edge |
6125.93 (86.88)) | |
| 6043.01 (75.05) | ||
| 1.0 mm from edge | 7119.49 (113.11)) | |
| 1.5 mm from edge | 8589.06 (146.10) | |
| 2.0 mm from edge | 9538.70 (87.24) | |
Disclaimer/Publisher’s Note: The statements, opinions and data contained in all publications are solely those of the individual author(s) and contributor(s) and not of MDPI and/or the editor(s). MDPI and/or the editor(s) disclaim responsibility for any injury to people or property resulting from any ideas, methods, instructions or products referred to in the content. |
© 2026 by the authors. Licensee MDPI, Basel, Switzerland. This article is an open access article distributed under the terms and conditions of the Creative Commons Attribution (CC BY) license (http://creativecommons.org/licenses/by/4.0/).
Copyright: This open access article is published under a Creative Commons CC BY 4.0 license, which permit the free download, distribution, and reuse, provided that the author and preprint are cited in any reuse.


