
Submitted:
08 January 2026
Posted:
09 January 2026
You are already at the latest version
Abstract
Financial analysis is crucial for informed decision-making among stakeholders of public companies. Yet extracting insight from lengthy and complex annual reports remains a significant challenge. Mirroring the proven capabilities of Deep Research Agents, we propose the Financial Deep Document Research (FinDDR) Challenge to motivate the development of AI agents that adopt methodologies similar to Deep Research. The FinDDR Challenge introduces a richly structured, industry-diverse dataset and requires participants to generate comprehensive, sectioned research reports. This is accomplished through a hierarchical, stepwise reasoning framework that closely emulates the analytical methodologies employed by professional financial analysts. In conclusion, the FinDDR Challenge seeks to establish new benchmarks for complex document-based deep research in financial AI applications, fostering progress and collaboration across both academic and industry communities. The benchmark is publicly available at https://OpenFinArena.com/.
Keywords:
document understanding
; FinDoc research
; AI for finance
1. Introduction
Financial analysis underpins strategic decision-making by leveraging annual reports to conduct critical evaluations, including profitability assessments, liquidity tests, and solvency analysis. For stakeholders in a public company, understanding key aspects of the company is imperative for making informed decisions. With the advent of Generative AI, RAG systems [1,2] have a proven track record of enhancing Large Language Models (LLMs) generation by retrieving relevant knowledge from external sources. Moreover, the emergence of Deep Research Agents [3,4], which are sophisticated AI systems capable of autonomously conducting comprehensive, multi-faceted research investigations that simulate or exceed human-level analytical depth, has transformed the research landscape. These agents are able to execute a pipeline of intelligent jobs such as multi-source retrieval, iterative query refinement, and autonomous planning. By seamlessly integrating these capabilities, Deep Research Agents not only accelerate the research process but also enhance the quality and reliability of insights across various domains. In the financial analysis domain, the challenge remains in effectively extracting relevant information and providing deep insights from complex and lengthy data such as texts and tables in annual reports. Given the demonstrated capabilities of Deep Research Agents, we believe that a similarly comprehensive analytical approach is necessary to replicate the workflow of a professional analyst in order to capture the inherent complexity and diversity of information contained within annual reports.
To accomplish this, we present the Financial Deep Document Research (FinDDR) Challenge, a competition framework that advances AI agents that leverages the principles of Deep Research methodology for document analysis, or Deep Document Research (DDR), by designing a detailed, extensive question framework and a targeted evaluation framework. In this competition, we expect the participants to build their input prompts, develop their DDR agents, and generate the output using their agents, as described in Figure 1. This challenge introduces a novel and richly structured dataset for financial analysis grounded in annual reports from more than 100 publicly listed companies across eight global markets. The tasks in this competition are meticulously categorized into three distinct types. For each task type, we have developed and validated a specialized evaluation framework using an "LLM as a Judge" approach, which is custom-tailored to assess the nuanced quality of responses across all three categories.
The highlights of this challenge include:
- A Diverse, Multi-lingual, and Structured Dataset: We provide a benchmark dataset featuring complex, interdependent questions designed to cover realistic analytical scenarios. The dataset’s industry and linguistic diversity makes it a robust test for Deep Document Research systems/agents in the Finance domain.
- A Novel Evaluation Framework for Financial Report: We develop a specialized evaluation framework that employs tailored assessment methodologies for each task type to facilitate robust evaluation.
2. Competition Timeline
The competition ran for approximately two months, from August 20, 2025, to October 22, 2025, and was structured in two phases.
Phase I (Development Phase): The competition commenced on August 20, 2025, with the release of a Sample dataset on August 25, 2025, consisting of paired annual reports and corresponding ground truth labels to assist participants in developing their DDR agents. Subsequently, a Validation set was released on September 15, 2025, enabling contestants to refine their approaches and submit predictions to the public leaderboard. Throughout this phase, participants could submit multiple entries to receive continuous feedback on their model performance.
Phase II (Evaluation Phase): The final Test set was released on October 6, 2025, marking the beginning of the evaluation period. Participants had until October 22, 2025, to submit their predictions via the private leaderboard, which remained closed throughout this period to ensure fair evaluation. Multiple submissions were permitted, though only the final submission was considered for the final ranking. Following the competition deadline, evaluation results were compiled and the top three performing teams were asked to submit technical reports documenting their methodologies. Award announcements of winning teams will take place on November 16, 2025, during which the top contestants will be invited to present their solutions.
3. Task Definition
Participants are provided with a corpus of multi-year annual reports and a structured question guideline. The guideline is designed to emulate the analytical workflow of professional financial analysts, progressing from basic fact extraction to in-depth interpretation and judgment. This section outlines the two key components of our task design: the hierarchical structure of the question guideline and the task types.
3.1. Structure of Question Guideline
Unlike existing QA datasets that present isolated questions, our competition introduces a structured and interrelated question design. Inspired by how human analysts approach annual reports, we organize questions into thematic, logically progressive groups that mirror comprehensive financial analysis stages, producing a structured report with sections and subsections. Similar to [5], we have defined the six main sections as follows: Company Overview (), Financial Performance (), Business Analysis (), Risk Factors (), Corporate Governance (), and Future Outlook (), where denotes section x with .
Please refer to Appendix A for the full details of the section and subsection structure of the expected output report. Participants are expected to follow this hierarchy and generate a structured financial report for each company in an integrated format, then write them in a markdown file (.md).
3.2. Dataset Task Types
We distinguish three fundamental task types that form a comprehensive evaluation hierarchy. These tasks reflect the cognitive processes required for thorough financial document analysis:
- Extraction: These tasks require direct retrieval of explicitly stated information from the report without transformation or interpretation.
- Calculation: These tasks require performing arithmetic operations on extracted facts to derive new quantitative metrics.
- Summary: These tasks require synthesizing, interpreting, and articulating insights from extracted facts (and calculated metrics) into coherent narratives.
These task types are arranged in a bottom-up reasoning hierarchy: Extraction and Calculation questions provide the factual foundation, while Summary questions simulate financial thinking by requiring the model to combine, interpret, and reflect on information given in the annual reports.
4. Evaluation
Similar to [5], we implement a multi-faceted evaluation framework comprising three distinct protocols, each tailored to the answer characteristics of different task types.
Each sub-section in a report is associated with a specific task type. To evaluate a sub-section, we define scoring elements called "grading items". To evaluate the report, we first extract the predicted grading items and then assess it against the corresponding ground truth grading items using one of the following protocols:
- Accuracy: This protocol provides deterministic evaluation for questions with unambiguous, factual answers. We employ an advanced LLM to evaluate the correctness by comparing the predicted answer to the ground truth, assigning a score of 1 for correct matches and 0 otherwise. This method is applied to all grading items in the Extraction and Calculation categories.
- Claim-based Score: To accommodate responses with multiple factual elements, we employ a claim-based scoring method. First, an advanced LLM identifies three to five critical reference claims from the ground truth, with the number determined by the length and complexity of the reference answer. The LLM then evaluates whether each claim is substantively addressed in the predicted answer [6]. This method is applied to the majority of the grading items in the Summary category.
- Criterion-based Score: For grading items demanding nuanced reasoning, qualitative judgment, and depth of analysis, we implement a criterion-based evaluation approach[7] that emulates expert human assessment. First, an advanced LLM is prompted to adopt the role of a financial expert to generate a detailed 10-point scoring criterion based on the ground truth. This criterion deconstructs the ideal answer into its core analytical components. Subsequently, the LLM then evaluates the predicted answer against the criterion to output a score for each criterion. This method is applied to some of the Summary grading items.
After evaluating all grading items using their respective protocols for each report, we calculate the average scores from all reports to obtain the overall performance metric:
where N represents the total number of reports and denotes the total score for report i (Max Total Score: 240).
5. Dataset Description
In this section, we will discuss the dataset construction process and statistics.
5.1. Dataset Construction
We emulate the idea of building the dataset in FinDeepResearch[5], in which there are four integral steps:
- Step 1: Public Company Selection. Our dataset construction involved selecting publicly listed companies from eight major financial markets, including the United States (US), United Kingdom (UK), China (CN), Hong Kong (HK), Australia (AU), Singapore (SG), Malaysia (MY), and Indonesia (ID). This geographical diversity enables coverage of four distinct languages: English (EN), Simplified Chinese (zh-CN), Traditional Chinese (zh-HK), and Bahasa Indonesia (BI). The final dataset consists of 104 companies, with their industry representation spans 10 distinct sectors according to the Bloomberg Industry Classification Standard (BICS).
-
Step 2: Document Preparation. Differently from FinDeepResearch, FinDDR datasets consists exclusively of annual reports. We applied the following selection criteria:
- We selected two reports from the Financial Years of 2023 and 2024 to maintain relevancy and information diversity.
- For the US market, we used Form 10-Ks filings instead of the generic annual reports as the former are regulatory compliant and present a more balanced, objective view focused on material facts.
- For markets with multilingual reports (China, Hong Kong, and Indonesia), we selected the predominant local language version: Simplified Chinese for China, Traditional Chinese for Hong Kong, and Indonesian for Indonesia.
- Step 3: Reference Report Generation. We generate a reference report for each company using the two annual reports. During the generation phase, the system systematically processes each company’s documentation through the hierarchical analytical framework, extracting relevant information segments and synthesizing comprehensive responses for each of the six primary report sections. This generation process produces initial draft reports that capture the breadth and depth of information contained within the source annual reports, serving as the foundation for subsequent human expert refinement.
- Step 4: Two-Tier Expert Verification Framework. The final validation phase implements a dual-stage quality assurance protocol. The first round conducts section-based verification, where domain experts evaluate individual report sections for factual accuracy, analytical depth, and adherence to professional financial analysis standards. The second round performs cross-section review, examining the coherence, consistency, and comprehensive integration across all report sections. This verification process culminates in the production of finalized ground truth reports that serve as reference standards for participant evaluation, ensuring that the benchmark maintains the analytical rigor expected in financial research environments.
5.2. Dataset Statistics
The complete dataset statistics are presented in Table 1. The dataset encompasses annual reports from 104 companies across 8 financial markets and 10 industrial sectors. Each output report has 6 sections and 17 sub-sections and 183 Grading Items.
6. Competition Details
In this report, we will focus on discussing and analyzing the methods and results of Phase II.
6.1. Participant Teams
By the end of Phase II, we have received prediction results from a total of 13 different participant teams from around the world. The statistics of the teams are as follows:
- 13 Teams: SilverSight, Finsselaer, Token Refund, Financial Wizard, afinit, e0nia, SI4Fin, ICT-NDST, DeepSeek Your Report, LedgerLens, FinSight, DataLovers, and RUCFinAI.
- 16 Organizations: Fudan University, Shanghai Innovation Institute, DataGrand Inc, Rensselaer Polytechnic Institute, Microsoft Research Asia, Experian, afinit, Individual, A*STAR, Chinese Academy of Sciences, Shanghai University of International Business and Economics, The University of Technology Sydney, Renmin University of China, Rajiv Gandhi Institute of Petroleum Technology, Galgotias University, and Wells Fargo.
- 7 Countries: Singapore, China, US, India, South Korea, Australia, and Malaysia.
6.2. Competition Result
In this section, we delve deep in discussing the results of the competition.
6.2.1. Main Result
See Table 4. SilverSight achieved the highest score of 197.66 out of 240 points (82.4%), establishing a significant 13-point lead over second place (Finsselaer, 184.5). Official baseline methods cluster in the middle rankings (rank 7-9, 13), where the top six teams (SilverSight, Finsselaer, Token Refund, Financial Wizard, afinit and e0nia) surpass the results of the baselines.
6.2.2. Region Performance Result
See Table 5. SilverSight achieves first place across all eight regions without exception, with scores ranging from 188.31 (Hong Kong) to 207.11 (China), demonstrating robust cross-regional performance. The regional difficulty patterns differ between teams. For SilverSight, China (207.11), Singapore (206.28), and UK (204.94) appear easiest, while Hong Kong (188.31) and Indonesia (188.95) present greater challenges, reflecting 15-20 point gaps. However, the third-ranked Token Refund, for instance, shows a different trend with weaker performance in China (167.79) and Hong Kong (163.20) compared to their stronger regions. Despite these varying regional difficulty patterns, one exception stands out: Indonesia consistently ranks among the bottom 1-3 regions for nearly all teams (14 out of 17) and ranks the lowest median score (51.18), suggesting unique challenges in Indonesian financial reporting that current approaches universally struggle to address.
6.2.3. Section Performance Result
See Table 6. Analysis of section-specific performance reveals substantial variation in task complexity and team capabilities. Financial Performance (S2) exhibits the highest median scores (73.93), while Corporate Governance (S3) and Risk Factors (S4) demonstrate significantly lower median scores (38.21 and 45.88 respectively). Performance variance analysis further illuminates divergent team capabilities. SilverSight maintains exceptional consistency across all sections, demonstrating robust generalization capabilities. Conversely, the majority of competing teams exhibit substantial intra-team variance, suggesting specialized rather than generalized competencies. This pattern is exemplified by FinSight, which achieves 43.06 in Risk Factors (S4) while scoring merely 21.04 in Financial Performance (S2)—a 20.02-point differential that underscores section-specific optimization. These findings suggest that most systems possess domain-specialized strengths rather than balanced, cross-sectional analytical capabilities required for comprehensive financial report generation.
6.2.4. Task Type Performance Result
See Table 7. Extraction demonstrates the highest median score (77.71), followed by Calculation (63.19), with Summary exhibiting substantially lower performance (47.88). The systematic performance decay across the hierarchy, with median scores declining approximately 10-15 points per level, underscores the compounding complexity of financial reasoning tasks. Besides, Summary performance exhibits the highest variance and steepest degradation curve, serving as the primary discriminator of system capabilities. While the top three teams (SilverSight, Finsselaer and Token Refund) maintain relatively narrow performance bands in Extraction (83.14-87.52, 4.38-point range) and Calculation (74.25-78.00, 3.75-point range), Summary scores span 19.09 points among the top three teams (61.75-80.84). Furthermore, mid-tier teams experience catastrophic Summary performance collapse. For example, the Baseline-GPT-5-MINI with File Search achieves competitive Extraction (83.36) result yet plummets to 43.32 in Summary, a 40.04-point differential. This pattern indicates that narrative synthesis constitutes the fundamental bottleneck in automated financial report generation, requiring capabilities beyond retrieval and computation.
7. Winning Teams’ Methods
In this section, we introduce the methods implemented by the top three teams in the competition.
7.1. SilverSight
Silversight presents the Multi-level Ensemble Generation Approach (MEGA), a sophisticated pipeline for generating comprehensive financial research reports from annual reports. The system operates through five sequential stages. The team runs OCR recognition using the Qwen3-VL-235B[11] Vision-Language Model (VLM) (enhanced with pdfplumber for precise numerical extraction) on the annual reports. Then, they employ an information extraction process that separately extracts numerical data (using GPT-5[9] and Qwen3-235B[11]) and textual content (using fine-tuned BGE-M3[12] embeddings and Qwen3-Reranker-8B[13]). Subsequently, they run retrieval to retrieve relevant passages for each section and reranking to refine the retrieved results. Finally, they generate the reports using a multi-model ensemble strategy. There are two key strengths of this approach. One, retrieval performance is improved dramatically through fine-tuned retrieval and reranking models for text information extraction and query design, where the recognized text is organized to a representation that mirrors the report’s structure. Two, a robust multi-model ensemble strategy is adopted where three cutting-edge LLMs (GPT-5[9], Qwen3-235B[11], DeepSeek-v3.2[8]) independently generate reports that are then integrated and synthesized by GPT-5, significantly reducing model-specific bias and improving coverage.
7.2. Finsselaer
The Finsselaer method implements a retrieval-augmented generation (RAG) pipeline that processes financial documents through the following stages. The annual reports of years 2023 and 2024 are converted to markdown using Mistral OCR[14] (or Docling[15]), then cleaned and normalized with standardized heading tags. The markdown files are segmented into sections based on ’##’ headings, with each section stored in JSONL format along with rich metadata including section titles, IDs, and exact line ranges. These sections, combining both the section title and content text, are embedded and indexed in FAISS for semantic search. Finally, LLMs process the retrieved context with structured prompts to generate standardized financial reports. The key strength of the method lies in using section information (headings and document structure) as semantic tags during both embedding and retrieval. By encoding "section title + content" together and preserving structural metadata, the system achieves more precise retrieval compared to naive chunking approaches.
7.3. Token Refund
Token Refund’s solution implements a sophisticated RAG-based pipeline that transforms annual report PDFs into structured reports through four key stages. The process begins by parsing raw PDFs using Azure AI Document Intelligence, chunking them into 1000-character segments, and storing them in a vector database. These chunks, combined with a structured question set derived from competition guidelines, feed into the PIKE-RAG framework[16] to generate QA pairs, which are ultimately assembled into comprehensive reports following the prescribed format. The approach demonstrates three notable strengths. One, they convert HTML tables to lightweight markdown format during document processing, which significantly reduces token consumption, thus making the retrieval process more efficient. Two, the question formulation approach employs two strategies: generating a single comprehensive question for each of sub-sections 2.1, 2.2, 2.3, and 5.1, while creating detailed, multiple point-level questions for other sections, thereby providing tailored granularity that matches each section’s analytical requirements. Three, they incorporate few-shot learning by adding 2-3 sample cases from provided reports as examples during the QA phase (particularly for sections 3, 4, 5, and 6), which provides context that guide the model toward generating more appropriately scoped responses.
8. Conclusion
We present FinDDR, a competition designed to advance DDR agents for financial analysis. In Phase II of the competition, 13 teams have participated and submitted their results to the private leaderboard, with the top three winning teams contributing the technical reports of their approaches. With six teams surpassing our baselines, the competition successfully drove substantial improvements in DDR agents, achieving its core objective. Looking back, we identify key opportunities for enhancement. One, the descriptions for the tasks, especially Summary tasks, can be refined and described in a more detailed and concise manner to improve clarity. Two, to bridge the gap between DDR systems and professional financial analysts, more sophisticated, analytical type questions can be defined to challenge the systems’ reasoning and domain expertise. Moving forward, we envision FinDDR evolving beyond a single competition into a continuous benchmark, serving as a foundational platform to foster the development of financial analysis systems.
9. Organization Team
- Project Leader:
- Fengbin Zhu, National University of Singapore
- Chao Wang, 6Estates Pte Ltd
- Tianhui Tan, Asian Institute of Digital Finance
- Dataset Construction and Evaluation:
- Xiang Yao Ng, 6Estates Pte Ltd
- Ziyang Liu, 6Estates Pte Ltd
- Huanchang Zhuo, 6Estates Pte Ltd
- Min Xu, 6Estates Pte Ltd
- Stanley Marcelino, 6Estates Pte Ltd
- Jing Wang, 6Estates Pte Ltd
- Junfeng Li, National University of Singapore
- Chang Liu, Asian Institute of Digital Finance
- Xuan Yao, Asian Institute of Digital Finance
- Hao Zhuang, Asian Institute of Digital Finance
- Ruiqi Zheng, Asian Institute of Digital Finance
- Zixuan Wang, 6Estates Pte Ltd
- Xiaohan Ai, 6Estates Pte Ltd
- Lan Huang, 6Estates Pte Ltd
- Xin Lin, 6Estates Pte Ltd
- Advisor:
- Ke-Wei Huang, Asian Institute of Digital Finance
- Shuo Zhang, Bloomberg
- Fuli Feng, University of Science and Technology of China
- Huanbo Luan, 6Estates Pte Ltd
- Tat-Seng Chua, National University of Singapore
Appendix A. Expected Report Structure
We define the sections as follows:
- Company Overview (): This section provides a concise overview of the company, including its basic information, industry background, key strengths, and strategic direction.
- Financial Performance (): This section presents a detailed analysis of the company’s financial health, including key financial statements and performance metrics, to assess profitability, liquidity, and solvency.
- Business Analysis (): This section provides a summary of a company’s business performance and strategies, offering readers a comprehensive understanding of the company’s business operations, competitive strengths, innovation efforts, and strategies.
- Risk Factors (): This section identifies and discusses the principal risks the company faces, including market, financial, operational, and regulatory risks, along with the strategies in place to manage them.
- Corporate Governance (): This section outlines the company’s governance framework, including the board of directors, executive leadership, governance policies, and practices, ensuring transparency and accountability.
- Future Outlook (): This section provides management’s projections and strategic plans for the future, including anticipated market trends, growth opportunities, and the company’s road map for achieving its objectives.
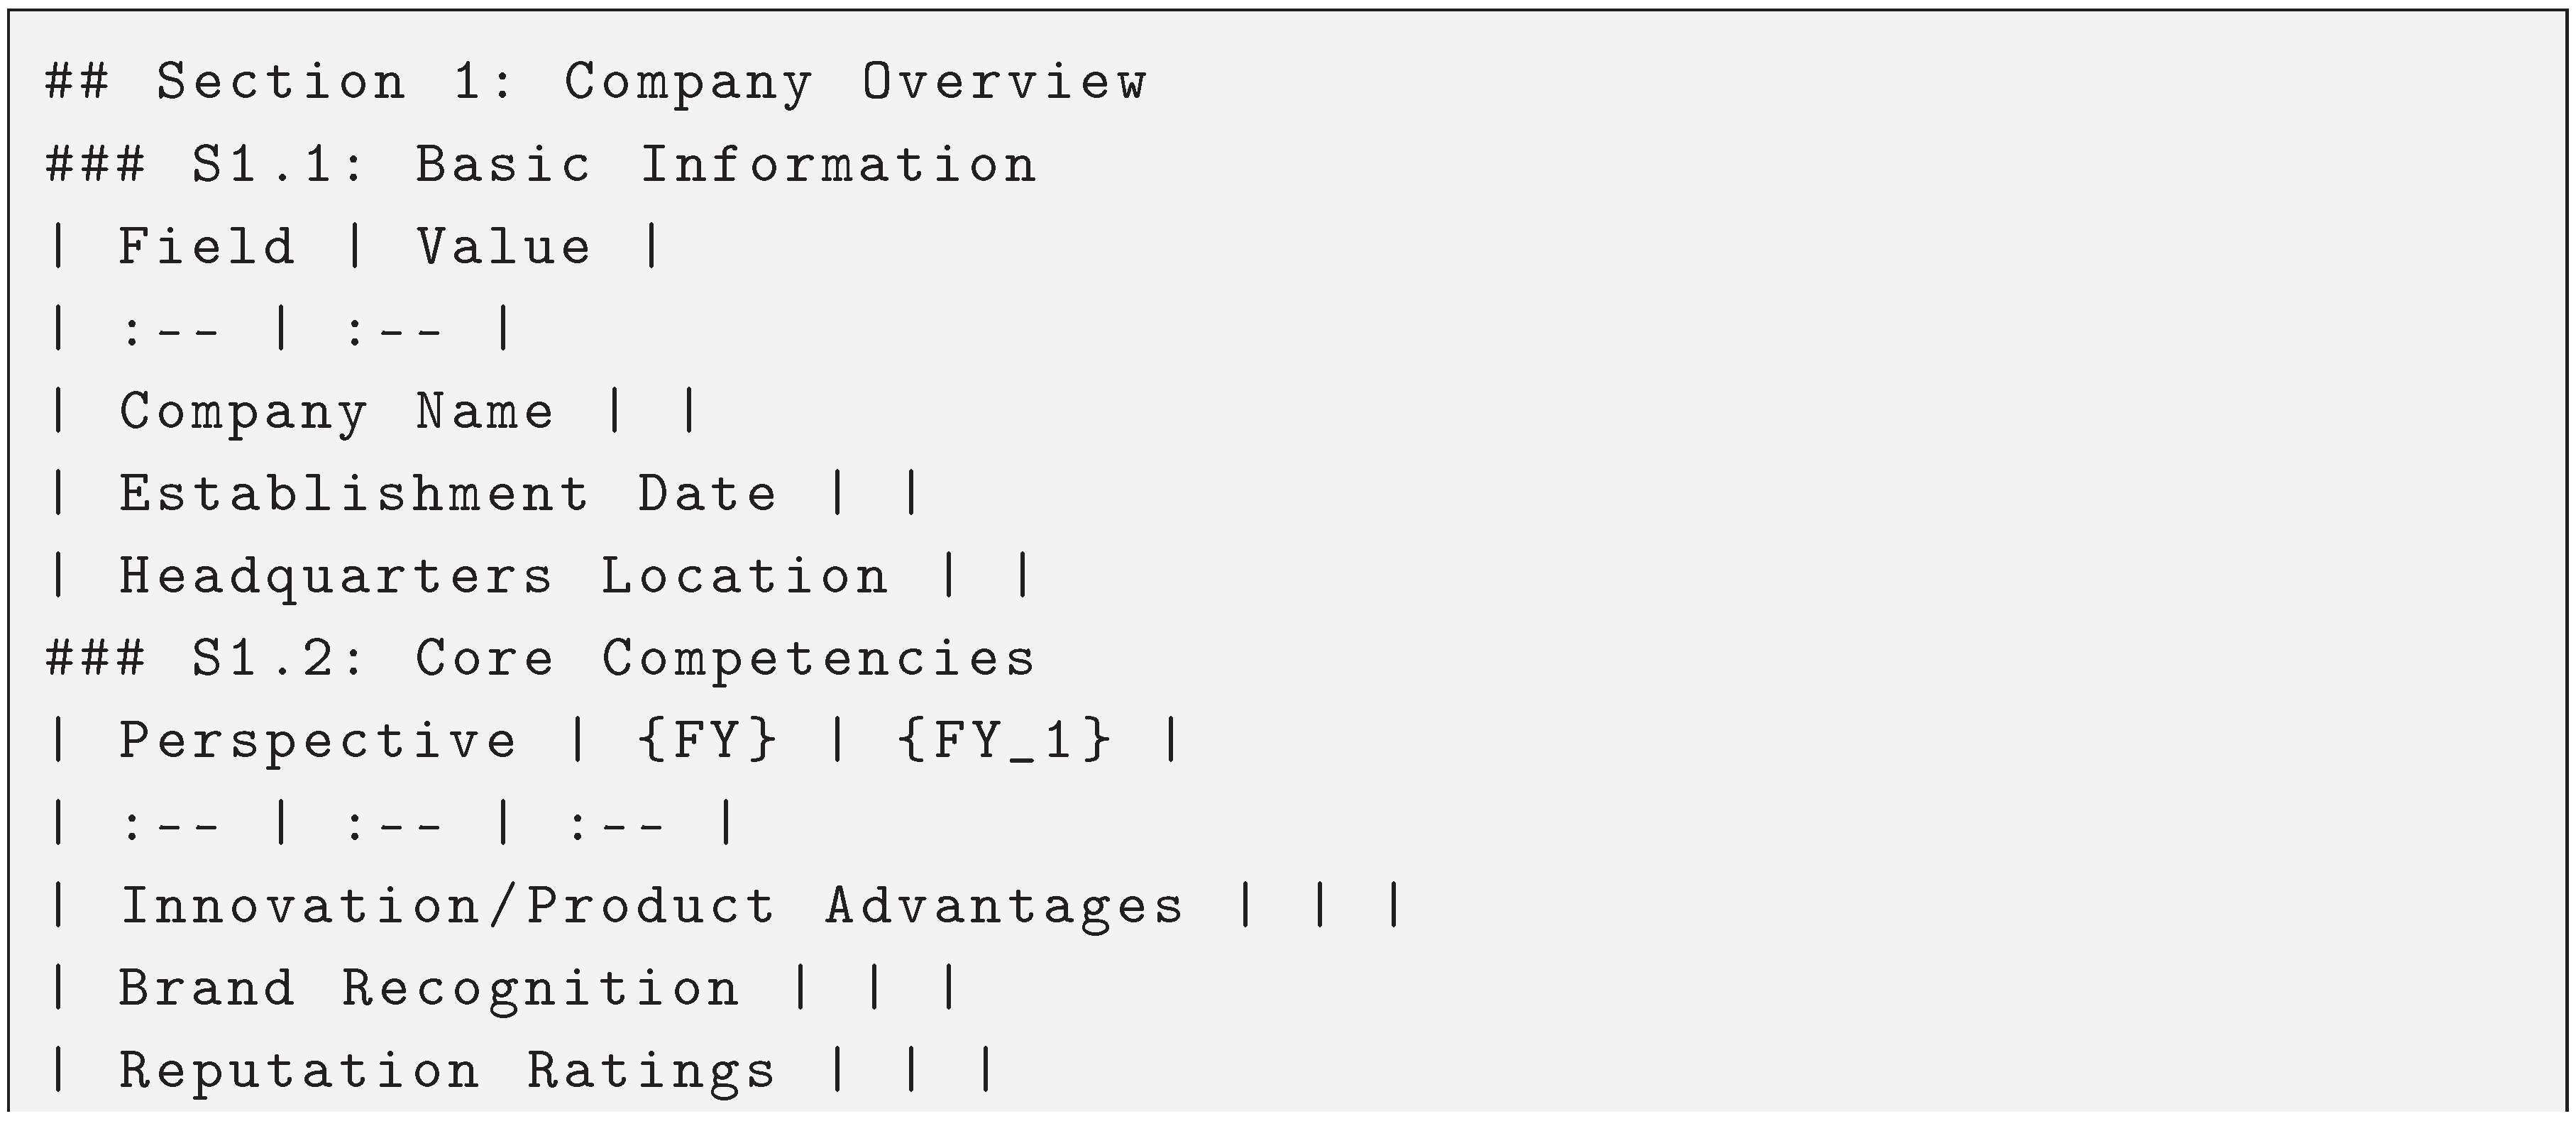
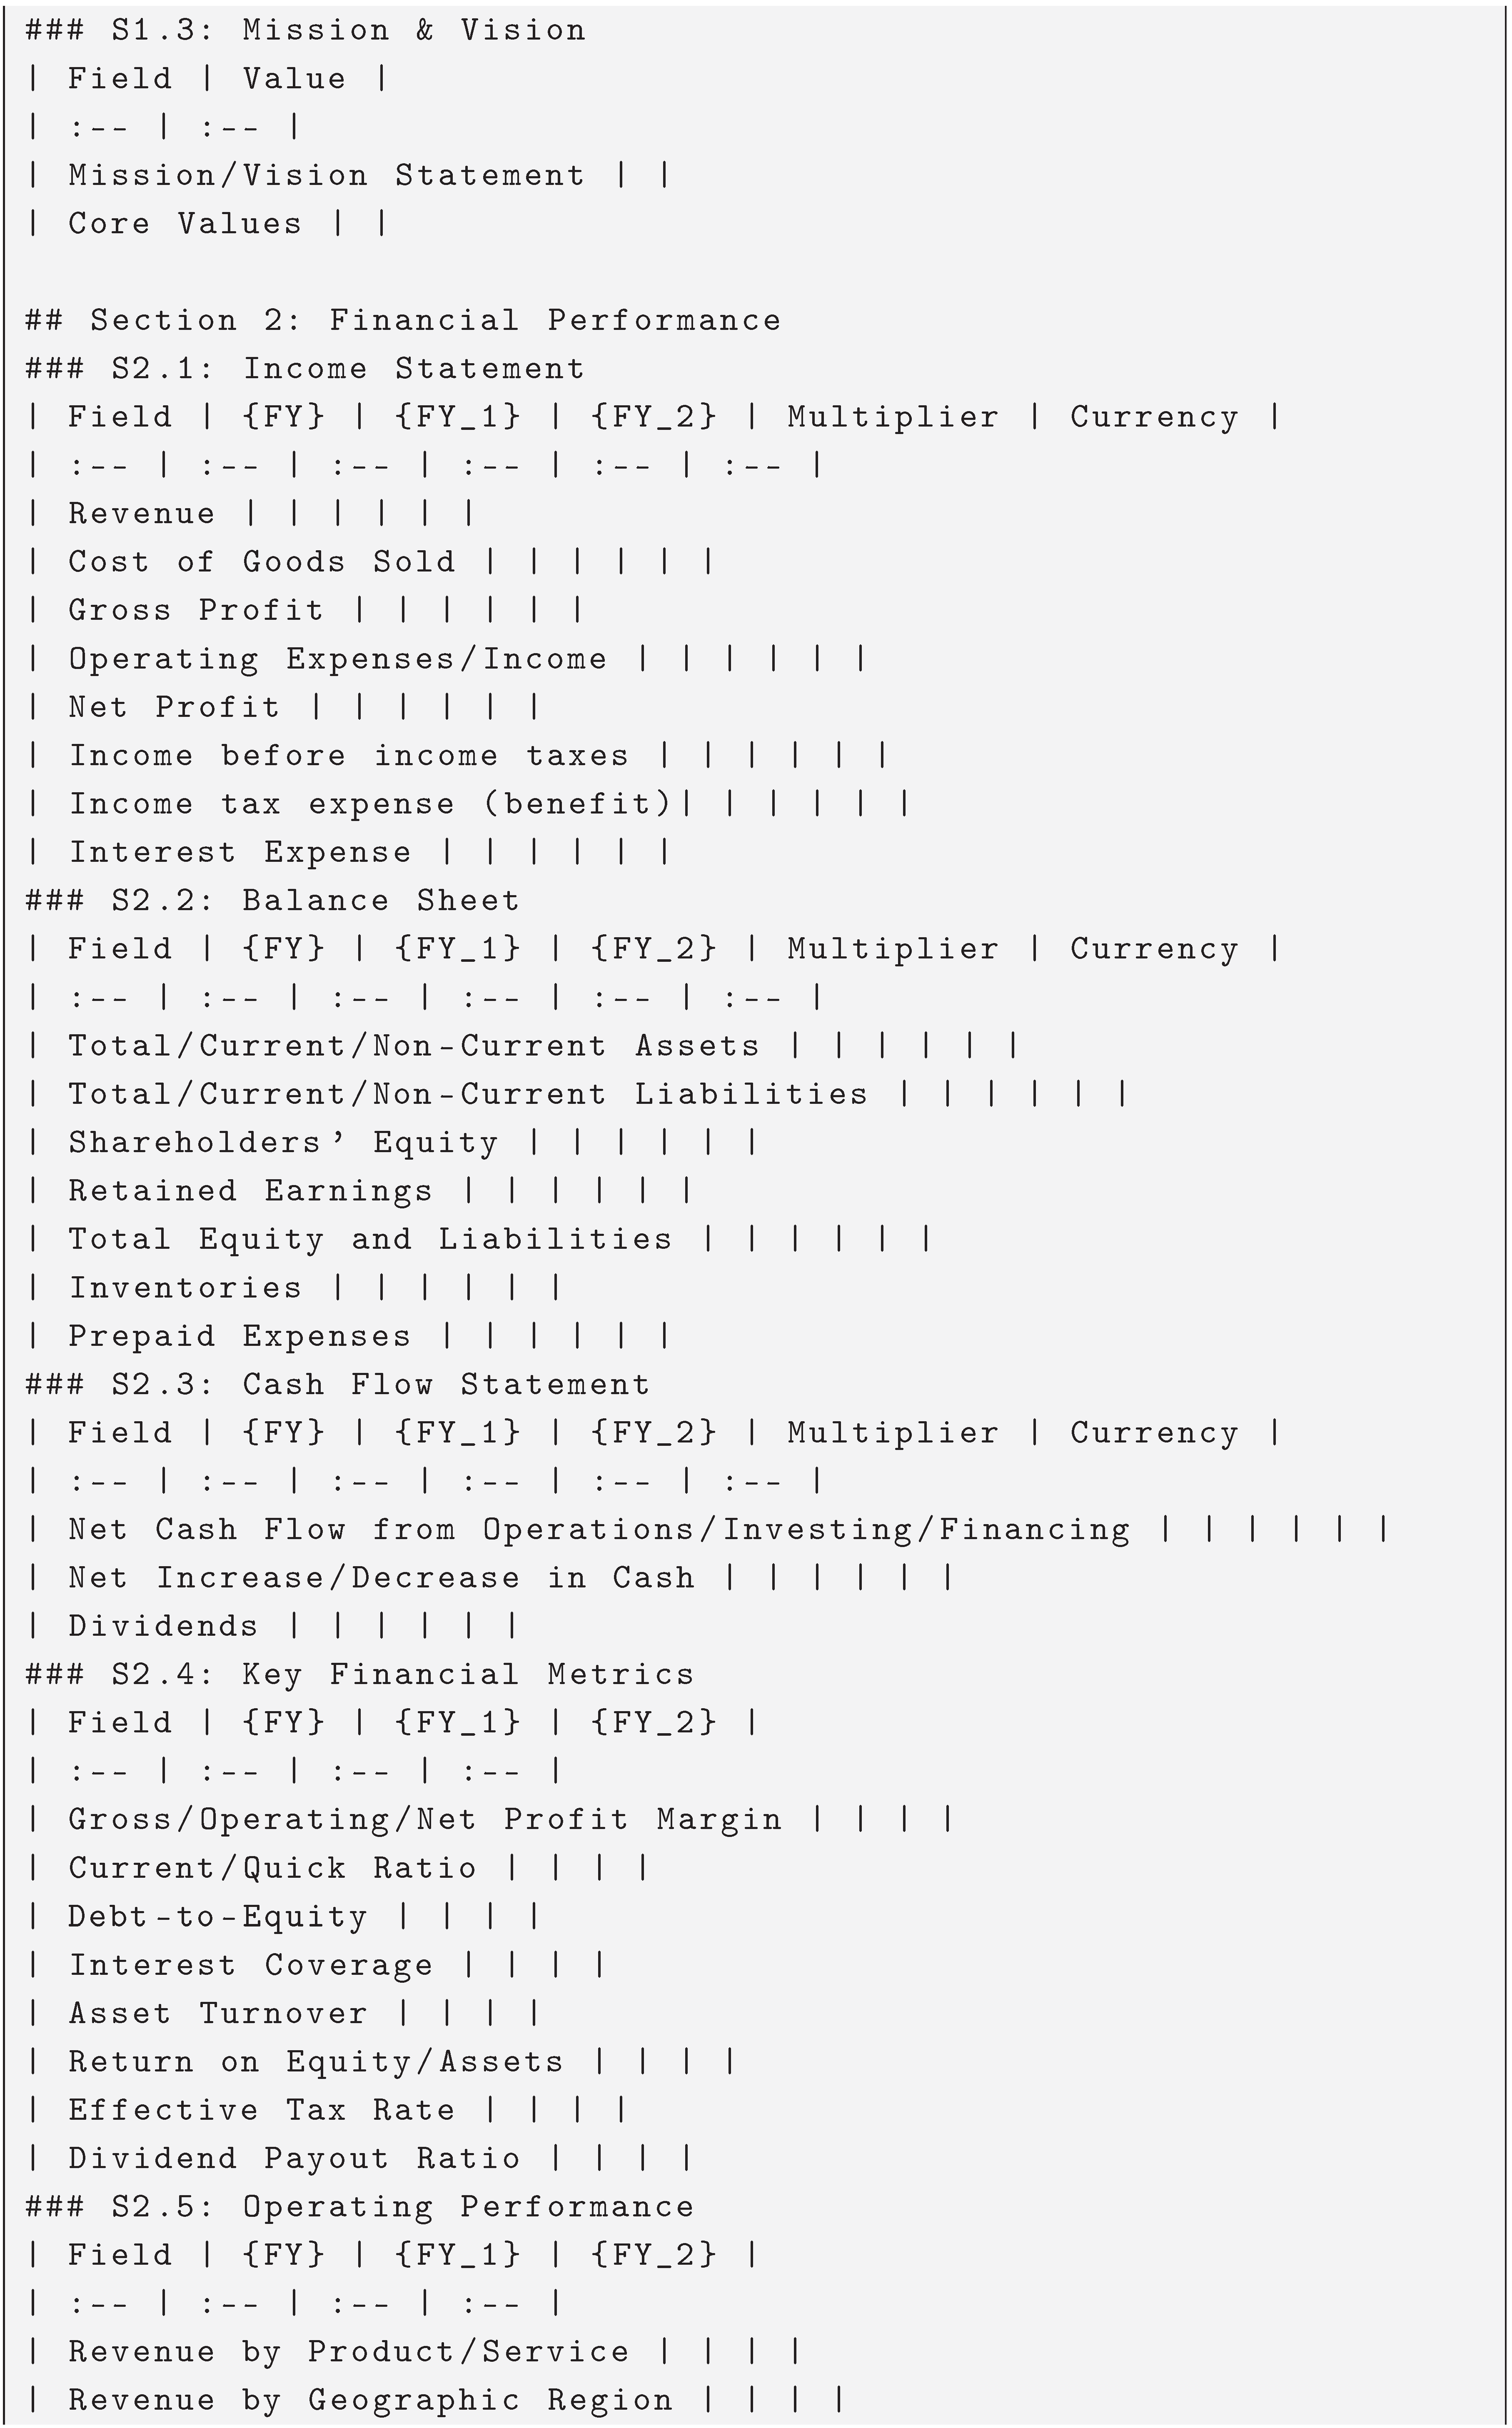
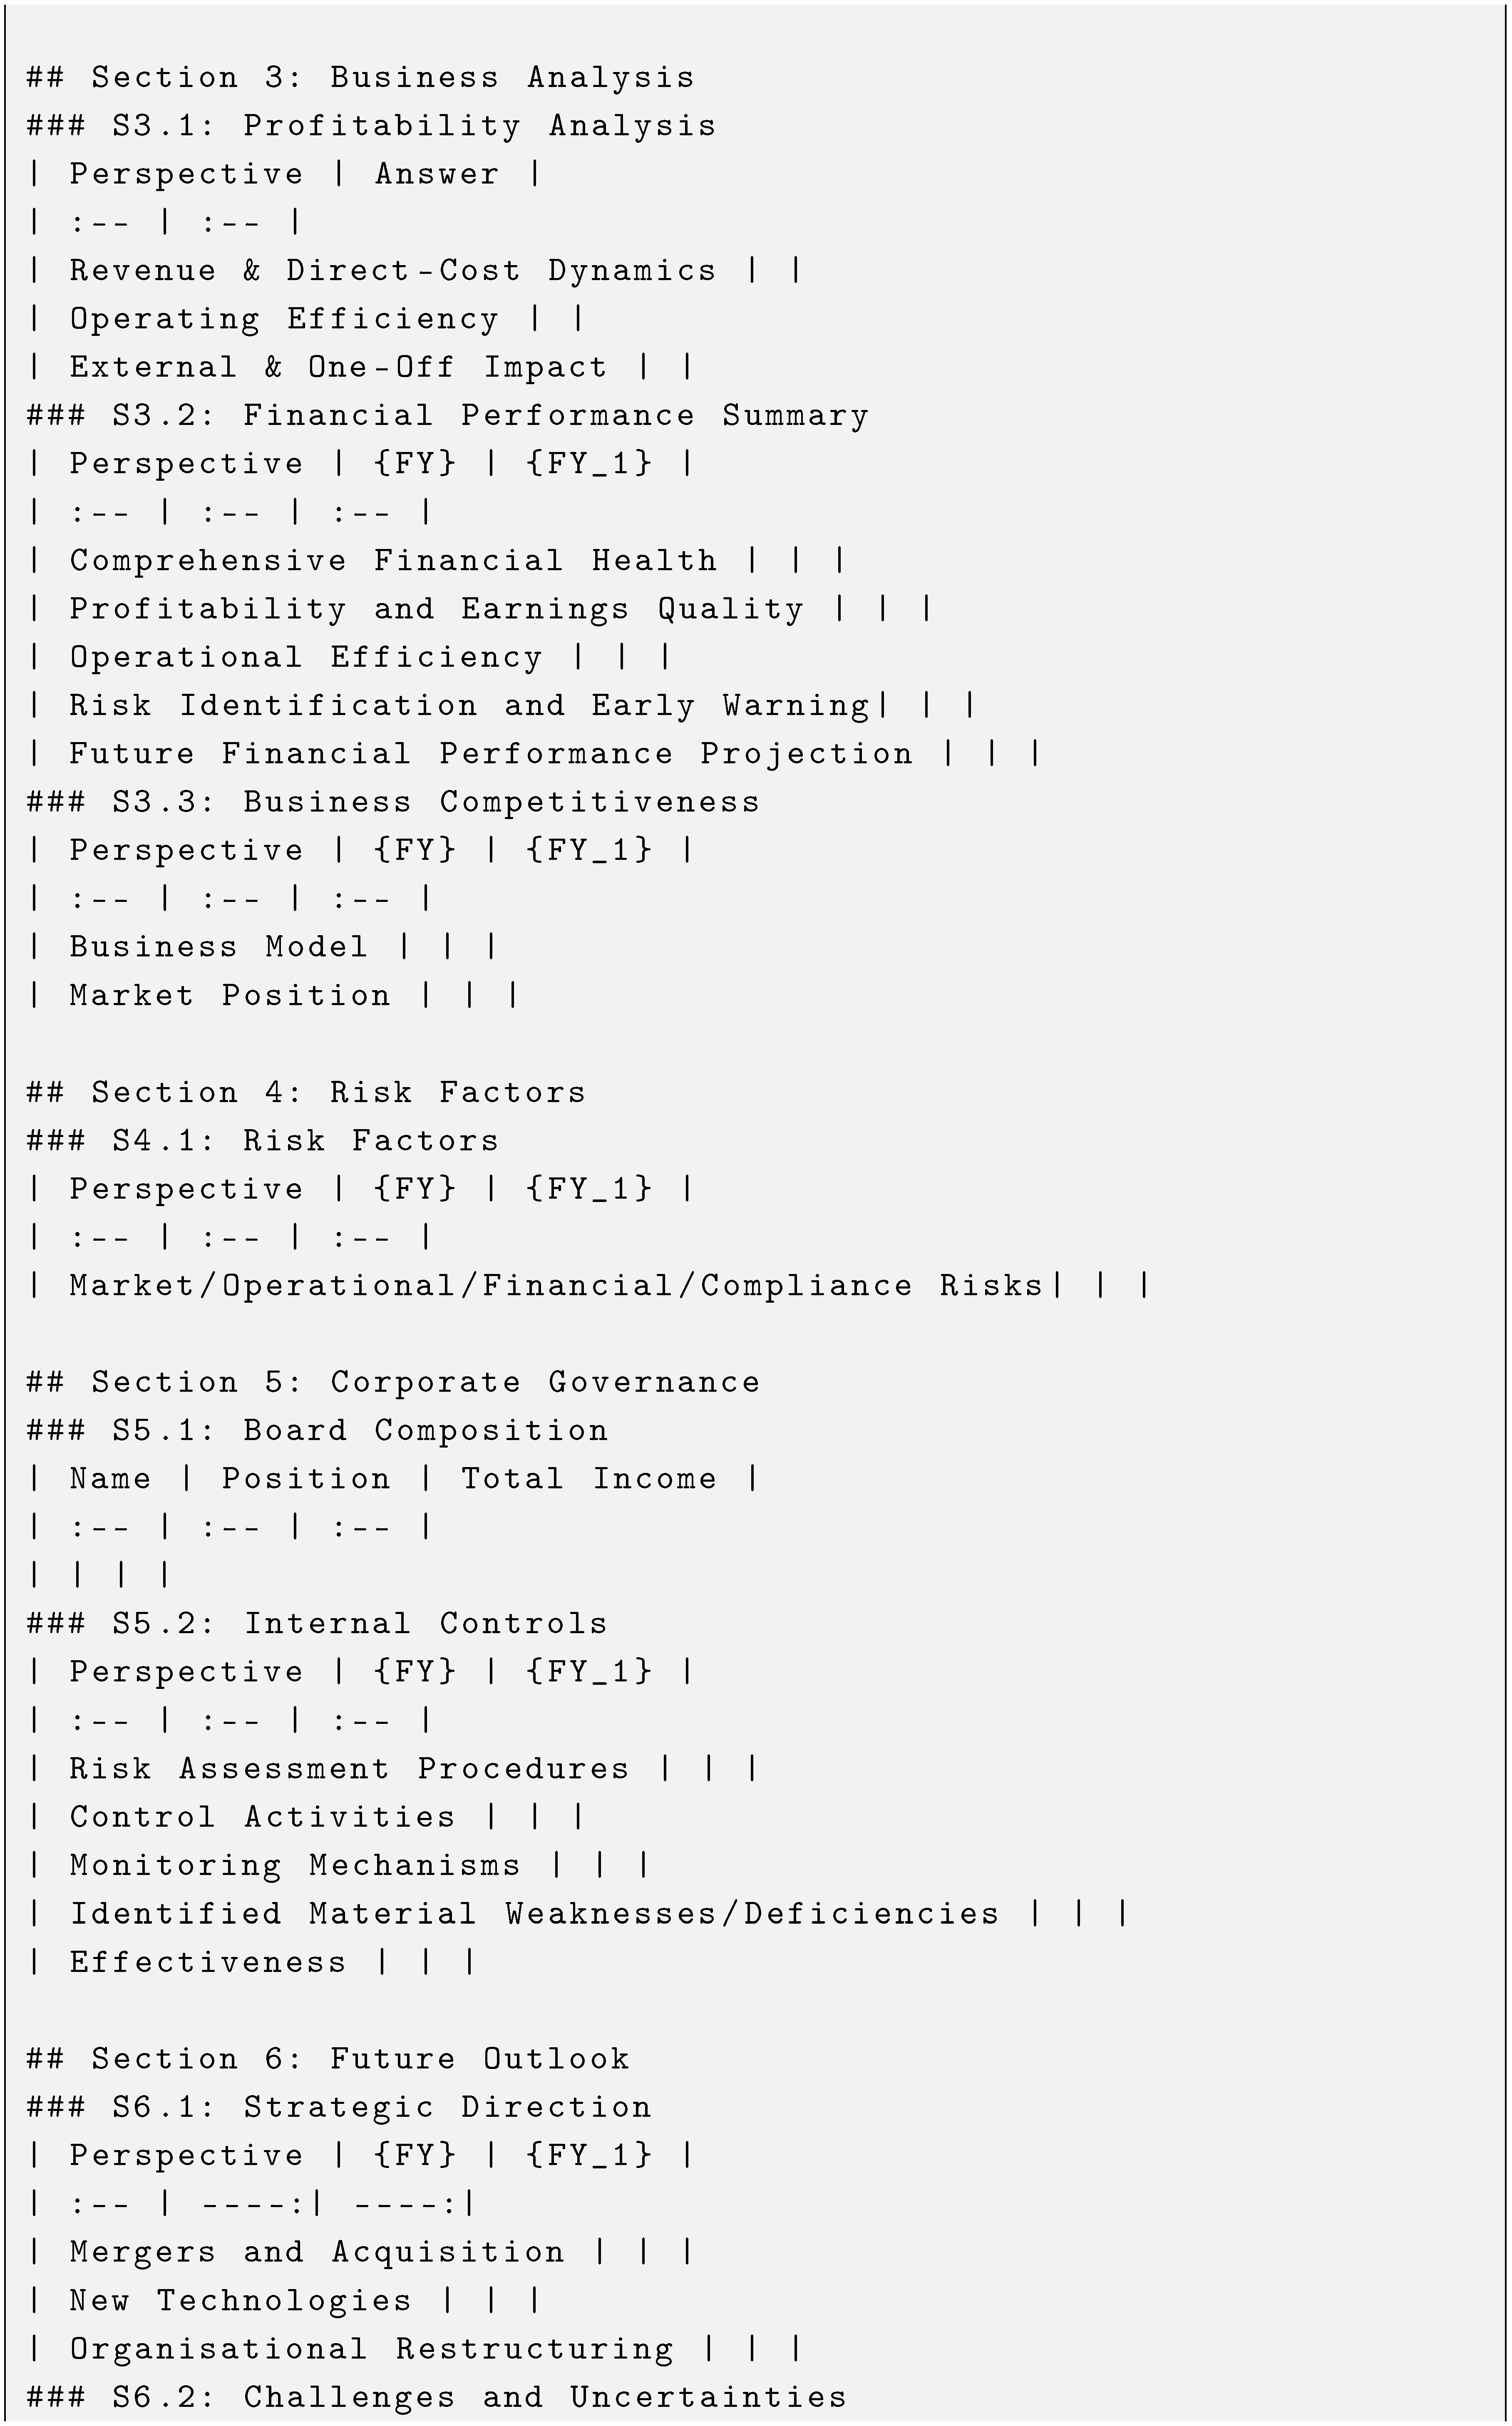
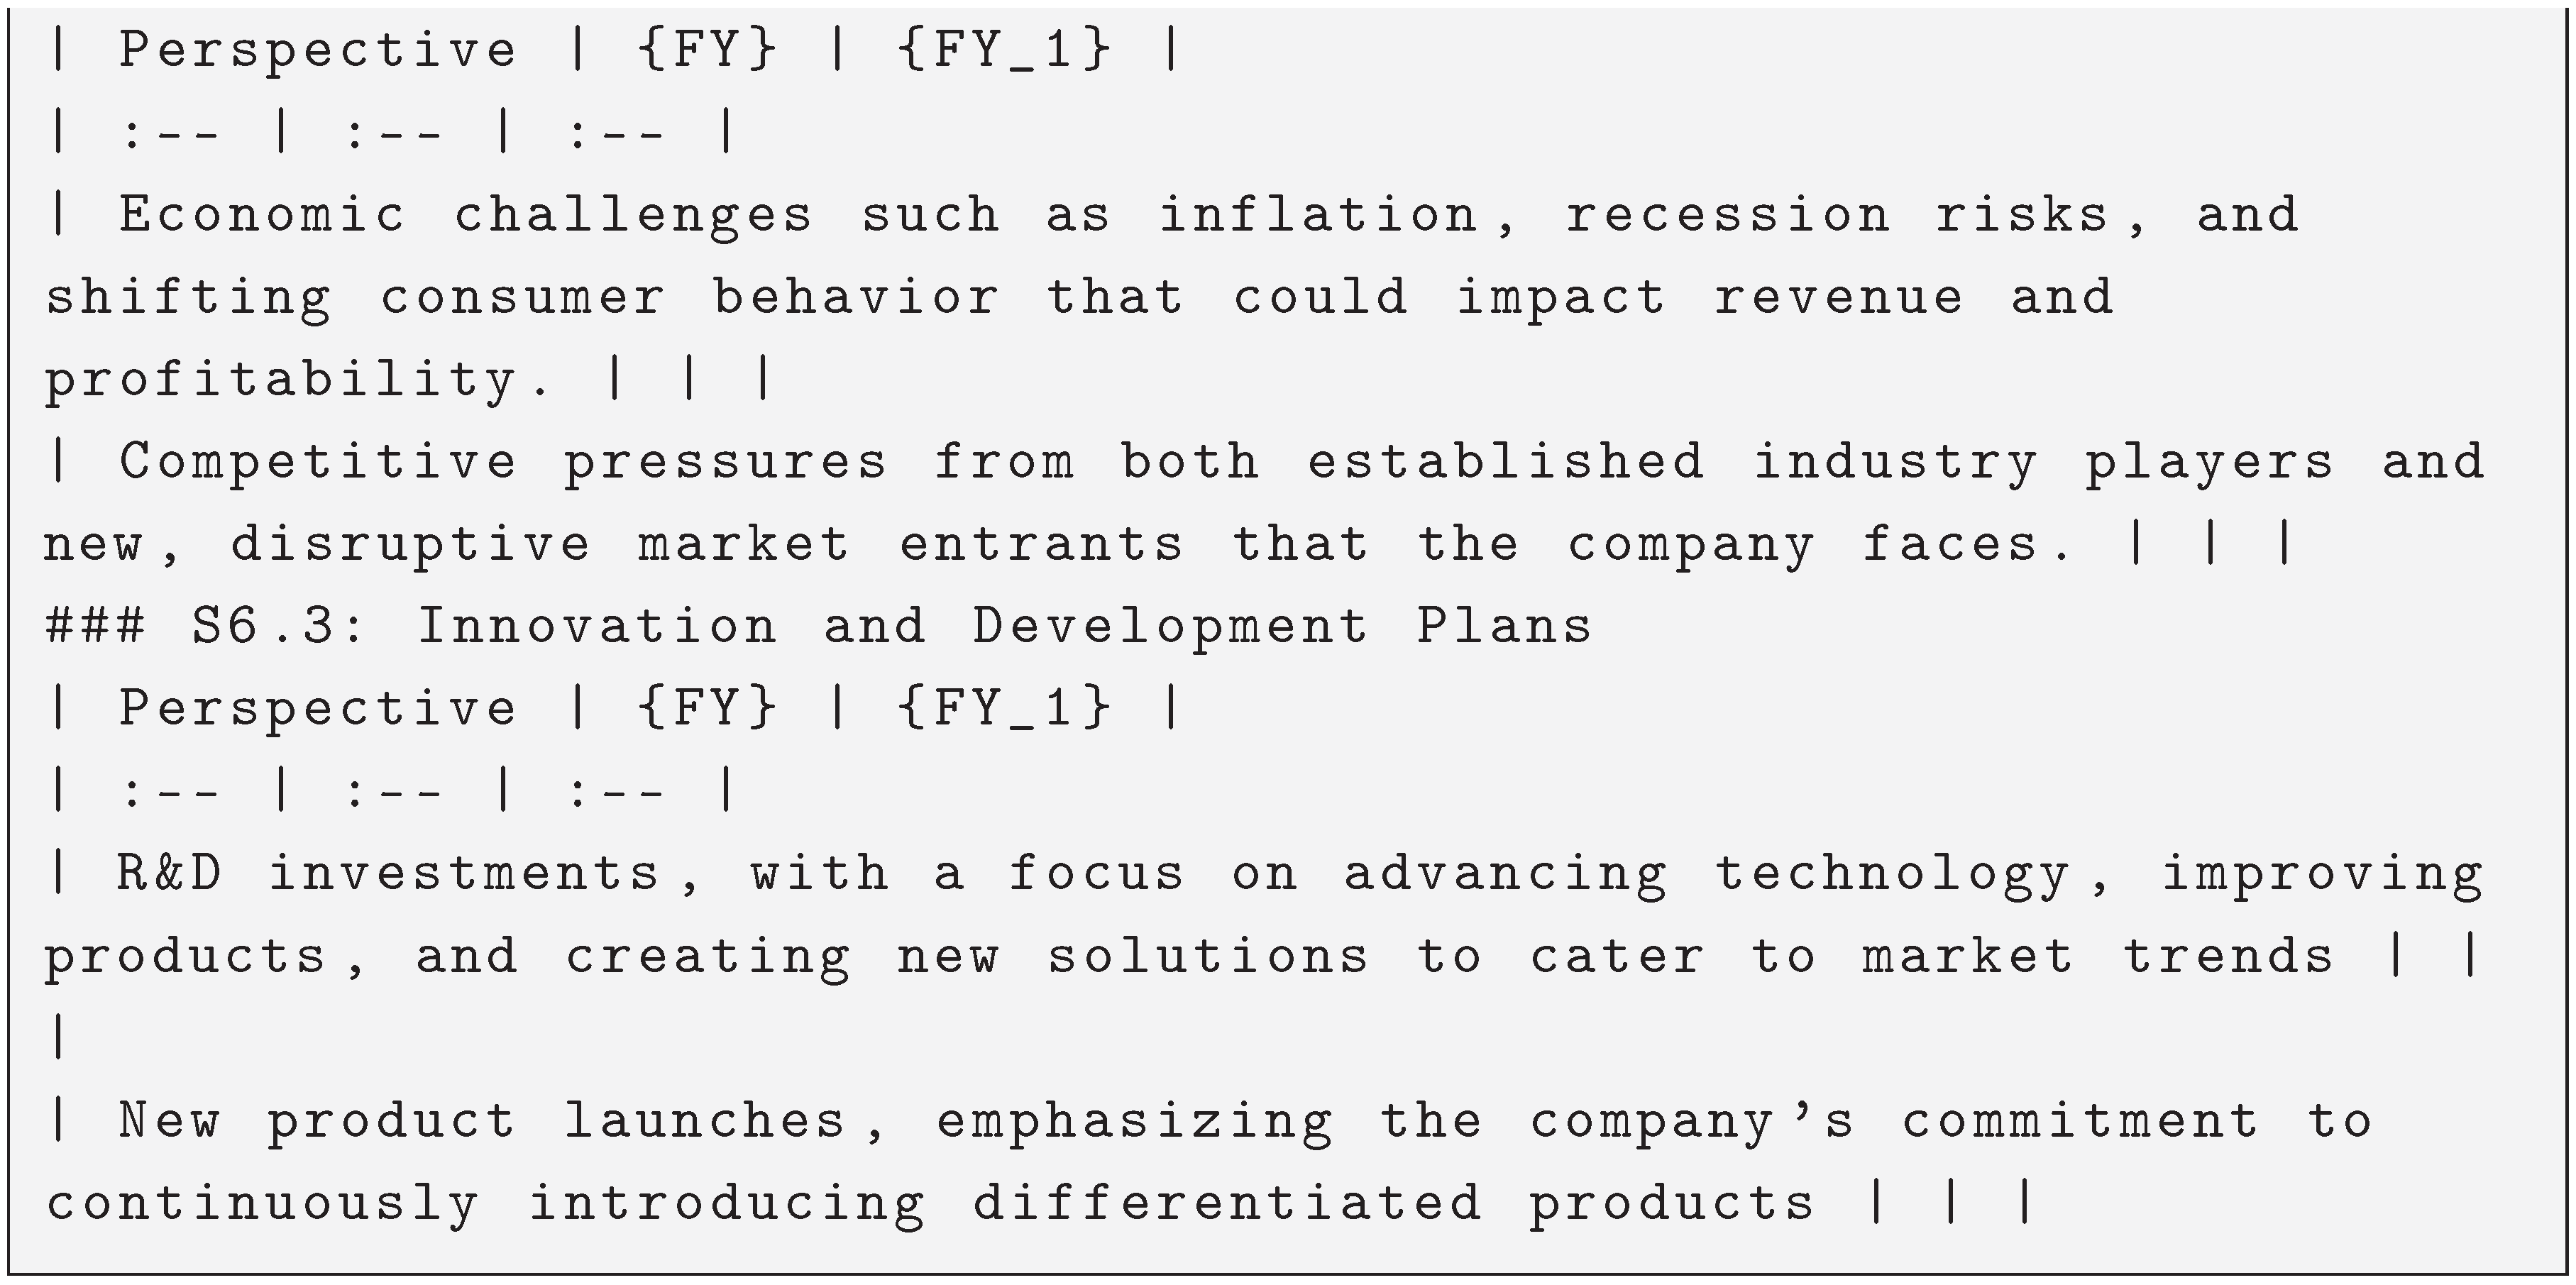
The expected output report should be formatted to a similar structure of sections and subsections as the structure below:
Figure A1.
Complete hierarchical structure for 6 main sections, 18 subsections and 18 markdown tables
Figure A1.
Complete hierarchical structure for 6 main sections, 18 subsections and 18 markdown tables
| 1 | The latest name is FinDocResearch on the OpenFinArena Platform. |
References
- Edge, D.; Trinh, H.; Cheng, N.; Bradley, J.; Chao, A.; Mody, A.; Truitt, S.; Metropolitansky, D.; Ness, R.O.; Larson, J. From local to global: A graph rag approach to query-focused summarization. arXiv preprint arXiv:2404.16130 2024.
- Guo, Z.; Xia, L.; Yu, Y.; Ao, T.; Huang, C. Lightrag: Simple and fast retrieval-augmented generation. arXiv preprint arXiv:2410.05779 2024.
- OpenAI. Introducing deep research. https://openai.com/index/introducing-deep-research/. Accessed: 2025-07-18.
- Gemini Google. Deep Research is now available on Gemini 2.5 Pro Experimental. https://blog.google/products/gemini/deep-research-gemini-2-5-pro-experimental/. Accessed: 2025-07-18.
- Zhu, F.; Ng, X.Y.; Liu, Z.; Liu, C.; Zeng, X.; Wang, C.; Tan, T.; Yao, X.; Shao, P.; Xu, M.; et al. FinDeepResearch: Evaluating Deep Research Agents in Rigorous Financial Analysis. arXiv preprint arXiv:2510.13936 2025.
- Ip, Jeffrey and Vongthongsri, Kritin Apache-2.0. deepeval, version = 3.6.2. Aug 2025 https://github.com/confident-ai/deepeval.
- Zhang, X.; Li, C.; Zong, Y.; Ying, Z.; He, L.; Qiu, X. Evaluating the performance of large language models on gaokao benchmark. arXiv preprint arXiv:2305.12474 2023.
- DeepSeek-AI. DeepSeek-V3.2-Exp: Boosting Long-Context Efficiency with DeepSeek Sparse Attention, 2025.
- Team, O. Introducing GPT-5. https://openai.com/index/introducing-gpt-5/, 2025. Accessed: 2025-10-07.
- Team, O. Introducing gpt-oss. https://openai.com/index/introducing-gpt-oss/, 2025. Accessed: 2025-11-07.
- Yang, A.; Li, A.; Yang, B.; Zhang, B.; Hui, B.; Zheng, B.; Yu, B.; Gao, C.; Huang, C.; Lv, C.; et al. Qwen3 technical report. arXiv preprint arXiv:2505.09388 2025.
- Chen, J.; Xiao, S.; Zhang, P.; Luo, K.; Lian, D.; Liu, Z. Bge m3-embedding: Multi-lingual, multi-functionality, multi-granularity text embeddings through self-knowledge distillation. arXiv preprint arXiv:2402.03216 2024.
- Zhang, Y.; Li, M.; Long, D.; Zhang, X.; Lin, H.; Yang, B.; Xie, P.; Yang, A.; Liu, D.; Lin, J.; et al. Qwen3 Embedding: Advancing Text Embedding and Reranking Through Foundation Models. arXiv preprint arXiv:2506.05176 2025.
- Team, M.A. Mistral OCR. https://mistral.ai/news/mistral-ocr, 2025. Accessed: 2025-03-06.
- Livathinos, N.; Auer, C.; Lysak, M.; Nassar, A.; Dolfi, M.; Vagenas, P.; Ramis, C.B.; Omenetti, M.; Dinkla, K.; Kim, Y.; et al. Docling: An efficient open-source toolkit for ai-driven document conversion. arXiv preprint arXiv:2501.17887 2025.
- Wang, J.; Fu, J.; Song, L.; Bian, J. From Complex to Atomic: Enhancing Augmented Generation via Knowledge-Aware Dual Rewriting and Reasoning.
Figure 1.
An overview of FinDDR competition guideline. Participants are required to create questions and prompts that enable their DDR agents to generate structured research reports.
Figure 1.
An overview of FinDDR competition guideline. Participants are required to create questions and prompts that enable their DDR agents to generate structured research reports.
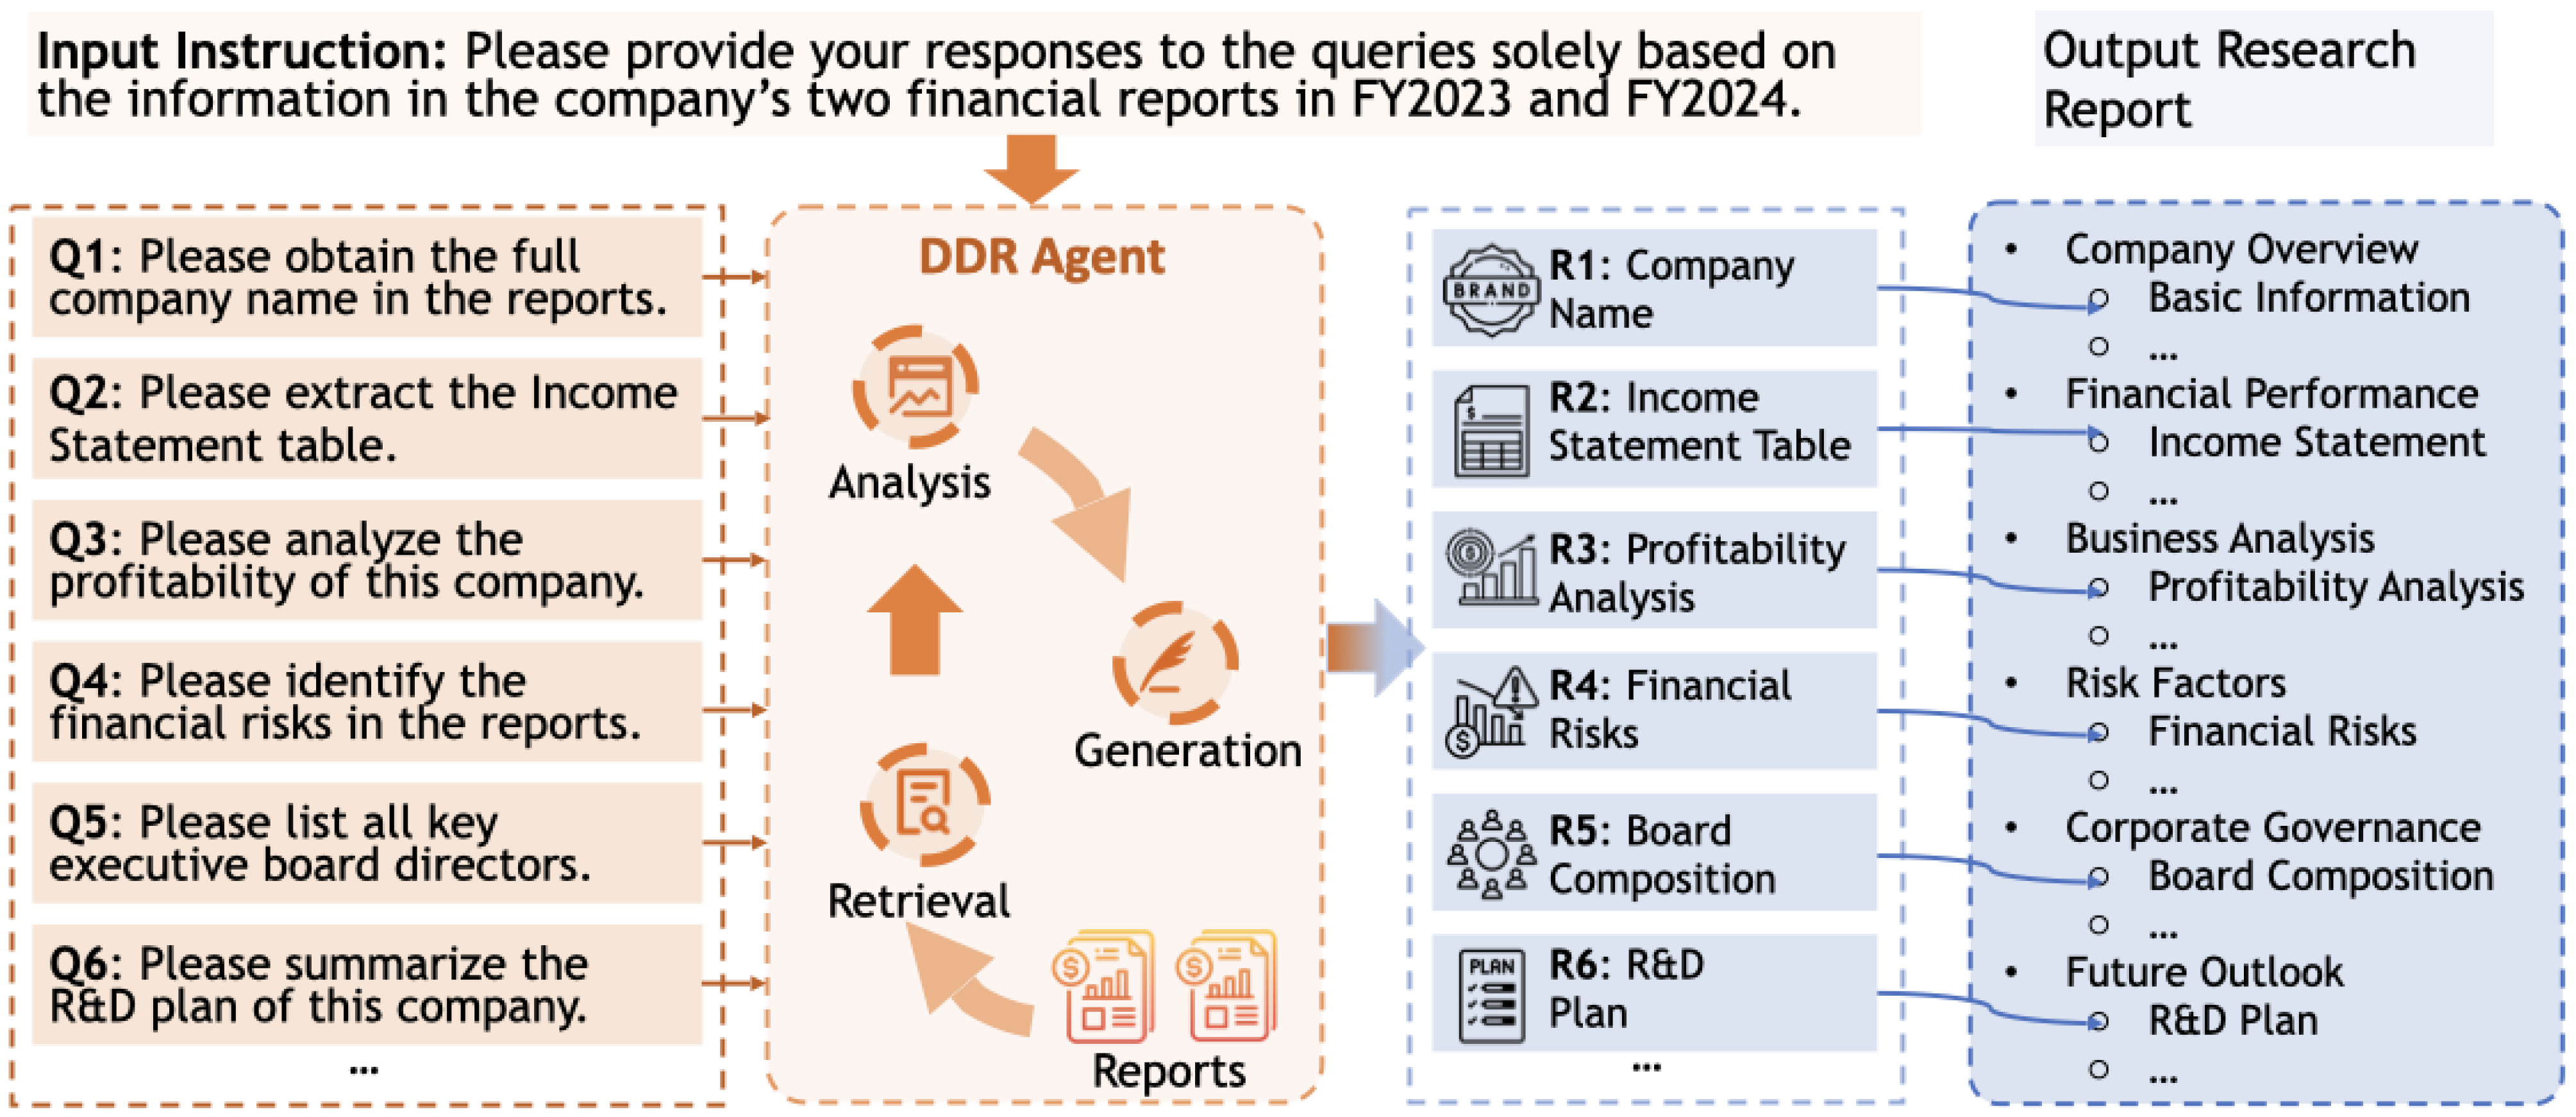

Table 1.
Statistics of FinDDR.
| Statistic | Number |
|---|---|
| Basic Information | |
| Number of Languages | 4 |
| Number of Financial Markets | 8 |
| Number of Industries | 10 |
| Number of Selected Companies | 104 |
| Analytical Structure | |
| Number of Major Sections | 6 |
| Number of Subsections | 17 |
| Grading Items | |
| Number of Grading Items per Report | 183 |
| Full Marks for each Report | 240 |
| Total Number of Grading Items | 19,032 |
Table 2.
Competition Dataset Distribution Based on Region.
| Market | Sample | Validation | Test |
|---|---|---|---|
 US US |
1 | 6 | 7 |
 UK UK |
1 | 6 | 6 |
 China China |
1 | 6 | 5 |
 Hong Kong Hong Kong |
1 | 6 | 6 |
 Singapore Singapore |
1 | 6 | 6 |
 Australia Australia |
1 | 6 | 5 |
 Indonesia Indonesia |
1 | 6 | 6 |
 Malaysia Malaysia |
1 | 6 | 7 |
| Total | 8 | 48 | 48 |
Table 3.
Industry Distribution Across Regions.
| Industry | |
|
|
|
|
|
|
|
|---|---|---|---|---|---|---|---|---|
| US | UK | CN | HK | SG | AU | ID | MY | |
| Communication | 0 | 2 | 3 | 2 | 0 | 3 | 2 | 2 |
| Consumer Discretionary | 3 | 0 | 3 | 0 | 0 | 0 | 0 | 0 |
| Consumer Staples | 0 | 2 | 4 | 0 | 4 | 2 | 3 | 4 |
| Energy | 2 | 4 | 0 | 4 | 0 | 0 | 3 | 0 |
| Health Care | 3 | 0 | 0 | 0 | 4 | 3 | 0 | 0 |
| Industrials | 0 | 4 | 1 | 4 | 3 | 0 | 0 | 4 |
| Materials | 2 | 0 | 1 | 0 | 0 | 2 | 0 | 0 |
| Real Estate | 1 | 0 | 0 | 3 | 2 | 0 | 4 | 1 |
| Technology | 3 | 1 | 0 | 0 | 0 | 1 | 1 | 1 |
| Utilities | 0 | 0 | 0 | 0 | 0 | 1 | 0 | 2 |
Table 4.
Leaderboard rankings (max score: 240). Teams are ranked by overall performance. First place shown in bold, second place underlined.
Table 4.
Leaderboard rankings (max score: 240). Teams are ranked by overall performance. First place shown in bold, second place underlined.
| Rank | Team | Model | Organization | Score |
|---|---|---|---|---|
| 1 | SilverSight | SilverSight Agent | Fudan Univ., Shanghai Innov. Inst., DataGrand | 197.66 |
| 2 | Finsselaer | FinFiler Agent | Rensselaer Polytechnic Institute | 184.50 |
| 3 | Token Refund | PIKE-Report | Microsoft Research Asia | 173.31 |
| 4 | Financial Wizard | Experian FinAgent | Experian | 171.01 |
| 5 | afinit | afinit fin report agent v2 | afinit | 158.40 |
| 6 | e0nia | aiar | Individual | 156.28 |
| 7 | Baseline | DeepSeek-v3.2 | Official | 156.20 |
| 8 | Baseline | GPT-5-MINI | Official | 150.72 |
| 9 | Baseline | GPT-5-NANO | Official | 149.10 |
| 10 | SI4Fin | GeminiFlashRAG | A*STAR | 140.81 |
| 11 | ICT-NDST | ICTDR | Chinese Academy of Sciences | 127.23 |
| 12 | DeepSeek Your Report | FinCMini Agent | Shanghai Univ. Intl. Business | 121.92 |
| 13 | Baseline | GPT-OSS-20B | Official | 113.41 |
| 14 | LedgerLens | AEGIS | Univ. Technology Sydney | 76.68 |
| 15 | FinSight | CAVM Agent | Renmin University of China | 71.94 |
| 16 | DataLovers | FinMAHRAG3 | Rajiv Gandhi Inst. et al. | 58.88 |
| 17 | RUCFinAI | DeepFin Agent | Renmin University of China | 51.29 |
Table 5.
Performance Statistics by Region (max score: 240). First place shown in bold, second place underlined.
Table 5.
Performance Statistics by Region (max score: 240). First place shown in bold, second place underlined.
| Rank | Team | |
|
|
|
|
|
|
|
|---|---|---|---|---|---|---|---|---|---|
| US | UK | China | HK | Singapore | Australia | Indonesia | Malaysia | ||
| 1 | SilverSight | 199.21 | 204.94 | 207.11 | 188.31 | 206.28 | 192.29 | 188.95 | 195.03 |
| 2 | Finsselaer | 179.09 | 187.08 | 188.08 | 176.86 | 187.14 | 189.54 | 174.02 | 194.80 |
| 3 | Token Refund | 163.99 | 180.77 | 167.79 | 163.20 | 181.92 | 175.50 | 171.76 | 181.22 |
| 4 | Financial Wizard | 175.11 | 178.45 | 171.71 | 162.69 | 174.57 | 163.79 | 159.25 | 179.34 |
| 5 | afinit | 161.46 | 174.42 | 154.68 | 142.89 | 169.16 | 154.22 | 142.98 | 164.53 |
| 6 | e0nia | 149.12 | 160.05 | 149.96 | 152.86 | 156.58 | 168.54 | 143.95 | 169.24 |
| 7 | Baseline-DeepSeek-v3.2 | 156.74 | 162.88 | 139.55 | 140.00 | 152.59 | 169.61 | 153.28 | 171.71 |
| 8 | Baseline-GPT-5-MINI with File Search | 152.43 | 160.27 | 132.22 | 130.61 | 162.53 | 151.24 | 147.30 | 163.72 |
| 9 | Baseline-GPT-5-NANO | 142.92 | 159.74 | 141.23 | 134.11 | 162.12 | 174.96 | 121.03 | 159.10 |
| 10 | SI4Fin | 148.61 | 140.29 | 154.85 | 132.29 | 131.95 | 148.87 | 122.83 | 148.01 |
| 11 | ICT-NDST | 130.28 | 148.60 | 94.86 | 129.89 | 128.47 | 130.00 | 108.53 | 139.68 |
| 12 | DeepSeek Your Report | 153.07 | 82.47 | 126.35 | 106.98 | 139.93 | 131.30 | 72.70 | 154.26 |
| 13 | Baseline-GPT-OSS-20B | 116.98 | 101.28 | 92.39 | 109.06 | 108.94 | 119.57 | 115.50 | 136.61 |
| 14 | LedgerLens | 78.50 | 75.32 | 83.78 | 80.99 | 80.66 | 78.81 | 44.12 | 90.21 |
| 15 | FinSight | 71.45 | 69.89 | 55.22 | 74.73 | 65.93 | 85.37 | 83.55 | 69.35 |
| 16 | DataLovers | 59.54 | 63.95 | 47.72 | 49.15 | 64.07 | 70.68 | 43.98 | 70.11 |
| 17 | RUCFinAI | 58.15 | 47.22 | 40.09 | 51.66 | 50.26 | 63.45 | 35.35 | 61.47 |
Table 6.
Performance Statistics by Section (max score is normalized to 100). First place shown in bold, second place underlined.
Table 6.
Performance Statistics by Section (max score is normalized to 100). First place shown in bold, second place underlined.
| Rank | Team | ||||||
|---|---|---|---|---|---|---|---|
| 1 | SilverSight | 80.77 | 83.71 | 69.44 | 87.38 | 86.39 | 87.50 |
| 2 | Finsselaer | 60.32 | 81.43 | 67.47 | 77.69 | 75.91 | 82.64 |
| 3 | Token Refund | 58.05 | 81.23 | 61.32 | 64.94 | 63.87 | 69.89 |
| 4 | Financial Wizard | 59.68 | 79.59 | 61.97 | 55.50 | 65.39 | 70.61 |
| 5 | afinit | 44.14 | 77.40 | 42.24 | 60.75 | 62.22 | 70.46 |
| 6 | e0nia | 59.14 | 73.93 | 44.74 | 54.19 | 58.43 | 69.50 |
| 7 | Baseline-DeepSeek-v3.2 | 57.82 | 77.88 | 40.38 | 47.88 | 51.52 | 68.25 |
| 8 | Baseline-GPT-5-MINI with File Search | 43.95 | 81.03 | 38.18 | 38.56 | 43.65 | 60.86 |
| 9 | Baseline-GPT-5-NANO | 55.50 | 74.70 | 38.21 | 45.88 | 48.70 | 64.18 |
| 10 | SI4Fin | 58.86 | 59.97 | 51.18 | 49.38 | 58.09 | 68.00 |
| 11 | ICT-NDST | 43.64 | 62.77 | 33.35 | 39.00 | 44.78 | 58.25 |
| 12 | DeepSeek Your Report | 42.73 | 58.68 | 34.18 | 41.88 | 42.57 | 56.29 |
| 13 | Baseline-GPT-OSS-20B | 49.68 | 56.88 | 37.32 | 41.94 | 40.52 | 60.29 |
| 14 | LedgerLens | 25.09 | 42.27 | 15.15 | 28.13 | 28.09 | 45.71 |
| 15 | FinSight | 33.45 | 21.04 | 27.38 | 43.06 | 42.13 | 50.25 |
| 16 | DataLovers | 29.41 | 17.26 | 18.71 | 27.38 | 32.61 | 49.93 |
| 17 | RUCFinAI | 27.95 | 21.12 | 5.59 | 19.75 | 18.57 | 39.64 |
Table 7.
Performance Statistics by Task Type (max score is normalized to 100). First place shown in bold, second place underlined.
Table 7.
Performance Statistics by Task Type (max score is normalized to 100). First place shown in bold, second place underlined.
| Rank | Team | Extraction | Calculation | Summary |
|---|---|---|---|---|
| 1 | SilverSight | 87.52 | 74.25 | 80.84 |
| 2 | Finsselaer | 83.59 | 77.03 | 71.53 |
| 3 | Token Refund | 83.14 | 78.00 | 61.75 |
| 4 | Financial Wizard | 81.58 | 75.97 | 61.61 |
| 5 | afinit | 81.86 | 67.19 | 53.11 |
| 6 | e0nia | 79.10 | 63.19 | 54.68 |
| 7 | Baseline-DeepSeek-v3.2 | 83.06 | 67.53 | 50.12 |
| 8 | Baseline-GPT-5-MINI with File Search | 83.36 | 73.08 | 43.32 |
| 9 | Baseline-GPT-5-NANO | 77.71 | 68.28 | 47.88 |
| 10 | SI4Fin | 66.09 | 50.53 | 55.39 |
| 11 | ICT-NDST | 67.97 | 51.61 | 41.65 |
| 12 | DeepSeek Your Report | 60.49 | 57.92 | 40.89 |
| 13 | Baseline-GPT-OSS-20B | 52.36 | 44.50 | 44.09 |
| 14 | LedgerLens | 38.91 | 32.86 | 26.18 |
| 15 | FinSight | 23.80 | 22.75 | 37.13 |
| 16 | DataLovers | 21.62 | 17.36 | 29.11 |
| 17 | RUCFinAI | 24.08 | 19.22 | 19.92 |
Disclaimer/Publisher’s Note: The statements, opinions and data contained in all publications are solely those of the individual author(s) and contributor(s) and not of MDPI and/or the editor(s). MDPI and/or the editor(s) disclaim responsibility for any injury to people or property resulting from any ideas, methods, instructions or products referred to in the content. |
© 2026 by the authors. Licensee MDPI, Basel, Switzerland. This article is an open access article distributed under the terms and conditions of the Creative Commons Attribution (CC BY) license (http://creativecommons.org/licenses/by/4.0/).
Copyright: This open access article is published under a Creative Commons CC BY 4.0 license, which permit the free download, distribution, and reuse, provided that the author and preprint are cited in any reuse.


