
Submitted:
17 July 2025
Posted:
21 July 2025
You are already at the latest version
Abstract
We introduce Explainable AI for Financial-News Sentiment Mining, a complete research workflow that anyone can reproduce at no cost. The workflow relies only on the free-tier of the Marketaux news-aggregation application programming interface (API) and widely available Python libraries. Our objective is to retrieve every United States technology-sector news article (tagged in the industries Technology and Semiconductors) published between January and June 2025, save each day’s material in a clear Excel format, and measure sentiment with methods that remain understandable to human readers. The sentiment layer combines two transparent techniques. First, we use VADER (Valence Aware Dictionary for Sentiment Reasoning), a rule-based lexicon that assigns a polarity score to each word, allowing us to highlight positive and negative tokens directly in the headline text. Second, we train a simple term-frequency–inverse-document-frequency model (TF–IDF) with logistic regression and explain its decisions through SHAP (Shapley Additive Explanations) feature-importance plots. This dual approach shows both the individual words that drive sentiment and the broader patterns that a supervised model discovers. We expect the result to be a practical, transparent toolset that helps researchers and practitioners explore news sentiment.
Keywords:
sentiment analysis
; market prediction
; VADER
; explainable AI
1. Introduction
In contemporary financial markets, the rapid pace and growing volume of information dissemination have heightened the demand for tools capable of extracting sentiment from concise and continuously evolving textual content. Headlines, despite their brevity, often encapsulate critical updates, strategic shifts, and macroeconomic signals. As such, they exert a disproportionate influence on investor sentiment and market behavior. The ability to detect and interpret the tone be it optimistic, pessimistic, or neutral embedded within these short textual units has become essential for researchers conducting empirical analysis, investors making strategic decisions, and automated systems engaged in real-time trading or risk assessment.
This study presents a methodologically transparent and fully reproducible framework for sentiment analysis focused specifically on financial news within the technology sector. The approach is designed around a commitment to openness and interpretability, ensuring that every component of the workflow data acquisition, sentiment scoring, and classification is auditable and accessible. Two primary techniques form the analytical core: the VADER (Valence Aware Dictionary and sEntiment Reasoner) lexicon-based tool, which provides an initial sentiment polarity score based on rule-based heuristics, and a logistic regression model trained on TF–IDF vector representations of the text. Although less complex than neural network-based approaches, this model architecture offers the essential advantage of transparency. It allows for the clear tracing of how specific lexical elements contribute to sentiment classification, facilitating greater trust and explanatory power.
To further reinforce interpretability, the framework incorporates SHAP (Shapley Additive Explanations), a model-agnostic explanation tool rooted in cooperative game theory. SHAP assigns additive importance values to each input feature here, individual tokens based on their contribution to the model's output. This enables both global and local explanations: researchers can observe which features consistently influence sentiment predictions across the dataset and examine how particular words shape individual classification outcomes. These granular insights help uncover semantic regularities and domain-specific patterns in financial language use. For example, SHAP visualizations highlight how references to certain firms, geopolitical terms, or macroeconomic indicators modulate the overall sentiment conveyed in headlines. The combination of transparent modeling and systematic explanation provides a foundation for more rigorous and accountable sentiment analysis within financial research.
2. Literature Review
Understanding sentiment in financial news has long been a focus of interdisciplinary research, integrating insights from computational linguistics, behavioral finance, and machine learning. One of the foundational contributions to this field is the Loughran–McDonald financial sentiment lexicon, which addressed the limitations of general-purpose dictionaries by adapting sentiment classification to the specific language used in financial texts This lexicon recognized that terms such as “liability,” “capital,” or “debt,” typically associated with negative sentiment in general contexts, often carry neutral or context-dependent connotations in financial [1]. As such, it provided a more accurate baseline for sentiment annotation within financial documents, particularly regulatory filings and earnings reports.
More recent studies have looked at how machine learning can classify financial sentiment using domain-specific datasets. FinBERT, for example, adapted the BERT language model for financial texts, achieving strong performance in classification [2]. However, such models require significant compute resources and are difficult to explain.
In parallel, researchers in the explainable AI (XAI) field have worked on tools to clarify model behavior. SHAP, developed by Lundberg and Lee ([1]), has become one of the most widely used tools for interpreting predictions in both tabular and text [1]). Despite its effectiveness, such transformer-based models come with significant drawbacks: they demand considerable computational resources, are less interpretable by design, and often function as opaque black boxes [3]. This has raised concerns, particularly in high-stakes applications such as investment decision-making or financial regulation, where model explainability is critical.
In response to the interpretability challenge, the field of explainable artificial intelligence (XAI) has produced tools aimed at demystifying the internal workings of complex models. Among these, SHAP (Shapley Additive Explanations), introduced by Lundberg and Lee ([1]), has become a standard approach for interpreting both linear and non-linear models. SHAP attributes each feature’s contribution to a model’s prediction based on cooperative game theory principles, offering consistent and theoretically grounded explanations across various model types. Unlike earlier techniques such as LIME (Local Interpretable Model-Agnostic Explanations), SHAP is model-agnostic yet internally coherent, providing local and global interpretability without sacrificing theoretical consistency or adherence to formal properties such as additivity and fairness derived from cooperative game theory. [4]
Beyond methodological developments, empirical studies have provided robust evidence linking news sentiment to financial market behavior. Tetlock [5]was among the first to show that negative media tone, particularly in financial columns, could predict stock market downturns, underscoring the behavioral relevance of textual sentiment. Later research expanded on this by examining how co-occurrences of firm names and sentiment-laden phrases in news articles can be aggregated into sentiment indices that capture investor mood and inform trading strategies, offering predictive signals for asset returns, volatility, and market reactions around key events ([6]). These studies laid the groundwork for sentiment-based market prediction models and validated the significance of language analysis in empirical finance.
The present study builds upon this multifaceted literature, drawing on sentiment lexicons, interpretable machine learning techniques, and empirical market research to propose a practical and accessible framework for sentiment mining. Unlike approaches that prioritize predictive performance at the expense of transparency, our method emphasizes usability, interpretability, and reproducibility. The goal is not merely to generate sentiment labels, but to create outputs that are easy to audit, analyze, and extend for further academic or applied research in financial text analysis.
3. Materials and Methods
The primary objective of this research is to demonstrate that meaningful and interpretable sentiment information can be extracted from financial headlines using fully transparent methods and exclusively open-source tools. This approach is motivated by the growing demand for explainable AI in high-stakes domains like finance, where decision accountability, regulatory compliance, and user trust are important [7]. Specifically, the study aims to:
• Build a complete, end-to-end pipeline for processing and classifying financial news headlines, using only free, publicly available APIs and Python libraries. The goal is to lower the barrier to entry for both academic researchers and financial practitioners by avoiding proprietary tools or costly infrastructure [8].
• Generate interpretable sentiment scores by combining a rule-based lexicon (VADER) with a supervised logistic regression classifier trained on TF–IDF representations. This hybrid architecture leverages the semantic priors of lexicon-based methods (Hutto & Gilbert, 2014) while allowing the model to learn domain-specific language [9].
• Apply SHAP (SHapley Additive Explanations) to trace model predictions back to individual tokens, revealing how each word contributes to the final sentiment classification. This use of SHAP aligns with recent advances in interpretable ML that advocate for feature-level transparency grounded in cooperative game theory [1]. Compared to earlier local explanation frameworks such as LIME [4], SHAP offers both local and global insights and is model-agnostic.
• Present visual and tabular outputs including SHAP impact plots, token-level tables, and color-coded Excel files that are suitable for a range of downstream tasks, from academic hypothesis testing to feature engineering in algorithmic trading systems [10]. These outputs reflect a commitment to usability and transparency, offering multiple entry points for non-experts to interpret the sentiment.
The overarching focus was not only on achieving competitive classification performance though this is reported and benchmarked but on ensuring that every component of the workflow could be audited, verified, and extended. This commitment to transparency distinguishes the present work from black-box deep learning approaches that, while accurate, often lack interpretability and reproducibility in financial applications.
We aimed to construct a processing pipeline capable of converting raw, publicly available financial news headlines into interpretable sentiment assessments that could be subsequently linked to financial variables. The pipeline is implemented entirely within a single, open-source Python script (see Figure 1), requiring only widely available free libraries and no paid API keys or proprietary tools. The end-to-end process begins with a JSON export from the Marketaux API and concludes with several outputs, including:
• an Excel workbook containing the annotated data,
• visual plots for interpretability (e.g., SHAP visualizations),
• two comma-separated value (CSV) tables suitable for integration with statistical analysis tools such as R, Python (pandas), or Stata.
The pipeline was designed around the principle of transparency. Every component was selected to ensure that the inner workings of the sentiment estimation could be directly inspected and understood. The methodology consists of the following layers:
1. Data Collection and Preprocessing
News headlines are retrieved using the Marketaux API with filters set to English-language articles from the U.S. technology sector. The JSON output includes metadata such as timestamps, source domains, URLs, and recognized ticker symbols. Titles and descriptions are concatenated into a unified text field, and timestamps are normalized for compatibility with spreadsheet software.
2. Rule-Based Sentiment Annotation (VADER)
The first sentiment layer applies VADER (Valence Aware Dictionary for Sentiment Reasoning), a lexicon-based tool tailored for short text.
Each headline receives a compound score between –1 and +1.
Discrete sentiment labels are assigned based on established thresholds:
- Positive: compound ≥ 0.05
- Negative: compound ≤ –0.05
- Neutral: values in between
These labels serve both as a heuristic signal for model training and as an immediate, interpretable output.
3. Supervised Classification (TF–IDF + Logistic Regression)
Headlines labeled as positive or negative are vectorized using TF–IDF, capturing unigrams, bigrams, and trigrams. The model excludes common stop-words, rare terms (fewer than three occurrences), and overly frequent boilerplate phrases. A balanced logistic regression model is trained to predict sentiment. Because of its linear nature, each feature’s coefficient can be directly interpreted as its contribution to the log-odds of a positive or negative classification.
SHAP (Shapley Additive Explanations) is used to enhance interpretability at both the global and local levels.
For each prediction, SHAP assigns additive importance scores to individual tokens.
This allows for the construction of:
- Global feature importance plots (e.g., SHAP beeswarm) to identify the most influential words across the dataset.
- Local force plots that explain individual classification decisions in terms of contributing and offsetting terms.
SHAP ensures consistency across models and respects theoretical properties of attribution, making it suitable for future extension to more complex classifiers.
This modular architecture ensures that each stage of the pipeline is not only functionally effective but also epistemologically transparent. Researchers can inspect how data flows through the pipeline, validate each transformation, and adapt components independently for domain-specific needs or extensions.
Financial news headlines were collected using the Marketaux API, targeting English-language articles related to U.S.-listed technology-sector firms such as Nvidia (NVDA), Intel (INTC), and AMD. To ensure a consistent and diverse sample, a custom Python script was used to retrieve a maximum of 20 unique articles from distinct sources per day. The script stored daily outputs as structured Excel files, which served as input for subsequent sentiment labeling and modeling stages. Below, in Figure 1 is a condensed excerpt highlighting the core logic of the collection routine.
We downloaded all English-language headlines categorized under the technology sector and geographically tagged as “United States” using the Marketaux API. The data collection period spans from 1 January to 30 June 2025, yielding a dataset of 1,503 unique records saved in a structured JSON format (market_aux_articles.json). Each record contains not only the headline but also a short accompanying description, a UTC timestamp indicating the time of publication, the domain of the news source, a permanent reference URL, and, critically, a list of stock tickers identified by Marketaux’s entity recognition engine. These metadata elements offer valuable contextual and referential information for future research, particularly for linking sentiment to specific firms or market events.
During the data ingestion phase, the preprocessing script concatenates each headline with its corresponding description to form a single coherent text field. This consolidation ensures that the sentiment analysis captures both the core message and its immediate explanatory context. In addition, timestamps are converted into timezone-naïve datetime objects to ensure compatibility with spreadsheet applications such as Microsoft Excel, which can render improperly formatted datetime entries as unreadable. The cleaned and processed data is exported into an Excel workbook titled news_with_vader.xlsx, which serves as the primary interface for manual review and preliminary exploration.
4. Results
Figure 2 presents a representative sample of the dataset as displayed in the Excel file, showing the structured layout of the headlines, their sentiment scores, and the metadata prepared for subsequent modeling and analysis.
4.1. Rule-Based Sentiment Layer (VADER)
VADER (Valence Aware Dictionary for Sentiment Reasoning) is a rule-based sentiment analysis tool that relies on a hand-curated lexicon consisting of several thousand words and expressions. In addition to static polarity scores assigned to lexical items, VADER incorporates syntactic heuristics to adjust sentiment intensity based on the presence of negation, punctuation, capitalization, and emoticons. These contextual rules enhance its ability to capture sentiment in short, informal texts, making it particularly well-suited for analyzing financial news headlines, which are typically concise and information-dense.
For each headline, the VADER algorithm produces a compound score, which is a normalized value ranging from –1 (representing the most negative sentiment) to +1 (indicating the most positive sentiment). In accordance with the thresholds established by Hutto and Gilbert (2014), we classify the headlines into three discrete sentiment categories: those with a compound score equal to or greater than 0.05 are labeled as positive; those with a score equal to or less than –0.05 are labeled as negative; and those falling between these two thresholds are labeled as neutral. These discrete labels serve a dual function within the research framework. First, they provide an intuitive and visually interpretable sentiment classification that facilitates filtering and color-coding within the Excel output. Second, they serve as a form of weak supervision for training the subsequent supervised machine learning model, providing initial sentiment guidance without the need for costly manual annotation.
4.2. Supervised Layer: TF–IDF and Logistic Regression
Headlines classified neutral are discarded; the remaining 968 instances (≈ 64 % of the corpus) form the training pool. We represent each headline with a TF–IDF vector that contains unigrams, bigrams and trigrams. Common English stop-words are removed, rare phrases that occur in fewer than three documents are ignored, and very common terms (document frequency > 90 %) are down-weighted to dampen the influence of boiler-plate language such as “reports” or “update”. Setting phrase=True (available in scikit-learn ≥ 1.4) lets the vectoriser treat statistically significant collocations e.g. advanced micro as a single feature.
A balanced logistic-regression classifier is fitted with max_iter = 1000. Because the model is linear in the TF–IDF space, every coefficient can be interpreted as a log-odds contribution of the corresponding n-gram.
4.2.1. Cross-Validation Protocol
We report three metrics accuracy, macro-averaged F1, and ROC-AUC under a stratified five-fold cross-validation. Table 1 summarises the means and standard deviations.
The moderate variance across folds indicates that the model generalises reasonably well despite the modest sample size.
4.2.2. Hold-Out Evaluation
Following the cross-validation procedure, the logistic regression classifier is retrained on 80% of the dataset and subsequently evaluated on the remaining 20%, which serves as an unseen hold-out set. This final evaluation step is critical for validating the generalizability of the model beyond the stratified folds used during training. The performance metrics computed from the resulting confusion matrix are as follows: precision equals 0.84, recall is 0.83, and the F1-score representing the harmonic mean of precision and recall is also 0.83 for the positive class. The overall classification accuracy on the hold-out set is recorded at 0.78, with a test set size of 245 instances.
These results exhibit strong alignment with the cross-validated macro-averaged scores previously reported, indicating consistent model performance across different data partitions. The absence of a significant performance drop between training and testing phases suggests that the model does not suffer from overfitting.
4.3. Explainability with SHAP
SHAP (Shapley Additive Explanations) allocates the predicted log-odds of a headline to individual words. Because logistic regression is linear, the SHAP value of a token is simply its TF–IDF weight multiplied by the corresponding coefficient, but computing them through the generic library guarantees comparability with future non-linear models.
Figure 3 presents the standard beeswarm plot where each dot is a headline and each row a token. Dots to the right increase the probability of a positive call; dots to the left decrease it.
The vertical ordering in the global SHAP summary plot reflects the twenty tokens with the highest mean absolute impact on the model's output. These features exert the greatest influence either positive or negative on sentiment predictions across the corpus. Several interpretive outcomes can be identified:
• Chipmaker asymmetry: Company names such as nvidia and amd appear prominently, but with opposing effects. Mentions of nvidia tend to increase the likelihood of a positive classification, while amd consistently contributes to negative predictions. This divergence is consistent with observed stock market sentiment during the sampling period, in which Nvidia received relatively favorable press.
• Macroeconomic pressure: Tokens such as tariffs, tensions, trade, and trump are strongly associated with negative sentiment. Their presence in headlines pushes the model’s output toward bearish interpretations, reflecting broader anxieties around regulatory and geopolitical developments.
• Pro-growth language: Generic business terms including growth, gains, and strong exhibit a positive influence on model predictions. These words elevate the log-odds of a positive label, suggesting that the classifier effectively recognizes optimistic economic framing.
In addition to these global insights, local interpretability is illustrated in Figure 4, which focuses on a single headline drawn from the hold-out set. In this instance, the SHAP force plot demonstrates how three key tokens influence the classifier’s final decision. The term investment contributes approximately +1.0 to the log-odds of a positive prediction, largely offsetting the negative effect associated with amd. The resulting residual contribution supports a high predicted probability of optimism approximately 0.88 confirming that the model captures a balance of positive and negative signals at the token level.
4.4. Token-Impact Table
To complement the global and local SHAP visualizations, we compute the mean SHAP value for each feature across the test set, separately for its positive and negative contributions. This quantitative summary offers a consolidated view of how individual tokens influence the model’s predictions. By averaging SHAP values across instances, we identify the features with the most consistent and substantial impact on classification outcomes. Table 2 presents the twenty most influential tokens on each side of the sentiment spectrum—those most strongly associated with positive and negative sentiment predictions, respectively.
The table reveals several notable patterns. First, the asymmetry between nvidia and amd reemerges as a dominant signal: nvidia appears as the token with the highest average positive SHAP contribution (0.0293), while amd leads the list of negative contributors (–0.0272). This divergence is consistent with the earlier observation in global SHAP plots and likely reflects broader media sentiment toward these firms during the sample period. Interestingly, amd also appears as a secondary positive token, underscoring the context-dependent nature of sentiment framing in financial headlines.
Second, macroeconomic and geopolitical terms feature prominently among the strongest negative contributors. Tokens such as tariffs, tensions, trump, and trade consistently depress sentiment scores, suggesting that the classifier has internalized the bearish tone associated with protectionist or politically volatile language. Conversely, tokens like growth, gains, and recession demonstrate mixed behavior: while growth appears as a positive contributor, it also shows up negatively when possibly framed in skeptical or speculative contexts. The token ai (artificial intelligence) exemplifies this duality, contributing both positively (0.0172) and negatively (–0.0205), which may reflect varied framing in ethical, regulatory, or technological narratives.
Third, several generic financial terms such as shares, stocks, drop, and losses exhibit predictable polarity. These tokens align with their expected market connotations: shares and gains appear among the top positive drivers, while losses and drop are prominent among negative ones. Moreover, compound or multi-word tokens such as advanced micro devices illustrate the added interpretive power gained from enabling phrase-level TF–IDF vectorization. These complex terms tend to have a strong directional influence, highlighting the benefit of treating frequently co-occurring words as atomic features.
Overall, the token-impact table serves as a succinct reference for the most influential linguistic elements in the classifier’s decision-making process. It enhances interpretability by quantifying the marginal effect of each token, and it supports further empirical exploration such as sentiment index construction, term weighting, or feature pruning. In conjunction with SHAP visualizations, it completes a multi-angle transparency framework that strengthens the analytical value of the model and underscores its suitability for finance-focused applications where both prediction and justification are essential.
5. Discussions
5.1. Quality of Automatic Labelling
The use of VADER as a low-cost labeling oracle introduces certain biases, owing to its reliance on a static lexicon and heuristic rules. However, the final classifier’s strong performance (ROC-AUC > 0.83) suggests that this weak supervision approach was largely effective. VADER’s rule-based framework appears to capture a significant portion of the sentiment structure present in financial headlines, especially given the brevity and direct language typical of such text. This aligns with VADER’s original design for short social media posts – it applies lexical polarity scores and intensifiers to approximate human sentiment judgments in concise texts[11]. As a result, the automatically generated labels provided a reasonable initial signal without costly manual annotation.
At the same time, the supervised TF–IDF + logistic regression model was able to learn and generalize patterns beyond VADER’s predefined rules. Notably, it picked up subtle context cues and asymmetric sentiment uses of specific tokens – for example, firm names, ticker symbols, or common phrases that VADER alone might misclassify. While VADER might assign similar sentiment scores to any company name it doesn’t recognize, the trained model learned that terms like “Nvidia” and “AMD” carried divergent sentiment connotations in our dataset. This refinement illustrates the value of combining rule-based weak supervision with data-driven modeling. In essence, the classifier uses VADER’s output as a springboard but can exceed the limitations of the lexicon by observing actual language patterns. This approach is akin to other weak supervision techniques in NLP, where noisy heuristic labels are used to train more robust models[12]. The success of our approach dovetails with recent findings that inexpensive labelers can suffice when followed by an efficient learning algorithm. For instance, one study found that a simple dictionary-based sentiment score, while less accurate in isolation, still contains enough signal for a model to leverage when refined with machine learning[13]. In our case, the combination of a lexicon and a transparent classifier achieved performance levels approaching those of more complex systems, confirming that strategic layering of simple tools can yield competitive results.
It is important to acknowledge that automatic labeling is not perfect. VADER cannot grasp nuances like sarcasm, subtle context shifts, or domain-specific meanings not present in its lexicon. These limitations may introduce noise into the training data – some headlines likely received sentiment labels (positive, negative, neutral) that a human annotator might disagree with. Despite this, our model’s generalization performance (cross-validated F1 ≈ 0.73 and hold-out F1 ≈ 0.83) indicates that it was robust to occasional mislabels. In effect, the logistic regression learned to smooth over VADER’s idiosyncrasies by weighting the most reliable n-gram features. This outcome supports two interpretations. First, VADER’s built-in heuristics did capture many obvious polarity cues correctly (e.g. words like “growth” or “losses”), providing a decent baseline signal. Second, the learning algorithm compensated for the systematic biases in VADER – for example, re-weighting words that VADER might mis-score due to context (like “charge” or “liability” in a financial sense). The end result reinforces that simple and interpretable tools, when strategically combined, can produce performance comparable to more complex models[14]. This balance between transparency and predictive power is especially important in financial applications: understanding why a headline is classified as positive or negative is as critical as the accuracy of the prediction itself [15]. Our findings underscore the viability of lightweight, explainable sentiment workflows in both academic research and practical financial analytics.
5.2. Interpretability Gains
The dual-layer approach to sentiment analysis – using both a transparent lexicon-based method and an explainable linear model – provides a rich, multi-dimensional framework for interpretability. Each component contributes a distinct analytical lens, allowing practitioners to examine model behavior at varying levels of granularity. This layered strategy facilitates deeper understanding of how and why certain headlines are classified with a given sentiment, enabling both qualitative insight and quantitative validation.
Concretely, the workflow offers several interpretability tools to end-users or analysts.
By sorting or filtering the Excel output by VADER’s compound scores, one can quickly surface headlines associated with extreme positive or negative sentiment. These serve as prototypical examples for manual review. A practitioner can easily verify if the rule-based sentiment assignments align with intuition – for instance, checking that strongly negative headlines indeed contain bearish language. This step acts as an initial sanity check, ensuring the lexicon’s output is reasonable before trusting the model’s more nuanced decisions.
The SHAP beeswarm plot provides a holistic view of which tokens have the greatest influence on the model’s predictions across the entire dataset. In our results, tokens like “Nvidia” and “tariffs” stood out, indicating their consistent impact on sentiment classification. By examining this plot, analysts discern recurrent linguistic patterns and domain-specific sentiment drivers. For example, seeing “tariffs” and “tensions” among top negative contributors confirms that the model has learned the expected pessimistic sentiment around trade conflict newsarxiv.orgarxiv.org. Such global interpretability is rarely available in complex architectures like deep neural networks, whose feature importance can be obscured. In contrast, our linear model combined with SHAP yields clear, defensible insights – a particularly valuable property in finance where stakeholders demand to know not just what the model predicts, but whymdpi.commdpi.com.
For any individual headline, we can generate a SHAP force plot to trace how each word pushes the model’s prediction toward positive or negative. This step-by-step explanation essentially reconstructs the model’s reasoning for a single decision[16]. As illustrated in Figure 4, a headline mentioning “investment” and “AMD” sees the positive contribution of “investment” outweigh the negative pull of “AMD,” resulting in an overall optimistic classification. This local view is important for trust in specific high-stakes decisions – for instance, if an investment firm were using the model to screen news, an analyst could justify the model’s decision on a particular story by referring to the exact words that influenced it. Such granularity in explanations is a cornerstone of explainable AI, helping bridge the gap between algorithmic outputs and human understanding[17].
We compiled a ranked list of tokens with the highest average positive or negative SHAP contributions in the test set. This tabular summary serves as a quick reference for which terms are most sentiment-bearing. It condenses the model’s behavior into an interpretable list that a financial analyst or researcher could readily use. For example, seeing “growth” on the positive side and “losses” on the negative side aligns with common sense and validates that the model’s drivers make intuitive sense. More interestingly, the table highlights asymmetric effects (like “Nvidia” vs. “AMD”) that warrant deeper investigation or domain knowledge to interpret. This kind of output not only aids interpretation but could also guide future feature engineering – e.g., knowing that “tariffs” is highly negative might lead one to incorporate a dummy variable for trade-war news in a broader market prediction model.
Collectively, these interpretive tools provide transparency seldom attainable with more complex models. Deep learning models such as Transformers or LSTMs often act as “black boxes,” where even techniques like attention weights or LIME provide only partial insight into the model’s logic. By contrast, our approach leverages the inherent interpretability of linear models and the additive explanations of SHAP to make every step of the sentiment analysis auditable[16]. This not only supports model debugging and validation but also fosters hypothesis generation. For instance, an economist seeing “inflation” or “Fed” among important tokens might hypothesize a linkage between monetary policy news and sentiment shifts, which could be tested in follow-up studies.
In summary, the combination of model coefficients, SHAP visualizations, and token-level impact tables equips users with a comprehensive understanding of the sentiment model. It enhances the overall reliability of sentiment analysis in finance by allowing analysts to trust but also verify the model’s outputs. This level of interpretability is increasingly demanded in financial AI applicationsmdpi.commdpi.com, where regulations and best practices call for explanations of algorithmic decisions. Our framework demonstrates that such transparency is achievable without sacrificing too much accuracy – an encouraging result for the adoption of explainable AI in economic and financial contexts.
5.3. Practical Implications for Finance Research
The insights derived from our model have direct implications for financial research and practice. The token importance analysis revealed that both firm-specific terms (e.g., ticker symbols, company names) and macroeconomic keywords (e.g., “tariffs,” “recession”) substantially influence sentiment classifications in our technology-sector news corpus. This aligns with intuition and confirms that our model is sensitive to economically salient language. It also reinforces findings from prior studies that news sentiment is often entity-specific and context-dependent. For instance, media tone around a particular firm can diverge from the overall market sentiment – a phenomenon our model captured with “Nvidia” (positive) versus “AMD” (negative). Such granularity is valuable because it suggests that aggregating sentiment at the firm level or theme level can provide more signal than a one-size-fits-all metric[13].
One practical outcome of this observation is the potential to construct targeted sentiment indices. Instead of treating all news equally in a single sentiment index, one could build sub-indices that track sentiment for specific companies, industries, or themes (e.g., a “trade war sentiment index” based on terms like “tariffs” and “tensions”) [18]. Our results indicate this might be fruitful: the impact of certain tokens on sentiment was so consistent that they effectively represent a latent factor (for example, “tariffs” appearing in headlines reliably drove sentiment negative, hinting at a “trade tension” factor). By filtering sentiment scores conditional on the presence of such keywords or entities, researchers can design more nuanced indicators. These entity-conditioned sentiment measures could then be linked to financial outcomes with greater precision than broad sentiment averages.
Indeed, there is growing evidence that such refined sentiment metrics have explanatory and predictive power. Prior work has shown that news sentiment indices can predict market movements and volatility – Tetlock’s seminal study demonstrated that high negativity in Wall Street Journal columns foreshadowed market downturns[19]. More recent research using machine learning has strengthened this link: Pasupuleti et al. found that daily sentiment scores from a FinBERT model correlated strongly (R² ≈ 0.76) with next-day S&P 500 returns [19]. This suggests that if one can isolate sentiment pertaining to specific drivers (say, a company’s earnings sentiment or sentiment about interest rates), it might be even more predictive of relevant asset price moves. Our approach contributes to this vision by providing explainable components of sentiment – for example, an analyst could use our token-level attributions to argue that “most of the negative sentiment today is due to trade policy news” versus “due to a tech company’s earnings miss.”
From an investment strategy perspective, these insights enable more sophisticated use of sentiment. Rather than a blunt sentiment signal, an asset manager could take long or short positions on baskets of stocks tied to targeted sentiment shifts. For example, one might go long on semiconductor stocks when their news sentiment (filtered for macro policy terms) is improving, or short if sentiment is deteriorating due to trade war fears. There is empirical support for this approach: a recent study that incorporated news sentiment from large language models found that trading strategies using a sentiment-based long-short signal achieved notable risk-adjusted returns (Sharpe ratios above 2.0)[13]. Notably, that study reported that a strategy based on an advanced NLP model outperformed one based on a traditional dictionary approach, highlighting that harnessing high-quality sentiment signals can yield real financial gains[13]. Our work, while using a simpler model, is a step toward such deployable sentiment signals – with the added benefit of being fully transparent to decision-makers.
Beyond trading, the interpretability of our sentiment analysis has implications for risk management and regulatory compliance. In risk management, understanding the drivers of market sentiment can help in scenario analysis and early warning signals. If our model flags that “recession”-related sentiment is spiking negatively across tech news, risk officers might examine portfolio exposure to economically sensitive tech firms. In the regulatory domain, explainable sentiment models could assist regulators in monitoring market manipulation or misinformation. Since our outputs are human-interpretable (down to which words caused a sentiment shift), they could be used to justify investigations – for instance, identifying if a flurry of negative articles with identical phrases coincides with suspicious trading activity. Sentiment analysis is already being considered for market surveillance; it can help detect unusual pessimistic or optimistic bursts that might indicate speculative attacks or pump-and-dump schemes[14]. An interpretable model would allow regulators to articulate why a set of news was flagged, an important aspect for enforcement actions.
Finally, our approach underscores a broader point for financial research: the integration of domain knowledge can enhance AI models. We deliberately focused on a single sector and included domain-relevant features (e.g., recognizing company names), which made the sentiment signals more meaningful. This resonates with recent work on hybrid models that inject financial knowledge into NLP models. For example, Hong and He (2025) introduced a hierarchical BERT with a query-guided attention mechanism that uses curated financial concept queries to guide the model’s focus[17]. They achieved better performance and more interpretable results by steering the model with domain-specific information. Our simpler pipeline achieves a similar goal in spirit: by examining outputs like Table 2, one can see it effectively identified financially relevant concepts (companies, economic terms) as key sentiment drivers, which is what a domain-informed model would also target. This convergence suggests that whether using complex deep learning or simple lexicon approaches, carefully leveraging financial context is key to meaningful sentiment analysis.
In summary, the practical implications of our work are multifaceted. It provides a blueprint for creating sentiment measures that are explainable, targeted, and actionable. Researchers can build on this to explore how news sentiment interacts with market dynamics (e.g., does a spike in negative tech sentiment predict NASDAQ volatility?). Practitioners can use the toolkit for decision support, confident that they can understand the model’s reasoning. And given the modular, open-source nature of our workflow, it can be readily extended to other domains such as social media sentiment (with appropriate lexicons for tweets) or to other languages and markets, addressing an area of need for more globally inclusive financial analysis[19]. In doing so, we contribute to the broader literature on market informatics, reinforcing the notion that explainable AI can serve as a valuable instrument in financial economics – one that bridges the gap between qualitative news narratives and quantitative market outcomes [20].
5.4. Limitations and Future Work
While our focus has been on a lexicon-based, interpretable pipeline, it is important to position this approach relative to the state-of-the-art in NLP for financial sentiment. Modern transformer-based models like BERT and its financial derivatives (FinBERT, FinGPT, etc.) have set new benchmarks for sentiment classification accuracy[19]. For instance, FinBERT – a BERT model pre-trained on financial text – was reported to achieve around 89% F1-score on financial news sentiment, substantially higher than what we obtained with our logistic model[19]. These models, especially when fine-tuned on large datasets, can capture nuanced language patterns (idioms, context, tone) that simpler models might miss. Additionally, in head-to-head comparisons, transformer models have been shown to outperform not only lexicons but also classical machine learning classifiers on financial text tasks[11]. For example, a recent large-scale study on 965,000 news articles found that a GPT-3-based model (OPT) slightly outperformed BERT and FinBERT in sentiment classification, whereas a traditional Loughran–McDonald dictionary approach lagged far behind (50% accuracy vs ~74% for LLMs)[13]. This underscores that, purely in terms of predictive performance, deep learning currently holds an advantage in financial sentiment analysis.
However, the efficacy of advanced NLP models comes at a cost. Transformers require extensive data and computational resources for training and inference[14]. They often involve significant inference time and infrastructure, making them less practical for real-time or high-frequency applications without substantial investment. In contrast, our lexicon+linear model approach is lightweight – it can be run on ordinary hardware and returns results almost instantly, which is beneficial for deployment in live systems or on the “edge” (e.g., within a trading algorithm that must make split-second decisions). More importantly, complex models are opaque by nature. Even with tools like SHAP or LIME, explaining a Transformer’s decisions is challenging and sometimes misleading, as these models may rely on distributed patterns in the text that don’t correspond neatly to human-understandable features. In high-stakes domains like finance, this lack of transparency is a critical drawback. Financial institutions and regulators are increasingly wary of black-box models; there are calls for AI systems that can “explain themselves” to build trust and satisfy compliance requirements[17]. In this regard, our approach offers a clear advantage: every prediction can be traced back to concrete words and simple coefficients, which is exactly the kind of traceability that industry guidelines (and emerging AI regulations) are starting to mandate[17].
Looking forward, a promising direction is to seek the best of both worlds – combining the accuracy of deep models with the transparency of lexicon-based methods. Recent research is exploring this intersection. Notably, Rizinski et al. (2024) introduce XLex (eXplainable Lexicons), a methodology where a Transformer model is used to automatically expand and refine a sentiment lexicon, guided by SHAP values for explainability[14]Their approach yielded an enriched financial lexicon that outperformed the original Loughran–McDonald lexicon by a significant margin, improving classification accuracy by over 40 percentage points in their experiments[14]. This indicates that we don’t necessarily have to choose between a human-readable lexicon and a high-performance model – we can use the model’s insights to inform the lexicon. Adopting such techniques in our workflow could address some limitations. For example, we relied on a general-purpose lexicon (VADER) that isn’t tailored to finance. A domain-specific lexicon, or one expanded via a Transformer on financial data, would likely catch nuances we miss (e.g., the word “charge” being neutral in finance vs negative in general sentiment). Future work could integrate a financial lexicon like Loughran–McDonald or the learned lexicons from XLex to improve initial labeling quality. This might reduce the bias introduced by using a general lexicon and provide an even stronger foundation for the classifier.
Another extension of interest is benchmarking our transparent model against fully black-box models on the same task. While we expect the black-box to have higher raw accuracy, measuring the gap quantitatively would help assess the trade-off between accuracy and interpretability. If a FinBERT-based classifier, for instance, reaches 90% accuracy on our dataset versus ~78% for our model, stakeholders can decide whether that ~12% gain is worth the loss of interpretability and the extra complexity [21]. In many finance use-cases, a slightly lower accuracy model that can be explained may be preferable to a marginally better model that operates as a mystery[14]. Additionally, we would apply the same SHAP analysis to the black-box model to see if it corroborates our findings. Prior works that applied SHAP to Transformers in finance have found that even those models highlight similar financial terms (company names, sentiment-laden words) as important[19]. This means that our model’s explanations could serve as a sanity check for more complex models – if a deep model were making decisions for reasons that completely diverge from what our interpretable model finds (e.g., focusing on irrelevant words), that could indicate when the deep model is picking up spurious correlations.
We also acknowledge the need to test our approach in different contexts to ensure its generalizability. Our dataset was limited to U.S. tech-sector news in English. Financial language varies across sectors (e.g., biotech vs. finance industry jargon) and certainly across languages. An exciting area for future research is to apply explainable sentiment analysis to non-English financial news. Early forays into this, such as Alasmari & Alotaibi (2025)’s work on Arabic business news, show that localized models can outperform translated or off-the-shelf approaches[19]. Adapting our pipeline would involve using local-language lexicons or machine translation combined with careful validation by native experts. Similarly, extending to social media data (Twitter, investor forums) would require handling much noisier text – but our two-tier approach might perform well there, since lexicon heuristics like VADER are known to handle social media elements (emojis, slang) reasonably well[11]. We could incorporate additional preprocessing for such data (e.g., hashtag handling) and possibly retrain the logistic model on an annotated tweet dataset for finance.
In terms of big data scalability, our current workflow (using a free API and Python on modest data) was not truly “big data”. Yet, it points toward how an accessible pipeline can be scaled. Cloud-based data aggregation and streaming sentiment analysis could continuously populate an Excel dashboard or feed signals into algorithmic trading systems. Given the efficiency of our approach, it could be deployed in streaming analytics for, say, real-time sentiment tracking of news as it breaks – something that high-frequency trading firms and market-makers monitor closely. If the need arises to handle millions of articles, the process could be distributed (each day’s news parsed in parallel) and the models updated incrementally. The commitment to open-source tools means even such scaled-up deployments remain cost-effective and transparent.
Finally, we must consider the evolving landscape of explainable AI techniques. Our use of SHAP was well-suited to a linear model, producing exact attributions. For more complex models, approximate explanation methods (SHAP, LIME, attention visualization) are being actively developed to be more trustworthy and user-friendly[17]. As these tools mature, some challenges we face – e.g., explaining interactions or sequential dependencies – might be better addressed. It would be worthwhile to explore emerging XAI methods like concept-based explanations or counterfactual explanations in the context of financial text. For example, a concept-based explainer might quantify the influence of “tech optimism” vs “trade war fear” as high-level concepts driving predictions, which could resonate well with finance experts. Exploring such methods could further bridge the gap between machine outputs and the mental models of human decision-makers.
In summary, our approach stands as a contrast to the prevailing trend of ever more complex NLP in finance. The limitations we outlined (static lexicon biases, sector specificity, linear model assumptions) are real, but they also highlight research opportunities. By addressing these through hybrid models, broader datasets, and new explainability techniques, we can advance the field of financial sentiment analysis. The end goal is a suite of models that are not only accurate and scalable, but also transparent, domain-aware, and usable in real decision contexts – aligning with the vision of AI-driven data analytics in finance that augment rather than obscure human judgment[14].
6. Conclusion
This study presented a fully reproducible, cost-free workflow for extracting and interpreting sentiment from financial news headlines. Centered on the U.S. technology sector, our approach integrated a rule-based lexicon (VADER), a transparent machine learning model (TF–IDF features with logistic regression), and the SHAP explanation framework. The results demonstrate that methodological clarity and computational accessibility can coexist with reliable performance. Despite relying on weak supervision and forgoing deep neural networks, our model achieved consistent and meaningful results (hold-out F1 around 0.83, ROC-AUC ≈ 0.83), supporting the central argument that high interpretability and practical utility are not mutually exclusive in financial sentiment analysis. In fact, the clarity of our model’s inner workings is a defining strength – every prediction is accompanied by an explanation – which is rarely attainable with more complex models.
The outputs of our workflow form a versatile toolkit for both research and practice. We provided a structured Excel workbook of the news data with sentiment annotations, facilitating immediate exploration and visualization. We reported cross-validation metrics and hold-out performance, which can serve as benchmarks for future studies. Through SHAP, we delivered both global explanations (what words generally drive sentiment) and local explanations (why a specific headline was labeled a certain way). Additionally, we compiled a token-impact table that ranks features by influence. These artifacts together make our work reproducible and extensible. An academic researcher can take the Excel dataset or the CSV outputs and perform further analysis (e.g., regress sentiment against stock returns in R or Stata) with full confidence in how the data were generated. A practitioner or student can use our Python script as a learning tool or a starting point for their own sentiment mining projects, without needing any proprietary software or data. This commitment to open science aligns with recent calls to improve reproducibility in machine learning research[8]. By sharing every component and using only public resources, we lower the barrier to entry and enable others to verify and build upon our findings, which is important for the progress of AI in finance.
Critically, the transparency of our pipeline enhances its trustworthiness, an essential property for deployment in real-world financial environments [22]. In high-stakes domains, decision-makers must be able to understand and justify the outputs of AI systems. Each step of our process – from data collection, to sentiment labeling, to model predictions, to explanations – is human-interpretable and auditable. This stands in stark contrast to black-box approaches that might offer higher raw accuracy but at the cost of opacity. As financial firms explore AI tools, many are recognizing that explainability is not a luxury, but a necessity[14]. Our work directly addresses this need by showing that one can attain useful performance on a market-relevant task while preserving full insight into the model’s reasoning. We anticipate that such explainable models will be better received by risk managers and regulators, who often require evidence that a model is making sensible, non-discriminatory, and stable decisions. In this sense, our study contributes to the broader movement toward responsible AI in finance, echoing initiatives for transparent model reporting and accountability in algorithmic decision-making[14].
The implications of our findings extend beyond the immediate task of classifying news sentiment. We demonstrated an approach to AI development that emphasizes simplicity, interpretability, and reproducibility. This approach is intentionally extensible. Researchers can adapt our pipeline to other sectors (e.g., finance or healthcare news) by swapping out the API filters or lexicon, and see how it performs [23]. They can incorporate alternative sentiment lexicons (such as Loughran–McDonald for finance-specific vocabulary) or even plug in a more advanced classifier (like an interpretable neural network or a rule-based ML model) while still using our SHAP-based explanation framework to maintain transparency. Our work can also be benchmarked against more complex models like FinBERT or GPT-based classifiers: it provides a baseline that is easy to understand, which any proposed complex model should ideally exceed in accuracy and match in interpretability [24]. By encouraging such comparisons, we promote rigorous evaluation of new models – if a novel deep model only marginally beats our simpler model but cannot explain itself, is it truly a step forward for practical purposes? These are the kind of questions that our study enables the community to ask. [25]
In conclusion, we have delivered both practical tools and conceptual insights. Practically, we offer a ready-to-use sentiment analysis pipeline that is inexpensive and transparent, suitable for educational use, preliminary market analysis, or integration into larger research projects. Conceptually, we show that embracing explainability does not necessitate sacrificing analytical value. On the contrary, the explainable nature of our model enhanced its usefulness – turning sentiment scores from opaque numbers into rich information about market narratives and keyword drivers. This opens up new avenues [26] for connecting textual sentiment with economic mechanisms: researchers can debate and test why certain words sway investor sentiment, rather than treating the model as an inscrutable oracle. We believe this kind of synergy between human insight and algorithmic analysis is the future of AI in finance [27]. By bridging the gap between simplicity and rigor, our work lays a foundation[10] for developing explainable, accessible, and domain-aware sentiment analysis tools. Such tools can empower analysts and researchers to navigate the ever-growing flood of financial news with greater confidence, extracting not just predictive signals but also the understanding necessary to act on them responsibly. The positive reception of explainable models in other fields – from medicine to consumer technology – suggests that finance too is ready to embrace AI solutions that are as transparent as they are powerful[17]. Our hope is that this study inspires further efforts to develop AI systems that stakeholders can trust and learn from, ultimately leading to smarter and more accountable financial decision-making.
Author Contributions
For research articles with several authors, a short paragraph specifying their individual contributions must be provided. The following statements should be used “Conceptualization, M.-P. C., I. P., D.-A. M. and C. B. ; methodology, M.-P. C., I. P., D.-A. M. and C.-V. B.; software, M.-P. C., I. P., D.-A. M. and C.-V. B.; validation, M.-P. C., I. P., D.-A. M. and C.-V. B.; formal analysis, M.-P. C., I. P., D.-A. M. and C.-V. B.; investigation, M.-P. C., I. P., D.-A. M. and C.-V. B.; resources, M.-P. C., I. P., D.-A. M. and C.-V. B.; data curation, M.-P. C., I. P., D.-A. M. and C.-V. B.; writing—original draft preparation, M.-P. C., I. P., D.-A. M. and C.-V. B.; writing—review and editing, M.-P. C., I. P., D.-A. M. and C.-V. B.; visualization, M.-P. C., I. P., D.-A. M. and C.-V. B.; supervision, M.-P. C., I. P., D.-A. M. and C.-V. B.; project administration, M.-P. C., I. P., D.-A. M. and C.-V. B.; funding acquisition, M.-P. C., I. P., D.-A. M. and C.-V. B.. All authors have read and agreed to the published version of the manuscript.
Conflicts of Interest
The authors declare no conflict of interest.
References
- S. Lundberg and S.-I. Lee, “A Unified Approach to Interpreting Model Predictions,” Nov. 25, 2017, arXiv: arXiv:1705.07874. [CrossRef]
- D. Araci, “FinBERT: Financial Sentiment Analysis with Pre-trained Language Models,” Aug. 27, 2019, arXiv: arXiv:1908.10063. [CrossRef]
- P. Hajek, J. Novotny, and J. Kovarnik, “Predicting Exchange Rate with FinBERT-Based Sentiment Analysis of Online News,” in Proceedings of the 2022 6th International Conference on E-Business and Internet, in ICEBI ’22. New York, NY, USA: Association for Computing Machinery, Mar. 2023, pp. 133–138. [CrossRef]
- M. T. Ribeiro, S. Singh, and C. Guestrin, “‘Why Should I Trust You?’: Explaining the Predictions of Any Classifier,” in Proceedings of the 22nd ACM SIGKDD International Conference on Knowledge Discovery and Data Mining, in KDD ’16. New York, NY, USA: Association for Computing Machinery, Aug. 2016, pp. 1135–1144. [CrossRef]
- “Giving Content to Investor Sentiment: The Role of Media in the Stock Market,” ResearchGate. [CrossRef]
- A. Khadjeh Nassirtoussi, S. Aghabozorgi, T. Ying Wah, and D. C. L. Ngo, “Text mining for market prediction: A systematic review,” Expert Syst. Appl., vol. 41, no. 16, pp. 7653–7670, Nov. 2014. [CrossRef]
- “Model Cards for Model Reporting | Proceedings of the Conference on Fairness, Accountability, and Transparency.” Accessed: Jul. 11, 2025. [Online]. Available: https://dl.acm.org/doi/10.1145/3287560.3287596.
- J. Pineau et al., “Improving Reproducibility in Machine Learning Research (A Report from the NeurIPS 2019 Reproducibility Program),” Dec. 30, 2020, arXiv: arXiv:2003.12206. [CrossRef]
- S. F. Yazdani, M. A. A. Murad, N. Sharef, Y. P. Singh, and A. Latiff, “Sentiment Classification of Financial News Using Statistical Features,” Int J Pattern Recognit Artif Intell, vol. 31, pp. 17500061–175000634, 2017. [CrossRef]
- arXiv:arXiv:2504.16188.J. Magomere, E. Kochkina, S. Mensah, S. Kaur, and C. H. Smiley, “FinNLI: Novel Dataset for Multi-Genre Financial Natural Language Inference Benchmarking,” Apr. 22, 2025, arXiv: arXiv:2504.16188. [CrossRef]
- T. Adams, A. Ajello, D. Silva, and F. Vazquez-Grande, “More than Words: Twitter Chatter and Financial Market Sentiment,” Finance Econ. Discuss. Ser., no. 2023–034, pp. 1–36, May 2023. [CrossRef]
- P. Lison, J. Barnes, and A. Hubin, “skweak: Weak Supervision Made Easy for NLP,” in Proceedings of the 59th Annual Meeting of the Association for Computational Linguistics and the 11th International Joint Conference on Natural Language Processing: System Demonstrations, H. Ji, J. C. Park, and R. Xia, Eds., Online: Association for Computational Linguistics, Aug. 2021, pp. 337–346. [CrossRef]
- K. Kirtac and G. Germano, “Sentiment trading with large language models,” Finance Res. Lett., vol. 62, p. 105227, Apr. 2024. [CrossRef]
- M. Rizinski, H. Peshov, K. Mishev, M. Jovanovik, and D. Trajanov, “Sentiment Analysis in Finance: From Transformers Back to eXplainable Lexicons (XLex),” IEEE Access, vol. 12, pp. 7170–7198, 2024. [CrossRef]
- M. P. Cristescu, R. A. Nerisanu, D. A. Mara, and S.-V. Oprea, “Using Market News Sentiment Analysis for Stock Market Prediction,” Mathematics, vol. 10, no. 22, Art. no. 22, Jan. 2022. [CrossRef]
- L. O. Hjelkrem and P. E. de Lange, “Explaining Deep Learning Models for Credit Scoring with SHAP: A Case Study Using Open Banking Data,” J. Risk Financ. Manag., vol. 16, no. 4, Art. no. 4, Apr. 2023. [CrossRef]
- C. Hong and Q. He, “Integrating Financial Knowledge for Explainable Stock Market Sentiment Analysis via Query-Guided Attention,” Appl. Sci., vol. 15, no. 12, Art. no. 12, Jan. 2025. [CrossRef]
- B. Fazlija and P. Harder, “Using Financial News Sentiment for Stock Price Direction Prediction,” Mathematics, vol. 10, no. 13, Art. no. 13, Jan. 2022. [CrossRef]
- M. K. P. Pasupuleti, “(PDF) Explainable Sentiment Analysis for Financial News and Market Prediction,” Int. J. Acad. Ind. Res. Innov., vol. 05, pp. 486–495, May 2025. [CrossRef]
- M. Wang and T. Ma, “MANA-Net: Mitigating Aggregated Sentiment Homogenization with News Weighting for Enhanced Market Prediction,” Oct. 2024, pp. 2379–2389. [CrossRef]
- “(PDF) FinBERT-FOMC: Fine-Tuned FinBERT Model with Sentiment Focus Method for Enhancing Sentiment Analysis of FOMC Minutes,” in ResearchGate, Jun. 2025. [CrossRef]
- P.-D. Arsenault, S. Wang, and J.-M. Patenande, “A Survey of Explainable Artificial Intelligence (XAI) in Financial Time Series Forecasting,” ACM Comput. Surv., vol. 57, no. 10, pp. 1–37, Oct. 2025. [CrossRef]
- J. Chen et al., “FinTextQA: A Dataset for Long-form Financial Question Answering,” 2024, pp. 6025–6047. [CrossRef]
- Z. Chen et al., “FinQA: A Dataset of Numerical Reasoning over Financial Data,” May 07, 2022, arXiv: arXiv:2109.00122. [CrossRef]
- S. Anbaee Farimani, M. Vafaei Jahan, A. Milani Fard, and S. R. K. Tabbakh, “Investigating the informativeness of technical indicators and news sentiment in financial market price prediction,” Knowl.-Based Syst., vol. 247, p. 108742, Jul. 2022. [CrossRef]
- P. Xiao, “Stock Market Prediction Based on Financial News, Text Data Mining, and Investor Sentiment Analysis,” Int. J. Inf. Syst. Model. Des. IJISMD, vol. 15, no. 1, pp. 1–13, 2024. [CrossRef]
- W.-J. Liu, Y.-B. Ge, and Y.-C. Gu, “News-driven stock market index prediction based on trellis network and sentiment attention mechanism,” Expert Syst. Appl., vol. 250, p. 123966, Sep. 2024. [CrossRef]
Figure 1.
Core Python routine for fetching daily technology-sector financial news from the Marketaux API.
Figure 1.
Core Python routine for fetching daily technology-sector financial news from the Marketaux API.

Figure 2.
excerpt of news_with_vader.xlsx.
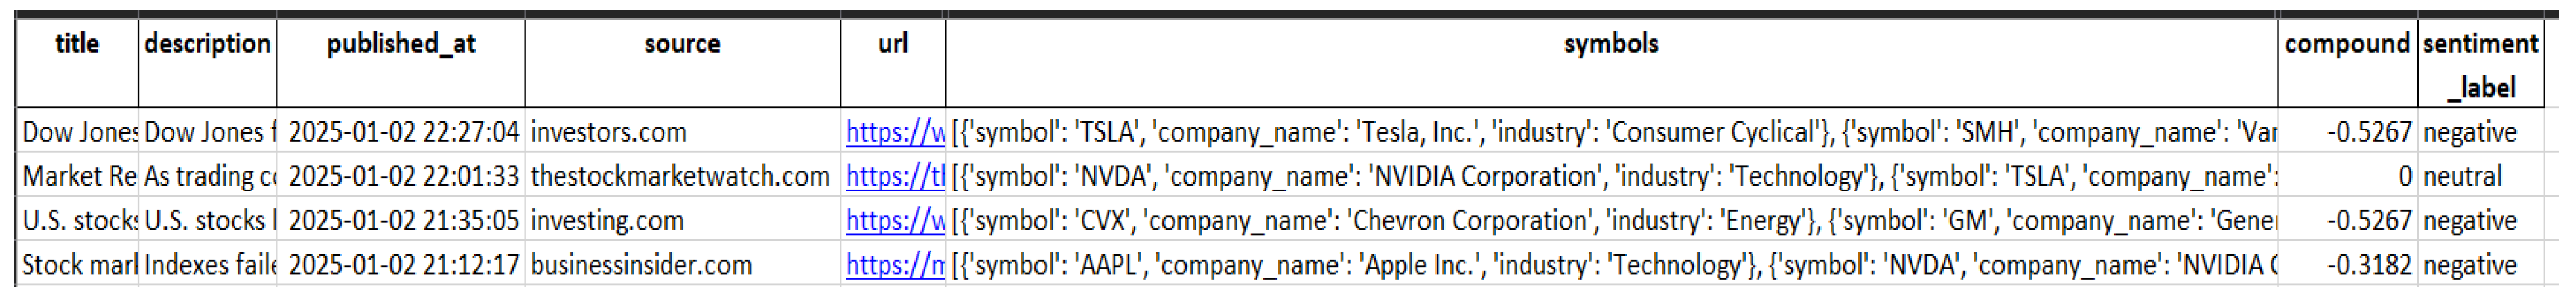
Figure 3.
global SHAP summary plot.
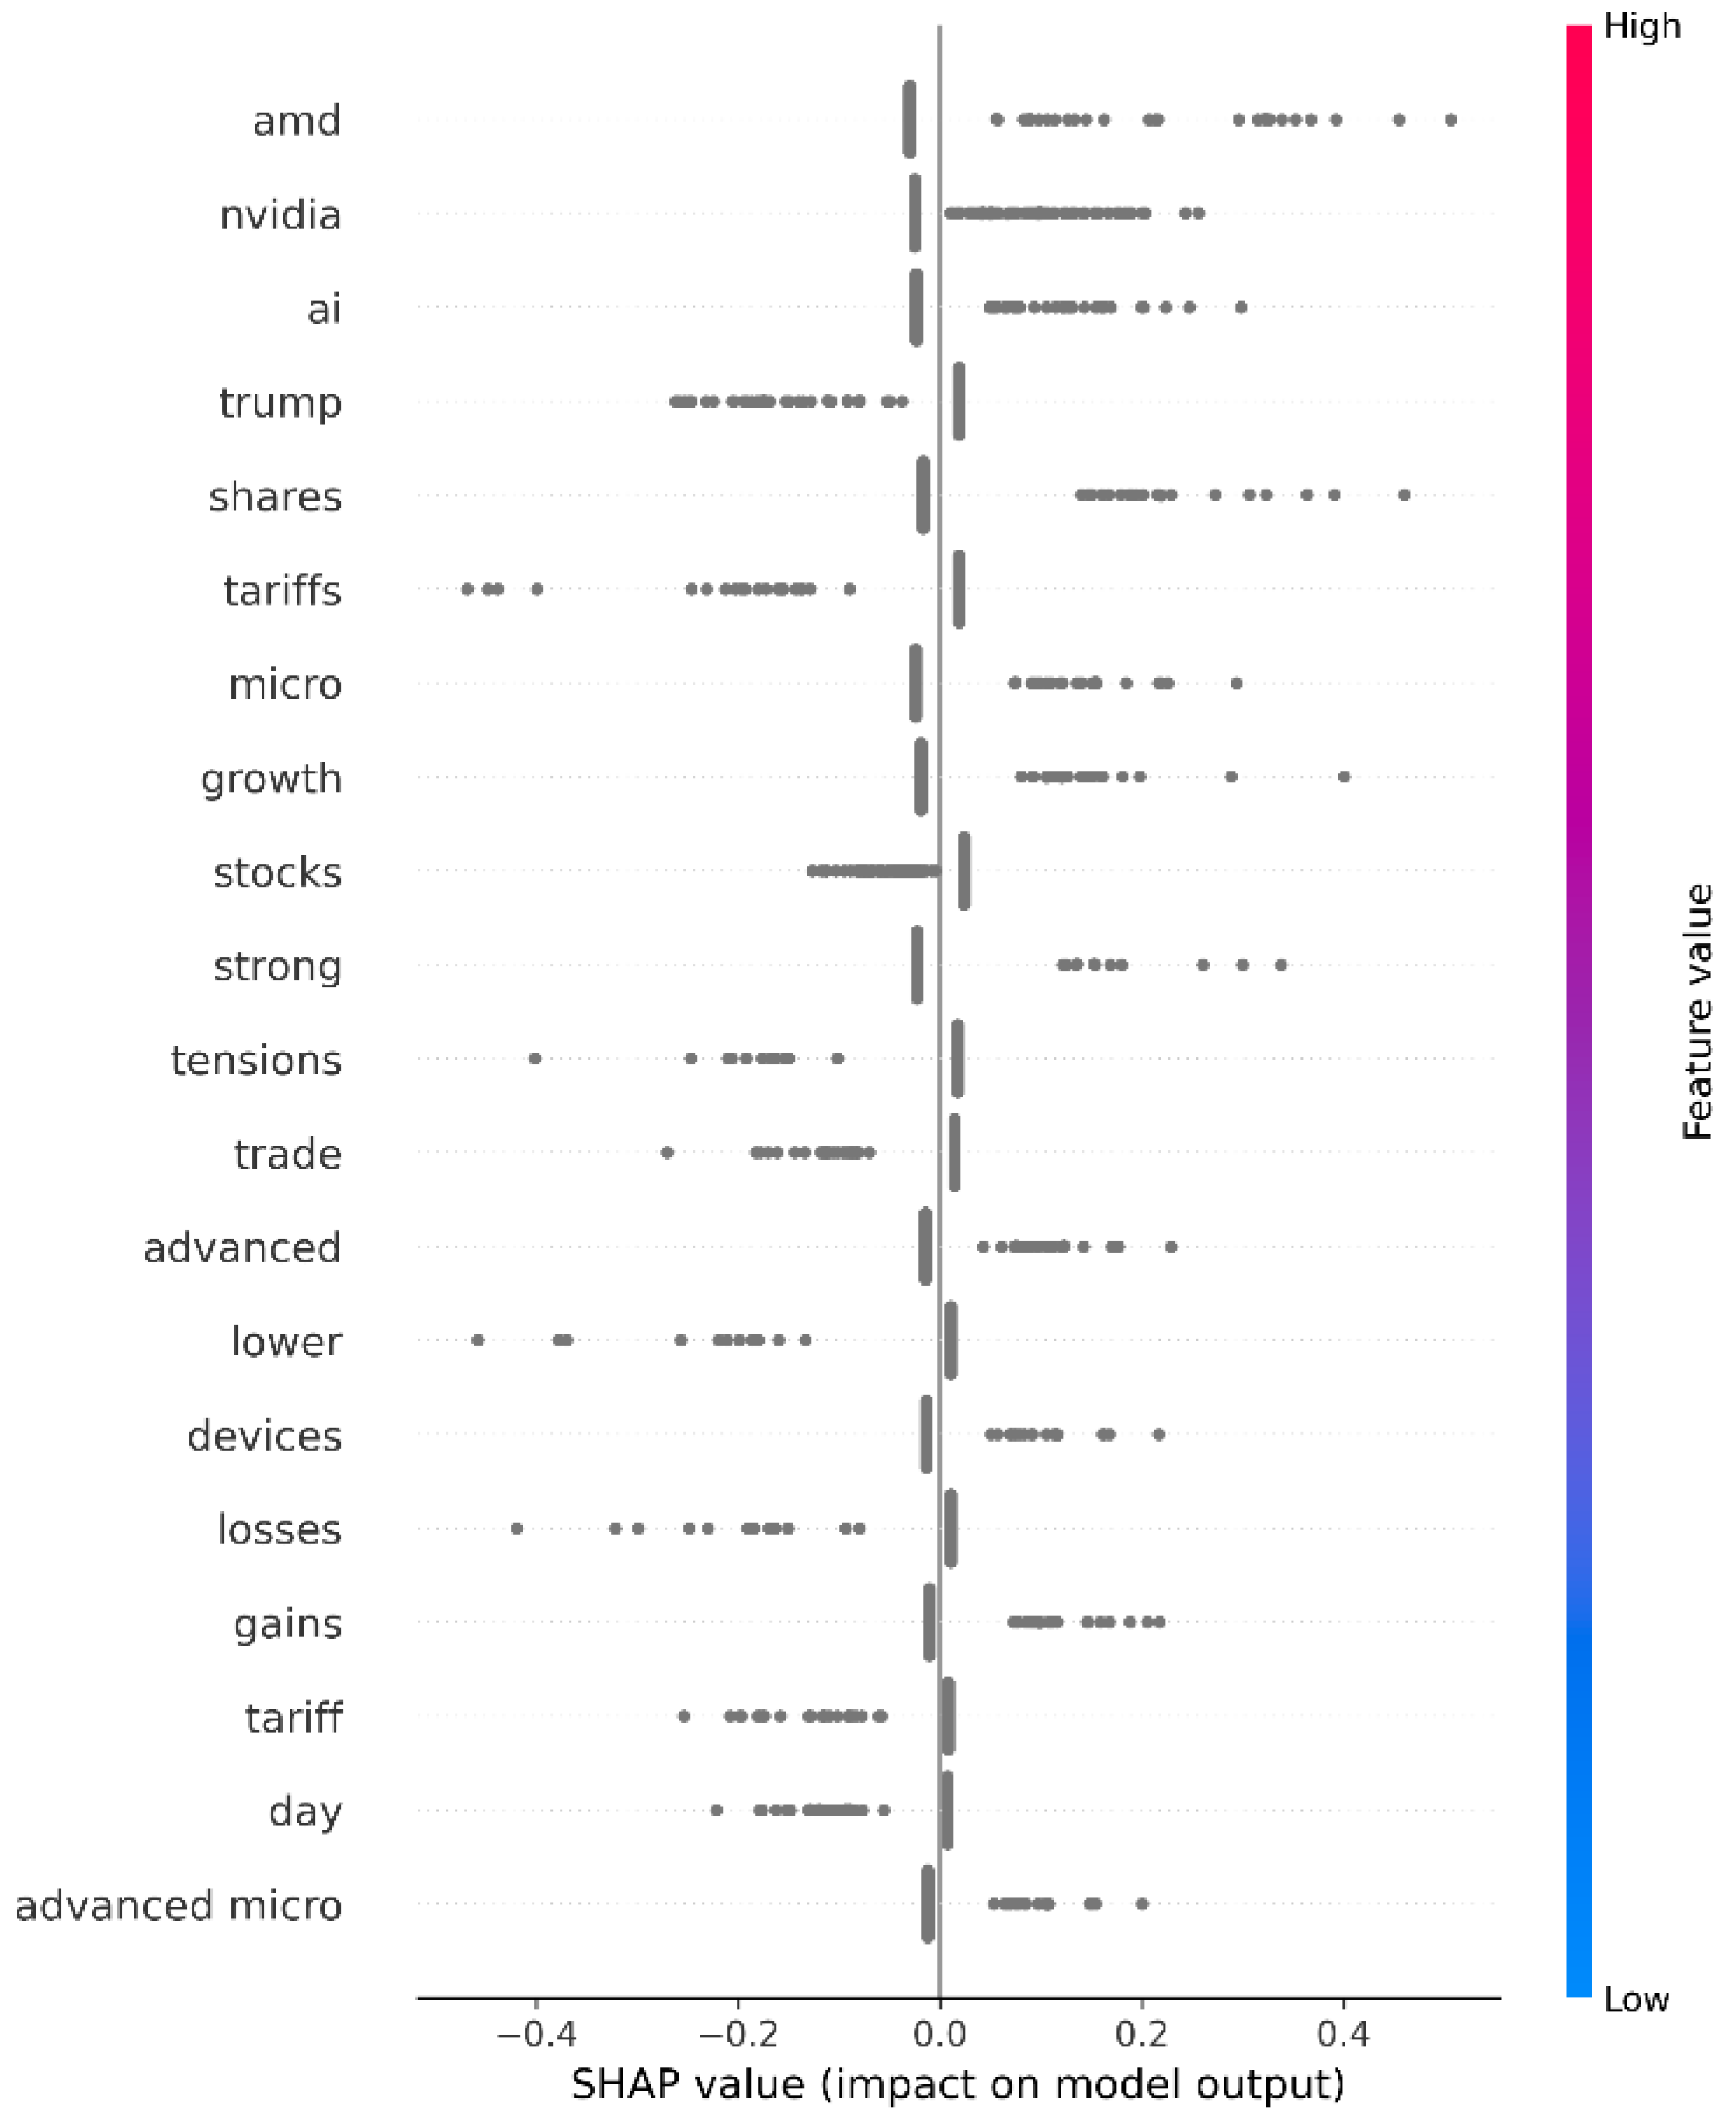
Figure 4.
local SHAP force plot.
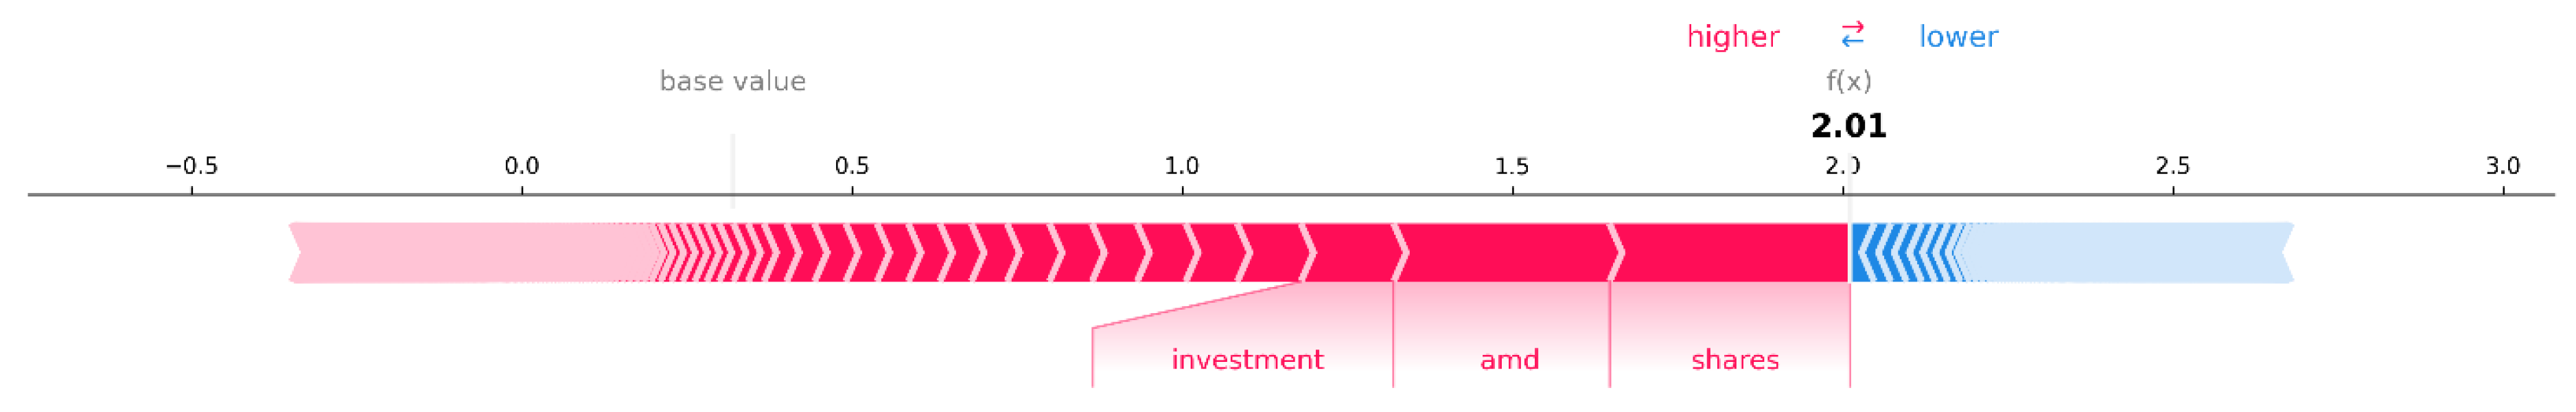

Table 1.
5-fold validation metrics.
| Accuracy | Macro-F1 | ROC-AUC | |
| Mean | 0.760 | 0.732 | 0.831 |
| Std. | 0.035 | 0.034 | 0.029 |
Table 2.
Most influential tokens.
| Rank | Positive token | Mean SHAP (+) | Negative token | Mean SHAP (–) |
| 11 | nvidia | 0.0293 | amd | –0.0272 |
| 22 | amd | 0.0244 | micro | –0.0224 |
| 33 | shares | 0.0204 | strong | –0.0219 |
| 44 | ai | 0.0172 | trump | –0.0215 |
| 55 | tariffs | +0.0168 | ai | –0.0205 |
| 66 | stocks | +0.0166 | tariffs | –0.0190 |
| 77 | tensions | +0.0164 | nvidia | –0.0176 |
| 88 | trump | +0.0161 | growth | –0.0170 |
| 99 | growth | +0.0148 | shares | –0.0155 |
| 110 | micro | +0.0129 | stocks | –0.0150 |
| 111 | trade | +0.0124 | day | –0.0137 |
| 112 | drop | +0.0113 | tariff | –0.0132 |
| 113 | gains | +0.0112 | devices | –0.0131 |
| 114 | recession | +0.0105 | trade | –0.0130 |
| 115 | advanced | +0.0105 | advanced | –0.0129 |
| 116 | lower | +0.0100 | advanced micro | –0.0115 |
| 117 | losses | +0.0099 | lower | –0.0112 |
| 118 | amid | +0.0097 | losses | –0.0112 |
| 619 | strong | 0.0084 | micro devices | –0.0108 |
| 720 | devices | 0.0082 | advanced micro devices | –0.0108 |
Disclaimer/Publisher’s Note: The statements, opinions and data contained in all publications are solely those of the individual author(s) and contributor(s) and not of MDPI and/or the editor(s). MDPI and/or the editor(s) disclaim responsibility for any injury to people or property resulting from any ideas, methods, instructions or products referred to in the content. |
© 2025 by the authors. Licensee MDPI, Basel, Switzerland. This article is an open access article distributed under the terms and conditions of the Creative Commons Attribution (CC BY) license (http://creativecommons.org/licenses/by/4.0/).
Copyright: This open access article is published under a Creative Commons CC BY 4.0 license, which permit the free download, distribution, and reuse, provided that the author and preprint are cited in any reuse.


