Submitted:
08 January 2026
Posted:
09 January 2026
You are already at the latest version
Abstract
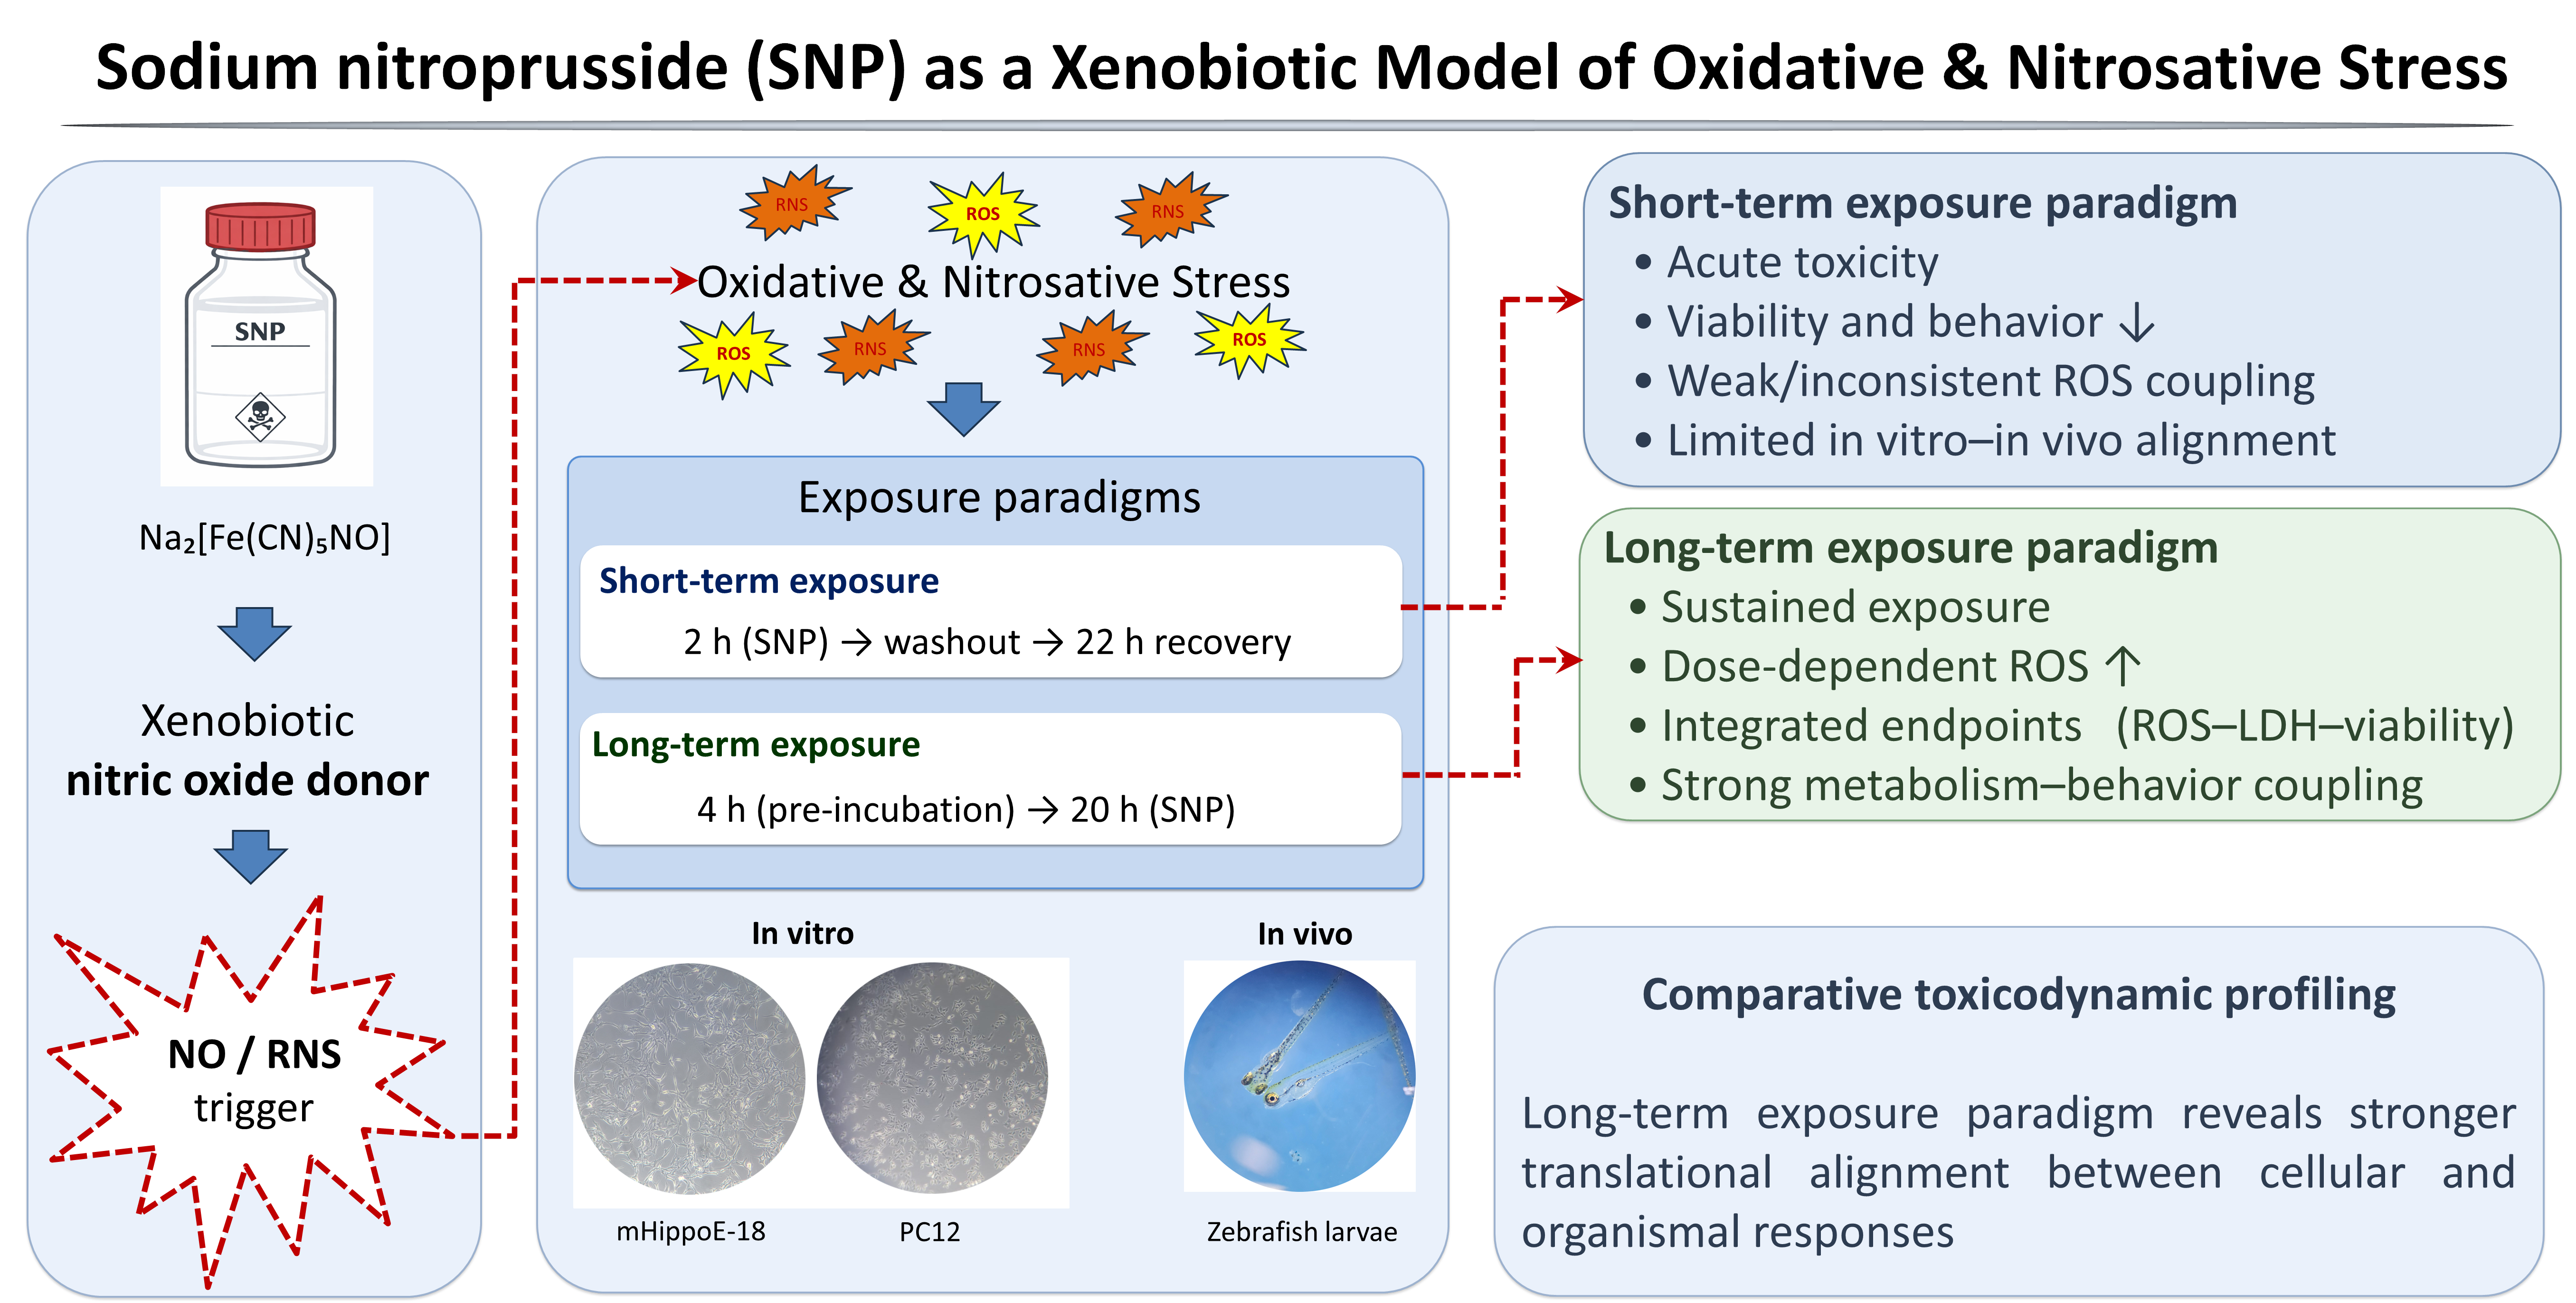
Oxidative and nitrosative stress are central mechanisms in the pathogenesis of neurodegenerative diseases, where excessive production of reactive oxygen and nitrogen species (ROS/RNS) leads to mitochondrial dysfunction, membrane damage, and neuronal death. In this study, we established and compared short-term (2 h) and long-term (20 h) exposure paradigms to sodium nitroprusside (SNP), used as a xenobiotic nitric oxide donor, in two neuronal cell lines (mHippoE-18 and PC12) and zebrafish larvae, aiming to provide a preclinical framework for neurodegenerative drug discovery. In vitro, SNP exposure caused concentration-dependent reductions in viability and alterations in oxidative balance, with mHippoE-18 cells exhibiting higher susceptibility than PC12 cells. In the short-term exposure, cytotoxicity was primarily associated with membrane disruption at higher concentrations, while oxidative stress contributed more strongly at intermediate doses. In the long-term exposure, mHippoE-18 cells showed strong integrated correlations between ROS, LDH release, and viability loss, highlighting their vulnerability to nitrosative stress. In zebrafish, SNP exposure impaired metabolic activity and swimming behavior in both paradigms. Long-term exposure led to consistent dose-dependent increases in ROS, accompanied by locomotor deficits tightly linked to energy metabolism. Overall, the higher sensitivity of mHippoE-18 cells compared with PC12, and the dose-dependent metabolic and behavioral impairments observed in zebrafish, indicate that cellular responses partially mirror the in vivo outcomes. This integrative approach underscores the value of combining neuronal cell lines with zebrafish larvae to capture complementary aspects of SNP-induced neurotoxicity and to strengthen preclinical evaluation of candidate compounds with protective or therapeutic potential. These findings support the use of SNP as a xenobiotic model to probe nitrosative stress–driven neurotoxicity across cellular and organismal systems.
Keywords:
xenobiotic-induced toxicity
; nitrosative stress
; reactive oxygen species (ROS)
; neurotoxicity
; behavioral phenotyping
; neurodegenerative disorders
1. Introduction
Oxidative and nitrosative stress are key contributors to neurodegeneration, affecting neuronal integrity through damage to lipids, proteins, and DNA mediated by reactive oxygen and nitrogen species (ROS/RNS) [1]. They have been consistently associated with the pathogenesis of major neurodegenerative diseases, including Alzheimer’s disease, Parkinson’s disease, Huntington’s disease, and amyotrophic lateral sclerosis, where excessive ROS/RNS generation overwhelms endogenous antioxidant defenses, leading to mitochondrial dysfunction, excitotoxicity, and activation of apoptotic pathways [2]. These processes not only accelerate neuronal death but also contribute to selective neuronal vulnerability, thereby explaining the progressive and region-specific nature of neurodegeneration [3].
Experimental evidence from cellular systems demonstrates that oxidative stress acts as an early driver of neurodegenerative cascades rather than a secondary by-product of neuronal loss [4], while complementary in vivo studies in zebrafish confirm that oxidative imbalance produces both structural and behavioral phenotypes reminiscent of human disease [5]. Given these pathophysiological mechanisms, modeling oxidative and nitrosative stress in vitro and in vivo has become an essential strategy for drug discovery [6,7,8]. Experimental paradigms that reproduce toxic insults and subsequent recovery phases allow researchers to evaluate both protective and therapeutic interventions under controlled conditions. For instance, zebrafish and neuronal cell lines have been widely used to simulate oxidative injury, most commonly through exposure to hydrogen peroxide (H2O2), thereby providing valuable insights into redox imbalance, behavioral alterations, and the efficacy of candidate molecules [4,7]. However, despite its popularity, repeated H2O2 application may lead to inconsistent cellular responses and limited reproducibility, reducing its utility as a robust experimental paradigm [9].
To address these limitations, sodium nitroprusside (SNP), a stable nitric oxide (NO) donor widely used as a xenobiotic model, has emerged as an alternative approach, since it induces both oxidative and nitrosative stress, thereby mimicking more complex and physiologically relevant conditions of neuronal damage [10,11,12]. As an exogenous xenobiotic, SNP enables controlled induction of nitrosative stress, allowing the systematic evaluation of toxicodynamic responses across different biological systems. In the classic PC12 model, high concentrations of SNP (e.g., 400 μM) trigger apoptotic cascades through activation of stress kinases, p53 stabilization, caspase activation, Bcl-2 down-regulation, and increased ROS, alongside DNA damage and impaired antioxidant defenses [13,14,15,16,17]. Beyond mechanistic insights, SNP-induced neurotoxicity in PC12 cells has also served as a platform to evaluate neuroprotective strategies. Pre-treatment with low, subtoxic SNP doses (~100 μM) can precondition PC12 cells and partially mitigate apoptosis induced by subsequent high-dose SNP, via attenuation of stress signaling and reduction of apoptotic markers [18]. Similarly, diverse protective agents, such as a huperzine A derivative (M3) [16], artemisinin (a well-known anti-malaria drug) [17], phytochemical compounds [19], 1,2,4-triazole derivatives [20] or selol (an organic selenite triglyceride) [21], have been reported to reduce SNP-induced ROS, enhance anti-apoptotic signaling, and increase cell survival in PC12 cultures.
To date, most in vitro studies employing SNP in neuronal models focus on protective pre-treatment paradigms, with only limited examples of co-treatment-based rescue strategies. For instance, selol co-administered with SNP attenuates ROS generation and apoptosis in neuronal cell lines, supporting translational relevance for therapeutic intervention [21]. In contrast, true post-treatment approaches, where a therapeutic agent is applied after the SNP insult, remain largely unexplored. Nevertheless, reports with H2O2-based models suggest that such paradigms are feasible. The flavonoid didymin, for example, was administered after H2O2-induced injury, a process known as neurorescue, resulting in increased cell viability, reduced ROS, and modulation of key antioxidant and apoptotic markers in SH-SY5Y neuronal cells [22]. Conversely, post-treatment with curcumin in PC12 cells following H2O2 exposure was ineffective, highlighting the complexity of evaluating therapeutic versus protective interventions [23].
In this context, the present study aimed to establish and characterize short-term and long-term exposure models of SNP-induced oxidative and nitrosative stress, using this compound as a xenobiotic probe in neuronal systems. By integrating in vitro assays in mHippo-E18 and PC12 cells with in vivo analyses in zebrafish larvae, we sought to compare cellular susceptibility, redox imbalance, and behavioral outcomes under distinct paradigms of toxic exposure and recovery. Importantly, PC12 cells, derived from rat pheochromocytoma, represent a classical and widely used neuronal model, while mHippo-E18 cells originate from embryonic mouse hippocampus and provide a complementary system that more closely reflects hippocampal vulnerability implicated in memory-related neurodegenerative disorders. These combined approaches not only provide novel insights into cell type–specific responses to SNP but also generate a robust experimental framework to evaluate the efficacy of protective and therapeutic interventions. Ultimately, this work proposes a translationally relevant platform for the bioprospecting of candidate compounds against oxidative stress–related neurodegenerative processes.
2. Materials and Methods
2.1. Reagents
All chemicals used in this study were of analytical grade, with purity above 98%, and obtained from Gibco BRL (New York, USA), Sigma-Aldrich Corporation (St. Louis, MO, USA), or Synth (Diadema, SP, Brazil), or equivalent suppliers. Stock solutions were prepared using deionized water filtered through a 0.22 μm pore membrane and adjusted to a resistivity >18.2 MΩ (Millipore, Burlington, MA, USA). Culture media and supplements were purchased from Thermo Fisher Scientific (Waltham, MA, USA). Sodium nitroprusside [SNP; Sigma–Aldrich (St. Louis, MO, USA)] was freshly prepared in sterile water immediately before use to prevent light-induced degradation.
2.2. Cell Lines and Maintenance
Two neuronal cell lines were employed: mouse embryonic hippocampal mHippoE-18 cells (CLU199, CELLutions Biosystems, Toronto, ON, Canada) and rat pheochromocytoma PC12 cells (CRL-1721™, ATCC, Manassas, VA, USA). The mHippoE-18 cells were cultured in high-glucose Dulbecco’s Modified Eagle Medium (DMEM; DH10) supplemented with 10% fetal bovine serum (FBS), penicillin (100 U·mL−1), streptomycin (100 μg·mL−1), and amphotericin B (25 μg·mL−1). PC12 cells were maintained in low-glucose DMEM (D10) under the same supplementation conditions. All media were prepared with heat-inactivated FBS (56 °C, 30 min). Cells were kept at 37 °C in a humidified incubator with 5% CO2 and 95% air (Forma™ Series 3 Water Jacketed CO2 Incubator; Thermo Scientific Inc., MA, USA). The medium was replaced every 2–3 days, and cells were passaged at ~80% confluence using 0.05% trypsin-EDTA for PC12 or Versene solution (140 mmol·L−1 NaCl, 2.7 mmol·L−1 KCl, 10 mmol·L−1 Na2HPO4, 1.8 mmol·L−1 KH2PO4, and 0.5 mmol·L−1 EDTA) for mHippoE-18 cells.
2.2. SNP-Induced Oxidative Stress Effects In Vitro
The effects of SNP-induced oxidative stress were evaluated in both cell types. The mHippoE-18 and PC12 cells (2.5 × 10³ and 5 × 10³ in 100 μL per well, respectively) were seeded in 96-well plates (Nest Biotechnology, Rahway, NJ, USA) and incubated for 24 h. Subsequently, cells were subjected to short-term and long-term exposure models.
2.2.1. Experimental Design In Vivo
To investigate the cytotoxic effects of SNP, two experimental protocols were performed (Figure 1). In the short-term exposure, cells were treated with SNP diluted in DH10 or D10 medium (0.1, 0.5, and 1 mmol·L−1) for 2 h. Following exposure, the medium was replaced with fresh, SNP-free medium, and cells were incubated for an additional 22 h at 37 °C with 5% CO2. In the long-term exposure, cells were pre-incubated in DH10 or D10 medium alone for 4 h, after which the medium was replaced with fresh medium containing SNP (0.1, 0.5, and 1 mmol·L−1) and maintained for 20 h at 37 °C with 5% CO2. Untreated cells were included as the control group in both models. After treatments, oxidative stress induced by SNP was assessed by crystal violet staining for cell viability [24], lactate dehydrogenase (LDH) release as a marker of membrane integrity [25], and 2′,7′-dichlorodihydrofluorescein diacetate (H2DCF-DA; Sigma–Aldrich, St. Louis, MO, USA) staining for ROS production [26].
2.2.2. Cell Viability by Crystal Violet Staining and LDH Release Assays
After treatments, the medium was collected, and cells were stained with crystal violet solution (0.5% w·v−1). Absorbance was measured at 570 nm using a BioTek Epoch microplate spectrophotometer (BioTek Epoch, CA, USA), according to literature [24]. LDH activity was quantified using a kinetic UV method based on pyruvate/NADH, following the manufacturer’s instructions (Katal Biotecnológica, Belo Horizonte, Brazil). Briefly, samples (20 μL) were incubated with the working reagent containing Tris buffer (100 mmol·L−1, pH 7.5), sodium pyruvate (0.6 mmol·L−1), and NADH (0.25 mmol·L−1). The decrease in absorbance at 340 nm was monitored at 37 °C, and LDH activity was expressed in units per liter (U·L−1). Data were presented as box-and-whisker plots of three independent experiments performed in sextuplicate.
2.2.3. ROS Assay
Culture medium from the experimental groups (50 μL) was transferred into a 96-well black plate (SPL Life Sciences, Pocheon-si, Republic of Korea), followed by the addition of 145 μL of PBS and 5 μL of H2DCF-DA at 1 mmol·L−1 (Sigma–Aldrich®, St. Louis, MO, USA). Plates were incubated at 37 °C for 1.5 h in the dark. Fluorescence was then measured using a microplate reader (BioTek Synergy HT Multi-Mode Microplate Reader, Santa Clara, CA, USA) at excitation/emission wavelengths of 480/530 nm. Results were expressed as percentages relative to the control group and displayed as box-and-whisker plots of three independent experiments performed in sextuplicate.
2.3. SNP-Induced Oxidative Stress Effects In Vivo
2.3.1. Zebrafish Maintenance, Husbandry, and Egg Collection
Adult wild-type (WT) zebrafish were maintained in the zebrafish bioterium of the Experimental Morphology Laboratory, Federal University of ABC (UFABC), under controlled conditions: 28 °C water temperature and a 14/10 h light/dark photoperiod. Fish were housed in glass aquaria filled with distilled water supplemented with sodium chloride (60 μg·mL−1; pH 7.0). Animal husbandry complied with the European Directive 2010/63/EU [27] and the Brazilian National Council for Animal Experimentation Control (CONCEA) guidelines [28]. Animals were fed twice daily with commercial dry food and supplemented with Artemia nauplii on the day prior to mating. Males and females were maintained in equal numbers. For embryo collection, a spawning apparatus was introduced into the tank the evening before breeding. Fertilized eggs were transferred to E3 medium (5 mmol·L−1 NaCl, 0.17 mmol·L−1 KCl, 0.33 mmol·L−1 CaCl2, 0.33 mmol·L−1 MgSO4) and incubated at 28 °C until the experiments. Embryos were collected at 0 h post-fertilization (hpf) and maintained under standard conditions until 96 hpf.
2.3.2. Experimental Design In Vivo
Zebrafish larvae (96 hpf) displaying normal morphology and spontaneous swimming were selected and distributed individually into 96-well plates (Nest Biotechnology, Rahway, NJ, USA), with 10 larvae assigned to each experimental group. In the short-term exposure, larvae were exposed for 2 h to SNP at concentrations of 0.1, 0.5, 1, or 2 mmol·L−1 prepared in E3 medium (final volume 0.1 mL per well). After this initial treatment, the solutions were replaced with fresh E3 medium, and the larvae were maintained for an additional 22 h at 28 °C. In the long-term exposure, larvae were first pre-incubated in E3 medium for 4 h and subsequently exposed to SNP at the same concentrations for 20 h (final volume 0.1 mL per well). Control groups, consisting of untreated larvae, were incubated under identical conditions in parallel with both treatment protocols.
2.3.3. Metabolic Activity
Solutions containing the larvae from the previously mentioned experimental groups were supplemented with 80 μmol⋅L−1 of resazurin [29]. After 24 h (5 dpf), metabolic conversion of resazurin to resorufin was quantified by measuring fluorescence (excitation: 530 nm; emission: 590 nm) using a microplate reader (BioTek, Winooski, VT, USA). Results were expressed as percentages relative to control values and presented in box-and-whisker plots of three independent experiments.
2.3.4. ROS Quantification
Larvae from each experimental group were rinsed with fresh E3 medium and subsequently exposed to 1 mmol·L−1 H2DCF-DA (Sigma–Aldrich®, St. Louis, MO, USA) in a final volume of 0.1 mL per well. Plates were incubated at 28 °C for 2 h in the dark. After incubation, fluorescence intensity was measured with a multimode microplate reader (BioTek Synergy HT, Santa Clara, CA, USA) using excitation and emission wavelengths of 480 and 530 nm, respectively. Results were normalized to the control group and expressed as percentages, represented graphically as box-and-whisker plots of three independent experiments.
2.3.5. Behavior Analysis
Larval locomotor behavior was evaluated at 120 hpf to assess swimming activity, as previously described [30]. reated and control larvae (n = 6 per group) were individually placed in 96-well plates containing 100 μL of E3 medium per well. After a 15-min acclimatization period, video recordings were acquired using a custom-built tracking setup. Each larva was monitored for 120 s, and locomotor parameters were analyzed using ImageJ2 and Fiji software [31,32]. Total distance traveled was defined as the cumulative displacement during the recording period, whereas mean swimming speed was calculated by dividing the total distance by the acquisition time.
2.4. Statistical Analyses
Data were analyzed using one-way analysis of variance (ANOVA) to assess differences among experimental groups. When appropriate, Tukey’s multiple comparison test was applied for comparisons across groups, and Dunnett’s test was used when experimental groups were compared with a single control. For behavioral parameters in zebrafish, repeated-measures ANOVA was employed, followed by Tukey’s post hoc test. Student’s t-test was used for specific pairwise comparisons. Spearman’s correlation coefficient (ρ, range –1 to +1) was calculated to investigate the associations among oxidative stress, metabolic activity, membrane integrity, and locomotor parameters. Correlation heatmaps were generated to visualize pairwise correlations, and linear regression was applied when necessary to further explore the predictive contribution of selected variables. All statistical analyses were performed using GraphPad Prism software, version 8.0 (GraphPad Software, La Jolla, CA, USA) and JASP software, version 0.16.2 (JASP Team, Amsterdam, The Netherlands). Statistical significance was defined as p < 0.05.
3. Results
Figure 1 illustrates the experimental designs used to evaluate the toxic effects of SNP in both the short-term and long-term exposure models, applied to two neuronal cell types (mHippoE-18 and PC12) and to zebrafish larvae. In the short-term exposure, cells or larvae were exposed to SNP for 2 h, followed by replacement with fresh medium or drug-free water and maintained for an additional 22 h before analysis. In the long-term exposure, cells or larvae were pre-incubated in culture medium or water for 4 h before SNP exposure, which was then maintained for the subsequent 20 h. Control groups (C) underwent identical handling but without SNP exposure. The timeline schemes show the treatment sequence and duration for each model, highlighting the initial treatment phase and the post-treatment or pre-treatment intervals.
3.1. SNP-Induced Toxicity in the Short-Term Exposure on mHippoE-18 and PC12 Cells
Exposure of mHippoE-18 cells to SNP resulted in a concentration-dependent decrease in cell viability (Figure 2A), and significant reductions compared to the control group were observed at 0.5 and 1 mmol·L−1 SNP (Figure 2A). LDH release was increased with with increasing SNP concentrations (Figure 2B). ROS production was significantly elevated at 0.1 and 1 mmol·L−1 SNP compared to control (Figure 2C). In PC12 cells, SNP exposure did not alter CV at 0.1 mmol·L−1; however, a marked and significant decrease was detected at 0.5 and 1 mmol·L−1 (Figure 2D). LDH release remained unchanged at 0.1 and 0.5 mmol·L−1, but was significantly higher at 1 mmol·L−1 SNP compared to control (Figure 2E). ROS generation increased in a concentration-dependent manner, with significant elevations observed at 0.5 and 1 mmol·L−1 (Figure 2F).
Spearman’s correlation analysis revealed dose-dependent and cell-type-specific association patterns between integrity, LDH release, and ROS (Figure 2G). At 1 mmol·L−1 SNP, both cell types showed strong negative correlations between integrity and LDH (ρ ≈ –0.75, p < 0.01), consistent with membrane damage as a major determinant of reduced viability. However, ROS did not correlate significantly with either integrity or LDH at this concentration, suggesting that cytotoxicity was primarily associated with membrane disruption rather than oxidative stress. At 0.5 mmol·L−1 SNP, mHippo-E18 cells displayed stronger coupling, with significant negative correlations between integrity and LDH (ρ = –0.77, **p < 0.01) and between integrity and ROS (ρ = –0.81, **p < 0.01), as well as a positive correlation between LDH and ROS (ρ = 0.66, *p < 0.05). In contrast, PC12 cells showed a moderate positive correlation between LDH and ROS (ρ = 0.59, *p < 0.05), while integrity had only non-significant negative associations with LDH and ROS. At 0.1 mmol·L−1 SNP, correlations were generally weaker. In mHippo-E18 cells, ROS correlated positively with LDH (ρ = 0.65, *p < 0.05), whereas integrity showed no significant associations. In PC12 cells, LDH correlated positively with ROS (ρ = 0.73, p < 0.01), while integrity showed no significant associations.
3.2. SNP-Induced Toxicity in the Long-Term Exposure on mHippoE-18 and PC12 Cells
In mHippo-E18 cells, SNP exposure caused a concentration-dependent reduction in cell viability, with significant decreases observed at 0.5 and 1 mmol·L−1 compared to control (Figure 3A). LDH release increased progressively with concentration, reaching significance at 1 mmol·L−1 (Figure 3B). ROS production was markedly elevated at all tested concentrations, with significant increases already detected at 0.1 mmol·L−1 (Figure 3C). In PC12 cells, viability was significantly reduced at all concentrations tested (Figure 3D), remaining consistently below control values. LDH release was significantly elevated only at 0.5 and 1 mmol·L−1 SNP, whereas 0.1 mmol·L−1 yielded values similar to control (Figure 3E). ROS generation was significantly increased at all concentrations, with high levels maintained across the full range (Figure 3F).
Spearman’s correlation analysis revealed dose-dependent and cell-type-specific associations among integrity, LDH, and ROS (Figure 5D). At 1 mmol·L−1 SNP, mHippo-E18 cells showed strong negative correlations between integrity and both LDH (ρ = –0.80, *p < 0.01) and ROS (ρ = –0.81, *p < 0.01), while LDH correlated positively with ROS (ρ = 0.91, ***p < 0.001). In contrast, PC12 cells exhibited a negative correlation between integrity and LDH (ρ = –0.72, *p < 0.05) and a positive correlation between LDH and ROS (ρ = 0.64, *p < 0.05), whereas integrity and ROS were not significantly related (ρ = –0.56, n.s.). At 0.5 mmol·L−1 SNP, mHippo-E18 cells displayed a significant negative correlation between integrity and ROS (ρ = –0.71, *p < 0.05), while integrity and LDH (ρ = –0.46, n.s.) and LDH and ROS (ρ = 0.33, n.s.) were not significant. By contrast, PC12 cells showed no significant correlations among any parameters (integrity vs. LDH: ρ = –0.50, n.s.; integrity vs. ROS: ρ = 0.33, n.s.; LDH vs. ROS: ρ = –0.14, n.s.). At 0.1 mmol·L−1 SNP, neither mHippo-E18 nor PC12 cells showed significant correlations.
3.3. SNP-Induced Toxicity in the Short-Term Exposure on Zebrafish Larvae
In the short-term exposure (Figure 4), zebrafish larvae exposed to SNP exhibited a dose-dependent decline in metabolic activity, measured by resorufin fluorescence. Significant reductions were detected from 0.1 mmol·L−1 onward, with the strongest suppression observed at 1 and 2 mmol·L−1 compared to both control and the 0.1 mmol·L−1 group (p = 0.005 and p = 0.007, respectively). ROS levels remained largely stable across concentrations, with no consistent significant differences, suggesting limited contribution of oxidative imbalance under these conditions.
SNP exposure also led to pronounced behavioral impairments compared to control larvae (Figure 4C). The total distance traveled was significantly reduced in the 0.1 mmol·L−1 group, while 1 and 2 mmol·L−1 groups showed lower values that did not reach significance. Swimming velocity followed a similar pattern, with a significant reduction at 0.1 mmol·L−1 and intermediate values at higher concentrations that were not statistically different from control. Freezing behavior was significantly increased at 0.1 mmol·L−1, whereas groups treated with 1 and 2 mmol·L−1 showed a non-significant tendency toward longer immobility. In contrast, the percentage of active time was markedly decreased at 1 and 2 mmol·L−1, accompanied by increased inactive time, suggesting impaired swimming ability at higher SNP concentrations.
Representative swimming trajectories confirmed these behavioral effects. Control larvae displayed longer and more exploratory movements, whereas SNP-treated groups exhibited shorter paths with reduced complexity. These differences were most evident at 0.1 mmol·L−1, where freezing behavior predominated. Cumulative distance plots over 120 s further demonstrated a progressive reduction in swimming activity across concentrations, with control larvae steadily increasing distance moved over time, while SNP-treated larvae showed flattened slopes, culminating in the lowest cumulative distance at 2 mmol·L−1.
Spearman’s rank correlation analysis revealed that associations among metabolism, ROS, and motility were generally weak and inconsistent across concentrations (Figure 4D). At 2 mmol·L−1, metabolism correlated positively with ROS (ρ = 0.67, *p < 0.05), but the association with motility was modest (ρ ≈ 0.53, n.s.). At 1 mmol·L−1, no significant correlations were detected among endpoints, indicating a lack of alignment between metabolic impairment, oxidative stress, and behavior. At 0.1 mmol·L−1, metabolism correlated strongly with motility (ρ = 0.80, **p < 0.01), while no meaningful association was observed with ROS (ρ ≈ 0.12). Across concentrations, metabolism displayed very strong positive correlations (ρ = 0.87–0.99, ***p < 0.001), confirming a consistent dose-dependent effect of SNP. However, the absence of robust within-dose associations suggests that metabolic disruption occurred largely independently of ROS levels and behavioral outcomes in this paradigm.
3.4. SNP-Induced Toxicity in the Long-Term Exposure
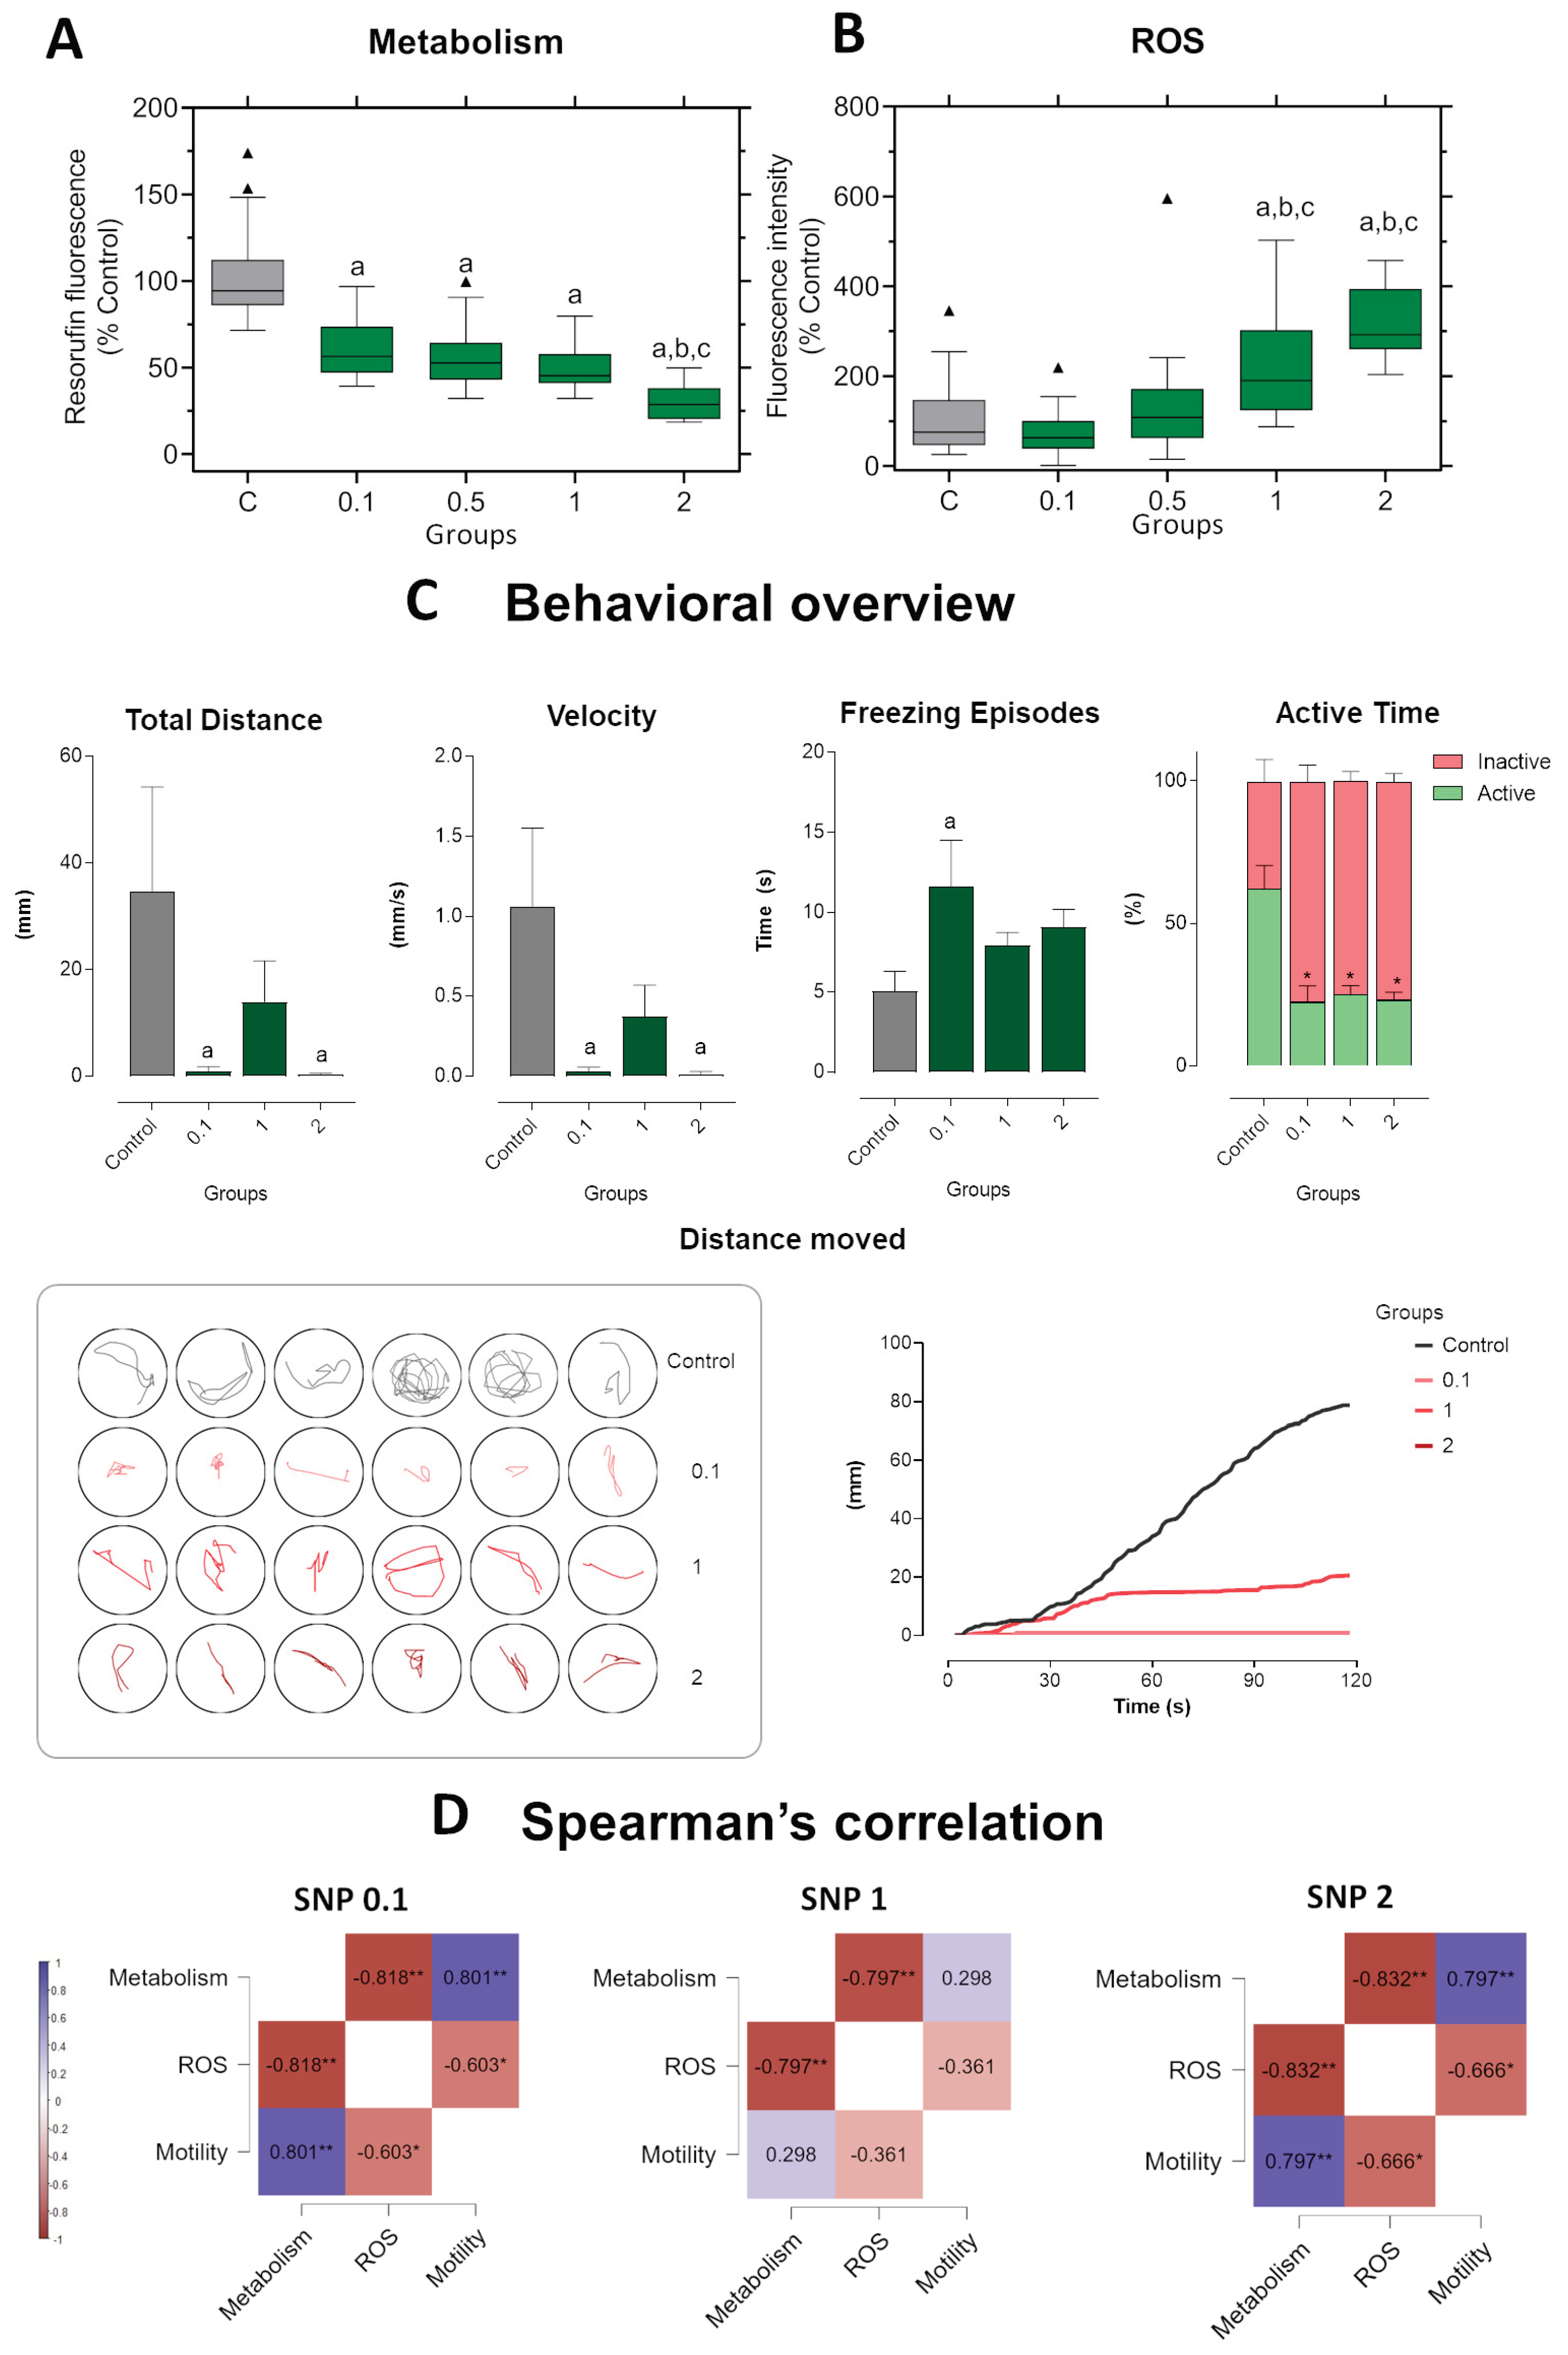
In the long-term exposure (Figure 5), zebrafish larvae pre-incubated in medium before SNP treatment showed a clear dose-dependent suppression of metabolic activity. Reductions were evident from 0.1 mmol·L−1, with the strongest decrease at 2 mmol·L−1 (p = 0.001), which also differed significantly from the 0.1 (p < 0.0001) and 0.5 mmol·L−1 groups (Figure 5A). ROS production was more prominently elevated than in the short-term exposure, with significant increases at 1 and 2 mmol·L−1 compared to control (p = 0.002 and p < 0.0001, respectively), as well as to 0.1 and 0.5 mmol·L−1 groups (all p < 0.01; Figure 5B).
SNP exposure consistently impaired locomotor activity across all tested concentrations (Figure 5C). The total distance traveled was significantly reduced at 0.1, 1, and 2 mmol·L−1, with larvae showing very limited displacement throughout the assay. Swimming velocity followed the same pattern, being markedly reduced at all doses, with significant differences from control already apparent at 0.1 mmol·L−1. Freezing behavior was significantly increased at 0.1 mmol·L−1, whereas larvae exposed to 1 and 2 mmol·L−1 also showed longer immobility times, although these changes did not reach significance. Active time was strongly decreased across concentrations, accompanied by corresponding increases in inactive time, indicating severe locomotor suppression. Representative swimming trajectories confirmed these effects: control larvae exhibited exploratory, complex paths, while SNP-treated larvae showed minimal, restricted movements, especially at 1 and 2 mmol·L−1. Cumulative distance curves further emphasized this pattern, with control larvae steadily increasing distance moved over 120 s, while treated groups displayed flat slopes, culminating in near-complete inactivity at 2 mmol·L−1.
Spearman’s rank correlation analysis revealed robust and monotonic associations among metabolism, ROS, and motility across SNP concentrations (Figure 5D). At higher concentrations (1 and 2 mmol·L−1), metabolism correlated negatively with ROS (ρ = –0.69 to –0.84, **p < 0.01 to ***p < 0.001), indicating that increasing oxidative stress was consistently associated with impaired energy metabolism. Across all concentrations, metabolism correlated positively with motility (ρ = 0.76–0.90, **p < 0.01 to ***p < 0.001), suggesting that locomotor behavior strongly depends on energy availability. ROS also correlated negatively with motility at subtoxic and intermediate doses (ρ = –0.60 to –0.73, **p < 0.01), reinforcing the link between oxidative imbalance and behavioral impairment. Cross-concentration analyses further confirmed these patterns, with metabolism showing very strong positive associations across doses (ρ > 0.90, ***p < 0.001), ROS displaying progressive dose-related increases (ρ ≈ 0.65–0.82, **p < 0.01), and motility measures correlating consistently at lower and intermediate concentrations but flattening at 2 mmol·L−1, likely due to a floor effect in locomotor activity.
4. Discussion
In this study, SNP was used as a xenobiotic nitric oxide donor to induce controlled oxidative and nitrosative stress across cellular and organismal systems, enabling a comparative assessment of toxicodynamic responses under short-term and long-term exposure paradigms. Together, the findings show that SNP elicits concentration and time dependent cytotoxicity that is detectable at the levels of metabolic activity, membrane integrity, reactive oxygen species (ROS) production, and behavior, and that the magnitude and pattern of these effects depend on cell type, exposure paradigm, and biological level of organization. These results support the view that oxidative and nitrosative stress act as early, interconnected drivers of neurodegenerative cascades rather than mere byproducts of neuronal loss, and that integrated cellular plus zebrafish models provide a relevant experimental platform for neurodegenerative drug discovery. Recent work has reinforced that excess ROS and RNS contribute to mitochondrial dysfunction, protein oxidation, lipid peroxidation, and DNA damage in several neurodegenerative conditions, including Alzheimer’s disease, Parkinson’s disease, amyotrophic lateral sclerosis, and related disorders [33].
SNP is widely used as an experimental nitric oxide donor, but its effects reflect a complex interplay between nitric oxide release, peroxynitrite formation, mitochondrial dysfunction, and potential cyanide contribution. Nitric oxide can reversibly inhibit cytochrome c oxidase, modulate mitochondrial membrane potential, and shift the balance between survival and cell death pathways depending on local concentration and redox context [34]. In the present work, both mHippoE-18 and PC12 cells showed concentration and time dependent reductions in metabolic activity and increases in LDH release when exposed to SNP in the short-term exposure, consistent with mitochondrial compromise and loss of membrane integrity. The stronger susceptibility of PC12 cells relative to mHippoE-18 cells is in line with previous evidence that chronic catecholaminergic or neuron-like lines often display pronounced vulnerability to nitrosative and oxidative stressors, and suggests cell type specific differences in antioxidant capacity, mitochondrial reserve, or nitric oxide signaling.
Previous studies have demonstrated that SNP can trigger both apoptotic and non-apoptotic death in PC12 cells, with contributions from ROS generation, lipid peroxidation, and perturbation of survival signaling pathways. In primary cortical neurons and differentiated PC12 cells, SNP evokes robust LDH release and morphological alterations that are compatible with necrotic or late apoptotic damage, with the pattern of cell death depending on both the nitric oxide donor and the cellular phenotype [35]. In PC12 cells, SNP has also been reported to induce cell death through mechanisms involving cyclooxygenases and lipoxygenases, with limited participation of classical caspase 3 dependent pathways, highlighting an important role for alternative execution routes under nitrosative stress. In contrast, pharmacological interventions that enhance antioxidant defenses or induce stress response proteins can attenuate SNP toxicity in PC12 cells. For example, a huperzine A derivative (M3) protects PC12 cells from SNP induced apoptosis by decreasing ROS and malondialdehyde levels and upregulating Hsp70, suggesting that reinforcement of redox buffering and chaperone systems can counteract nitric oxide mediated injury [36,37]. The current findings that metabolic activity and LDH release are tightly correlated with SNP concentration in both cell lines, and that ROS levels show dose and time dependent increases, are coherent with this literature and support the view that the in vitro models used here capture relevant components of nitric oxide induced neuronal damage.
The comparison between the short-term and long-term exposure paradigms provides additional insight into how the timing of exposure shapes the toxic response. In the short-term exposure, cells are challenged with SNP after attachment and adaptation, which may better mimic an acute insult to a relatively stable network. In the long-term exposure, pre-exposure to SNP occurs before or during early cell adaptation, which could theoretically induce a preconditioning like response, but in practice still results in reduced metabolic activity and increased LDH release at higher concentrations. The observation that Spearman correlations between metabolic activity, LDH, and ROS remain strong in both paradigms suggests that, despite differences in exposure sequence, SNP primarily disrupts cell viability through convergent oxidative and nitrosative pathways. However, subtle differences in correlation patterns between mHippoE-18 and PC12 cells indicate that the thresholds for ROS accumulation and loss of viability are not identical and should be considered when choosing cell systems for neuroprotective screening.
At the in vivo level, zebrafish larvae offer a complementary perspective by integrating systemic physiology, intact neural circuits, and behavior. Larval zebrafish possess a functional blood brain barrier, conserved neurotransmitter systems, and orthologs of many human genes associated with neurological disorders, which makes them suitable for modeling central nervous system pathophysiology and for screening neuroactive compounds [38,39,40,41]. From a toxicological perspective, the use of SNP as a xenobiotic probe allowed direct comparison of sensitivity thresholds and functional outcomes across in vitro neuronal models and an intact vertebrate organism. The present data show that in the short-term exposure zebrafish paradigm, SNP produced modest reductions in metabolic activity at the highest concentrations, limited changes in whole larval ROS, but clear and concentration dependent impairments in locomotor behavior. Total distance traveled, swimming trajectories, and activity profiles all declined with increasing SNP, indicating that functional motor outcomes are more sensitive readouts than bulk metabolic or ROS measures under these conditions. This pattern suggests that SNP perturbs neuronal function and network dynamics at concentrations where global redox readouts in whole larvae remain near baseline, possibly because localized oxidative and nitrosative stress in specific neuronal populations is diluted in whole organism measurements.
In the long-term exposure zebrafish paradigm, pre-incubation with SNP amplified both metabolic suppression and ROS production, and accentuated locomotor deficits, culminating in near complete inactivity at the highest concentration. The more prominent ROS increase relative to the short-term exposure condition indicates that exposure sequence modifies how larvae handle nitrosative stress, and may reflect an exhaustion of compensatory antioxidant responses or altered pharmacokinetics during longer exposure. The robust monotonic correlations observed between SNP concentration, ROS, and locomotor parameters in this model support the idea that integrated behavioral and biochemical endpoints can reveal dose dependent neurotoxic effects and floor effects at extreme concentrations. These features are valuable for establishing concentration ranges that are suitable for subsequent screening of candidate neuroprotective compounds, where partial but significant rescue of behavior and redox balance can be quantified.
The behavioral phenotypes observed here are consistent with recent zebrafish work showing that locomotor readouts are highly sensitive to early neurodegenerative processes and can be combined with molecular profiling to dissect underlying mechanisms. For example, zebrafish larvae exposed to the mitochondrial complex I inhibitor MPP+ display pronounced hypokinesia, loss of light evoked responses, and broad proteomic alterations in pathways related to mitochondrial metabolism, redox regulation, proteostasis, and synaptic organization, effectively modeling early Parkinsonian-like dysfunction [30]. The current study extends this concept to a nitric oxide donor, showing that SNP can also generate robust locomotor and metabolic phenotypes in zebrafish larvae, with patterns that resemble early stage neurotoxic stress rather than advanced structural degeneration. This reinforces the suitability of zebrafish larvae as an in vivo platform for probing early events that are likely to be more amenable to therapeutic modulation.
Mechanistically, the combined cellular and zebrafish results support a model in which nitric oxide released from SNP interferes with mitochondrial respiration, enhances ROS generation, and perturbs redox sensitive signaling pathways, leading to metabolic exhaustion, membrane damage, and behavioral dysfunction. At low to moderate SNP concentrations, cells and larvae may activate compensatory responses, including antioxidant enzyme upregulation, stress protein induction, and transient metabolic adjustments, which can preserve viability despite rising nitrosative pressure. At higher concentrations, these defenses are overwhelmed, resulting in significant loss of metabolic activity, increased LDH release, elevated ROS and, in zebrafish, severe locomotor impairment. The observation that PC12 cells and zebrafish larvae exhibit particularly pronounced functional deficits suggests that systems with high energy demand and complex network activity are especially vulnerable to sustained nitric oxide driven oxidative stress.
From the standpoint of neurodegenerative drug discovery, the use of short-term and long-term exposure paradigms across cellular and zebrafish models provides several advantages. First, it allows the distinction between compounds that mitigate damage when administered after the onset of stress, as modeled by short-term exposure, and those that prevent or attenuate injury when present before or during exposure, as captured by the long-term exposure paradigm. Second, it enables cross validation of candidate neuroprotective effects at multiple biological levels, where improved cell viability and reduced ROS in vitro can be aligned with preserved locomotor behavior in vivo. Third, the zebrafish platform facilitates high throughput phenotypic screening under conditions that recapitulate early neurodegenerative processes, where subtle functional improvements can be quantified with automated tracking systems. Finally, the shared reliance on a single nitric oxide donor across models simplifies interpretation of structure activity relationships for new molecules targeting redox imbalance, mitochondrial pathways, or nitric oxide signaling. By integrating neuronal cell lines and zebrafish larvae, the present work positions SNP as a versatile xenobiotic model for probing early redox-driven neurotoxicity and for supporting translational screening of compounds with neuroprotective or therapeutic potential.
Some limitations should be considered when interpreting these data. SNP releases not only nitric oxide but also cyanide and iron, and the relative contribution of each species to toxicity can vary with concentration, exposure time, and tissue context. Whole larval ROS measurements may underestimate localized oxidative and nitrosative stress in discrete neuronal populations, and complementary approaches such as region specific redox imaging or targeted biomarkers would refine mechanistic interpretations. In addition, the in vitro models used here do not fully capture the complexity of mature neural circuits, glial contributions, or neuroimmune interactions that modulate nitric oxide signaling in the mammalian brain. Despite these limitations, the convergence observed between cell based and zebrafish endpoints supports the translational relevance of the present approach.
5. Conclusions
The data indicate that SNP induces coherent patterns of oxidative and nitrosative stress across mHippoE-18 cells, PC12 cells, and zebrafish larvae in both short-term and long-term exposure paradigms. Within this framework, SNP is reinforced as a xenobiotic nitric oxide donor suitable for comparative neurotoxicity profiling across cellular and organismal models. Metabolic impairment, loss of membrane integrity, increased ROS, and locomotor deficits emerge in a dose and time dependent manner, with PC12 cells and zebrafish behavior showing particular sensitivity. These findings position the combined cellular plus zebrafish SNP models as a versatile framework for identifying and characterizing candidate compounds with neuroprotective or therapeutic potential that target early redox driven events in neurodegeneration and support their use in future studies integrating behavioral, biochemical, and omics level readouts.
Author Contributions
Conceptualization, C.A.-S. and M.S.C.; Methodology, A.L.A.M., B.R.S. and F.A.d.C.e.S. and L.R.B.; Formal analysis, A.L.A.M., B.R.S. and F.A.d.C.e.S; Investigation, A.L.A.M. and F.A.d.C.e.S.; Data curation, A.L.A.M., C.A.-S., B.R.S. and F.A.d.C.e.S. and L.R.B.; Writing—original draft preparation, C.A.-S. and M.S.C.; Writing—review and editing, C.A.-S. and M.S.C.; Visualization, A.L.A.M., C.A.-S., B.R.S. and F.A.d.C.e.S. and L.R.B., M.S.C.; Funding acquisition, C.A.-S. All authors have read and agreed to the published version of the manuscript.
Funding
This research was funded by the S.o Paulo Research Foundation (FAPESP, Grant No. 2023/03608-1, No. 2024/10831-1, and 2024/02247-8) and the Coordination for the Improvement of Higher Education Personnel (CAPES, Finance Code 001).
Institutional Review Board Statement
All animal procedures were conducted in accordance with ethical guidelines and approved by the Ethics Committee on the Use of Animals of the Federal University of ABC (CEUA/UFABC), under protocol number CEUA 4925270323, approved on 7 June 2023.
Informed Consent Statement
Not applicable.
Data Availability Statement
All data generated or analyzed during this study are included in this published article.
Acknowledgments
The authors thank Alexandre Alves de Sousa for his contributions as the attending veterinarian and for his technical support throughout the experimental procedures.
Conflicts of Interest
The authors declare no conflicts of interest.
Abbreviations
The following abbreviations are used in this manuscript:
| ANOVA | Analysis of Variance |
| ATCC | American Type Culture Collection |
| BBB | Blood–Brain Barrier |
| CEUA | Ethics Committee on the Use of Animals |
| CV | Crystal Violet |
| DMEM | Dulbecco’s Modified Eagle Medium |
| dpf | Days Post-Fertilization |
| E3 | Embryo Medium |
| EDTA | Ethylenediaminetetraacetic Acid |
| FBS | Fetal Bovine Serum |
| hpf | Hours Post-Fertilization |
| H2DCF-DA | 2′,7′-Dichlorodihydrofluorescein Diacetate |
| H2O2 | Hydrogen Peroxide |
| LDH | Lactate Dehydrogenase |
| MPP+ | 1-Methyl-4-Phenylpyridinium |
| NADH | Nicotinamide Adenine Dinucleotide (Reduced Form) |
| NO | Nitric Oxide |
| PC12 | Rat Pheochromocytoma Cell Line |
| PBS | Phosphate-Buffered Saline |
| ROS | Reactive Oxygen Species |
| RNS | Reactive Nitrogen Species |
| SEM | Standard Error of the Mean |
| SNP | Sodium Nitroprusside |
| WT | Wild-Type |
References
- Lin, M.T.; Beal, M.F. Mitochondrial Dysfunction and Oxidative Stress in Neurodegenerative Diseases. Nature 2006, 443, 787–795. [Google Scholar] [CrossRef]
- Gandhi, S.; Abramov, A.Y. Mechanism of Oxidative Stress in Neurodegeneration. Oxid Med Cell Longev 2012. [Google Scholar] [CrossRef] [PubMed]
- Wang, X.; Michaelis, E.K. Selective Neuronal Vulnerability to Oxidative Stress in the Brain. Front Aging Neurosci 2010, 2. [Google Scholar] [CrossRef] [PubMed]
- Slanzi, A.; Iannoto, G.; Rossi, B.; Zenaro, E.; Constantin, G. In Vitro Models of Neurodegenerative Diseases. Front Cell Dev Biol 2020, 8. [Google Scholar] [CrossRef] [PubMed]
- Rosa, J.G.S.; Lima, C.; Lopes-Ferreira, M. Zebrafish Larvae Behavior Models as a Tool for Drug Screenings and Pre-Clinical Trials: A Review. Int J Mol Sci 2022, 23. [Google Scholar] [CrossRef]
- Di Xia, Z.; Ma, R.X.; Wen, J.F.; Zhai, Y.F.; Wang, Y.Q.; Wang, F.Y.; Liu, D.; Zhao, X.L.; Sun, B.; Jia, P.; et al. Pathogenesis, Animal Models, and Drug Discovery of Alzheimer’s Disease. Journal of Alzheimer’s Disease 2023, 94, 1265–1301. [Google Scholar] [CrossRef]
- Sanfeliu, C.; Bartra, C.; Suñol, C.; Rodríguez-Farré, E. New Insights in Animal Models of Neurotoxicity-Induced Neurodegeneration. Front Neurosci 2023, 17, 1248727. [Google Scholar] [CrossRef]
- Tello, J.A.; Williams, H.E.; Eppler, R.M.; Steinhilb, M.L.; Khanna, M. Animal Models of Neurodegenerative Disease: Recent Advances in Fly Highlight Innovative Approaches to Drug Discovery. Front Mol Neurosci 2022, 15. [Google Scholar] [CrossRef]
- Pickering, A.M.; Vojtovich, L.; Tower, J.; Davies, K.J.A. Oxidative Stress Adaptation with Acute, Chronic, and Repeated Stress. Free Radic Biol Med 2013, 55, 109–118. [Google Scholar] [CrossRef]
- Orfanidou, M.A.; Lafioniatis, A.; Trevlopoulou, A.; Touzlatzi, N.; Pitsikas, N. Acute and Repeated Exposure with the Nitric Oxide (NO) Donor Sodium Nitroprusside (SNP) Differentially Modulate Responses in a Rat Model of Anxiety. Nitric Oxide 2017, 69, 56–60. [Google Scholar] [CrossRef]
- Wang, R.; Zhao, J.; Zhang, L.; Peng, L.; Zhang, X.; Zheng, W.; Chen, H. Genipin Derivatives Protect RGC-5 from Sodium Nitroprusside-Induced Nitrosative Stress. International Journal of Molecular Sciences 2016, 17, 117. [Google Scholar] [CrossRef]
- Izumi, Y.; Benz, A.M.; Clifford, D.B.; Zorumski, C.F. Neurotoxic Effects of Sodium Nitroprusside in Rat Hippocampal Slices. Exp Neurol 1993, 121, 14–23. [Google Scholar] [CrossRef]
- Su, T.; Pu, M.C.; Tang, D.K.; Long, J.C.; Yuan, F.Y.; Yin, A.P.; Wu, S.Q.; Yin, S.; Tang, G.H. New Benzofuran Neolignans with Neuroprotective Activity from Phyllanthodendron Breynioides. Nat Prod Res 2023, 37, 3798–3805. [Google Scholar] [CrossRef]
- Yuan, F.Y.; Tang, Z.Y.; Huang, D.; Li, W.; Wu, S.Q.; Huang, J.L.; Yan, X.L.; Fan, R.Z.; Tang, G.H.; Yin, S. Tigliane and Rhamnofolane Glycosides from Euphorbia Wallichii Prevent Oxidative Stress-Induced Neuronal Death in PC-12 Cells. Bioorg Chem 2022, 128. [Google Scholar] [CrossRef]
- Pandareesh, M.D.; Anand, T. Neuroprotective and Anti-Apoptotic Propensity of Bacopa Monniera Extract against Sodium Nitroprusside Induced Activation of INOS, Heat Shock Proteins and Apoptotic Markers in PC12 Cells. Neurochem Res 2014, 39, 800–814. [Google Scholar] [CrossRef]
- Ning, N.; Hu, J.F.; Yuan, Y.H.; Zhang, X.Y.; Dai, J.G.; Chen, N.H. Huperzine A Derivative M3 Protects PC12 Cells against Sodium Nitroprusside-Induced Apoptosis. Acta Pharmacol Sin 2012, 33, 34–40. [Google Scholar] [CrossRef]
- Zheng, W.; Chong, C.M.; Wang, H.; Zhou, X.; Zhang, L.; Wang, R.; Meng, Q.; Lazarovici, P.; Fang, J. Artemisinin Conferred ERK Mediated Neuroprotection to PC12 Cells and Cortical Neurons Exposed to Sodium Nitroprusside-Induced Oxidative Insult. Free Radic Biol Med 2016, 97, 158–167. [Google Scholar] [CrossRef]
- Varga, J.; Bátor, J.; Nádasdi, G.; Árvai, Z.; Schipp, R.; Szeberényi, J. Partial Protection of PC12 Cells from Cellular Stress by Low-Dose Sodium Nitroprusside Pre-Treatment. Cell Mol Neurobiol 2015, 36, 1161. [Google Scholar] [CrossRef]
- Lu, Q.R.; Wang, Y.; Tang, Z.Y.; Chen, Y.; Weng, H.Z.; Yin, S.; Tang, G.H. Chemical Constituents of Wikstroemia Alternifolia and Their Neuroprotective Activities. Nat Prod Res 2024, 38, 986–993. [Google Scholar] [CrossRef]
- Liao, L.; Jiang, C.; Chen, J.; Shi, J.; Li, X.; Wang, Y.; Wen, J.; Zhou, S.; Liang, J.; Lao, Y.; et al. Synthesis and Biological Evaluation of 1,2,4-Triazole Derivatives as Potential Neuroprotectant against Ischemic Brain Injury. Eur J Med Chem 2020, 190. [Google Scholar] [CrossRef]
- Dominiak, A.; Wilkaniec, A.; Wroczyński, P.; Jęśko, H.; Adamczyk, A. Protective Effects of Selol Against Sodium Nitroprusside-Induced Cell Death and Oxidative Stress in PC12 Cells. Neurochem Res 2016, 41, 3215–3226. [Google Scholar] [CrossRef]
- Morelli, S.; Piscioneri, A.; Salerno, S.; Al-Fageeh, M.B.; Drioli, E.; De Bartolo, L. Neuroprotective Effect of Didymin on Hydrogen Peroxide-Induced Injury in the Neuronal Membrane System. Cells Tissues Organs 2014, 199, 184–200. [Google Scholar] [CrossRef] [PubMed]
- Siddiqui, M.A.; Kashyap, M.P.; Kumar, V.; Tripathi, V.K.; Khanna, V.K.; Yadav, S.; Pant, A.B. Differential Protection of Pre-, Co- and Post-Treatment of Curcumin against Hydrogen Peroxide in PC12 Cells. Hum Exp Toxicol 2011, 30, 192–198. [Google Scholar] [CrossRef]
- Feoktistova, M.; Geserick, P.; Leverkus, M. Crystal Violet Assay for Determining Viability of Cultured Cells. Cold Spring Harb Protoc 2016, 2016, 343–346. [Google Scholar] [CrossRef] [PubMed]
- Riss, T.L.; Moravec, R.A. Cell Proliferation Assays: Improved Homogeneous Methods Used to Measure the Number of Cells in Culture. In Cell Biology: A Laboratory Handbook; 2006; pp. 25–31. [Google Scholar] [CrossRef]
- Silva, B.R.; Mendes, L.C.; Echeverry, M.B.; Juliano, M.A.; Beraldo-Neto, E.; Alberto-Silva, C. Peptide Fraction from Naja Mandalayensis Snake Venom Showed Neuroprotection Against Oxidative Stress in Hippocampal MHippoE-18 Cells but Not in Neuronal PC12 Cells. Antioxidants 2025, 14. [Google Scholar] [CrossRef] [PubMed]
- European Parliament and Council of the European Union Directive 2010/63/EU of the European Parliament and of the Council of 22 September 2010 on the Protection of Animals Used for Scientific Purposes. 2010; 33–79.
- Guia Brasileiro de Produção, Manutenção Ou Utilização de Animais Para Atividades de Ensino Ou Pesquisa Científica — Ministério Da Ciência, Tecnologia e Inovação. Available online: https://www.gov.br/mcti/pt-br/composicao/conselhos/concea/paginas/publicacoes-legislacao-e-guia/guia-brasileiro-de-producao-manutencao-ou-utilizacao-de-animais-para-atividades-de-ensino-ou-pesquisa-cientifica (accessed on 16 August 2025).
- da Cunha e Silva, F.A.; da Silva, B.R.; de Barros, L.R.; Beraldo-Neto, E.; Maleski, A.L.A.; Alberto-Silva, C. Snake Venom Peptide Fractions from Bothrops Jararaca and Daboia Siamensis Exhibit Differential Neuroprotective Effects in Oxidative Stress-Induced Zebrafish Models. Pharmaceuticals 2025, 18. [Google Scholar] [CrossRef]
- Maleski, A.L.A.; da Cunha e Silva, F.A.; Echeverry, M.B.; Alberto-Silva, C. Integrated Behavioral and Proteomic Characterization of MPP+-Induced Early Neurodegeneration and Parkinsonism in Zebrafish Larvae. Int J Mol Sci 2025, 26. [Google Scholar] [CrossRef]
- Schindelin, J.; Arganda-Carreras, I.; Frise, E.; Kaynig, V.; Longair, M.; Pietzsch, T.; Preibisch, S.; Rueden, C.; Saalfeld, S.; Schmid, B.; et al. Fiji: An Open-Source Platform for Biological-Image Analysis. Nat Methods 2012, 9, 676–682. [Google Scholar] [CrossRef]
- Rueden, C.T.; Schindelin, J.; Hiner, M.C.; DeZonia, B.E.; Walter, A.E.; Arena, E.T.; Eliceiri, K.W. ImageJ2: ImageJ for the next Generation of Scientific Image Data. BMC Bioinformatics 2017, 18. [Google Scholar] [CrossRef]
- Castelli, S.; Carinci, E.; Baldelli, S. Oxidative Stress in Neurodegenerative Disorders: A Key Driver in Impairing Skeletal Muscle Health. Int J Mol Sci 2025, 26. [Google Scholar] [CrossRef]
- Moncada, S.; Erusalimsky, J.D. Does Nitric Oxide Modulate Mitochondrial Energy Generation and Apoptosis? Nat Rev Mol Cell Biol 2002, 3, 214–220. [Google Scholar] [CrossRef] [PubMed]
- Reimann-Philipp, U.; Ovase, R.; Weigel, P.H.; Grammas, P. Mechanisms of Cell Death in Primary Cortical Neurons and PC12 Cells. J Neurosci Res 2001, 64, 654–660. [Google Scholar] [CrossRef] [PubMed]
- Muñoz, M.; Bermejo-Bescós, P.; Romero, C.; Benedí, J.; Martín-Aragón, S. SNP-Mediated Neuroprotection under Glucose Deprivation Is Enhanced by Hypericum Perforatum. CNS Neurol Disord Drug Targets 2012, 11, 162–173. [Google Scholar] [CrossRef] [PubMed]
- Ning, N.; Hu, J.F.; Yuan, Y.H.; Zhang, X.Y.; Dai, J.G.; Chen, N.H. Huperzine A Derivative M3 Protects PC12 Cells against Sodium Nitroprusside-Induced Apoptosis. Acta Pharmacol Sin 2012, 33, 34–40. [Google Scholar] [CrossRef]
- Pansera, L.; Mhalhel, K.; Cavallaro, M.; Aragona, M.; Laurà, R.; Levanti, M.; Guerrera, M.C.; Abbate, F.; Germanà, A.; Montalbano, G. Zebrafish as an Integrative Model for Central Nervous System Research: Current Advances and Translational Perspectives. Life (Basel) 2025, 15. [Google Scholar] [CrossRef]
- Habjan, E.; Schouten, G.K.; Speer, A.; Van Ulsen, P.; Bitter, W. Diving into Drug-Screening: Zebrafish Embryos as an in Vivo Platform for Antimicrobial Drug Discovery and Assessment. FEMS Microbiol Rev 2024, 48. [Google Scholar] [CrossRef]
- Wang, X.; Zhang, J.B.; He, K.J.; Wang, F.; Liu, C.F. Advances of Zebrafish in Neurodegenerative Disease: From Models to Drug Discovery. Front Pharmacol 2021, 12. [Google Scholar] [CrossRef]
- Razali, K.; Othman, N.; Mohd Nasir, M.H.; Doolaanea, A.A.; Kumar, J.; Ibrahim, W.N.; Mohamed Ibrahim, N.; Mohamed, W.M.Y. The Promise of the Zebrafish Model for Parkinson’s Disease: Today’s Science and Tomorrow’s Treatment. Front Genet 2021, 12. [Google Scholar] [CrossRef]
Figure 1.
Schematic representation of the experimental designs for the short-term and long-term exposure models using mHippoE-18 cells, PC12 cells, and zebrafish larvae. In the short-term exposure, cells or larvae were treated with SNP for 2 h, followed by replacement with SNP-free medium or water for an additional 22 h before endpoint measurements. In the long-term exposure, cells or larvae were pre-incubated in culture medium or water for 4 h, after which SNP was added and maintained for 20 h before analysis. Control groups (C) received identical handling but without SNP exposure. Representative micrographs of mHippoE-18 cells (100 X), PC12 cells (100 X), and zebrafish larvae (100 X) are shown on the left.
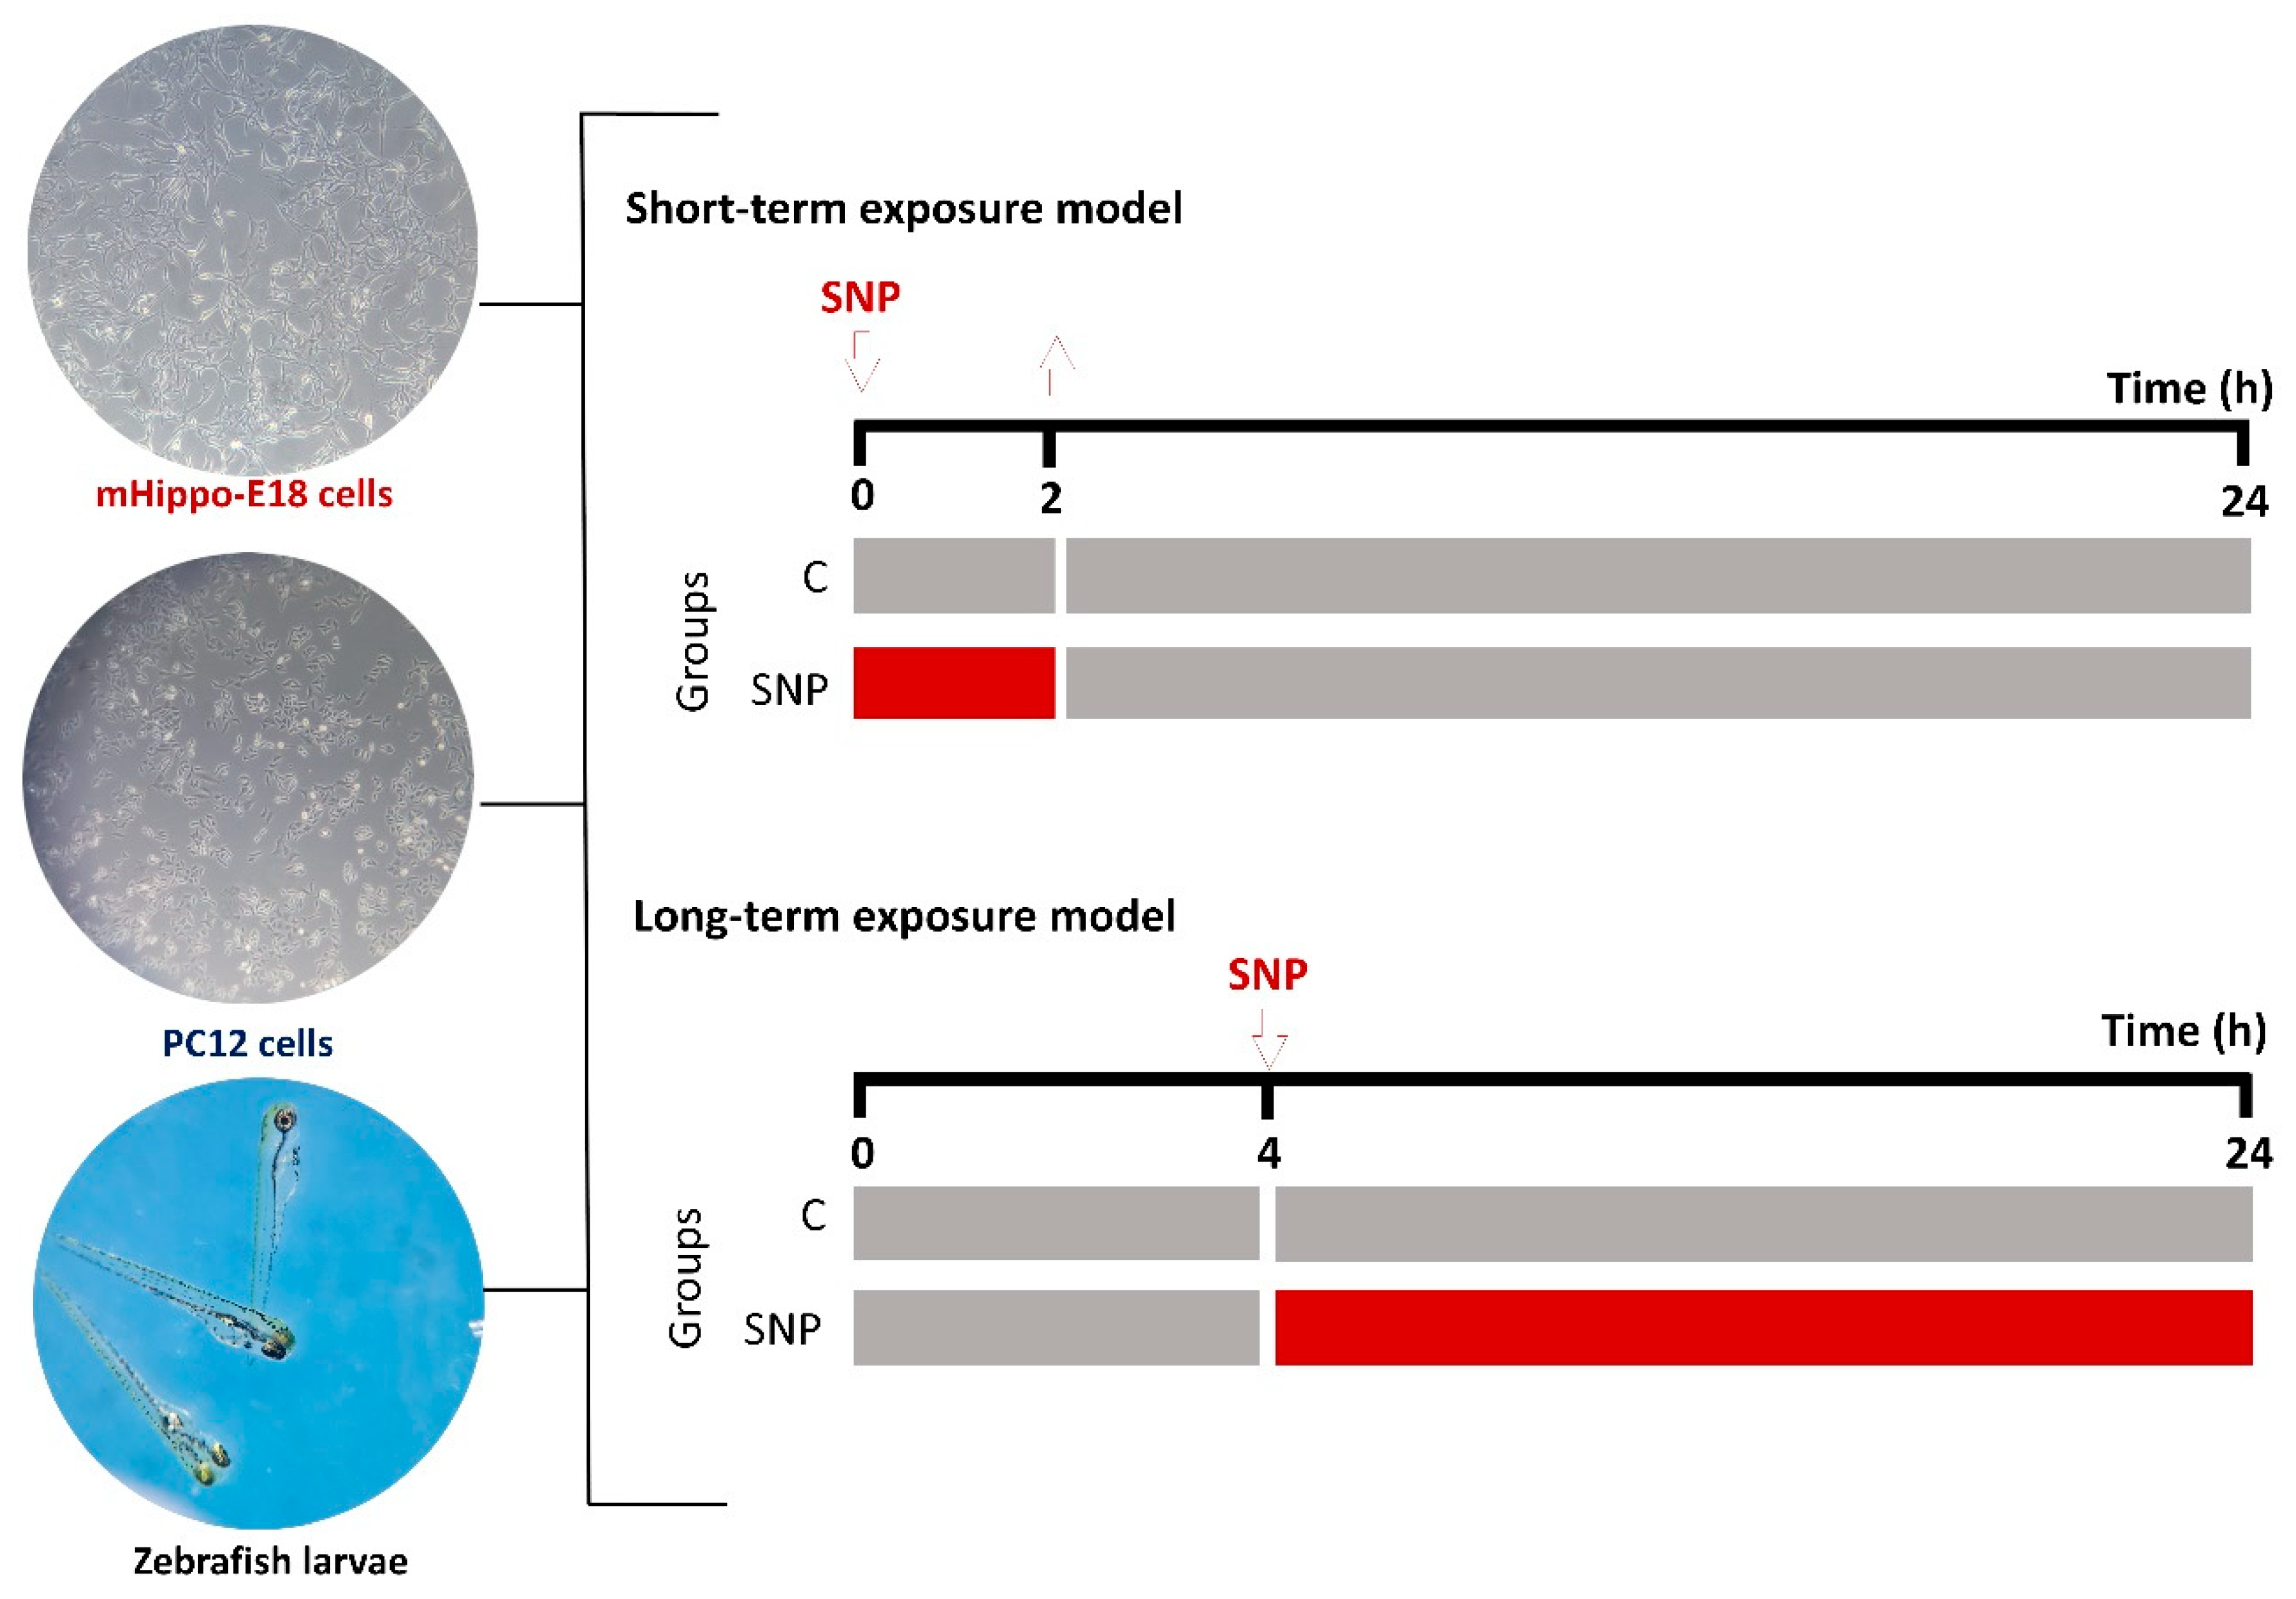
Figure 2.
Effects of sodium nitroprusside (SNP) in the short-term exposure on cell viability, membrane integrity, and ROS production in mHippoE-18 and PC12 cells. Cells were exposed to SNP (0.1, 0.5, or 1 mmol·L−1) for 2 h, followed by 22 h in fresh culture medium. (A, D). Cell viability was determined by crystal violet dye (CV) assay and expressed as absorbance at 570 nm. (B, E) Membrane integrity was assessed by LDH release (U·L−1). (C, F) ROS production was measured by H2DCF-DA fluorescence and expressed as percentage of control. Outlier values are represented by symbols (∙) and were retained in the graphical representation to illustrate data distribution. Data are shown as box-whisker plots (minimum–maximum, median). Statistical differences compared to the control are indicated by “a” (p < 0.05). (G) Spearman correlation analyses between cell viability by integrity, LDH release and ROS production in mHippoE-18 and PC12 cells exposed different SNP concentrations. The positively correlated variables are represented by the blue tone, and the negatively correlated variables are represented by the wine tone (Spearman ρ from +1 to −1). JASP software for correlations was employed to perform Spearman’s analyses, and significant differences were set at * p < 0.05, ** p < 0.01, *** p < 0.001.
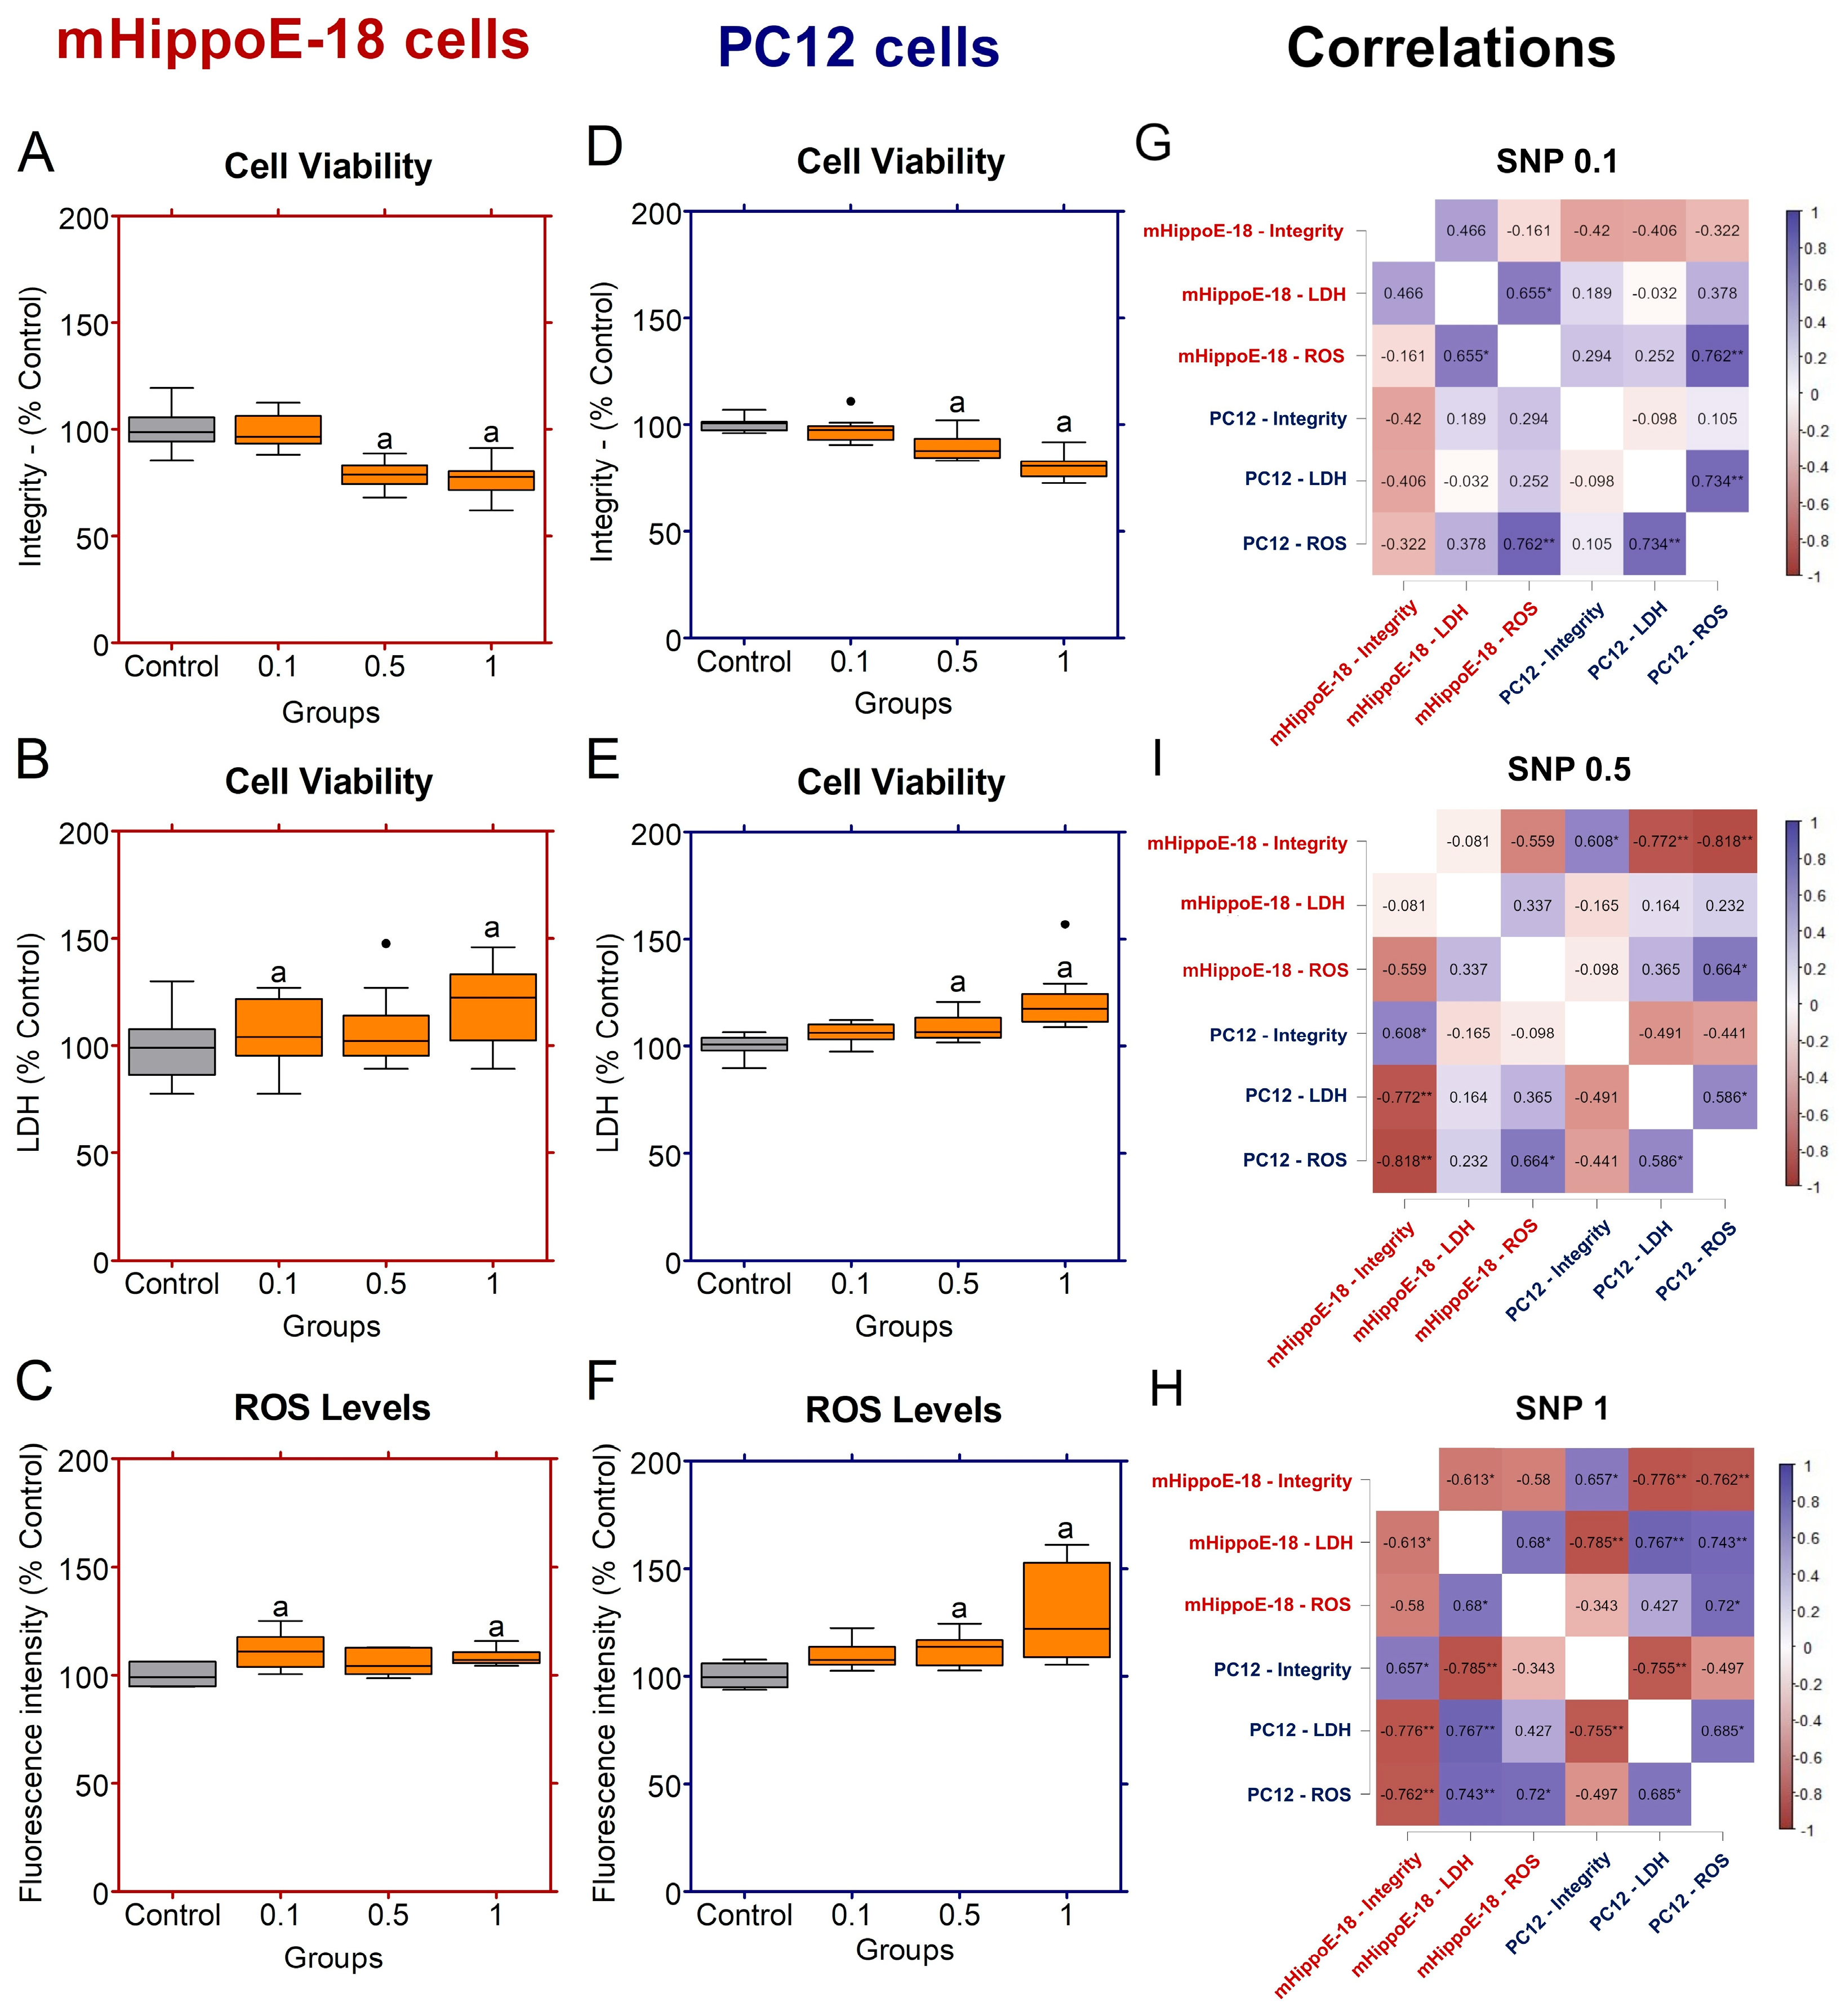
Figure 3.
Effects of sodium nitroprusside (SNP) in the long-term exposure on cell viability, membrane integrity, and ROS production in mHippoE-18 and PC12 cells. Cells were pre-incubated in culture medium alone for 4 h, followed by exposure to SNP (0.1, 0.5, or mmol·L−1) for 20 h. (A, D) Cell viability was determined by crystal violet dye (CV) assay and expressed as absorbance at 570 nm. (B, E) Membrane integrity was assessed by LDH release (U·L−1). (C, F) ROS production was measured by H2DCF-DA fluorescence and expressed as percentage of control. Data are shown as box-whisker plots (minimum–maximum, median). Data are shown as box-whisker plots (minimum–maximum, median). Outlier values are represented by symbols (∙) and were retained in the graphical representation to illustrate data distribution. Statistical differences compared to the control are indicated by a (p < 0.05). (G) Spearman correlation analyses between cell viability by integrity, LDH release and ROS production in mHippoE-18 and PC12 cells exposed different SNP concentrations. The positively correlated variables are represented by the blue tone, and the negatively correlated variables are represented by the wine tone (Spearman ρ from +1 to −1). JASP software for correlations was employed to perform Spearman’s analyses, and significant differences were set at * p < 0.05, ** p < 0.01, *** p < 0.001.
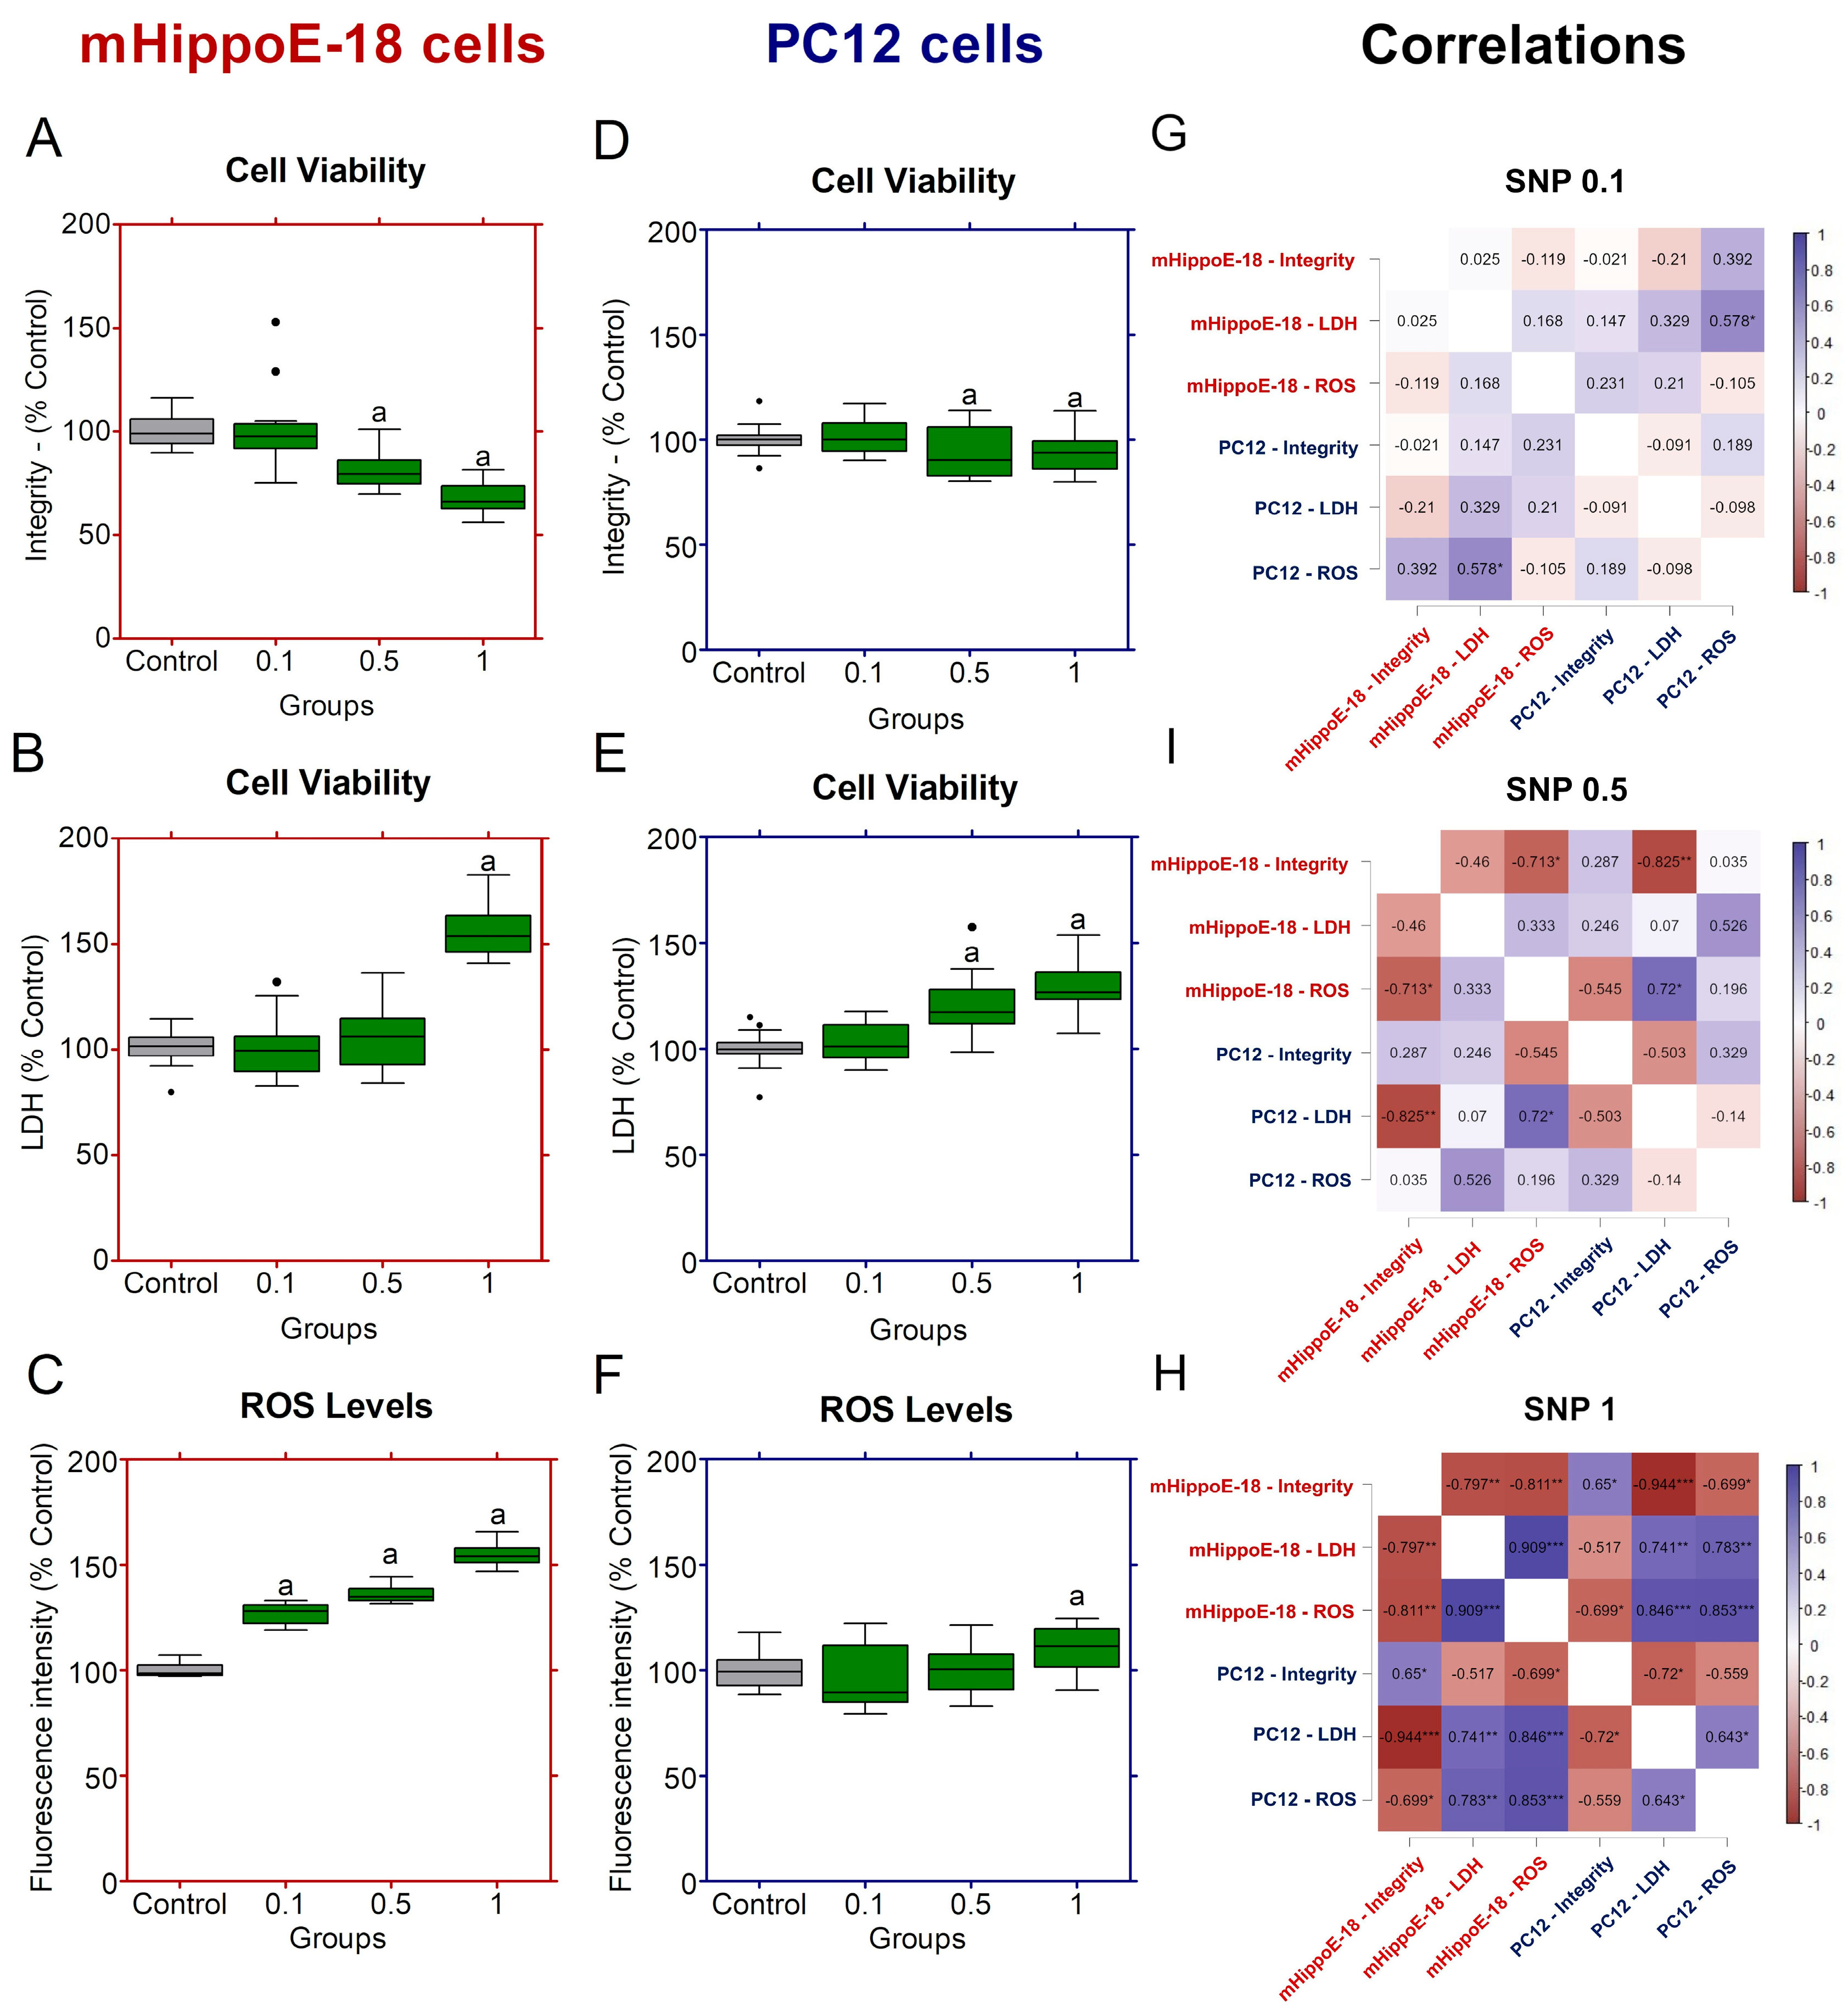
Figure 4.
Short-term exposure in zebrafish larvae exposed to sodium nitroprusside (SNP) at concentrations of 0.1, 1, and 2 mmol·L−1 compared to control larvae. (A) Metabolic activity measured by resorufin fluorescence. (B) ROS production expressed as fluorescence intensity relative to control (%). (C) Behavioral parameters were assessed by total distance traveled (mm), swimming velocity (mm·s−1), freezing episodes (s), and percentage of active versus inactive time. Lower panels illustrate representative swimming trajectories of individual larvae within wells and cumulative distance moved over 120 s. Data were analyzed using one-way ANOVA to assess differences among groups, followed by Tukey’s multiple comparison test or Dunnett’s test when comparing experimental groups with a single control (mean ± SEM; n = 6). Data are presented as box-and-whisker plots (minimum–maximum, median; n = 30) or bar graphs. Outlier values are represented by triangles and were retained in the graphical representation to illustrate data distribution. Different letters indicate significant differences (p < 0.05): “a” vs. control group (C), “b” vs. 0.1 mmol·L−1 SNP, “*” between experimental groups. (D) Spearman’s correlation analysis of metabolism, ROS production, and motility (total distance traveled) in zebrafish larvae exposed to different concentrations of SNP. Positive correlations are shown in blue and negative correlations in burgundy (ρ range: –1 to +1). Correlation matrices were generated using JASP software. Statistical significance was set at *p < 0.05, **p < 0.01, ***p < 0.001.
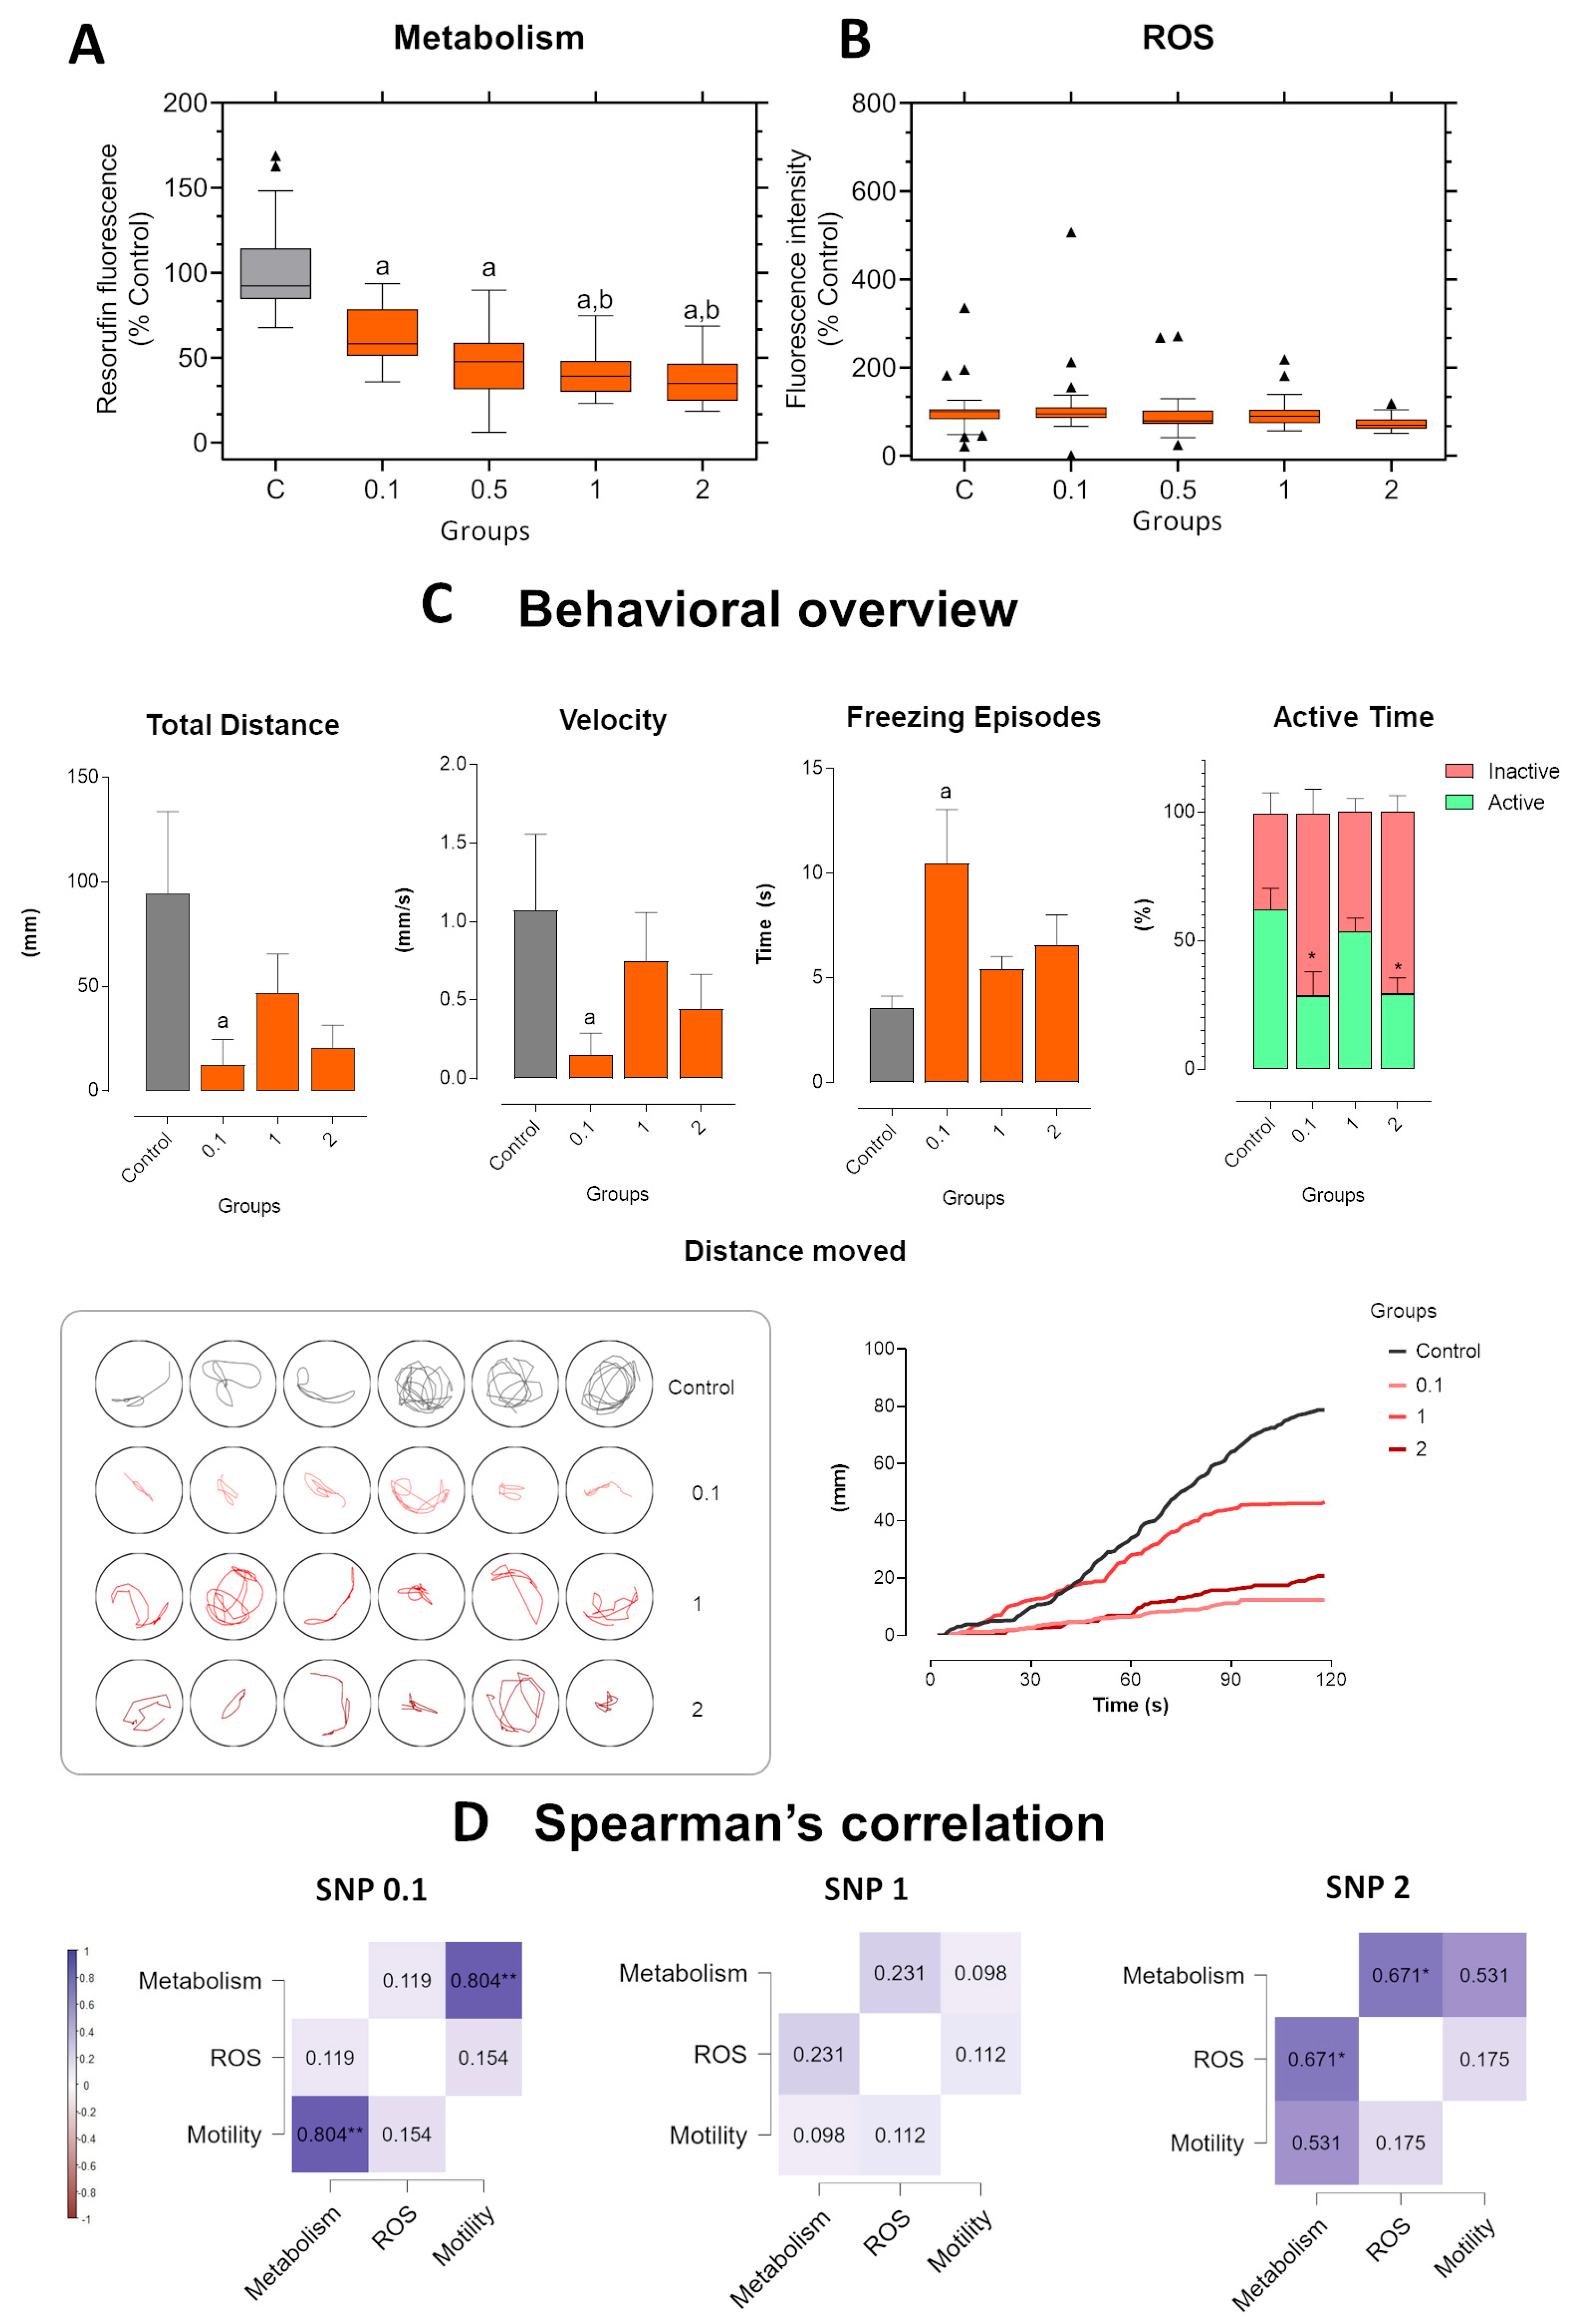
Figure 5.
Long-term exposure in zebrafish larvae exposed to sodium nitroprusside (SNP) at concentrations of 0.1, 1, and 2 mmol·L−1 compared to control larvae. (A) Metabolic activity measured by resorufin fluorescence. (B) ROS production expressed as fluorescence intensity relative to control (%). (C) Behavioral parameters were assessed by total distance traveled (mm), swimming velocity (mm·s−1), freezing episodes (s), and percentage of active versus inactive time. Lower panels illustrate representative swimming trajectories of individual larvae within wells and cumulative distance moved over 120 s. Data were analyzed using one-way ANOVA to assess differences among groups, followed by Tukey’s multiple comparison test or Dunnett’s test when comparing experimental groups with a single control (mean ± SEM; n = 6). Data are presented as box-and-whisker plots (minimum–maximum, median; n = 30) or bar graphs. Outlier values are represented by triangles and were retained in the graphical representation to illustrate data distribution. Different letters indicate significant differences (p < 0.05): “a” vs. control group (C), “b” vs. 0.1 mmol·L−1 SNP, “*” between experimental groups. (D) Spearman’s correlation analysis of metabolism, ROS production, and motility (total distance traveled) in zebrafish larvae exposed to different concentrations of SNP. Positive correlations are shown in blue and negative correlations in burgundy (ρ range: –1 to +1). Correlation matrices were generated using JASP software. Statistical significance was set at *p < 0.05, **p < 0.01, ***p < 0.001.
Disclaimer/Publisher’s Note: The statements, opinions and data contained in all publications are solely those of the individual author(s) and contributor(s) and not of MDPI and/or the editor(s). MDPI and/or the editor(s) disclaim responsibility for any injury to people or property resulting from any ideas, methods, instructions or products referred to in the content. |
© 2026 by the authors. Licensee MDPI, Basel, Switzerland. This article is an open access article distributed under the terms and conditions of the Creative Commons Attribution (CC BY) license.
Copyright: This open access article is published under a Creative Commons CC BY 4.0 license, which permit the free download, distribution, and reuse, provided that the author and preprint are cited in any reuse.


