Submitted:
08 January 2026
Posted:
09 January 2026
You are already at the latest version
Abstract
Mango holds a significant place globally. Considering its importance, it is also called 2 the king of fruits. Accurate price forecasting is essential for market decisions, policy 3 formulation, and agricultural market stability. Traditional time series models struggle 4 to provide effective and accurate forecasts of Mango prices and cannot capture their 5 nonlinear dynamics. The current study integrates machine learning, deep learning, and 6 statistical models to build a robust forecasting model using a dataset from 2001 to 2025. This 7 study proposed a novel attention-based Mango price forecasting approach. It significantly 8 forecasted Mango prices in the Indian market. It combines the strengths of various models 9 and produces generalized results. The hybrid ETS + ANN + GARCH model has high 10 predictive accuracy (MAE = 0.0498, MSE = 0.0106, RMSE = 0.1028, R2 209 = 0.774) and 11 ETS+SVM Hybrid achieves the accuracy level (MAE = 0.063, MSE = 0.006, RMSE = 0.078, 12 R2 = 0.873). The performance of ETS + BiLSTM is also significant, with an accuracy level 13 97.5%. Thus, an attention-based approach offers a new technological paradigm for mango 14 price forecasting.
Keywords:
price prediction of mango
; time series
; deep learning
; attention-based mechanism
1. Introduction
Mangoes are an important part of Indian agriculture and the country’s horticulture economy, having a big impact on market activity and farm income [1,22]. This study uses time-series modelling techniques to estimate and project mango modal prices for 23 Indian states through 2035. In horticulture, price forecasting is essential for enhancing supply-chain planning, lowering post-harvest losses, and facilitating prompt market interventions meant to stabilise prices [13,20]. For efficient policy development and regional agriculture planning, precise state-level pricing projections are especially crucial. Mango prices fluctuate significantly over time due to weather, production cycles, market connections, and policy changes because they are a high-value, seasonally produced horticultural crop [23,25]. Additionally, price behaviour varies significantly between states as a result of differences in institutional characteristics, market integration, and local production levels [13,22]. There is still a dearth of research that offers trustworthy and comparable long-term pricing projections across different Indian states, despite the fact that numerous studies have offered national-level or single-market price forecasts [22,36]. Current research frequently ignores structural variations between states or relies on short predicting horizons [13,23]. In order to close this research vacuum, the current work creates and assesses time-series models to produce long-term (up to 2035) state-wise mango modal price estimates for 23 Indian states. This would help farmers, traders, and policymakers make better decisions.
2. Problem Statement
Mango models prices in India fluctuate remarkable depending on a number of variables, such as market dynamics, seasonal variations, and meteorological conditions. Decisions about cultivation, storage, and marketing have been affected by the uncertainty these inconsistent fluctuate cause for farmers, traders, and legislators. The complicated non-linear and temporal character of price change is frequently avoided by traditional forecasting techniques. In order to accurately predict future mango prices using actual price data and relevant external factors, a robust and intelligent forecasting model must be developed. This study attempts to provide accurate long-term price forecasts to support improved market planning and policy formulation via the use of machine learning and statistical methods like ANN, GARCH, and ARIMAX models.
- Main contributions of the paper
This foretelling contributes to the body of research on agricultural price forecasting by creating a mixed prediction framework that improve the accuracy of mango model price forecasts in India by combining ANN, GARCH, and ARIMAX models.For the purpose of to improve forecast accuracy and long-term dependency learning, an Attention-based mixed Model (Attention-LSTM) was used. The proposed hybrid approach captures both linear and non-linear dependencies as well as volatility clustering in price data, in contrast to traditional time series models that only center on linear patterns.To improve forecasting accuracy, the analysis also takes into account outside factors like weather patterns and seasonal patterns. In order to help farmers, traders, and policymakers make well-informed decisions about production, storage, and marketing policy, the study also offers a long-term price forecast through 2035. The effectiveness of the suggested model for predicting agricultural markets is proved by its superior performance in terms of MAE, MSE, RMSE, and R2 metrics.
- i.
- Development of Hybrid Models: Integrating Machine Learning, Deep Learning, and Statistical Models.One model class—ANN, LSTM, or ARIMA—was typically utilised alone in previous analyses. This work introduces a hybrid, multi-family modelling framework that combines statistical (ARIMA/ETS), machine learning (SVM, Decision Tree), and deep learning (ANN, LSTM, BiLSTM) methods. Because of this integration, the model may collectively represent trend, seasonality, nonlinear patterns, and residual changes, increasing prediction accuracy.
- ii.
- A long-term, multi-state forecasting framework: In previous research that determined mango pricing (e.g., [11,20]) was limited to a single state and small market, or short forecasting period. For long-term economic analysis and national agriculture planning, these constrained scopes were inadequate. But the new study provides a comprehensive forecasting technique that encompasses 23 Indian states and anticipates until 2035.Thus, it one of the first nationally conducted long-term forecasting studies for a horticulture product in India. The model supports state-level policy design, procurement plan formulation, and supply chain oversight by offering extended predictions for all main mango-growing regions, hazardous decision-making, stabilised markets strategies, and optimisation. This broad geographical and temporal coverage significantly surpasses the capabilities of earlier research and establishes a new national benchmark for agricultural price forecasting.
- iii.
- Attention approach based mechanism: The LSTM and traditional RNN models were unclear. The analysis incorporates an Attention-LSTM, which allows the model to wisely focus on the most instructional historical time points. This is a significant methodological advancement in explainability and forecast accuracy.
- iv.
- Integrating Seasonal and Exogenous Factors: Unlike other studies that mostly relied on past pricing, this study includes seasonality indicators and environmental variables as exogenous elements. By allowing the models to learn seasonal shocks, climate effects, and cyclical oscillations, this improves long-term forecast dependability.
- v.
- Evaluation of Multi-Model Precision: The majority of previous analyses simply evaluated one or two models. This analysis offers a comprehensive quantitative evaluation of seven distinct models (ARIMA+DT, ANN, LSTM, GARCH, ETS+SVM, ETS+BiLSTM, Attention-LSTM) using industry-standard measures including MAE, MSE, RMSE, and R(square).
- vi.
- Novel ETS + BiLSTM and ETS + SVM Hybrid Architectures: In a mango price forecasting investigation, ETS decomposition has never been combined with cultivated nonlinear models such as SVM or BiLSTM. By decomposing the data into linear components (ETS) and using SVM or BiLSTM to model nonlinear residuals, the technique produces more precise and reliable predictions.
- vii.
- ETS + ANN + GARCH Forecasting with Volatility Awareness: Volatility clustering, a common feature of agricultural prices, was frequently disregarded in previous studies. By incorporating both stable trends and erratic market phases, the hybrid ETS + ANN + GARCH model produces uncertainty-aware forecasts that are crucial for risk-sensitive decisions.
- viii.
- Integrated Framework for Tracking Linear, Nonlinear, and Volatility Patterns: Previous study models were able to capture independent characteristics like trend, volatility, or nonlinearity. This approach is the first to combine trend using ARIMA/ETS, nonlinear patterns using ANN/LSTM/BiLSTM, and volatility using GARCH into a single, coherent forecasting method.
- ix.
- Efficient Interpretation for Farmers, Traders, and Policymaker: Modelling was the main issue with earlier analysis. This analysis demonstrates how stakeholders can use forecast prediction for proceeds planning, storage decisions, expenditure scheduling, and market stability strategies.
3. Previous Work
The studies importance:By generating similar long-horizon forecasts at the state level, the analysis adds to the body of literature and advantages supply chain participants, farmers, cooperatives, and market supervisors. prediction and model analytical help recognize states that are more vulnerable to price volatility and facilitate enhanced planning for price sustain, procurement, and storage process. Andhra Pradesh, Assam, Chandigarh, Goa, Haryana, Himachal Pradesh, Jammu and Kashmir, Jharkhand, Karnataka, Kerala, Madhya Pradesh, Maharashtra, Meghalaya, the National Capital Territory of Delhi, Odisha, Punjab, Rajasthan, Tamil Nadu, Telangana, Tripura, Uttar Pradesh, Uttarakhand, and West Bengal are among the 23 states and union territories that are involved in the analysis. The research focuses on time-series foretelling techniques and limits its latitude to modal market price series (state-level aggregates). It does not conduct a thorough causal imputation to particular policy or agricultural interventions, although it does address potential drivers when suitable.

Table 1.
Literature Survey.
| SNo. | Citation (Author, Year) | Research Objective | Methodology | Data Used (Time Series Period) | Key Findings and Accuracy Level | Evaluation Metric |
|---|---|---|---|---|---|---|
| 1 | [3] | Using recurrent neural network (RNNs)to predict the minimum and maximum price | LSTM, GRU, Simple RNN | Vegetables and Fruits | LSTM, MAE (3.43), MSE (65.659), (0.993), MEDAE (1.99), EV (0.99). GRU, MAE (4.24), MSE (88.23), (0.991), MEDAE (5.69), EV (0.98). Simple RNN, MAE (4.815), MSE (105.251), ( 0.989), EV (0.99). | MAE, MSE, RMSE, , MEDAE, EV |
| 2 | [6] | Image recognition to detect fruit weights and deep learning based YOLOv9 to classify the level of ripeness | Cost estimation YOLOv9 | Fruit data | ||
| 3 | [4] | The mislabeling of mangoes in local Pakistani markets | CNN,Gaussian Mixture Model | Image mango data | Anwar Ratol, Precision(0.98), Recall(0.98),F1-score(0.98), Support(22), Chaunsa, Recall(0.97), Recall(0.97), F1_score(0.97), Support(16), Dosehri, Precision(0.97), Recall(0.97), F1_score(0.97), Support(23), Accuracy 0.97 | Precision,Recall,F1-Score,Support |
| 4 | [5] | Handling large volumeb of data ,emerges as an innovation solution to enhance the precision of mangon production estimation | YOLOv4-tiny,YOLOv5-CS,ANN, RetinaNet, YOLOv5, R-CNN | Image mango data | YOLO-Trained accuracy(96.725%) recall(77.4%),F1 Score (86%), R-CNN Accuracy(98.57%) recall(63.80%), F1 score(77.46%) | |
| 5 | [34] | Review agricultural product price forecasting methods and challengs. | Literature review (Traditional, Intelligent, and Combined models). | N/A (Review of various historical studies and methods). | Combined models and integration of unstructured data (news) are future trends. | Accuracy of values and precision of trends |
| 6 | [7] | Considering the profit component agriculture,particularly in India | (Vegetables and Pulses According to Weather) data | Decision tree accuracy(90.20%),K-NN accuracy(89.78%), Random Forest(90.43%), Neural Network(91.00%) | RMSE | |
| 7 | [10] | Optimizing productivity and reducing food waste | Gaussian Process Regression,FCN,Linear Regression,ANN, KNN,SVR And RF | Mango (remote sensing and weather variables) | Gaussian process regression accuracy(85.95%),FCN accuracy(73.6%),Linear Regression accuracy(90%),ANN, KNN,SVR And RF accuracy(86.5%),R-CNN accuracy(96%),Faster R-CNN accuracy(90%) | MAE,NMAE,RMSE, FLEM |
| 9 | [13] | Boost farmers livelihoods and increase yield as well | CNN,RNN, ARIMA, ARIMAX, LASSO, SVM, XGBOOST, CNN-RNN, CNN-LSTM, MLR-ANN, GRNN,MARS | Crop data | Precision rate for the computed model (86%),recall(87%),F1-Score(86.5%) | RMSE,F1-SCORE,RECALL |
| 10 | [20] | Forecast the price of mango using ARIMA model | ARIMA ,FORECASTING PRICE | Mango | MAPE | |
| 11 | [33] | Assess short-term impact of Russia-Ukraine conflict on food supply and prices. | Counterfactual analysis using SARIMA and VAR forecasting models. | Monthly food price indexes from Jan 2000 to Dec 2022. | Significant export decline; short-lived commodity surge but persistent retail price increases. | Forecast errors (Actual vs. Counterfactual) |
| 12 | [8] | The forecasting of horticulture commodity price has wide-ranging impacts on farmers, traders, and end-users | ARIMA, ANN, GARCH, SARIMA, RNN,ARCH | Banana data | ARIMA Model MSE(44007.7), RMSE(209.78), MAPE(65.79), SMAPE(30.14) MASE(2.44), MDA(0.55), SARIMA Model MSE(43614.2) RMSE(208.84), MAPE(74.13), SMAPE(37.80), MASE(12.37), MDA(0.56), GARCH Model MSE(29549.6), RMSE(171.9), MAPE(60.91), SMAPE(32.49), MASE(7.78), MDA(0.46), ANN Model MSE(13686.7), RMSE(116.99), MAPE(16.56), SMAPE(11.12), MASE(0.58), MDA(1.00), RNN Model MSE(7157.16), RMSE(84.6), MAPE(9.58), SMAPE(7.43), MASE(0.12), MDA(1.74) | MSE,RMSE, MAPE, SMAPE, MASE,MDA |
| 13 | [9] | Forecasting prices for dripping crops | ANN, ARIMA,LSTM, Ridge regression,Linear regression | Crop data | Linear regression Model On Training data MSE(1.22) RMSE(1.32), MAPE(1.23), on Validation data MSE(1.28), RMSE(1.52), MAPE(1.56) on Testing data MSE(0.98), RMSE(0.95), MAPE(0.85), Ridge regression Model Training data MSE(1.19) RMSE(1.28), MAPE(1.19),Validation data MSE(1.26) RMSE(1.51), MAPE(1.56), Testing data MSE(0.97) RMSE(0.92), MAPE(0.84), ARIMA Model Training Data MSE(1.15)RMSE (1.26), MAPE(1.17),on Validation data MSE(1.25) RMSE(1.49), MAPE(1.55), Testing data MSE(0.88) RMSE(0.84), MAPE(0.82), LSTM model Training data MSE(1.10) RMSE(1.14), MAPE(1.01),Validation data MSE(1.74)RMSE(1.74), MAPE(1.45), Testing data MSE(0.74)RMSE(0.77), MAPE(0.81) | MSE,RMSE,MAPE |
| 14 | [35] | Investigate if live hog futures prices help forecast forthcoming spot prices. | 6 Futures-based models (e.g., futures spread, linear regression). | Daily hog spot and futures prices from Jan 2021 to March 2023. | Futures-based models outperformed no-change models; spread models best for 1–4 months ahead. | RMSE, MAE, MAPE, MSPE, and DM tests |
| 15 | [2] | Computer Vision for mango price estimation based on breed classification in Thailand | YOLO, YOLOv2, YOLOv3, YOLOv4 and YOLOv5, R-CNN | Image mango data | Kiewsavoy ,ResNetModel accuracy(87.0968%) ,MoblieNetV2 modelaccuracy(83.8710%), GoogleNetmodel accuracy(83.87%), Turmeric, ResNetModel (100%), MoblieNetV2 model (100%), GoogleNet model (100%) | |
| 16 | [16] | Focuses on the decisions of picking, inventory, ripening, delivering and selling mangos in harvesting season | Stochastic programming model,Bass model,EV,SP, EEV,VSS | Mango data | Bass model MAPE Mangifera indica Linn(18%),Irwin(27%)Jin-Hwang(14%),Yu-Wen(13%),Sensation(40%), Keitt(30%) MSE Mangifera indica Linn(22554941),Irwin (7971410592) Jin-Hwang(471484026),Yu-Wen(47548986)Sensation (5648911), Keitt(446139313) | MAPE,MSE |
| 17 | [27] | Evaluate deep learning models for China’s soybean futures. | Comparative study of 9 models (iTransformer, TFT, PatchTST, etc.). | Soybean futures and exogenous variables (ER, SF) from Jan 1, 2007 to Dec 31, 2024. | iTransformer best for MAPE (short/long term); | TFT best for multivariate settings. MAE, RMSE, MAPE |
| 18 | [30] | Predict daily prices for major vegetables for market monitoring. | VMD-FOA-GRU: Variational Mode Decomposition + Fruit Fly Optimization + GRU. | Daily price data of 6 vegetables (cabbage, cucumber, etc.) from 2014 to 2024. | values consistently exceeded 99.4%, outperforming single deep learning models. | MAE, RMSE, |
| 19 | [36] | Predict China’s aquatic product consumer price index. | VMD-IBES-LSTM: Variational Modal Decomposition + Improved Bald Eagle Search + LSTM. | 5 fishery products (e.g., carp) from Week 52, 2012 to Week 44, 2021. | High accuracy; RMSE for five test sets: 0.480, 0.214, 0.288, 0.58, and 0.68. | MSE, RMSE, MAE, MAPE |
| 20 | [13] | Boost farmers livelihoods and increase yield as well | CNN,RNN, ARIMA,ARIMAX, LASSO,SVM, XGBOOST,CNN-RNN, CNN-LSTM,MLR-ANN,GRNN,MARS | Crop data | Precision rate for the computed model (86%),recall(87%),F1-Score(86.5%) | RMSE,F1-SCORE,RECALL |
| 21 | [16] | Focuses on the decisions of picking, inventory, ripening, delivering and selling mangos in harvesting season | Stochastic programming model,Bass model,EV,SP,EEV, VSS | Mango data | Bass model MAPE Mangifera indica Linn(18%),Irwin(27%)Jin-Hwang(14%),Yu-Wen(13%),Sensation(40%), Keitt(30%)MSE Mangifera indica Linn(22554941),Irwin(7971410592) Jin-Hwang(471484026),Yu-Wen(47548986)Sensation(5648911), Keitt(446139313) | MAPE,MSE |
| 22 | [28] | Detect anomalies and cluster regional wholesale fruit/vegetable prices. | Hybrid ML: Noise reduction (IQR/Hampel) + PCA + Gaussian Mixture Models. | Chilean produce prices across 16 regions from 2015 to 2023. | Model is robust for detecting regional price anomalies and supply chain planning. | Sensitivity analysis and robustness validation. |
| 23 | [29] | Enhance futures return prediction while preventing data leakage. | Rolling VMD-LASSO-Mixed Ensemble: Rolling window + LASSO + 6 algorithms. | Daily returns of 5 commodities (coffee, cotton, corn, etc.) from 2010 to 2024. | Framework improved accuracy; Rolling VMD successfully prevented data leakage. | MSE, MAE, Theil U, ARV, DA |
| 24 | [14] | Forecasting of area, production and the idea about price trend and used to provide support in decision making and proper planning for sustainable growth of the developing country | ARIMA(5,1,2), ARIMA(3,1,1) | Food | Validation of the ARIMA(5,1,2) model RMSE(705.239),MAE(539.033), MAPE(13.701%),Theil inequality(0.0796). Validation of the ARIMA(3,1,1) model RMSE(441.593),MAE(325.648) MAPE(7.077%)Theil inequality coefficient(0.0526) | RMSE,MAE,MAPE |
| 25 | [15] | Thus aim of the study was to develop precise and easy early population prediction model of mango hopper for tropical monsoon climate conditions | SARIMA AND HYBRID SARIAM ANN | Mango | Fitting error statistics for SARIMA model R2(0.90),MSE(1.33),RMSE(1.15), MAE(0.93),MAPE(.0.51), SARIMA -ANN model R2(0.91),MSE(1.23),RMSE(1.11), MAE(0.91),MAPE(0.51),Validation error statistics SARIMA model R2(0.92),MSE(1.74),RMSE(1.31), MAE(0.96),MAPE(0.33),SARIMA-ANN Model R2(0.94),MSE(1.30),RMSE(1.14) MAE(0.73),MAPE(0.28) | RMSE,MAE,MSPE,R2 |
| 26 | [17] | The present study was conducted in Tamil Nadu .since, area and production of mango and banana are higher in Tamil Nadu. | ARIMA model ,Regression model ,TDNN,SVM,NLSVR | mango and banana dataset | ARIMA model MAPE(29.39),MAX APE(346.07),MAE(1.11),DF(18), SIG.(88),OUTLIERS(0) | MAPE,MAX APE,MAE, SIG,OUTLIERS |
| 27 | [26] | the present investigation was carried out for weekly data interval of 20 consecutive years(1998-2017)to understand the population dynamics of mango hoppers and developed good fit time series prediction model for better management of hoppers in humid agro-climatic conditions | Multiple linear regression,SARIMA, ARIMA | Mango hoppers dataset | SARIMA(1,0,2)(1,1,1),R2(.89), Schwarz criterion(SIC)(0.62), SARIMA(1,0,1) (0,1,1),R2(.88), Schwarz criterion(SIC)(0.68), SARIMA(1,0,0)(0,1,1),R2(.88), Schwarz criterion(SIC)(0.70),SARIMA(1,0,0) (1,1,0),R2(.86), Schwarz criterion(SIC)(0.89) fitting and validation(2018) R2(0.963),MSE(0.622),RMSE (0.789),MAE(0.566),MAPE(2.111) | R2,RMSE,MAPE,MAE, MSE |
| 28 | [18] | Region VII reports that many mango orchards in Cebu province are dying because of the absence of required post-harvest attention | NDVI,TIME SERIES USING HIERARCHICAL CIUSTERING | Mango | Cluster1 containing 29 division cluster2 containing 24 division, cluster3 containing 2.17 division | |
| 29 | [31] | Develop an efficient method for predicting corn market prices. | SGKGBA: STL + GARCH-M + KPCA + GWO-optimized BiGRU-Attention. | Weekly Chinese corn prices and 21 factors from Jan 2014 to June 2024. | High accuracy: MAE 0.0159, RMSE 0.0215, MAPE 0.5544%, 0.9815. | MAE, RMSE, MAPE, . |
| 30 | [19] | Inflation has up as a leading concern of India’s economic policymakers and citizens over the last decade | Forecasting ,inflation,Seasonal ARIMA,ARIMA | Mango | SARIMAX(1,0,0)x(1,1,1)12,ARIMA | |
| 31 | [12] | Product price forecasting system that pulls data from the indian Ministry of Agriculture and Farmers can more easily identify which markets to sell at and when | Data imputation, time quantisation,classification, Machine learning | Product | RMSE | |
| 32 | [23] | Forecast model has been developed for the mango production in Pakistan(AREA,RAIN -FALL, TEMPERATURE) | ARIMA-X(1,1,1), ARMA[12,13] | Mango | R2,Standard Error | |
| 33 | [32] | Propose a novel vegetable-price forecasting method using Mixture of Experts. | VPF-MoE: Combines LLMs (TimeMoE/Time-LLM) with deep learning (N-BEATS/TIDE). | Daily prices for 5 vegetables (e.g., eggplant) from Jan 1, 2014 to March 31, 2024. LLMs generally outperform other methods; VPF-MoE adapts to different vegetable types. | MAE, MSE, , PCC. | |
| 34 | [21] | Horticulture sector plays a prominent role in economic growth for most of the developing countries . | ARIMA,HYBRID MODELS,NLSVR, REGRESSION MODEL TIME SERIES,TDNN, MEAN MEDIAN MODE SKEWNESS,KURTOSIS | MANGO AND BANANA | ARIMA MANGO YIELD MAPE(3.83),TDNN(2.81), NLSVR(2.81),ARIMA-TDNN(1.98),ARIMA-NLSVR(1.73) ARIMA BANANA YIELD MAPE(12.10),TDNN(7.58), NLSVR(6.93),ARIMA-TDNN(5.12),ARIMA-NLSVR(4.73) | MAPE |
| 35 | [22] | the growth rate and instability of mango production is studied for the period 1992-93 to 2013-14. | Adjusted R2,Growth rate ,instability, root mean square error, spline model ,trend | Mango | ||
| 36 | [24] | From this viewpoint ,we investigate domestic integration among ten major mango market,LAHORE, FAISALABAD,MULTAN, GUJRANWALA, SARGODHA, KARACHI, HYDERBAD, SIKKUR, PRESHAWA AND QUETTA | Mangoes ,cointegration,causlity | Mango |
4. Research Method
4.1. BOX -Jenkins Hybrid Autoregressive Integrated Moving Average(ARIMA) and( Decision Tree)Models
The stationarity of the data was carried out with Augmented Dickey-Fuller (ADF) Test (Unit root test) before being the implementation process steps of ARIMA .The ARIMA is one of the most traditional methods of non-stationary time series analysis(Box et al.,1994). The model is usually stated as ARIMA (p,q,d), where p denotes the order of autoregression, d denotes integration (differencing), and q denotes the moving average order.The Box and Jenkins propose a practical three-stage procedure for finding a good or best model: a) Identification b)Estimation of parameters
Figure 1.
ACF-Model Price(Rs./Quintal).
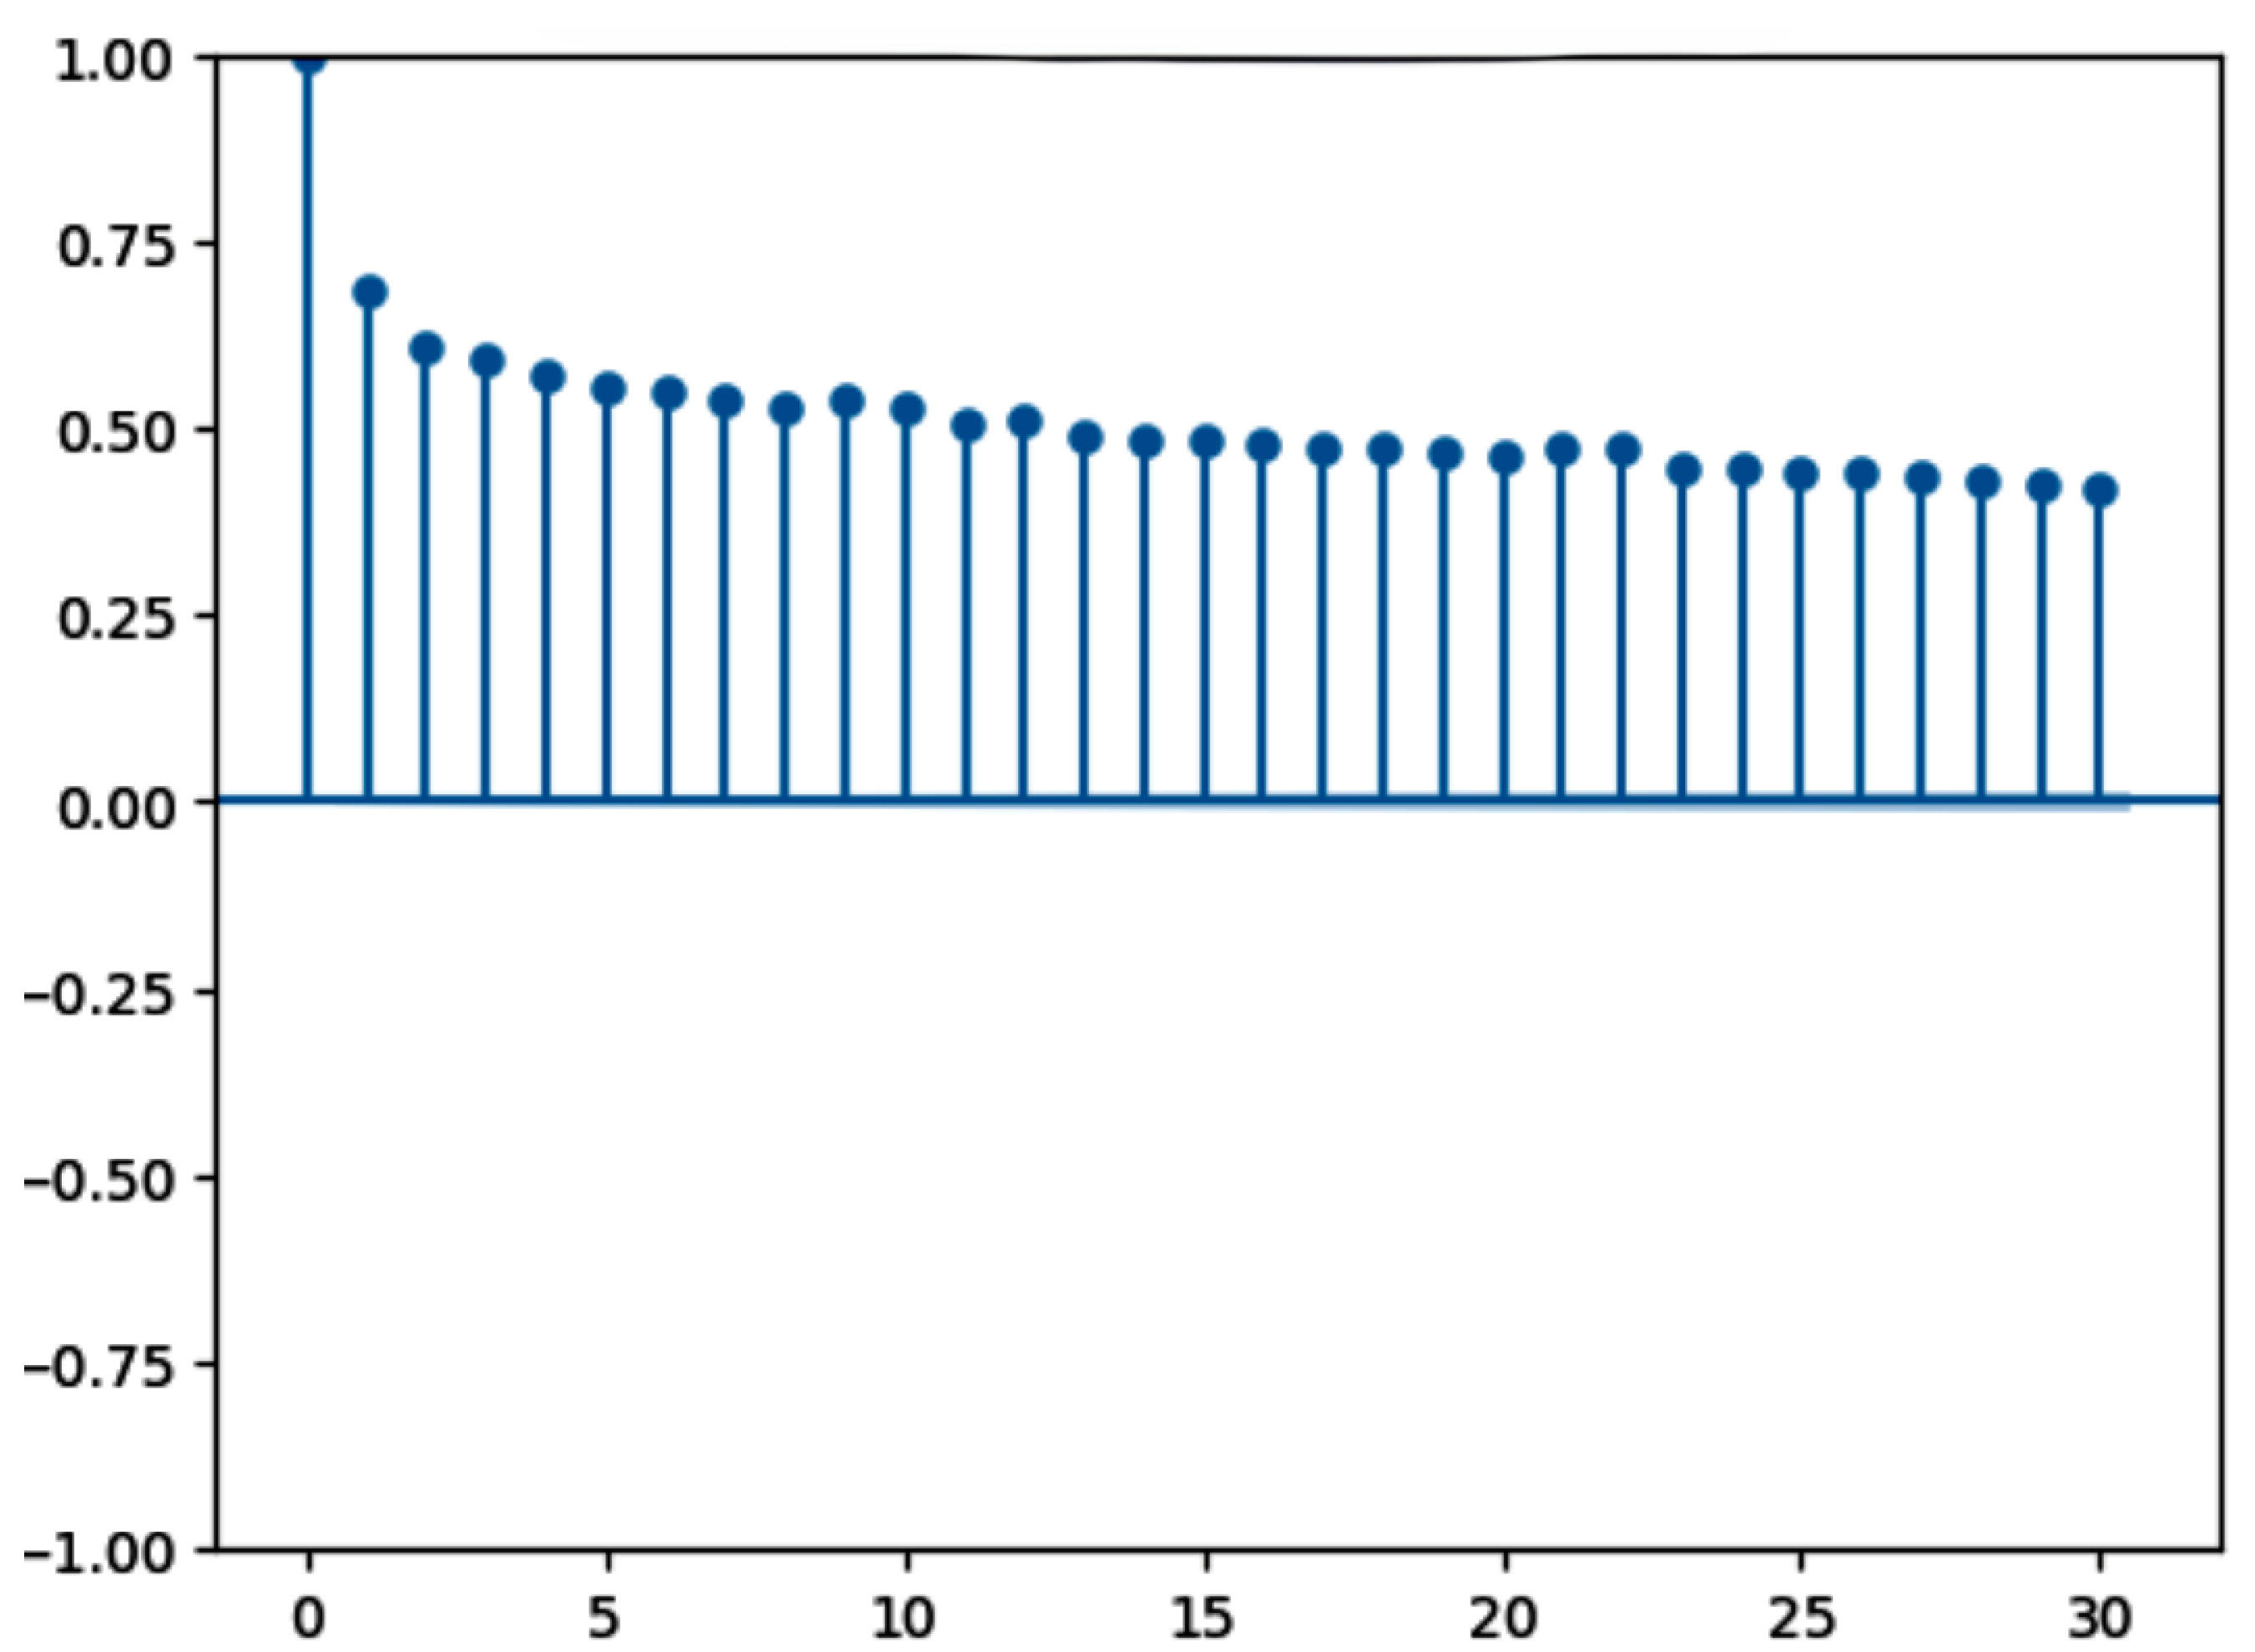
"Stable short-term correlations and good stationarity for accurate time-series modeling are confirmed by the ACF’s steady decline and lack of explosive patterns."
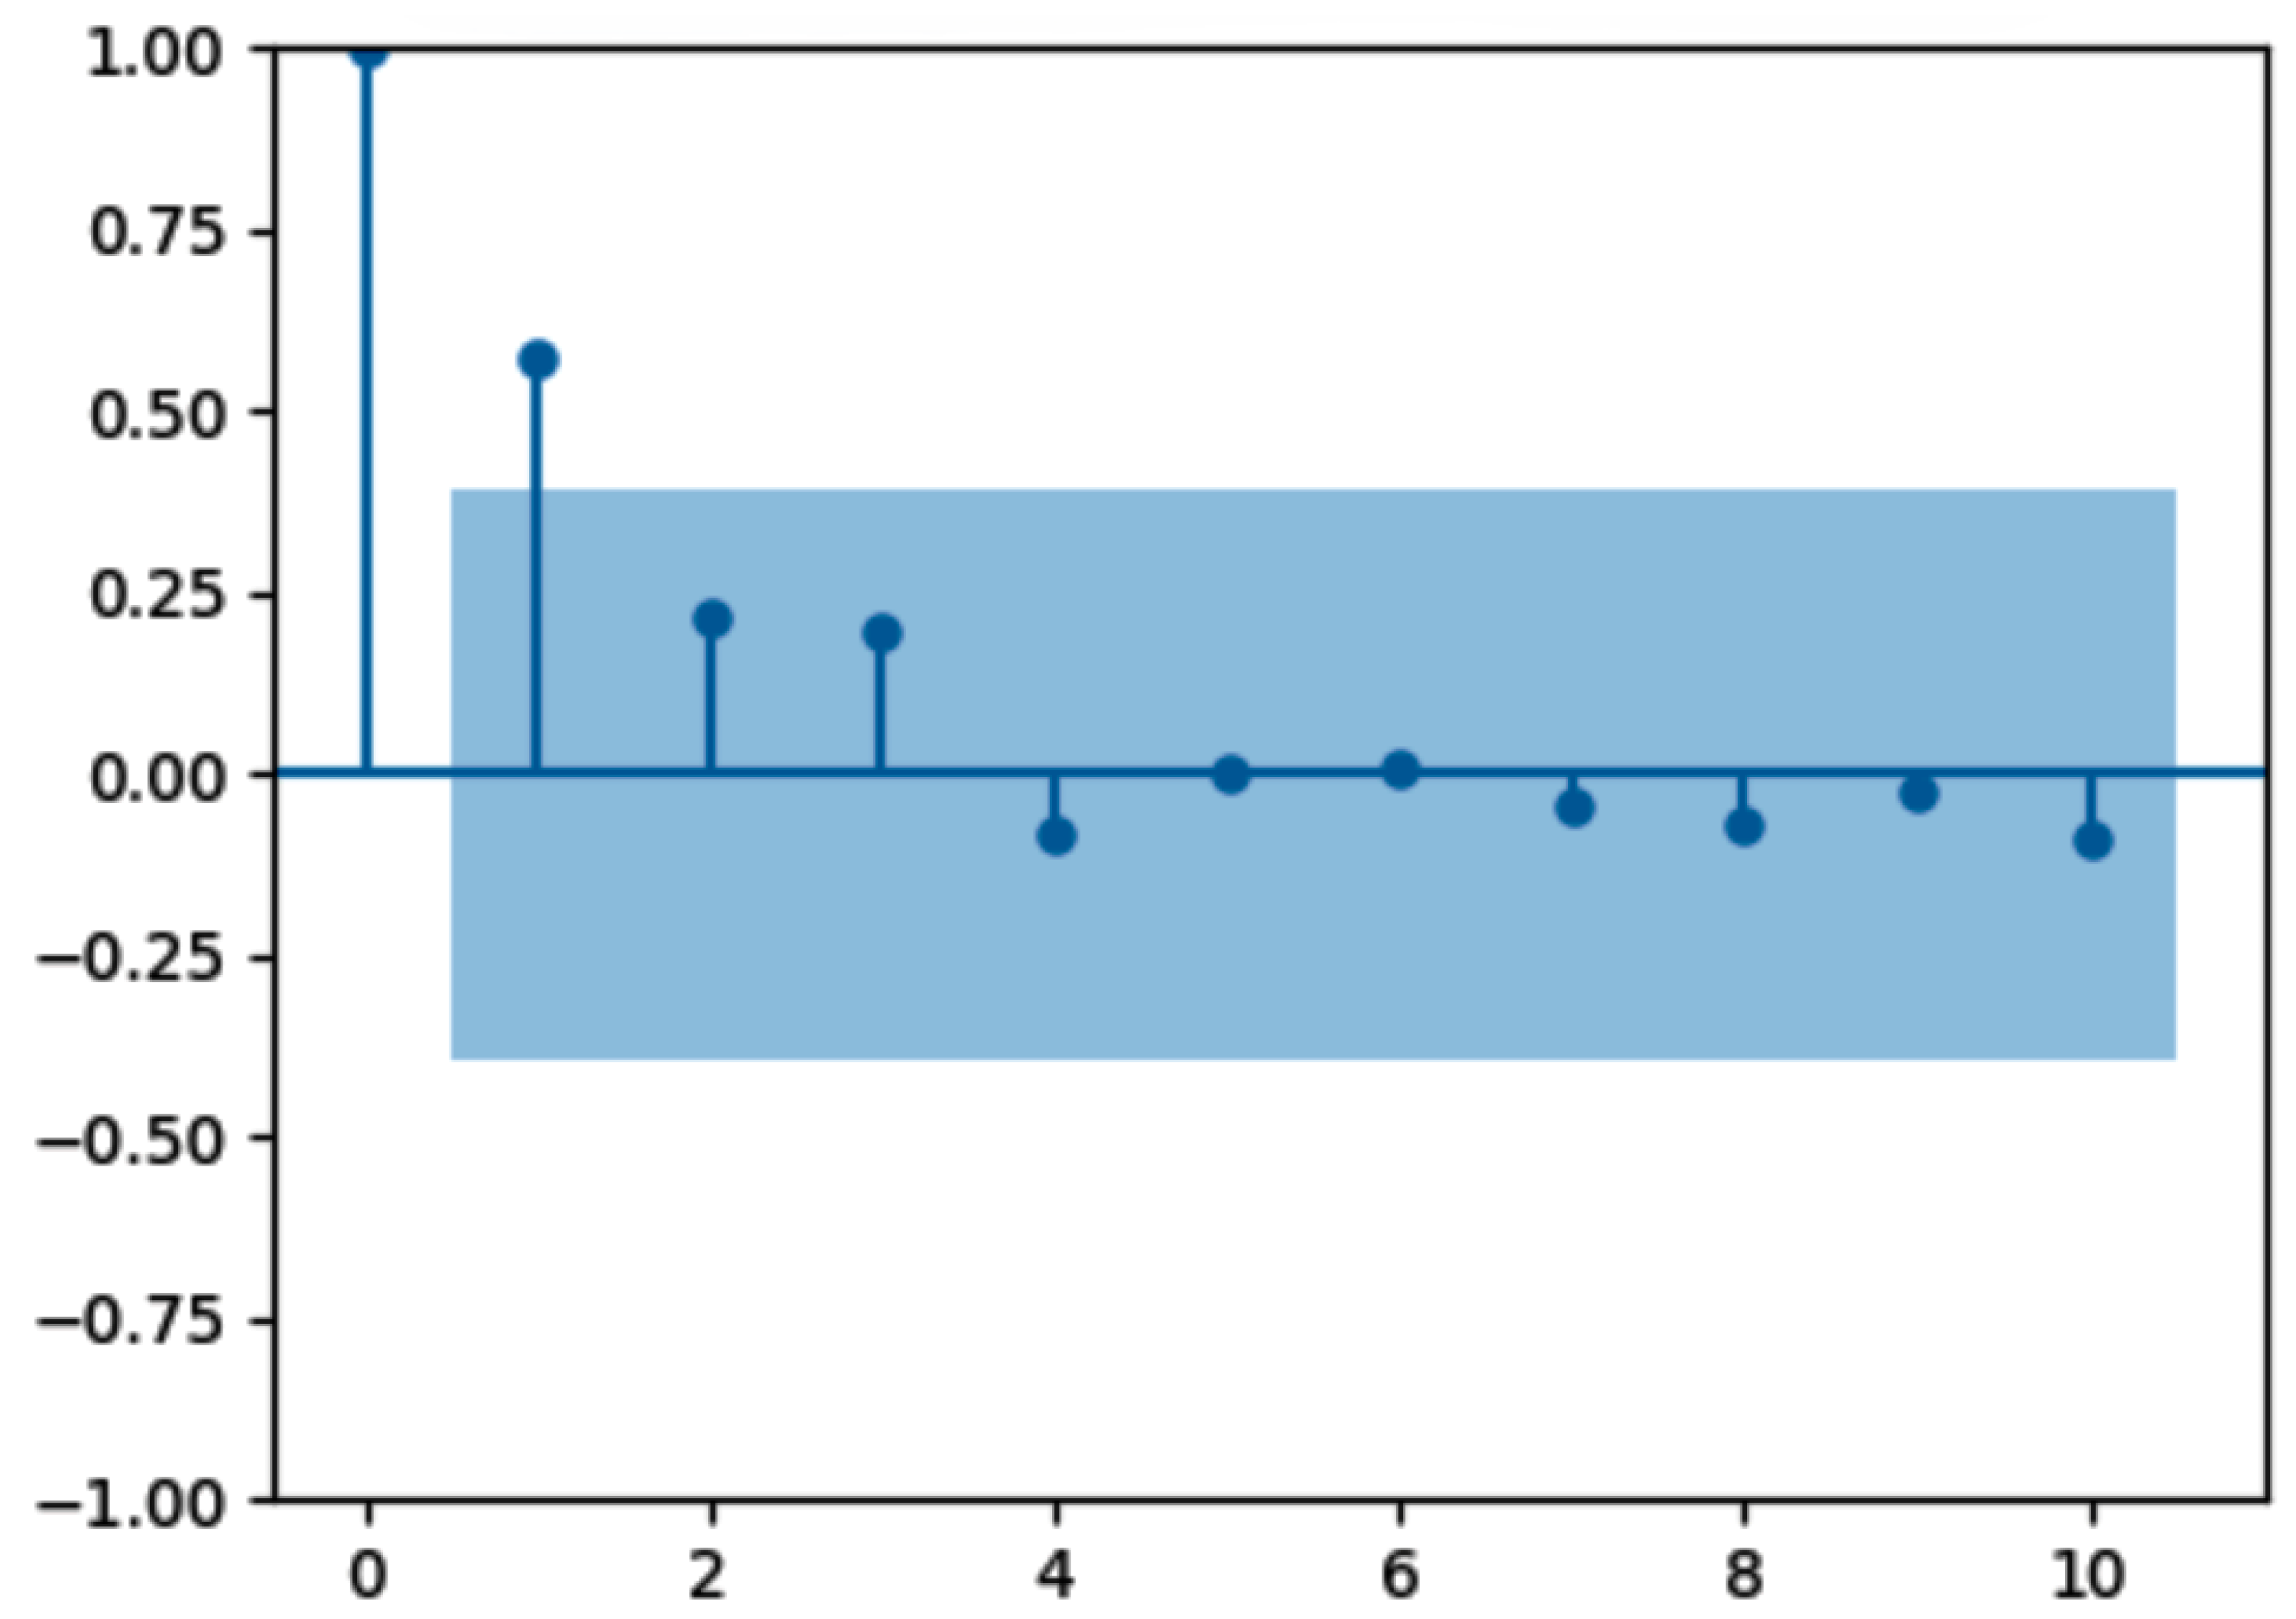
Figure 2.
PACF-Model Price(Rs./Quintal).
After Lag 4 or Lag 5, the PACF plot clearly cuts off to zero within the confidence band, with a strong, significant spike at Lag 1 (). An Autoregressive (AR) process is identified by this unique pattern. Consequently, or is the initial, tentative order for the AR component (p) in an ARIMA model.
Table 2.
Stationarity (ADF) test at level and at 1st differencing ADF summary table.
| Transform | ADF Statistic | p-value | Used_Lag | N_ObsWM | Crit_1% | Crit_5% | Crit_10% |
|---|---|---|---|---|---|---|---|
| Original | -46.520997 | 0.0 | 91 | 375001 | -3.430367 | -2.861548 | -2.566774 |
| diff_1 | 109.598447 | 0.0 | 94 | 374997 | -3.430367 | -3.861548 | -2.566774 |
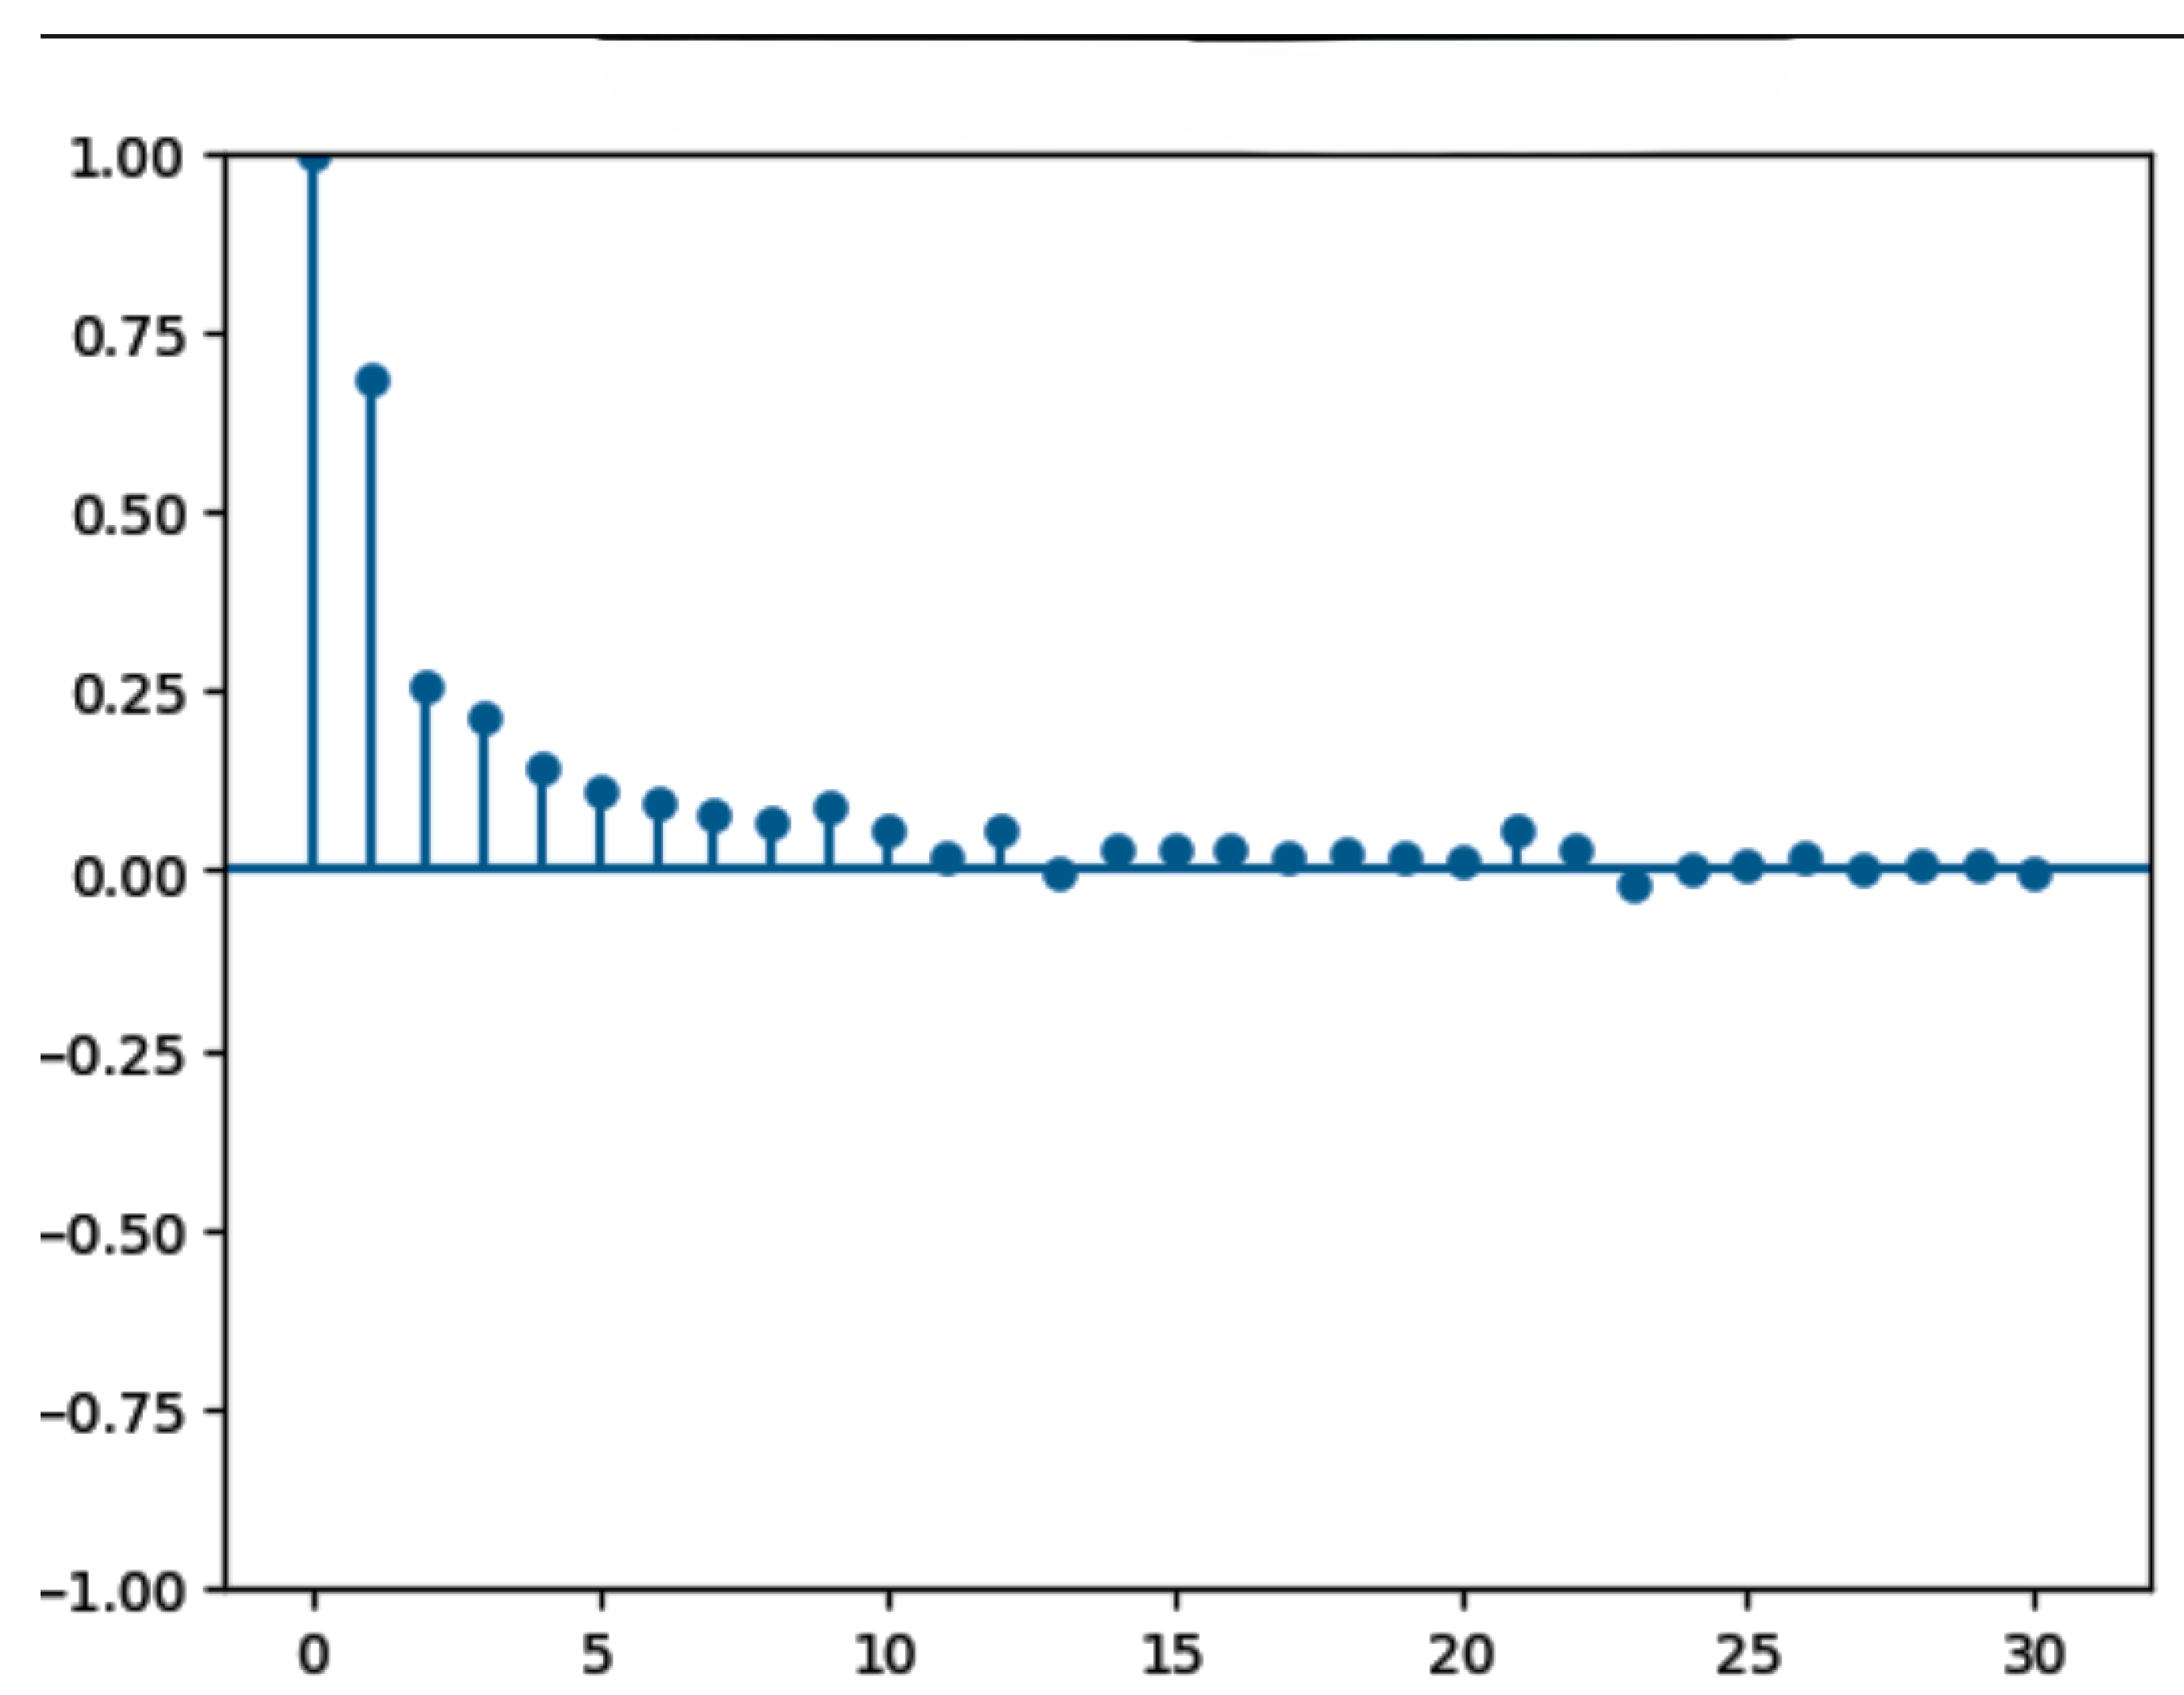
Figure 3.
ACF(Autocorrelation Function).
"The ACF now demonstrate a quicker decline toward zero, demonstrating that the differencing has efficiently eliminated trend and delivered the series stationary."
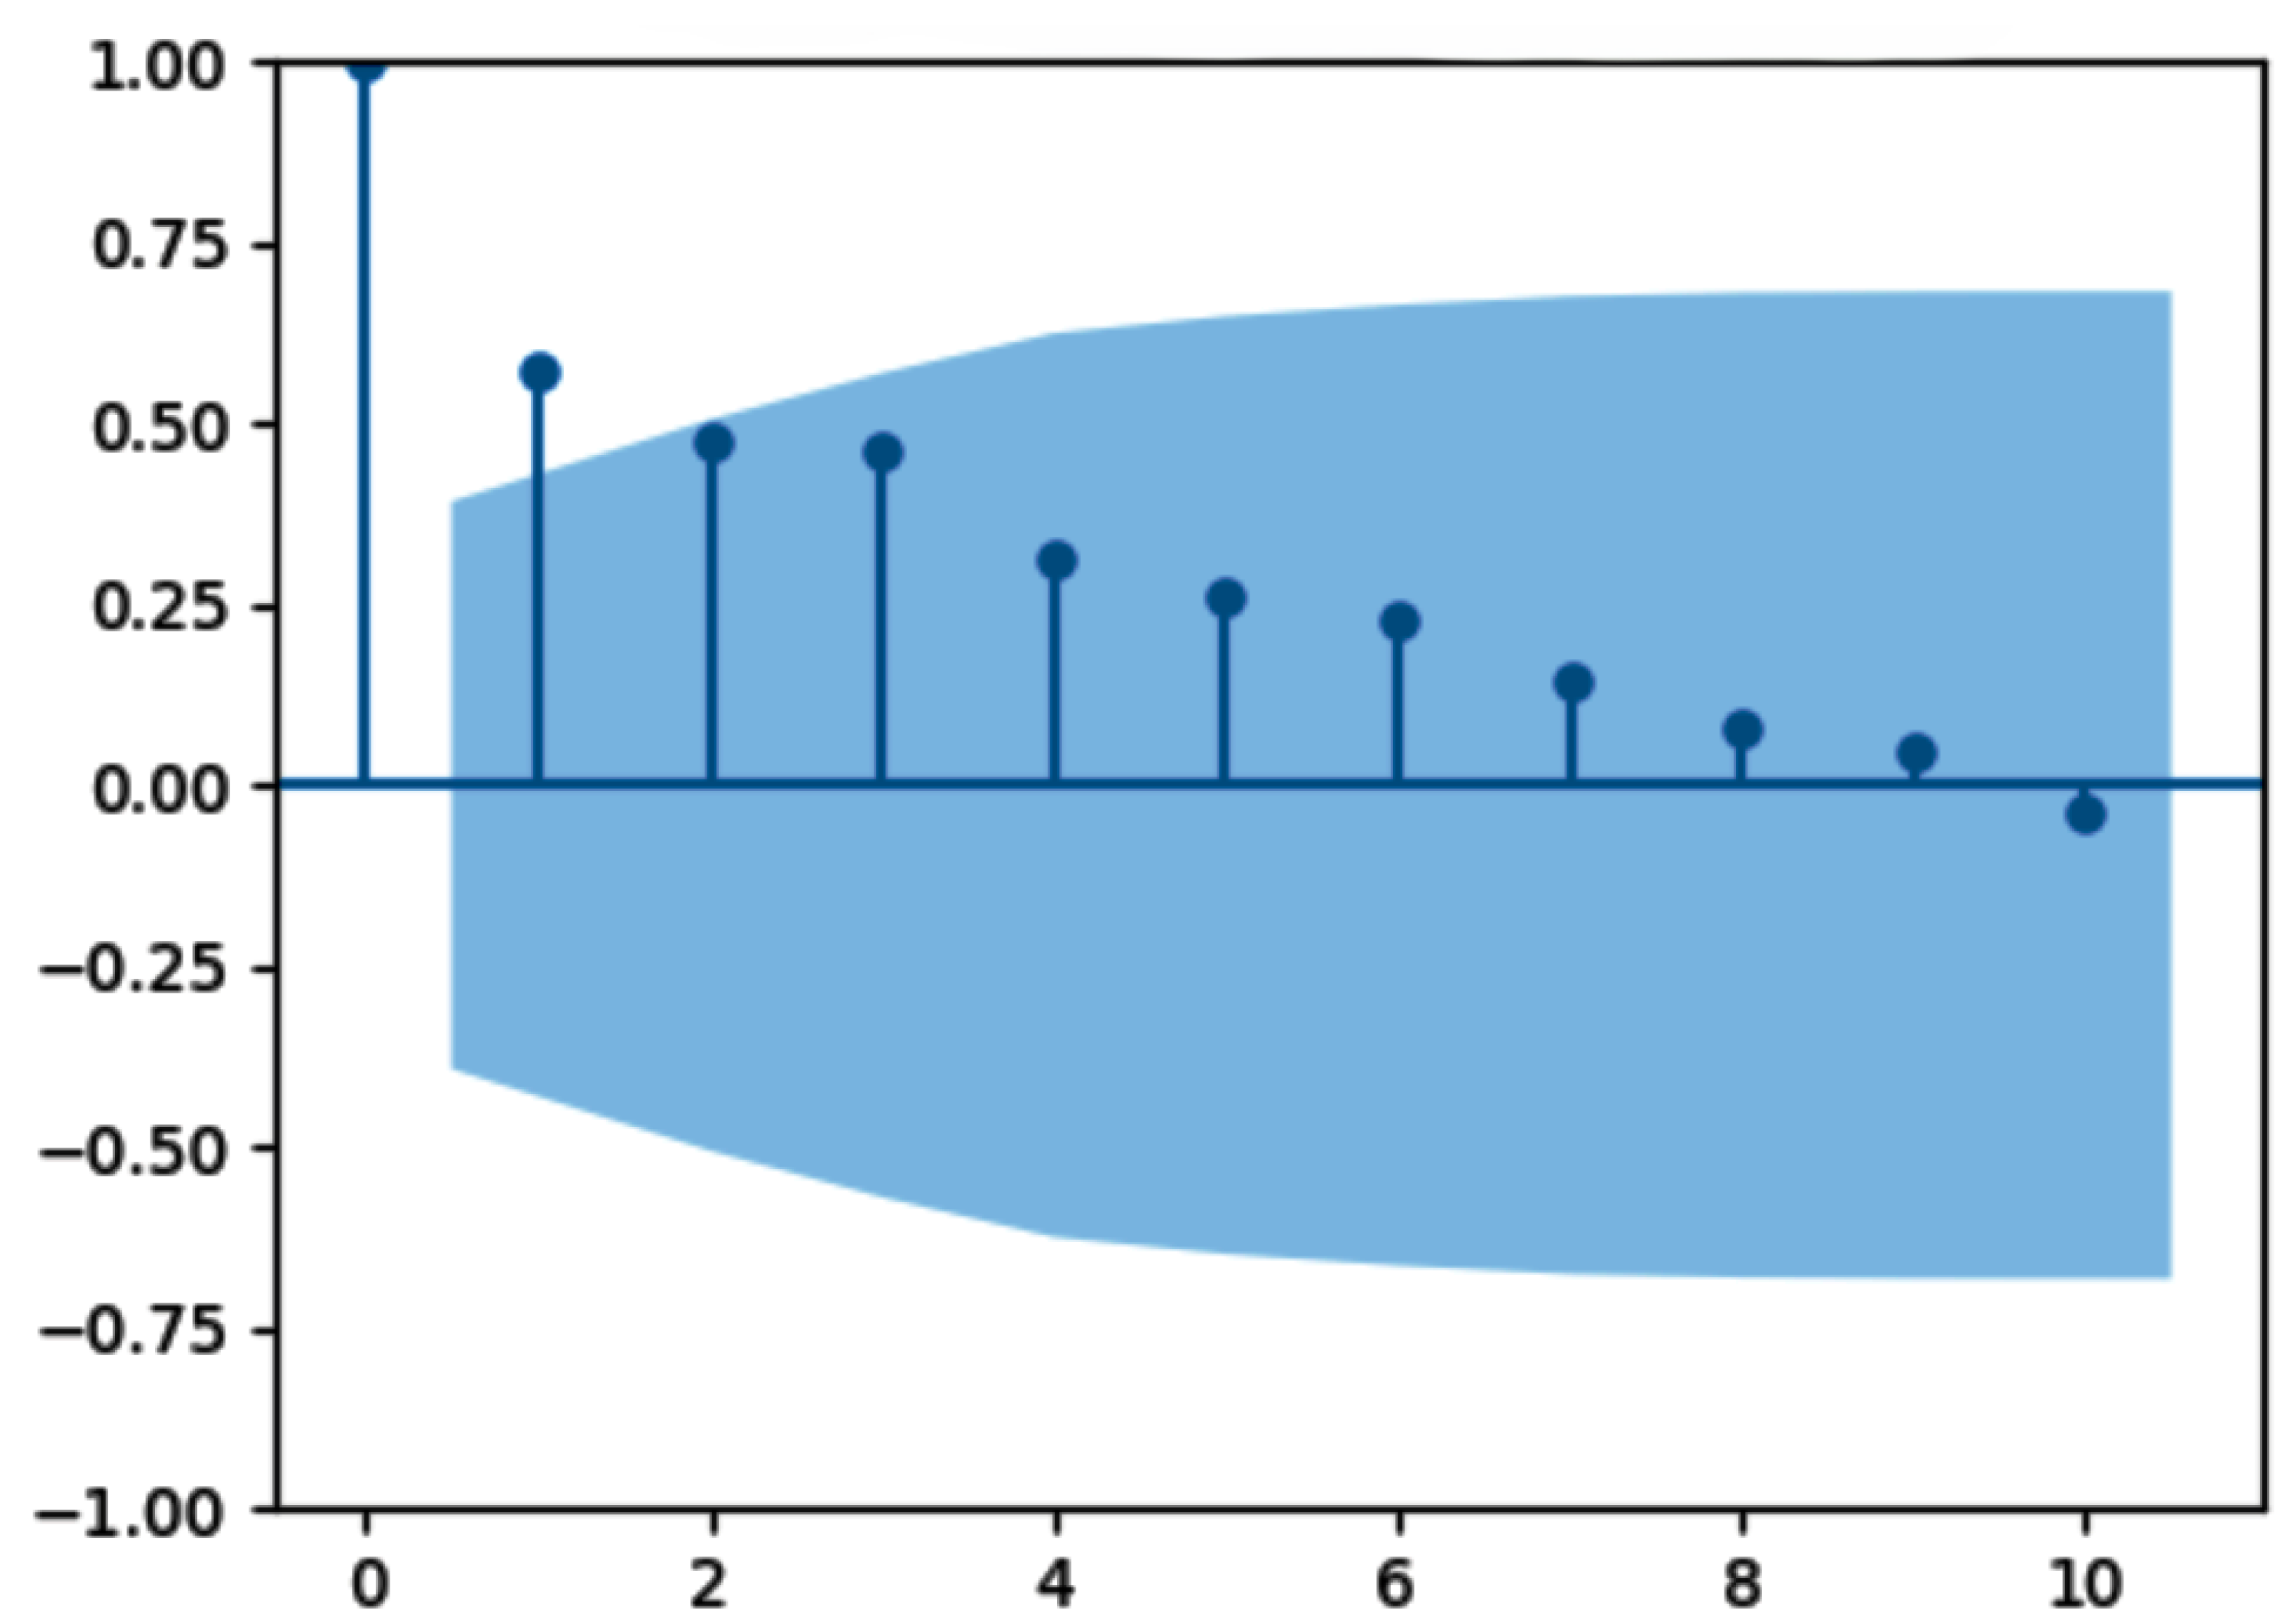
Figure 4.
PACF(Partial Autocorrelation Function).
"The PACF cuts off sharply after lag 1, substantiating that the series is now stationary and indicating that the differenced series follows an AR(1) structure."
Figure 5.
Whole India Mango model price forecast).
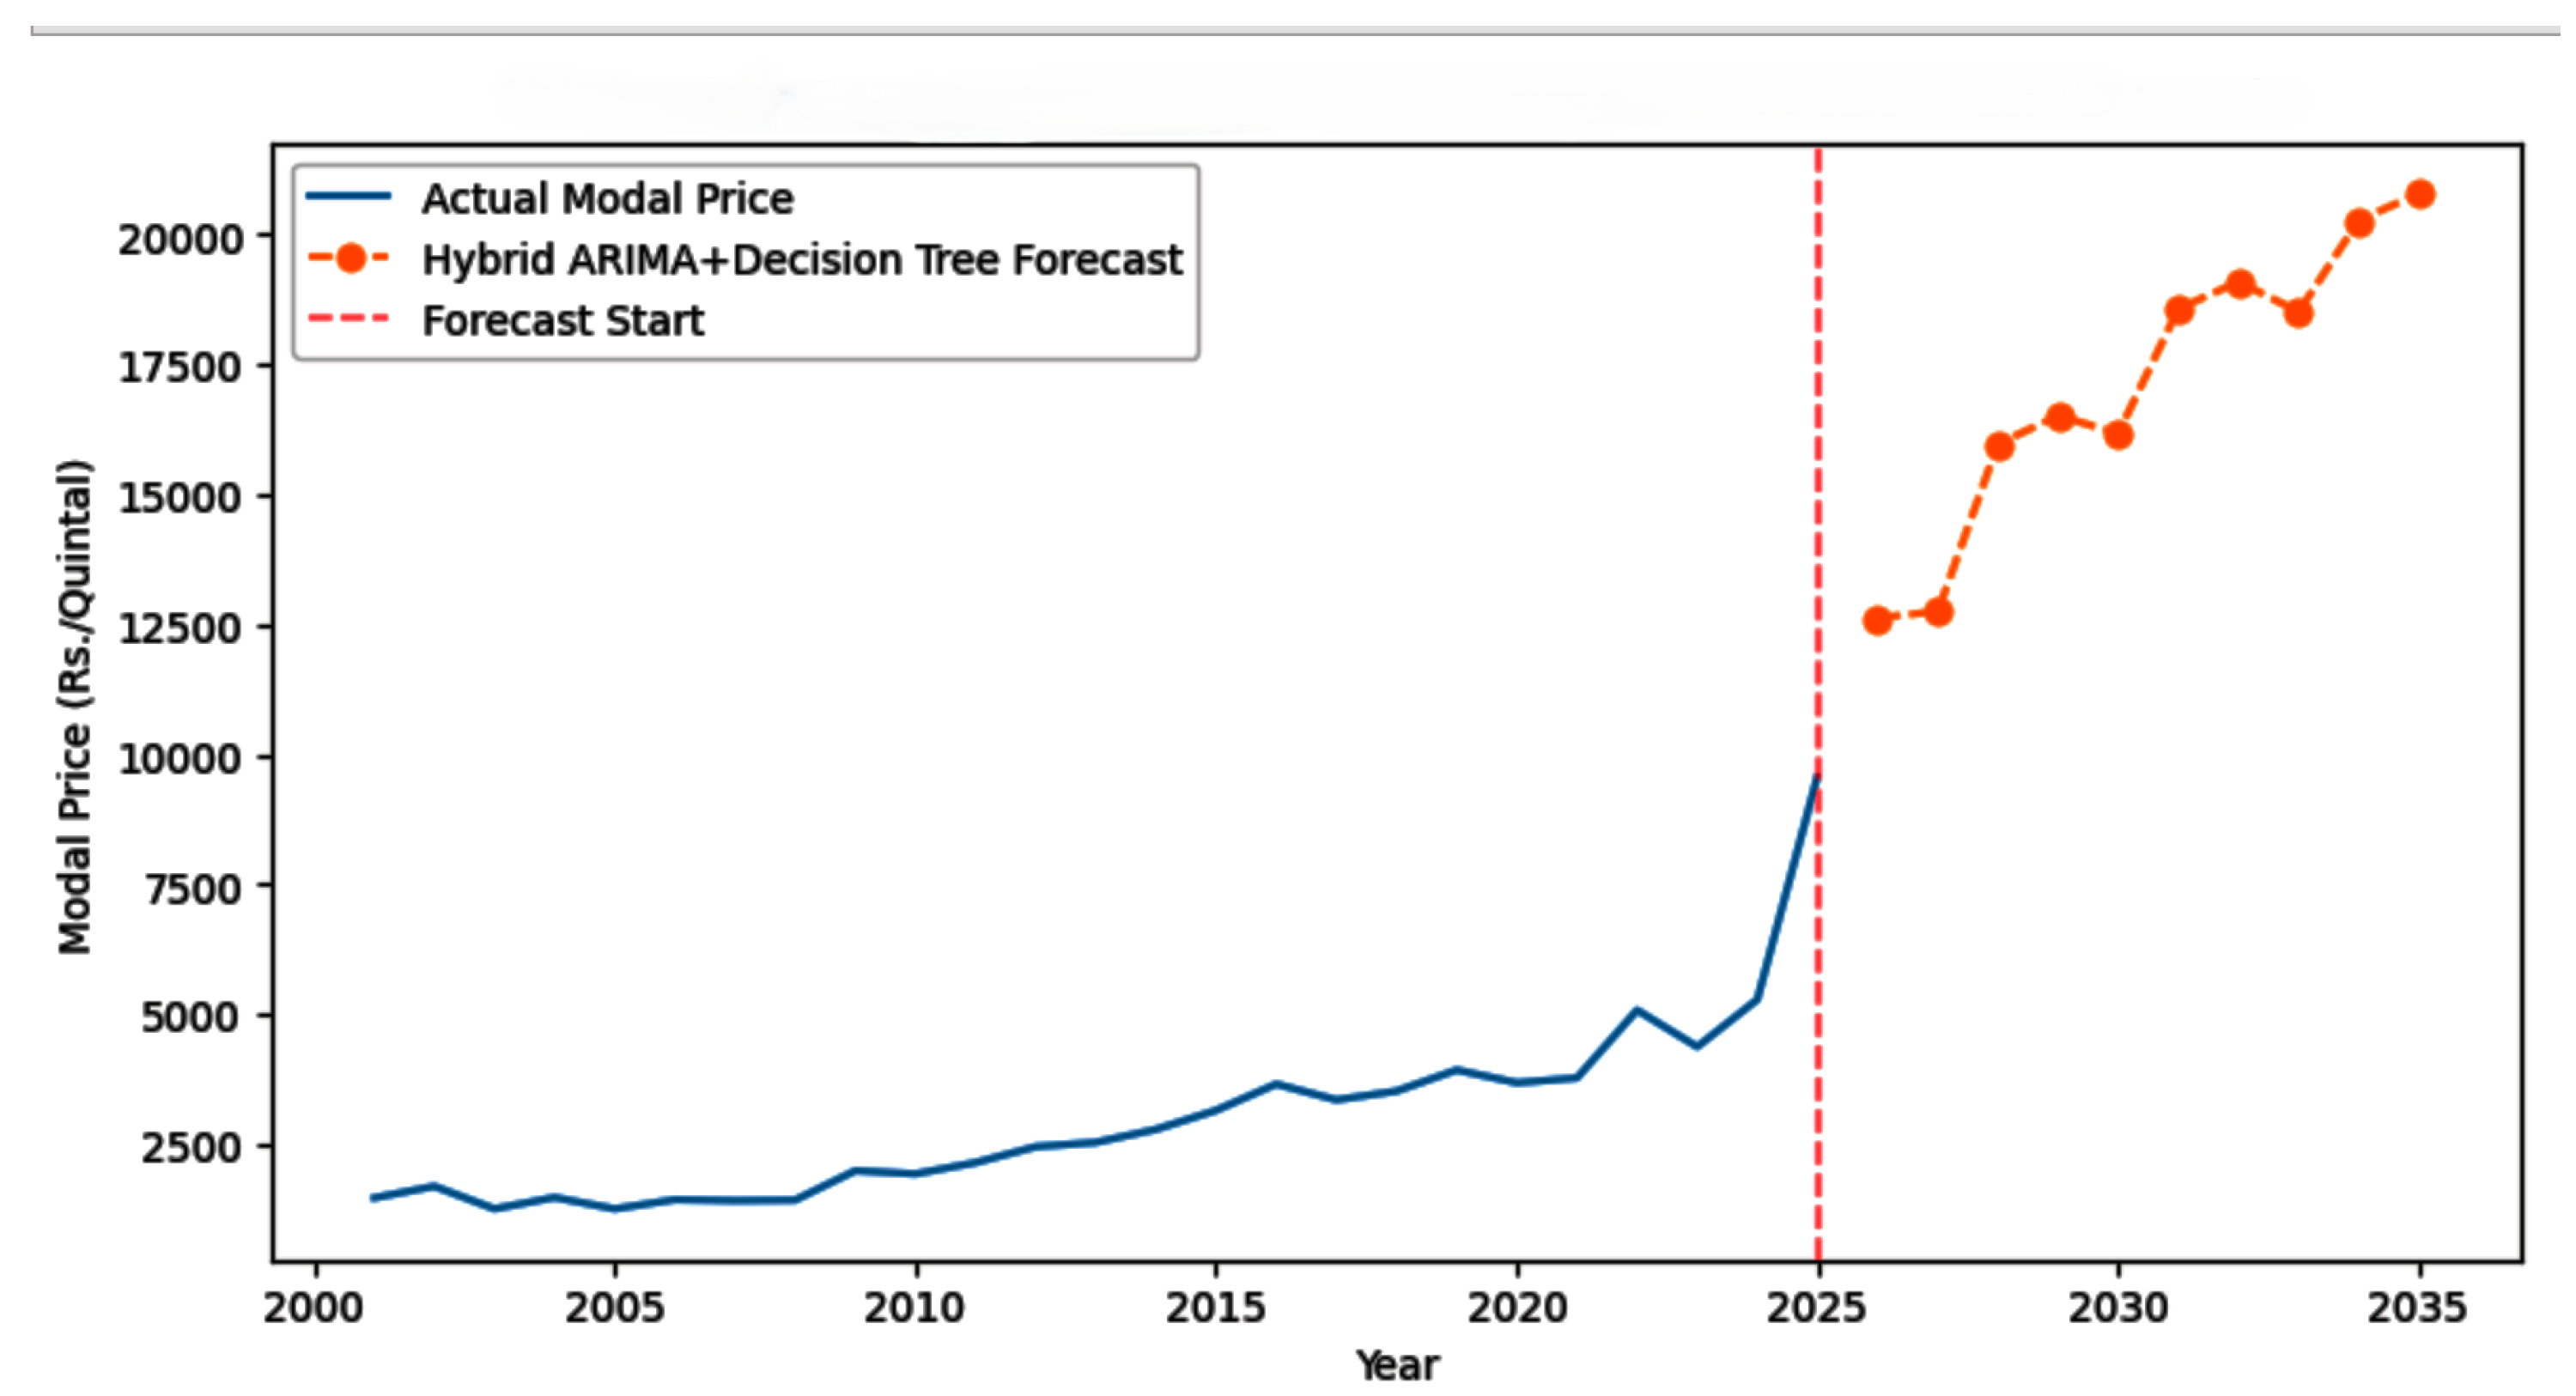
Figure 6.
Comparison of AIC and BIC).
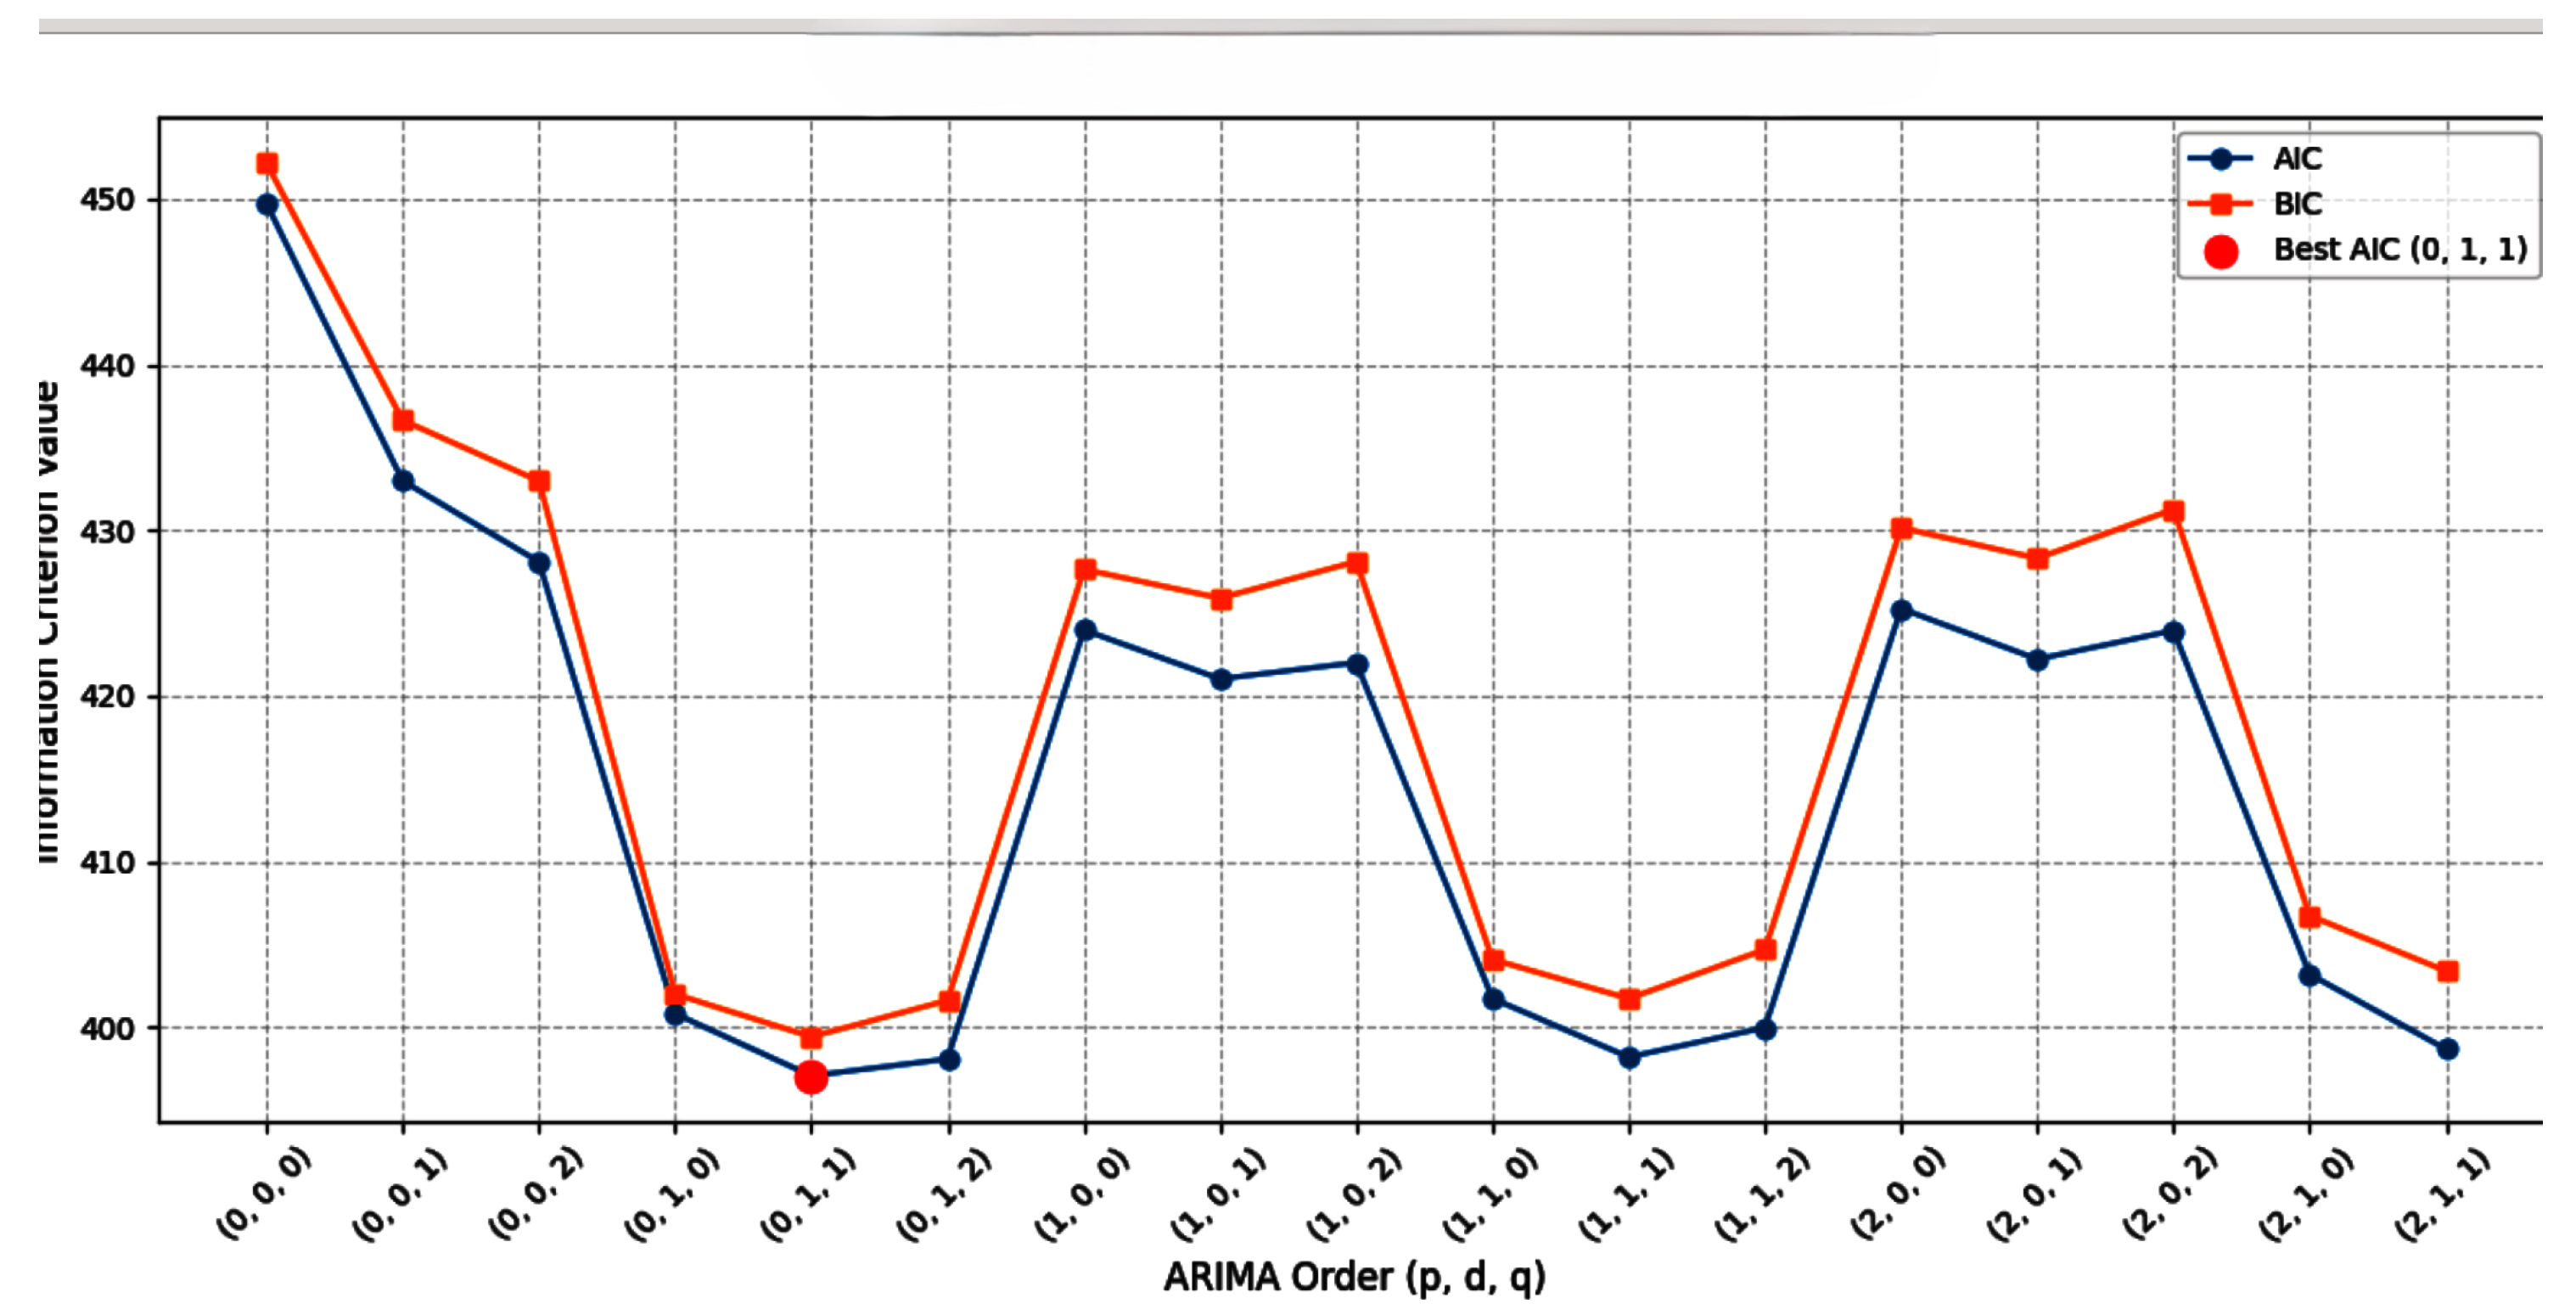
Table 3.
Table 2. Identification of ARIMA best model.
| ARIMA Model order | order(011) | order(012) | order(111) | order(211) | order(212) | order(112) |
|---|---|---|---|---|---|---|
| AIC | 397.064107 | 398.082520 | 398.192113 | 398.678592 | 399.714501 | 399.968077 |
| BIC | 399.420215 | 401.616681 | 401.726275 | 403.390807 | 405.604770 | 404.680293 |
| Time | 0.006 | 0.009 | 0.013 | 0.012 | 0.034 | 0.014 |
Table 4.
Whole India Mango Modal Price Forecast until 2035 (Rs./Quintal).
| S.no | Year | Hybrid ARIMA DT Forecasting |
|---|---|---|
| 1 | 2026 | 12630.112316 |
| 2 | 2027 | 12754.083696 |
| 3 | 2028 | 15976.008736 |
| 4 | 2029 | 16516.039232 |
| 5 | 2030 | 16180.946513 |
| 6 | 2031 | 18576.680938 |
| 7 | 2032 | 19094.206088 |
| 8 | 2033 | 18519.158104 |
| 9 | 2034 | 20276.976371 |
| 9 | 2035 | 20795.247673 |
Table 5.
Whole India Hybrid ARIMA + Decision Tree Accuracy.
| MAE | MSE | RMSE | RMAPE | R2_Score |
|---|---|---|---|---|
| 0.000 | 0.000 | 0.0000 | 1 |
4.2. Long-Shrot-Trem Memory(LSTM) Model:
To studies the future mango model price until 2035 (Rs./Quintal A deep learning technique using the LSTM neural network architectonics was employed for time series analysis, which remained below Rs. 10,000/Quintal until about 2025. A period of hyper-volatility, marked by a approximately, almost vertical spike in the modal price, is directly projected by the LSTM forecast (in orange). By 2030, the price is awaited to have risen significantly from its historical range to exceed Rs. 80,000/Quintal. The price will stage and stabilize at this much elevated value through the predicted end date of 2035, according to the model, after this sharp and haste.
Figure 7.
Superfit LSTM training).
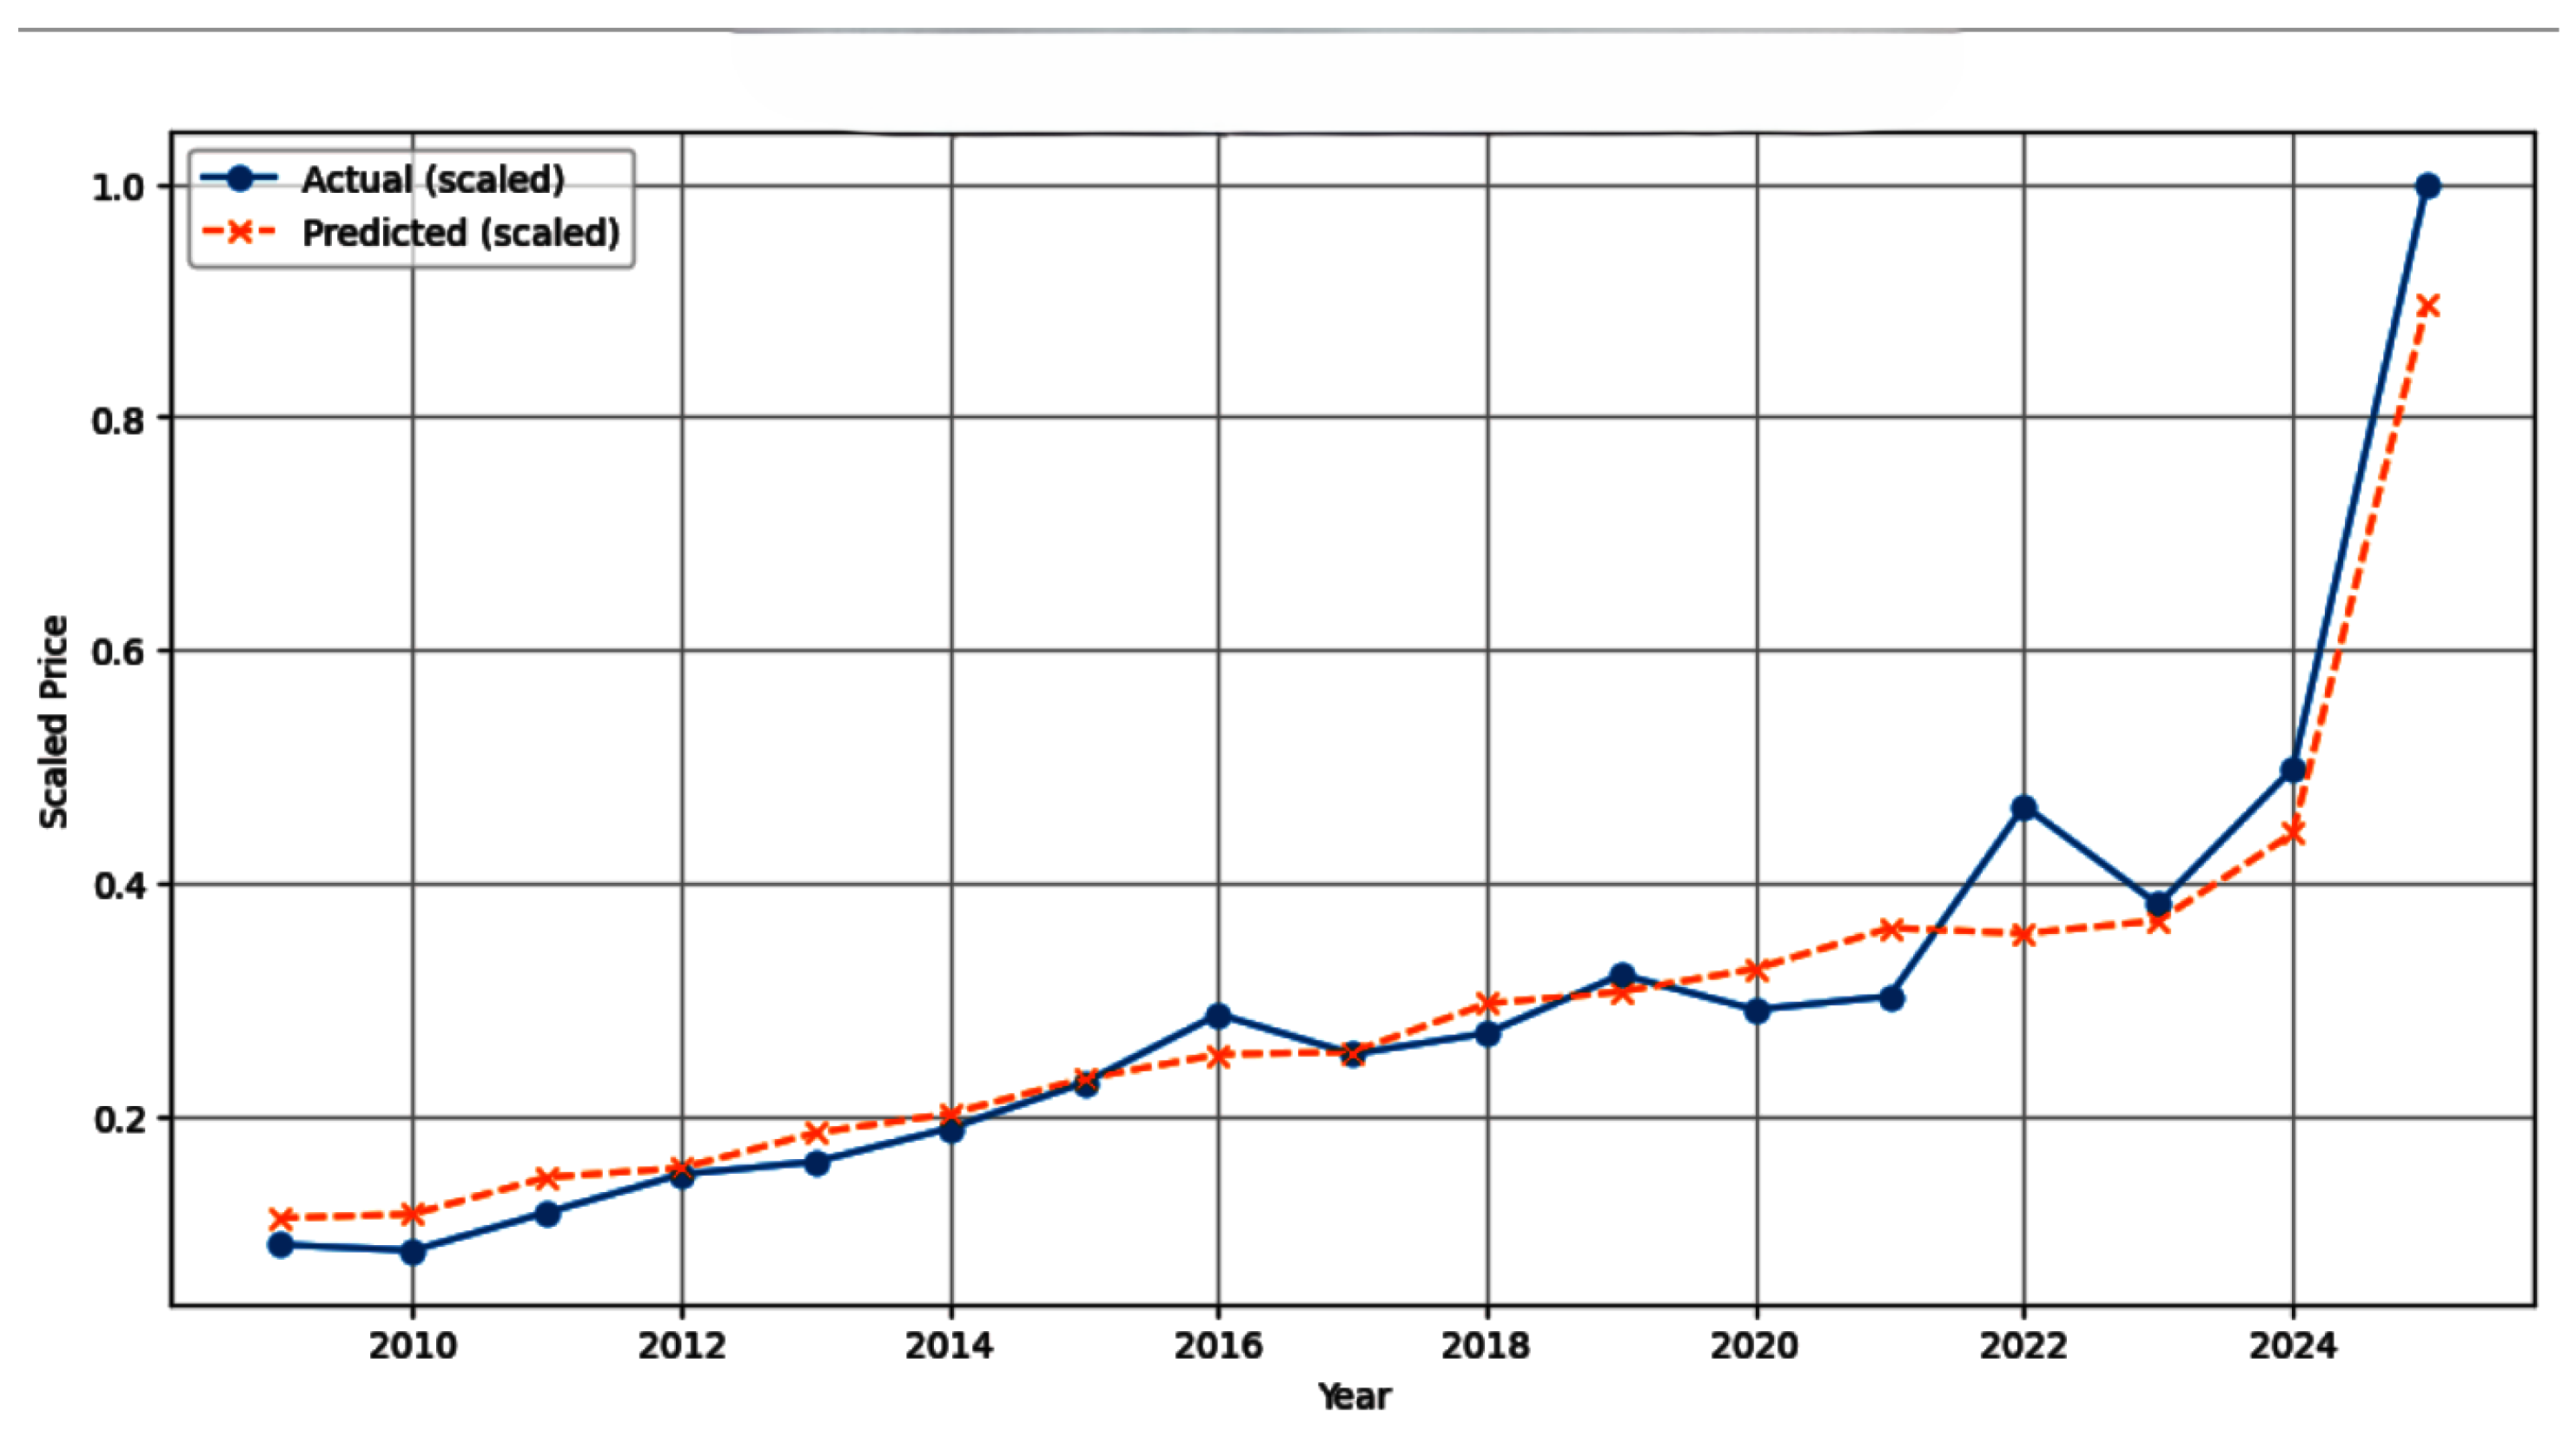
Figure 8.
LSTM forecast for mango model.
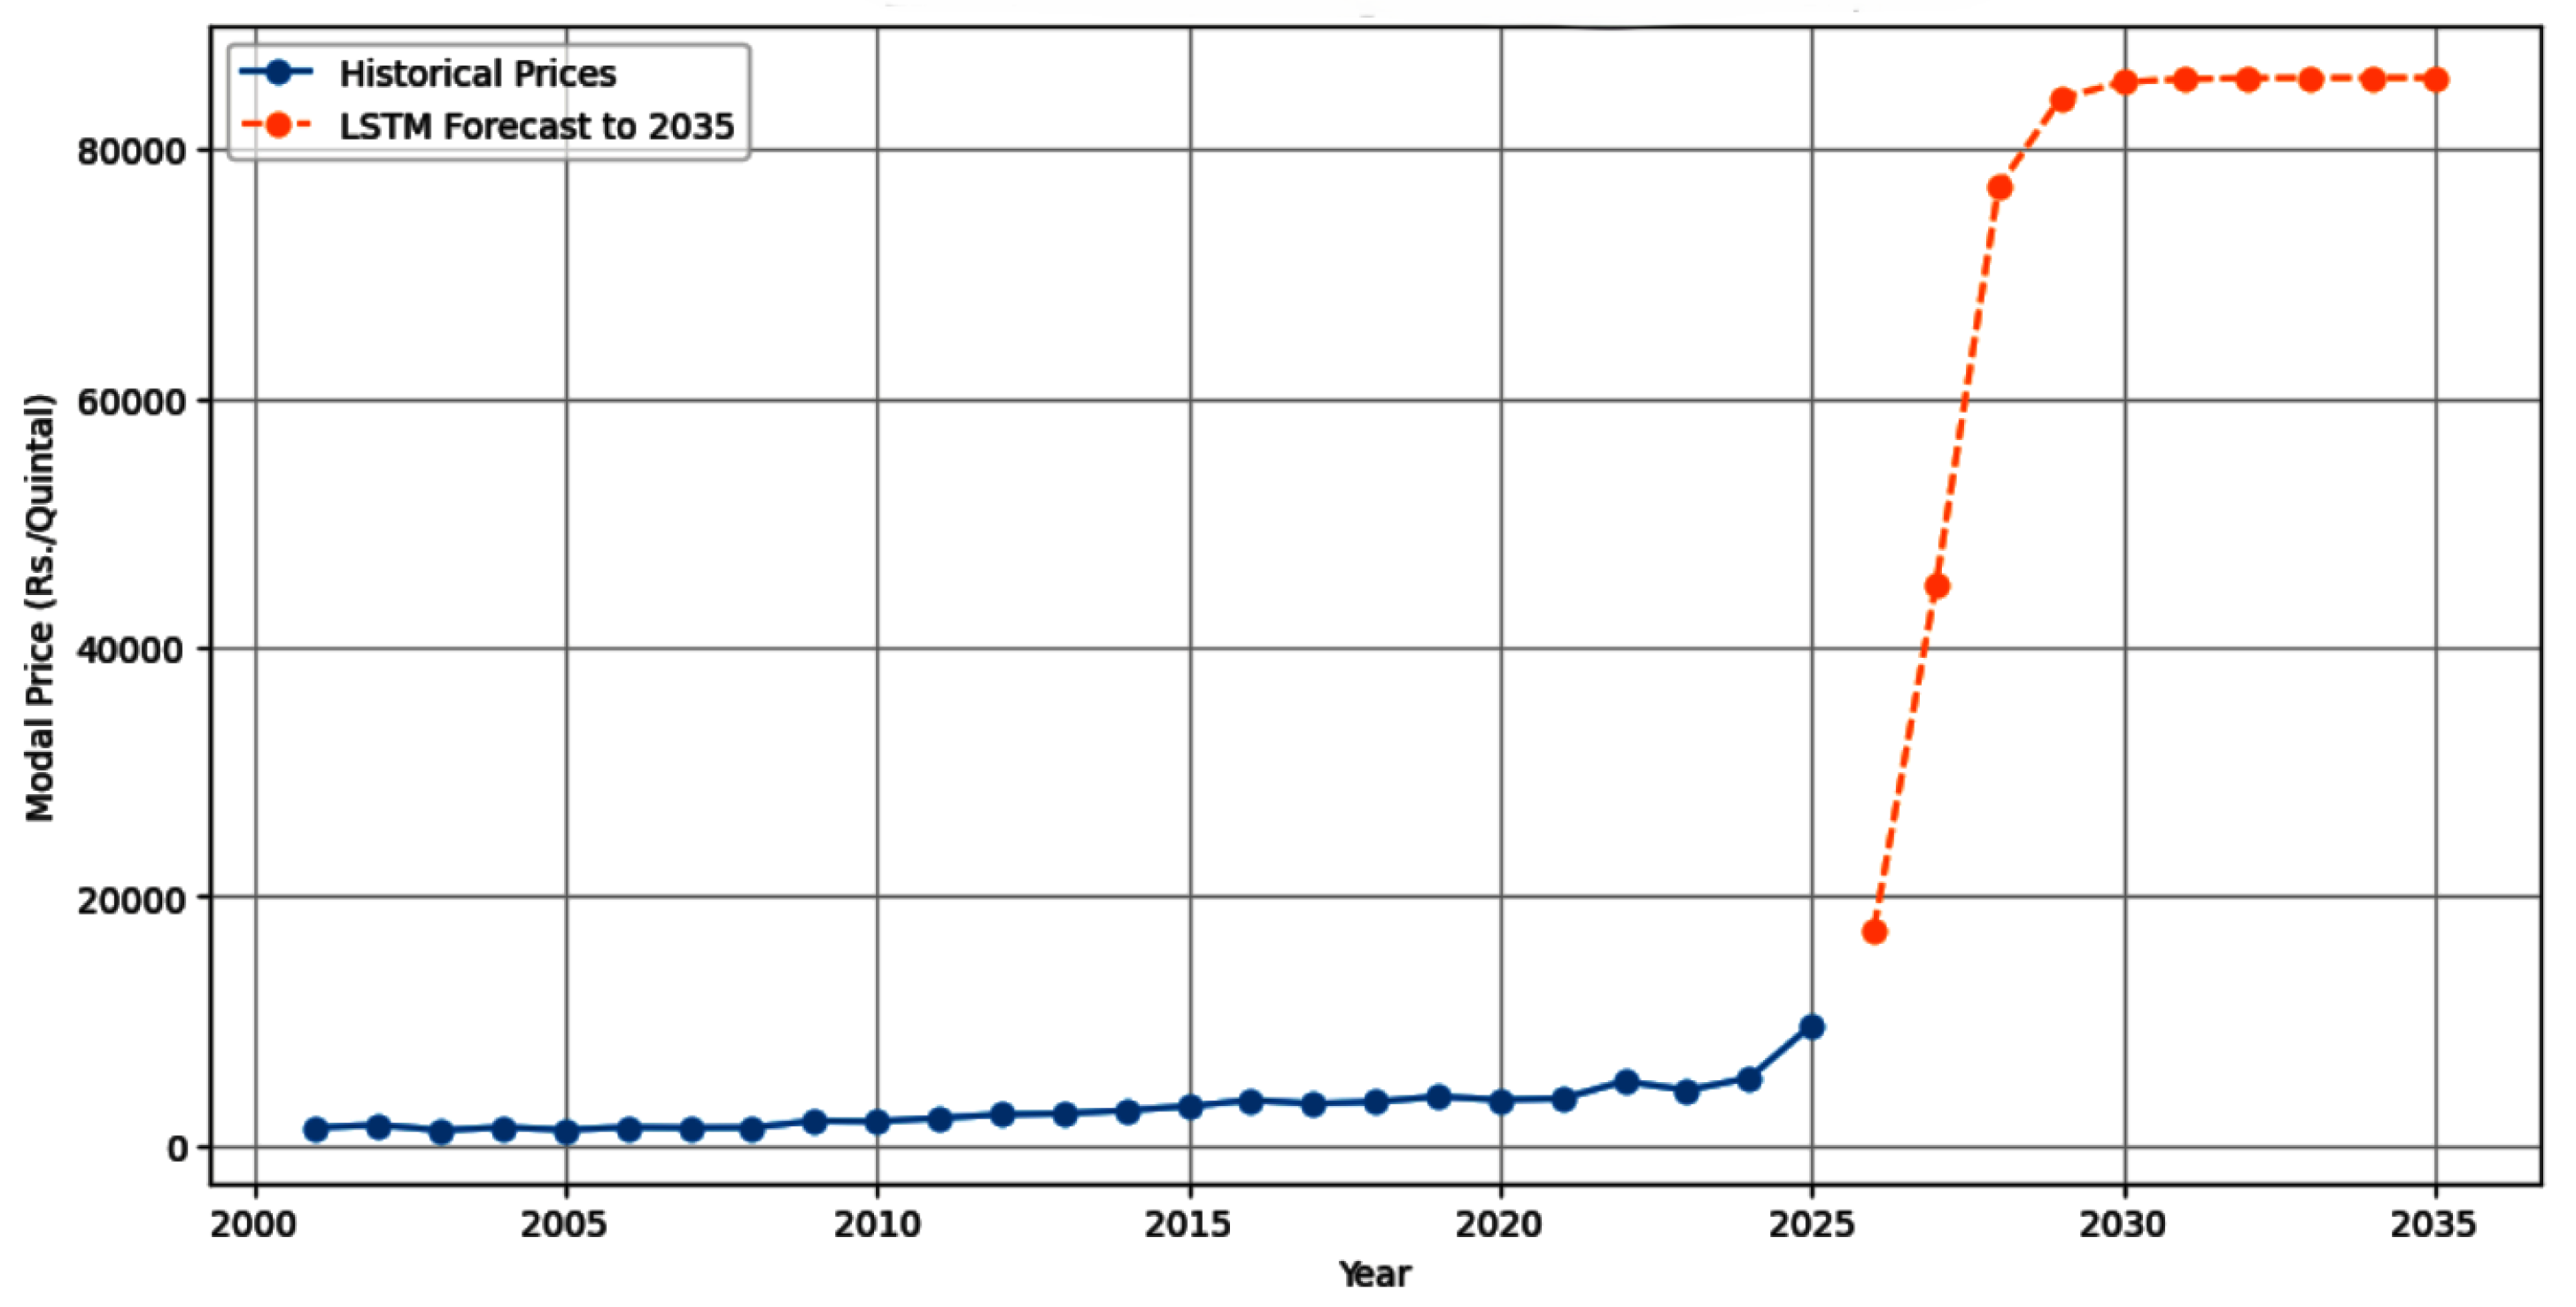
Table 6.
Super-Fit LSTM Training Performance(Scaled Data).
| MSE | RMSE | MAE | R2_Score |
|---|---|---|---|
| 0.0021 | 0.0458 | 0.0342 | 0.9529 |
Table 7.
LSTM Mango Modal Price Forecast upto 2035 (Rs./Quintal).
| S.no | Year | Forecasted_price |
|---|---|---|
| 1 | 2026 | 17361.833984 |
| 2 | 2027 | 45129.320312 |
| 3 | 2028 | 76947.750000 |
| 4 | 2029 | 84088.367188 |
| 5 | 2030 | 85366.273438 |
| 6 | 2031 | 85612.523438 |
| 7 | 2032 | 85682.585938 |
| 8 | 2033 | 85701.640625 |
| 9 | 2034 | 85706.640625 |
| 10 | 2035 | 85707.757812 |
4.3. Hybrid Error Trend Seasonality(ETS)
The residue modelling principle, which deconstructs time series data, is the foundation of the ETS + SVM model: The analytical tool known as the ETS (Error, Trend, Seasonality) model is in charge of determine the linear and harmonious structural patterns in the historical price data, such as a congruous upward trend over an extended period of time or predictable seasonal variation. Support Vector Machine (SVM): It is assumed that the non-linear, irregular, or volatile patterns are included in the error component, which is the surviving fluctuation that ETS was unable to explain (referred to as the residuals). These intricate, non-linear residuals are then modelled and foretell using the SVM (used here for regression, or SVR).
Figure 9.
Hybrid ETS+SVM.
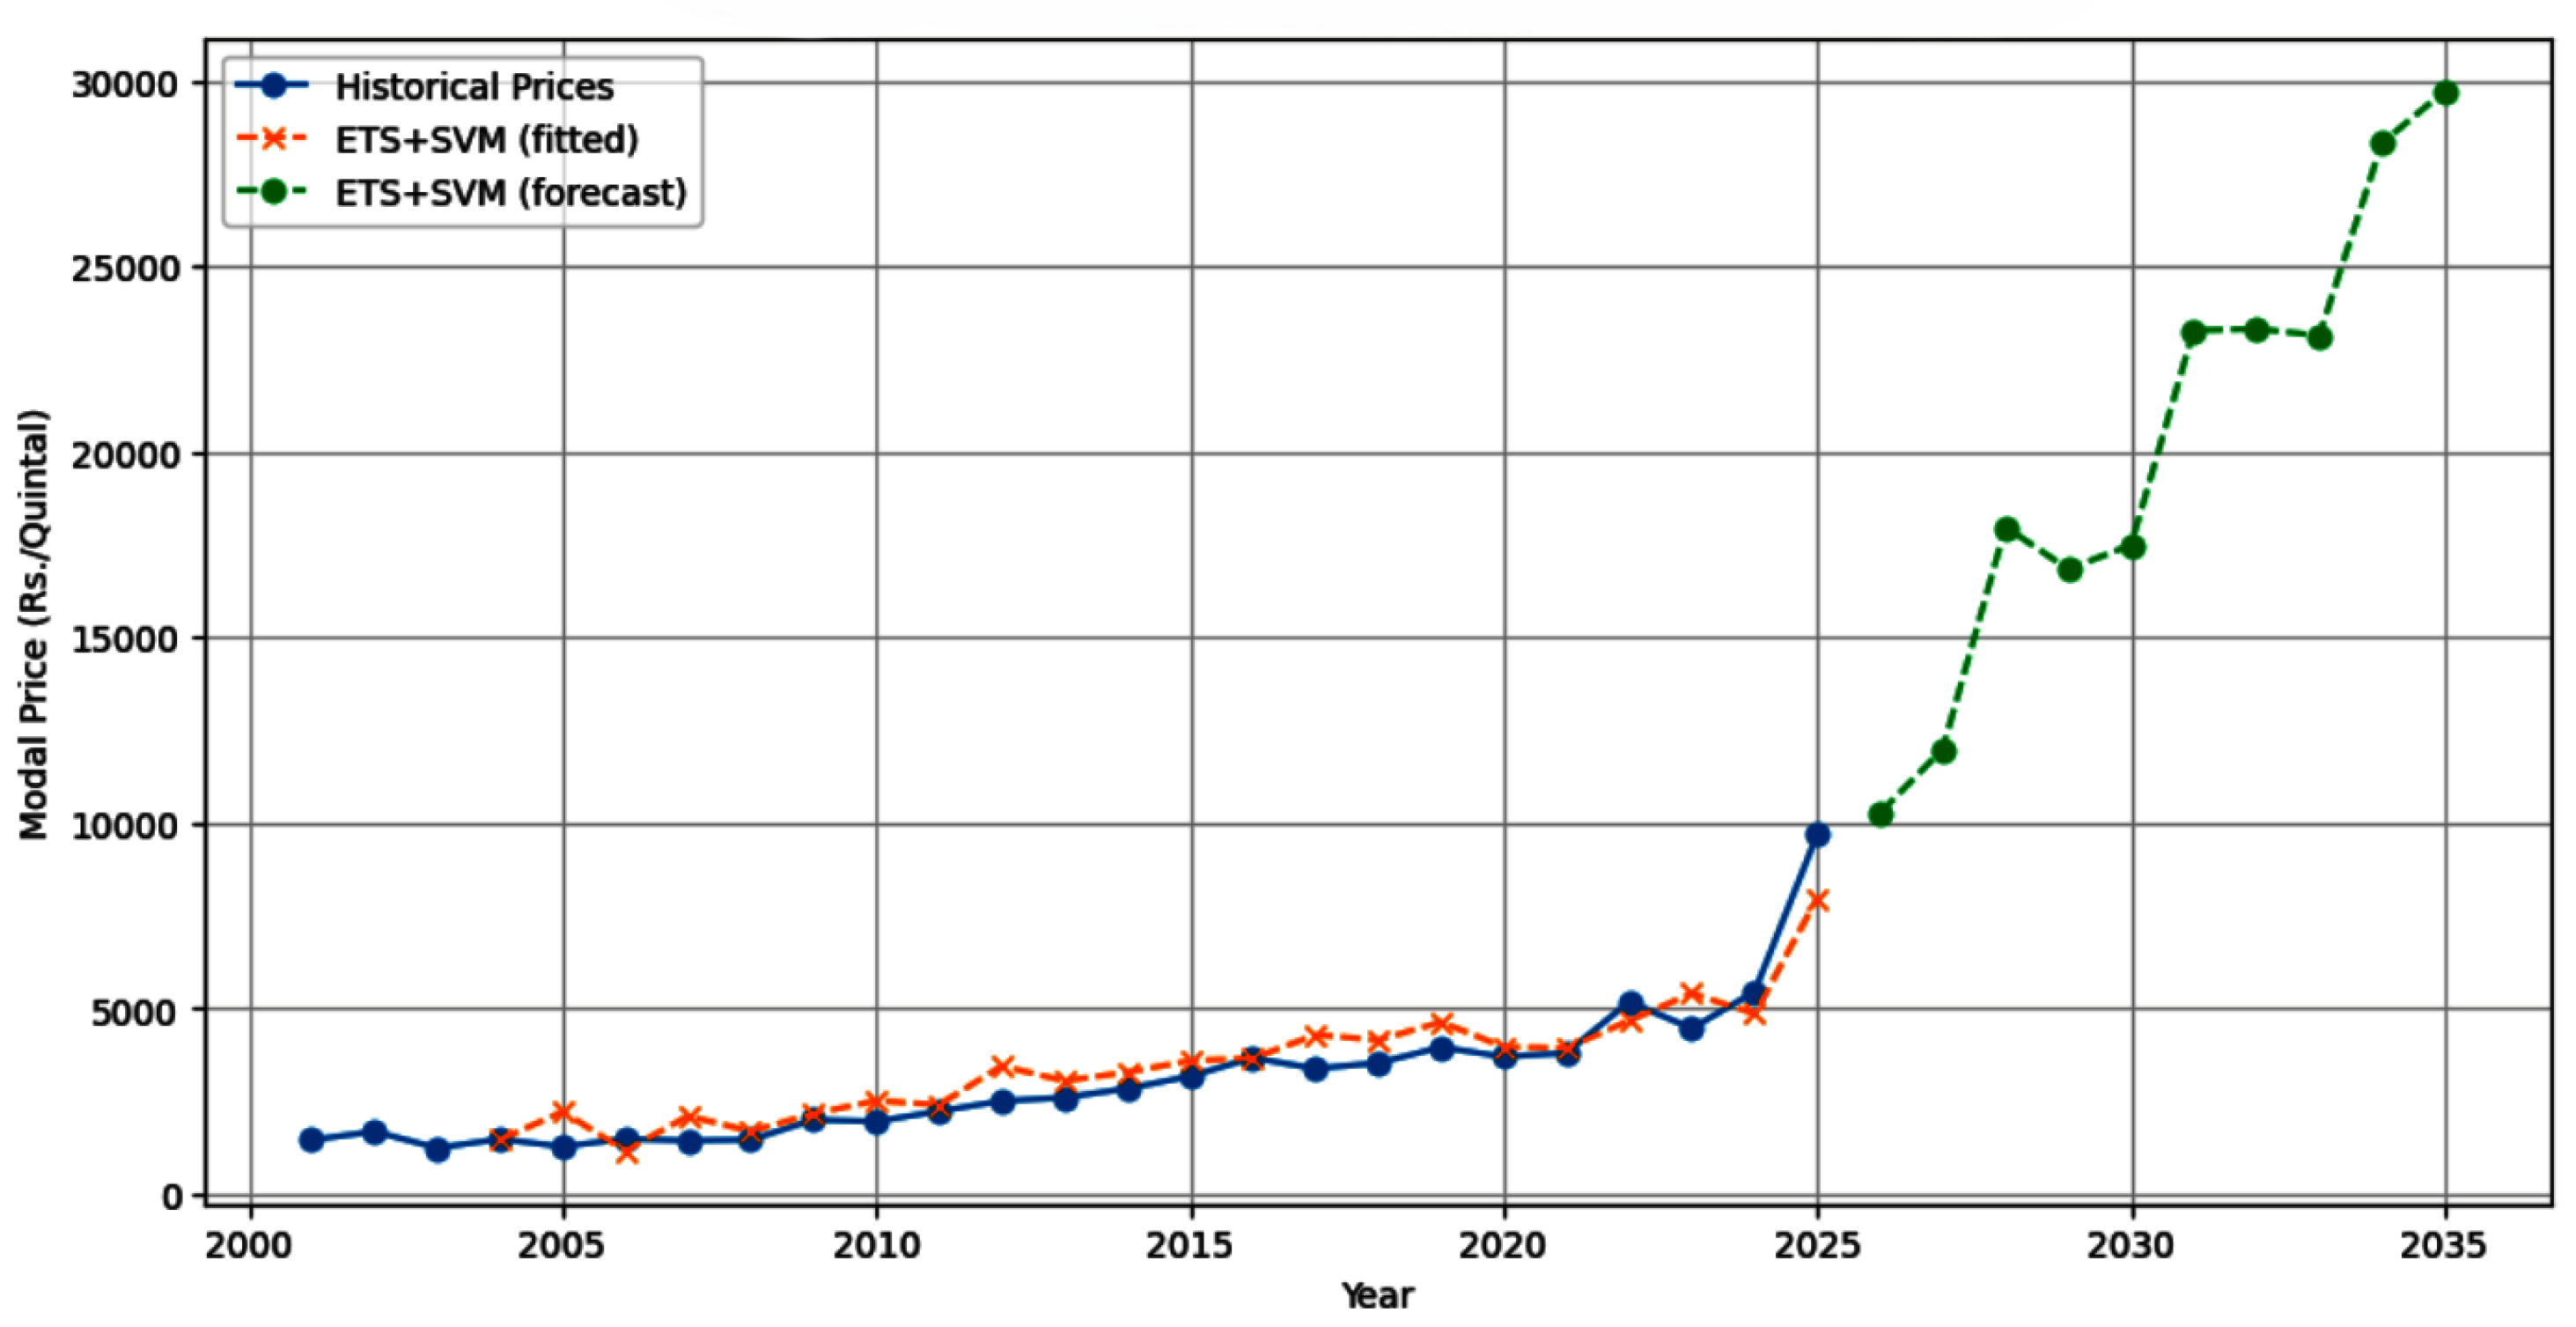
Table 8.
Adjusted ETS+SVM Hybrid Training performance.
| MSE | RMSE | MAE | R2_Score | NRAMSE mean | NRMSE range | SMAPE |
|---|---|---|---|---|---|---|
| 0.006 | 0.078 | 0.063 | 0.873 | 0.335 | 0.078 | 0.465 |
4.4. Hybrid ETS -BiLSTM Model:s
The highest degree of risk is indicated by the Hybrid ETS + BiLSTM forecast. Its discovery of a price above Rs. 120,000/Quintal along with severe turbulence highlights how the sophisticated deep learning analysis reads recent market events as the start of a structural crisis in which supply shocks overwhelm market mechanisms, necessitating immediate policy action.
Figure 10.
Hybrid ETS+BiLSTM Forecast for mango model price.
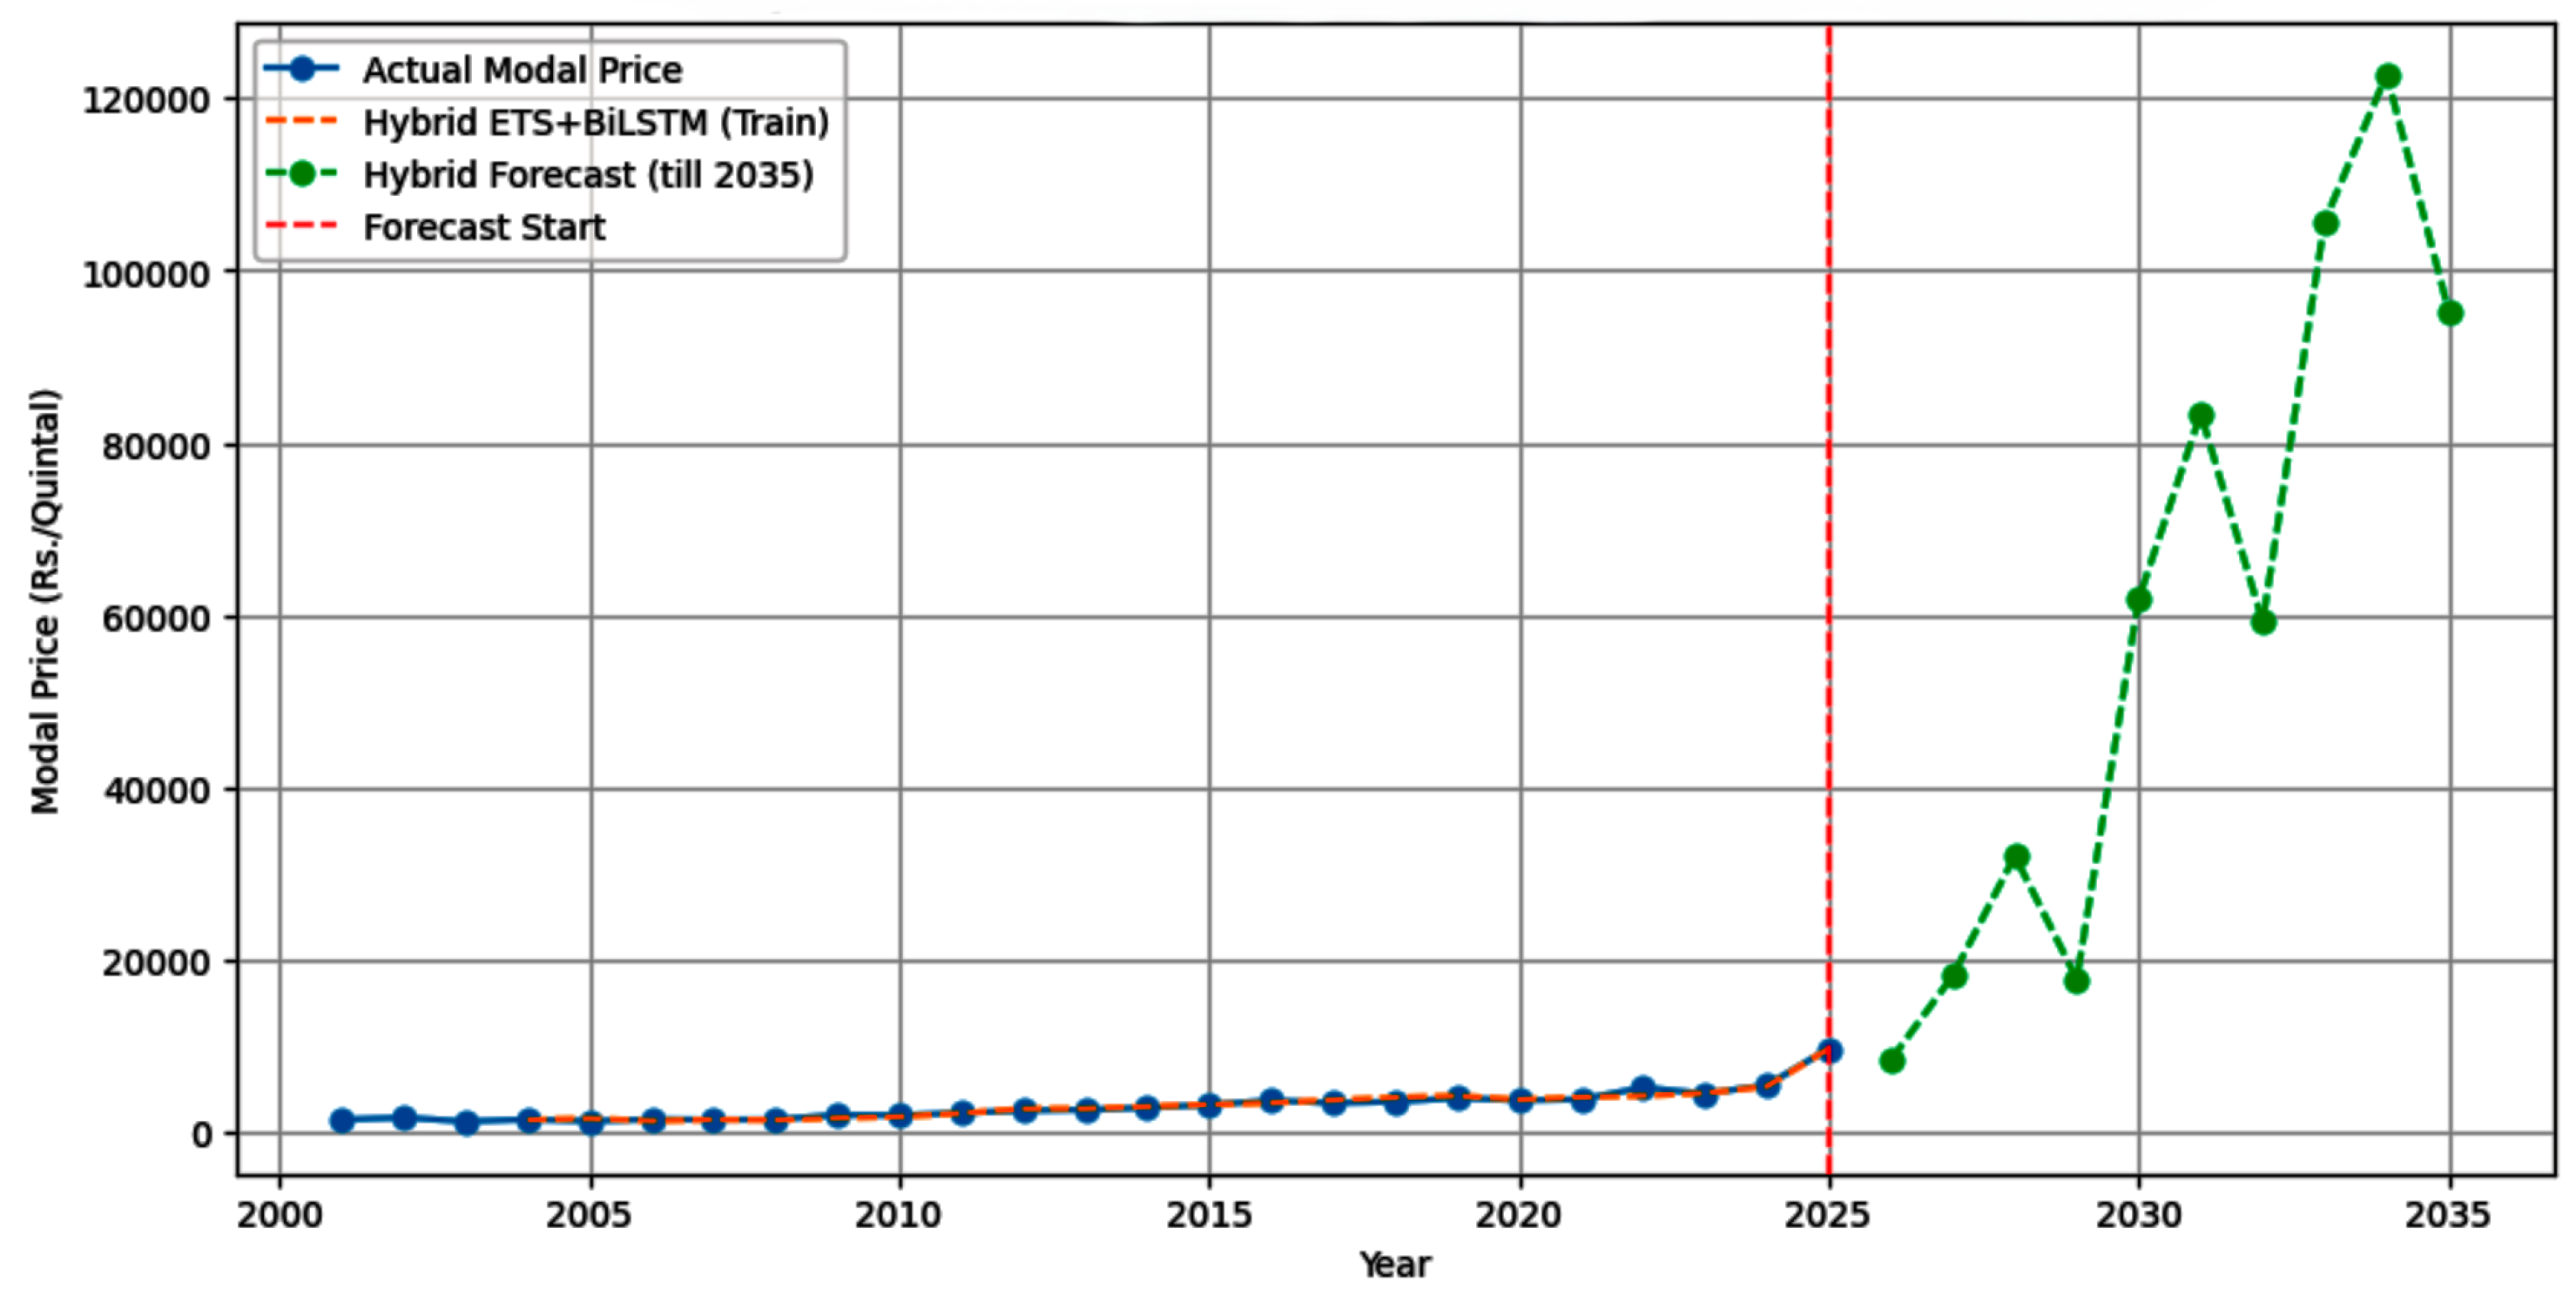
Table 9.
Hybrid ETS+BiLSTM Accuracy.
| MAE | MSE | RMSE | R2_Score |
|---|---|---|---|
| 0.024381 | 0.001188 | 0.034466 | 0.975072 |
Table 10.
Modal Price Forecast upto 2035(Hybrid ETS -BiLSTM).
| S.no | Year | Forecasted_price |
|---|---|---|
| 1 | 2026 | 8389.606955 |
| 2 | 2027 | 18164.456223 |
| 3 | 2028 | 32060.076838 |
| 4 | 2029 | 17785.109728 |
| 5 | 2030 | 61908.443448 |
| 6 | 2031 | 83423.989295 |
| 7 | 2032 | 59219.310578 |
| 8 | 2033 | 105724.14221 |
| 9 | 2034 | 122770.617312 |
| 10 | 2035 | 95345.215007 |
4.5. Attention-LSTM Model:
Methodological Perspective: The Attention mechanism’s ability to fit the historical irregularity quite well (Figure 2) supports its maximal prediction (Figure 1), proposing that the market’s non-linear, uncertain factors are accountable for the most articulate price, Among the numerous models, the Attention-LSTM model predicts the most extreme, super exponential price increase because it focus on the momentous points in the price chronicle The Narrative of Prediction: According to the model, the current price volatility—the "attention-worthy" event—is the beginning of a tragic, ongoing inflationary trend rather than a passing exception.Economic Danger: An maximal food security crisis for this goods is indicated by a price above Rs. 160,000/Quintal, which makes it expensive for almost all population fragments and calls for fast and forceful policy.
Figure 11.
Attention-LSTM Predictions.
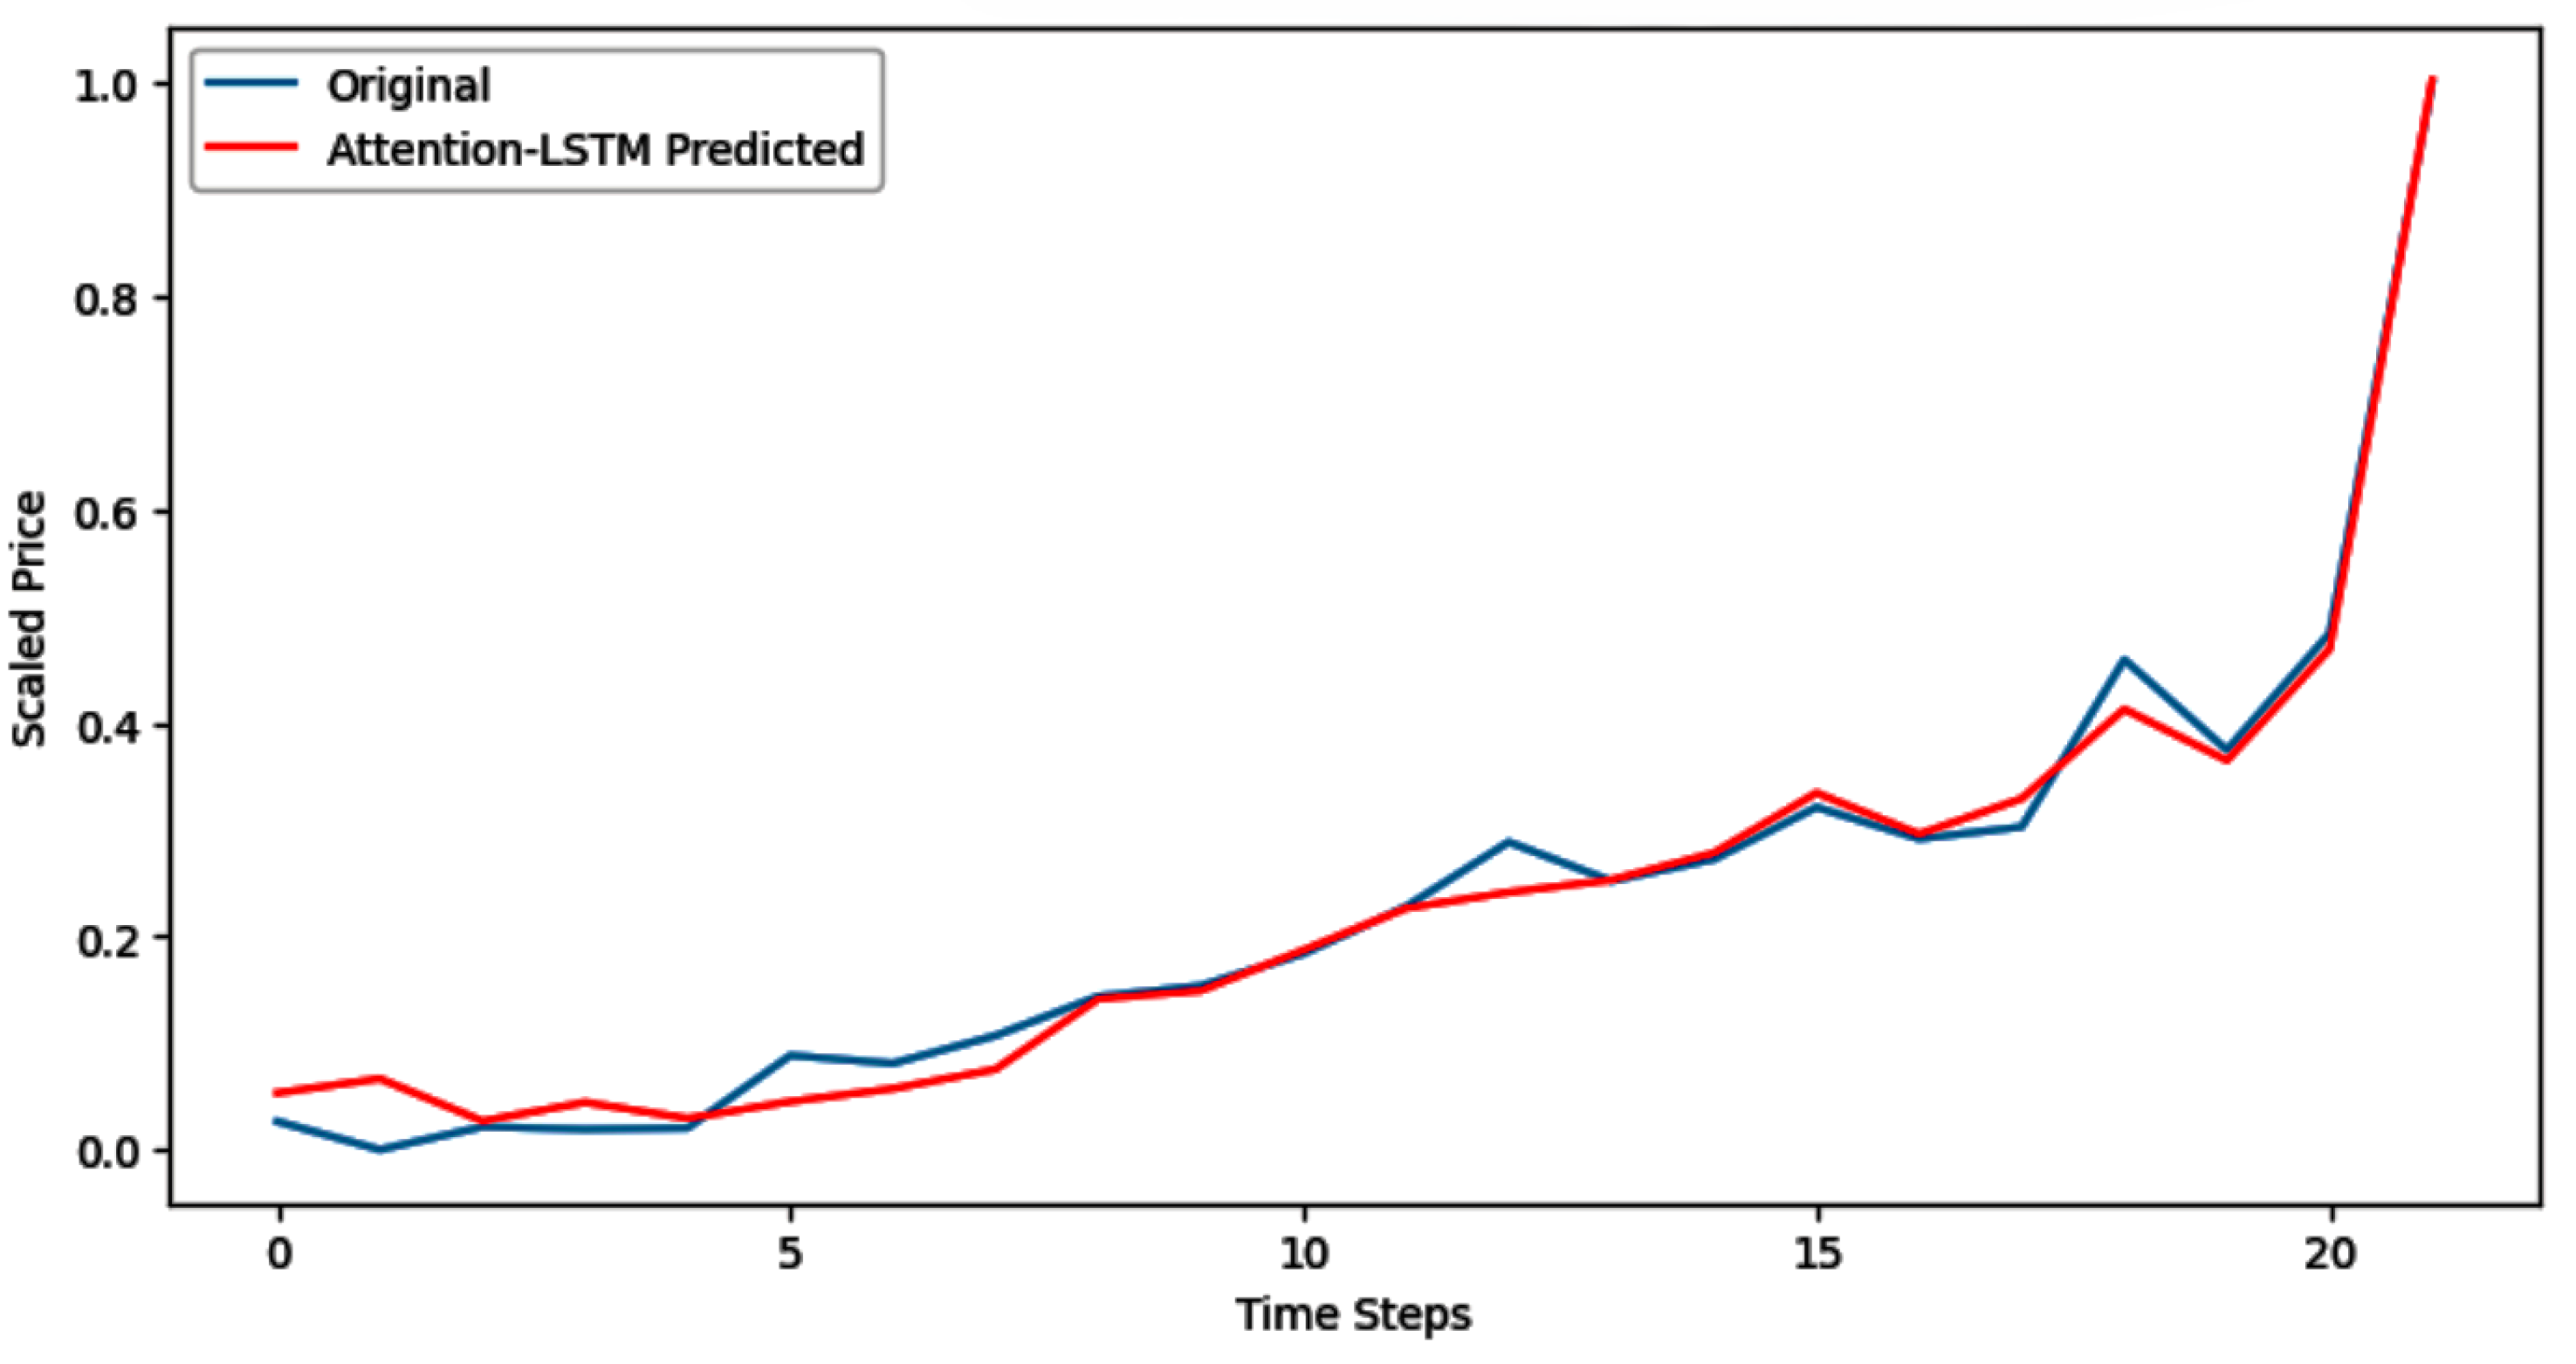
Figure 12.
Mango price forecast up to 2035.
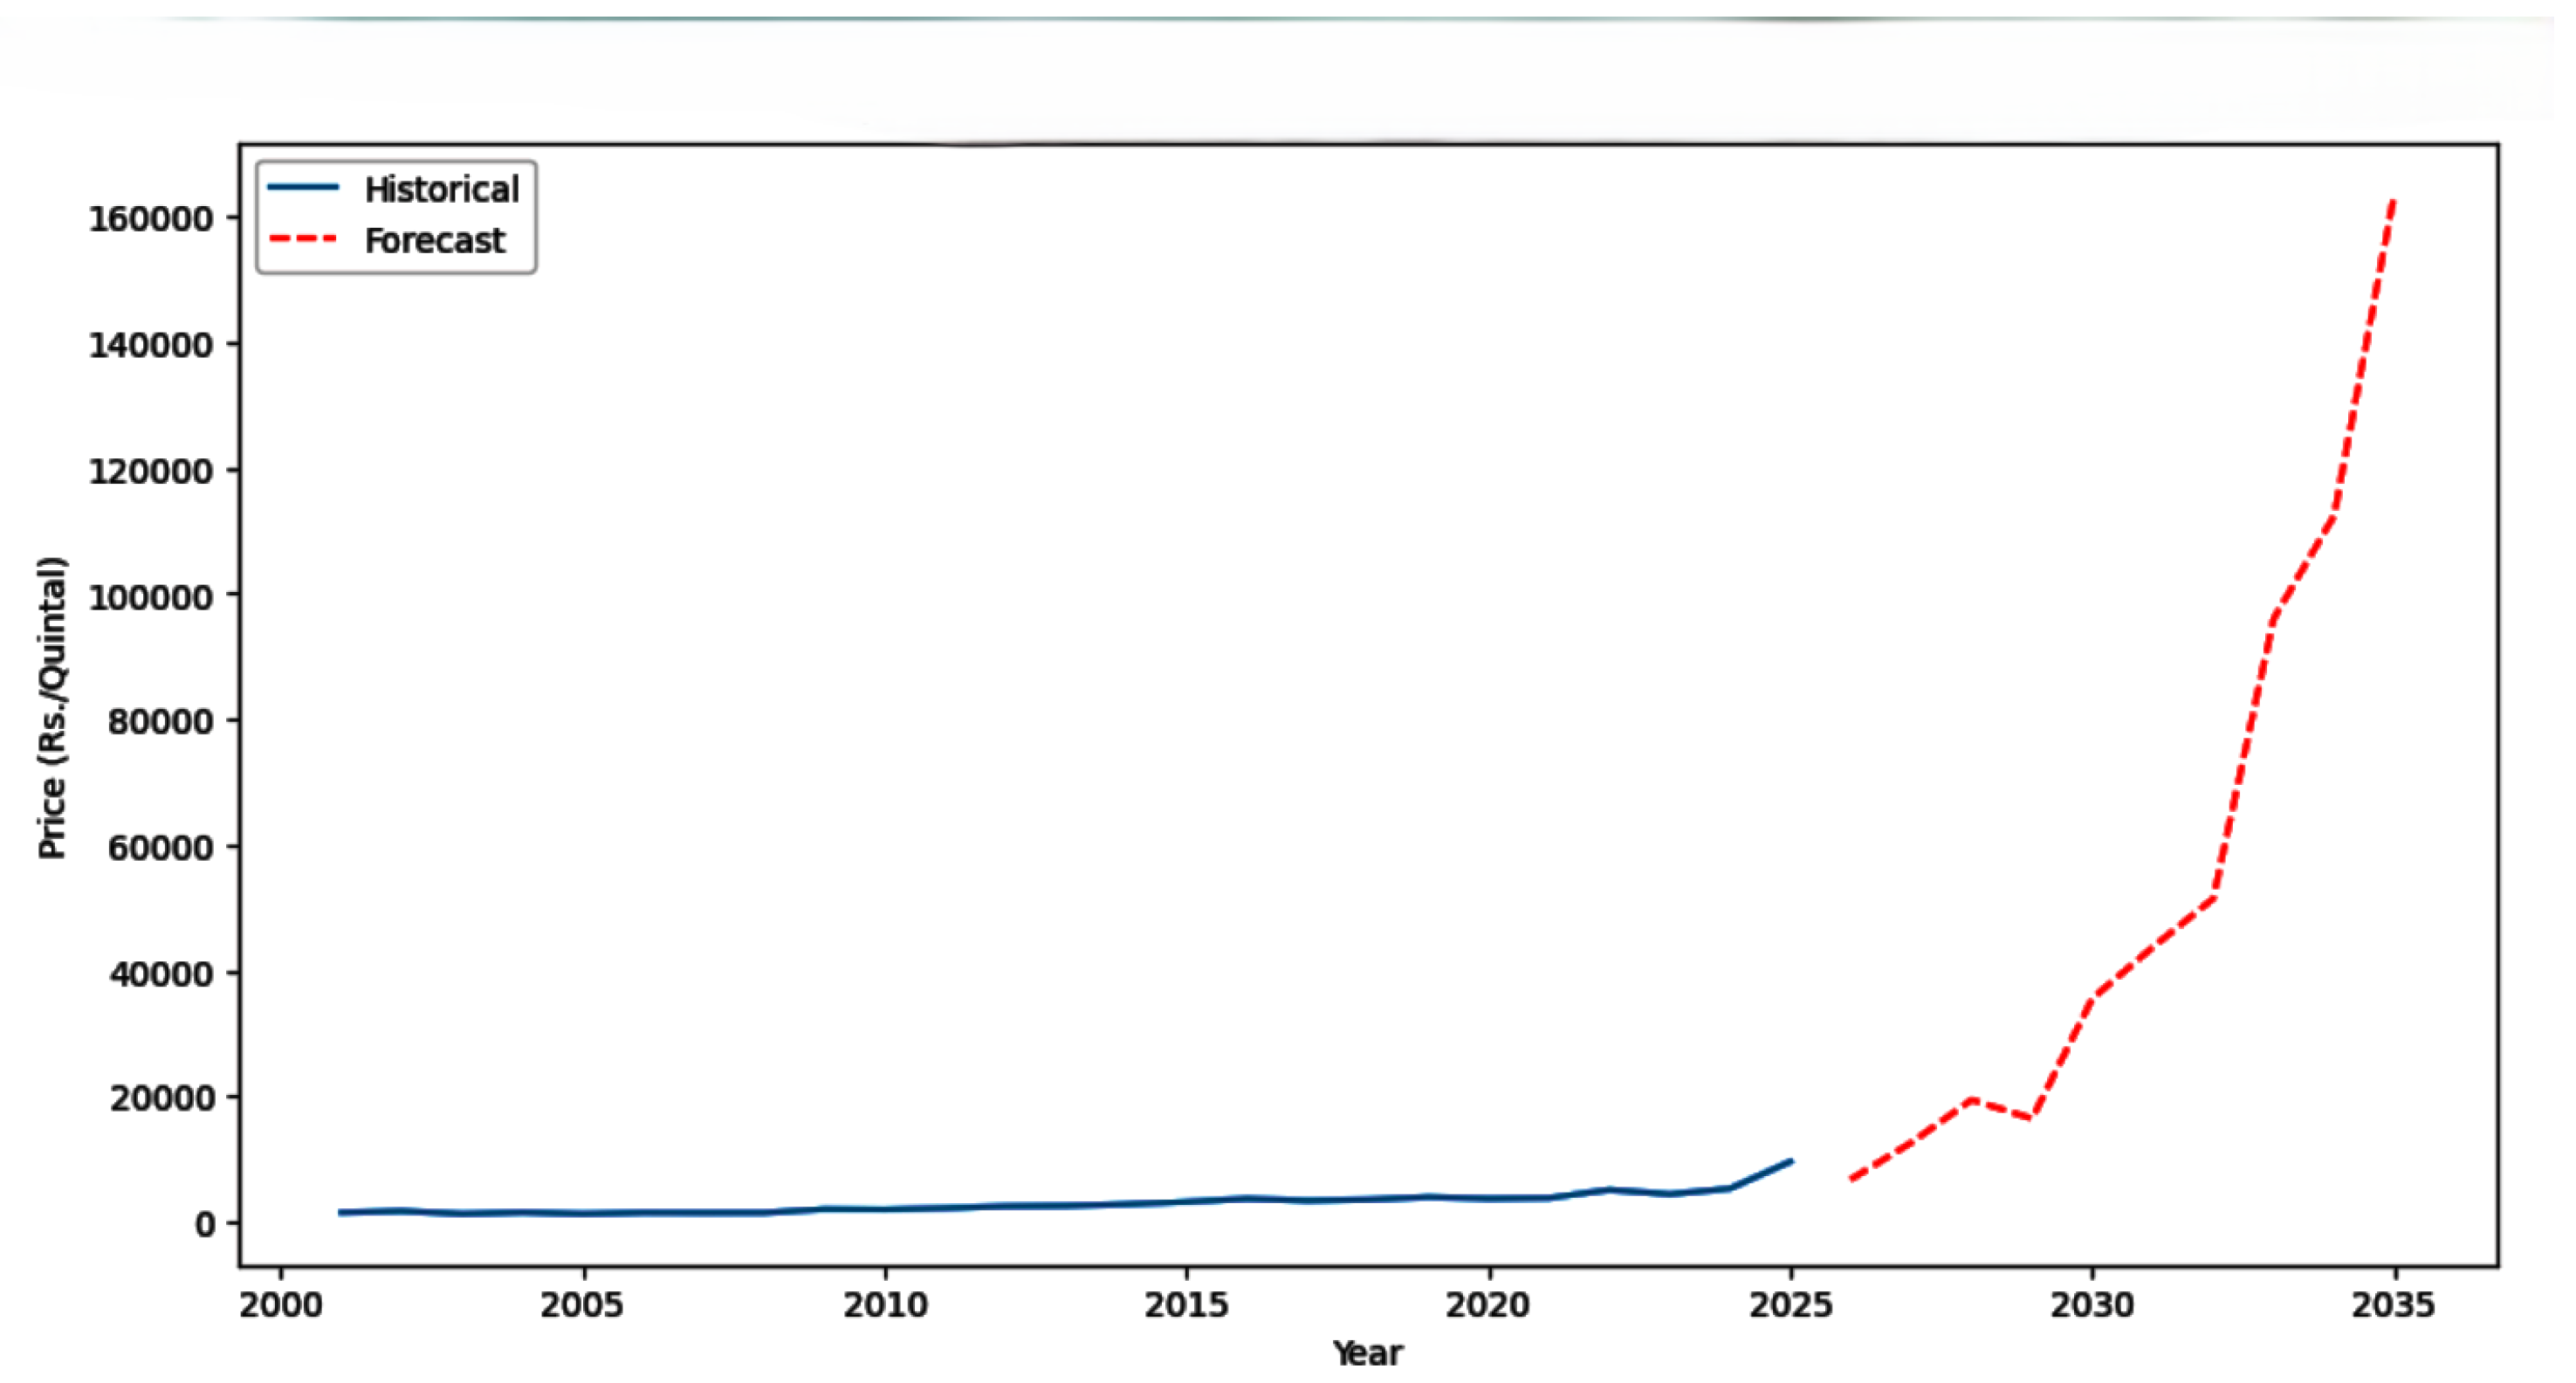
Table 11.
Model: "functional".
| Layer (type) | Output Shape | Param # |
|---|---|---|
| input_layer (InputLayer) | (None, 3, 1) | 0 |
| lstm (LSTM) | (None, 3, 50) | 10,400 |
| attention (Attention) | (None, 50) | 2,550 |
| dense (Dense) | (None, 1) | 51 |
Table 12.
Hybrid ETS+BiLSTM Accuracy.
| MAE | RMSE | MSE | R2_Score |
|---|---|---|---|
| 0.019 | 0.026 | 0.001 | 0.986 |
4.6. Artificial Neural Network(ANN) Model:
The model’s foretell for the coming ten years is presented in the plot ANN Forecast for Mango Modal Price (Historical + Projection):Maximal Extrapolation: The trend implied from the current historical spike is promptly projected in the forecast (red dashed line), which show a sharp, nearly vertical acceleration. The recent high-velocity growth is understood by the ANN model as the goods new, long-term trend.Crisis Amount: It is predicted that the price will increase significantly, surpassing Rs. 100,000/Quintal by 2033 and hitting an beyond belief peak of more than Rs. 160,000/Quintal by 2035.Meaning: The fundamental idea of many straight forward time-series neural networks is echoed in the ANN’s high prediction: if a strong, non-linear trend is present at the end of the data (as it is around 2025), the model will hostile project that momentum forward.
Figure 13.
ANN Historical fit.
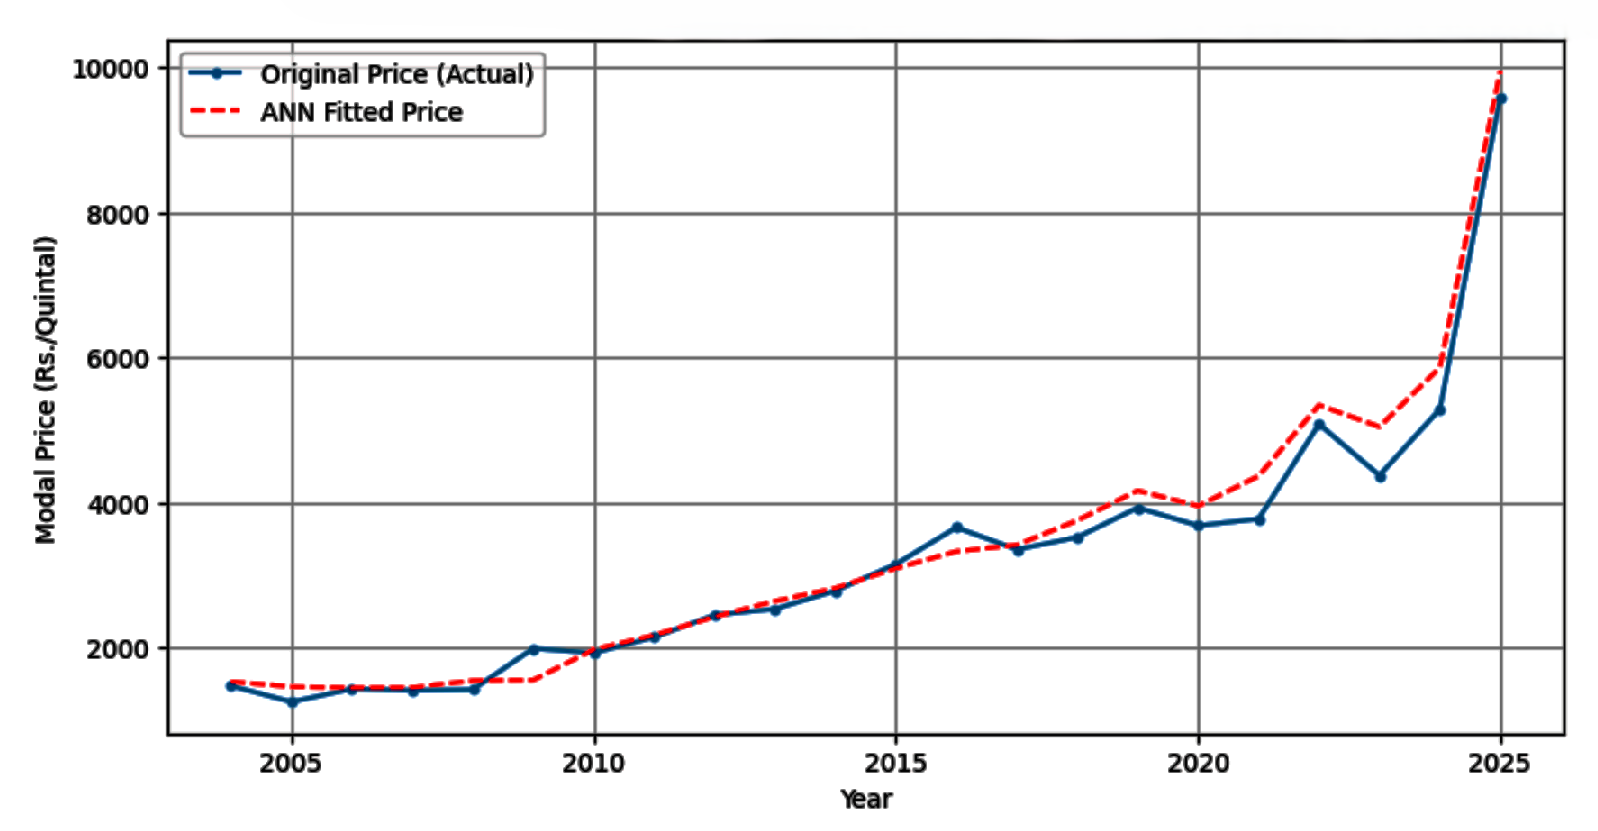
Figure 14.
ANN forecast for Mango model price.
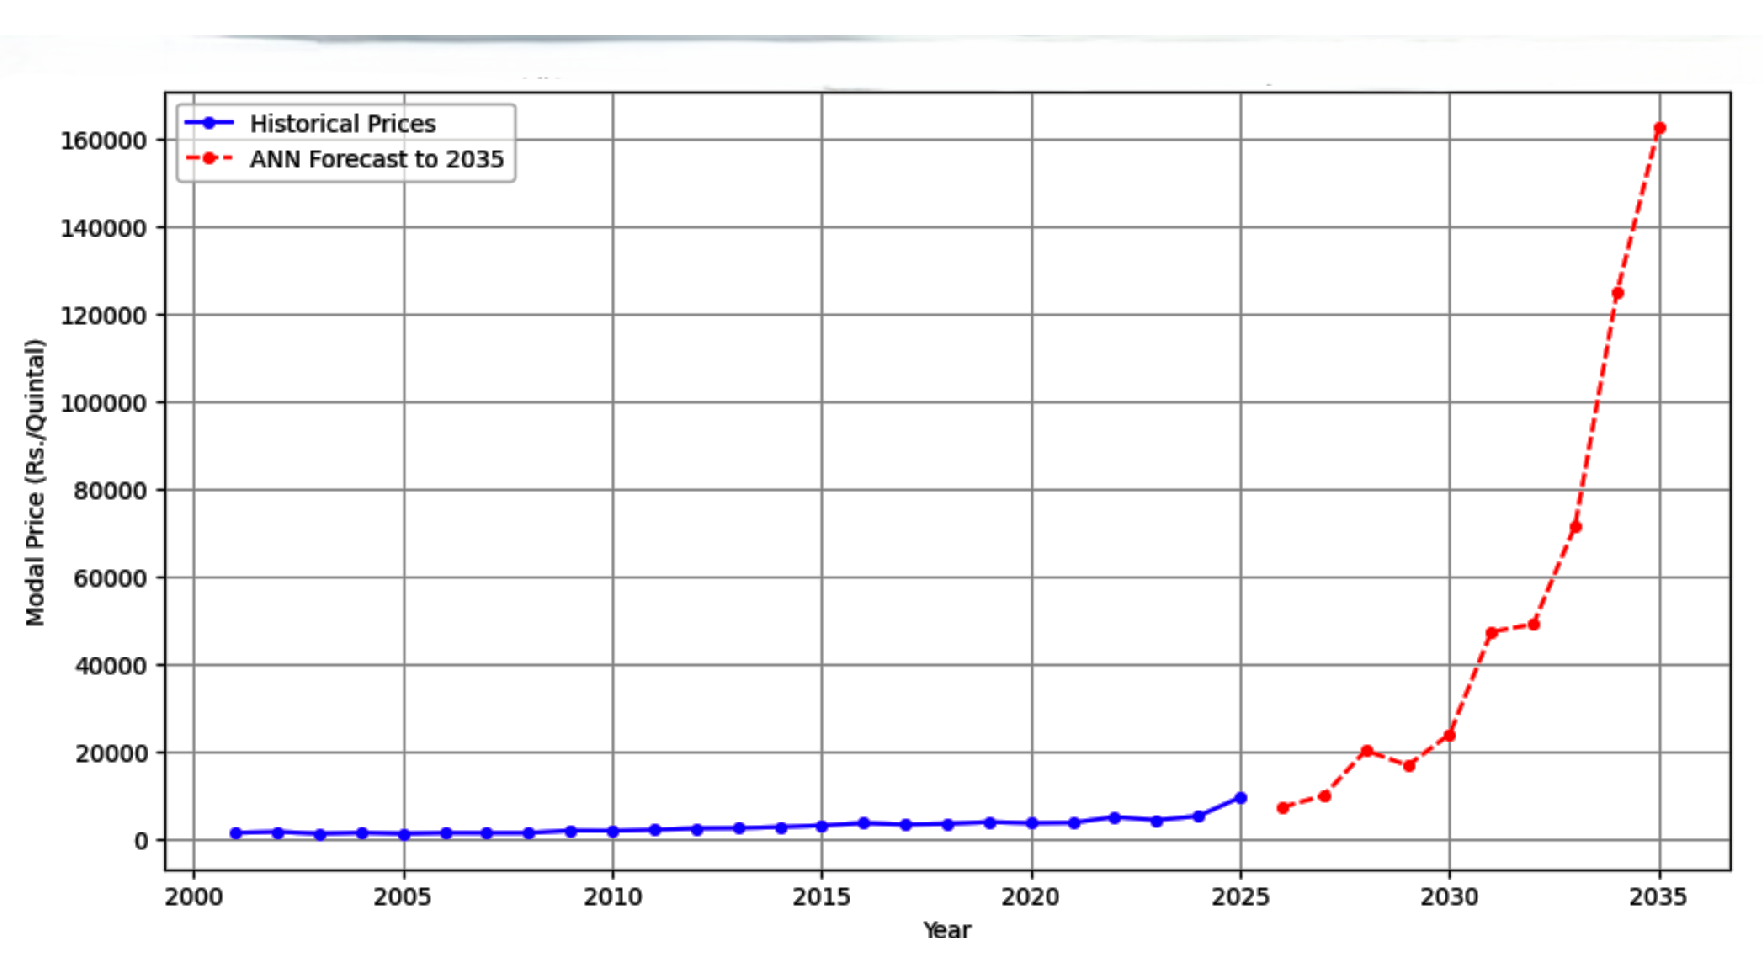
Table 13.
Model: "Sequential".
| Layer (type) | Output Shape | Param # |
|---|---|---|
| dense (Dense) | (None, 50) | 200 |
| dense_1 (Dense) | (None, 25) | 1, 275 |
| dense_2 (Dense) | (None, 1) | 26 |
Table 14.
Historical fit ANN.
| MAE | MSE | RMSE | R2_Score |
|---|---|---|---|
| 0.0260 | 0.0012 | 0.0352 | 0.9741 |
4.7. Hybrid Grach Model:
A model that predict severe price expansion between 2026 and 2035 is proposed by the overall investigation. Although the hybrid model’s GARCH component is used to estimate the unpredictability (prediction interval),the AIC/BIC analysis prefers GARCH(1,1) or GARCH(3,0); however, the GARCH(1,0) analysis has certain constraint when it comes to capturing volatility. The decision between the unalike GARCH orders eventually seems to have little practical effect on the 95% Prediction Interval.
Figure 15.
Comparison of AIC & BIC across GARCH Orders.
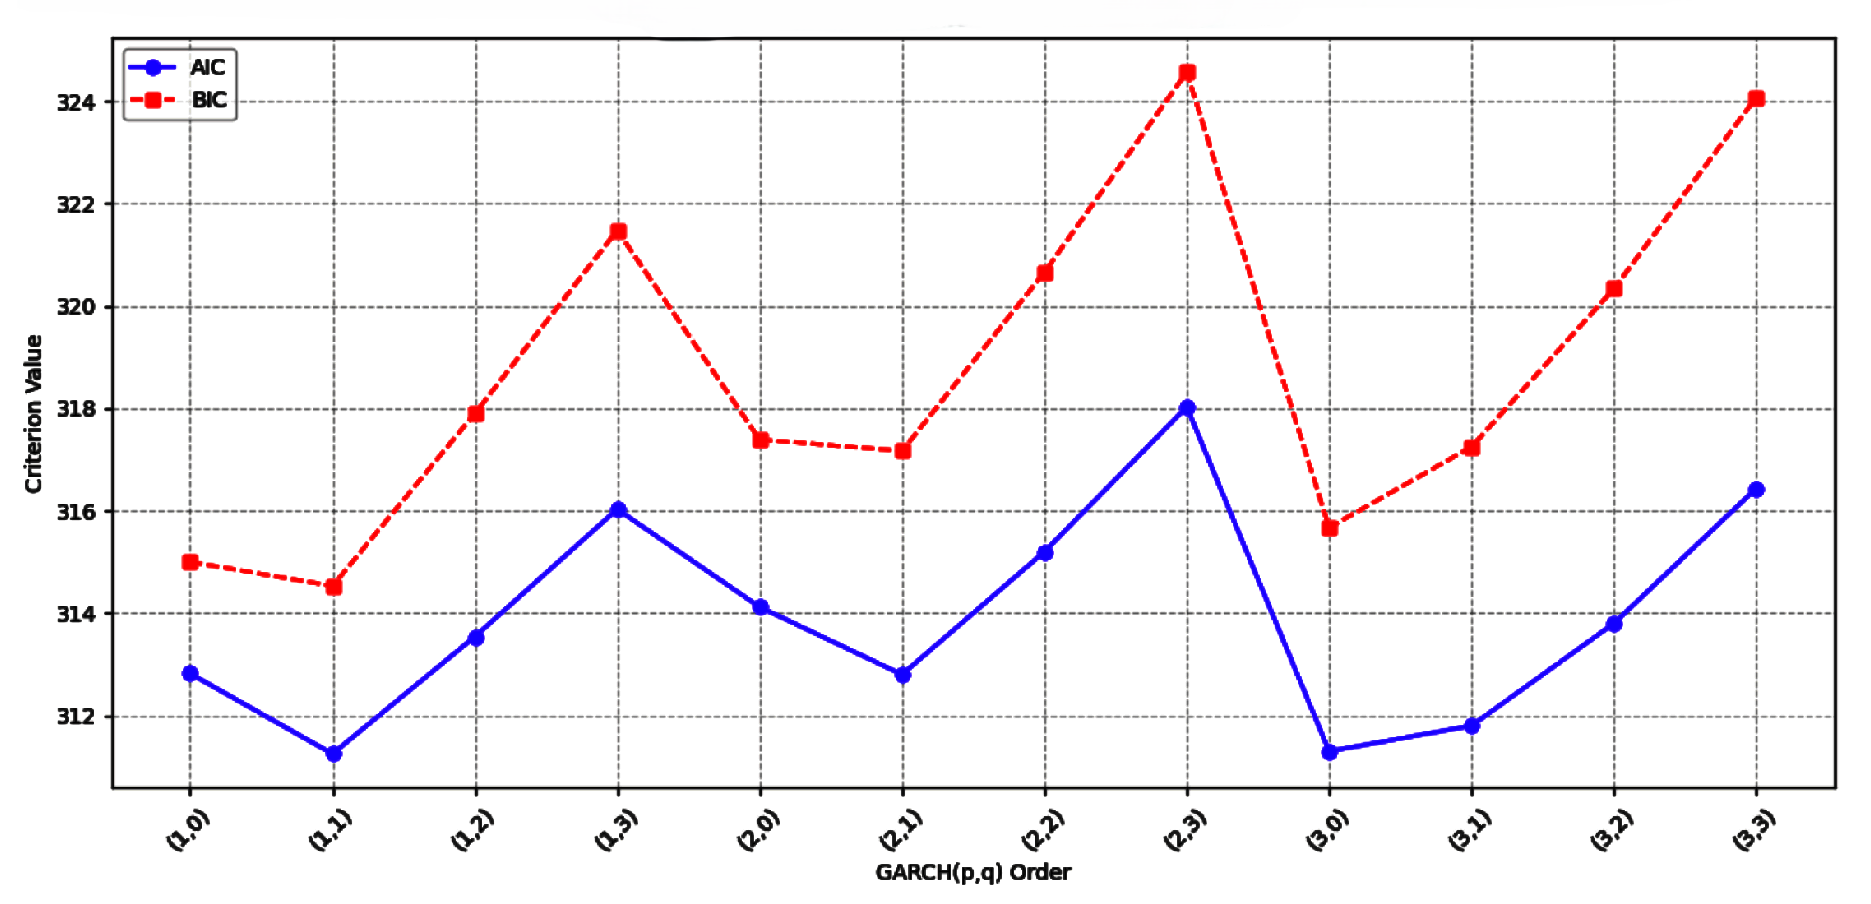
Figure 16.
GARCH(1,0)-Residuals & Conditional Volatility.
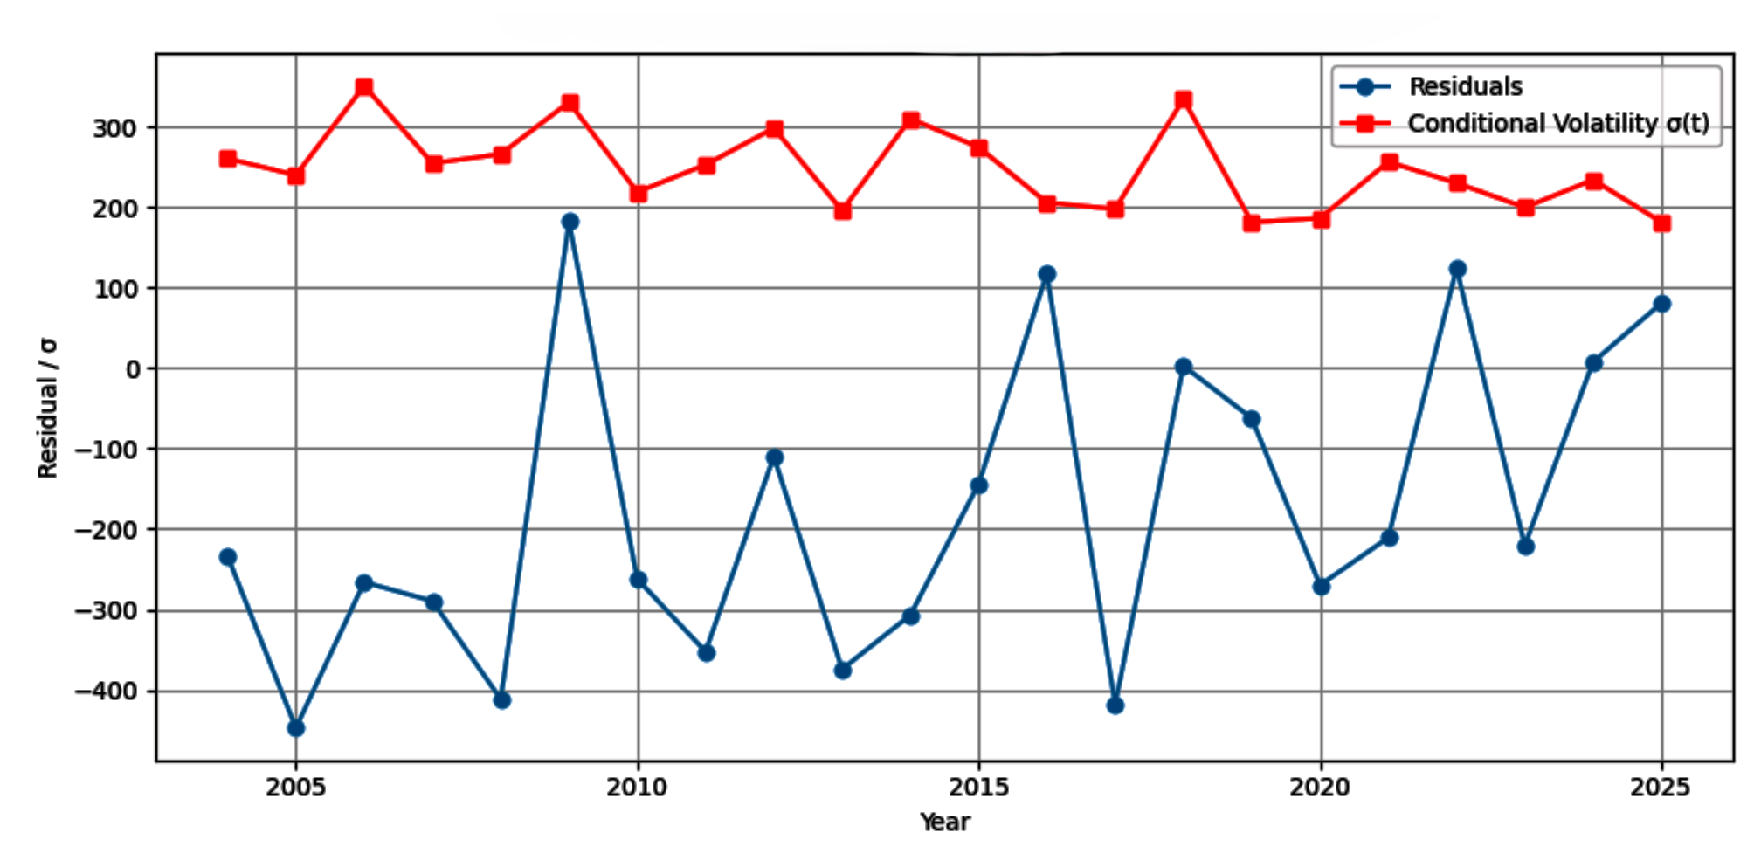
Figure 17.
Hybrid ANN & GARCH(1,0) Forecast to 2035.
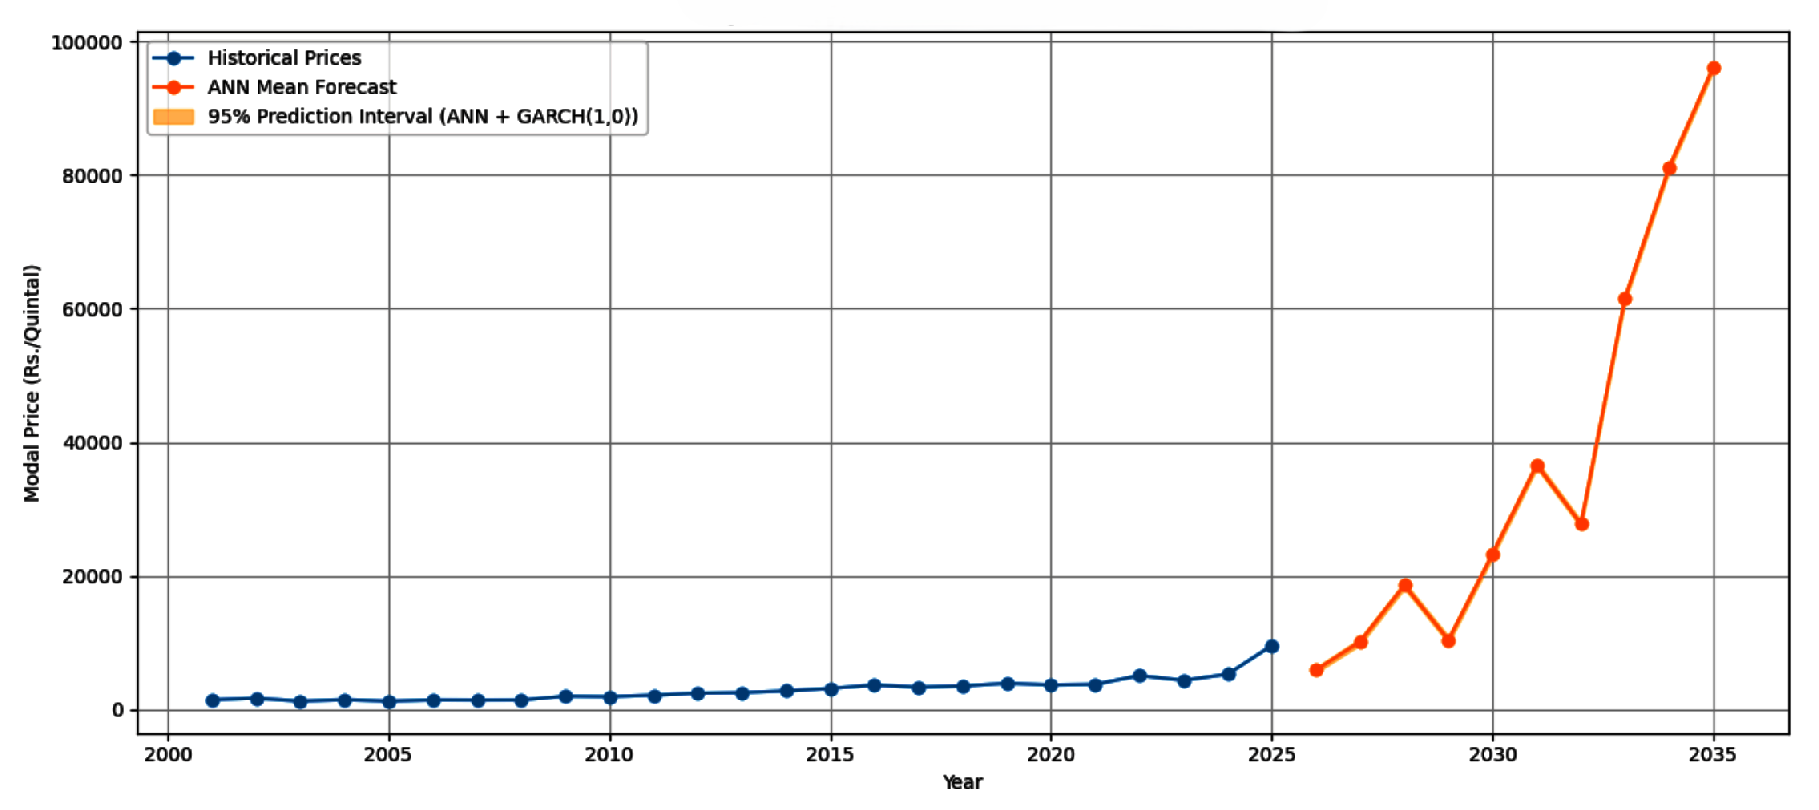
Figure 18.
ANN + GARCH(1,0) Forecast to 2035.
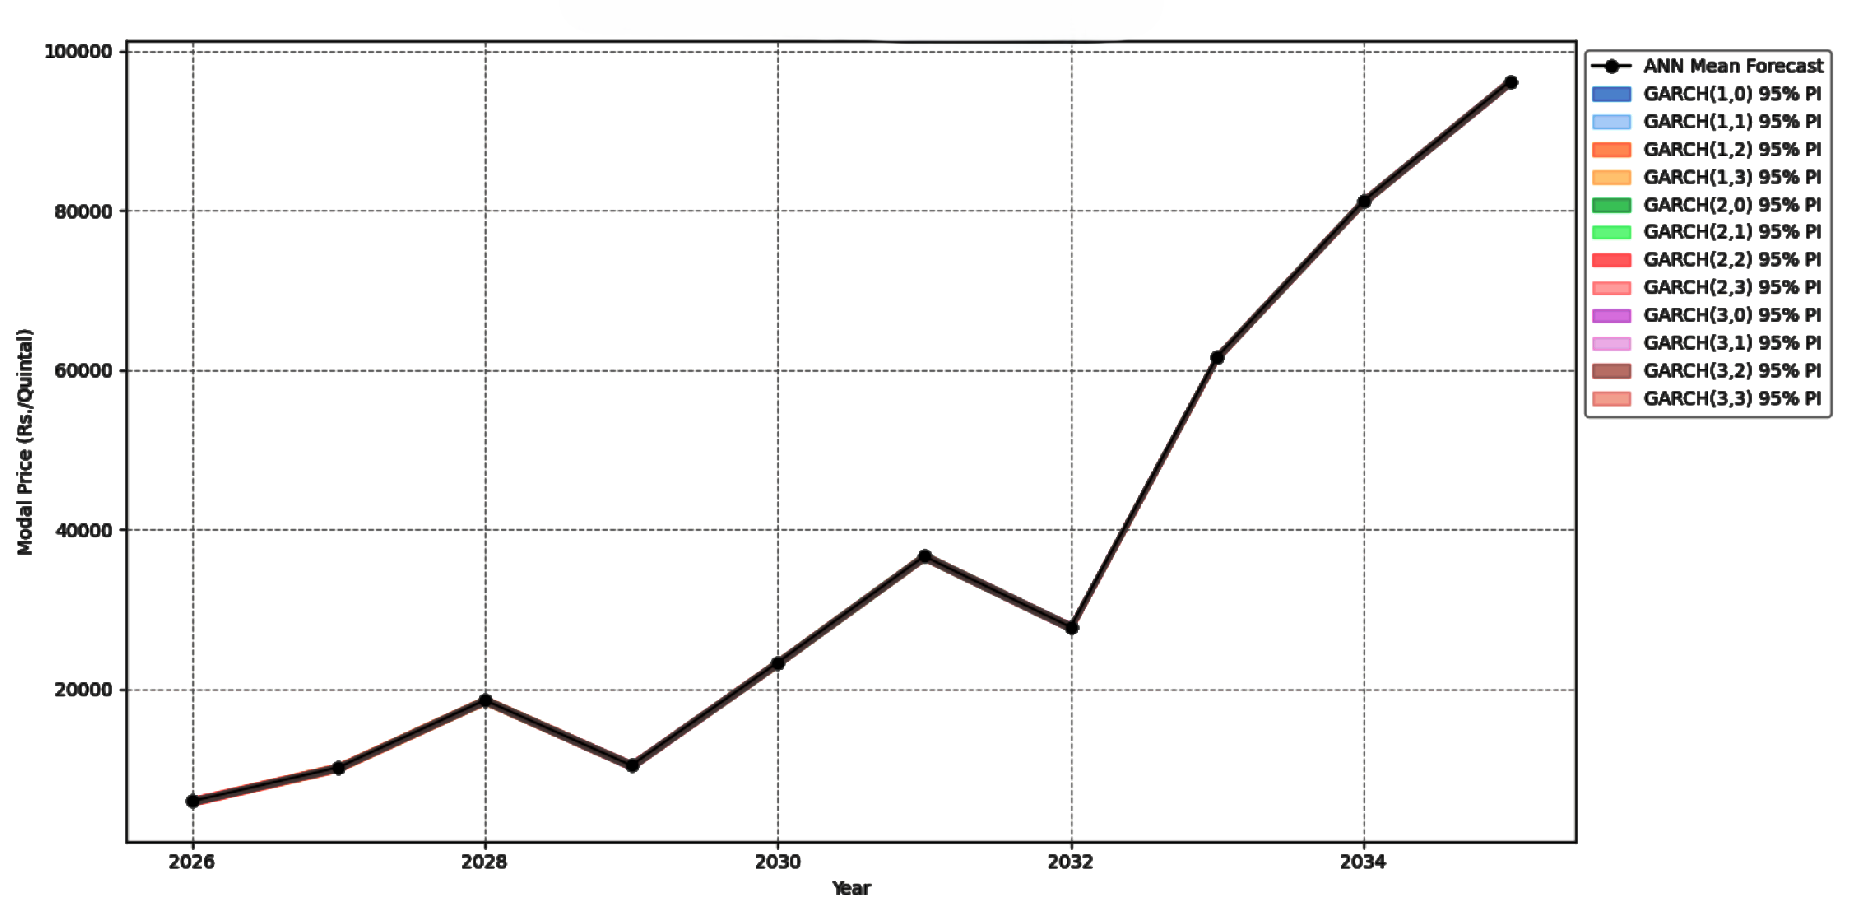
Table 15.
GARCH Model Summary.
| s.no | P | Q | AIC | BIC | RMSE | R2_Score |
|---|---|---|---|---|---|---|
| 1 | 1 | 0 | 282.696366 | 284.878451 | 0.0 | 1.0 |
| 2 | 1 | 1 | 283.859778 | 287.132905 | 0.0 | 1.0 |
| 3 | 2 | 0 | 284.696366 | 287.969493 | 0.0 | 1.0 |
| 4 | 1 | 2 | 285.243879 | 289.608049 | 0.0 | 1.0 |
| 5 | 1 | 3 | 285.813598 | 291.268810 | 0.0 | 1.0 |
| 6 | 2 | 1 | 285.859778 | 290.223947 | 0.0 | 1.0 |
| 7 | 3 | 0 | 286.696366 | 291.060535 | 0.0 | 1.0 |
| 8 | 2 | 2 | 287.243879 | 292.699092 | 0.0 | 1.0 |
| 9 | 2 | 3 | 287.813592 | 294.359846 | 0.0 | 1.0 |
| 10 | 3 | 1 | 287.859778 | 293.314990 | 0.0 | 1.0 |
| 11 | 3 | 2 | 289.243702 | 295.789957 | 0.0 | 1.0 |
| 12 | 3 | 3 | 289.813579 | 297.450876 | 0.0 | 1.0 |
5. Discussion
To predict the prices of mango modal across India, the research involved the use of advanced hybrid models that integrated time series, neural networks, and the volatility models to explain complex market trends. The Hybrid ETS + ANN + GARCH model used attained high predictive accuracy (MAE = 0.0498, MSE = 0.0106, RMSE = 0.1028, R2 = 0.774) after fitting trend-seasonality decomposition, nonlinear mapping and volatility modelling effectively. The GARCH component observed that recent historical shocks generally influence the price variations suggesting that the GARCH(1,0) model is most appropriate in the condition of capturing conditional volatility (MAE = 0.019, MSE = 0.001, RMSE = 0.026, R2 = 0.986). This further demonstrated the importance of relevant time-based relationships in forecasting prices. The strength of hybrid and deep learning methods in long-term price prediction has been established on the basis of close-to-perfect in-sample performance of other hybrid methods, including the ANN models and ARIMA + Decision Tree.Based on these results, it is possible to justify the inclusion of linear, nonlinear, and volatility-sensitive components in the hybrid approach capable of forecasting price changes in mangoes and providing traders, farmers, and policymakers with valuable information. The significance of exogenous variables in future models is explained by the fact that deviations may still be caused by such external factors as extreme weather, change of policy, and pest outbreaks.
- This analysis is play significant role in area of horticultural market in India (national) and international market.It goes beyond the typical emphasis on single models and image-based classification to provide a comprehensive solution for managing market risk.
- Previous research relied on a large number of combined forecasting models based on traditional methods, whereas a single deep learning forecasting model has emerged.
- Specifically, this frame may simultaneously detect trend-seasonality disintegration (ETS), non-linear mapping (ANN), and volatility modelling (GARCH).
- This analysis tell us we can use deep learning models like Attention -LSTM the use of deep learning in this sector by abstracting deeper insights from temporal data.
- This analysis effectively built an integrated hybrid ETS+ANN+GRACH model.
- Mango model price forecasting is highly relevant and can help us make better decisions.
6. Conclusion
This paper explores the strength of hybrid modeling methodologies in mango price prediction by analysis the time series data of twenty five years of twenty three states of Indian agriculture market. The Hybrid ETS + ANN + GARCH and Attention-LSTM along with other hybrid models found both trend-seasonality patterns and price volatility and kept on creating very precise forecasts. Although the GARCH factor considered the volatility of the market, the Attention mechanism among them contributed to the better interpretation of the market and helped traders to optimise their commercial tactics and farmers to plan their cultivation and storage more effectively due to the expected trends. ETS+Bi-LSTM , Hybrid Grach to check its wider application. Moreover, it has been noted that additional neural-network combinations may work better in different regions, which certainly makes efforts like this worthwhile in terms of enabling flexible decision-making with creative and representative modeling tools. Thus, this paper presents a novel approach for forecasting the mango prices and provides tools to enhance economic efficiency in the agricultural sector by facilitating policy formulation, managing market fluctuations, and optimizing resource allocation. This analysis will inspire further research on the applications of hybrid models in Mango pricing forecasting. This study also has some limitations. Due to the limitations of the available data, the time series and hybrid methodologies are constrained. It does not include other external factors such as soil fertility, weather, production levels, supply and demand, and the Mango inflation rate. In the future, the model can be strengthened by incorporating more variables and analyzing the Mango market prices more dynamically. It is expected that the developed forecasting model not only benefit market participants and agricultural policymakers but also significantly contribute to decision-making in the agricultural sector.
Author Contributions
The following statements should be used for author contributions: “Conceptualization, Dr.Suraj Arya, Dr Sahimel Azwal Bin Sulaiman, and Dr.Dedek Andrian.; Methodology, Dr.Suraj Arya and Swati Singh.; software, Swati Singh.; validation, Dr.Suraj Arya and Swati Singh.; formal analysis, Swati Singh.; investigation, Dr.Suraj Arya and Swati Singh.; resources, Dr.Suraj Arya and Swati Singh.; writing—original draft preparation Dr.Suraj Arya and Swati Singh.; writing—review and editing, Dr.Suraj Arya, Dr Sahimel Azwal Bin Sulaiman.; visualization, Dr.Suraj Arya and Swati Singh.; supervision, Dr.Suraj Arya; project administration, Dr.Suraj Arya and Dr. Dedek Andrian.; funding acquisition: Dr Sahimel Azwal Bin Sulaiman and Dr. Dedek Andrian. All authors have read and agreed to the published version of the manuscript.
Funding
This work was supported in part by the Research Innovation Department, Universiti Malaysia Pahang Al215 Sultan Abdullah, for the financial support received through the Internal Grant UMPSA (RDU242706/UIC241507).
Institutional Review Board Statement
Not applicable.
Informed Consent Statement
Informed consent was obtained from all participants involved in the study.
Data Availability Statement
Data may be available on request.
Acknowledgments
All authors thank the Institute for providing valuable resources for conducting this research.
Conflicts of Interest
The authors declare no conflicts of interest.
Abbreviations
The following abbreviations are used in this manuscript:
| LSTM | Long Short-Term Memory |
| SARIMA | Seasonal AutoRegressive Integrated Moving Average |
| ETS | Error, Trend, Seasonal |
| MAE | Mean Absolute Error |
| RMSE | Root Mean Squared Error |
| MAPE | Mean Absolute Percentage Error |
References
- Pardhi, R.; Singh, R.; Rathod, S.; Singh, P. K. Effect of price of other seasonal fruits on mango price in Uttar Pradesh. Economic Affairs 2016, 61(4), 627. [Google Scholar] [CrossRef]
- Yosbuth, C.; Pattarajariya, K.; Sitthikarn, P.; Ditjarern, S.; Siriborvornratanakul, T. Using Computer Vision for Mango Price Estimation Based on Breed Classification and Quality Grading. Journal of The Institution of Engineers (India): Series B 2024, 105(2), 443–454. [Google Scholar] [CrossRef]
- Gothai, E.; Rajalaxmi, R. R.; Thamilselvan, R.; Harshath, S. M. Forecasting Price Prediction for Vegetables and Fruits Using Recurrent Neural Network. 2024 5th International Conference on Electronics and Sustainable Communication Systems (ICESC), 2024; IEEE; pp. 1889–1896. [Google Scholar]
- Peerzada, S.; Saud, M. R.; Javed, D. NeuralMango: Advanced Mango Classification and Price Prediction. 2024 International Conference on Engineering & Computing Technologies (ICECT), 2024; IEEE; pp. 1–6. [Google Scholar]
- Arcila-Diaz, L.; Mejia-Cabrera, H. I.; Arcila-Diaz, J. Estimation of Mango Fruit Production Using Image Analysis and Machine Learning Algorithms. In Informatics 2024, 11(4), 87. [Google Scholar] [CrossRef]
- Kumar, S. Y.; Mishra, A.; Nambiar, R.; Nekar, A.; Benedict, S. Fruit Weight Prediction and Cost Estimation Using YOLOv9-based Deep Learning. 2024 International Conference on IoT Based Control Networks and Intelligent Systems (ICICNIS), 2024; IEEE; pp. 1304–1309. [Google Scholar]
- Sharma, C.; Misra, R.; Bhatia, M.; Manani, P. Price prediction model of fruits, vegetables and pulses according to weather. 2023 13th international conference on cloud computing, data science & engineering (confluence), 2023; IEEE; pp. 347–351. [Google Scholar]
- Kumari, P.; Goswami, V.; Harshith, N.; Pundir, R. S. Recurrent neural network architecture for forecasting banana prices in Gujarat, India. Plos one 2023, 18(6), e0275702. [Google Scholar] [CrossRef]
- Banerjee, S.; Mondal, A. C. An ingenious method for estimating future crop prices that emphasises machine learning and deep learning models. International journal of information technology 2023, 15(8), 4291–4313. [Google Scholar] [CrossRef]
- Torgbor, B. A.; Rahman, M. M.; Brinkhoff, J.; Sinha, P.; Robson, A. Integrating remote sensing and weather variables for mango yield prediction using a machine learning approach. Remote Sensing 2023, 15(12), 3075. [Google Scholar] [CrossRef]
- Garde, Y.; Chavda, R. R.; Thorat, V. S.; Pisal, R. R.; Shrivastava, A.; Varshney, N. Forecasting area, productivity and prices of mango in Valsad District of Gujarat: Time series analysis. Environment Conservation Journal 2023, 24(2), 218–227. [Google Scholar] [CrossRef]
- Ma, W.; Nowocin, K.; Marathe, N.; Chen, G. H. An interpretable produce price forecasting system for small and marginal farmers in india using collaborative filtering and adaptive nearest neighbors. In Proceedings of the Tenth International Conference on Information and Communication Technologies and Development, 2019; pp. 1–11. [Google Scholar]
- Thapaswini, G.; Gunasekaran, M. A methodology for crop price prediction using machine learning. 2022 ieee 2nd international conference on mobile networks and wireless communications (icmnwc), 2022; IEEE; pp. 1–7. [Google Scholar]
- Garde, Y. A.; Chavda, R. R.; Thorat, V. S.; Pisal, R. R. Forecasting of area, productivity and prices of mango in Navsari district, Gujarat. 2021. [Google Scholar] [CrossRef]
- Munj, A. Y.; Jalgaonkar, V. N.; Salvi, B. R.; Narangalkar, A. L.; Choudhary, J. S.; Kumari, M.; Mali, S. S.; Das, B. Prediction of mango hopper, Idioscopus nitidulus (Walker) using hybrid modelling in Konkan region. Journal of Agrometeorology 2021, 23(1), 60–65. [Google Scholar] [CrossRef]
- Chen, S. I.; Chen, W. F. The Optimal Harvest Decisions for Natural and Artificial Maturation Mangoes under Uncertain Demand, Yields and Prices. Sustainability 2021, 13(17), 9660. [Google Scholar] [CrossRef]
- Sujatha, P. Hybrid Statistical Models for Forecasting Yield of Mango and Banana in Tamil Nadu, India. Asian Journal of Agricultural Extension, Economics & Sociology 2021, 39(11), 168–174. [Google Scholar] [CrossRef]
- Navaja, R. B.; Campomanes, F. P.; Patiño, C. L.; Flores, M. J. L. Analyzing the Status of Mango Trees in Brgy. Cantipay, Carmen, Cebu Using Ndvi and Time Series Clustering. The International Archives of the Photogrammetry, Remote Sensing and Spatial Information Sciences 2019, 42, 313–317. [Google Scholar] [CrossRef]
- Dharavath, R.; Khosla, E. Seasonal ARIMA to forecast fruits and vegetable agricultural prices. 2019 IEEE International Symposium on Smart Electronic Systems (iSES)(Formerly iNiS), 2019; IEEE; pp. 47–52. [Google Scholar]
- Pardhi, R.; Singh, R.; Paul, R. K. Price forecasting of mango in Varanasi market of Uttar Pradesh. Current Agriculture Research Journal 2018, 6(2), 218. [Google Scholar] [CrossRef]
- Rathod, S.; Mishra, G. C. Statistical models for forecasting mango and banana yield of Karnataka, India. Journal of Agricultural Science and Technology 2018, 20(4), 803–816. [Google Scholar]
- Abhiram Dash, A. D.; Dhakre, D. S.; Debasis Bhattacharya, D. B. Fitting of appropriate model to study growth rate and instability of mango production in India. 2017. [Google Scholar]
- Qureshi, M. N.; Bilal, M.; Ayyub, R. M.; Ayyub, S. Modelling on Mango Production in Pakistan. Sci. Int.,(Lahore) 2014, 26(3), 1227–1231. [Google Scholar]
- Ghafoor, A.; Mustafa, K.; Mushtaq, K.; others. Cointegration and causality: An application to major mango markets in Pakistan. Lahore Journal of Economics 2009, 14(1), 85–113. [Google Scholar] [CrossRef]
- Khan, M.; Mustafa, K.; Shah, M.; Khan, N.; Khan, J. Z. Forecasting mango production in Pakistan an econometric model approach. Sarhad J. Agri 2008, 24(2), 363–370. [Google Scholar]
- Bana, J. K.; Choudhary, J. S.; Kumar, S.; Ghoghari, P. D.; Kalaria, G. B.; Desai, H. R.; Patil, S. J.; Patil, P. Seasonal time series forewarning model for population dynamics of mango hopper (Hemiptera: Cicadellidae) in humid agro-climatic conditions. International Journal of Pest Management 2024, 70(4), 626–636. [Google Scholar] [CrossRef]
- Dai, X.; Chen, L.; Hou, Y.; Ning, X.; Zhao, W.; Cui, Y.; Liu, J.; Wang, M. A Comparative Study of Neural Network Models for China’s Soybean Futures Price Forecasting. Agriculture 2025, 15(24), 2586. [Google Scholar] [CrossRef]
- Aguilera, S. G.; Karbassi Yazdi, A. Anomaly Detection and Regional Clustering in Chilean Wholesale Fruit and Vegetable Prices with Machine Learning. Agriculture 2025, 15(22), 2362. [Google Scholar] [CrossRef]
- Ye, Y.; Zhuang, X.; Yi, C.; Liu, D.; Tang, Z. Enhancing Agricultural Futures Return Prediction: Insights from Rolling VMD, Economic Factors, and Mixed Ensembles. Agriculture 2025, 15(11), 1127. [Google Scholar] [CrossRef]
- Wang, G.; Xu, S.; Chen, Z.; Li, Y. A Hybrid Model Integrating Variational Mode Decomposition and Intelligent Optimization for Vegetable Price Prediction. Agriculture 2025, 15(9), 919. [Google Scholar] [CrossRef]
- Feng, Y.; Hu, X.; Hou, S.; Guo, Y. A Novel BiGRU-Attention Model for Predicting Corn Market Prices Based on Multi-Feature Fusion and Grey Wolf Optimization. Agriculture 2025, 15(5), 469. [Google Scholar] [CrossRef]
- Zhao, C.; Wang, X.; Zhao, A.; Cui, Y.; Wang, T.; Liu, J.; Hou, Y.; Wang, M.; Chen, L.; Li, H. A vegetable-price forecasting method based on mixture of experts. Agriculture 2025, 15(2), 162. [Google Scholar] [CrossRef]
- Hamulczuk, M.; Pawlak, K.; Stefańczyk, J.; Gołębiewski, J. Agri-food supply and retail food prices during the Russia–Ukraine conflict’s early stage: implications for food security. Agriculture 2023, 13(11), 2154. [Google Scholar] [CrossRef]
- Sun, F.; Meng, X.; Zhang, Y.; Wang, Y.; Jiang, H.; Liu, P. Agricultural product price forecasting methods: A review. Agriculture 2023, 13(9), 1671. [Google Scholar] [CrossRef]
- Xiong, T.; Li, M.; Cao, J. Do futures prices help forecast spot prices? Evidence from China’s new live hog futures. Agriculture 2023, 13(9), 1663. [Google Scholar] [CrossRef]
- Wu, J.; Hu, Y.; Wu, D.; Yang, Z. An aquatic product price forecast model using VMD-IBES-LSTM hybrid approach. Agriculture 2022, 12(8), 1185. [Google Scholar] [CrossRef]
Disclaimer/Publisher’s Note: The statements, opinions and data contained in all publications are solely those of the individual author(s) and contributor(s) and not of MDPI and/or the editor(s). MDPI and/or the editor(s) disclaim responsibility for any injury to people or property resulting from any ideas, methods, instructions or products referred to in the content. |
© 2026 by the authors. Licensee MDPI, Basel, Switzerland. This article is an open access article distributed under the terms and conditions of the Creative Commons Attribution (CC BY) license.
Copyright: This open access article is published under a Creative Commons CC BY 4.0 license, which permit the free download, distribution, and reuse, provided that the author and preprint are cited in any reuse.


