
Submitted:
07 January 2026
Posted:
08 January 2026
You are already at the latest version
Abstract
Head-mounted (“virtual reality”) perimeters (HMPs), based on standard consumer electronic hardware, are a cheaper alternative to standard automated perimetry. They have not been validated in patients with inherited retinal disease (IRDs), yet. We evaluated the Iowa-HMP in a first pilot study. It consists of a legacy smartphone, a headset, and freely available, open-source software. We used the 10-2 grid, the ZEST algorithm, and a background of 10 cd/m^2 to measure central visual fields in one normal subject, and in patients with occult macular dystrophy (n = 2), Stargardt’s disease (n=3) and retinitis pigmentosa (n = 6). Results were compared with those from an Octopus 900 perimeter. The typical patterns of visual field loss were clearly discernible, but head-mounted perimeters generally have a limited dynamic range. Within the dynamic range of the Iowa-HMP (14 to 30 dB Octopus sensitivity), the Limits of Agreement (Bland-Altman) were ±7.5 dB. The Iowa-HMP had a diagnostic sensitivity of 0.67 for detecting locations with low perimetric sensitivity (< 14 dB in the Octopus perimetry) with a diagnostic specificity of 0.95. Although the Iowa-HMP cannot be directly compared to standard perimetry in IRDs, open software greatly facilitates research in this area.
Keywords:
head-mounted perimetry
; virtual reality
; inherited retinal diseases
1. Introduction
In inherited retinal diseases, perimetry is an important tool that allows not only the identification of typical patterns of visual field loss but also the quantification of photoreceptor function by measuring decreased light sensitivity[1,2]. Standard automated perimetry (SAP) uses projection-based perimeters with white stimuli on a white background[3].
The first automated (computer-driven) static perimeters were developed in the 1970s: the Octopus 201 (Haag-Streit, Köniz, Switzerland)[4,5] and the Humphrey Field Analyser (Carl Zeiss Meditec, Inc., Dublin, California)[6,7]. These consist of a dome with diffuse background illumination, on which focal stimuli are projected as light increments. During the test, the patient places his head on a chin rest and fixates the center of the dome. The stimuli are modified according to the patients’ responses (a pressing of a button that is registered within a response window indicates that the luminance increase was seen) following predefined algorithms to effectively determine the light increment detection thresholds. With these devices, very strong light increments are possible because the stimuli are created with a xenon arc lamp or with modern, very bright LEDs and superimposed on the background. In addition, neutral density filters facilitate very small luminance increments, enabling a very large technical dynamic range[8].
Perimetry usually tests observers’ sensitivities to differential light increments[3]. Absolute scotomas are areas of the visual field where there is no light perception at all; relative scotomas allow detection of lights that are brighter than necessary for a normal observer. In these relative scotomas, the threshold denotes the light increment that is just detected by the observer[3]. Sensitivity is a logarithmic measure that relates the individual’s increment threshold to a reference, so that lower thresholds correspond to a higher sensitivity and vice versa. By convention, the largest increment () that can be presented by a given perimeter is chosen as the 0 dB reference luminance (see the supplement to [3]). Thus, the sensitivity scales of different perimeters define different stimulus brightness levels as 0 dB sensitivity. In clinical practice, the implication of this is mitigated because the sensitivity deviation (or defect), that is the difference between the observed sensitivity and that of an age-matched or age-corrected normal population, is used instead of the sensitivity. Because the difference to the 0 dB reference level is present in both the observed and the normal values, it is eliminated from the equation. During the last decades, the background luminance settings () have converged across the perimeters, and low photopic settings of are generally used (historically, the Octopus perimeters used )[4].
In contrast, head-mounted perimetry has emerged only recently as an interesting alternative, relying on commercially more widely available and, therefore, much cheaper components that are also used in consumer electronics[9]. They are either based on smartphones and a headset or on full-fledged virtual-reality platforms. This technical development allows a more widespread application in underserved communities and telemedical settings[10]. However, background and stimuli are presented on OLED or LCD displays which have a much smaller maximal luminance and often provide only 255 equal luminance steps, owing to the RGB additive color model and thus to a limited resolution[11]. This limits direct emulation of projection-based perimeters[11,12]. In a number of devices, lower background settings in the mesopic range are used in order to enable larger luminance increments.
When sensitivity is systematically mapped across the visual field, the resulting pattern is often interpreted by pattern recognition (“gestalt” perception), but this might be misleading[13]. Therefore, a quantitative analysis of SAP results is necessary[3]. In inherited retinal diseases (IRDs), perimetry is used to identify characteristic patterns of visual field loss, including central scotoma[14], ring scotomas or concentric constriction[15,16]. Perimetry is used as a functional screening test for toxic maculopathy in patients under (hydroxy-)chloroquine therapy[17]. In addition to supporting the clinical diagnosis, visual field tests support clinicians in counseling the patient on a range of issues like driving or occupational safety. Quantification of visual field losses is also important in clinical research. They are an integral part of phenotype-genotype correlations[18], and a number of perimetric techniques are discussed as endpoints in clinical trials of gene- and cell-based therapies of inherited retinal diseases[2,15,19]. However, new techniques, including fundus-controlled perimetry[20], dark-adapted perimetry[15], chromatic perimetry[2], and volumetric analysis of the hill of vision[21] are frequently advocated to overcome limitations of SAP for such endpoints.
The Iowa head-mounted perimeter is a cheap open source perimeter for research purposes[22]. It is based on a legacy smartphone mounted in a virtual reality headset. The freely available Phone HMD app on the smartphone is driven by the (also) freely-available OpiApp via a local WiFi network. In contrast to some commercially available HMD perimeters, the data are saved locally on the desktop computer and not on an external server, and can be exported completely. This software is provided by the Open Perimetry Initiative (OPI)[23,24]. The purpose of the present study was to provide a first proof-of-principle for using head-mounted perimetry in inherited retinal diseases with an open-source device.
2. Materials and Methods
2.1. Patients
We examined 11 patients and one normal subject with ages between 24 and 73 years (median: 58 years, IQR: 23 years). The demographic and clinical characteristics of our study cohort are shown in Table 1. The patients had participated in earlier studies[25,26,27] and were seen yearly in our retina clinic. All perimetric measurements reported here were performed in 2025. All cases of ABCA4-associated disease[26] and RP1L1-associated occult macular dystrophy[27] were genetically confirmed. In contrast, diagnosis of RP was made clinically[25]. However, genetic results were available for most patients, and two women with clinically manifest heterozygous RPGR mutations were included[28]. All patients had been examined at least three times with the Octopus perimeter (usually G1 or M pattern) but not with the VR perimeter prior to this study.
This study adhered to the tenets of the declaration of Helsinki and was approved by the Ethics committee of the Medical Faculty of the Friedrich-Alexander University Erlangen-Nürnberg (300-17B). Patients gave written informed consent prior to participation.
2.2. Device 1: Iowa Head-Mounted Perimeter
The device consisted of a commercially available smartphone, a headset, and a personal computer which drives the smartphone via a client-server-infrastructure in a local WiFi network. The total price of the smartphone, the headset, the neutral density filter, and a USB WiFi adapter was below 300 Euro.
2.2.1. Smartphone and Headset
We used a Samsung Galaxy S10e (SM-6970U1) with a 6.1 inch screen and an Android 12 operating system together with a VR Shinecon headset. An optical neutral density (ND) filter (0.6 OD units) was placed between the smartphone screen and the headset (see Figure 1). The opiPhoneHMD app (opiPhoneHMP-release.apk) was downloaded from www.optocom.es and installed on the smartphone. Because no dedicated Google Daydream QR code, allowing the VR app to correct for distortion, was provided by the manufacturer of the headset (VR shinecon), we used a QR code that was published on the internet for this headset.
2.2.2. Software
A conventional personal computer, running on Windows 10, was used to drive the visual field test with the OPI app for R (version 4.5.1, “Great Square Root”). It was necessary to install the older version 2.11.2 instead of the current version 3.x of the OPI package. The Smartphone was calibrated using a Minolta LS-110 Luminance Meter from a distance of >1 m.
2.2.3. Settings
The background was set to (as seen through the ND filter; i.e., the screen was set to on the phone). This allowed minimal luminance increments of , and maximal luminance increments of . The program used the 10-2 pattern, a Goldmann III stimulus size ( visual angle), and 100 ms stimulus duration.
2.3. Device 2: Octopus 900 Projection-Based Perimeter
Standard automated perimetry was performed on the Octopus 900 (Haag-Streit, Köniz, Switzerland) using the Haag-Streit EyeSuite Software (2.3.1). We also used the 10-2 pattern, a Goldmann III stimulus size ( visual angle), and 100 ms stimulus duration. Contrary to current practice and to the VR perimetry settings, a background luminance of (4 asb), and a maximum of (1000 asb) was used.

Table 2.
Parameters used by the two perimeters. The sensitivity decibel scale is a relative unit of measurement and, in perimetry, the is used by convention as the reference value. Therefore, 0 dB sensitivity is the brightest possible stimulus in a given perimeter or program. To account for these differences in , 14 dB must be added to the sensitivities of the Iowa-HM-perimeter. For clarity, we do this only for plotting the fields
| Parameter | Octopus 900 | Iowa-HM-perimeter | Comment |
|---|---|---|---|
| Background luminance | |||
| Difference in sensitivity offset: 14 dB | |||
| Stimulus size | Goldman III | ||
| Stimulus duration | 100 ms | 100 ms | |
| Location pattern | 10-2 | 10-2 | 68 locations, central |
| Strategy | TOP | ZEST |
2.4. Data Analysis
We analyzed only sensitivity values, because no age-related reference values were available for the head-mounted perimeter. A sensitivity of 0 dB is defined as the ability to just detect the most luminant stimulus that can be presented during the examination. This results in different offsets of the dB-scale in the two devices.
Throughout the manuscript, we compare uncorrected sensitivity values, and not “equivalent sensitivity” values (where the dB scales are corrected for differences in ), except for the visual field printouts. These were plotted with the vfplot() function of the visualFields library[29] for the statistical programming language R. Due to the vastly different dynamic ranges and the resulting floor effects, it is not reasonable to compare global indices like mean sensitivity (MS).
For comparison of sensitivity values between both modalities, Deming regression was used, because both measures have a measurement error[30].
Bland-Altman plots were created to compare perimetric sensitivities while censoring locations where sensitivities were smaller than 14 dB in the Octopus perimetry. Both eyes of each subject were included in the analyses. No dedicated correction for the correlation between both eyes of each patient was applied, because we performed no statistical testing. Analyses were performed for all 68 locations of each field (pointwise).
For Bland-Altman-plots locations with Octopus sensitivities below 14 dB were censored. Instead, we used a contingency table and the diagnostical measures sensitivity and specificity in order to evaluate the ability of the head-mounted perimeter to detect low perimetric sensitivities (< 14 dB in the Octopus field).
3. Results
3.1. Relationship Between Sensitivity Scales
Figure 2 shows the pointwise sensitivities and the corresponding threshold luminance increments that were observed with the two perimeters in our subjects. The plot illustrates the logarithmic relationship between luminance increments and perimetric sensitivities. By convention, perimetric sensitivities are quantified relative to the brightest stimulus the device can present, and therefore, 14 dB must be added to the HMP sensitivities, so that identical luminances correspond to identical sensitivities between the perimeters. The dynamic range of the Octopus (33 dB) is much larger than that of the Iowa HMP (16 dB).
Note that Figure 2 also illustrates that the Octopus is capable of measuring both 1) higher sensitivities (because of the higher luminance resolution) and 2) lower sensitivities (because it can produce more luminous stimuli). The inability of the head-mounted device to measure high sensitivities, as observed in normal subjects in the fovea, because very small changes in luminance on the left hand side of the plot result in large changes in sensitivity (ceiling effects). The HMP cannot produce sufficiently small luminance increments.
On the other hand, the head-mounted device cannot measure sensitivities below 14 dB Octopus equivalent sensitivity because it cannot produce more luminous stimuli (floor effects). Without the 0.6 ND filter, the dynamic range would extend more into the low sensitivity regions and floor effects would have been mitigated. However, the cost would have been larger ceiling effects, a flattened hill of vision and the inability to measure small sensitivity losses in the foveolar region[22].
Deming regression was used to characterize the relationship between pointwise HMP and Octopus sensitivities (see Figure 3, no correction for the different 0 dB setoff). Octopus sensitivities between below 14 dB and above 30 dB were censored from regression analysis, because ceiling and floor effects occur with the Iowa-HMP outside that range. Within this range, regression yielded a slope of 0.77 (95% confidence interval 0.70 to 0.84) with an intercept of -10.0 dB (95% CI: -11.8 to -8.3). This slope is smaller than the slope of 1 that would be expected if stimulus conditions, especially background luminance, had been identical in both perimeters. The spline fit (without censoring) suggested an even smaller slope of approximately 0.5. However, the deviation from the theoretical slope of 1 is small compared to the variability of perimetric measurements.
Therefore, we calculated HMP-measured “Octopus equivalent” sensitivities by simply adding 14 dB without correcting for slope for further comparison.
3.2. Agreement Between Measurements
The Bland-Altman plot showed good agreement for locations with Octopus sensitivities >14 dB with limits of agreement (LoA) of , and even better agreement for higher sensitivities (Figure 4). Only values were compared that were within the dynamic range of both devices. The systematic difference of exceeds the 14 dB predicted by the difference in offset by almost 2 dB, possibly due to the differences in background.
Thus, in order to compare agreement of perimeters in the low sensitivity range, we created a contingency table (Table 1). The HMP’s diagnostic sensitivity (true positives divided by true positives + false negatives) to detect Octopus sensitivity values below 14 dB was 0.67 and diagnostic specificity was 0.95. This suggests that the HMP has a tendency toward higher sensitivities close to the lower limit of its dynamic range.
Table 3.
Contingency table showing the agreement between examinations concerning whether sensitivities are outside the dynamic range of the HMD perimeter.
Table 3.
Contingency table showing the agreement between examinations concerning whether sensitivities are outside the dynamic range of the HMD perimeter.
| Octopus >= 14 dB | < 14 dB | |
|---|---|---|
| HMP >= 0 dB | 1001 | 191 |
| 0 dB | 55 | 385 |
3.3. Patterns of Visual Field Loss
The overall patterns are similar with both devices, and the characteristic patterns of occult macular dystrophy (OMD), ABCA4-associated Bull’s-Eye-maculopathy and retinitis pigmentosa could be clearly appreciated (Figure 5) with the HMP. In the OMD subjects, the central sensitivity losses were more pronounced with the head-mounted device. In the other two disease groups, there were transition zones with slightly decreased sensitivities, where losses were clearly overestimated with the head-mounted device (for example the deep superior defects in the patient with ring Bull’s-Eye scotoma, see Figure 5).
4. Discussion
This pilot study shows that head-mounted perimeters can show typical visual field patterns in inherited retinal diseases, including decreases in central sensitivity cause by occult macular dystrophy, bull’s eye defects and central scotomas in Stargardt’s disease and concentric defects in retinitis pigmentosa. However, the pointwise comparison shows that HMP perimeters are not equivalent to projection-based systems. For this study, we used a low-budged, open-source head-mounted perimeter[22], which is based on the open-perimetry initiative (OPI) interface[23,24,29]. Open software allows modification of testing protocols and greatly facilitates research.
4.1. Differences in Measurements Between the HMP and the Projection-Based System
Although typical visual field loss patterns could be discerned in our study, measurements were not equivalent. Foremost, the HMP (like other HMP devices[11]) has a much smaller dynamic range than the Octopus perimeter, resulting in both floor and ceiling effects (see Figure 2). Therefore, in the normal subject in Figure 5, central sensitivities were lower. With a background luminance of , our device had a dynamic range of 16 dB, which means that the strongest stimulus is 40 times brighter than the dimmest stimulus. In contrast, the Octopus perimeter has a much larger dynamic range of 33 dB. On the other hand, the minimal luminance increments that can be achieved with head-mounted devices are too large to measure the very high sensitivities in the fovea. Because head-mounted devices are RGB displays, there are 255 equally spaced luminance increments between the smallest and the largest . This results in a flattened hill of vision centrally.
Following the study by Heinzman and coworkers[22], we used a neutral density (ND) filter to mitigate the ceiling effect at the cost of a more pronounced floor effect. The neutral density filter can be omitted when patients with low sensitivities are examined, but perimetry is more reliable in areas of high sensitivity, so that the effective dynamic range is likely improved by the ND filter[31]. The limited dynamic range is inherent to the underlying hardware and affects all head-mounted devices, even though some of them have a larger dynamic range[11]. Technically, dynamic range can be expanded using software techniques like dithering or different hardware, for example 10 bit displays.
Some HMP devices drastically reduce background luminance in order to expand dynamic range[12,32], but this only mitigates floor and not ceiling effects. Furthermore, due to the different adaptive state of the retina, photoreceptor damage can have different functional consequences with different background luminances[8].
In our study, the background luminance was lower in the Octopus perimeter, because, inadvertently, a protocol with legacy settings was used throughout the study (these settings allow comparison with older measurements from Octopus 500 perimeters for a longitudinal study with very long follow-up[33]). In the perimeter with lower background luminance, the Weber contrast is increased for any given . Therefore, systematically and constantly higher sensitivities would be expected for the Octopus perimeter in our study, had both perimeters operated in the Weber range (where perception depends on contrast rather than absolute luminances). Thus, the slope of the Deming regression confirms that perimeters do not operate in the Weber range, at least at [4]. The 15.92 dB systematic difference in the Bland-Altman analysis exceeds the 14 dB predicted by the difference in , but not by the amount predicted by the difference in Weber range. Again, such problems may affect all perimeters that use different background luminances. In several publications, very low background luminances were used in the head-mounted device in order to increase the dynamic range[12,32]. On the other hand, these limitations also offers the opportunity to question old standards and new testing protocols could be developed in order to improve diagnostic power[8].
Given these differences, the limits of agreement in the Bland-Altman analyses () were quite good. This was also comparable to earlier comparisons of the Iowa head-mounted perimeter with the Octopus 900 in normal subjects (mean difference 0.4 dB, limits of agreement ) and patients with glaucoma (mean difference 0.1dB, limits of agreement )16.
4.2. First Use of Head-Mounted Perimeter in Patients with IRDs
To our knowledge, this is the first study that demonstrates the feasibility of perimetry measurements with head-mounted devices in patients with IRDs. Typical disease patterns could be demonstrated despite limiting floor- and ceiling-defects.
Interestingly, central sensitivities of the patients with occult macular dystrophies were lower when measured with the head-mounted perimeter. Possibly, this could be explained by the differences in background luminance. The structure-function relationship is complex in retinal diseases and depends on the affected photoreceptor types and the retinal adaptation[8,34]. In the fovea, the parvocellular system is more dominant compared to the peripheral retina and it may be involved in the detection of perimetric stimuli[35], particularly for relatively long stimulus presentation times as used for perimetry[36]. Finally, the area of complete summation (Ricco’s Area) is smaller in the central retina, so that perimetric stimuli are frequently larger than this area, which is not optimal for reproducibility of results[12].
On the other hand, darker backgrounds might be superior to the used in SAP[2,37]. Furthermore, protocols where stimulus size is adjusted instead of luminance (size threshold perimetry) could be investigated for improving reliability of measurements in inherited retinal diseases[38]. Thus, the introduction of HMP might facilitate improvements of testing protocols, as long as researchers have the opportunity to experiment without limitations imposed by manufacturers who are interested in a rapid proof of equivalence with SAP[10].
4.3. Open-Source HMP
For the Iowa HMP, considerable patience and knowledge of the programming language R, networking and luminance measurements are necessary in order to set up the device, because it is based on open-source projects and because it is no longer fully supported by the maintainers. Legacy equipment (smartphone) and neutral density filters are needed for building the device[22]. Most importantly, it cannot be used for clinical diagnosis, because has neither a CE-mark nor approval as a medical device.
The advantages of the Iowa head-mounted perimeter are the low price, the experimental degrees of freedom concerning the test parameters, and the control over the collected data, which is saved locally and completely available for analysis. In our case the price was less than 300 Euro, excluding the desktop computer and the equipment for a local WiFi, which were already part of the Lab infrastructure. Many commercially available head-mounted-perimeters process data on a backend server (which can be in another country)[9].
Other smartphone-based visual field tests have been published[32,39,40], but the Iowa-HMP is the only one that is based on open-source software, where the full source code is available for research purposes[24]. Furthermore, this source code is developed and maintained in the context of the Open Perimetry Initiative, which serves as a platform for continuous and transparent development of perimetric methods in the future[23].
4.4. Limitations
The major limitation of our study is the small sample size. However, the study was a pilot for optimizing the research protocol. A larger study is already planned, which systematically investigates modifications of the protocol, including background luminance, stimulus size and testing locations in various retinal diseases.
Furthermore, it is not clear which consequence eccentric fixation has in the context of binocular fixation. The background and the fixation cross are presented to both eyes, but the stimulus itself is presented only on one side of the split screen (see Figure 1). This will also be investigated. Possibly, the alignment of the testing grid is not perfect in the HMP, because the manufacturer did not provide a Google Daydream QR code with the headset.
A further limitation of the Iowa head-mounted perimeter compared with other available HMPs is the lack of an eye tracking system that detects malfixation during the exam[10].
4.5. Implications for Clinicians
Head-mounted perimeters enable more widespread availability of perimetry in telemedical settings and underserved populations and offer higher patient comfort. However, they are clearly inferior to conventional perimeters in dynamic range. Therefore, they show a flattened hill of vision in normal subjects and cannot detect small losses of sensitivity in the macula, because the dimmest stimulus they can produce is too easily recognizable (ceiling effects). Furthermore, they cannot quantify large sensitivity losses (in the Iowa-HMP: sensitivities below 14 dB of Octopus sensitivity) due to floor effects. Therefore, it is not possible to differentiate poor sensitivities from absolute scotomas[22]. Furthermore, global indices like the mean defect (MD) cannot easily be compared between HMD parameters and conventional parameters, because sensitivities below the lower end of the dynamic range will affect the arithmetic average. This is an inherent limitation of the displays that are used in head-mounted devices. Although technical developments may mitigate this limitation, the question remains whether these developments will be used in consumer electronics so that the price advantage of head-mounted devices can be maintained.
HMPs have been validated in glaucoma and can be used there if regulatory approval is available and the clinician is aware of the limitations. However, it has not been validated in retinal disease[10]. To our knowledge, this is the first study on HMP in inherited retinal diseases, and our study clearly shows that HMP cannot characterize the entire range of pathological changes in IRDs and, thus, cannot replace conventional perimeters. Open-source perimeters enable researchers to develop new testing protocols that fully leverage the potential of HMD-based perimetry.
5. Conclusions
HMP can be used to identify characteristic patterns of visual field loss in inherited retinal diseases, but it cannot fully characterize sensitivities in the full range observed in inherited retinal diseases. Modifications in the testing protocol may limit comparability to established standards, but also offer the opportunity for improved protocols. Open software greatly facilitates research in this area.
Author Contributions
Conceptualization, C.H.; methodology, C.H.; validation, C.H. and J.K.; formal analysis, C.H.; investigation, C.H. and J.K.; resources, F.K..; data curation, C.H.; writing—original draft preparation, C.H.; writing—review and editing, J.K.; visualization, C.H..; supervision, F.K. and J.K.; project administration, C.H..; funding acquisition, C.H. All authors have read and agreed to the published version of the manuscript.
Funding
This research was funded by Deutsche Forschungsgemeinschaft (DFG, German Research Foundation), grant number HU2340/1-2.
Institutional Review Board Statement
The study was conducted in accordance with the Declaration of Helsinki, and approved by the Ethics Committee of the Friedrich-Alexander University Erlangen-Nürnberg (protocol code 300-17B, 07/20/2018).
Informed Consent Statement
Informed consent was obtained from all subjects involved in the study.
Data Availability Statement
Data will be provided by the corresponding author upon reasonable request.
Acknowledgments
The authors would like to thank Sarah Stolper for the careful conduct of the HMD examinations.
Conflicts of Interest
The authors declare no conflicts of interest. The funders had no role in the design of the study; in the collection, analyses, or interpretation of data; in the writing of the manuscript; or in the decision to publish the results.
References
- Jacobson, S.G.; Voigt, W.J.; Parel, J.M.; Apáthy, P.P.; Nghiem-Phu, L.; Myers, S.W.; Patella, V.M. Automated light- and dark-adapted perimetry for evaluating retinitis pigmentosa. Ophthalmology 1986, 93, 1604–1611. [Google Scholar] [CrossRef]
- Wu, V.; Roman, A.J.; Galsterer, E.L.; Ansari, G.; Erdinest, I.; Righetti, G.; Viarbitskaya, I.; Russell, R.C.; Kim, R.J.; Charlier, J.; et al. Measuring Rod- and Cone-Photoreceptor-Specific Vision in Inherited Retinal Diseases Using a Commercial Perimeter. Investigative Ophthalmology & Visual Science 2025, 66, 31. [Google Scholar] [CrossRef]
- Sample, P.A.; Dannheim, F.; Artes, P.H.; Dietzsch, J.; Henson, D.; Johnson, C.A.; Ng, M.; Schiefer, U.; Wall, M.; IPS Standards Group. Imaging and Perimetry Society standards and guidelines. Optometry and Vision Science: Official Publication of the American Academy of Optometry 2011, 88, 4–7. [Google Scholar] [CrossRef]
- Fankhauser, F. Problems related to the design of automatic perimeters. Documenta Ophthalmologica. Advances in Ophthalmology 1979, 47, 89–139. [Google Scholar] [CrossRef] [PubMed]
- Bebie, H.; Fankhauser, F.; Spahr, J. Static Perimetry: Strategies. Acta Ophthalmologica 1976, 54, 325–338. [Google Scholar] [CrossRef]
- Asman, P.; Britt, J.M.; Mills, R.P.; Heijl, A. Evaluation of adaptive spatial enhancement in suprathreshold visual field screening. Ophthalmology 1988, 95, 1656–1662. [Google Scholar] [CrossRef]
- Mills, R.P.; Hopp, R.H.; Drance, S.M. Comparison of quantitative testing with the Octopus, Humphrey, and Tübingen perimeters. American Journal of Ophthalmology 1986, 102, 496–504. [Google Scholar] [CrossRef] [PubMed]
- Phu, J.; Khuu, S.K.; Nivison-Smith, L.; Kalloniatis, M. Standard automated perimetry for glaucoma and diseases of the retina and visual pathways: Current and future perspectives. Progress in Retinal and Eye Research 2025, 104, 101307. [Google Scholar] [CrossRef] [PubMed]
- Selvan, K.; Mina, M.; Abdelmeguid, H.; Gulsha, M.; Vincent, A.; Sarhan, A. Virtual reality headsets for perimetry testing: a systematic review. Eye 2024, 38, 1041–1064. [Google Scholar] [CrossRef]
- Vera, J.; Glazier, A.N.; Dunbar, M.T.; Ripkin, D.; Nafey, M. Evaluating the Clinical Validity of Commercially Available Virtual Reality Headsets for Visual Field Testing: A Systematic Review. Vision (Basel, Switzerland) 2025, 9, 80. [Google Scholar] [CrossRef]
- Lee, C.; Redden, L.; Eng, V.; Eadie, B. Luminance and thresholding limitations of virtual reality headsets for visual field testing. PloS One 2025, 20, e0332795. [Google Scholar] [CrossRef]
- Phu, J.; Wang, H.; Kalloniatis, M. Comparing a head-mounted virtual reality perimeter and the Humphrey Field Analyzer for visual field testing in healthy and glaucoma patients. Ophthalmic and Physiological Optics 2024, 44, 83–95. [Google Scholar] [CrossRef]
- Cook, C. Is Clinical Gestalt Good Enough? The Journal of Manual & Manipulative Therapy 2009, 17, 6–7. [Google Scholar] [CrossRef]
- Ahn, S.J.; Yang, L.; Tsunoda, K.; Kondo, M.; Fujinami-Yokokawa, Y.; Nakamura, N.; Iwata, T.; Kim, M.S.; Mun, Y.; Park, J.Y.; et al. Visual Field Characteristics in East Asian Patients With Occult Macular Dystrophy (Miyake Disease): EAOMD Report No. 3. Investigative Ophthalmology & Visual Science 2022, 63, 12. [Google Scholar] [CrossRef]
- McGuigan, D.B.; Roman, A.J.; Cideciyan, A.V.; Matsui, R.; Gruzensky, M.L.; Sheplock, R.; Jacobson, S.G. Automated Light- and Dark-Adapted Perimetry for Evaluating Retinitis Pigmentosa: Filling a Need to Accommodate Multicenter Clinical Trials. Investigative Ophthalmology & Visual Science 2016, 57, 3118–3128. [Google Scholar] [CrossRef]
- Jacobson, S.G.; Roman, A.J.; Aleman, T.S.; Sumaroka, A.; Herrera, W.; Windsor, E.A.M.; Atkinson, L.A.; Schwartz, S.B.; Steinberg, J.D.; Cideciyan, A.V. Normal central retinal function and structure preserved in retinitis pigmentosa. Investigative Ophthalmology & Visual Science 2010, 51, 1079–1085. [Google Scholar] [CrossRef]
- Marmor, M.F.; Kellner, U.; Lai, T.Y.Y.; Melles, R.B.; Mieler, W.F.; American Academy of Ophthalmology. Recommendations on Screening for Chloroquine and Hydroxychloroquine Retinopathy (2016 Revision). Ophthalmology 2016, 123, 1386–1394. [Google Scholar] [CrossRef]
- Hardcastle, A.J.; Sieving, P.A.; Sahel, J.A.; Jacobson, S.G.; Cideciyan, A.V.; Flannery, J.G.; Beltran, W.A.; Aguirre, G.D. Translational Retinal Research and Therapies. Translational Vision Science & Technology 2018, 7, 8. [Google Scholar] [CrossRef]
- Roman, A.J.; Schwartz, S.B.; Aleman, T.S.; Cideciyan, A.V.; Chico, J.D.; Windsor, E.A.M.; Gardner, L.M.; Ying, G.S.; Smilko, E.E.; Maguire, M.G.; et al. Quantifying rod photoreceptor-mediated vision in retinal degenerations: dark-adapted thresholds as outcome measures. Experimental Eye Research 2005, 80, 259–272. [Google Scholar] [CrossRef]
- Pfau, M.; Jolly, J.K.; Wu, Z.; Denniss, J.; Lad, E.M.; Guymer, R.H.; Fleckenstein, M.; Holz, F.G.; Schmitz-Valckenberg, S. Fundus-controlled perimetry (microperimetry): Application as outcome measure in clinical trials. Progress in Retinal and Eye Research 2021, 82, 100907. [Google Scholar] [CrossRef]
- Josan, A.S.; Buckley, T.M.W.; Wood, L.J.; Jolly, J.K.; Cehajic-Kapetanovic, J.; MacLaren, R.E. Microperimetry Hill of Vision and Volumetric Measures of Retinal Sensitivity. Translational Vision Science & Technology 2021, 10, 12. [Google Scholar] [CrossRef]
- Heinzman, Z.; Linton, E.; Marín-Franch, I.; Turpin, A.; Alawa, K.; Wijayagunaratne, A.; Wall, M. Validation of the Iowa Head-Mounted Open-Source Perimeter. Translational Vision Science & Technology 2023, 12, 19. [Google Scholar] [CrossRef]
- Marín-Franch, I.; Turpin, A.; Artes, P.H.; Chong, L.X.; McKendrick, A.M.; Alawa, K.A.; Wall, M. The Open Perimetry Initiative: A framework for cross-platform development for the new generation of portable perimeters. Journal of Vision 2022, 22, 1. [Google Scholar] [CrossRef]
- Turpin, A.; Artes, P.H.; McKendrick, A.M. The Open Perimetry Interface: An enabling tool for clinical visual psychophysics. Journal of vision 2012, 12. [Google Scholar] [CrossRef]
- Huchzermeyer, C.; Fars, J.; Kremers, J. Photoreceptor-Specific Loss of Perifoveal Temporal Contrast Sensitivity in Retinitis Pigmentosa. Translational Vision Science & Technology 2020, 9, 27. [Google Scholar] [CrossRef]
- Fars, J.; Pasutto, F.; Kremers, J.; Huchzermeyer, C. Perifoveal Cone- and Rod-Mediated Temporal Contrast Sensitivities in Stargardt Disease/Fundus Flavimaculatus. Investigative Ophthalmology & Visual Science 2021, 62, 24. [Google Scholar] [CrossRef]
- Huchzermeyer, C.; Fars, J.; Kremers, J.; Kühlewein, L.; Kempf, M.; Ott, S.; Stingl, K.; Stingl, K. Photoreceptor-Specific Temporal Contrast Sensitivities in RP1L1-Associated Occult Macular Dystrophy. Investigative Ophthalmology & Visual Science 2023, 64, 33. [Google Scholar] [CrossRef]
- Huchzermeyer, C.; Stingl, K.; Kremers, J. Multidimensional Functional Phenotyping Based on Photoreceptor-Directed Temporal Contrast Sensitivity Defects in Inherited Retinal Diseases. Investigative Ophthalmology & Visual Science 2025, 66, 25. [Google Scholar] [CrossRef]
- Marín-Franch, I.; Swanson, W.H. The visualFields package: a tool for analysis and visualization of visual fields. Journal of Vision 2013, 13. [Google Scholar] [CrossRef]
- Deming, W.E. Statistical adjustment of data, 1st ed. ed.; John Wiley & Sons: New York, London, 1943; Open Library ID: OL6456639M. [Google Scholar]
- Wall, M.; Woodward, K.R.; Doyle, C.K.; Zamba, G. The effective dynamic ranges of standard automated perimetry sizes III and V and motion and matrix perimetry. Archives of Ophthalmology (Chicago, Ill.: 1960) 2010, 128, 570–576. [Google Scholar] [CrossRef]
- Grau, E.; Andrae, S.; Horn, F.; Hohberger, B.; Ring, M.; Michelson, G. Teleglaucoma Using a New Smartphone-Based Tool for Visual Field Assessment. Journal of Glaucoma 2023, 32, 186–194. [Google Scholar] [CrossRef]
- Huchzermeyer, C.; Lämmer, R.; Mardin, C.Y.; Kruse, F.E.; Kremers, J.; Horn, F.K. Pattern electroretinogram, blue-yellow visual evoked potentials and the risk of developing visual field defects in glaucoma suspects: a longitudinal "survival" analysis with a very long follow-up. In Graefe’s Archive for Clinical and Experimental Ophthalmology = Albrecht Von Graefes Archiv Fur Klinische Und Experimentelle Ophthalmologie; 2024. [Google Scholar] [CrossRef]
- Simunovic, M.P.; Hess, K.; Avery, N.; Mammo, Z. Threshold versus intensity functions in two-colour automated perimetry. Ophthalmic and Physiological Optics 2021, 41, 157–164. [Google Scholar] [CrossRef]
- Simunovic, M.P.; Moore, A.T.; MacLaren, R.E. Selective Automated Perimetry Under Photopic, Mesopic, and Scotopic Conditions: Detection Mechanisms and Testing Strategies. Translational Vision Science & Technology 2016, 5, 10. [Google Scholar] [CrossRef]
- Lennie, P.; Pokorny, J.; Smith, V.C. Luminance. Journal of the Optical Society of America. A, Optics and image science 1993, 10, 1283–1293. [Google Scholar] [CrossRef]
- Cideciyan, A.V.; Swider, M.; Aleman, T.S.; Feuer, W.J.; Schwartz, S.B.; Russell, R.C.; Steinberg, J.D.; Stone, E.M.; Jacobson, S.G. Macular Function in Macular Degenerations: Repeatability of Microperimetry as a Potential Outcome Measure for ABCA4-Associated Retinopathy Trials. Investigative Ophthalmology & Visual Science 2012, 53, 841–852. [Google Scholar] [CrossRef]
- Wall, M.; Doyle, C.K.; Eden, T.; Zamba, K.D.; Johnson, C.A. Size threshold perimetry performs as well as conventional automated perimetry with stimulus sizes III, V, and VI for glaucomatous loss. Investigative Ophthalmology & Visual Science 2013, 54, 3975–3983. [Google Scholar] [CrossRef]
- Anderson, A.J.; Bedggood, P.A.; Kong, Y.X.G.; Martin, K.R.; Vingrys, A.J. Can Home Monitoring Allow Earlier Detection of Rapid Visual Field Progression in Glaucoma? Ophthalmology 2017, 124, 1735–1742. [Google Scholar] [CrossRef]
- Prea, S.M.; Kong, Y.X.G.; Mehta, A.; He, M.; Crowston, J.G.; Gupta, V.; Martin, K.R.; Vingrys, A.J. Six-month Longitudinal Comparison of a Portable Tablet Perimeter With the Humphrey Field Analyzer. American Journal of Ophthalmology 2018, 190, 9–16. [Google Scholar] [CrossRef]
Figure 1.
Headset equipped with a 0.6 neutral density filter foil. A Samsung galaxy S10e is inserted into this headset for perimetry. The inset shows the smartphone display with the perimetry app running. The total price for the device (excluding the personal computer running the software) was below 300 Euro.
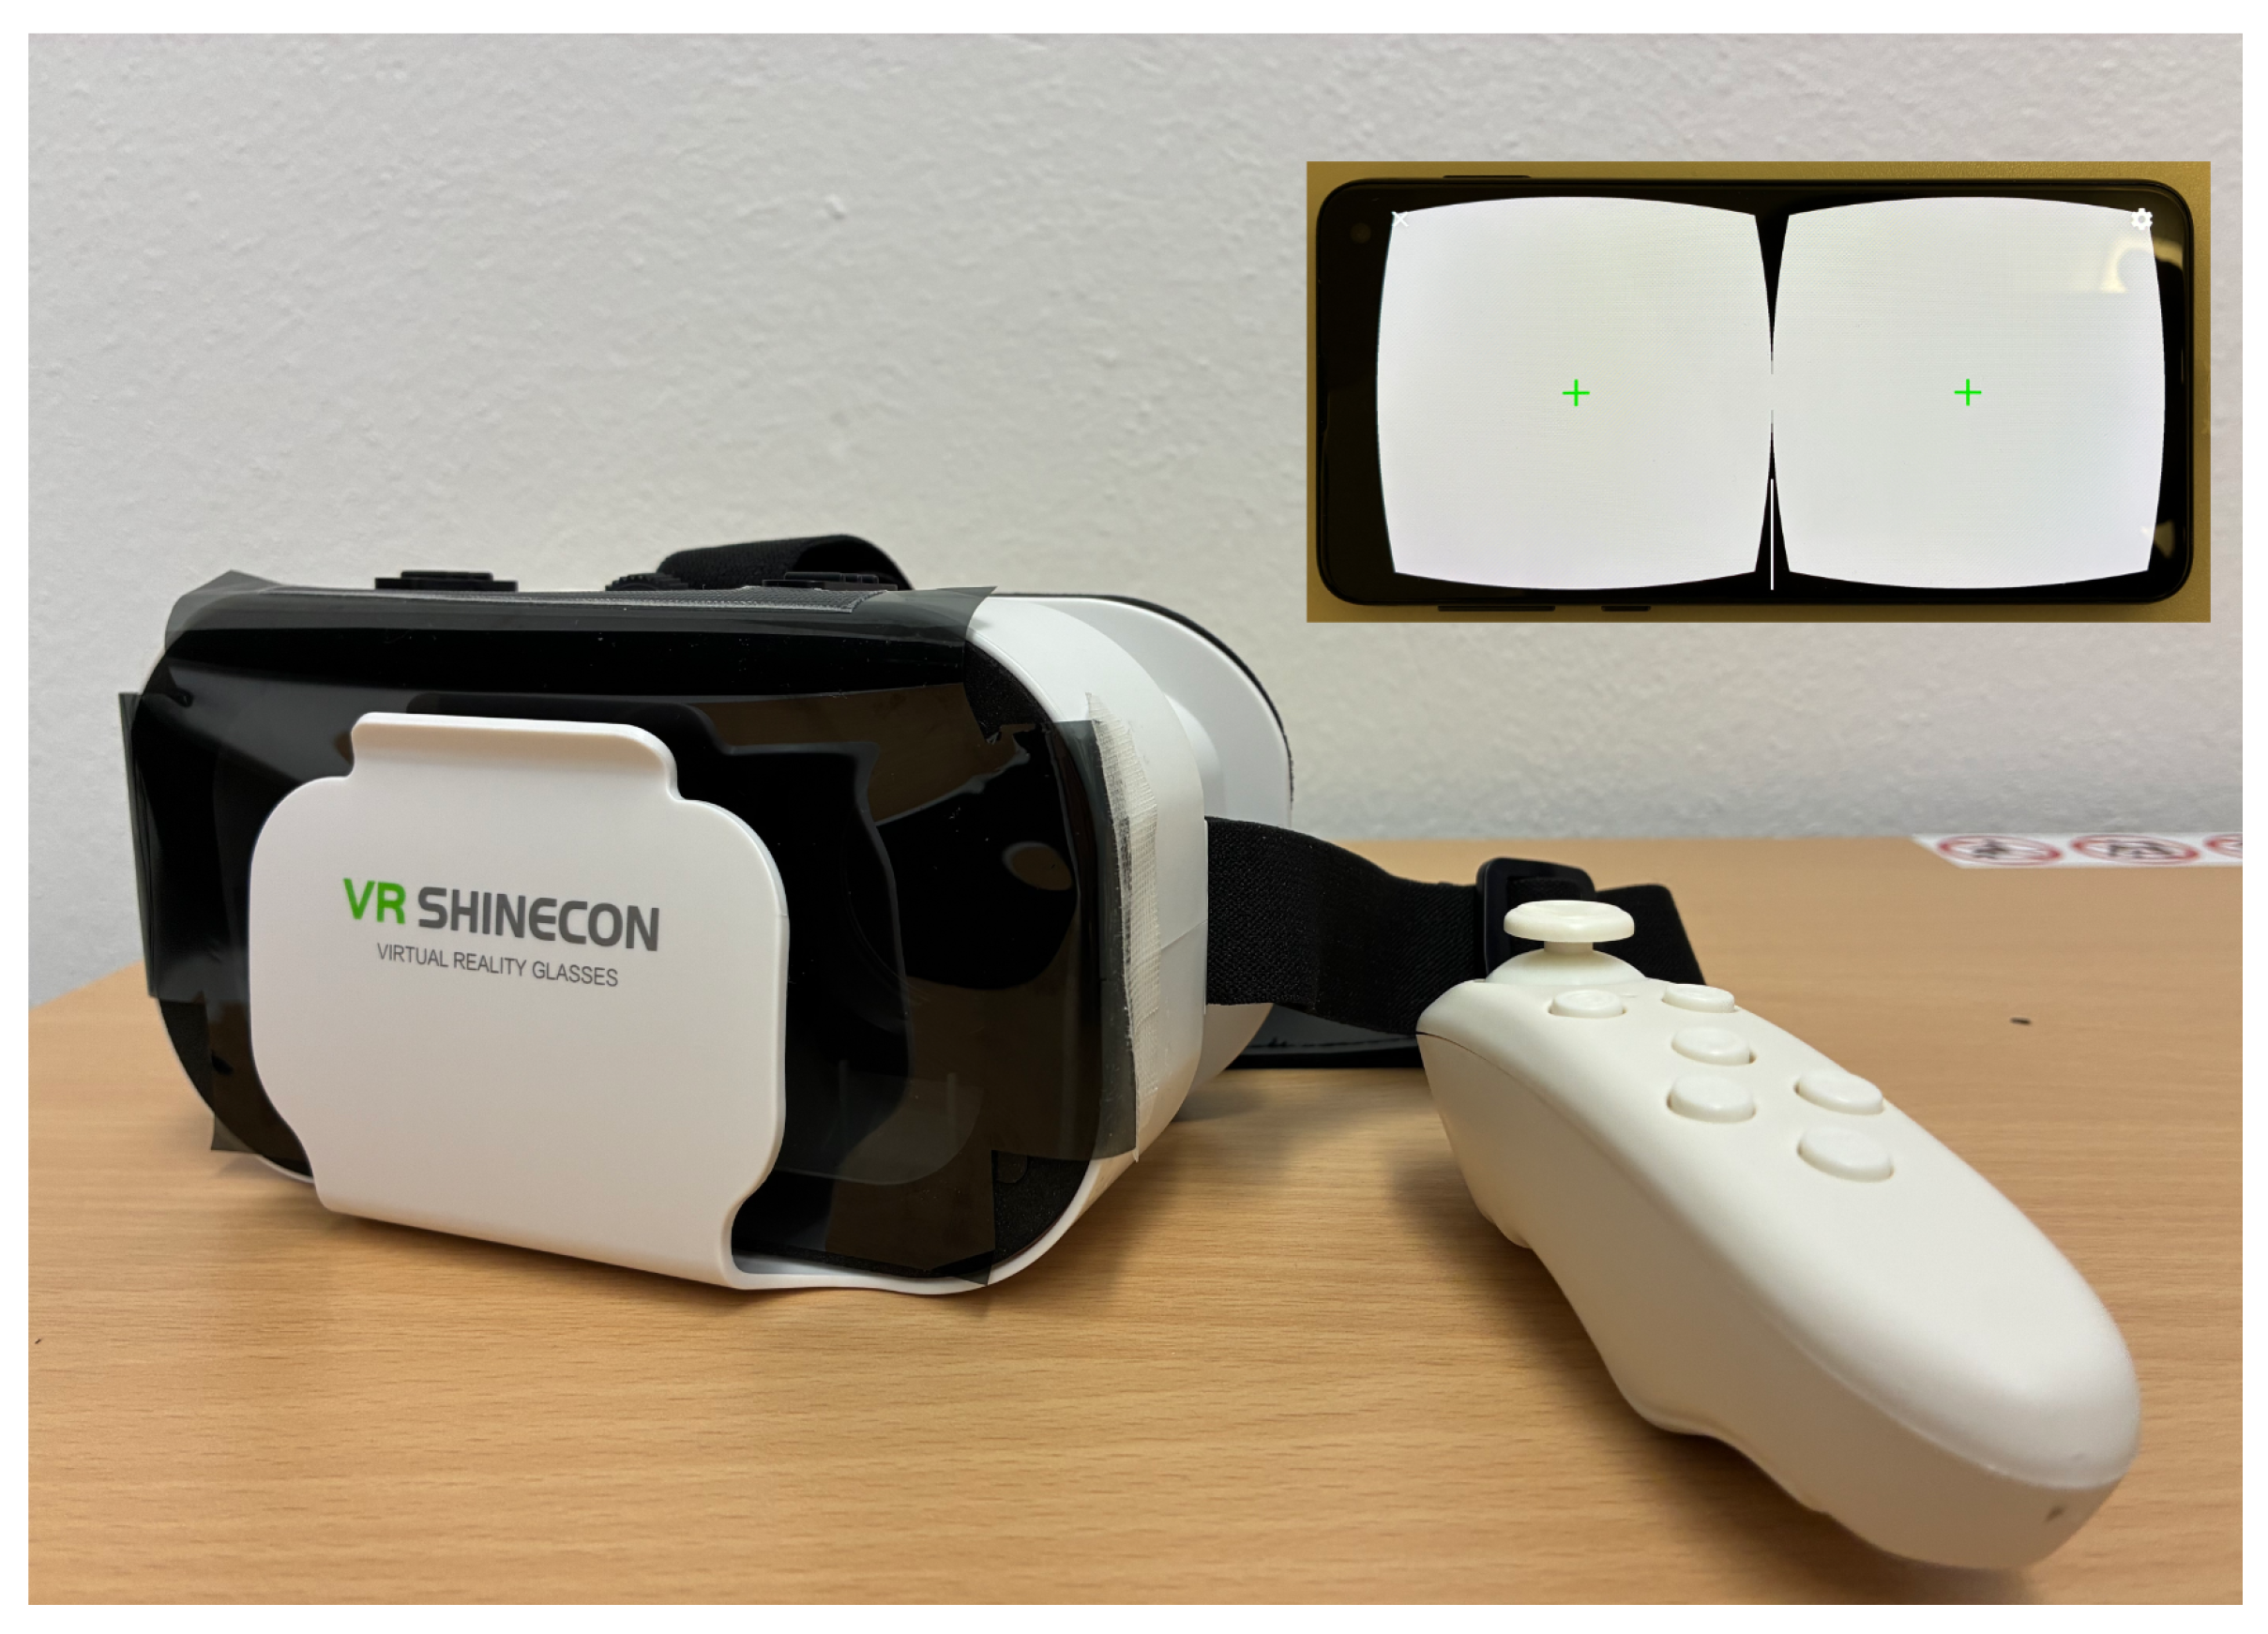
Figure 2.
Stimulus luminances and the corresponding retinal sensitivities that were observed in our study population with the Octopus perimeter (black) and the head-mounted device (red, shifted upward by 14 dB to account for the different and slightly shifted to the right to avoid overplotting). There is a simple mathematical relationship between Luminance and Sensitivity.
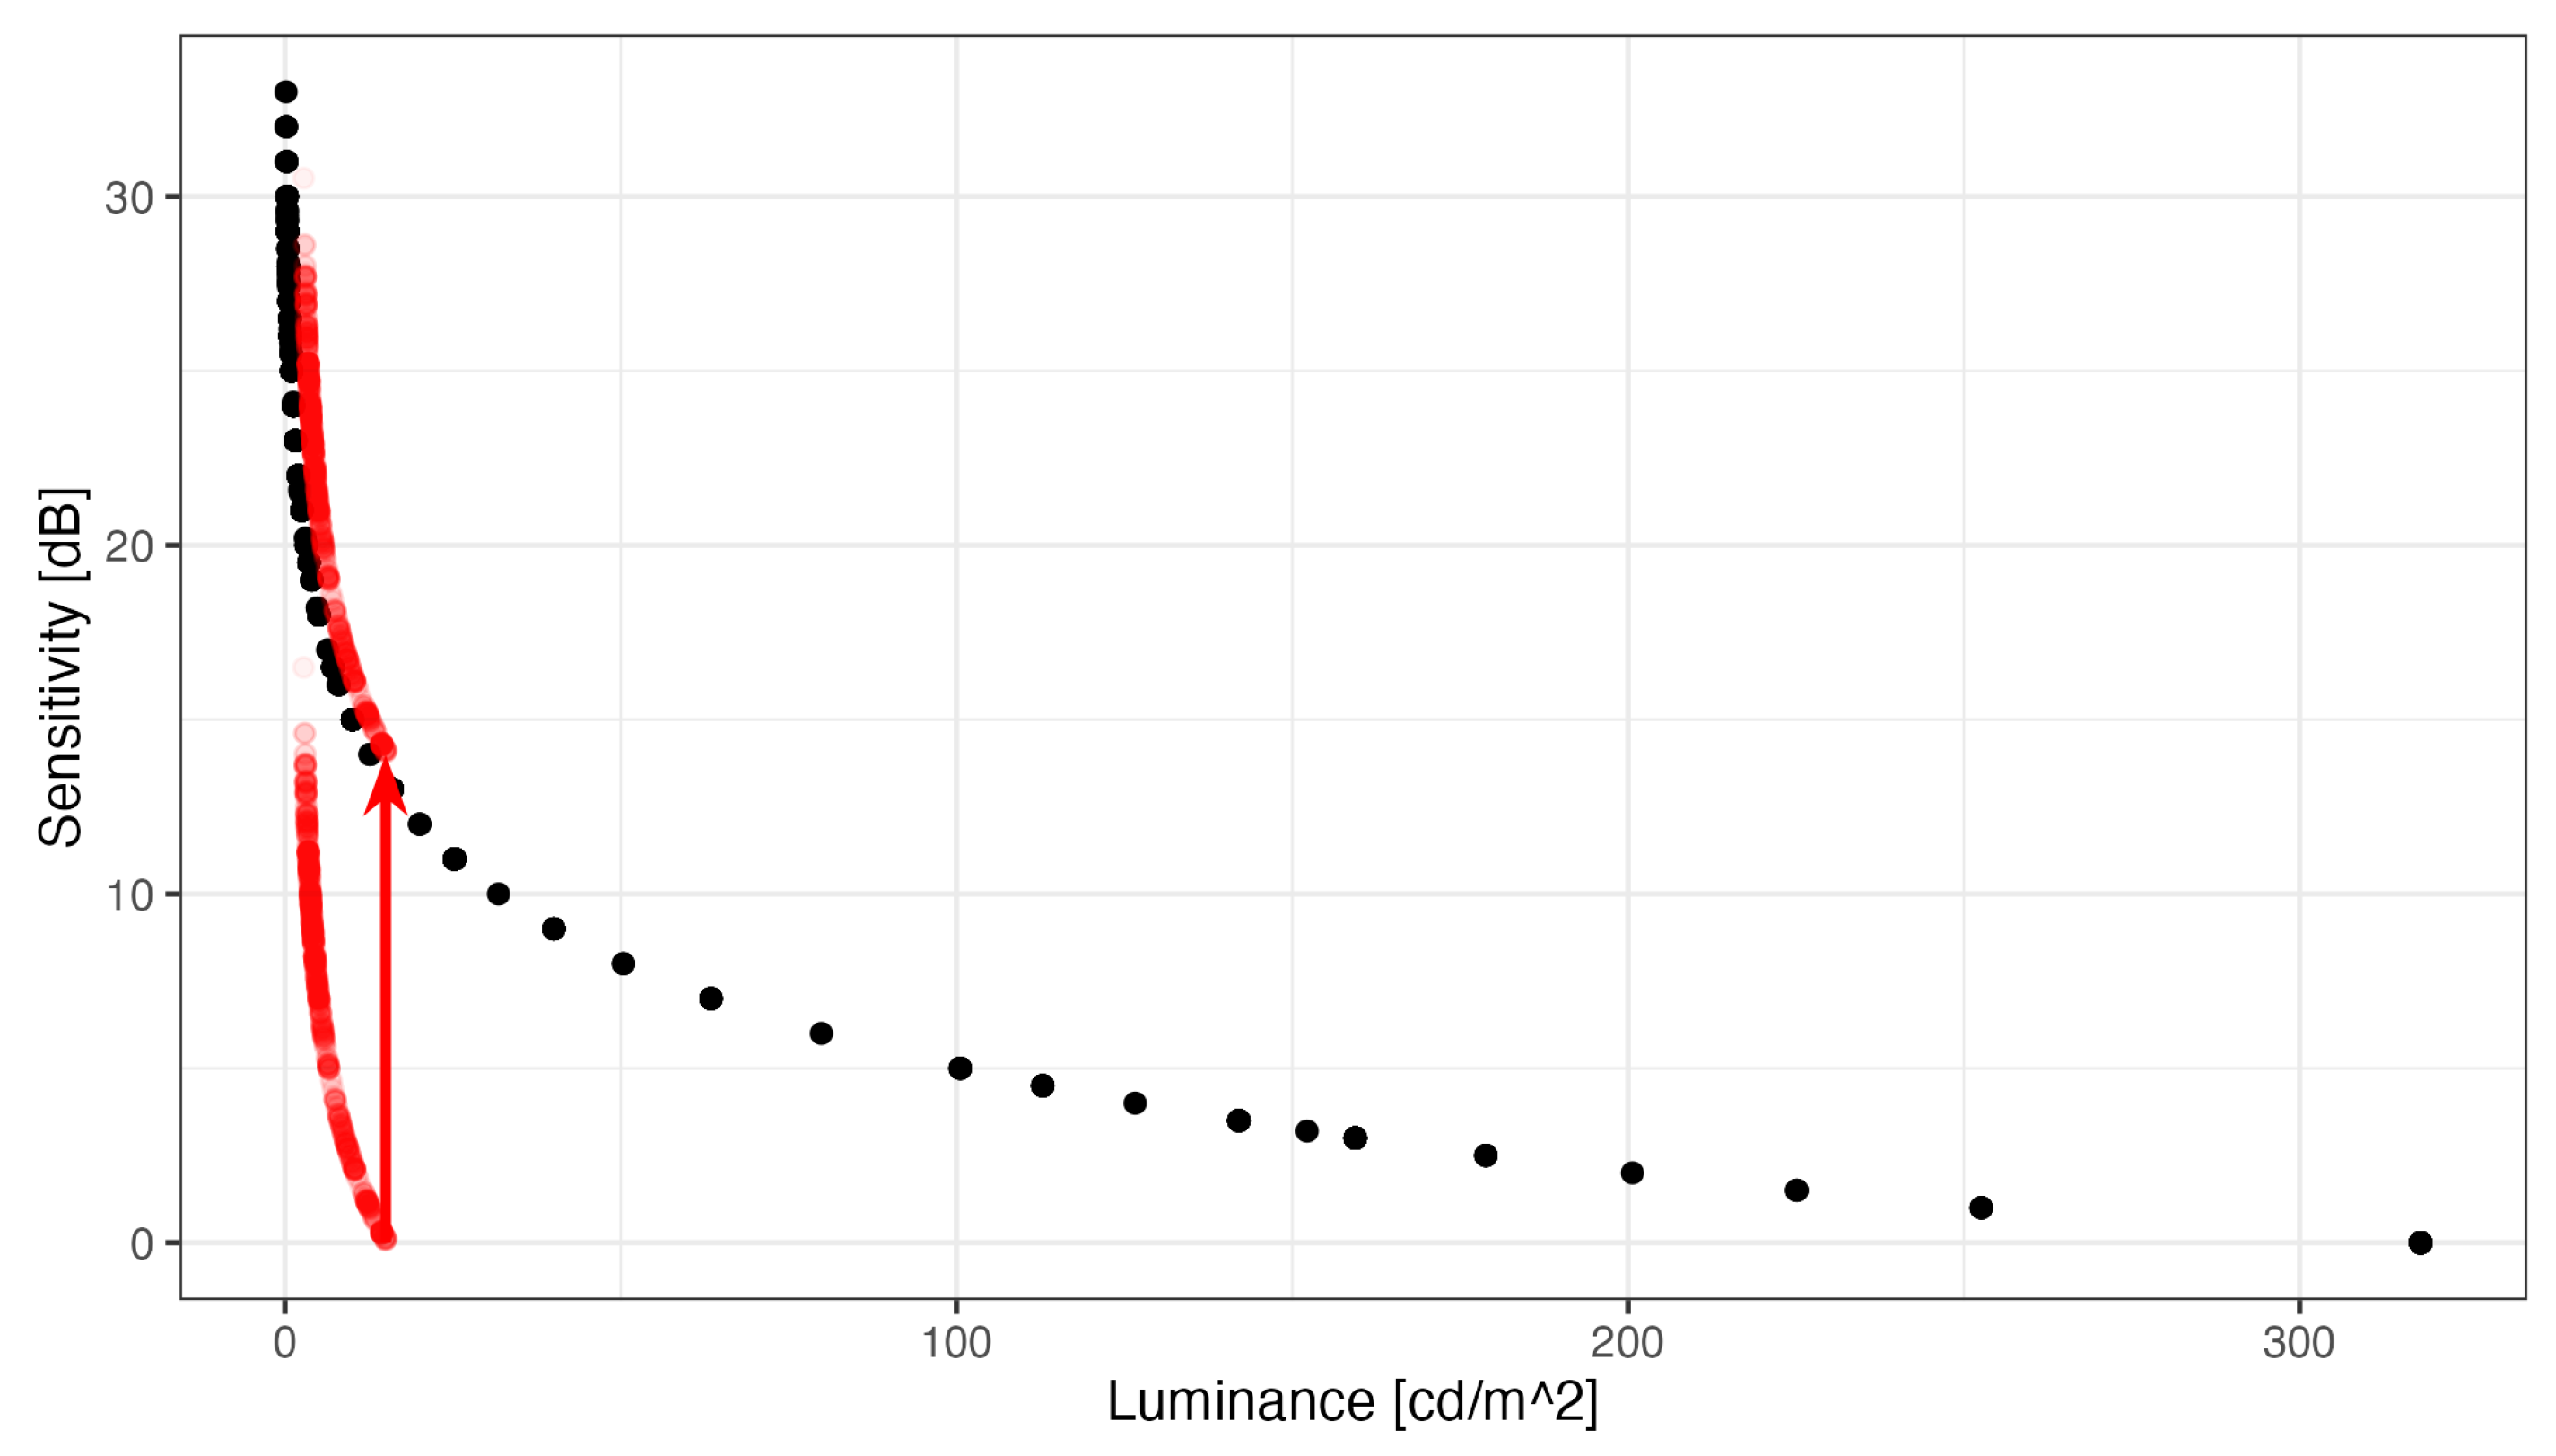
Figure 3.
Relationship between the measured Octopus sensitivities and the corresponding head-mounted perimetry sensitivities. The blue line shows a spline fit, which highlights the floor effects below 14 dB sensitivity. The drawn black line shows a the Deming regression line through the points with Octopus sensitivities larger than 14 dB and smaller than 30 dB (floor and ceiling effects expected in the HDM perimetry). The dashes line shows a line with a slope of 1 and an intercept of -14 dB.
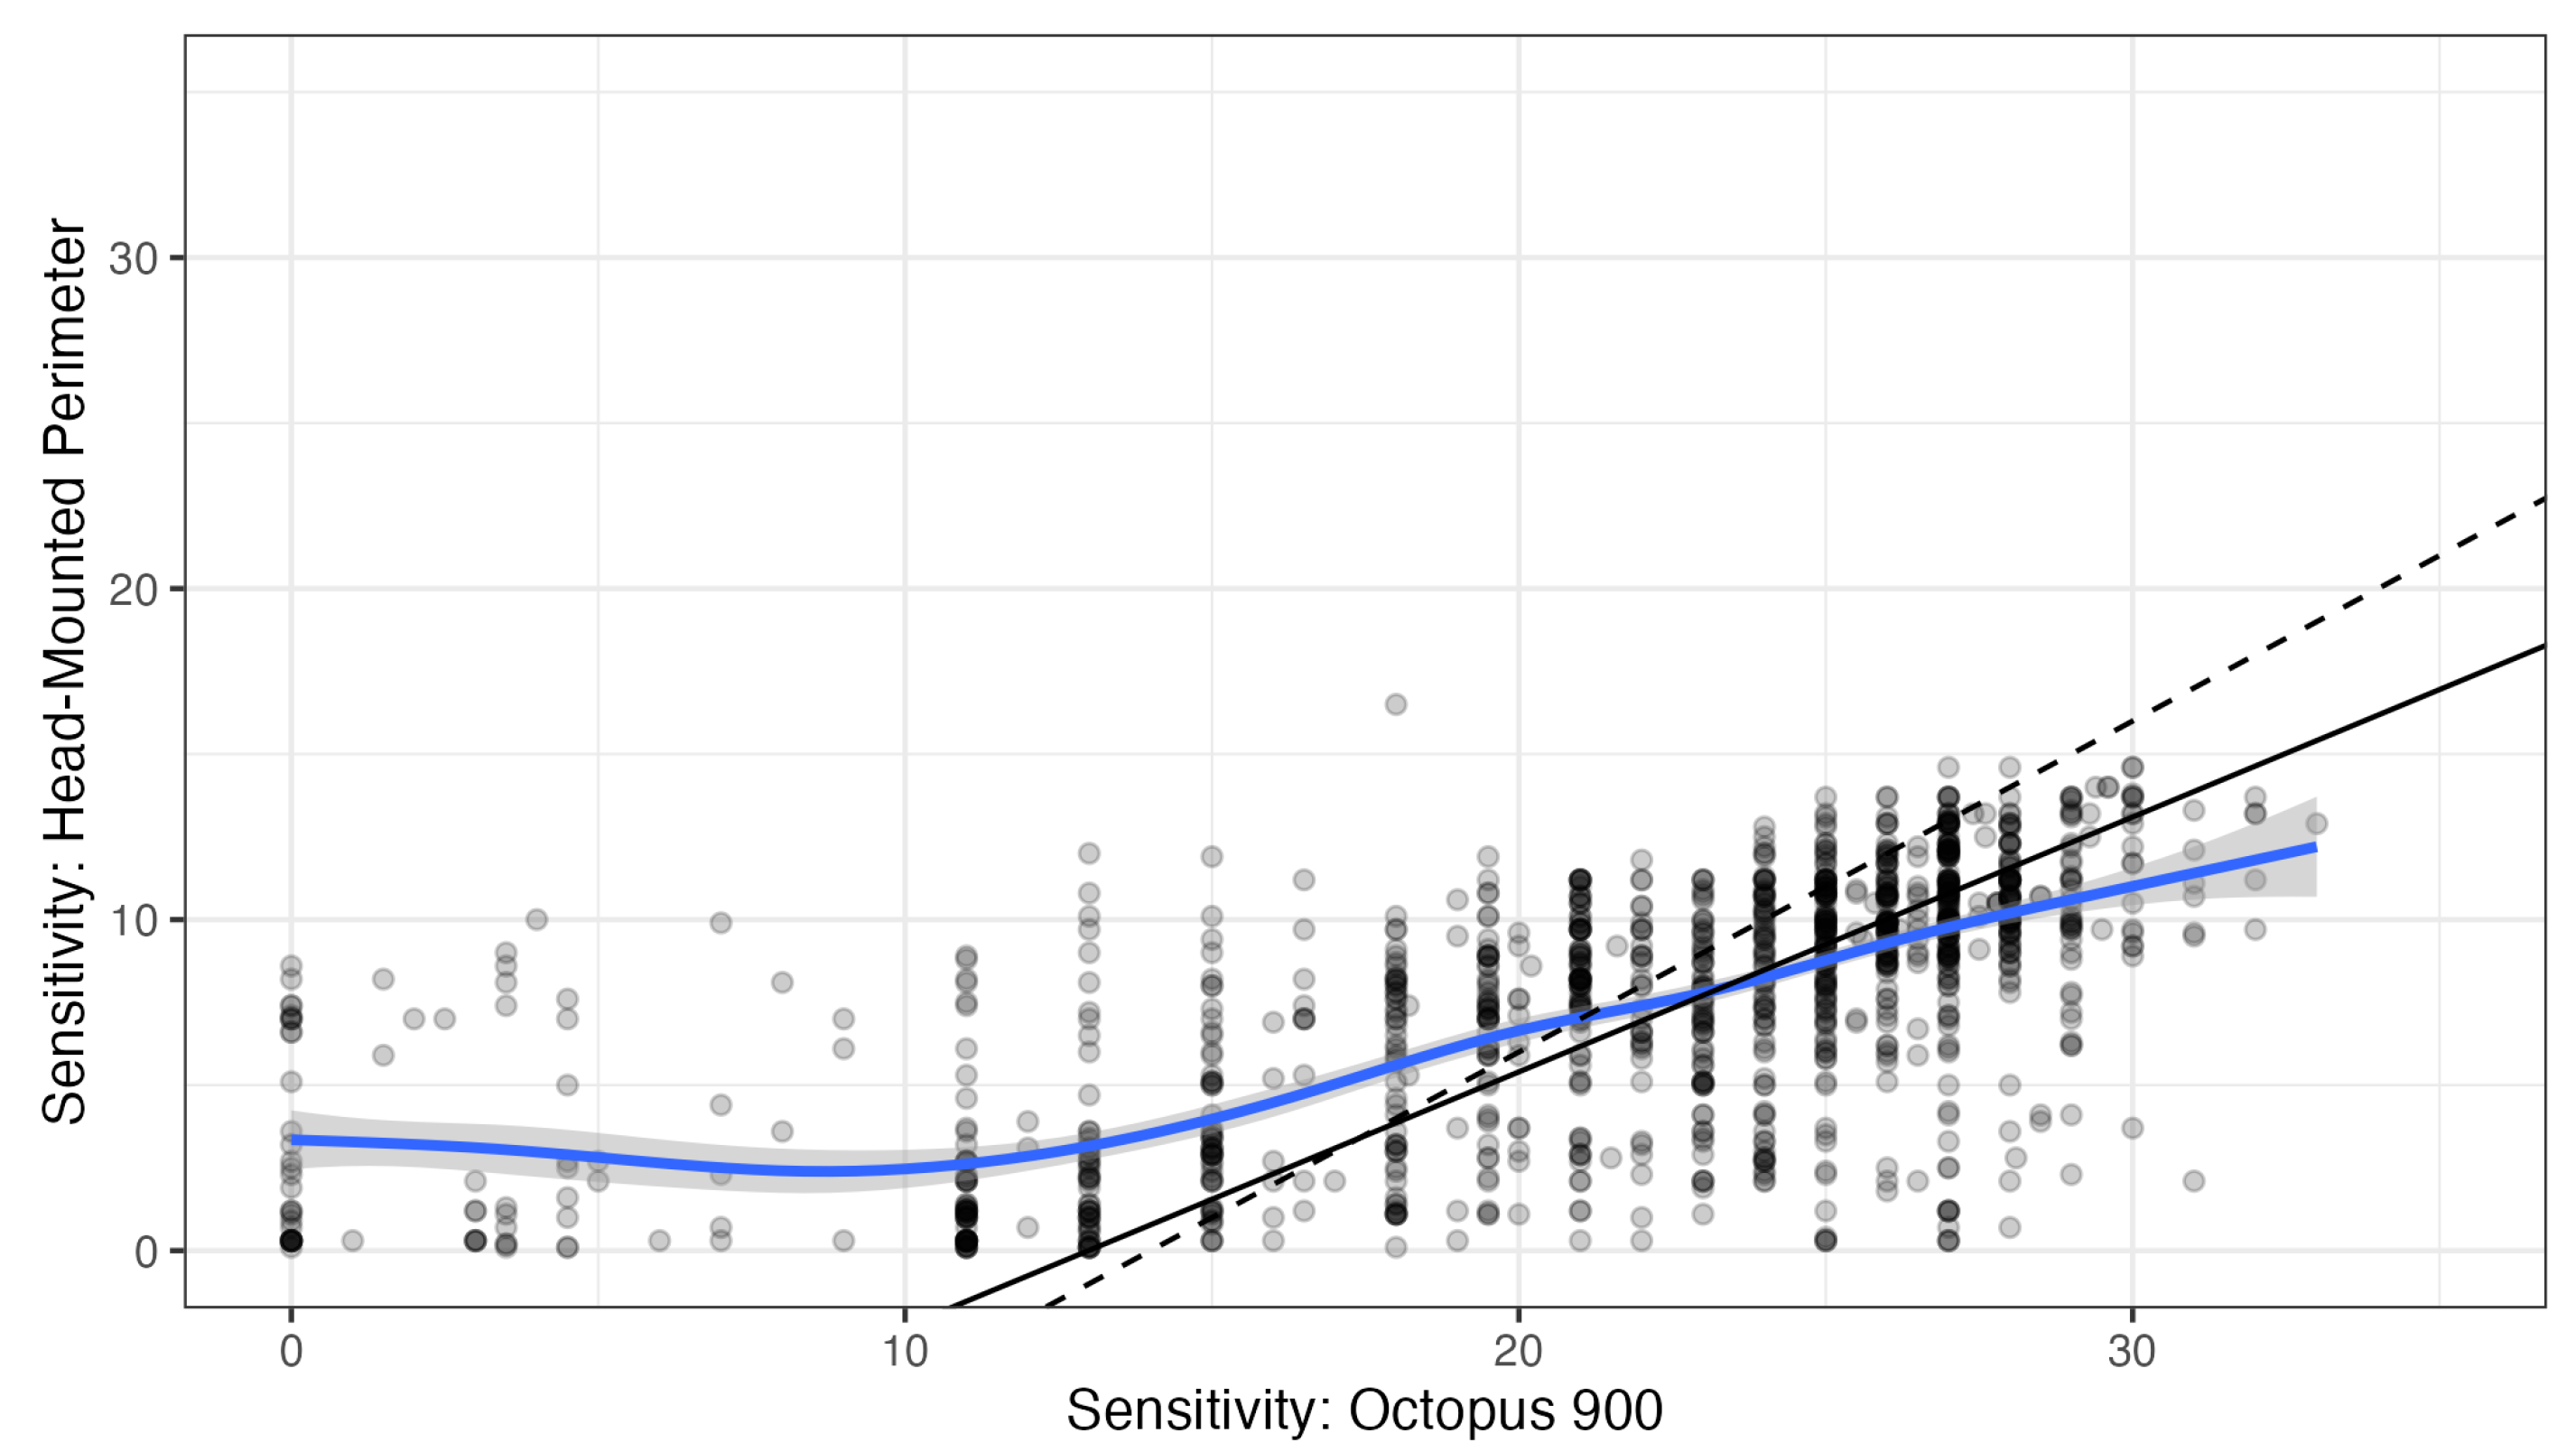
Figure 4.
Bland-Altman plot showing the agreement between Octopus perimeter and head-mounted perimeter for locations with Octopus sensitivities > 14 dB (looking for agreement is pointless when sensitivities are outside the dynamic range of one device). For this analysis, HMP sensitivities below the dynamic range were either set to 0 or censored when Octopus sensitivities were also low. The systematic difference exceeds that predicted by the difference in offset by almost 2 dB, possibly due to the differences in background.
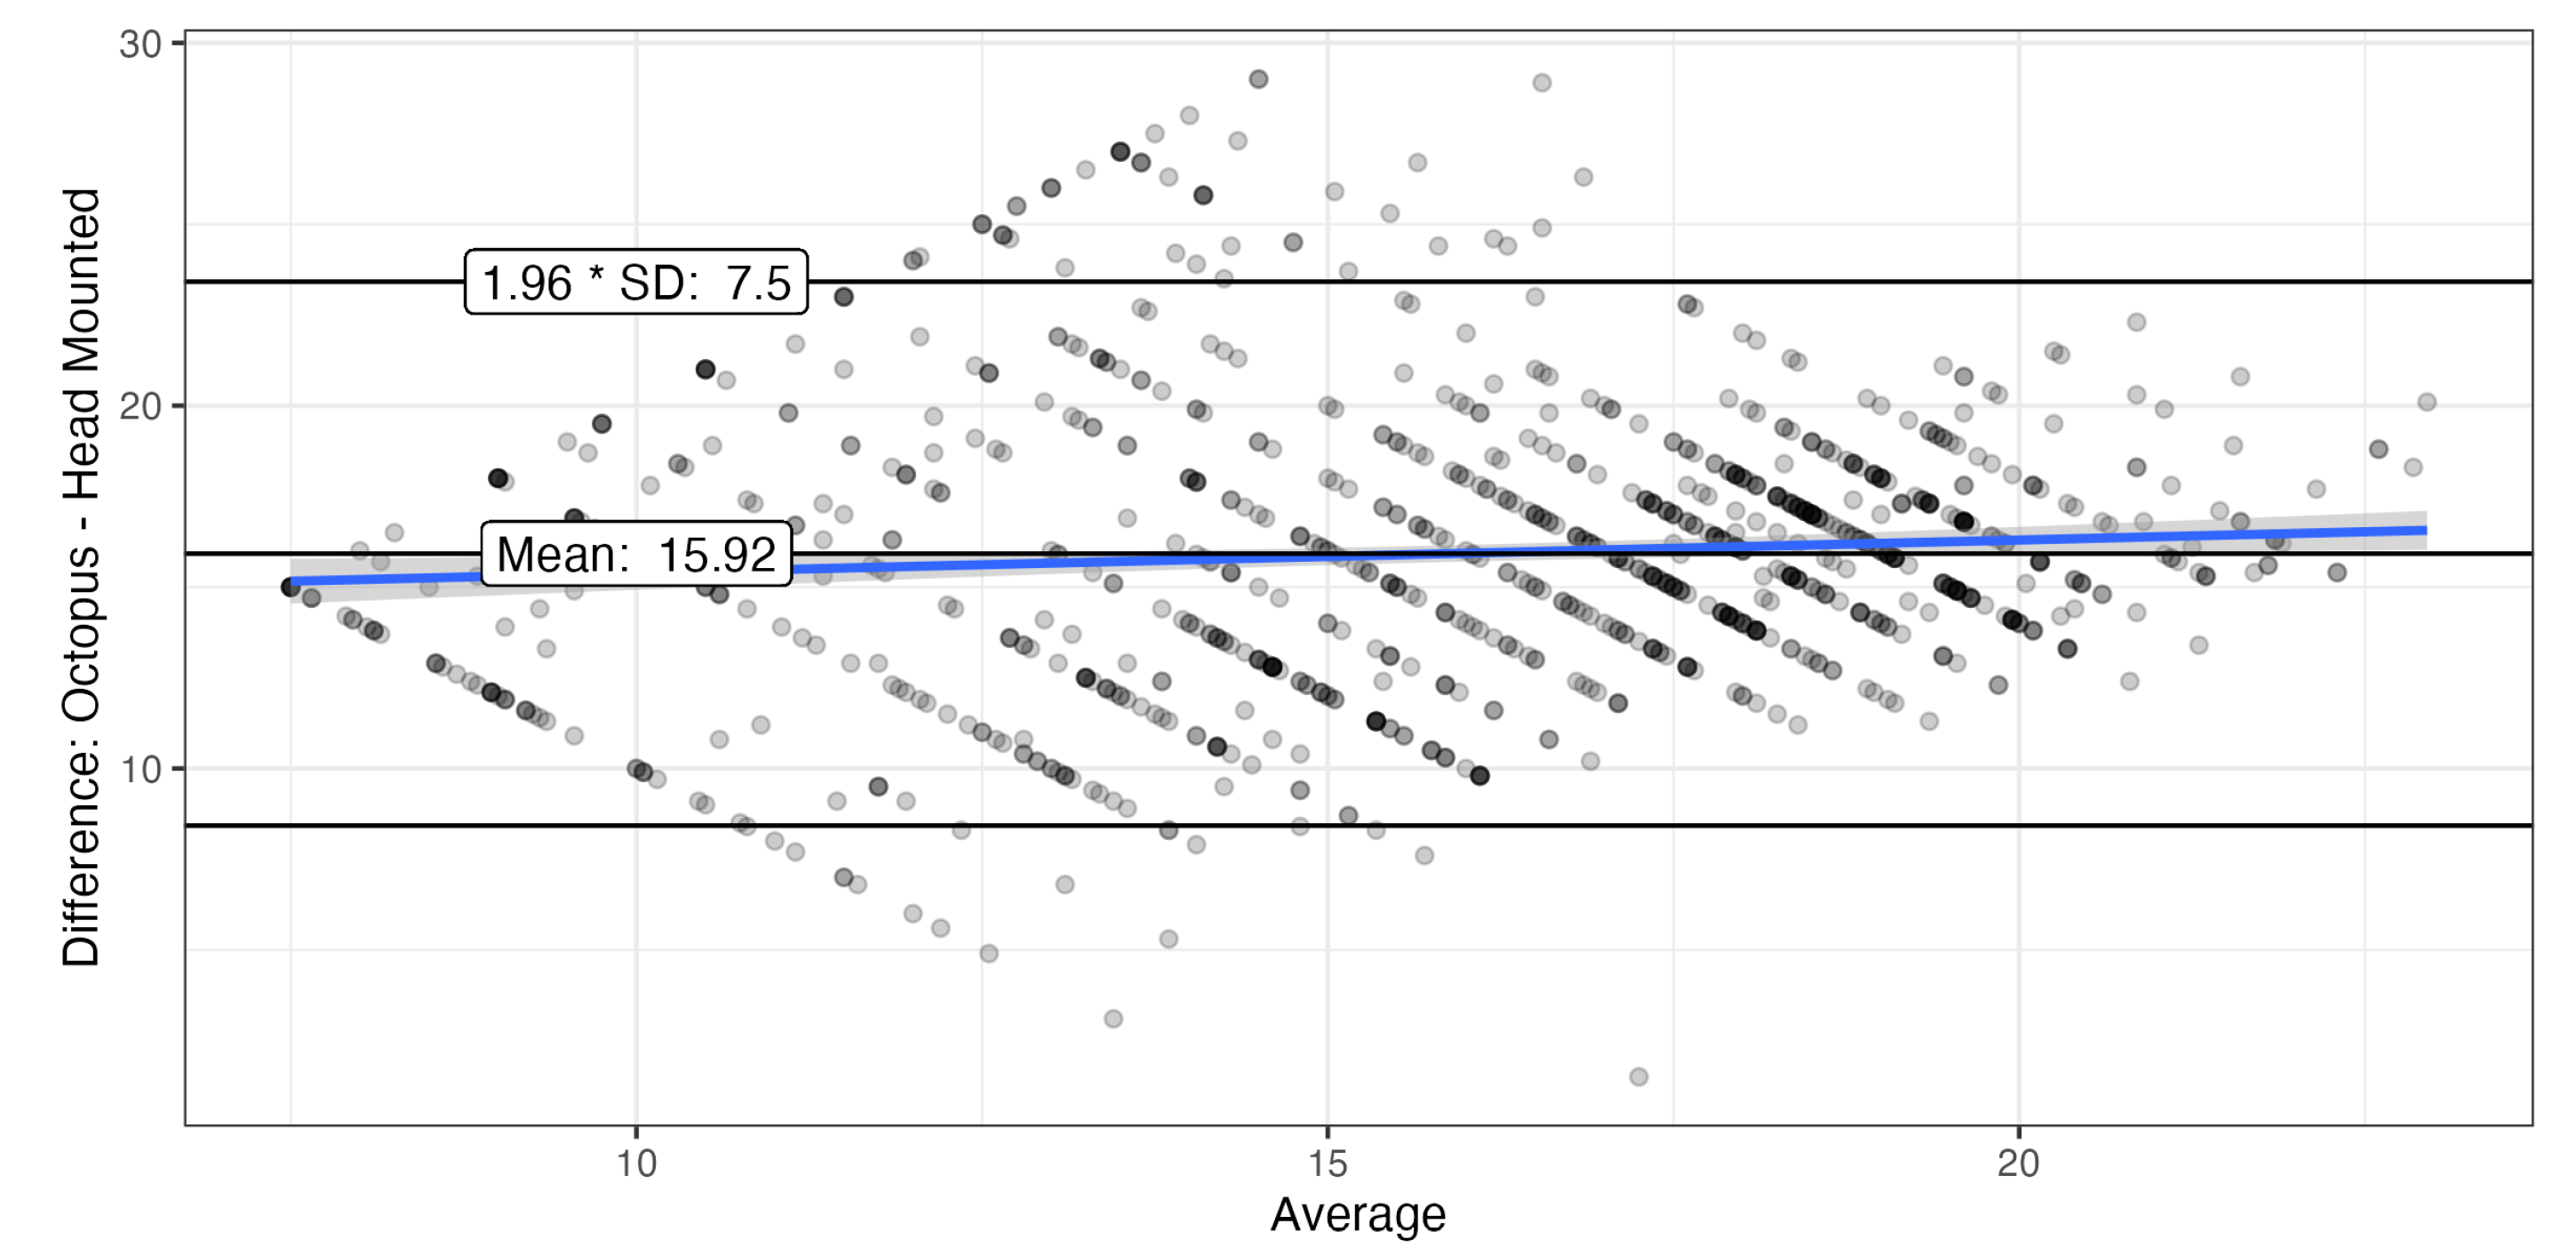
Figure 5.
Comparison of characteristic fields of four subjects (normal, occult macular dystrophy, Stargard’s disease, and retitinitis pigmentosa) between the Octopus perimeter (left side) and the head-mounted perimeter (right side). The gray ovals show the location of the blind spot.
Figure 5.
Comparison of characteristic fields of four subjects (normal, occult macular dystrophy, Stargard’s disease, and retitinitis pigmentosa) between the Octopus perimeter (left side) and the head-mounted perimeter (right side). The gray ovals show the location of the blind spot.
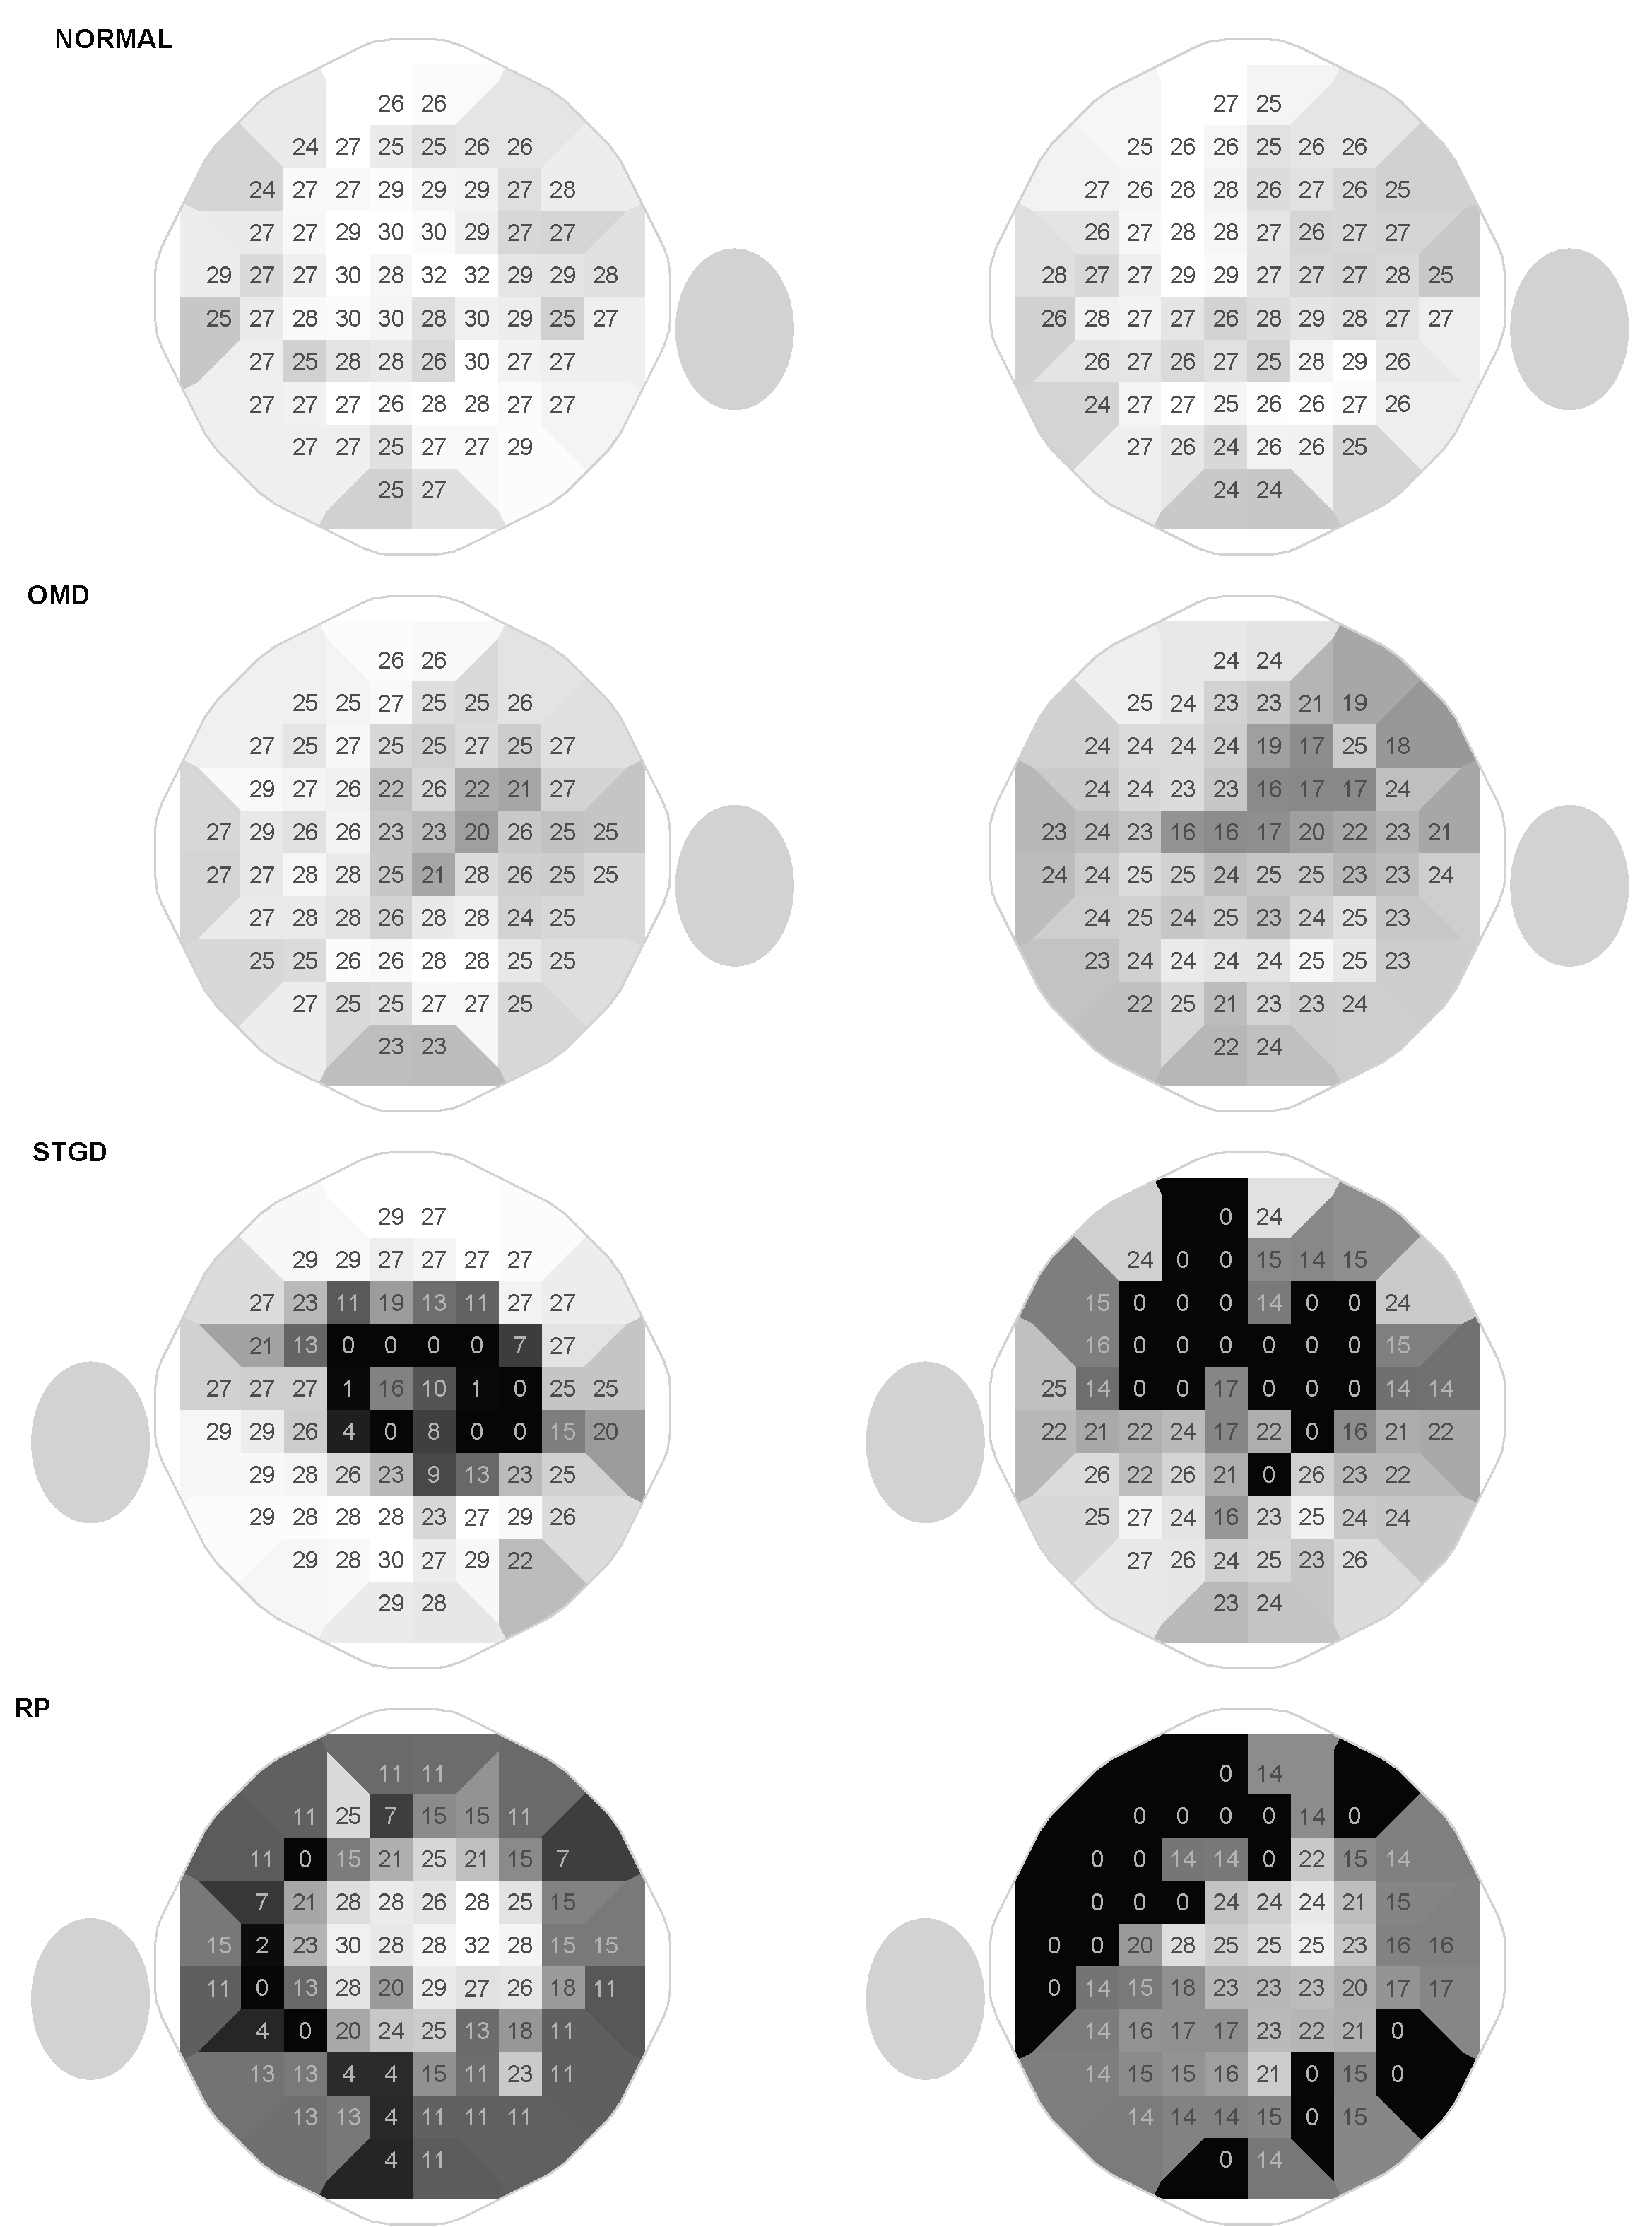
Table 1.
Demographics and clinical data.
| Overall (N=12) | |
|---|---|
| Sex | |
| Female | 6 (50.0%) |
| Male | 6 (50.0%) |
| Age (years) | |
| Mean (SD) | 56.3 (14.3) |
| Median [Min, Max] | 58.0 [24.0, 73.0] |
| logMAR | |
| Mean (SD) | 0.528 (0.444) |
| Median [Min, Max] | 0.471 [0, 1.45] |
| Mean Defect (dB) | |
| Mean (SD) | 14.3 (8.13) |
| Median [Min, Max] | 13.8 [4.55, 28.5] |
| Missing | 1 (8.3%) |
| Diagnosis | |
| normal | 1 (8.3%) |
| OMD | 2 (16.7%) |
| STGD | 3 (25.0%) |
| RP | 6 (50.0%) |
Disclaimer/Publisher’s Note: The statements, opinions and data contained in all publications are solely those of the individual author(s) and contributor(s) and not of MDPI and/or the editor(s). MDPI and/or the editor(s) disclaim responsibility for any injury to people or property resulting from any ideas, methods, instructions or products referred to in the content. |
© 2025 by the authors. Licensee MDPI, Basel, Switzerland. This article is an open access article distributed under the terms and conditions of the Creative Commons Attribution (CC BY) license.
Copyright: This open access article is published under a Creative Commons CC BY 4.0 license, which permit the free download, distribution, and reuse, provided that the author and preprint are cited in any reuse.


