
Submitted:
07 January 2026
Posted:
08 January 2026
You are already at the latest version
Abstract
This work presents a strategy for implementing advanced control in a real Linear Low-Density PolyEthylene (LLDPE) production unit (“Sclairtech” technology) followed by a systematic evaluation of economic benefits in accordance with best international practices. Melt Index (MI), density and conversion were considered as controlled variables. The analysis considered two different situations (with and without hydrogen as process input) and comprised groups/ families of polyethylene (rotational molding, low-density injection, octene film and high-density injection). The proposed control strategy is capable of efficiently addressing two of the main problems associated with “Sclairtech” technology, namely, the generation of out-of-specification product during grade transitions and wide specification ranges. The benefits analysis involved using real process data, a statistical analysis of key variables to identify the dispersion and percentage of out-of-specification products, and the calculation of the net present value of financial indicators capable of validating the investment. An annual gain of US$ 791,812 was estimated, with US$ 494,883 coming from the reduction in catalyst consumption and US$ 296,929 from other sources (reduction in out-of-specification product and production losses associated with grade transitions).
Keywords:
linear polyethylene
; advanced control
; commercial plant
; economic benefit analysis
1. Introduction
The “Sclairtech” technology is notable for its complexity, wide range of Melt Index (MI) and density of resins produced, and low reactor residence time, which requires quick adjustments to reactor conditions. This technology typically operates with a broad product portfolio and a large number of grade transitions, which implies additional challenges for product quality control when it is carried out manually. The absence of automatic control techniques contributes to the increase in the generation of out-of-specification products (off-spec) during grade transitions and the adoption of wider specification ranges. This scenario has a direct effect on the global benchmarking of technologies and resin applications in the market.
Model-based Predictive Control (MPC), more specifically in its non-linear version (NMPC), has been the strategy adopted in almost all advanced control applications in the polyethylene industry this century, considering different technologies and reactor types [Slurry with Continuous Stirred Autoclave Reactor (Seki et al., 2001) or Continuous Stirred Tank Reactor (Fontes and Mendes, 2008; Nogueira et al., 2020; Jiang et al., 2024); Gas phase with fluidized bed reactor (Hwang et al., 2002); super high pressure with continuous tubular reactor (Jacob and Dhib, 2012; Skalén et al., 2016; Muhammad et al., 2019)]. In general, the controlled variables comprise MI and temperature (Muhammad et al., 2019) or MI and density (Seki et al., 2001; Nogueira et al., 2020), with the inclusion or replacement of one of these by other process variables (production rate, Hwang et al., 2002; average fraction of comonomer incorporated into the polymer, Fontes and Mendes, 2008). Internal model structures adopted include Kalman Filter (Jacob and Dhib, 2012), state space (Muhammed et al., 2019) and phenomenological (Seki et al., 2001; Nogueira et al., 2020) approaches. Most of the works is related to Low-Density Polyethylene (LDPE) production processes (e.g.: Zavala and Biegler, 2009; Quachio et al., 2012) and control approaches have an academic feature, without a strong association with details and aspects of the production process itself, which are mandatory in defining the strategy.
Despite the numerous studies involving the application of Economic Model Predictive Control (EMPC) in various applications using economic criteria directly in the cost function (Bagla et al., 2020; Ma et al., 2023; Obiri et al., 2023; Quintanilla et al., 2025; Zhang et al., 2025), few studies present an economic feasibility analysis for the implementation of advanced control which considers gains and costs associated with the reality of the process. In turn, these are focused on cost savings through the implementation of advanced control in residential and commercial constructions including heating and cooling systems (Wang et al., 2013; Huang et al., 2015; Ulpiania et al., 2017; Wang et al., 2023). Bradford et al. (2019) apply an economic stochastic MPC in a virtual unit (benchmark process) involving a semi-batch polymerization reactor for the production of polyol from propylene oxide with the aim of reducing batch time.
This work presents a broad strategy for implementing advanced control in a real LLDPE production unit (“Sclairtech” technology) whose general objectives consist of increasing the production rate together with reducing variability in product quality (MI and density, including grade transitions) and reduction in catalyst consumption. The following contributions are associated with this work:
- Proposition and validation of an advanced control strategy for a real polyethylene production unit fully associated with the intrinsic features of the process and with innovative alternatives tailored to these characteristics.
- A broad economic feasibility study for the implementation of advanced control, capable of quantifying the potential gains in different types of resins associated with the reduction of out-of-specification product (mainly in grade transitions), reduction in production losses associated with transitions and reduction of catalyst consumption. Additionally, an assessment of costs associated with the advanced control implementation project (labor, hiring specialized support for implementation in the unit's operating system) was carried out in which estimates for the Net Present Value (NPV), Internal Rate of Return (IRR) and Return On Investment (ROI) were also obtained in order to prove the effective economic viability of this investment. The feasibility study also presented a cash flow for a ten-year horizon with a residual value of the initial investment (US$).
Besides this introductory Section 1, this work is structured as follows. Section 2 presents the conceptual design of the control system, together with the description of the process and the main controlled variables and presents also the process model used for control simulation tests and as an internal MPC model. Section 3 presents the results obtained from closed-loop simulation tests, Section 4 presents the economic feasibility study for the implementation of advanced control and finally Section 5 presents the concluding remarks.
2. Conceptual Design of the Control System
The process here studied refers to one of Braskem's polymer units located in Camaçari Petrochemical Complex (Bahia, Brazil) and is based on “Sclairtech” technology (licensor NOVA Chemicals, Canada). The process comprises 3 reactors, namely, one CSTR (“Reactor 1”) and two tubular reactors (“Reactor 3” and “Trimmer”, respectively). The configuration used to operate the process 97% of the time corresponds to the use of the autoclave reactor followed by the “Trimmer”.
A detailed description of the process (Figure 1) is presented by Silva et al. (2023) who proposed an innovative approach (Gomes de Sá et al., 2022), based on Feedforward Neural Networks (FNN), which comprised a weight initialization strategy combined with a constructive algorithm. The authors applied this approach to obtain two virtual analyzers (density and Melt Index) for quality monitoring of the final product in the same unit.
The LLDPE production process comprises the use of cyclohexane (C6H12) as a solvent and an alpha-olefin (butene-1 or octene-1) as a commoner. The “Trimmer” is a tubular reactor with a volume smaller than “Reactor 1” and its main function is to increase the catalyst efficiency and the conversion of ethylene. Each passing through the process results in a conversion of approximately of ethylene to polyethylene. A catalyst deactivator is introduced at the exit of the reactor to ensure the completion of the polymerization reaction (deactivation also aims to prepare the catalyst residue for its adsorption on the alumina beds). After the adsorber vessels, the solution is sent to gas separators in which unreacted cyclohexane, ethene and comonomer are separated from the polymer in the Intermediate Pressure Separator (IPS) and then polymer and solvent are separated in the Low-Pressure Separator (LPS). Each resin has a synthesis condition which establishes the process conditions for the production of the respective grade and compliance with specification limits (MI and density). The following general control objectives must be considered:
- Process safety;
- Increase in production rate;
- Reduction of variability in product quality;
- Improved quality control;
- Optimizing the grade transitions;
- Reduction in catalyst consumption and other associated inputs as cocatalyst, alumina, deactivators and silica.
2.1. Specific Control Objectives, Manipulated and Controlled Variables
The variables controlled to achieve the general control objectives comprise MI, density and conversion. Due to the low residence time in the reactor, conversion is an important parameter for the “Sclairtech” process. Conversion has a direct relationship with cost [generation of low molecular weight polymer (wax) and catalyst consumption], MI and productivity. The conversion is controlled through the temperature profile in the reactor which is, in turn, determined by the catalyst dosage and/ or monomer concentration in the solution. In this work, conversion control is carried out through the concentration of ethylene in the solution. Additionally, the temperature of the reactor medium must be controlled at a reference value, depending on the resin synthesis condition (temperature control in the middle of the reactor is fundamental for controlling MI, as it also represents an indirect alternative for controlling the reaction conversion).
Table 1 presents the manipulated variables and the disturbances associated with each of the controlled variables and the respective signs of static gains (direction of the effect of the increase in each input, manipulated or disturbance, on the output, controlled variable), considering 2 classes/ families of resins: i) butene copolymer resins in which the hydrogen concentration is manipulated to control the MI (rotational molding, low-density injection and high-density injection); and ii) resins with low density (butene copolymers) and very low MI in which the hydrogen concentration is not used to control the MI (butene film). The temperature of the Heater Treatment Catalytic (HTC) is adopted in this work to fine-tune the MI. However, this temperature is limited to a range ( to oC) to avoid undesirable effects on the catalyst activity. Initially, the reactor side feed was also defined as a manipulated variable. However, tests carried out at the unit showed a negligible effect of this variable in both MI and density.
In both polymer classes/ families (R1 and R2, Table 1) analyzed, the conversion was controlled in the range as a soft constraint (penalty for conversion values outside this range in the MPC objective function) and also imposing a hard constraint to avoid obtaining conversion values below . Both types of constraint (soft and hard) were also adopted for MI and density according to the synthesis conditions of each resin. Similarly soft and hard constraints were adopted for the manipulated variables (HTC temperature between and oC and butene/ ethylene ration between and ), with the exception of the hydrogen concentration (butene copolymer) for which a hard constraint was imposed to avoid concentrations above ppm.
2.2. Process Model
The NMPC internal model (the same one used to represent the process in the simulation tests) was obtained from the identification of the dynamics between each of the controlled variables (MI, density and conversion) and the respective input variables (manipulated and unmanipulated/ disturbances). To identify dynamic models, a set of alternatives involving historical data, expert knowledge and operational tests (when possible) were also carried out. Virtual analyzers (stationary models based on neural networks) for MI and density were developed in a recent work (Silva et al., 2023) involving the same process. These models were used for the following purposes: i) provide real-time measurements of these variables in simulation tests; and ii) support the estimate of the static gains of these outputs (MI and density) in relation to the inputs. The following assumptions were considered to formulate the dynamic models:
- The system pressure differential (difference between reactor pressure and system pressure) was also considered as input in the MI model;
- The dynamics of density and MI were assumed to be approximately the same with respect to all input variables;
- The effect of the Reaction Temperature Differential (RTD) on the MI was also considered. In the operational test to identify this dynamic, RTD was changed by varying the ethylene concentration;
- The effects of the comonomer/ monomer mass ratio and the ethylene concentration in the solution were both considered directly and indirectly through the dynamics of the RTD;
- The hourly resin production is obtained from the total flow of ethylene and comonomer converted into polyethylene. This flow must have an increase limit in order to ensure stability in the other regulatory control loops;
- As shown in Table 1, conversion control is carried out by controlling the concentration of ethylene in the reaction. In turn, the reactor medium temperature was controlled through a simple regulatory control loop to ensure the stability of the reaction since this variable has a direct effect on the catalyst's performance;
- Temperature control in the middle of the reactor is carried out through the concentration of catalyst in the solution, using a triple cascade strategy involving, ultimately, the catalyst flow. This strategy aims to mainly eliminate the interference of impurities (an unmeasured disturbance variable).
Figure 2 presents the block diagram with the various cause-effect relationships that constitute the global process model.
The equations of the process model (also used as an internal NMPC model) together with the values of the dynamic parameters (time constants and time delays) are presented in Appendix A.
3. NMPC Simulation and Results
The closed-loop simulation tests initially comprised grade transitions between resins from the butene copolymer family (with hydrogen) and resins from the butene film family (without hydrogen). In both cases, grade transitions essentially involve changes in MI and density setpoints.
In the butene copolymer family (Figure 3), the simulation was started with a rotational molding resin followed by increases in density and MI at different times. The next stage comprised the transition to low-density injection resin and a final elevation of the MI to , aiming for a product for masterbach-type applications. The results demonstrate good controller performance, capable of adjusting the manipulated variables in response to setpoint changes and maintaining the quality variables at the desired values with satisfactory stability. The conversion remained at most of the time and when the MI was increased from to , a reduction in its setpoint to was accomplished once the maximum ethene concentration in the solution was reached. This scenario represents a common operational condition in which adjusting the conversion setpoint is required to prevent controller saturation and reduce wax formation, especially under conditions of high conversion and elevated ethylene concentrations.
In the production of resins from the butene film family (Figure 4), in which hydrogen is not used as an input, the HTC temperature is adopted as manipulated variable to control the MI. The density remains controlled through the butene/ ethene mass ratio. This situation implies an operational control challenge since the value of the MI gain in relation to this input (HTC temperature) depends on the features of the catalytic system. The catalytic system of the analyzed unit allows this pairing alternative (HTC temperature-MI) due to specific features: i) vanadium concentration; and ii) absence of high-pressure diluent stream in the discharge of the catalyst pumps. The alternative of controlling MI through the temperature of the reactor middle (directly related to the conversion) was not adopted as it implies an increase in the variable cost, since this temperature is adjusted through the concentration of catalyst in the solution.
The simulation started with a rotational molding resin used for film application . Then there was a transition to two film resins, and . The results show that the MI is successfully controlled by the HTC temperature which varied across the entire possible range () oC, highlighting the extreme operating conditions. It would be necessary to adjust other variables, such as the reactor inlet and outlet temperatures, if these limits were exceeded. In turn, the controller gradually reduces the concentration of ethylene in the solution to maintain the conversion at the desired value, a situation commonly observed in film resins.
Figure 5 shows the simulation of a regulatory problem involving a resin from the butene copolymer family. This test consists of increasing the concentration of impurities in the process considering the same sequence of setpoint changes presented in Figure 3 (the effect of impurities was emulated through their effect on the reaction temperature differential, represented by an additive perturbation in the inlet temperature). This disturbance results in a reduction of the reaction temperature differential through a sharp increase of approximately °C in inlet temperature, and further reduction of temperature differential around time range due to other variable interactions, which, in turn, causes a reduction of around in conversion together with a reduction of in MI and an increase of less than in density (Figure 6). The controller is capable of rejecting disturbances caused by an increase in the concentration of impurities. There was an increase in hydrogen content to adjust the MI and in the ethylene concentration in order to recover the conversion.
Conversion control, even using an advanced strategy (NMPC), is a challenge due to the low residence time in the reactor. In practice, sharp changes (in MI and density setpoints) are not performed because they can generate control difficulties and even loss of the reaction profile (production planning is done in such a way that the sequences of changes in the setpoints are smoother than those simulated in this work). Therefore, since the control is efficient in sharp transitions, it will have satisfactory performance in controlling smoother transitions. Furthermore, as shown and discussed in the regulatory problem simulation, the control system also proved to be efficient in rejecting disturbances and under more severe conditions than those that will be observed in real operating conditions.
4. Economic Feasibility Study for the Implementation of Advanced Control
Unlike other technologies, the “Sclairtech” process can produce polyethylene in a very wide range of MI and density, enabling the unit studied here to produce linear polyethylene in a variety of families (rotomolding, octene film, butene film, low density injection, high density injection, raffia and blowing). Furthermore, the residence time in the reactor is very short (about 60 seconds), enabling grade transitions in a short period of time.
The wide MI and density ranges associated with the low residence time in the reactor guarantee the LLDPE unit to have a low generation of out-of-specification product due to grid transition, in relation to other technologies. However, as it is unique in Brazil, production schedule imposes a high number of grade transitions each month to meet consumer market demands.
Product quality control is carried out by the unit's operators through their expert knowledge and based on the results of the Quality Control Laboratory (QCL). This practice, together with the dynamics of the portfolio (many grade transitions), suggests great potential for minimizing costs and reducing deviations in the quality of the final product through the implementation of an MPC.
Each resin produced in the linear polyethylene plant is associated with an End Product Specification (EPF). In turn, each specification comprises two types of ranges. The first (Specification Range, SR, itself) corresponds to market demands. The second (Mixing Range, MR) is broader and determines whether an out-of-spec batch can be mixed (effectively utilized) or rejected as off-spec. The economic evaluation was carried out using indicators associated with the expected gains from implementing advanced control: reduction of out-of-specification products, mainly in grade transitions; reduction in the number of mixtures due to variations in density or grinding index; reduction in production losses in grade transitions; and reduction in the consumption of catalysts and associated inputs.
4.1. MI and Density Dispersion Analysis in the Current Process
MI and density analysis results (obtained from QCL) were collected, corresponding to one year of unit operation, with the aim of evaluating the degree of dispersion of these properties under current process conditions. The data refers to four resins, each one representing one of the following families: octene film; low density injection; high-density injection; and rotational molding. These four resins together represent around 50% of all annual production.
Figure 7, Figure 8, Figure 9 and Figure 10 show the dispersion of MI and density values in the four resins analyzed together with the average and percentage of results below and above the Lower and Upper Specification Limits (LSL and USL, respectively, both related to the SR).
Regarding rotational molding (Figure 7), among the MI results outside the SR (23%), 21% correspond to deviations from the USL (positive deviations). The higher frequency of positive deviations is justified by problems in the application of this resin caused by negative deviations in MI. Therefore, operators behave more conservatively, operating with an MI value above the target (EPF). For all resins analyzed, the total product out of specification (SR) is equal to the sum of the MI and density results out of specification, that is, it is assumed that the frequency of MI and density results simultaneously out of specification is negligible. The results related to low density injection (Figure 8) show that 18% of production was classified outside the SR (sent for mixing or segregated as off spec). The MI results show greater dispersion and a greater amount of data outside the specification range (12.9% positive deviations and 1.5% negative deviations). The density results show better efficiency in controlling this property which is due to the high concentration of butene (comonomer) in the reaction. The octene film resin (Figure 9) presented the highest percentage of out-of-specification product (29%) among the 4 families analyzed, with the largest density deviations (16.3%). This is due to the difficulty in concentrating/ diluting the octene comonomer in the “Sclairtech” process. Furthermore, there is a greater incidence of reaction variations in this family due to the greater concentration of impurities in the hydrocarbon stream arising from distillation. This, in turn, is due to the high distillation temperatures associated with the lower volatility of the octene comonomer. Regarding high density injection (Figure 10, homopolymer), even without the alternative of using comonomer, MI presented a higher frequency of results outside the SR. No positive density deviations were obtained due to the limitation of the technology in producing resins with values of this property above .
When a batch presents results outside the Specification Range (SR), the product must be reworked. Rework is performed in one of the following alternatives: i) cold rework; and ii) hot rework. The first one is carried out on batches that presented analysis results between the specification limit and the mixing limit (Mixing Range, MR) and the product is cold mixed with another batch capable of correcting the out-of-specification quality parameter. Hot rework is carried out in an auxiliary extruder and is used for batches with greater variation in properties, outside of market specifications, and the amount recovered is low (the amount of off-specification product to be processed is about 1.5% of the mass of product specified). Rework is a direct consequence of the variability/ dispersion of quality parameters (MI and density) both in normal operation and in grade transitions. Both rework alternatives imply costs (silo occupation, segregation of the final product and capital immobilization, and even reduction of the unit's load) which must be considered. The estimated gain expected from the reduction in rework from the implementation of advanced control was determined based on the unit's best monthly performance (lowest frequency of mixtures performed) over two years. Based on data from the best month, a feasible reduction of 50% is estimated in relation to cold rework. In turn, the reduction in the frequency of hot rework will be proportional to the reduction in the generation of product outside of market specification (SR).
On average, six monthly transitions between resins from different families are performed, resulting in out-of-specification material. Each transition produces, on average, 35 tons of off-specification products (around 280 tons per month), which is equivalent to 1.6% of the average monthly production (18 thousand tons). Furthermore, at the beginning of the transition the unit's load is reduced, which additionally generates a monthly loss of 250 tons of products (1.4% of monthly production). Analogous to the estimated gain from reducing rework, the five best grade transitions carried out in two years were identified as representative of what can be achieved after implementing the planned control and automation strategies. The criteria for classifying a transition as optimal was the amount of off-specification product generated and the load reduction, according to the best operator method. This method involves identifying the best transition executed by an operator based on the unit's historical data. To do this, five years of production records were analyzed. Therefore, an average reduction of 35 to 25 tons of out-of-specification product in grade transitions is estimated (around 29%). The reduction in production losses resulting from load reductions was estimated at 25%.
4.2. Analysis of Economic Benefits
The expected gains from the implementation of advanced control at the unit are as follows:
- 50% reduction in process variability (Xu et al., 2007);
- 50% reduction in the number of mixtures performed (cold rework) due to the reduction in the generation of out-of-specification products due to variation in MI and density in normal operation and in grade transitions;
- 29% reduction in the generation of out-of-specification products during grade transitions;
- 25% reduction in production losses associated with transitions and full silos;
- Catalyst consumption is reduced by 10% by controlling the average reactor temperature, which is achieved by adjusting the catalyst concentration in the reactor. This reduction was based on the unit's historical performance and operational changes tested to optimize catalyst use.
The costs related to the implementation of advanced control are essentially associated with the hiring of two engineers (process and automation, respectively) and the hiring of a specialized company to code and connect the control algorithm with the unit's operational management system, in addition to providing technical support. The cost associated with the engineers' working hour (plus labor charges in accordance with current laws in Brazil) is equivalent to about US$ . Adding to the cost of hiring a specialized company, it is estimated that the total cost of implementing advanced control is US$ . Based on the expected gains, the estimated annual return with the implementation of advanced control in the unit with “Sclairtech” technology is US$ , with US$ corresponding to the reduction in catalyst consumption and US$ to other gains.
The feasibility analysis considered a ten-year horizon and a residual value of 30% of the investment (US$ ), resulting in an annual net profit equal to US$ (to which the residual value in the last year is added) (Figure 11). Adopting a minimum attractiveness rate and other parameters already used by the company, the financial evaluation obtained the following results: i) Net Present Value (NPV) equal to US$ ; ii) Internal Rate of Return (IRR) equal to 161%; and iii) Return On Investment (ROI) equal to 1.60.
In addition to the estimated financial gains, the significant reduction in the dispersion (variability) of MI and density is important for the company's market share. Although there is no capacity to increase production at the unit, this aspect is important to preserve the market.
5. Conclusions
This work presents a broad economic feasibility analysis for the implementation of advanced control in a real linear polyethylene production unit, which considers costs associated with investment (hiring specialized services, among others) and expected gains (reduction in catalyst consumption, reduction of variability in product quality) fully based on the operational reality of the process. Thus, considering the scarcity of data and information in the open literature, this work provides a clear and consistent perspective of real gains arising from the implementation of an advanced control strategy in a real polymerization unit.
The financial feasibility study of implementing advanced control in a linear polyethylene plant based on “Sclairtech” technology demonstrated that the project is viable (NPV, IRR and ROI equal to US$ , 161% and 1.60, respectively).
Although model-based predictive control is a strategy that has been consolidated for decades, the configuration adopted in this work (selection of manipulated variables, which variables to effectively control, internal model of the controller) was defined based on the restrictions/ limitations of the process, the operational history of production of the various resins (including grade transitions), and the production planning, requirements and marketing perspectives for the portfolio of resins produced at the unit. Furthermore, the closed-loop simulation results demonstrated a clear improvement in the unit's operation control, which was mainly seen in the potential for reducing out-of-specification product in grade transitions and also in coping with regulatory problems.
Acknowledgments
The authors acknowledge the financial support provided by the Federal Agency for Support and Evaluation of Graduate Education (Coordenação de Aperfeiçoamento de Pessoal de Nível Superior, CAPES-Brazil) and the National Council for Scientific and Technological Development (Conselho Nacional de Desenvolvimento Científico e Tecnológico, CNPq-Brazil).
Appendix A. Model Equations and Parameters
This Appendix A presents the equations of the process model (also used as an internal NMPC model) together with the values of their coefficients (Table A1) and dynamic parameters (time constants and time delays, Table A2).
Model equations:
| Nomenclature | |
| CM | Comonomer mass ratio (butene/ ethene or octene/ ethene) in the reactor feed |
| Reaction temperature differential | |
| Hydrogen concentration in the solution | |
| Mass concentration of ethene in the solution | |
| Temperature of the Heater Treatment Catalytic | |
| Inlet temperature | |
| Outlet temperature | |
| Q | Conversion |
| τ | Time constant (Table A2) |
| td | Time delay (dead time) (Table A2) |
| a | Dependence coefficients between output variables and input variables (Table A1) |
| Subscripts | |
| h | High MI |
| l | Low MI |

Table A1.
Coefficients.
| Density (r) | Melt Index (MI) | Outlet temperature (To) | |||||
|---|---|---|---|---|---|---|---|
| Value | u.m. | Valueh | Valuel | u.m. | Value | u.m. | |
| aCM,1 | -1.4978·10-1 | 2.550·100 | 2.80·100 | -2.0563·100 | |||
| aCM,2 | 3.0060·10-1 | 0 | 0 | 0 | |||
| aCM,3 | -2.3740·10-1 | 0 | 0 | 0 | |||
| aH2,1 | -8.1190·10-5 | 9.500·10-3 | 0 | 0 | |||
| aH2,2 | 0 | -6.900·10-4 | 0 | 0 | |||
| aEt,1 | 0 | 8.480·10-2 | 9.88·10-2 | 8.5680·100 | |||
| aHTC,1 | 0 | -2.518·10-2 | -3.35·10-2 | 0 | dimensionless | ||
| aHTC,2 | 0 | 0 | 1.50·10-5 | 0 | |||
| aDT,1 | 1.4900·10-4 | 3.740·10-2 | 3.30·10-2 | 0 | dimensionless | ||
| aDT,2 | 0 | 0 | -2.50·10-6 | 0 | |||
| a0 | 9.1800·10-1 | -5.300·100 | -3.20·100 | 1.1849·102 | |||
u.m.: units of measurement.
Table A2.
Dynamic parameters (time constants and time delays) (min).
| CM | H2 | Et | HTC | DT | |
|---|---|---|---|---|---|
| t | 20.2 | 10.2 | 13.5 | 27.0 | 17.0 |
| td | 1.0 | 1.0 | 5.0 | 10.0 | 5.0 |
References
- Bagla, G.; Valluru, J.; Patwardhan, S. C. Efficient Operation of Continuous Reactor Systems using Economic Nonlinear MPC Formulations. IFAC Papers Online 2020, 53(1), 512–517. [Google Scholar] [CrossRef]
- Bradford, E.; Reble, M.; Bouaswaig, A.; Imsland, L. Economic stochastic nonlinear predictive control of a semi-batch polymerization reactor. IFAC Papers Online 2019, 53(1), 512-517, 52-1, 667-672. [Google Scholar]
- Fontes, C.; Mendes, M. Nonlinear predictive control of an industrial slurry reactor. Controle e Automação 2008, 19(4), 417–430. [Google Scholar] [CrossRef]
- Gomes de Sá, G. A., Fontes, C., Embiruçu, M., 2022. A new method for building single feedforward neural network models for multivariate static regression problems: a combined weight initialization and constructive algorithm. Evolutionary Intelligence. [CrossRef]
- Huang, H.; Chen, L.; Hu, E. A new model predictive control scheme for energy and cost savings in commercial buildings: An airport terminal building case study. Building and Environment 2015, 89, 203–216. [Google Scholar] [CrossRef]
- Hwang, C.-A., Johnson, D., Goff, S., 2002. Advanced Control Strategies for polyolefin gas phase processes. Anchorage, AK, USA, IEEE.
- Jacob, N. C.; Dhib, R. Nonlinear MPC of a multi-zone multi-feed LDPE autoclave reactor. Journal of Industrial and Engineering Chemistry 2012, 18(5), 1781–1795. [Google Scholar] [CrossRef]
- Jiang, Z.-F.; Wei, X.-Z.; Kang, J.-L.; Wong, D. S.-H.; Yao, Y.; Chuang, Y.-C.; Jang, S.-S.; Ou, J. D.-Y. Deep learning model predictive control of a high-density polyethylene reactor with a physics-guided sequence-to-sequence model with memory. Computers & Chemical Engineering 2024, 189, 108790. [Google Scholar] [CrossRef]
- Ma, L.; Kong, X.; Liu, X.; Abdelbaky, M. A.; Besheer, A. H.; Wang, M.; Lee, K. Y. Offshore wind power generation system control using robust economic MPC scheme. Ocean Engineering 2023, 283, 115178. [Google Scholar] [CrossRef]
- Muhammad, D.; Ahmad, Z.; Aziz, N. Low density polyethylene tubular reactor control using state space model predictive control. Chemical Engineering Communications 2019, 208(4), 500–516. [Google Scholar] [CrossRef]
- Nogueira, I. B.R.; Fontes, R. M.; Ribeiro, A. M.; Pontes, K. V.; Embiruçu, M.; Martins, M. A. F. A robustly model predictive control strategy applied in the control of a simulated industrial polyethylene polymerization process. Computers & Chemical Engineering 2020, 133, 106664. [Google Scholar] [CrossRef]
- Obiri, S. A.; Bo, S.; Agyeman, B. T.; Debnath, S.; Decardi-Nelson, B.; Liu, J. Optimizing the switching operation in monoclonal antibody production: Economic MPC and reinforcement learning. Chemical Engineering Research and Design 2023, 199, 61–73. [Google Scholar] [CrossRef]
- Quachio, R., Germiniani, D. S., Pinto, G. A., Pavanelli, P. E., Tizzo, L. M., 2012. Improvements in Energy Efficiency of Polyethylene Autoclave Reactor using Advanced Process Control. 8th IFAC Symposium on Advanced Control of Chemical Processes, Singapore, July 10-13.
- Quintanilla, P.; Navia, D.; Neethling, S. J.; Brito-Parada, P. R. Centralized economic model predictive control of froth flotation banks with experimental implementation. Chemical Engineering Research and Design 2025, 224, 467–481. [Google Scholar] [CrossRef]
- Seki, H.; Ogawa, M.; Ooyama, S.; Akamatsu, K.; Ohshima, M.; Yang, W. Industrial application of a nonlinear model predictive control to polymerization reactors. Control Engineering Pratice 2001, 9(8), 819–828. [Google Scholar] [CrossRef]
- Silva, A. L.; Fontes, C. H.; Embiruçu, M. Virtual Analyzers for MI and Density Based on Neural Networks Improved through an Integrated Strategy Involving a Constructive Algorithm and Definition of Initial Weights. Macromol. React. Eng. 2023, 17, 2200066. [Google Scholar] [CrossRef]
- Skålén, S.; Josefsson, F.; Ihrström, J. Nonlinear MPC for grade transitions in an industrial LDPE tubular reactor. IFAC-PapersOnLine 2016, 49(7), 562–567. [Google Scholar] [CrossRef]
- Ulpiania, G.; Benedettelli, M.; Perna, C.; Naticchia, B. Overheating phenomena induced by fully-glazed facades: Investigation of a sick building in Italy and assessment of the benefits achieved via model predictive control of the AC system. Solar Energy 2017, 157, 830–852. [Google Scholar] [CrossRef]
- Wang, D.; Chen, Y.; Wang, W.; Gao, C.; Wang, Z. Field test of Model Predictive Control in residential buildings for utility cost savings. Energy & Buildings 2023, 288, 113026. [Google Scholar]
- Wang, W.; Katipamula, S.; Huang, Y.; Brambley, M. R. Energy savings and economics of advanced control strategies for packaged air conditioners with gas heat. Energy & Buildings 2013, 65, 497–507. [Google Scholar]
- Xu, F.; Huang, B.; Akande, S. Performance Assessment of Model Predictive Control for Variability and Constraint Tuning. Industrial & Engineering Chemistry Research 2007, 46(4), 1208–1219. [Google Scholar]
- Zavala, V. M.; Biegler, L. T. Optimization-based strategies for the operation of low-density polyethylene tubular reactors: nonlinear model predictive control. Computers and Chemical Engineering 2009, 33, 1735–1746. [Google Scholar] [CrossRef]
- Zhang, T.; Gao, S.; Yang, Y.; Wang, S.; Ding, Z. Economic model predictive control of thermal-power boiler-turbine units. 2025. [Google Scholar]
Figure 1.
Process flowchart (Silva et al., 2023).
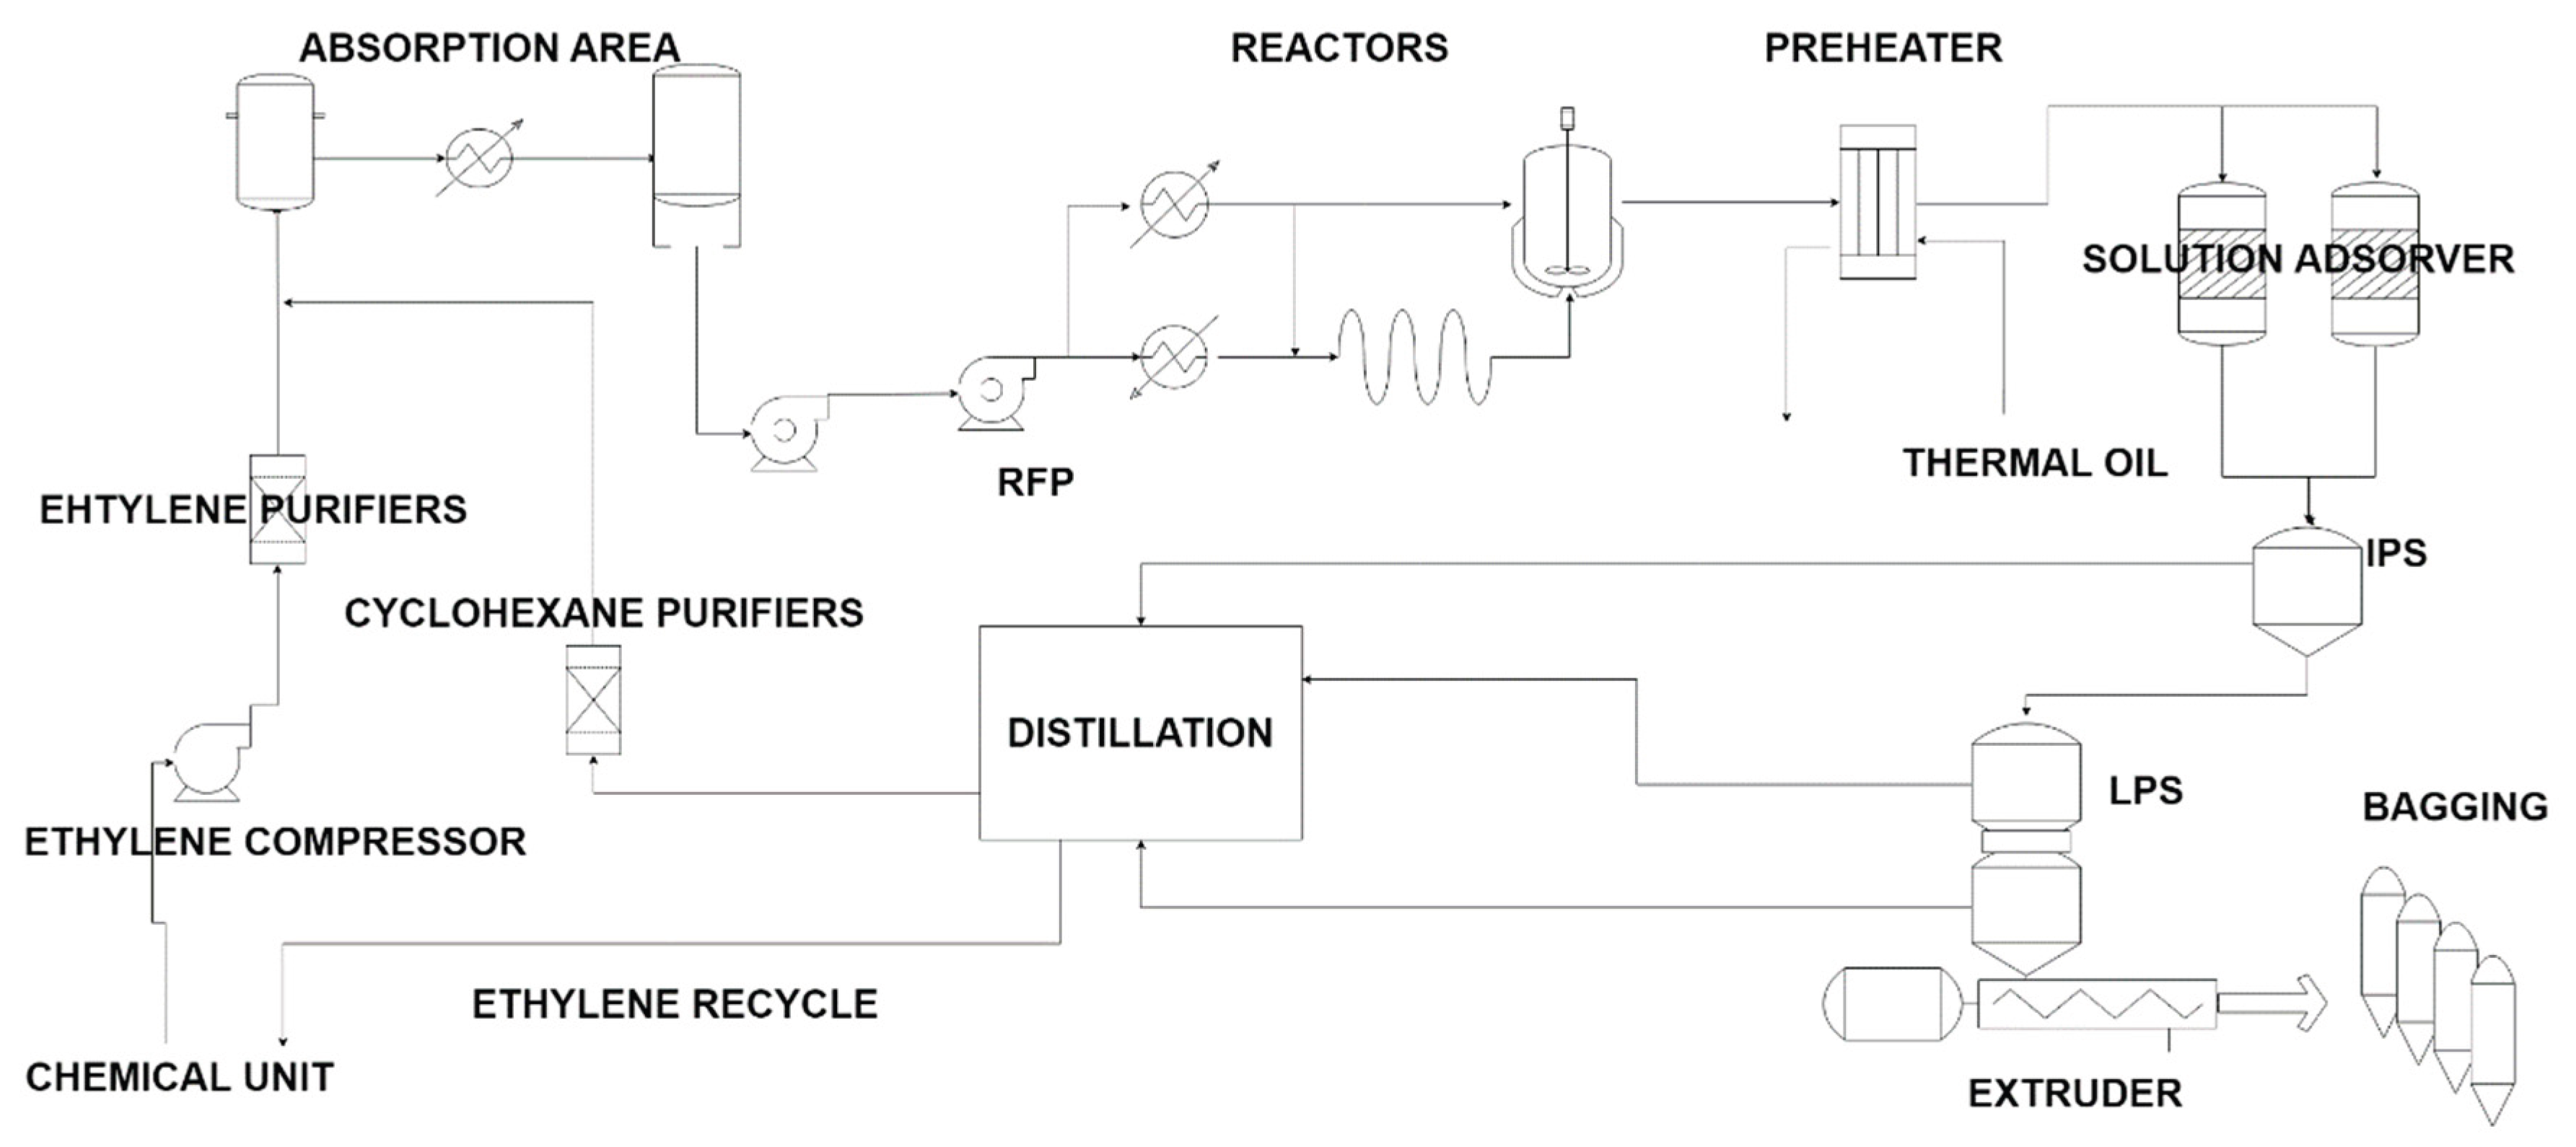
Figure 2.
Global process model.
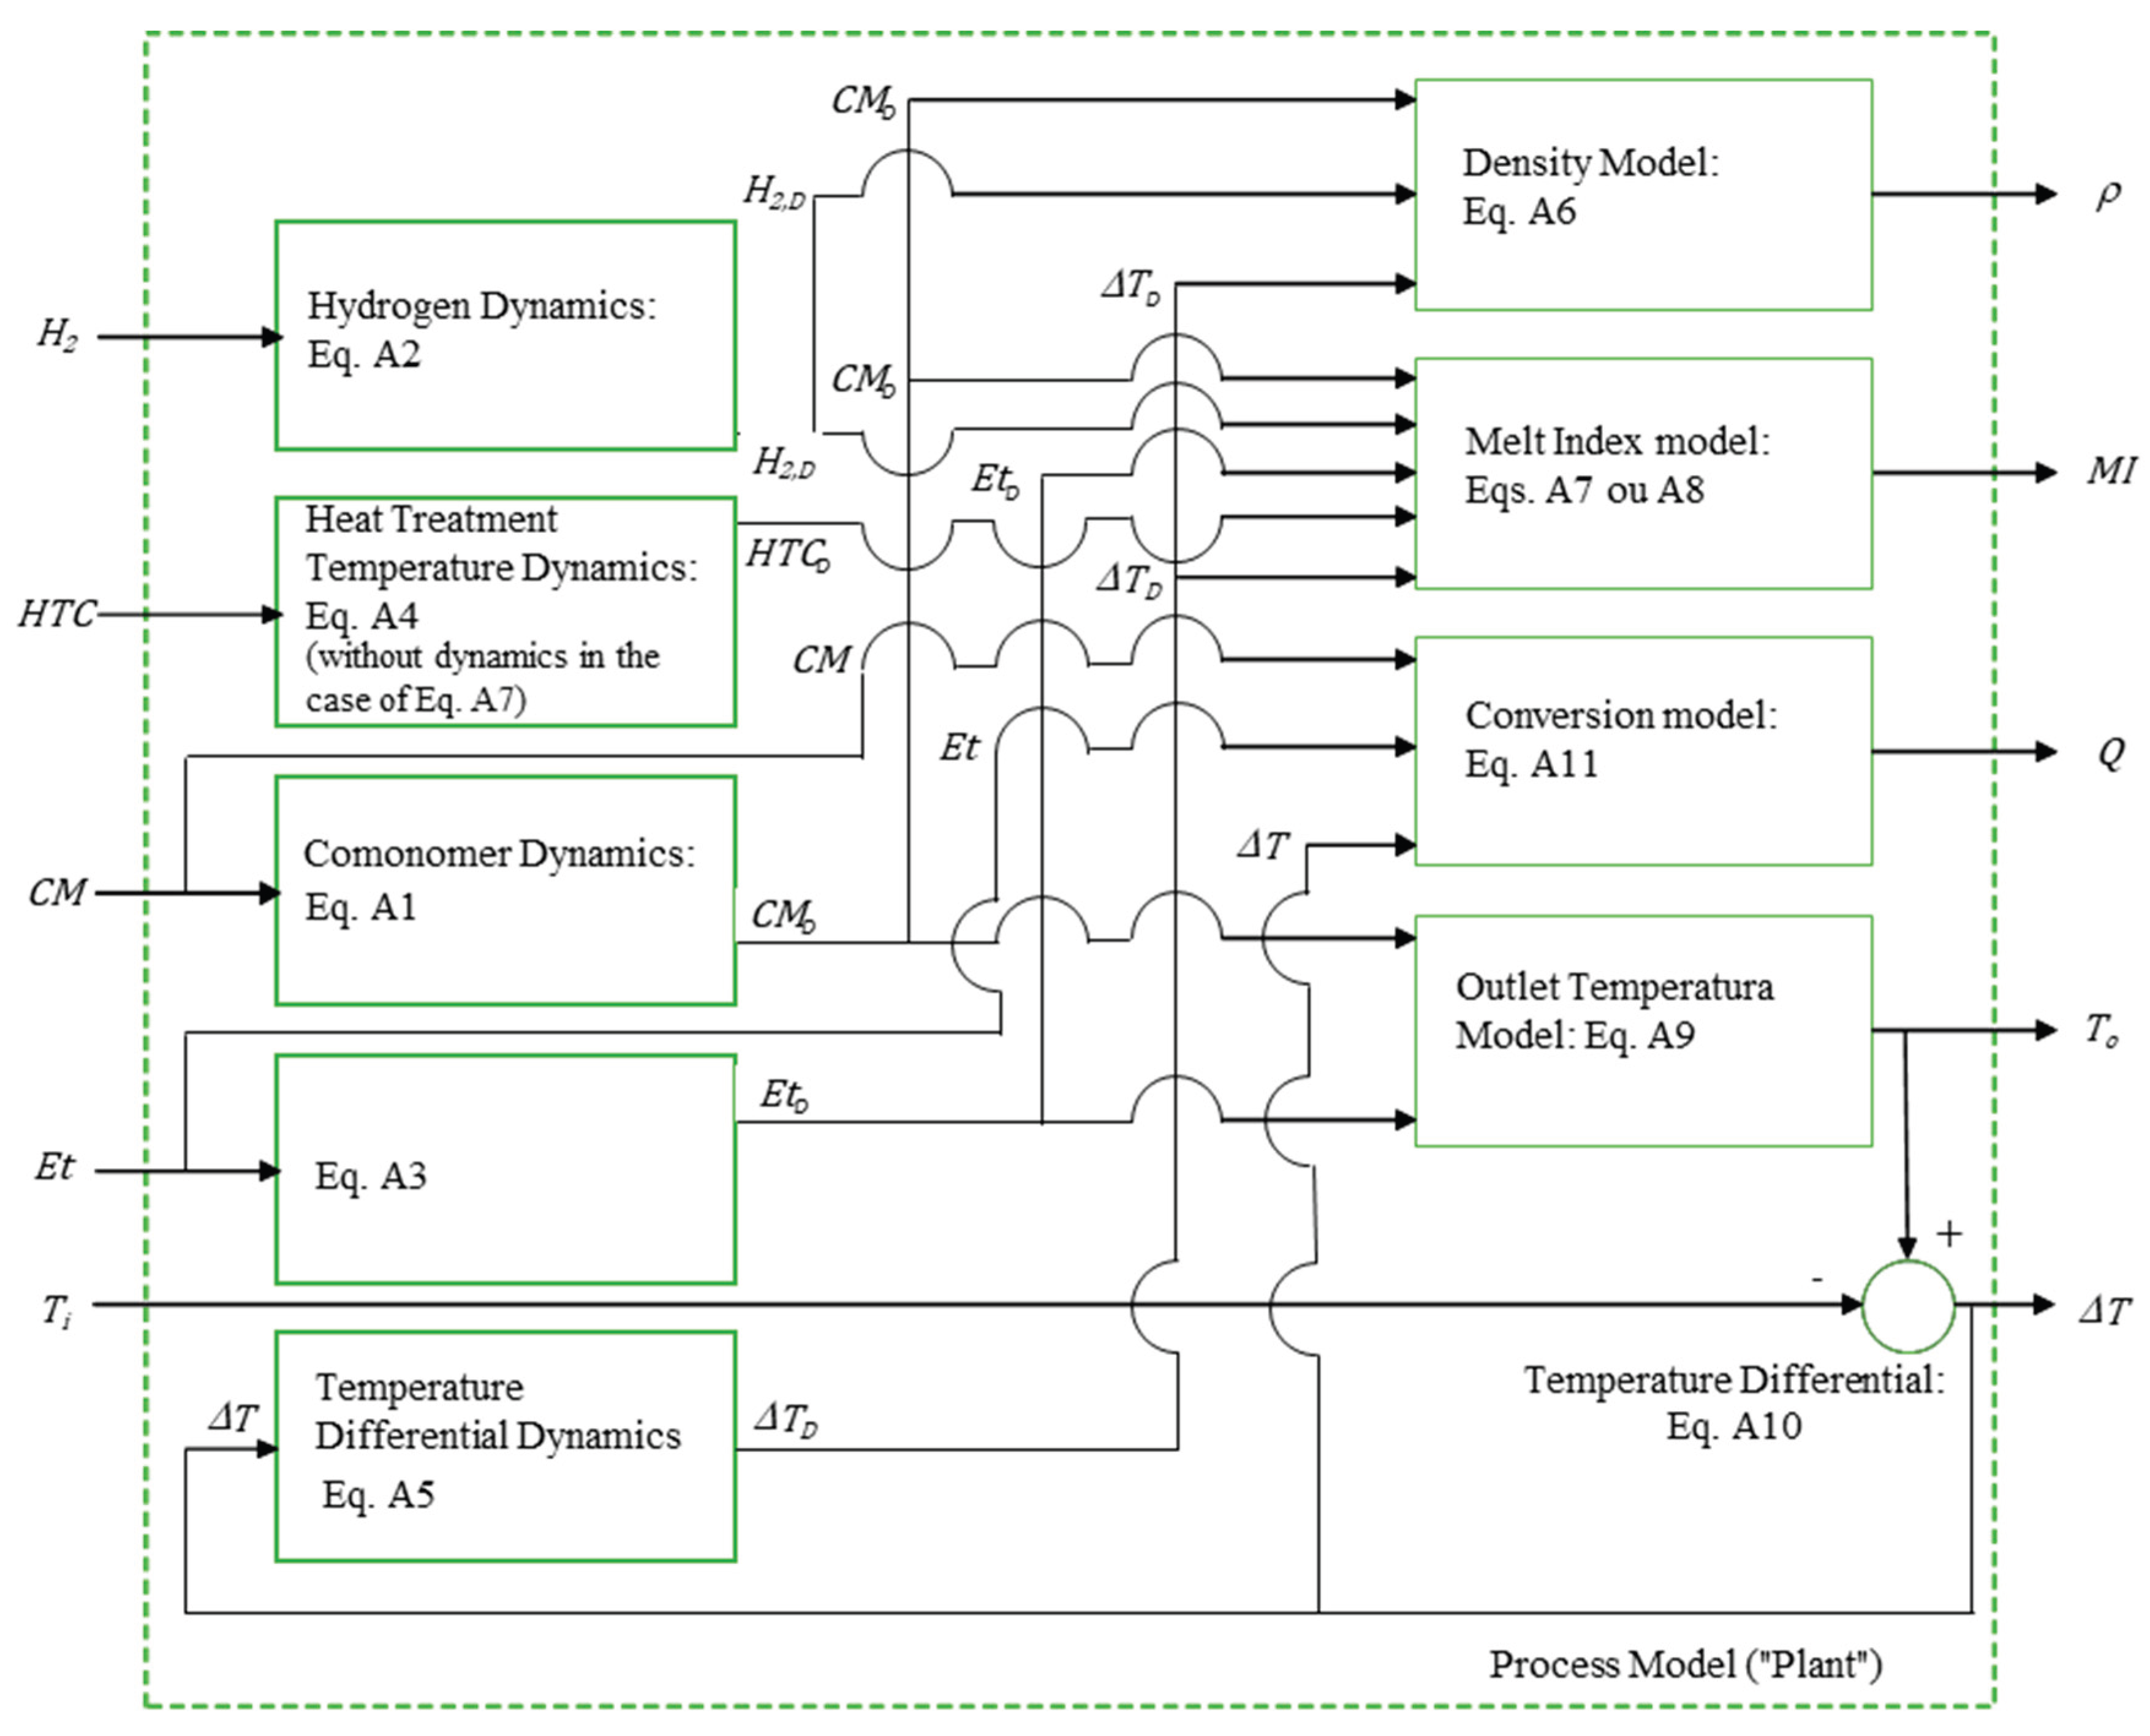
Figure 3.
Closed-loop simulation (butene copolymer resins).
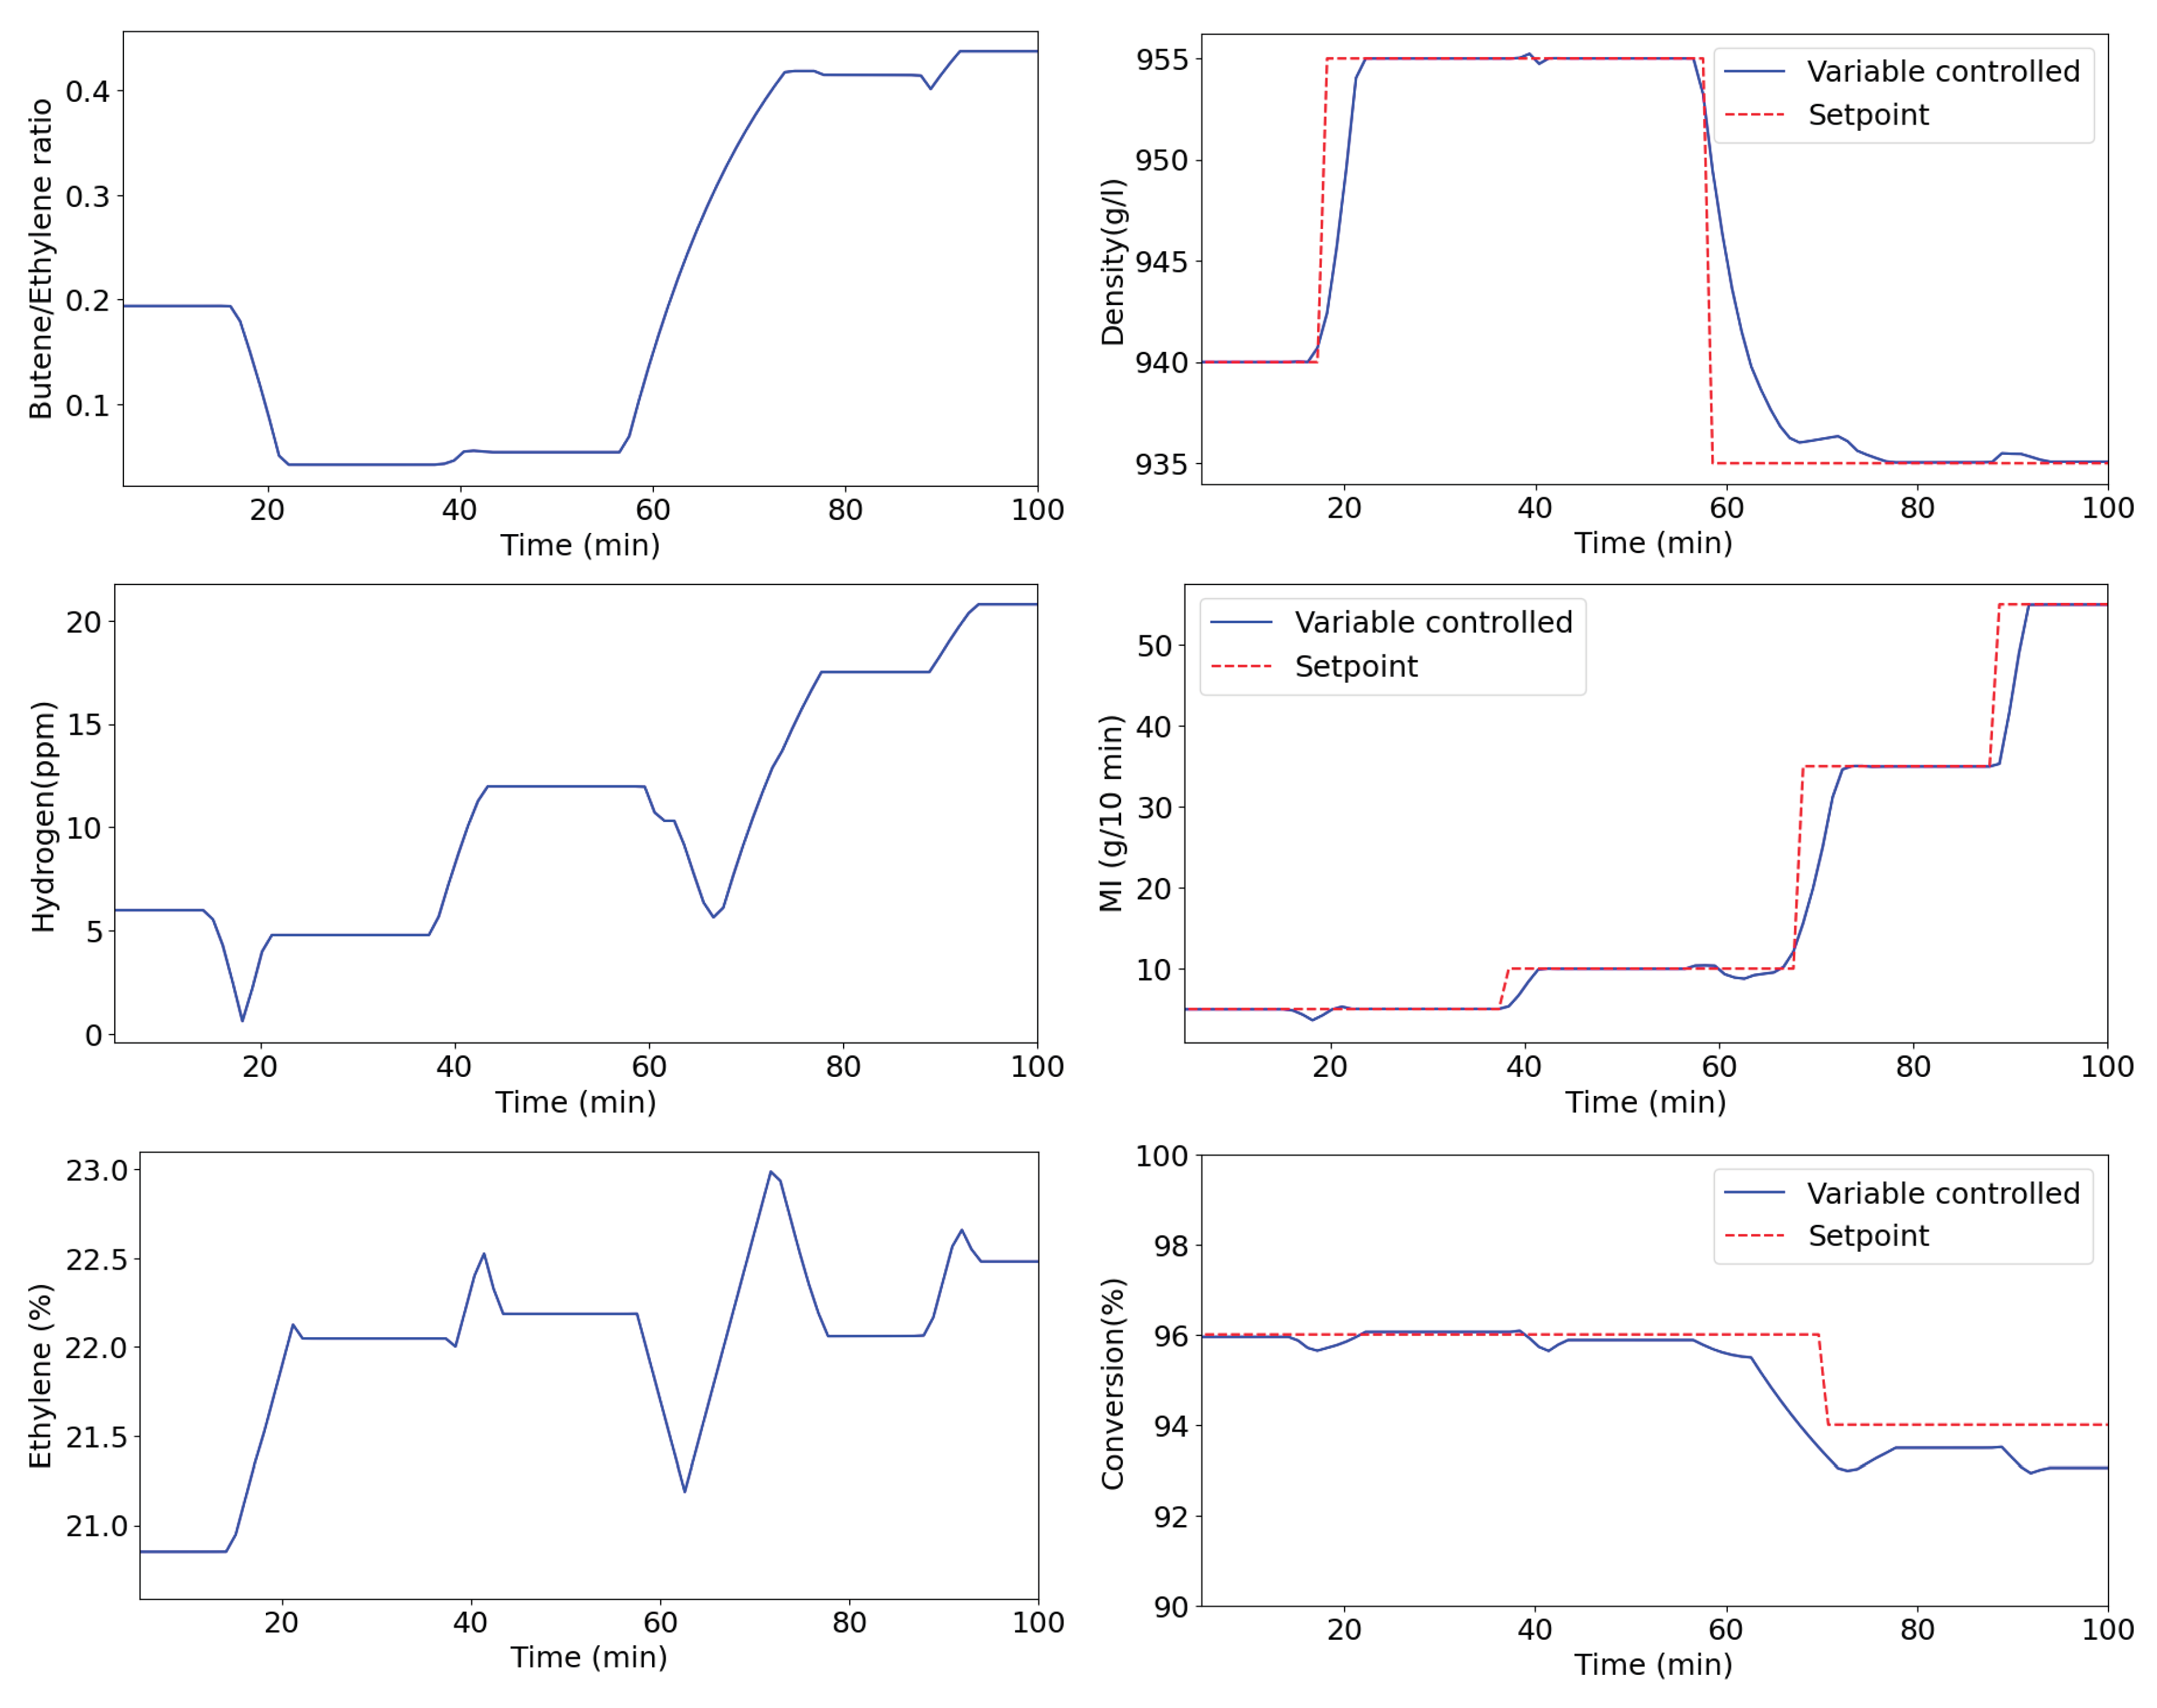
Figure 4.
Closed-loop simulation (butene film resins).
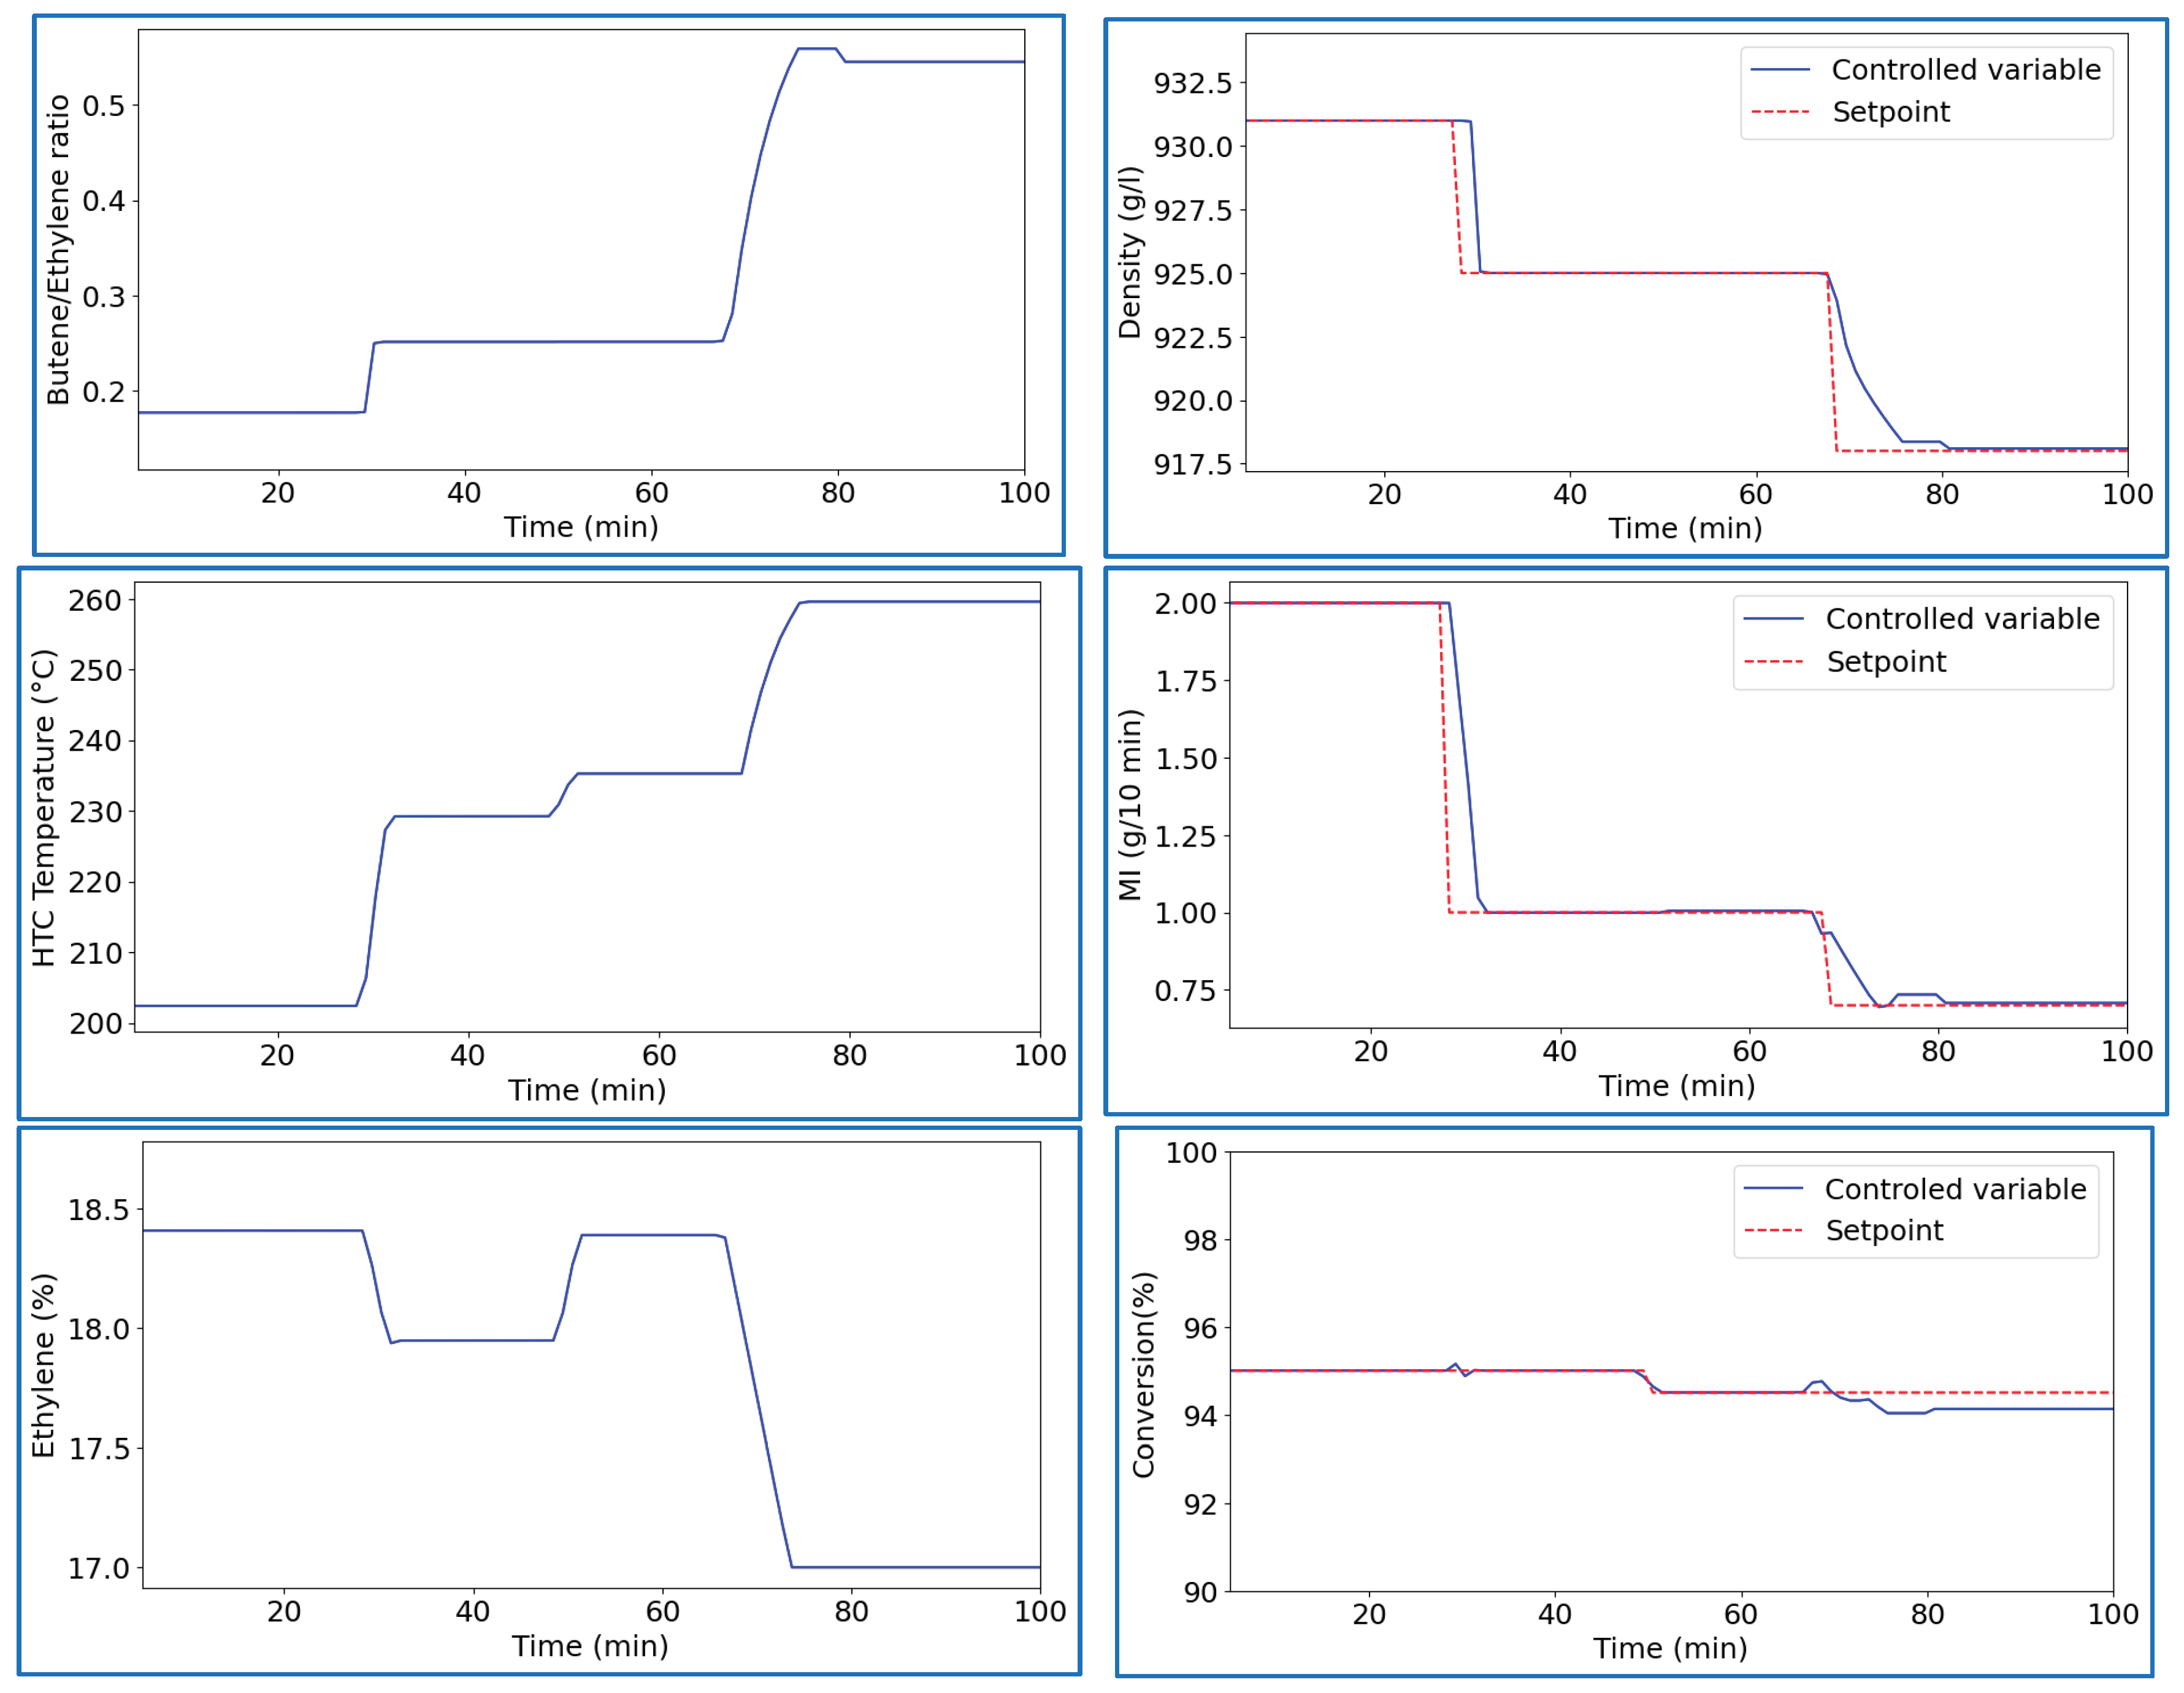
Figure 5.
Regulatory problem simulation (butene film resins).
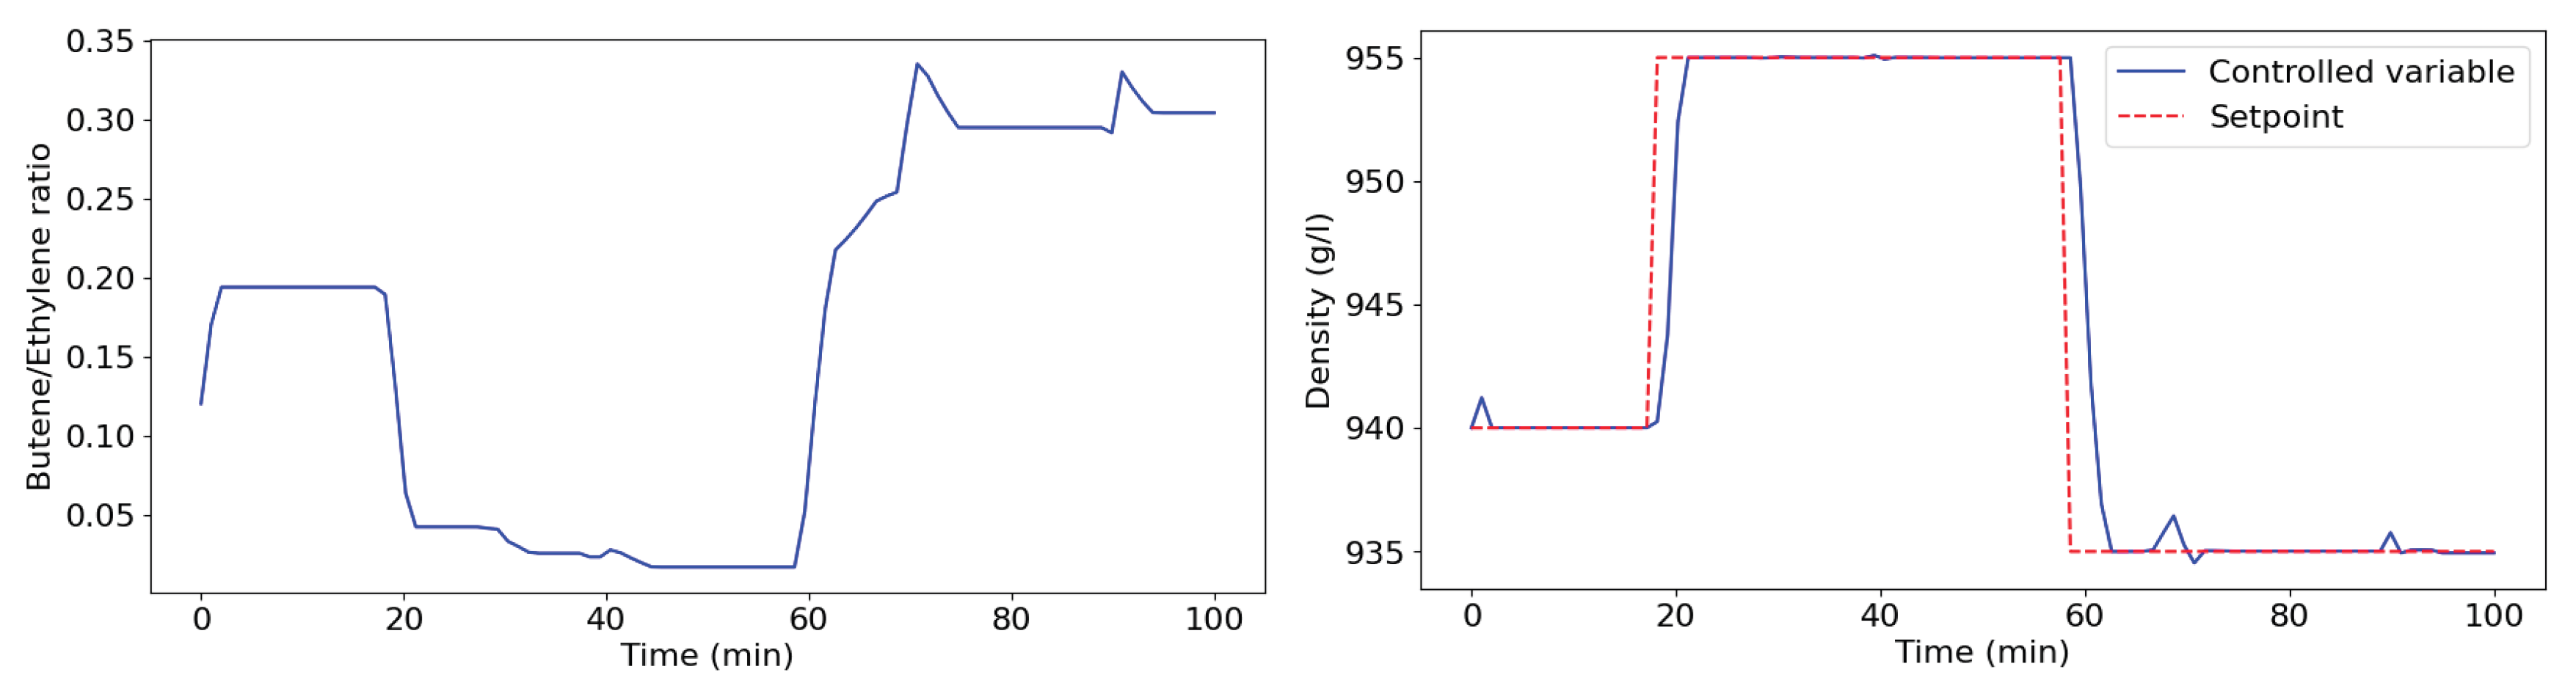
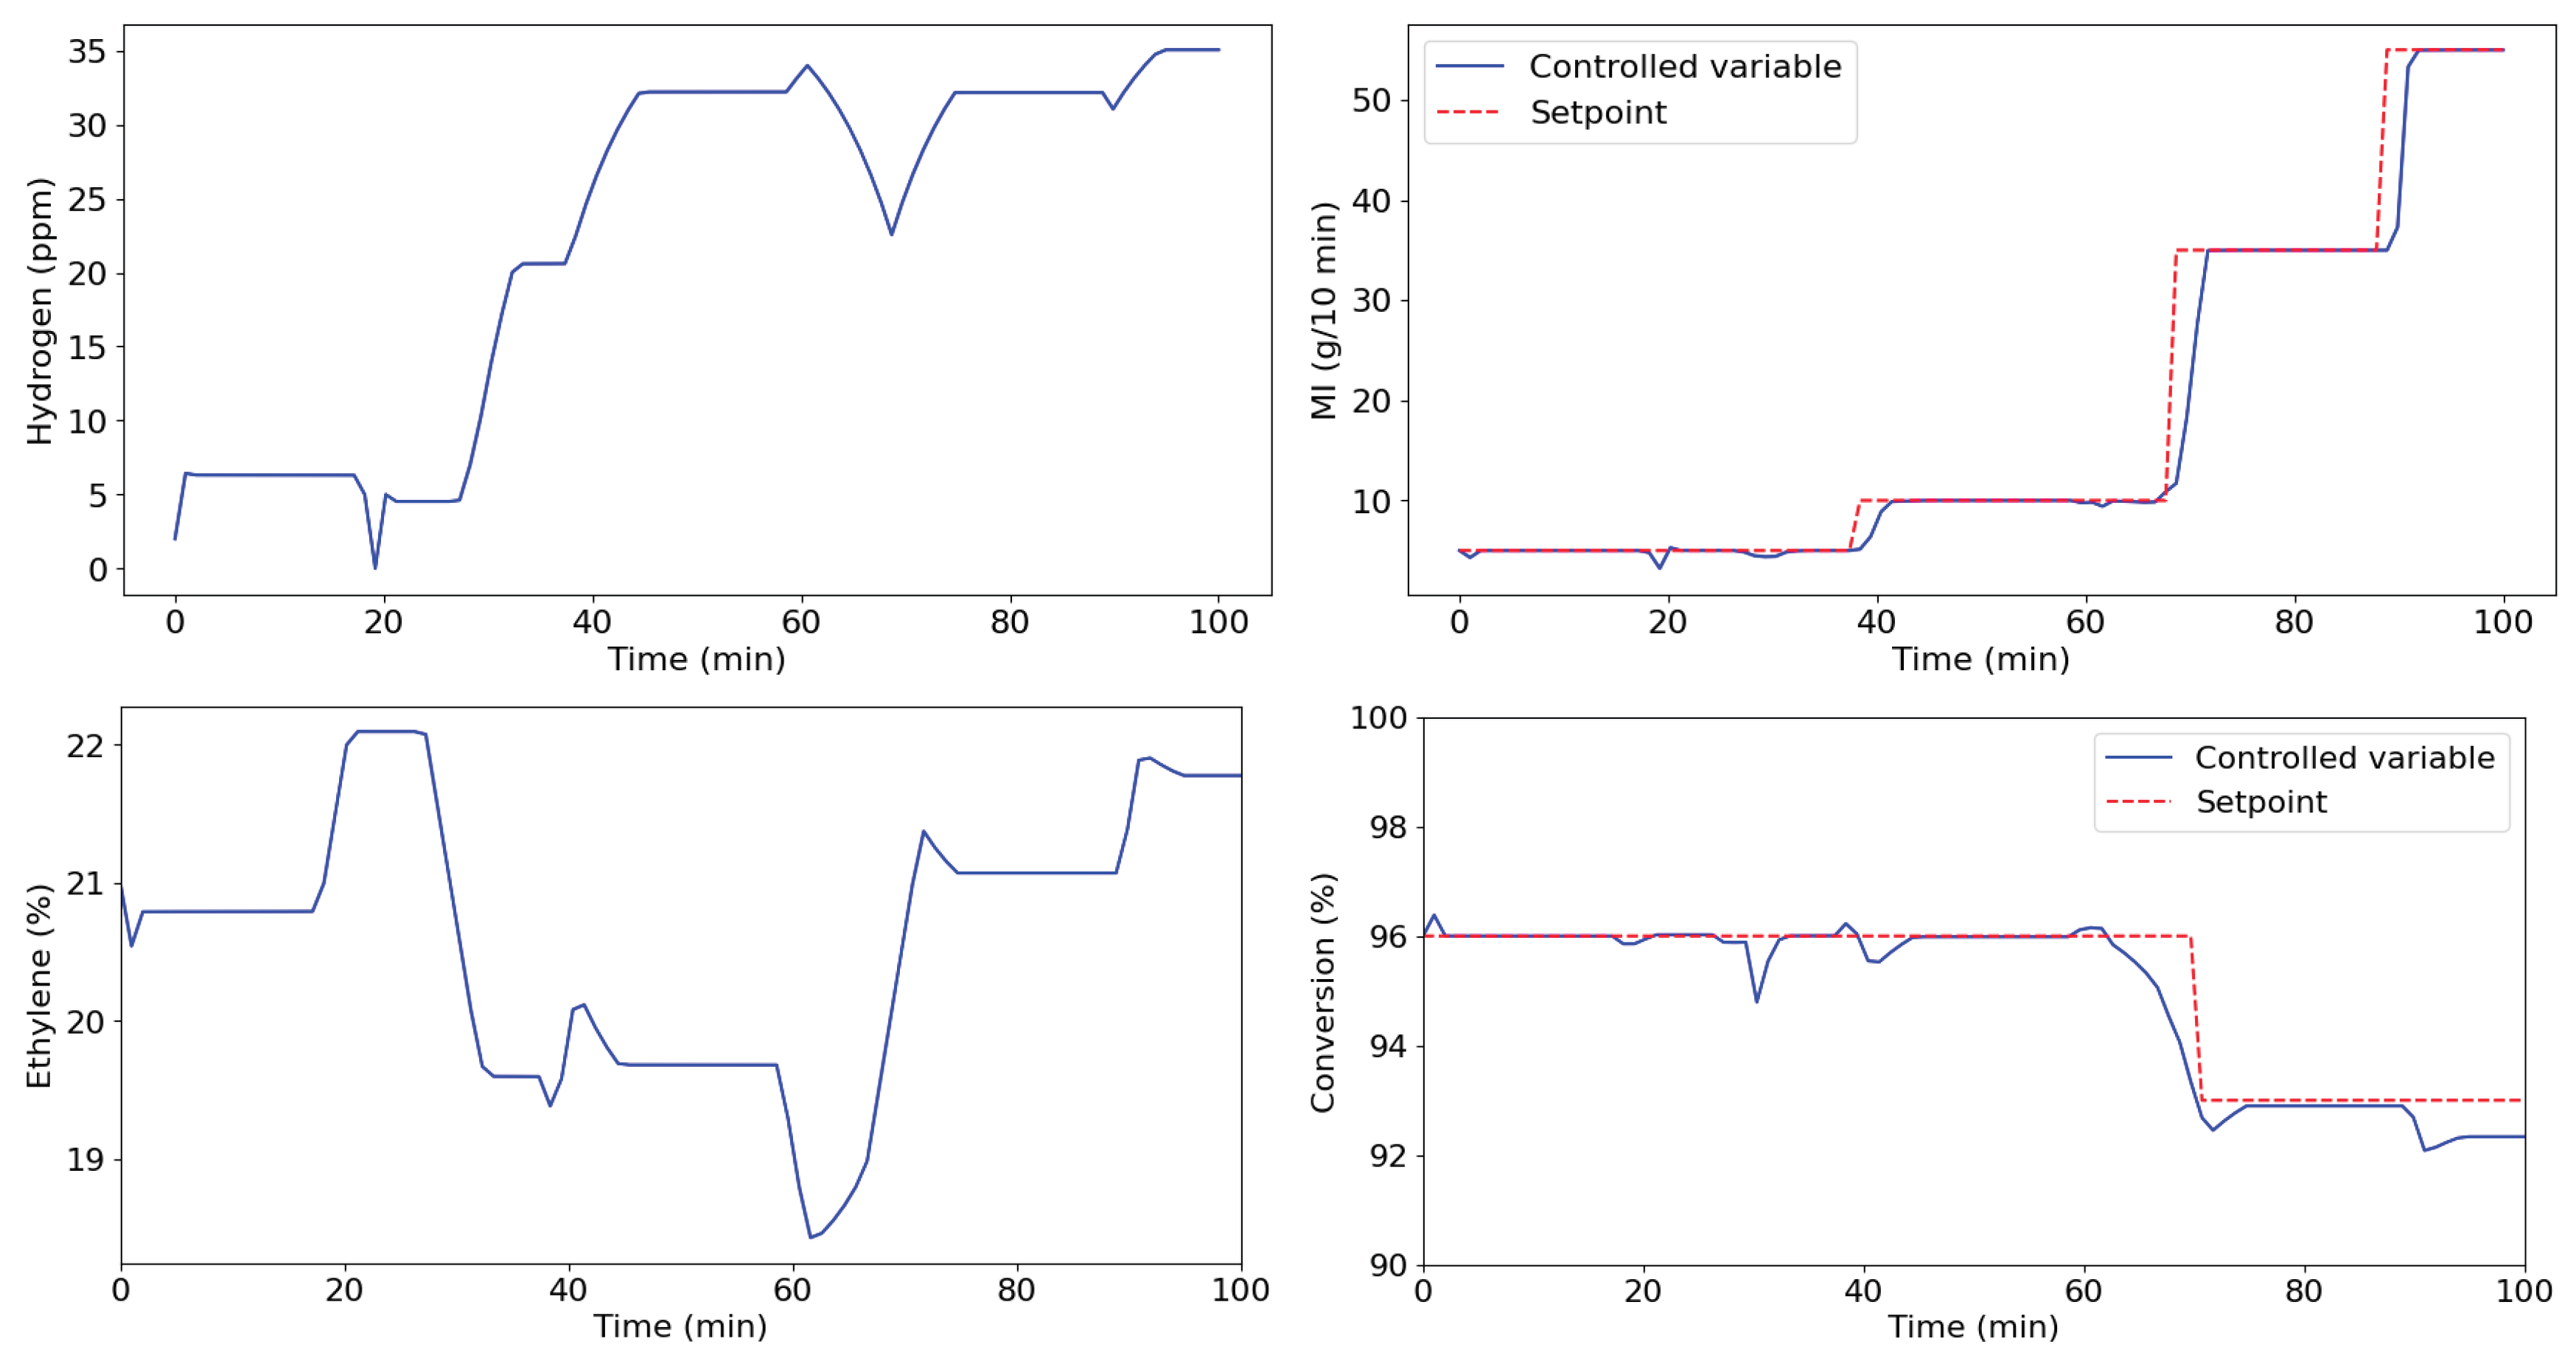
Figure 6.
Regulatory problem: time range (butene film resins) (impurity increase emulated and represented by an increase in inlet temperature).
Figure 6.
Regulatory problem: time range (butene film resins) (impurity increase emulated and represented by an increase in inlet temperature).
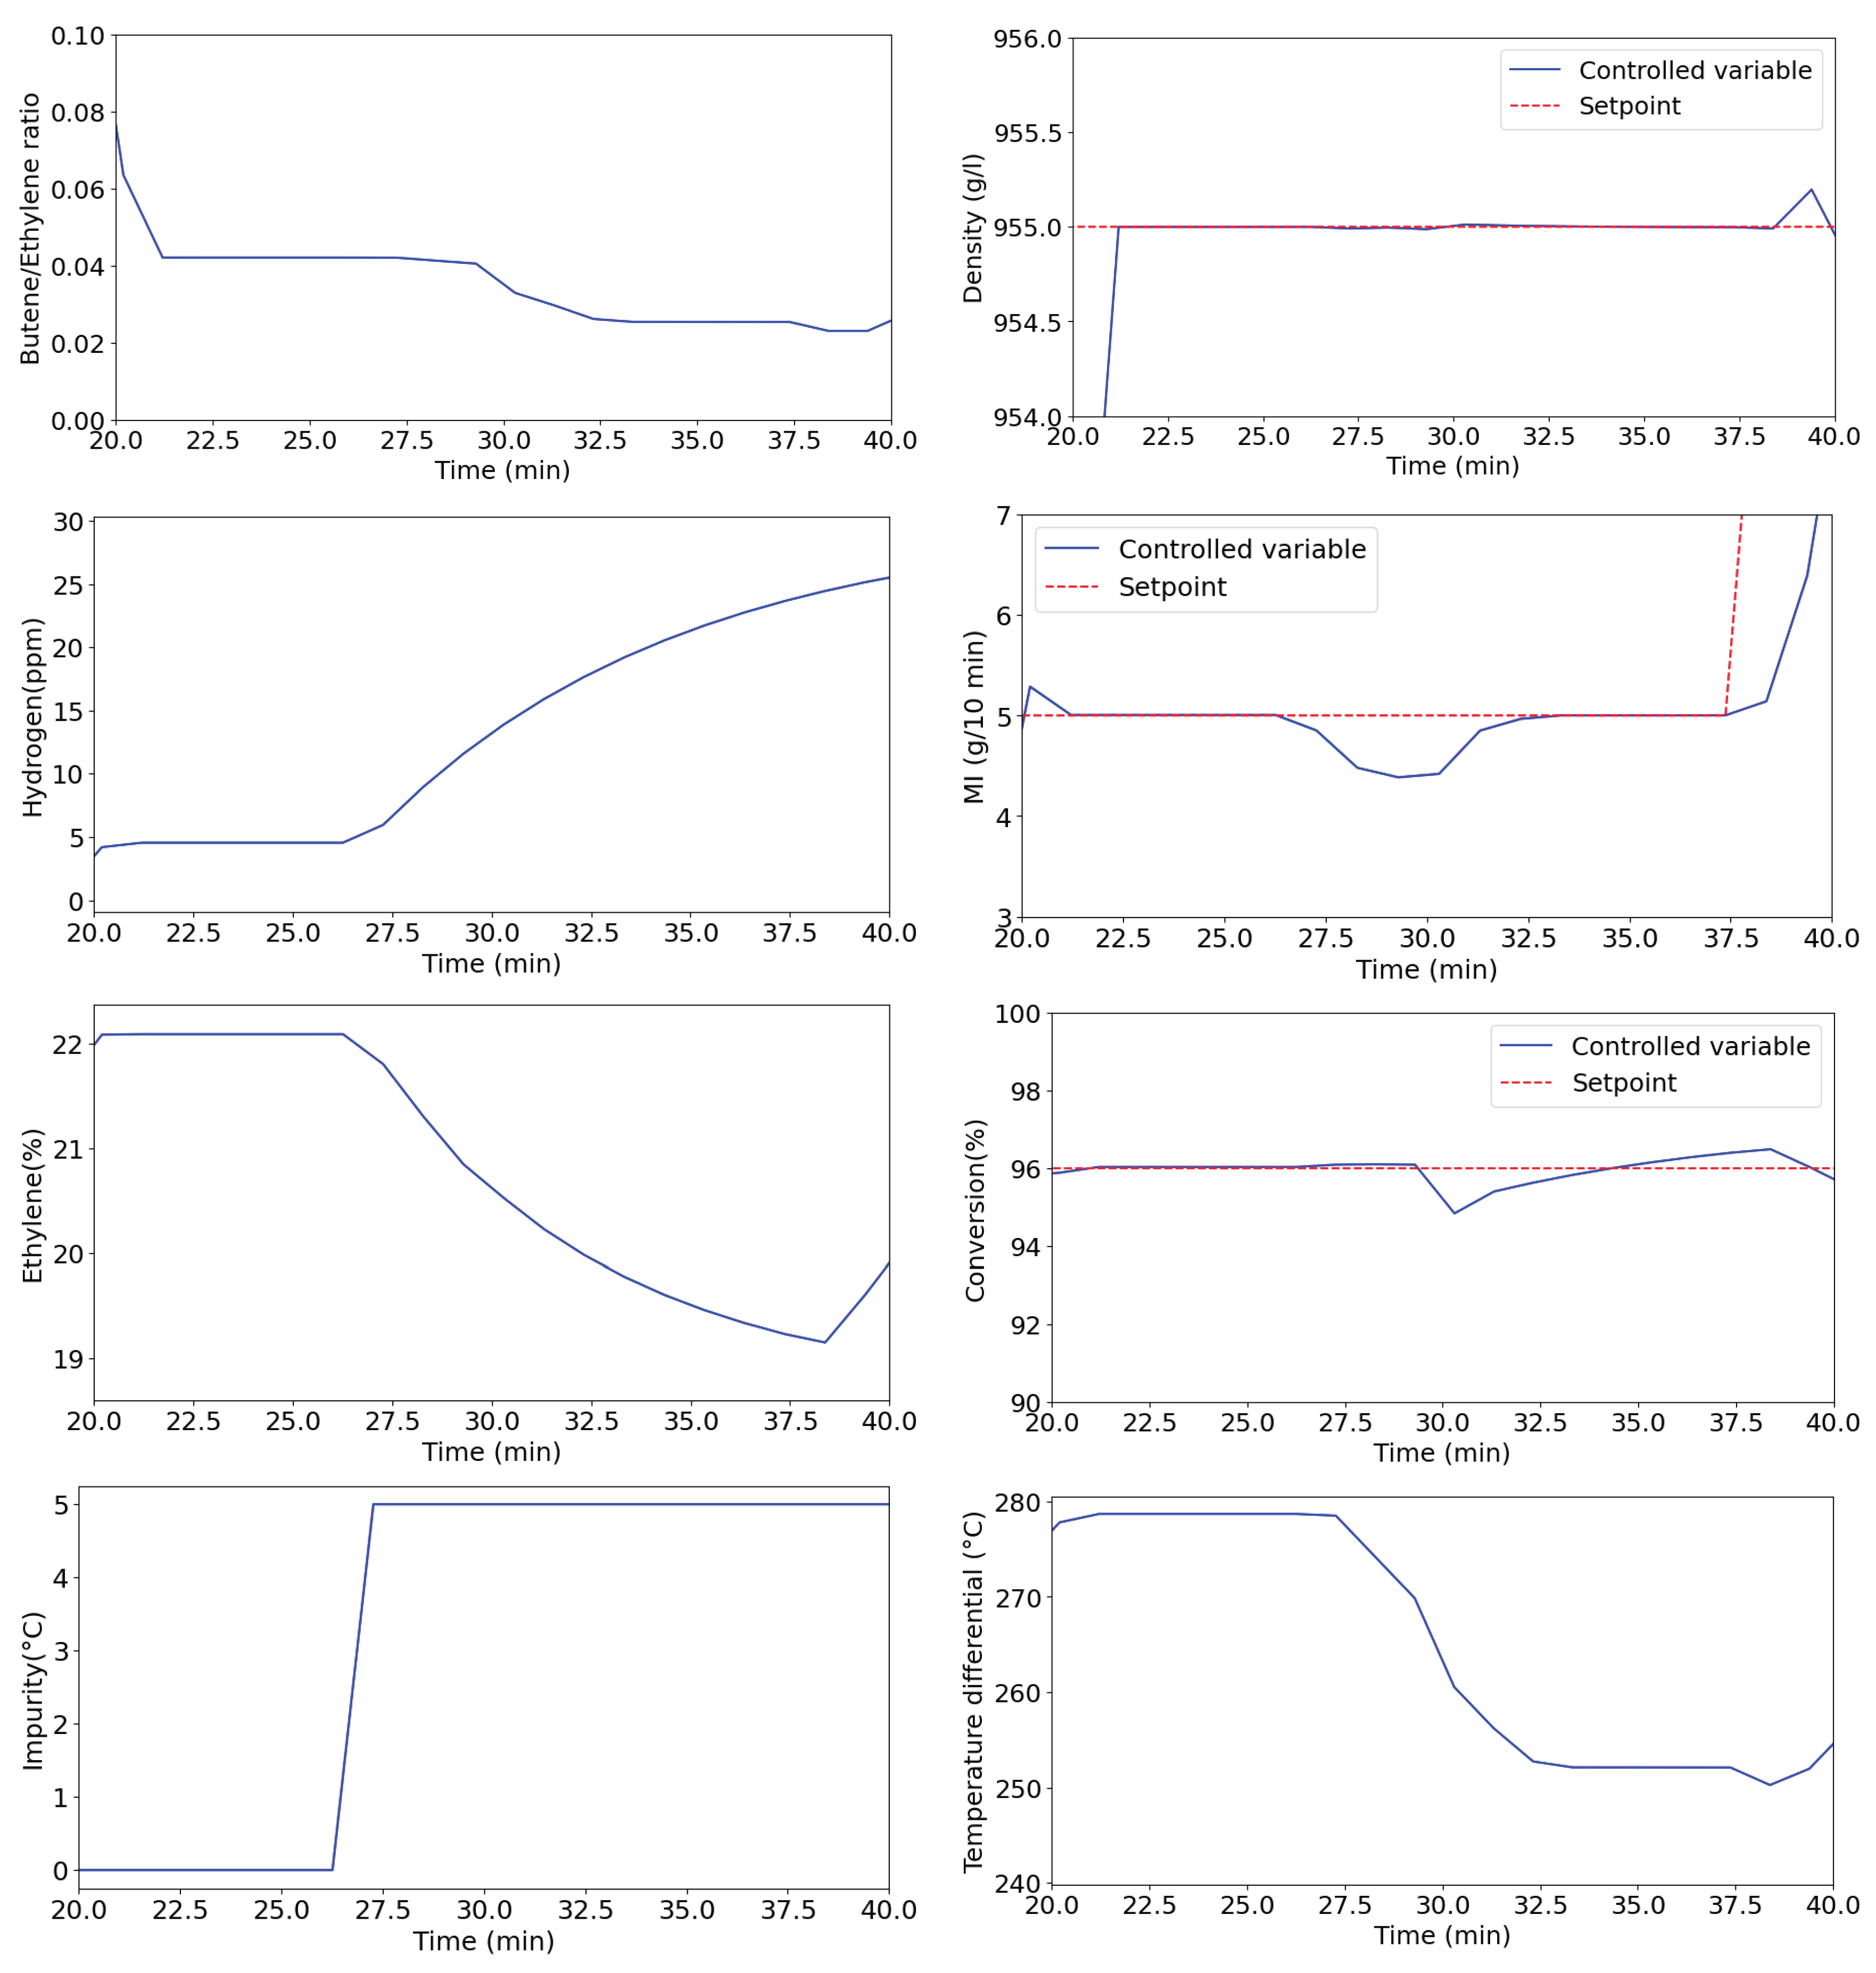
Figure 7.
Dispersion of MI and density results (rotational molding).
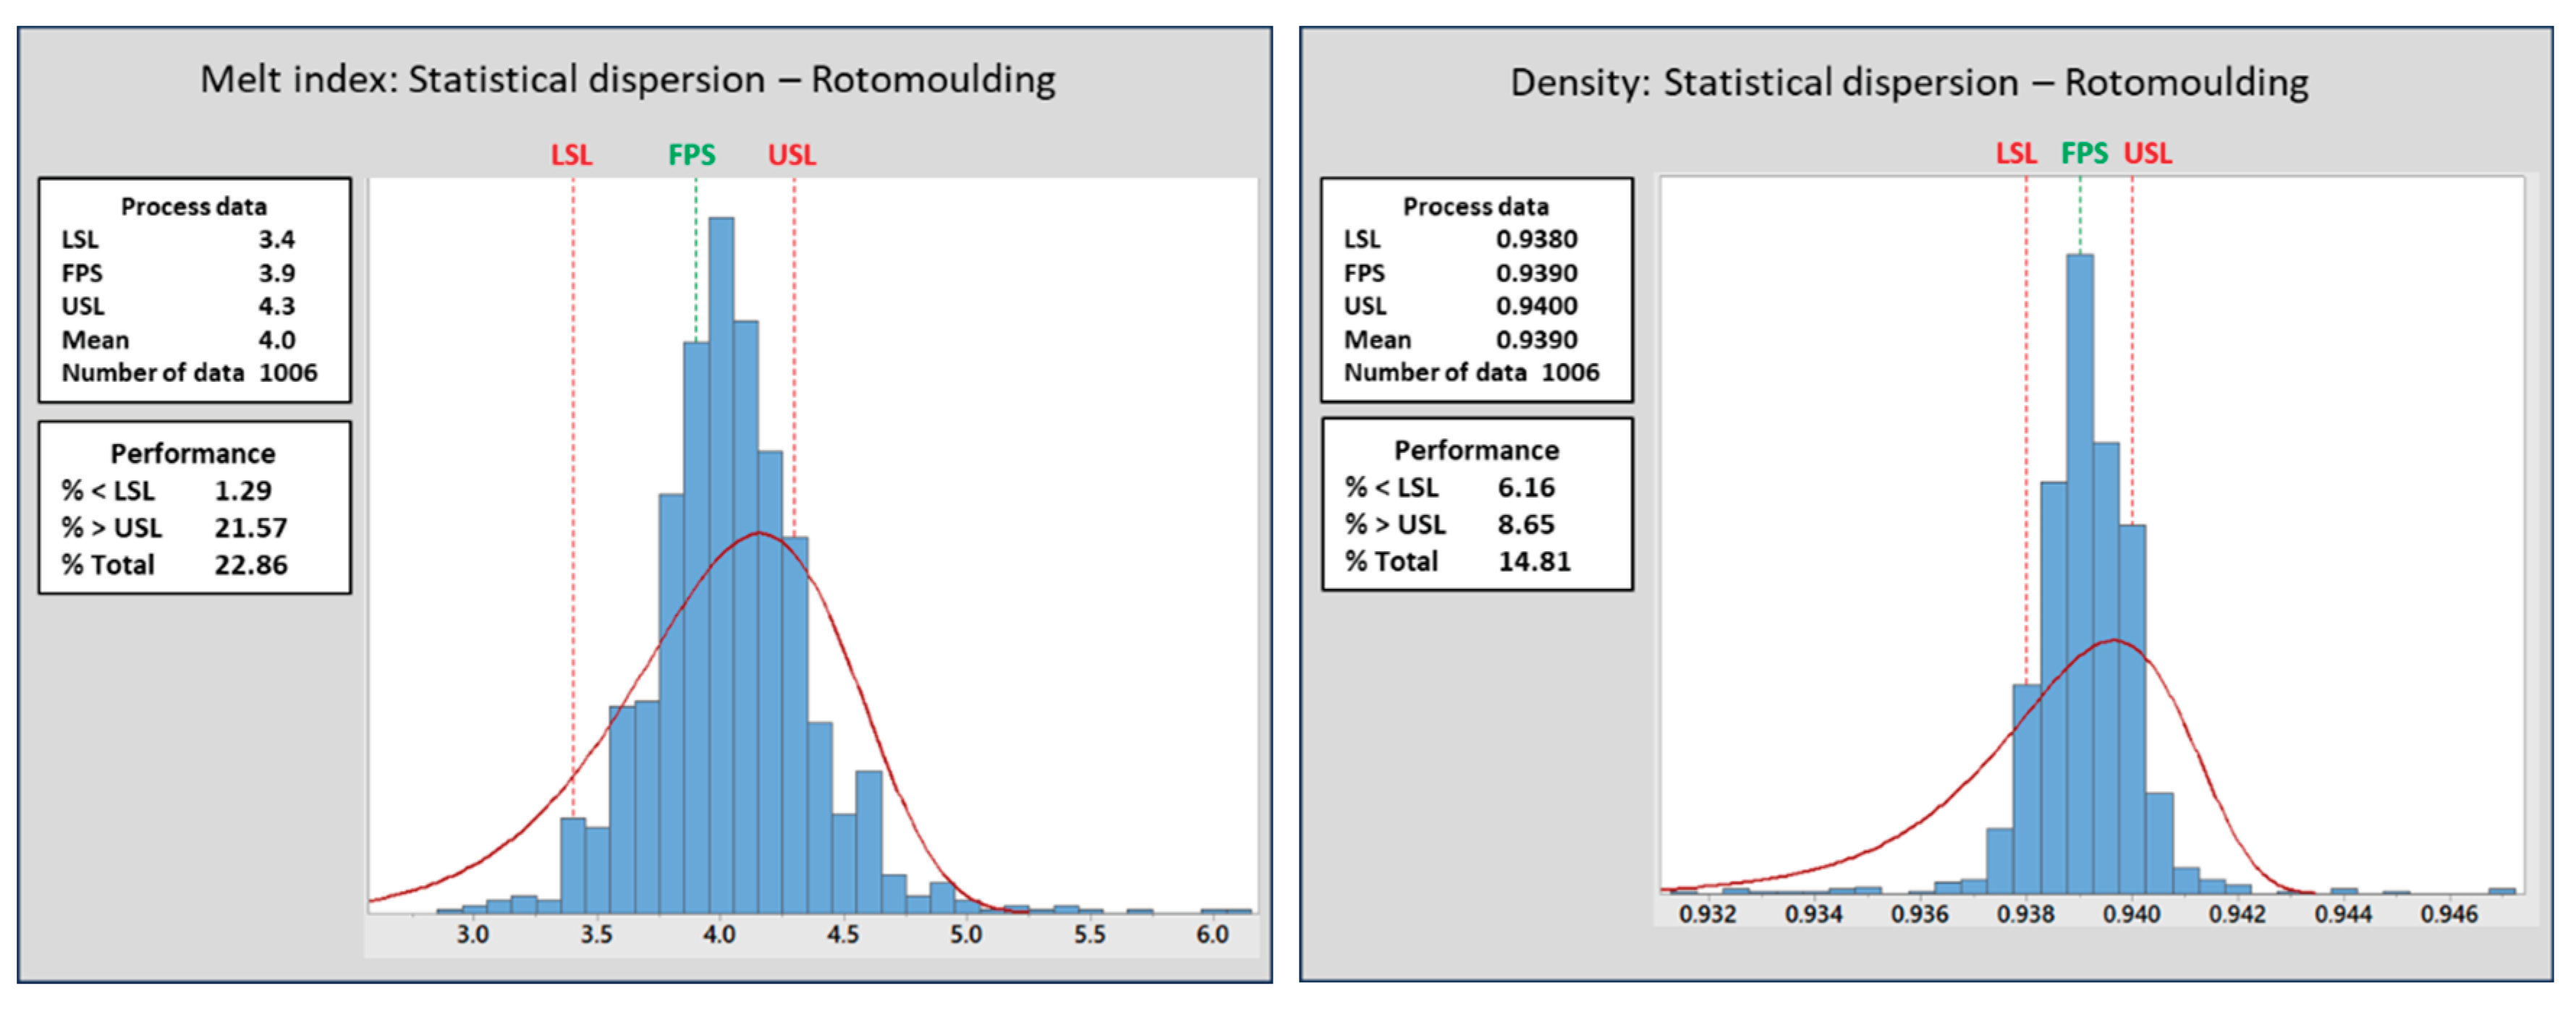
Figure 8.
Dispersion of MI and density results (low density injection).
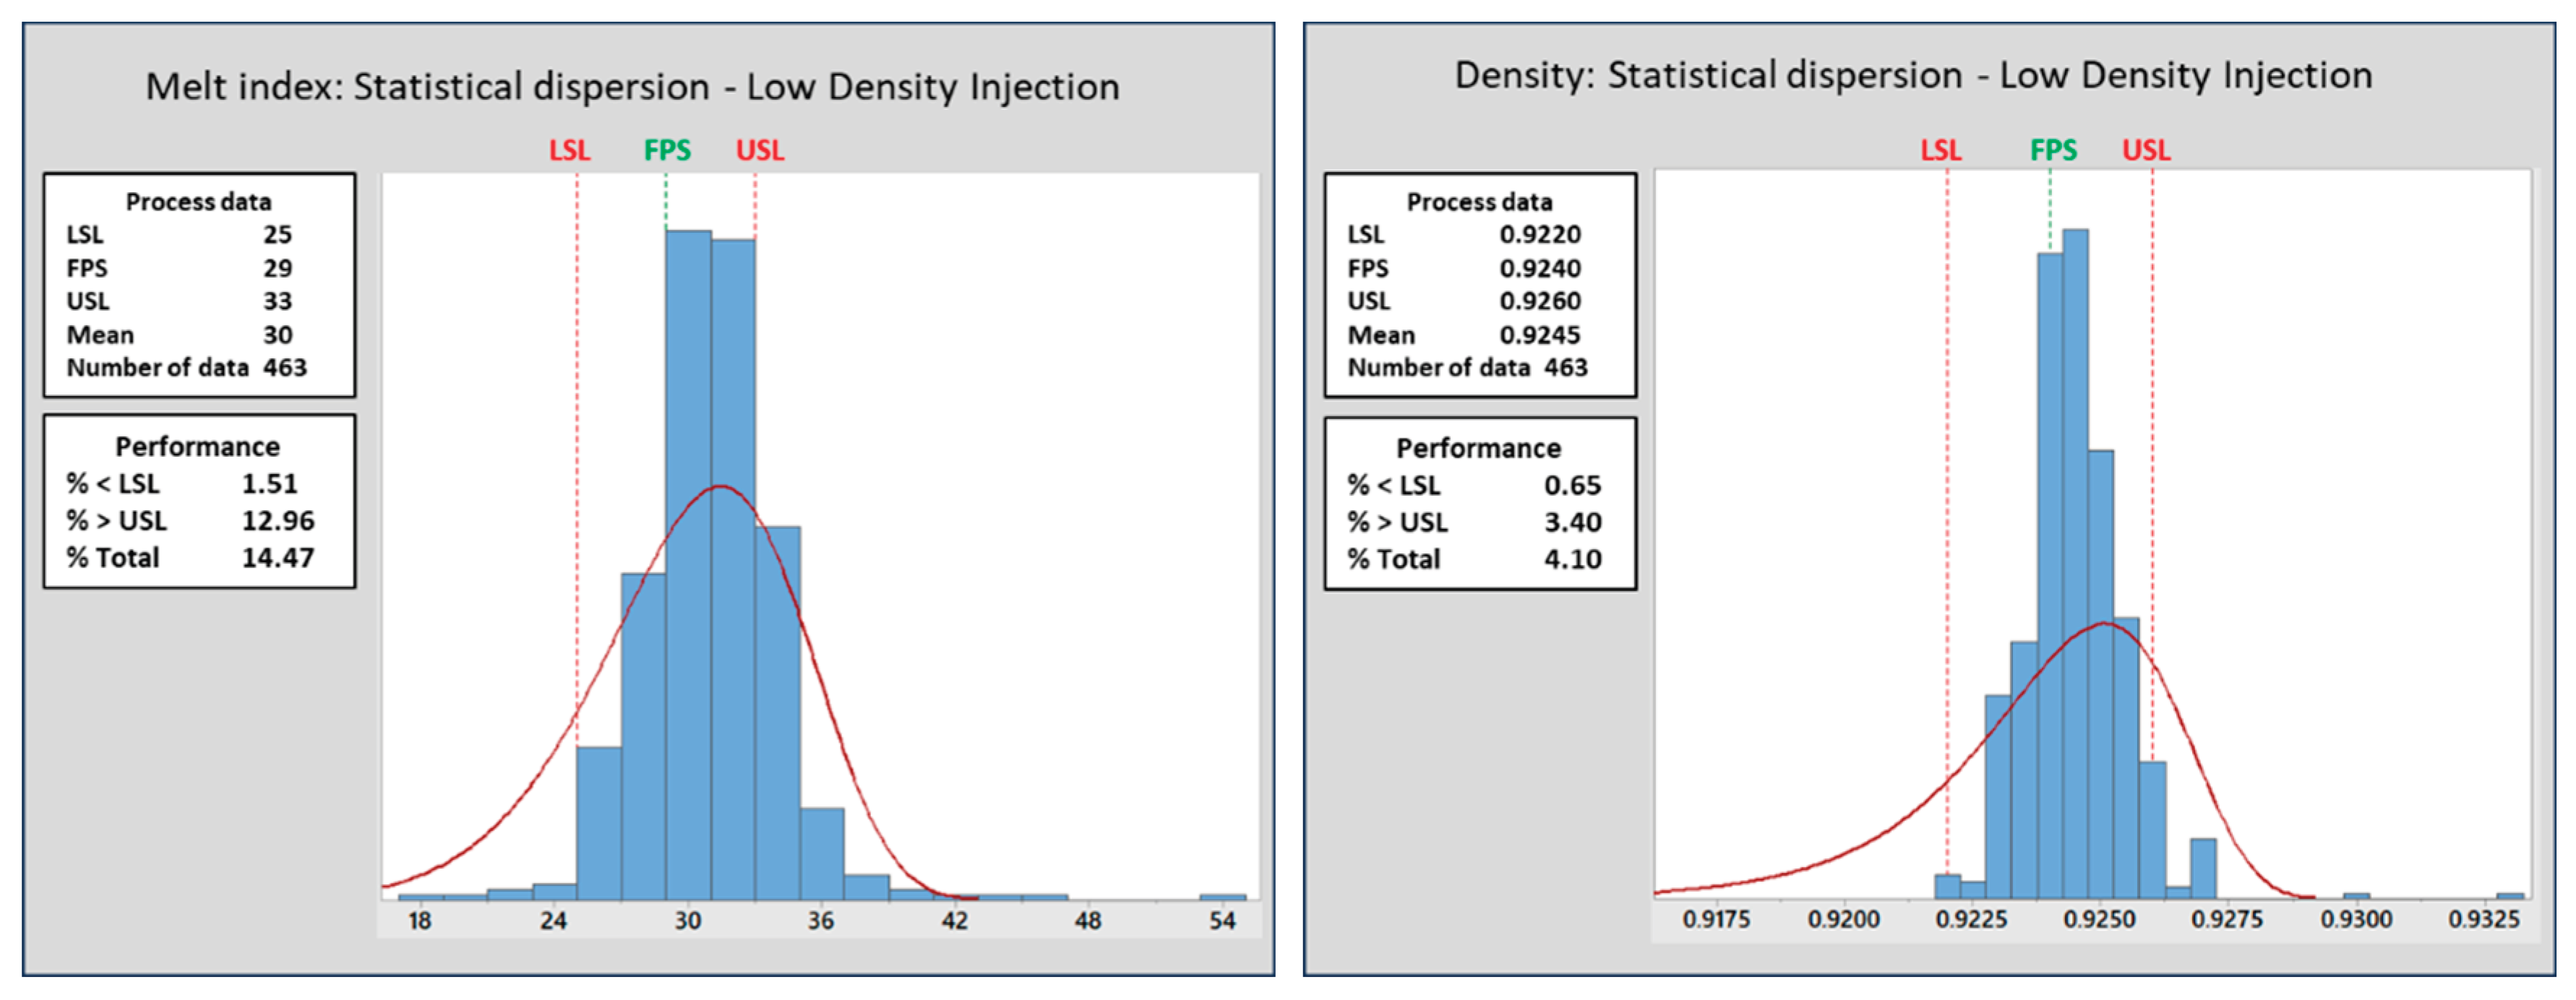
Figure 9.
Dispersion of MI and density results (octene film).
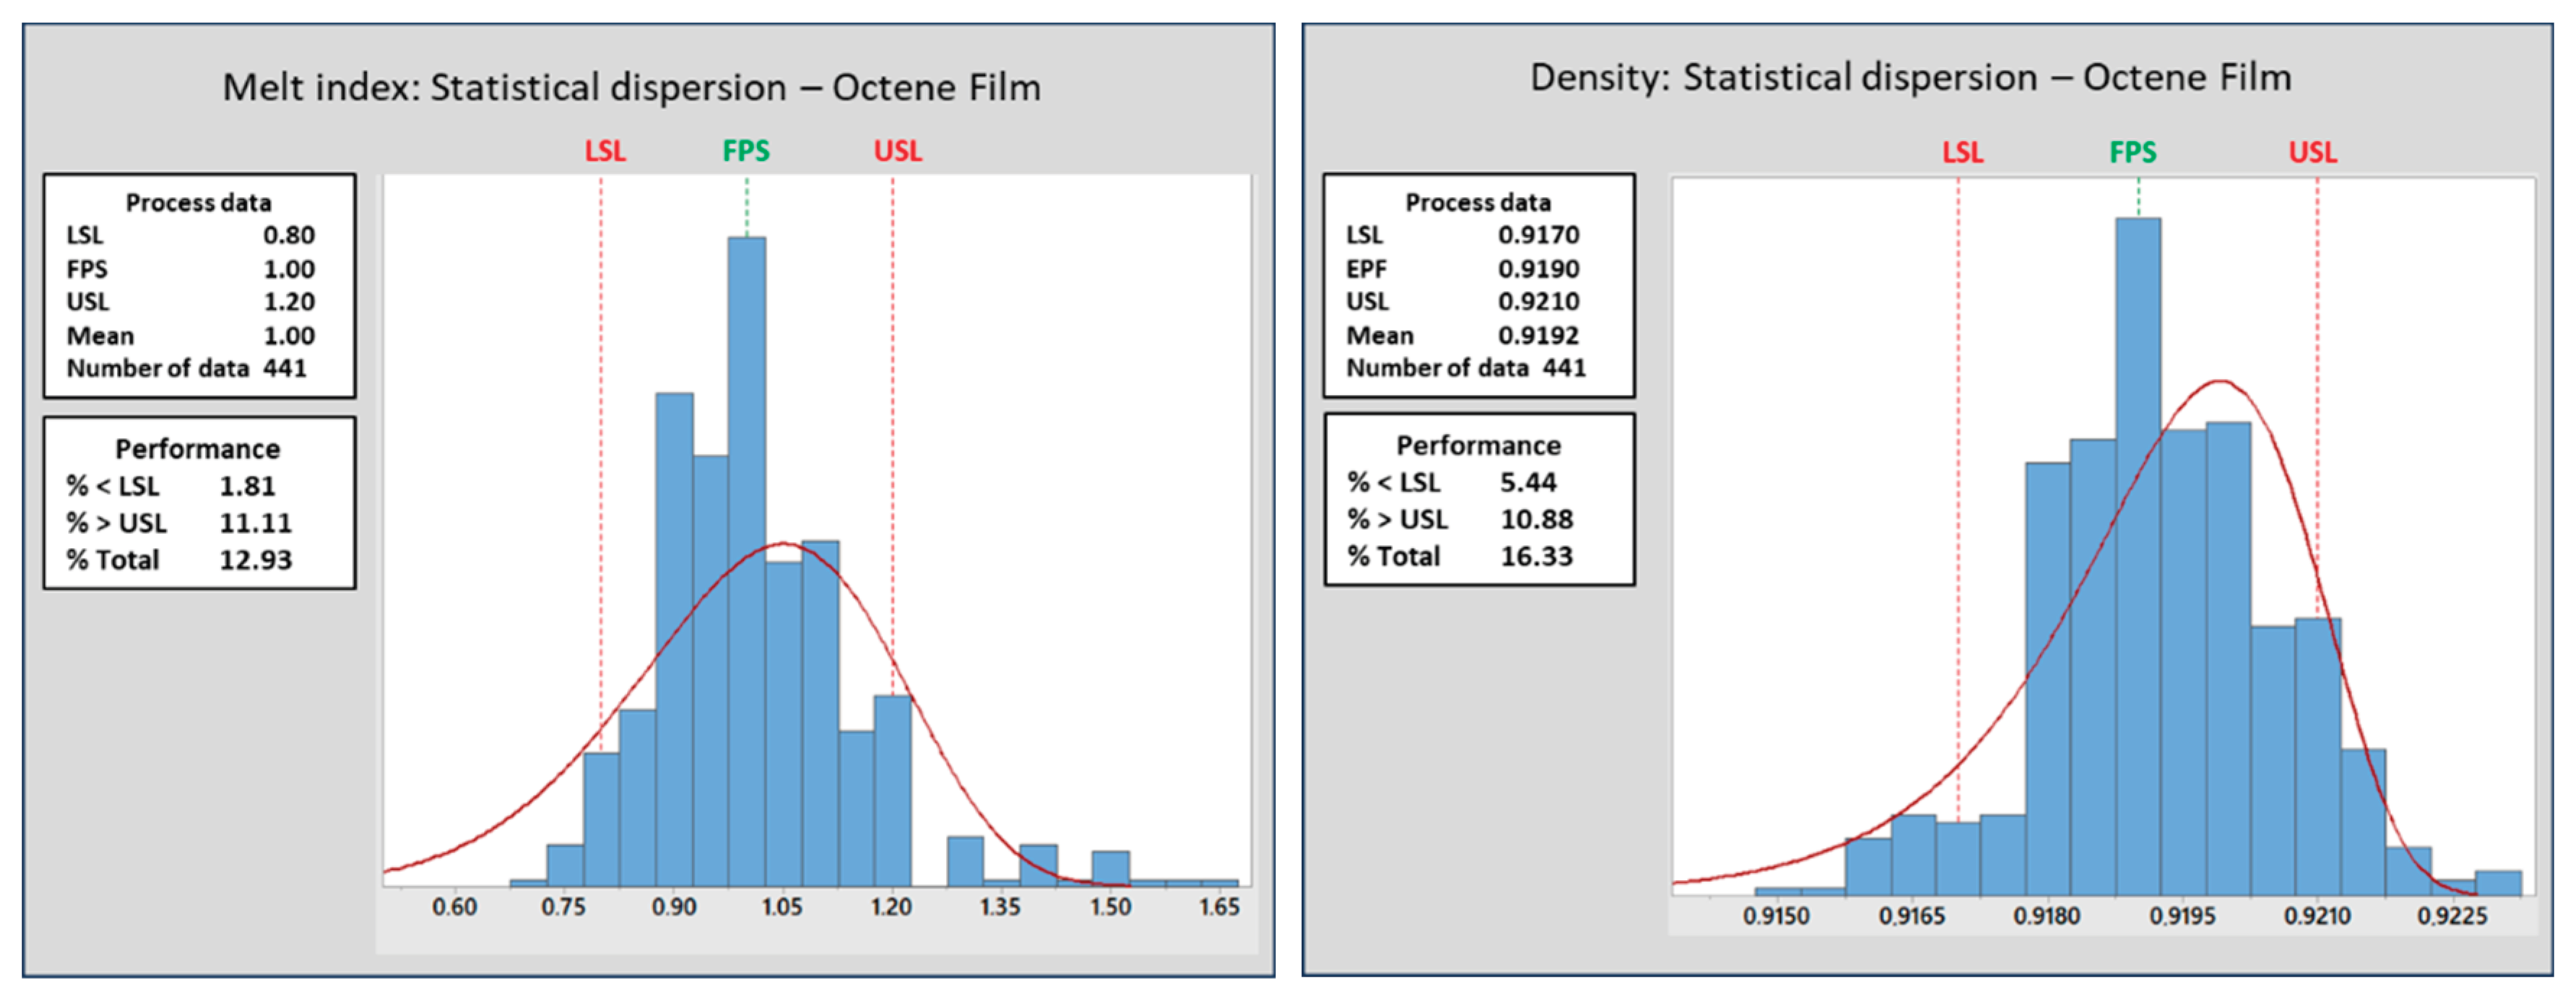
Figure 10.
Dispersion of MI and density results (high density injection).
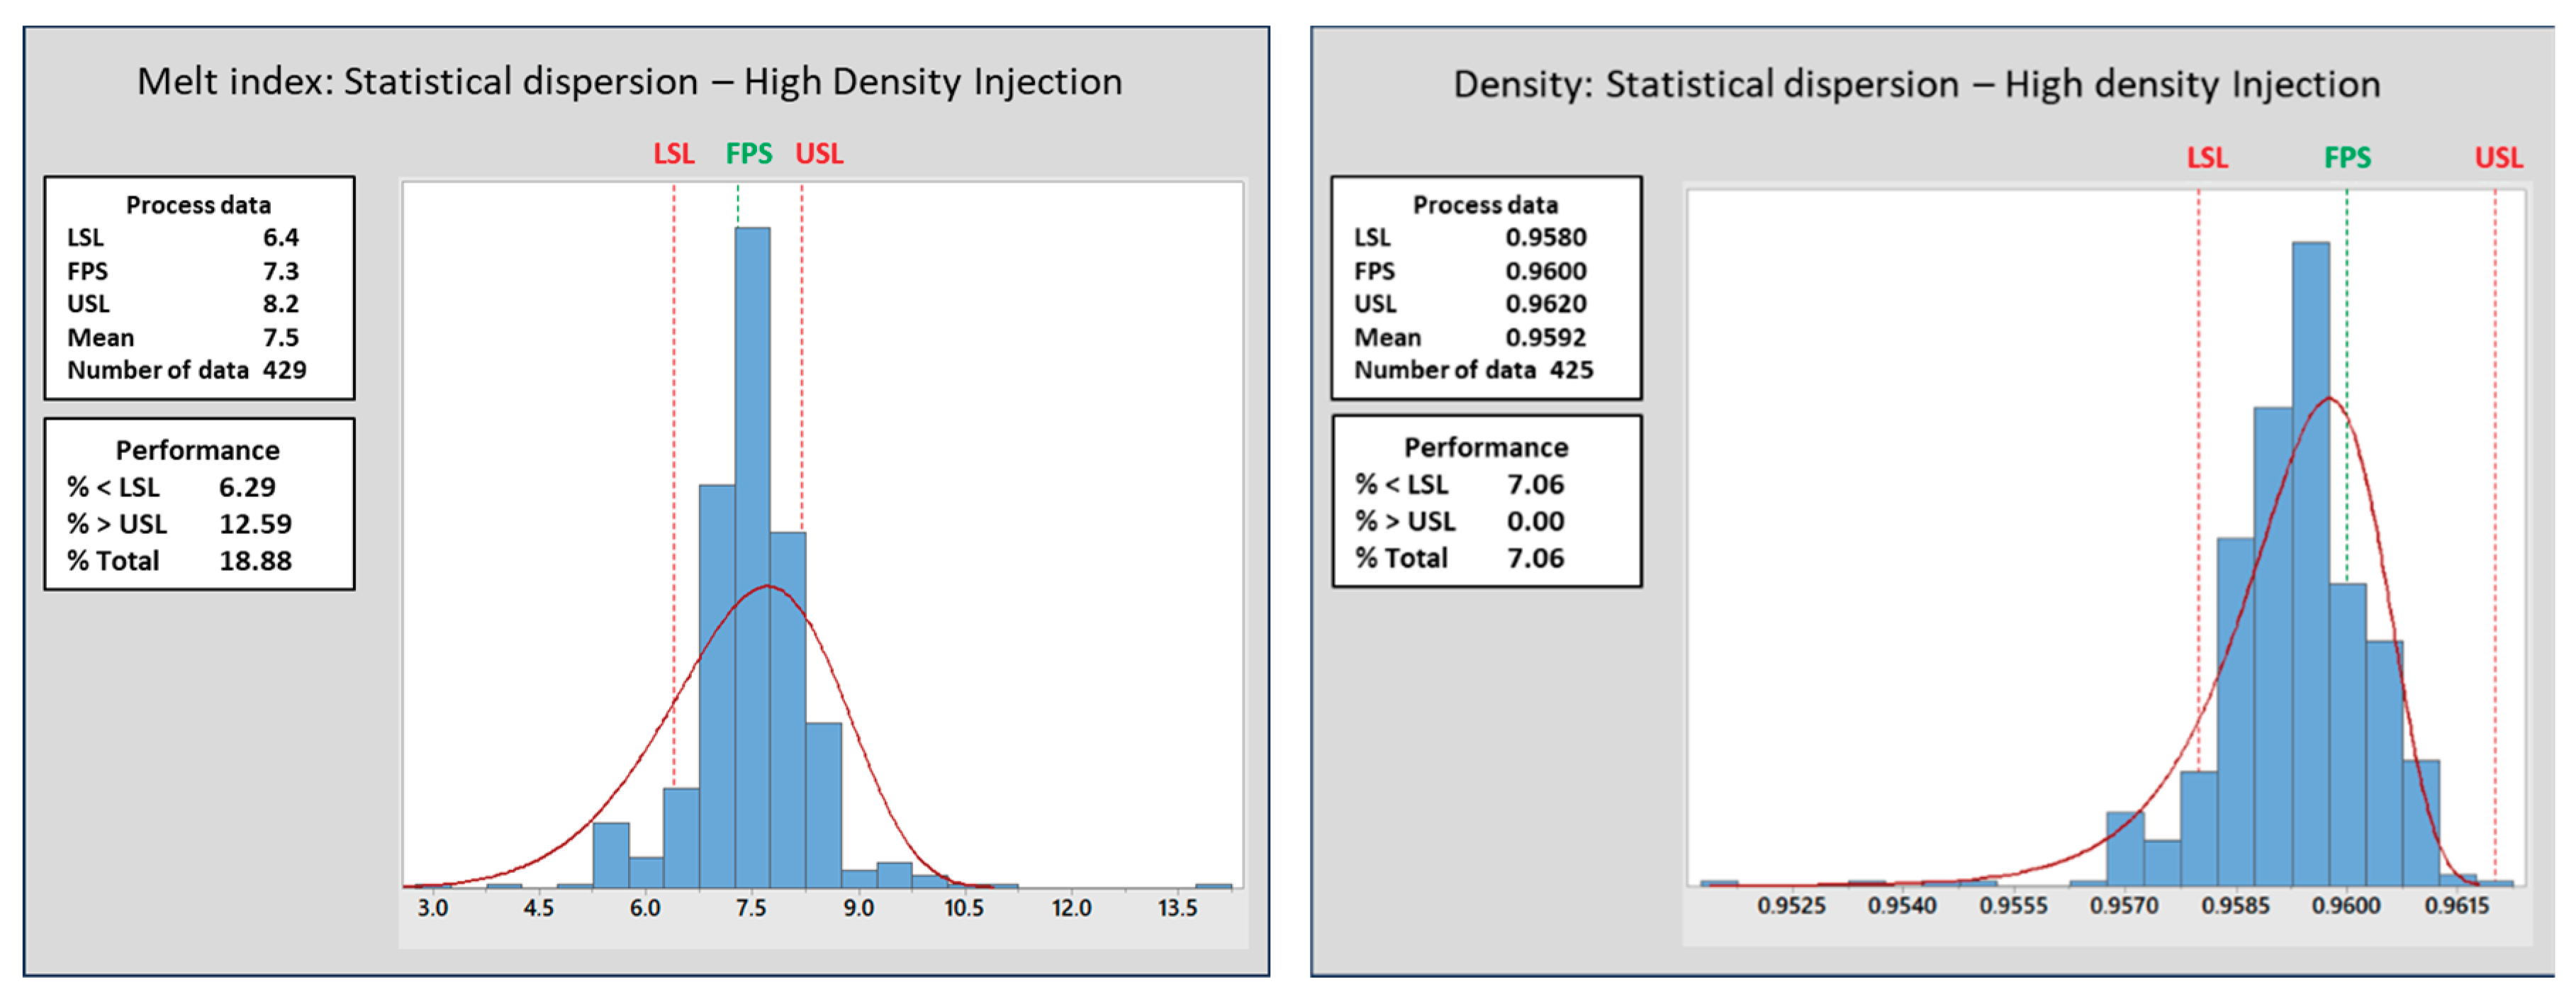
Figure 11.
Cash flow − economic feasibility analysis.
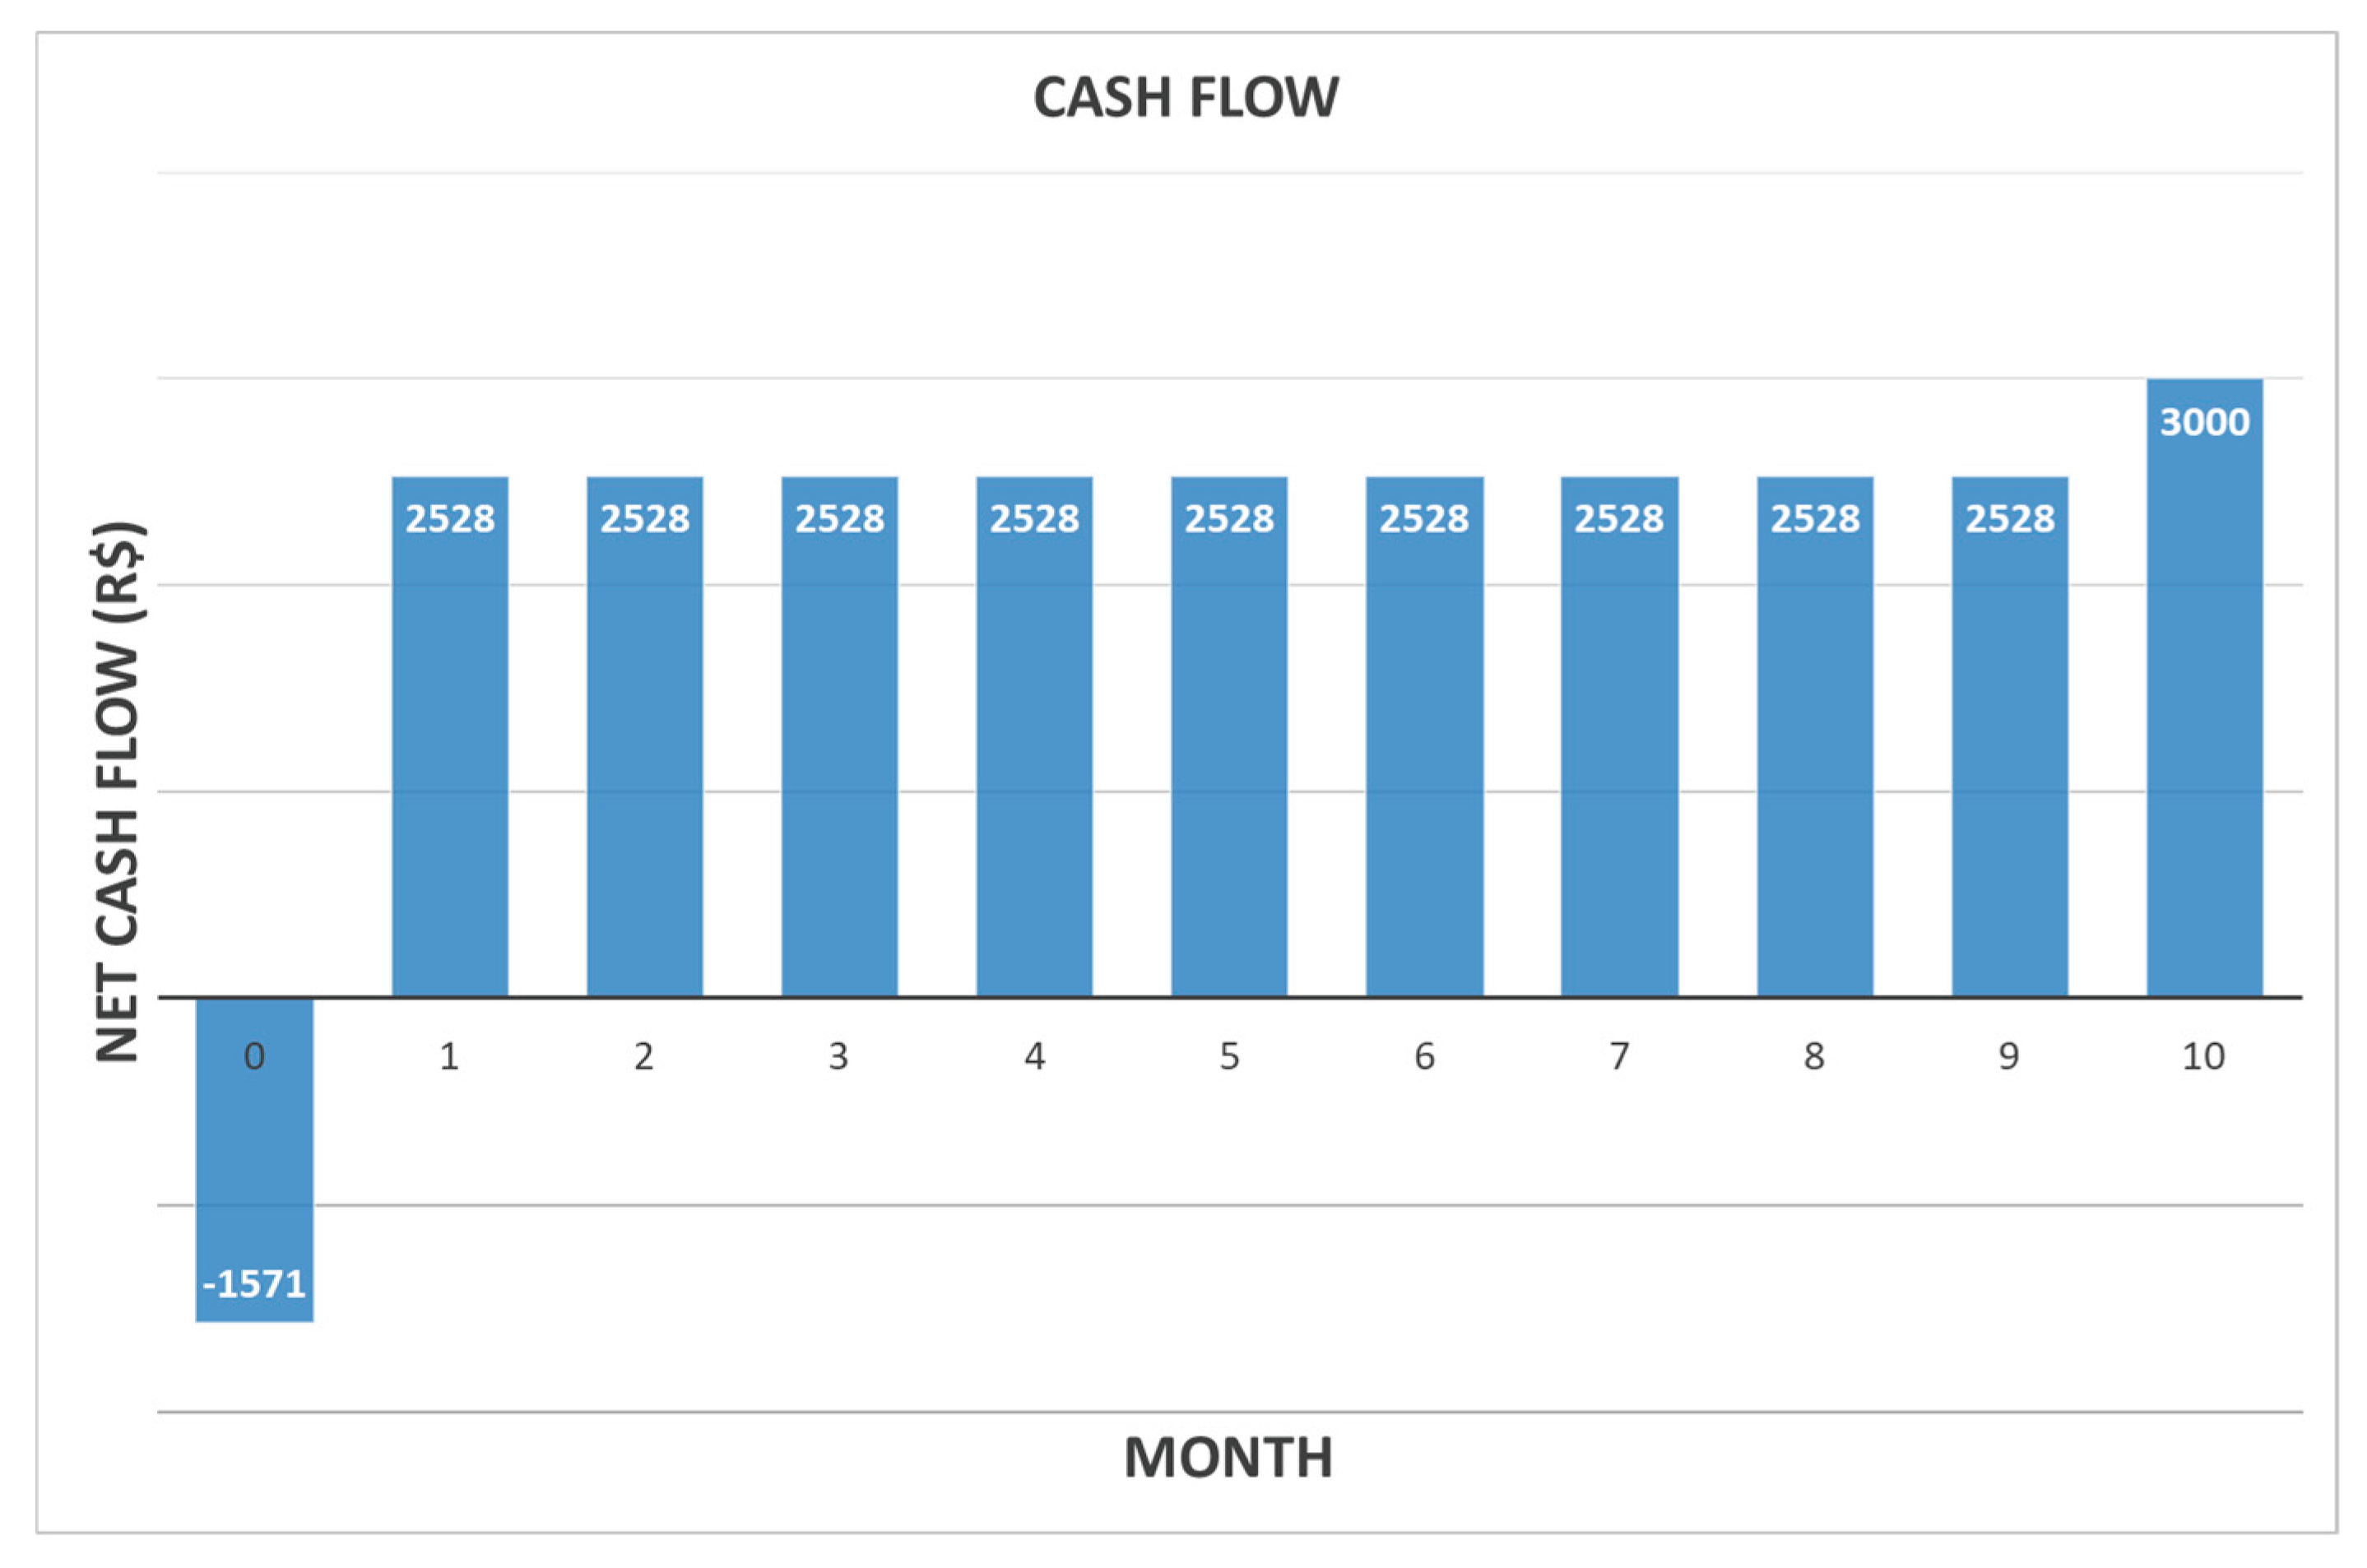
Table 1.
Manipulated variables and disturbances (butene copolymer and butene film).
| Input | MI | Density | Conversion | |||
|---|---|---|---|---|---|---|
| Manipulated variables | R1 | R2 | R1 | R2 | R1 | R2 |
| Hydrogen concentration | ||||||
| Butene/ ethylene mass ratio | ||||||
| HTC temperature | ||||||
| Ethylene concentration | ||||||
| Disturbances | R1 | R3 | R1 | R3 | R1 | R3 |
| Reactor inlet temperature | ||||||
| Reactor medium temperature | ||||||
R1 (butene copolymer); R2 (Butene film).
Disclaimer/Publisher’s Note: The statements, opinions and data contained in all publications are solely those of the individual author(s) and contributor(s) and not of MDPI and/or the editor(s). MDPI and/or the editor(s) disclaim responsibility for any injury to people or property resulting from any ideas, methods, instructions or products referred to in the content. |
© 2026 by the authors. Licensee MDPI, Basel, Switzerland. This article is an open access article distributed under the terms and conditions of the Creative Commons Attribution (CC BY) license (http://creativecommons.org/licenses/by/4.0/).
Copyright: This open access article is published under a Creative Commons CC BY 4.0 license, which permit the free download, distribution, and reuse, provided that the author and preprint are cited in any reuse.


