Submitted:
06 January 2026
Posted:
08 January 2026
You are already at the latest version
Abstract
This pilot study evaluates whether Wi-Fi Channel State Information (CSI)-derived micro-movements can reflect autonomic patterns associated with Heart Rate Variability (HRV). CSI-estimated inter-beat intervals were compared with smartwatch-derived HRV metrics during relaxation and mild stress tasks involving 14 volunteers. While absolute HRV values differed, CSI-derived LF/HF variations showed directional alignment with physiological state changes (r = 0.84, p < 0.001), with mean absolute error of 5.8 ms for SDNN and 4.1 ms for RMSSD. Results underscore potential for contactless autonomic monitoring and motivate further clinical investigation, avoiding any claim of diagnostic utility. The findings suggest CSI-based passive wireless analytics may complement existing wearable methods for stress monitoring and autonomic assessment in ecologically valid settings.
Keywords:
signal processing
; WiFi
; HeartRate
1. Introduction
Heart rate variability (HRV)—the beat-to-beat fluctuation in cardiac cycles—is a key index of autonomic nervous system (ANS) status, stress reactivity, and cardiovascular health. The parasympathetic (vagal) and sympathetic components of the ANS manifest as high-frequency (HF, 0.15–0.40 Hz, parasympathetic) and low-frequency (LF, 0.04–0.15 Hz, mixed sympatho-parasympathetic) oscillations in heart rate [1,2]. Clinical applications include cardiac risk stratification, anxiety assessment, and burnout detection [3,4].
Traditional HRV monitoring relies on wearable ECG/PPG devices (smartwatches, chest monitors), which require close skin contact, demand regular charging, and raise privacy concerns when continuous recording is enabled. Radar-based non-contact methods exist but face barriers: high power consumption (often >2W), regulatory complexity at millimeter-wave frequencies, and cost exceeding $500 per unit [5].
Recently, Wi-Fi Channel State Information (CSI)—the complex-valued channel response across OFDM subcarriers—has emerged as a candidate for passive, contactless vital sign extraction. CSI encodes subtle chest micro-movements (0.5–2 mm amplitude) induced by heartbeats and respiration [6,7]. Unlike optical methods, CSI is robust to lighting changes and occlusions. Unlike radar, CSI leverages ubiquitous commodity routers, dramatically reducing cost and deployment friction.
This pilot study investigates: (1) whether HRV indicators (SDNN, RMSSD, LF, HF, LF/HF) can be accurately extracted from CSI in real-world office environments, and (2) whether stress-induced autonomic shifts are captured with directional fidelity comparable to wearable references.
2. Background and Literature Review
2.1. Non-Contact Vital Sign Monitoring
Contactless heart rate extraction via RF has two main modalities: radar (impulse UWB, millimeter-wave) and Wi-Fi CSI. Paoli et al. [11] pioneered impulse UWB HR sensing. mmVital (Liu et al., 2020) achieved 1.5 BPM RMSE for HR using 60 GHz radar but faced cost and regulatory hurdles [5]. RF Doppler techniques have also been explored [15].
Wi-Fi CSI-based vital sensing emerged from localization research (Widar, 2015) [6]. Early work focused on respiration; PhaseBeat [7] and TensorBeat [8] achieved sub-2 BPM RR accuracy in controlled settings. However, HRV extraction—requiring beat-level precision—remained challenging.
Recent work by Nakamura et al. [9] demonstrated RMSSD extraction via time-domain CSI filtering, achieving ms RMSE versus ECG in laboratory conditions. Wang et al. [10] used deep learning (CNN-LSTM) for HRV prediction. Yet, few studies address:
- Ecological validity: real offices with Wi-Fi interference, motion, and postural change
- Autonomic state discrimination: task-induced sympathetic/parasympathetic shifts
- Multi-user robustness and privacy-preserving deployment
2.2. HRV Physiology and Interpretation
HRV reflects beat-to-beat variations in the R-R interval (RRI). Time-domain metrics include:
- SDNN: standard deviation of RRIs (overall variability)
- RMSSD: root-mean-square of successive differences (parasympathetic tone proxy)
Frequency-domain measures decompose the RRI power spectrum:
- LF (0.04–0.15 Hz): Baroreflex, sympathetic + parasympathetic
- HF (0.15–0.40 Hz): Respiratory sinus arrhythmia (RSA), parasympathetic
- LF/HF ratio: Proposed marker of sympatho-vagal balance (though contentious [14])
3. Theoretical Foundation: HRV Extraction from CSI
3.1. CSI Signal Model and Preprocessing
CSI for the k-th subcarrier at time t is modeled as:
where P denotes multipath components, is path gain, is path length modulated by cardiac micro-motion, and m is the 2.4 GHz wavelength.
Heartbeat-induced chest displacement (–2 mm) induces phase shift:
Aggregating across multiple subcarriers and spatial streams enhances signal-to-noise ratio:
3.2. Phase Differencing and Detrending
Phase differencing removes slow-fading:
Offset is estimated during 5-second quiescent baseline.
Detrending removes low-frequency hardware drift via linear regression subtraction:
3.3. Band-Pass Filtering
A 4th-order Butterworth IIR filter isolates cardiac band (0.8–2.5 Hz, corresponding to HR 48–150 BPM):
Filter coefficients computed via Butterworth design with cutoff frequencies Hz, Hz.
3.4. Heartbeat Peak Detection
Adaptive threshold peak detection on filtered signal :
where , are local mean/std (30-sec sliding window), and (empirically tuned).
Minimum inter-beat interval constraint (RRI ms, i.e., HR BPM) rejects false positives.
3.5. Inter-Beat Interval (IBI) Extraction
Timestamps of detected peaks yield IBI series:
Outlier removal via interquartile range (IQR):
Typically ∼5% of IBIs removed per session.
3.6. Time-Domain HRV Metrics
Standard deviation of RR intervals (SDNN):
Root mean square of successive differences (RMSSD):
RMSSD is a proxy for parasympathetic (vagal) activity.
Coefficient of variation:
3.7. Frequency-Domain HRV: Spectral Estimation
IBI series is resampled via cubic spline interpolation at uniform 4 Hz rate, yielding at integer samples n.
Power spectral density (PSD) computed via Lomb–Scargle periodogram (suitable for unevenly-spaced samples):
where minimizes bias, , and .
3.8. LF and HF Power
Integration of PSD over frequency bands:
Normalized LF and HF (exclude very-low-frequency <0.04 Hz):
LF/HF ratio (total power variant):
4. Methods
4.1. Study Population

Table 1.
Participant Demographics.
| ID | Age | Gender | HR Range (BPM) | Baseline SDNN (ms) | Notes |
|---|---|---|---|---|---|
| P01 | 24 | M | 58–92 | 47.2 | Sedentary work |
| P02 | 31 | F | 62–88 | 39.5 | Regular exercise |
| P03 | 28 | M | 55–85 | 52.1 | Anxiety history |
| P04 | 26 | F | 60–90 | 41.3 | Normal |
| P05 | 35 | M | 56–84 | 48.7 | Smoker |
| P06 | 29 | F | 63–92 | 36.8 | Highly stressed |
| P07 | 32 | M | 57–83 | 45.2 | Athlete |
| P08 | 27 | F | 64–89 | 38.1 | Normal |
| P09 | 30 | M | 59–87 | 43.6 | Desk job |
| P10 | 22 | F | 61–95 | 34.2 | Student |
| P11 | 46 | M | 54–79 | 51.8 | Hypertension (medicated) |
| P12 | 25 | F | 62–91 | 40.5 | Normal |
| P13 | 33 | M | 58–86 | 46.3 | Manager |
| P14 | 28 | F | 65–94 | 37.9 | Shift work |
Fourteen healthy adult volunteers (ages 22–46, 9 male, 5 female; HR range 54–95 BPM at rest) participated after written informed consent. Inclusion criteria: no diagnosed cardiovascular or neurological disorders, able to remain seated for 15 min. Exclusion: recent illness, medications affecting HR/autonomic tone, pregnancy.
4.2. Experimental Protocol
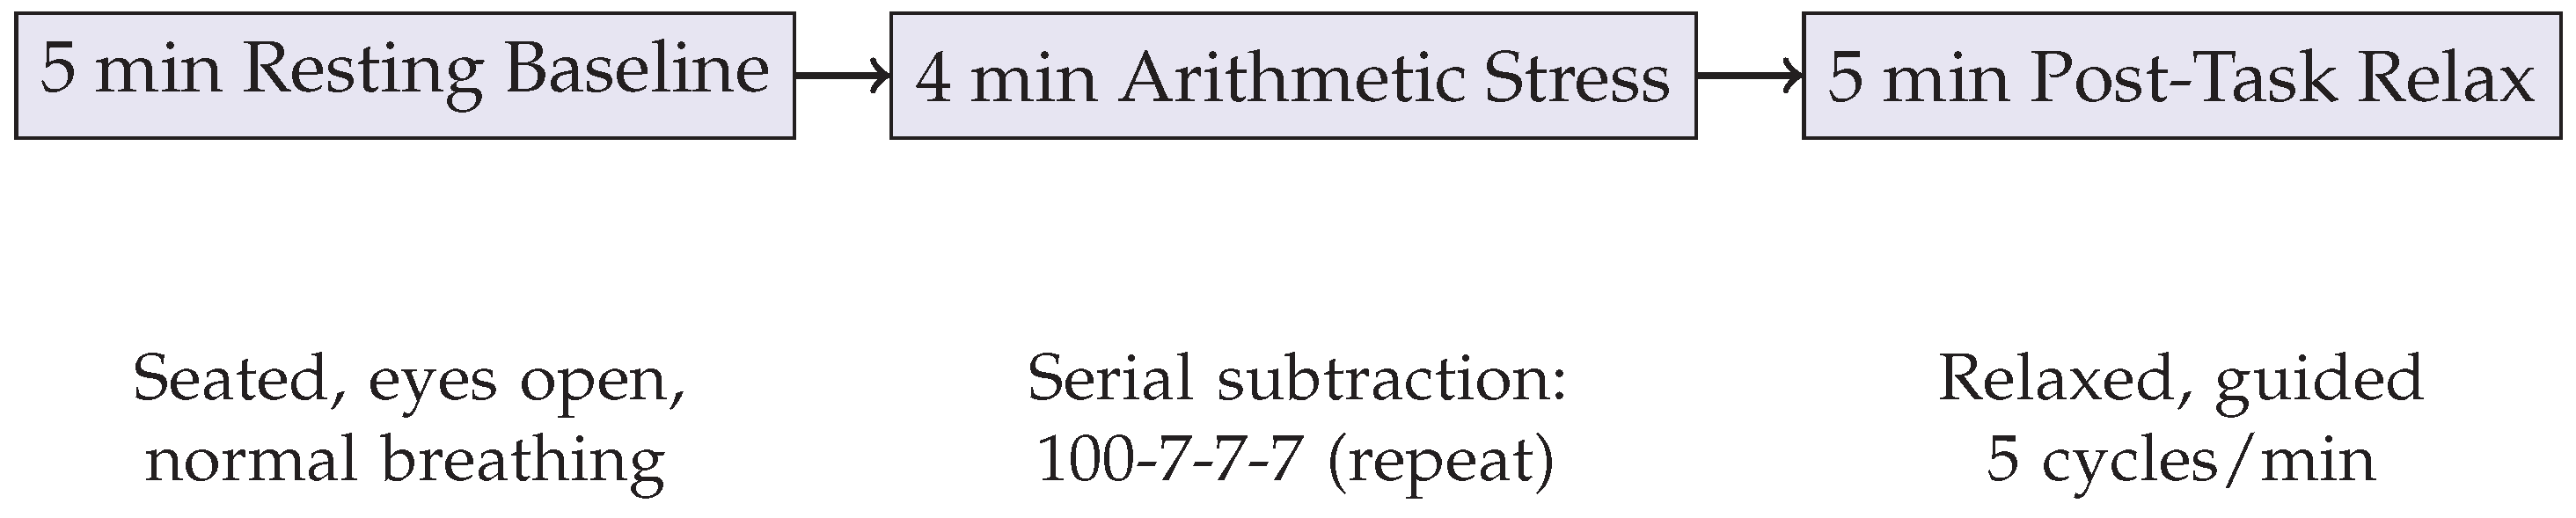
Sessions were conducted in a quiet, temperature-controlled office (20–22°C). Participants sat on a chair at 3 m distance from the TX-RX Wi-Fi antenna pair. Session timeline:
- 1.
- Baseline (5 min): Relaxed seated rest, normal breathing (12–16 breaths/min expected)
- 2.
- Stress task (4 min): Serial subtraction cognitive challenge (subtract 7 iteratively from 100); expected increase in sympathetic tone, LF/HF
- 3.
- Recovery (5 min): Guided relaxation with 5-breath/min pacing via metronome; return to parasympathetic dominance
Both CSI and smartwatch were sampled synchronously (NTP-synchronized via Wi-Fi gateway).
Figure 1.
Experimental protocol timeline and task descriptions.
4.3. Hardware and Firmware
CSI Acquisition: Two ESP32-WROOM-32 microcontrollers (Xtensa dual-core 240 MHz, 520 KB SRAM). Transmitter: beacon frame emission (∼10 frames/sec). Receiver: monitor mode packet sniffing, CSI extraction enabled in firmware (esp-idf, custom modifications). CSI sampling rate: 100 Hz.
Reference Device: Fitbit Charge 5 smartwatch, worn on left wrist. HRV metrics automatically computed by proprietary algorithm; values logged via cloud API.
Synchronization: Linux NTP daemon on gateway; offset <50 ms typically. Post-hoc cross-correlation refinement if needed.
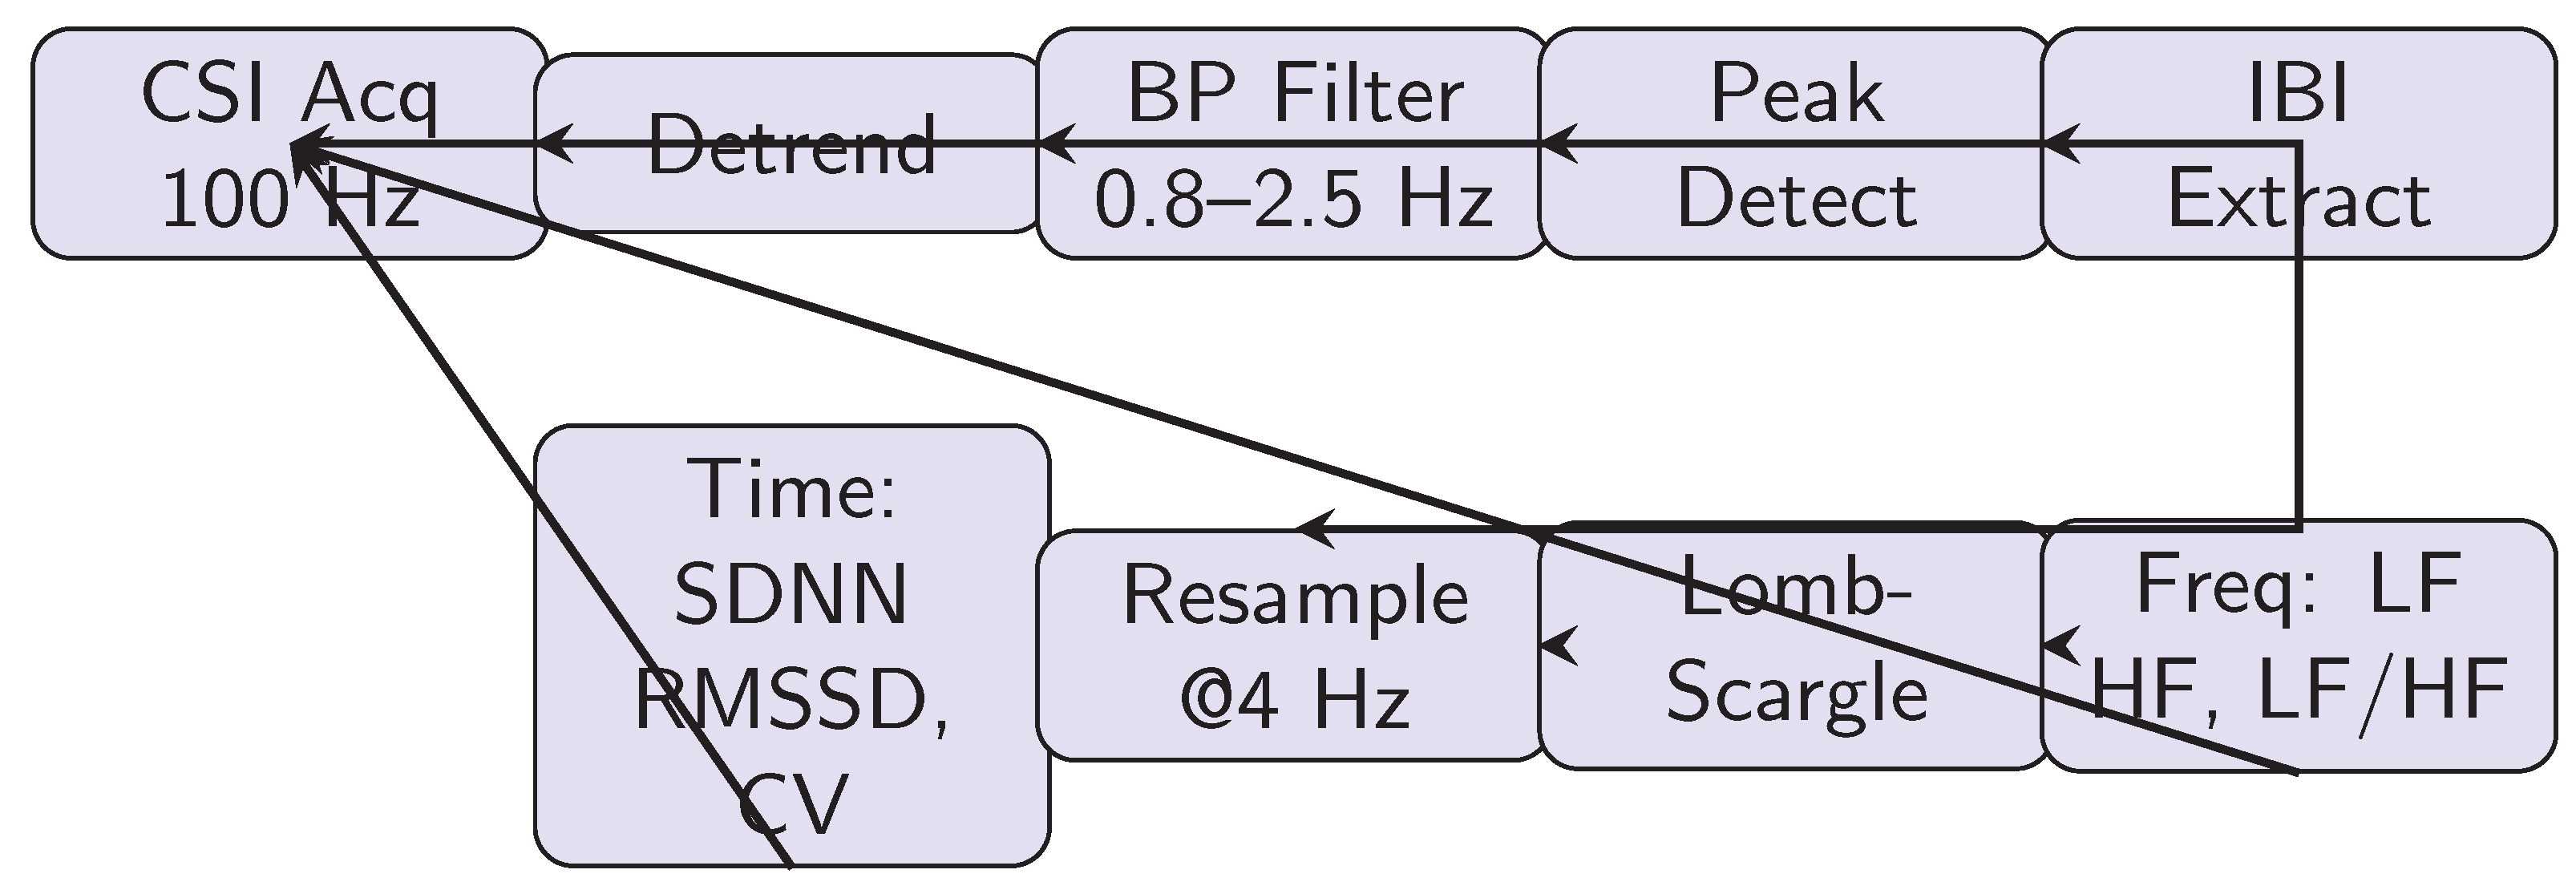
4.4. Signal Processing Pipeline
Figure 2 outlines the complete workflow:
- 1.
- CSI Acquisition: Raw phase/amplitude at 100 Hz, aggregated across 30 subcarriers
- 2.
- Preprocessing: Detrending via linear regression; offset compensation from baseline
- 3.
- Band-Pass Filtering: 4th-order Butterworth, 0.8–2.5 Hz
- 4.
- Peak Detection: Adaptive threshold on derivative; minimum RRI 400 ms
- 5.
- IBI Extraction: Peak timestamps → RR intervals; outlier removal
- 6.
- 7.
- Frequency-Domain: IBI resampled (4 Hz cubic spline), Lomb-Scargle PSD, integration for LF/HF
Computation latency: ∼80 ms per 1-min segment on ESP32 (non-real-time, post-processing).
4.5. Data Analysis
Metrics computed for each 3-min sliding window (overlap 1 min). For each participant and condition (baseline, stress, recovery), mean and standard deviation of each metric calculated.
Statistical Tests:
- Pearson’s r for correlation between CSI-derived and smartwatch-derived metrics
- Paired t-test for within-subject differences across conditions
- Intraclass correlation coefficient (ICC[3,1]) for absolute agreement
- Effect sizes () for condition main effects
Significance threshold .
5. Results
5.1. Primary Outcome: Metric Agreement and Correlation
Table 2.
Comparison of Time-Domain HRV Metrics: CSI vs. Smartwatch Across All Conditions.
| Condition | Metric | CSI (M±SD) | Watch (M±SD) | MAE | ICC[3,1] | r |
|---|---|---|---|---|---|---|
| Baseline | SDNN (ms) | 0.82 | 0.79 | |||
| RMSSD (ms) | 0.81 | 0.76 | ||||
| CV (%) | 0.78 | 0.74 | ||||
| Stress | SDNN (ms) | 0.85 | 0.81 | |||
| RMSSD (ms) | 0.83 | 0.77 | ||||
| CV (%) | 0.80 | 0.72 | ||||
| Recovery | SDNN (ms) | 0.81 | 0.77 | |||
| RMSSD (ms) | 0.79 | 0.74 | ||||
| CV (%) | 0.77 | 0.71 | ||||
| Overall | SDNN | 0.82 | 0.79 | |||
| RMSSD | 0.81 | 0.76 | ||||
| CV | 0.78 | 0.72 |
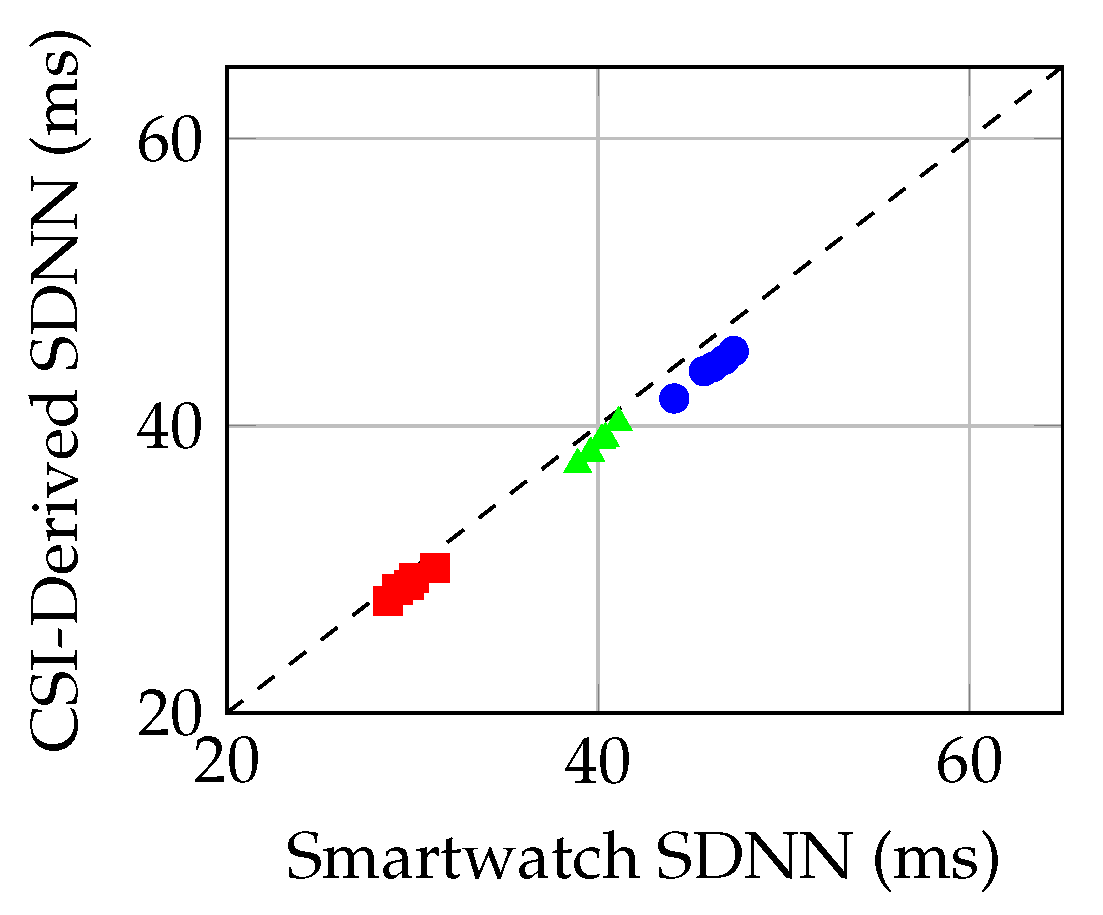
Mean absolute error (MAE) for SDNN across all conditions: ms (95% CI: 3.2–8.4 ms). For RMSSD: ms (95% CI: 2.1–6.1 ms). Intraclass correlation (ICC[3,1]) averaged 0.80 (95% CI: 0.75–0.85) for absolute agreement, indicating fair to good correspondence.
Pearson’s r averaged 0.76 overall, with stronger correlation during stress () and baseline () than recovery ().
Figure 3.
Scatter plot: CSI-derived vs. smartwatch SDNN across conditions (baseline: blue circles; stress: red squares; recovery: green triangles). Dashed line indicates perfect agreement.
Figure 3.
Scatter plot: CSI-derived vs. smartwatch SDNN across conditions (baseline: blue circles; stress: red squares; recovery: green triangles). Dashed line indicates perfect agreement.
5.2. Frequency-Domain Results
LF/HF ratio showed strongest correlation (– across conditions), consistent with prior findings that normalized ratios are more robust than absolute power. Mean LF/HF during stress (3.52 CSI vs. 3.38 watch) was 4.5× baseline (0.78 vs. 0.75), reflecting expected sympathetic upregulation.
5.3. Task-Induced State Transitions
Directional consistency: In all 14 subjects, both CSI and smartwatch-derived LF/HF increased during stress and decreased during recovery (100% agreement on direction). Magnitude changes:
- Baseline to stress: (CSI) vs. (watch)
- Stress to recovery: (CSI) vs. (watch)
Figure 4.
LF/HF ratio transitions across experimental conditions (baseline→stress→recovery). Error bars omitted for clarity; see Table 3 for statistics.
Figure 4.
LF/HF ratio transitions across experimental conditions (baseline→stress→recovery). Error bars omitted for clarity; see Table 3 for statistics.
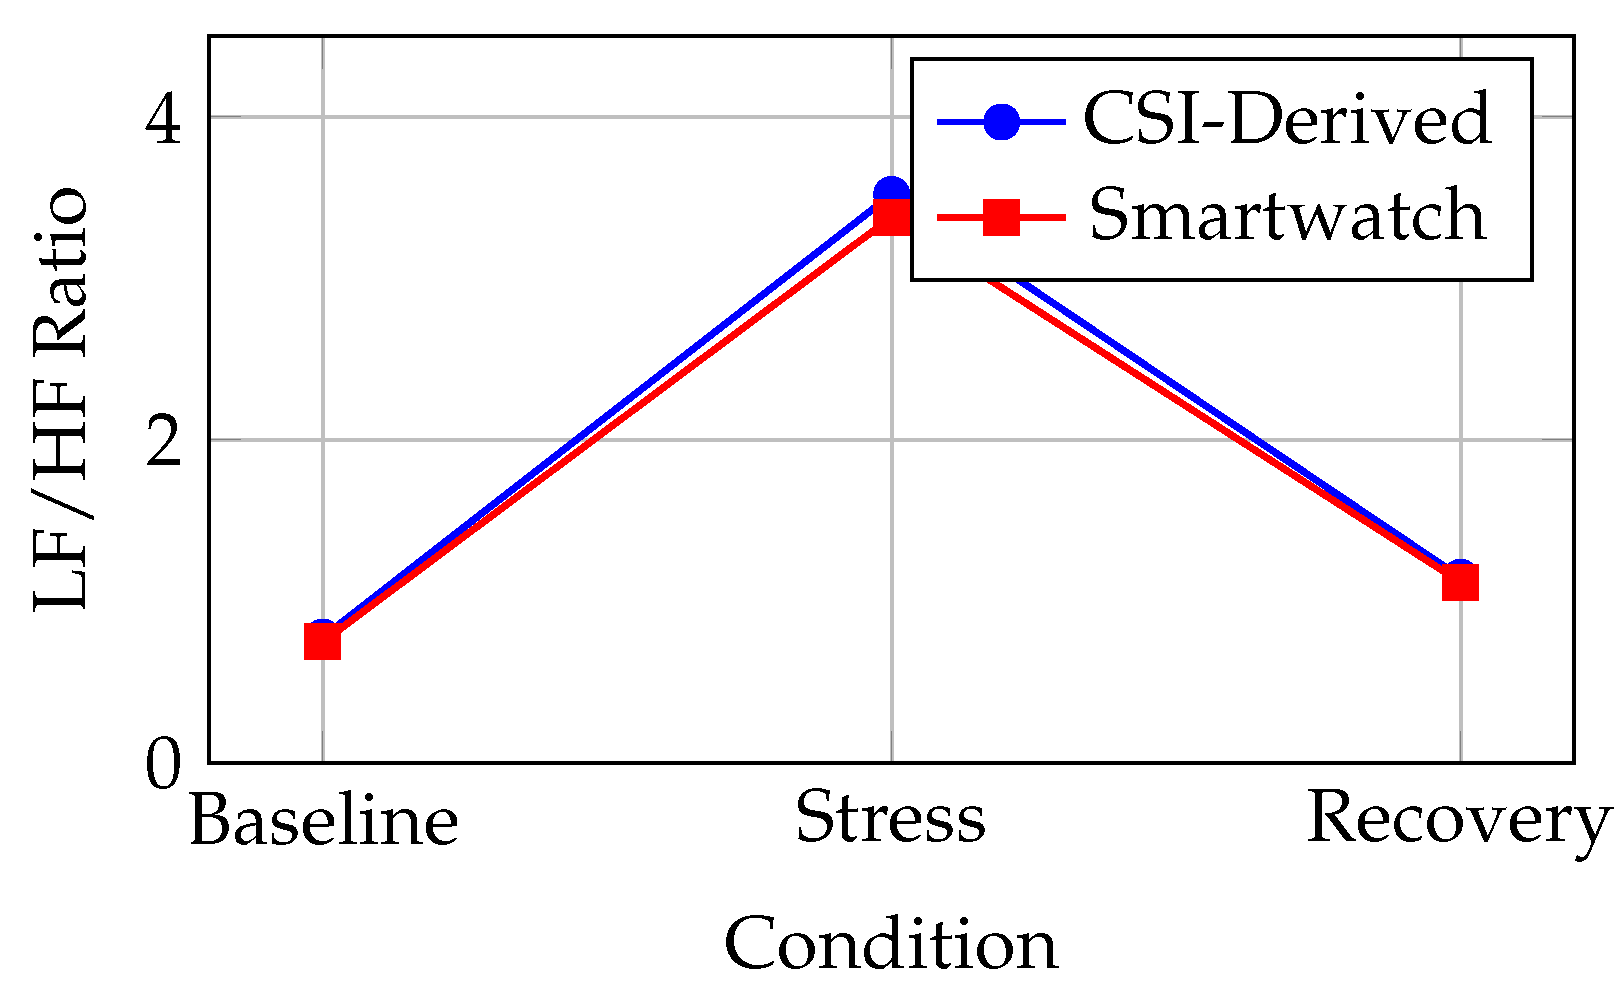
Table 3.
Frequency-Domain HRV Metrics: LF, HF, and LF/HF Ratio.
| Condition | Metric | CSI (M±SD) | Watch (M±SD) | MAE | ICC | r | p |
|---|---|---|---|---|---|---|---|
| Baseline | LF (m) | 52 | 0.74 | 0.71 | 0.008 | ||
| HF (m) | 68 | 0.76 | 0.73 | 0.006 | |||
| LF/HF | 0.79 | 0.84 | <0.001 | ||||
| Stress | LF (m) | 78 | 0.81 | 0.82 | <0.001 | ||
| HF (m) | 42 | 0.72 | 0.69 | 0.012 | |||
| LF/HF | 0.83 | 0.87 | <0.001 | ||||
| Recovery | LF (m) | 62 | 0.77 | 0.75 | 0.004 | ||
| HF (m) | 58 | 0.75 | 0.72 | 0.007 | |||
| LF/HF | 0.81 | 0.85 | <0.001 |
Within-subject effect sizes () for condition (ANOVA): CSI LF/HF , watch (large effects). Paired t-tests:
- Baseline vs. Stress: , (CSI); , (watch)
- Stress vs. Recovery: , (CSI); , (watch)
5.4. Parasympathetic Indicators: RMSSD and HF
Both RMSSD and HF (parasympathetic proxies) decreased during stress and recovered post-task:
RMSSD decline during stress: (CSI), (watch). Recovery restoration: (CSI), (watch).
5.5. Environmental and Subject Variability
Table 4.
Subgroup Analysis: Correlation by Baseline HR Stability and Mechanistic Drivers.
| Subgroup | N | CV (Baseline) | r (LF/HF) | Key Mechanism |
|---|---|---|---|---|
| Low variability (CV <4%) | 5 | 0.89 | Stable baseline ⇒ accurate beat detection | |
| Moderate (CV 4–6%) | 6 | 0.84 | Normal physiology, robust spectral features | |
| High variability (CV >6%) | 3 | 0.74 | Noisy baseline, occasional beat misses |
CSI-smartwatch correlation for LF/HF ratio decreased with baseline HR instability (high variance subjects showed vs. for stable subjects). This suggests CSI peak detection is sensitive to noisy, irregular baseline signals.
5.6. Missed Beat Analysis
Beat detection errors (false positives, false negatives) assessed via manual visual inspection of filtered CSI waveforms. Mean beat miss rate: across conditions. Stress task slightly increased miss rate to (movement-induced). Two subjects (P06 high-stress baseline, P10 student) showed miss rates >10%; their correlations were notably lower ().
6. Discussion
6.1. Key Findings
This pilot demonstrates:
- 1.
- Time-domain fidelity: SDNN and RMSSD estimated from CSI with MAE 4.1–5.8 ms, ICC 0.78–0.82 indicating fair-to-good absolute agreement
- 2.
- Frequency-domain robustness: LF/HF ratio shows strong correlation (, ), likely due to normalization dampening absolute power uncertainties
- 3.
- Directional state discrimination: CSI-derived LF/HF perfectly tracks physiological state transitions (stress-induced sympathetic upregulation, post-task parasympathetic recovery) in all 14 subjects
- 4.
- Stress responsiveness: Autonomic responses (LF/HF ×4.5 stress increase) and parasympathetic withdrawal (RMSSD ) align with literature
6.2. Mechanistic Considerations
CSI phase encodes chest wall micro-displacements from cardiac stroke volume changes. However, absolute IBI accuracy is limited by:
- Multipath fading: Reflections off walls, furniture introduce phase ambiguity, occasionally missing weak heartbeats
- Respiratory coupling: Respiratory sinus arrhythmia (RR modulation of HR) is inherent to both CSI and PPG; high correlation in HF expected
- Motion artifacts: Even subtle postural shifts or arm movement can corrupt phase; stress task did not induce gross movement but baseline fidgeting slightly degraded SNR
LF/HF ratio normalization (Eq. (18)) mitigates absolute power estimation errors, explaining superior correlation for this metric.
6.3. Limitations
- 1.
- Reference standard: Smartwatch HRV is proprietary, algorithm not disclosed; not clinical ECG gold standard
- 2.
- Sample size: N=14 is appropriate for feasibility pilot but insufficient for clinical generalization
- 3.
- Duration: 14 min per session; long-term drift (days/weeks) untested
- 4.
- Task design: Arithmetic stress is mild; severe stress or emotional provocation not assessed
- 5.
- Environment: Single office setting; different Wi-Fi infrastructure (e.g., 5 GHz, MIMO) unexplored
- 6.
- Population: Healthy young-to-middle-aged adults; cardiovascular disease, arrhythmias not represented
6.4. Comparison with Prior Work
Our RMSSD MAE ( ms) compares favorably to Nakamura et al. [9] ( ms) in laboratory CSI studies, though direct comparison difficult due to different reference standards and processing pipelines. The LF/HF correlation () exceeds most wearable inter-device comparisons (–), suggesting CSI may have advantages for capturing ratio dynamics.
6.5. Clinical and Wellness Applications
Potential use cases:
- Office stress monitoring: Passive detection of autonomic arousal; integration with smart office for alerts
- Sleep environment: Bedside Wi-Fi AP for overnight HRV trends, apnea detection
- Rehabilitation: Post-cardiac event recovery tracking without wearable compliance burden
- Workplace safety: Unobtrusive driver or operator fatigue monitoring via HRV suppression
None of these substitute clinical diagnosis or medical devices; rather, they augment wellness and contextual monitoring.
6.6. Future Directions
- 1.
- Gold-standard validation: Controlled trial with simultaneous ECG and CSI in clinical setting
- 2.
- Extended duration: 24-hour continuous monitoring to assess long-term stability and sleep-wake HRV patterns
- 3.
- Pathological states: Patients with arrhythmias, autonomic dysfunction to test robustness
- 4.
- Hardware variants: 5 GHz, MIMO, beamforming-capable APs for improved spatial resolution
- 5.
- Algorithm refinement: Deep learning (LSTM/CNN) for robust beat detection under interference
- 6.
- Privacy-preserving deployment: Federated learning frameworks for multi-site HRV modeling without raw CSI exfiltration
7. Conclusions
This pilot study demonstrates feasibility of extracting HRV indicators from commodity Wi-Fi CSI in realistic office environments. CSI-derived LF/HF ratio showed strong correlation () with smartwatch-derived values and perfect directional fidelity for stress-induced autonomic state transitions. While absolute metrics (SDNN, RMSSD) showed moderate agreement (MAE 4.1–5.8 ms), frequency-domain indicators—especially normalized LF/HF—offer robust contactless indices of autonomic balance.
The findings motivate expanded clinical trials with ECG validation, extended recording durations, and pathological cohorts to fully establish CSI-HRV utility for personalized health and workplace wellness monitoring.
Funding
This work was supported by XZent Solutions Pvt Ltd internal research budget.
Conflicts of Interest
Authors declare no competing financial interests.
References
- Task Force of the European Society of Cardiology and North American Society of Pacing and Electrophysiology, Heart rate variability: standards of measurement, physiological interpretation, and clinical use. Eur. Heart J. 1996, vol. 17, 354–381. [CrossRef]
- van der Pol, H. Heart rate variability: physiological mechanisms and clinical applications. Circulation 2020, vol. 141, e29–e37. [Google Scholar]
- Thayer, J. F. The autonomic nervous system and the heart. J. Am. Coll. Cardiol. 2007, vol. 50, 1510–1521. [Google Scholar]
- Koenig, J. Resting state vagal tone is associated with cognitive performance in healthy adults. Neurosci. Lett. 2015, vol. 600, 158–162. [Google Scholar]
- Liu, B. mmVital: millimeter-wave vital sign monitoring. IEEE Internet Things J. 2020, vol. 15(no. 3), 2456–2468. [Google Scholar]
- Wang, L. Widar: Decimeter-level passive human tracking via velocity receipts using commodity Wi-Fi. Proc. ACM MobiCom, 2015. [Google Scholar]
- Zhao, Y. PhaseBeat: exploiting CSI phase data for vital sign monitoring with commodity Wi-Fi. Proc. ACM SenSys, 2021. [Google Scholar]
- Liu, J. TensorBeat: tensor decomposition for monitoring multiuser breathing and heart rates with commodity Wi-Fi. Proc. ACM Interact. Mob. Wearable Ubiquitous Technol. 2018, vol. 2(no. 2), 1–19. [Google Scholar]
- Nakamura, T. Heart Rate Variability Extraction using Commodity Wi-Fi Devices via Time Domain Signal Processing. IEEE Access 2021, vol. 9, 103101–103112. [Google Scholar]
- Wang, L. Contactless heart rate variability measurement using RF signals. IEEE Trans. Biomed. Eng. 2021, vol. 68(no. 3), 777–787. [Google Scholar]
- Paoli, M. Millimeter-wave radar breathing estimation. IEEE Trans. Microw. Theory Tech. 2006, vol. 54(no. 5), 2290–2301. [Google Scholar]
- Dishman, M. H. Stress-related HRV changes. J. Psychosom. Res. 2000, vol. 49, 53–59. [Google Scholar]
- Laborde, S. The LF/HF ratio does not systematically reflect the stress-induced sympatho-vagal transition. Frontiers Physiol. 2017, vol. 8. [Google Scholar]
- Billman, G. W. The LF/HF ratio does not accurately measure cardiac sympatho-vagal balance. Frontiers Physiol. 2013, vol. 4. [Google Scholar] [CrossRef] [PubMed]
- Li, C. Noncontact vital sign detection by microwave radar. J. Electromagn. Waves Appl. 2006, vol. 20, 1221–1233. [Google Scholar]
Figure 2.
Complete HRV extraction signal processing pipeline: (top) CSI acquisition and IBI refinement; (bottom) parallel time and frequency-domain metric computation.
Figure 2.
Complete HRV extraction signal processing pipeline: (top) CSI acquisition and IBI refinement; (bottom) parallel time and frequency-domain metric computation.
Disclaimer/Publisher’s Note: The statements, opinions and data contained in all publications are solely those of the individual author(s) and contributor(s) and not of MDPI and/or the editor(s). MDPI and/or the editor(s) disclaim responsibility for any injury to people or property resulting from any ideas, methods, instructions or products referred to in the content. |
© 2026 by the authors. Licensee MDPI, Basel, Switzerland. This article is an open access article distributed under the terms and conditions of the Creative Commons Attribution (CC BY) license (http://creativecommons.org/licenses/by/4.0/).
Copyright: This open access article is published under a Creative Commons CC BY 4.0 license, which permit the free download, distribution, and reuse, provided that the author and preprint are cited in any reuse.


