Submitted:
06 January 2026
Posted:
07 January 2026
You are already at the latest version
Abstract
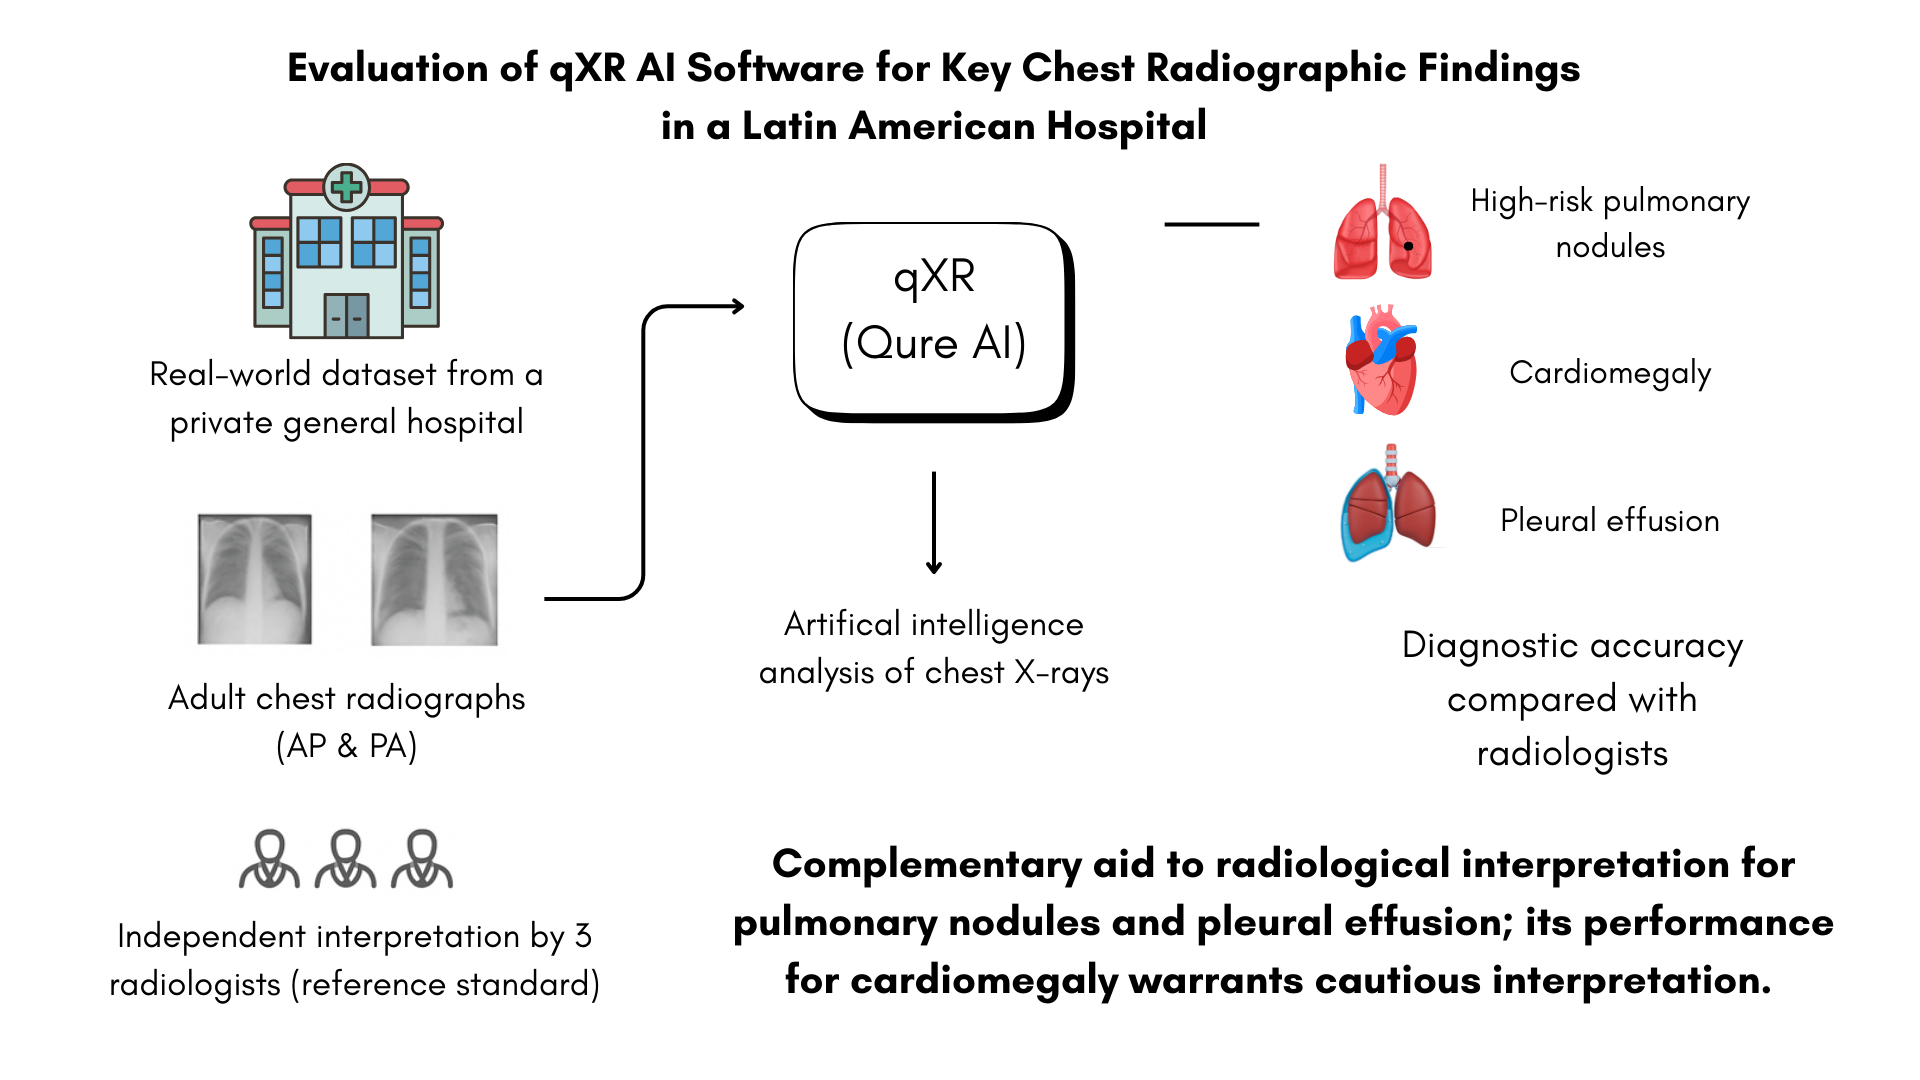
Background/Objectives: Artificial intelligence (AI) tools for chest X-ray interpretation have gained relevance as support systems in diagnostic workflows, particularly in settings with high demand or limited specialist availability. This study evaluated the diagnostic performance of the qXR software (Qure.ai) for detecting high-risk pulmonary nodules, cardiomegaly, and pleural effusion in adult patients at Hospital Clínica Bíblica in San José, Costa Rica. Methods: Three radiologists independently interpreted 225 chest radiographs, serving as the reference standard. qXR results were compared against this standard for each finding. Sensitivity, specificity, Cohen’s kappa, and area under the curve (AUC) were calculated. Predictive values were not used for interpretation due to the artificial prevalence of the sample. Results: qXR showed higher agreement with radiologist assessments for pulmonary nodules and pleural effusion, achieving moderate to substantial concordance. Performance for cardiomegaly was more variable, with lower agreement across evaluators. Overall diagnostic accuracy was acceptable, although the magnitude differed by condition. Conclusions: These findings underscore the importance of validating AI diagnostic tools within local clinical environments and heterogeneous imaging conditions. qXR demonstrated potential as a complementary aid for detecting pulmonary nodules and pleural effusion, while its performance for cardiomegaly should be interpreted with caution. The study does not provide evidence of real-world clinical impact.
Keywords:
thoracic radiography
; artificial intelligence
; diagnostic imaging
; pulmonary nodule
; cardiomegaly
; pleural effusion
1. Introduction
AI–based decision-support systems have demonstrated increasing potential to enhance diagnostic accuracy, workflow efficiency, and inter-reader consistency in medical imaging, particularly in radiology-intensive environment [1]. In chest radiography, deep learning algorithms have been shown to assist in the detection of clinically relevant findings such as pulmonary nodules, pleural effusions, and cardiomegaly, features that are often subtle and subject to inter-observer variability, especially in high-volume clinical settings [1,2]. These systems are primarily designed to augment, rather than replace, radiologist interpretation by prioritizing suspicious findings and providing standardized, reproducible assessments [3].
Chest X-ray imaging remains a cornerstone of diagnostic evaluation worldwide due to its accessibility, low cost, minimal radiation exposure, and utility as a first-line modality for a broad spectrum of cardiopulmonary conditions [4,5]. However, its diagnostic performance is highly dependent on reader expertise and workload, which may be unevenly distributed across healthcare systems. AI-based tools offer a scalable approach to support image interpretation, particularly in settings where subspecialty radiology expertise or advanced imaging modalities are limited [6].
Despite the rapid development and regulatory approval of several AI tools for chest radiograph interpretation, most validation studies have been conducted using datasets derived from high-income countries. These datasets may not adequately represent the demographic characteristics, imaging protocols, or equipment variability encountered in routine clinical practice in Latin American healthcare systems. Consequently, the external validity and generalizability of AI performance across different geographic, epidemiological, and operational contexts remain uncertain [7].
In Latin America, evidence evaluating the real-world performance of AI-assisted chest radiography is limited, and in Costa Rica, no published studies have assessed the application of AI algorithms for chest X-ray interpretation using locally generated data. The absence of national evidence derived from domestic imaging archives and interpreted by practicing local radiologists represents a critical gap, particularly given the increasing interest in integrating AI solutions into public and private healthcare systems.
The present study seeks to address this gap by evaluating the performance of the qXR software within the Costa Rican clinical context, using chest radiographs interpreted independently by local radiologists as the reference standard. By generating locally relevant performance data, this study contributes to the biomedical informatics literature by examining the contextual validity of AI-based diagnostic tools and informing evidence-based decisions regarding their potential implementation. Ultimately, establishing region-specific evidence is essential to ensure that AI integration in radiology supports safe, equitable, and clinically meaningful adoption within national health systems.
2. Materials and Methods
The initial study population included all posteroanterior (PA) and anteroposterior (AP) chest radiographs performed in the Radiology and Medical Imaging service at the main campus and the Santa Ana campus of Hospital Clínica Bíblica between August 15, 2024, and February 28, 2025, for a total of 5017 radiographs.
Sample size calculation was performed using the formula for the difference between two proportions:
n: Sample size
= 1.96
= 0.84
= Sensitivity of radiologist detection
= Sensitivity of Qure.ai detection
Given that the objective of the study was to compare the proportion of correct detections by the qXR artificial intelligence software with the proportion of radiological findings reported by a radiologist considered the Gold Standard [8]. For this purpose, we used the differences in sensitivity reported in the literature for the three radiological signs analyzed [9,10]. We selected the sensitivity corresponding to the detection of pleural effusion (radiologist: 0.76; qXR: 0.89), as this option generated the largest sample size, totaling 225 radiographs.
A two-sided significance level of 0.05 and statistical power of 80% were selected in accordance with standard diagnostic accuracy study conventions. Sensitivity was chosen as the primary parameter for sample size estimation given the clinical relevance of minimizing missed diagnoses in chest radiography. Pleural effusion was selected as the reference condition because it demonstrated the largest reported sensitivity difference between AI and radiologist interpretation, resulting in the most conservative sample size estimate. Subsequently, we distributed the sample by convenience, in a non-proportional manner among the three radiological signs and the radiographs without findings, with the following assignment: 67 cases with pleural effusion, 67 with cardiomegaly, 24 with at least one pulmonary nodule, and 67 without pathological signs. This distribution sought to maintain a balanced representation of findings; however, since only 24 radiographs with at least one pulmonary nodule were identified in the total population, we gave priority to including cases of cardiomegaly, pleural effusion, and radiographs without signs. It is important to note that we applied this division solely for selection purposes, as a single radiograph could present more than one sign. Likewise, the sample, having been selected by convenience, does not represent the actual prevalence of these signs in the population treated; prevalence was not a study variable.
The artificial distribution of the sample introduced a spectrum bias, given that the proportions used (67–67–24–67) do not reflect the real clinical spectrum of findings in chest radiographs. Although this strategy was necessary to ensure a minimum number of cases in each group, it may modify the magnitude of diagnostic metrics, particularly predictive values, which depend on prevalence, and prevents extrapolation of results to populations with different distributions.
Since the sample was constructed by convenience with a predetermined distribution of findings (67–67–24–67), the positive predictive value (PPV) and negative predictive value (NPV) estimates derived from it do not reflect the expected performance in clinical practice under real prevalence conditions. For this reason, PPV and NPV are presented solely for descriptive purposes; clinical interpretation should rely primarily on sensitivity, specificity, and AUC, which are prevalence-independent metrics.
We included PA or AP chest radiographs corresponding to patients over 18 years old and performed at Hospital Clínica Bíblica. Studies other than chest radiographs, incomplete images, and qXR reports that did not specify nodule location or pleural effusion laterality were excluded. Image completeness was assessed by members of the research team prior to inclusion; selection required complete chest radiographs with no missing anatomical regions to ensure adequate interpretation and reporting.
All 225 selected radiographs fully met the established inclusion and exclusion criteria, and none were discarded for technical quality reasons. Radiographs were identified through the institutional Picture Archiving and Communication System (PACS) using structured report keywords and diagnostic codes associated with pleural effusion, cardiomegaly, and pulmonary nodules. Searches were performed by a member of the research team who was not involved in image interpretation. Radiographs without pathological findings were identified by selecting reports in which none of the three radiological signs under investigation were documented. Figure 1 shows the selection and interpretation process of the radiographs.
The study was approved by the Scientific Ethical Committee of Hospital Clínica Bíblica, which authorized the retrospective and anonymous evaluation of radiological images without requiring individual informed consent. All images were anonymized by the research team prior to data collection and analysis.
Statistical analysis will compare the diagnostic performance of the qXR software against the radiologists’ assessments through the estimation of sensitivity, specificity, predictive values, concordance (Kappa coefficient), anatomical accuracy, and area under the ROC curve for each evaluated sign [11,12].
AI Algorithm
All anonymized chest radiographs were processed using the qXR artificial intelligence algorithm (Qure.ai, Mumbai, India). To ensure data confidentiality and avoid transfer outside the institution, all analysis was executed within the institutional firewall of Hospital Clínica Bíblica. We used the commercially available version of the software, qXR v3.2, Rev. 04, employing only manufacturer-preset parameters, including internal operating thresholds, with no adjustments or additional retraining for this cohort. Binary outputs were generated using the default manufacturer-defined operating thresholds embedded within the software. No post-processing modifications were applied.
For processing, qXR accepts only anonymized DICOM (.dcm) studies meeting predefined technical and clinical criteria. Radiographs labeled as “chest,” acquired in PA or AP projections, with a minimum resolution of 1440 × 1440 pixels and a grayscale depth of at least 10 bits, were included. The algorithm has been previously trained on large volumes of non-local images and has authorization for clinical use in more than 50 countries, including approval by the U.S. Food and Drug Administration (FDA).
Additionally, qXR is an automated analysis system based on deep convolutional neural networks (CNNs), designed to detect multiple radiological findings. The software generates a continuous probability for each evaluated sign, accompanied by a binary label (“present”/”absent”) and, when applicable, a heat map highlighting regions of interest. In accordance with the manufacturer’s intellectual property policy, the exact model architecture, training parameters, and specific datasets used are not publicly available. Likewise, decision thresholds or operating thresholds are internal to the system, not modifiable by the user, and not openly documented, as they form part of the software’s proprietary design. According to Qure.ai documentation, the algorithm presents known limitations related to variability in non-standard images, the presence of artifacts, intrathoracic devices, and low-prevalence conditions [13].
Establishment of the Reference Standard in the Study
To define the reference standard (gold standard), three radiologists independently evaluated the chest radiographs included in the study. The 225 images were distributed equally among the radiologists, such that each specialist interpreted only a subset of them. For this reason, duplicate readings were not performed, nor was a consensus process conducted among evaluators; the individual report of each radiologist was considered the definitive diagnostic reference for the images assigned to them. This approach was selected to reflect real-world clinical practice, in which chest radiographs are typically interpreted by a single radiologist. While this strategy does not allow assessment of inter-reader variability, it provides an ecologically valid reference standard for evaluating AI performance in routine settings. The three participating radiologists were experienced professionals with 3 to 19 years of clinical experience.
Each radiological report included an assessment of the following findings:
- Presence or absence of pulmonary nodules, specifying quantity and anatomical location (left or right lung; upper, middle, or lower fields) when applicable.
- Presence or absence of pleural effusion, indicating laterality.
- Presence or absence of cardiomegaly.
Radiologists had access only to the images and did not receive clinical or demographic information about participants to ensure objective and independent interpretation. Radiologists were blinded to qXR outputs, and the research member performing statistical analysis was blinded to radiologist identity.
Anonymization and Data Recording
A sub-team of the research group assigned each image a unique identification code and then randomly distributed the radiographs among the three radiologists. Before readings began, the data collection instrument was presented to the radiologists, questions were clarified, and adjustments were made according to their expert recommendations.
Each radiologist interpreted the images independently, at different times and according to their availability, recording findings on the form designed for this purpose. The evaluations were conducted on the computers of the Medical Imaging Service at Hospital Clínica Bíblica.
Statistical Analysis
Part of the research team recorded the data in an editable collection form on the REDCap platform and later exported it to Microsoft Excel 365 (Microsoft Inc). A biostatistician conducted all statistical analysis in RStudio, version 4.5.0, using base libraries and the pROC package. The classification of each radiograph was based on the independent observations of the three radiologists and on the findings generated by qXR, from which the binary variables required for analysis were derived. For each radiological sign, sensitivity, specificity, predictive values, Kappa coefficient, anatomical accuracy, and area under the ROC curve were estimated. Confidence intervals for the AUC values were calculated using DeLong’s method. In cases requiring additional characterization, such as the location of pulmonary nodules or the laterality of pleural effusion, the corresponding Kappa coefficient was also calculated. All evaluations were conducted using a fully paired design between radiological readings and AI tool interpretation.
3. Results
Among the 225 radiographs included in the analysis, radiologists identified 31 pulmonary nodules, 85 cases of cardiomegaly, and 49 cases of pleural effusion, which were used as the reference standard to evaluate qXR performance. The distribution of true positives, true negatives, false positives, and false negatives for each sign is shown in Table 1.
Initially, 24 radiographs with at least one pulmonary nodule were identified in the institutional database, according to the diagnoses recorded in previous radiology reports. Since verification or reevaluation of these original reports was not part of the study objectives, no systematic comparison was made between those reports and the new interpretation. During the reading conducted specifically for this analysis, a total of 31 nodules were identified. This difference may be explained by interobserver variability and by the fact that, although 24 radiographs with at least one nodule were selected, each could contain more than one nodule, while the search filter only captured presence as a binary variable. For the performance analysis, this current reading of 31 nodules was used as the operational reference. A similar pattern was observed for the other two radiological findings. Interobserver variability, along with potential discrepancies between identifying a finding and correctly documenting it in the patient record, affecting whether it appears in the database when applying filters, may contribute to differences between the initial and final numbers of cases reported.
3.1. Specificity and Sensitivity
Methodological note: The PPV and NPV reported correspond to the convenience-stratified sample of the study and do not necessarily reflect values expected in populations with different prevalences.
For pulmonary nodule detection, qXR showed a sensitivity of 0.71 (95% CI: 0.53–0.83) and a specificity of 0.90 (95% CI: 0.84–0.93), with a PPV of 0.49 (95% CI: 0.35–0.63) and an NPV of 0.96 (95% CI: 0.92–0.98) (Table 2). Cohen’s Kappa was 0.51 (95% CI: 0.39–0.63, p= 0.0000), the lowest among the three signs evaluated. Regarding nodule location, a Kappa of 0.83 (95% CI: 0.62–1.0, p= 0.0000) was obtained.
For cardiomegaly, qXR achieved a sensitivity of 0.64 (95% CI: 0.57–0.70) and a specificity of 0.91 (95% CI: 0.85–0.94), with a PPV of 0.81 (95% CI: 0.70–0.88) and an NPV of 0.80 (95% CI: 0.74–0.86). Cohen’s Kappa was 0.57 (95% CI: 0.44–0.70, p= 0.0000).
In the detection of pleural effusion, qXR showed a sensitivity of 0.86 (95% CI: 0.73–0.93) and an equal specificity of 0.86 (95% CI: 0.80–0.90), with a PPV of 0.63 (95% CI: 0.51–0.73) and an NPV of 0.96 (95% CI: 0.91–0.98). Cohen’s Kappa was 0.63 (95% CI: 0.50–0.76, p= 0.0000). For effusion laterality identification, qXR obtained a Kappa of 0.76 (95% CI: 0.53–0.99, p= 0.0000).
3.2. Receiver Operating Characteristics (ROC) Curves
4. Discussion
In this study, we evaluated the performance of the qXR artificial intelligence software for detecting high-risk pulmonary nodules, cardiomegaly, and pleural effusion in chest radiographs of adults treated at Hospital Clínica Bíblica in San José, Costa Rica. Using the independent interpretation of three radiologists as the reference standard, we analyzed the diagnostic accuracy metrics and the discriminative capacity. The results allow an assessment of the strengths and limitations of qXR in a real clinical environment, with a heterogeneous set of radiographs and operational conditions characteristic of local practice.
In the detection of pulmonary nodules, qXR showed the highest level of agreement among the signs evaluated, with a Kappa coefficient of 0.75 and an AUC of 0.80. This behavior is similar to that described in previous studies that have documented stable performance of AI-based models in identifying nodules on chest radiographs [2,14,15]. However, the clinical interpretation of predictive values must be approached cautiously. Because the prevalence of nodules in this sample was artificially manipulated by the convenience sampling process, the positive and negative predictive values do not reflect the expected performance in routine practice; therefore, the evaluation must focus on sensitivity, specificity, and AUC, which are metrics independent of prevalence.
In the case of cardiomegaly, qXR showed the lowest level of agreement among the three signs analyzed (Kappa = 0.61) and moderate sensitivity. The literature has described considerable variability in the performance of AI models for this finding, influenced by factors such as variation in the cardiothoracic ratio (CTR), the degree of inspiration, and, importantly, radiographic projection [16,17]. In our sample, radiographs acquired in both PA and AP projections were included, which could be related to the variability observed, although it was not possible to confirm this due to lack of stratified analysis by projection type [18]. The AUC obtained indicates adequate discriminative capacity, although influenced by technical heterogeneity among radiographs.
In the detection of pleural effusion, qXR showed balanced performance, with sensitivity and specificity of 86%, a Kappa of 0.72, and an AUC of 0.86. The moderate agreement observed is compatible with a reasonable ability of the algorithm to differentiate anatomical characteristics, although additional studies are required to confirm this.
When comparing our results with previous research, a trend toward lower sensitivity and specificity is observed for all three radiological signs evaluated [2,19]. These differences become particularly evident when contrasting our findings with large multicenter studies such as that of Govindarajan et al., whose design, objectives, and acquisition conditions differ substantially from those of the present work. The distinction between global normal/abnormal classification tasks and tasks focused on identifying specific findings is another relevant factor, given that many commercial models are optimized for large-scale triage processes rather than sign-specific diagnosis [19].
Additionally, it should be emphasized that the sample used in this study was constructed by convenience stratification with a fixed distribution (67–67–24–67), which introduces spectrum bias that directly affects the estimation of PPV and NPV and limits the generalization of results to contexts with different real prevalences. This bias implies that no clinical interpretation based on predictive values is appropriate in this study, reinforcing the need for conclusions to rely on sensitivity, specificity, and AUC.
Taken together, it is likely that the performance observed was influenced by several methodological elements of the study design, including the use of a gold standard based on radiological reports without tomographic confirmation, the convenience sampling of a cohort with non-representative prevalences, and technical heterogeneity between AP and PA studies. These differences limit direct comparability with previous research, including that of Govindarajan et al., and explain, at least in part, the lower sensitivity and agreement observed. For this reason, interpretation of results must consider the direct impact of these methodological factors on the algorithm’s performance metrics.
Finally, our results complement international evidence by providing local data, stratified by finding and derived from a Latin American clinical setting in which AI tool adoption is still developing. The variability observed in comparison with previous studies underscores the importance of validating these systems in the same environments where implementation is intended, considering technical, population, and operational factors that may influence performance. Likewise, these findings highlight the need for prospective studies evaluating clinical impact, performance under real prevalence conditions, reproducibility across centers and levels of care, and operational integration of the software into routine workflows.
Limitations
A relevant limitation of the study was the small number of pulmonary nodules with suspected malignancy identified in the initial population. Although convenience stratification was applied to ensure minimal representation of each radiological sign, this strategy may limit the generalization of the results. Additionally, the selected sample does not reflect the real prevalence of these findings in the population treated, since prevalence was not evaluated nor was it part of the study objective.
Another important limitation relates to the technical heterogeneity of the images. The study included radiographs obtained in AP and PA projections, but the specific proportion of each type within the sample was not recorded or analyzed. This absence of information affects interpretation of the results, as inherent differences between these projections may substantially alter the appearance of several radiological signs. As has long been recognized, AP radiographs, particularly portable films, tend to magnify the heart and mediastinum, because the source-image geometry amplifies anterior structures; this may result in overestimation of cardiac size [20]. Without stratified analysis by projection type, it is not possible to accurately estimate the extent to which this heterogeneity may have influenced sensitivity, specificity, and other performance metrics of the algorithm and radiological readings.
Likewise, the study lacked a definitive diagnostic method to confirm the presence or absence of the evaluated findings. Higher-precision modalities such as computed tomography or histopathological confirmation in the case of nodules suspected of malignancy were not used as reference. Nor was an additional review performed by a thoracic radiology specialist to validate the reference standard. As a result, findings were based exclusively on the independent interpretation of the three participating radiologists, which, although adequate for a preliminary study, limits the ability to establish diagnostic truth with complete certainty.
It is important to emphasize that the present study did not evaluate aspects related to clinical impact, usefulness in triage scenarios, workload reduction, or software performance in non-specialized environments. The retrospective design focused solely on diagnostic accuracy prevents making assertions about operational or clinical benefits. Finally, the single-center nature of the study limits the generalization of results to other environments or levels of care.
Despite these limitations, the study provides valuable local evidence regarding the performance of artificial intelligence tools applied to chest radiographs in Costa Rica, in a context where adoption of these technologies is still developing. The use of multiple radiologists as the reference standard and the detailed evaluation of accuracy metrics strengthen the internal validity of the study and highlight the need for future research with prospective designs and larger samples.
Future Research
Building on the findings of this study, future research should move toward evaluating how AI-assisted chest radiography tools function as decision-support systems in clinical practice, rather than focusing only on retrospective accuracy assessment.
Subsequent investigations could examine implementation-oriented questions, including how AI outputs are integrated into radiology workflows, how results are presented within reporting systems, and how radiologists interact with algorithm-generated information during routine interpretation.
Future studies may also explore use-case–specific evaluations, such as the application of AI tools for case prioritization, quality assurance, or support in high-volume reading environments. Assessing performance and usability within clearly defined operational scenarios may provide more actionable insights than generalized accuracy metrics alone.
In addition, longitudinal and multicenter evaluations could help characterize consistency of AI behavior over time and across institutions with different imaging practices and infrastructure.
Finally, further work may address human–AI interaction and governance considerations, including transparency of algorithm outputs, user trust, and alignment with local regulatory and ethical frameworks. These dimensions are particularly relevant in middle-income health systems where AI adoption is emerging and require evidence that extends beyond technical validation.
5. Conclusions
Taken together, the findings of this study suggest that qXR may function as a complementary tool for the interpretation of chest radiographs within the Costa Rican clinical context, with performance varying across different radiological signs. By providing locally generated evidence derived from routine clinical data and independent radiologist interpretation, this work contributes to the biomedical informatics literature on the contextual evaluation of AI-based decision-support systems in medical imaging. While the observed diagnostic accuracy supports continued investigation of AI-assisted chest radiography, the results should be interpreted in light of the study’s methodological constraints and are not intended to support autonomous clinical use. Overall, these findings underscore the importance of context-specific validation prior to broader implementation of AI tools in radiological practice.
Supplementary Materials
The following supporting information can be downloaded at the website of this paper posted on Preprints.org, Figure 1: Flow diagram of chest radiograph selection, inclusion and exclusion criteria, ground truth, and AI interpretation; Figure 2: ROC curve for the detection of pulmonary nodules (AUC= 0.80); Figure 3: ROC curve for the detection of pleural effusion (AUC = 0.86), Figure 4: ROC curve for the detection of cardiomegaly (AUC = 0.77).
Author Contributions
Conceptualization, E.Z.M, S.A.C and A.A.A.; methodology, D.Q.L., A.A.A, G.H.V., S.A.C and E.Z.M; software, S.A.C.; validation, A.A.A., G.H.V., S.S.S. and E.Z.M.; formal analysis, D.Q.L; investigation, L.A.C, S.S.A, K.W.H and A.A.A.; resources, E.Z.M and S.A.C.; data curation, D.Q.L., A.A.A., G.H.V. and S.S.S.; writing—original draft preparation, A.A.A. and D.Q.L.; writing—review and editing, E.Z.M, M.M.A., J.S.S. and A.A.A.; visualization, D.Q.L., A.A.A. and S.A.C.; supervision, E.Z.M.; project administration, A.A.A.; funding acquisition, E.Z.M. All authors have read and agreed to the published version of the manuscript.
Funding
This research was funded by ASTRAZENECA CAMCAR.
Institutional Review Board Statement
The study was conducted in accordance with the Declaration of Helsinki and approved by the Ethics Committee Hospital Clínica Bíblica (protocol code CEC-HCB-E017-2024 and date of approval August 8, 2025).
Informed Consent Statement
Patient consent was waived due to the retrospective nature of the study and the impracticality of contacting participants, including deceased patients or those with unavailable contact information. All data were anonymized to ensure confidentiality. The study was conducted in full compliance with national ethical regulations.
Data Availability Statement
The original contributions presented in this study are included in the supplementary material. Further inquiries can be directed to the corresponding author.
Acknowledgments
We would like to thank Dr. Yazlin Alvarado-Rodríguez, Rebeca Agüero-Cedeño, Dr. Daniel Díaz-Juan, Briansy Angulo-Gaucherand and Dr. Daniel Nieto-Bernal for their support and assistance during the implementation of this study.
Conflicts of Interest
The authors declare no conflicts of interest. The funders had no role in the design of the study; in the collection, analyses, or interpretation of data; in the writing of the manuscript; or in the decision to publish the results.
Abbreviations
The following abbreviations are used in this manuscript:
| AI | Artificial Intelligence |
| ROC | Receiver Operating Characteristic |
| AUC | Area Under the Curve |
| PA | Posteroanterior |
| AP | Anteroposterior |
| PPV | Positive Predictive Value |
| NPV | Negative Predictive Value |
| FDA | U.S. Food and Drug Administration |
| CNNs | Deep Convolutional Neural Networks |
| CI | Confidence Interval |
| CTR | Cardiothoracic Ratio |
References
- Celik, A.; Surmeli, A.O.; Demir, M.; Esen, K.; Camsari, A. The diagnostic value of chest X-ray scanning by the help of Artificial Intelligence in Heart Failure (ART-IN-HF). Clin Cardiol. 2023, 46, 1562–1568. [Google Scholar] [CrossRef] [PubMed]
- Mahboub, B.; Tadepalli, M.; Raj, T.; Santhanakrishnan, R.; Hachim, M.; Bastaki, U.; Hamoudi, R.; Haider, E.; Alabousi, A. Identifying malignant nodules on chest X-rays. A validation study of radiologist versus artificial intelligence diagnostic accuracy. Adv Biomed Health Sci. 2022, 1, 137–143. [Google Scholar] [CrossRef]
- Rohan, K.; Anupama, R.; Shivaraj, K. Artificial Intelligence in Radiology: Augmentation, Not Replacement. Cureus 2025, 6, e86247. [Google Scholar] [CrossRef] [PubMed]
- Homayounieh, F.; Digumarthy, S.; Ebrahimian, S.; Rueckel, J.; Hoppe, B.F.; Sabel, B.O. An Artificial Intelligence–Based Chest X-ray Model on Human Nodule Detection Accuracy From a Multicenter Study. JAMA Netw Open. 2021, 4, e2141096. [Google Scholar] [CrossRef] [PubMed]
- Niehoff, J.H.; Kalaitzidis, J.; Kroeger, J.R.; Schoenbeck, D.; Borggrefe, J.; Michael, A.E. Evaluation of the clinical performance of an AI-based application for the automated analysis of chest X-rays. Sci Rep. 2023, 13, 3680. [Google Scholar] [CrossRef] [PubMed]
- Achour, N.; Zapata, T.; Saleh, Y.; Pierscionek, B.; Azzopardi-Muscat, N. The role of AI in mitigating the impact of radiologist shortages: A systematized review. Health Technol. 2025, 15, 489–501. [Google Scholar] [CrossRef] [PubMed]
- Queralt-Miró, C.; Vidal-Alaball, J.; Fuster-Casanovas, A.; Escalé-Besa, A. Real-world testing o fan artificial intelligence algorithm for the analysis of chest X-rays in primary care settings. Sci Rep. 2024, 14, 5199. [Google Scholar] [CrossRef] [PubMed]
- García-García, J.A.; Reding-Bernal, A.; López-Alvarenga, J.C. Cálculo del tamaño de la muestra en investigación en educación médica. Inv Ed Med. 2013, 2, 217–224. [Google Scholar] [CrossRef]
- Zaki, H.A.; Albaroudi, B.; Shaban, E.E.; Shaban, A.; Elgassim, M.; Almarri, N.D. Advancement in pleura effusion diagnosis: A systematic review and meta-analysis of point-of-care ultrasound versus radiographic thoracic imaging. Ultrasound J. 2024, 16. [Google Scholar] [CrossRef] [PubMed]
- Blake, S.R.; Das, N.; Tadepalli, M.; Reddy, B.; Singh, A.; Agrawal, R. Using Artificial Intelligence to Stratify Normal versus Abnormal Chest X-rays: External Validation of a Deep Learning Algorithm at East Kent Hospitals University NHS Foundation Trust. Diagnostics 2023, 13, 3408. [Google Scholar] [CrossRef] [PubMed]
- Cerda, J.; Cifuentes, L. Uso de curvas ROC en investigación clínica: Aspectos teórico-prácticos. Revista chilena de infectología 2012, 29, 138–141. [Google Scholar] [CrossRef] [PubMed]
- Cerda, L.J.; Villarroel Del, P.L. Evaluación de la concordancia inter-observador en investigación pediátrica: Coeficiente de Kappa. Revista chilena de pediatría 2008, 79, 54–58. [Google Scholar] [CrossRef]
- Qure AI|AI assistance for Accelerated Healthcare. Available online: https://www.qure.ai/ (accessed on 24 November 2025).
- Nam, J.G.; Park, S.; Hwang, E.J.; Lee, J.H.; Jin, K.N.; Lim, K.Y. Development and Validation of Deep Learning-based Automatic Detection Algorithm for Malignant Pulmonary Nodules on Chest Radiographs. Radiology 2019, 290, 218–228. [Google Scholar] [CrossRef] [PubMed]
- Schalekamp, S.; van Ginneken, B.; Koedam, E.; Snoeren, M.M.; Tiehuis, A.M.; Wittenberg, R. Computer-aided detection improves detection of pulmonary nodules in chest radiographs beyond the support by bone-suppressed images. Radiology 2014, 272, 252–261. [Google Scholar] [CrossRef] [PubMed]
- Litjens, G.; Kooi, T.; Bejnordi, B.E.; Setio, A.A.A.; Ciompi, F.; Ghafoorian, M. A survey on deep learning in medical image analysis. Med Image Anal. 2017, 42, 60–88. [Google Scholar] [CrossRef] [PubMed]
- Kufel, J.; Czogalik, Ł.; Bielówka, M.; Magiera, M.; Mitręga, A.; Dudek, P. Measurement of Cardiothoracic Ratio on Chest X-rays Using Artificial Intelligence-A Systematic Review and Meta-Analysis. J Clin Med. 2024, 13, 4659. [Google Scholar] [CrossRef] [PubMed]
- American College of Radiology. Available online: https://www.acr.org/Data-Science-and-Informatics/AI-in-Your-Practice/AI-Use-Cases/Use-Cases/Cardiomegaly-Detection (accessed on 17 November 2025).
- Govindarajan, A.; Govindarajan, A.; Tanamala, S.; Chattoraj, S.; Reddy, B.; Agrawal, R. Role of an Automated Deep Learning Algorithm for Reliable Screening of Abnormality in Chest Radiographs: A Prospective Multicenter Quality Improvement Study. Diagnostics (Basel) 2022, 12, 2724. [Google Scholar] [CrossRef] [PubMed]
- Broder, J. Imaging the Chest: The Chest Radiograph. Diagnostic Imaging for the Emergency Physician 2011, 185–296. [Google Scholar]
Figure 1.
Flow diagram of chest radiograph selection, inclusion and exclusion criteria, ground truth, and AI interpretation. Abbreviations: PA, Posteroanterior; AP, Anteroposterior; AI, Artificial Intelligence.
Figure 1.
Flow diagram of chest radiograph selection, inclusion and exclusion criteria, ground truth, and AI interpretation. Abbreviations: PA, Posteroanterior; AP, Anteroposterior; AI, Artificial Intelligence.
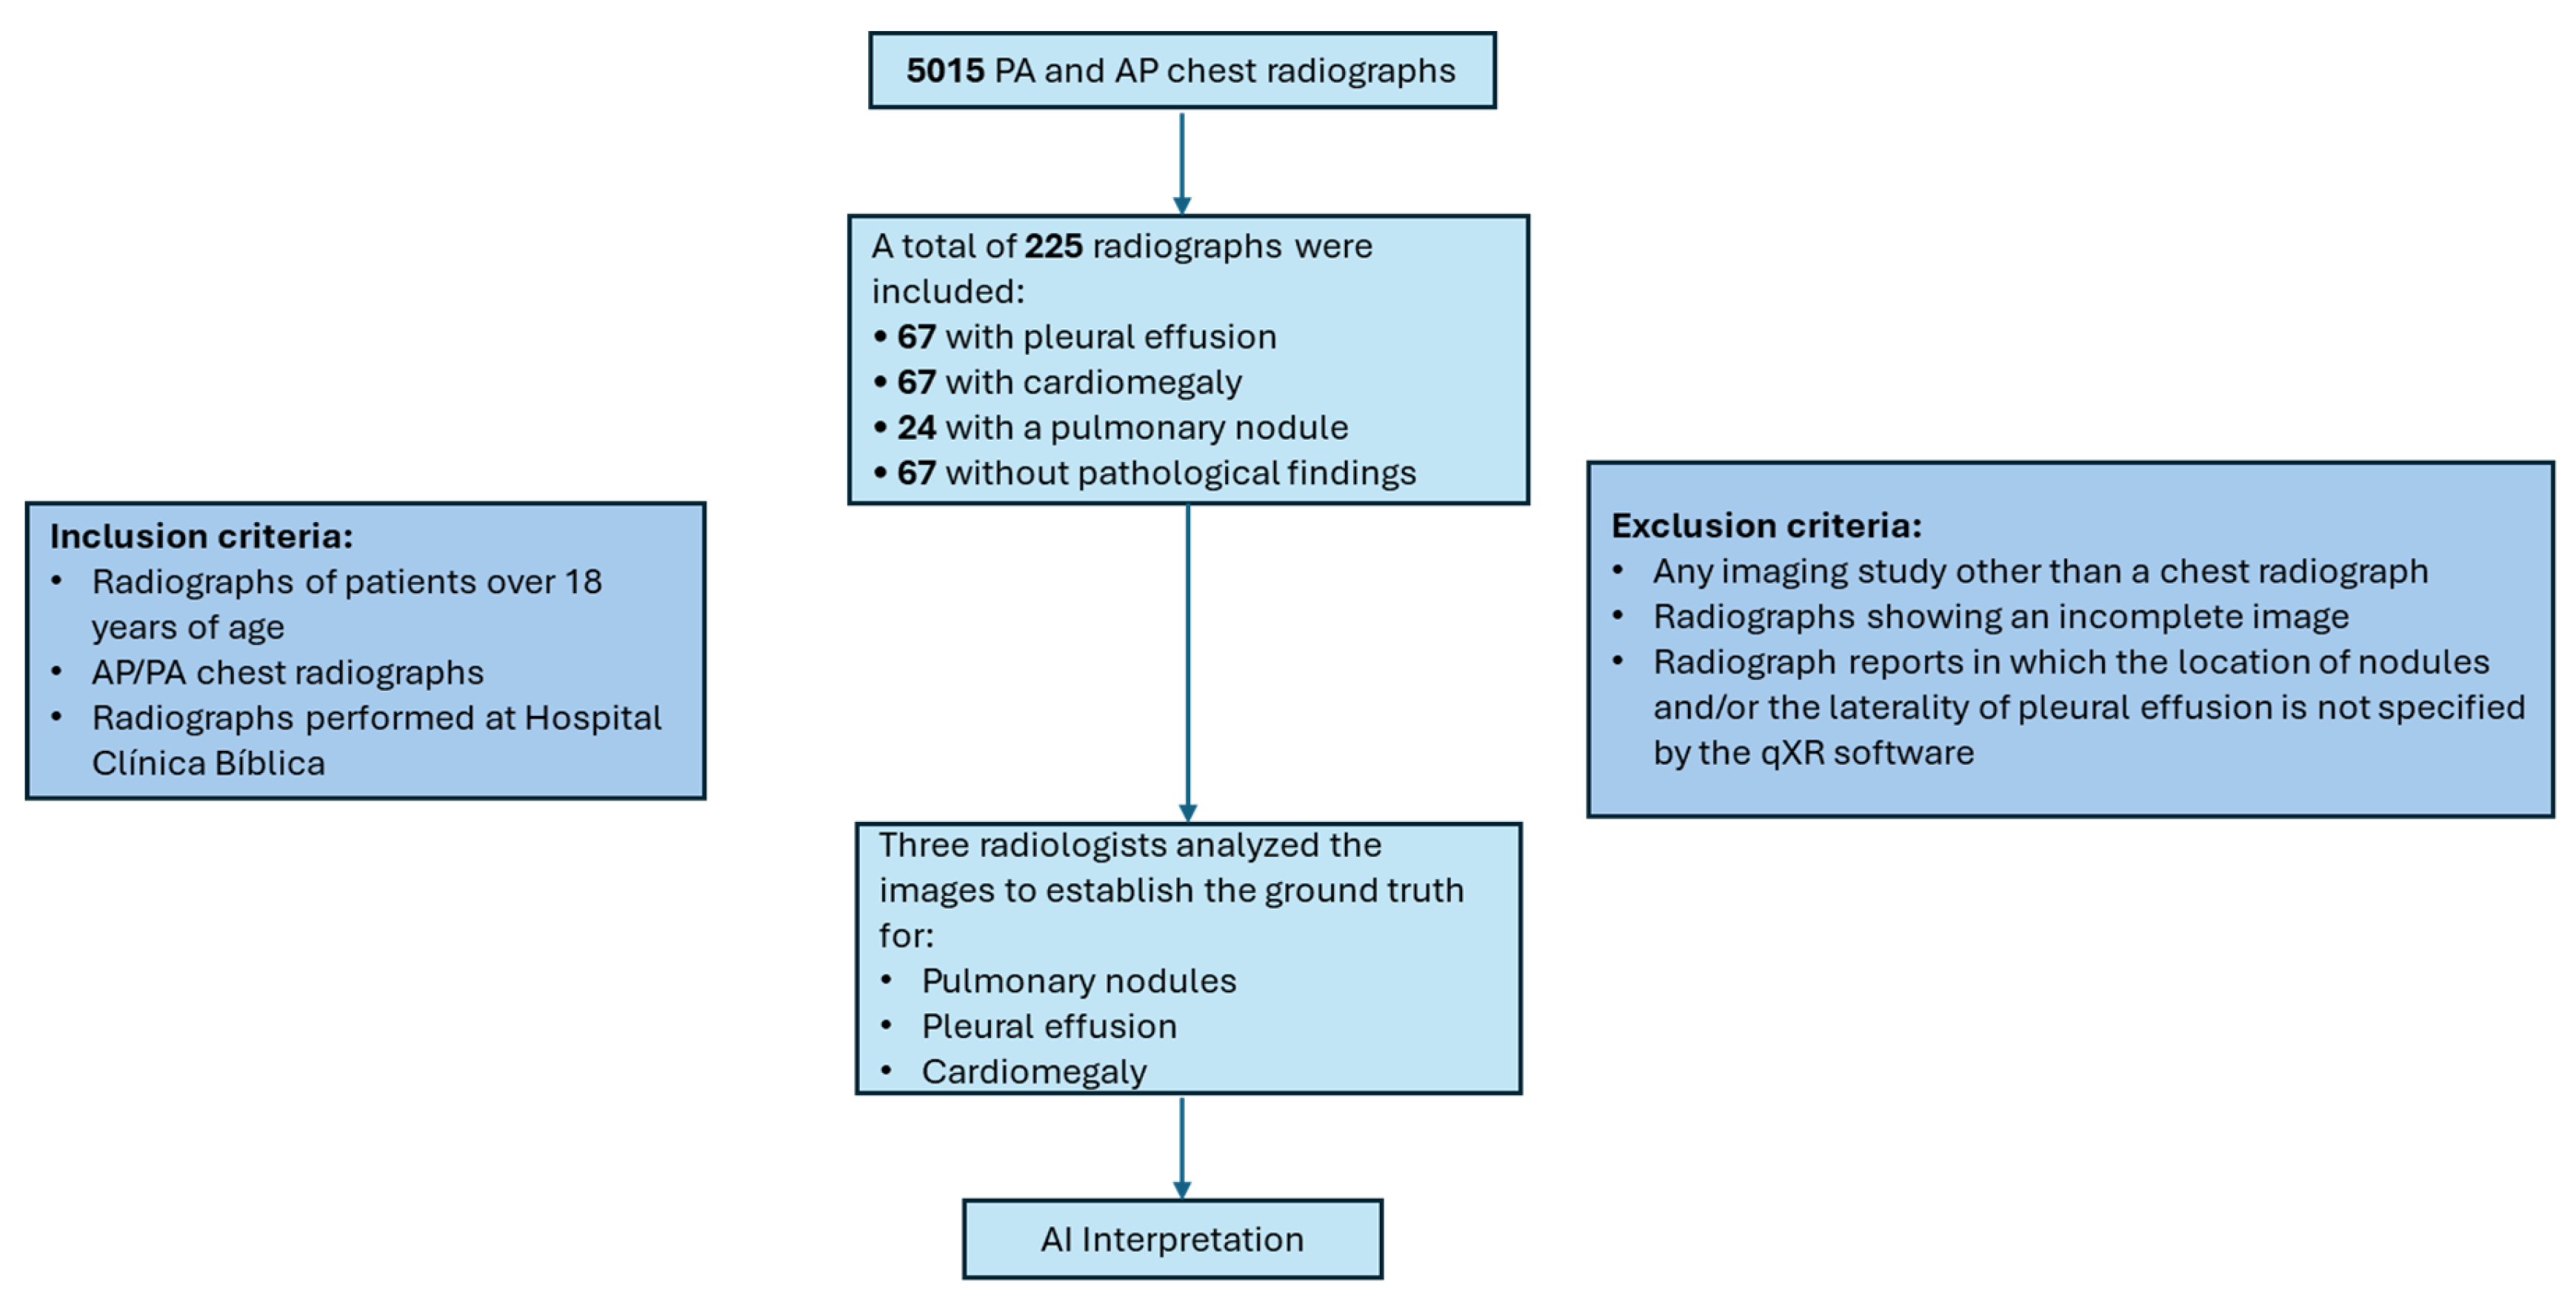
Figure 2.
ROC curve for the detection of pulmonary nodules (AUC= 0.80).
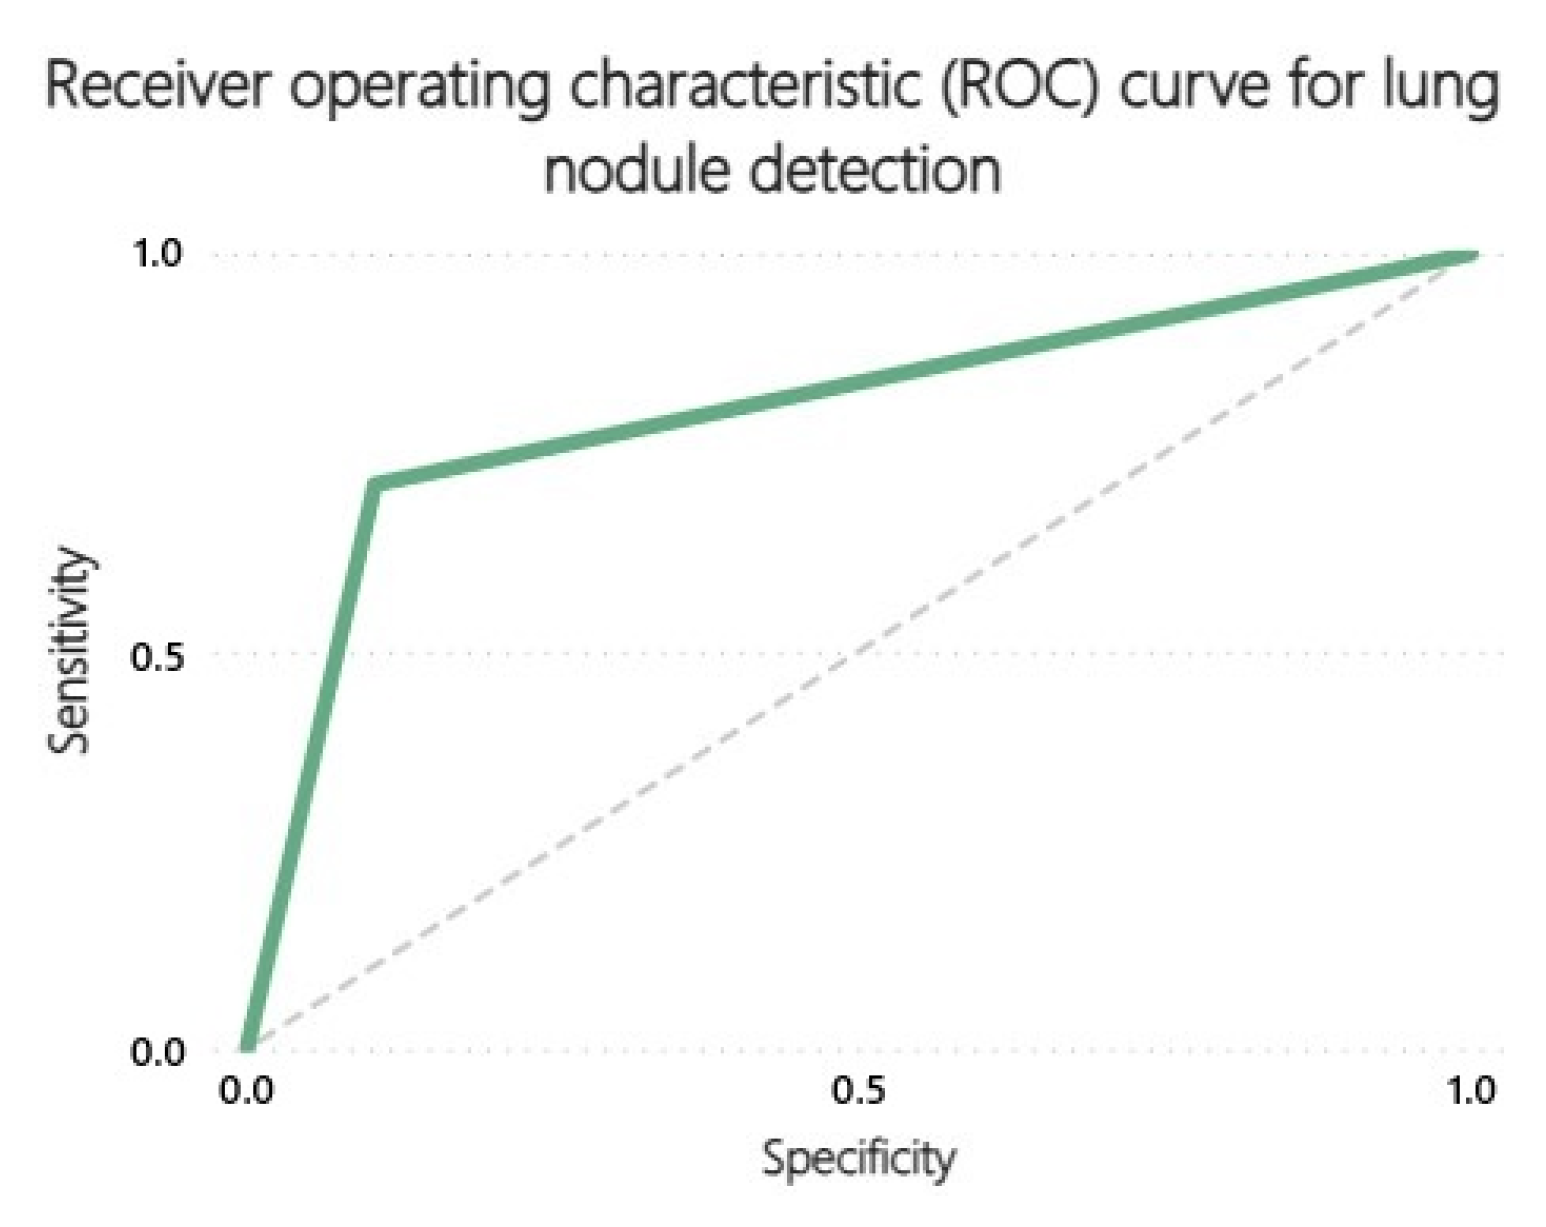
Figure 3.
ROC curve for the detection of pleural effusion (AUC = 0.86).
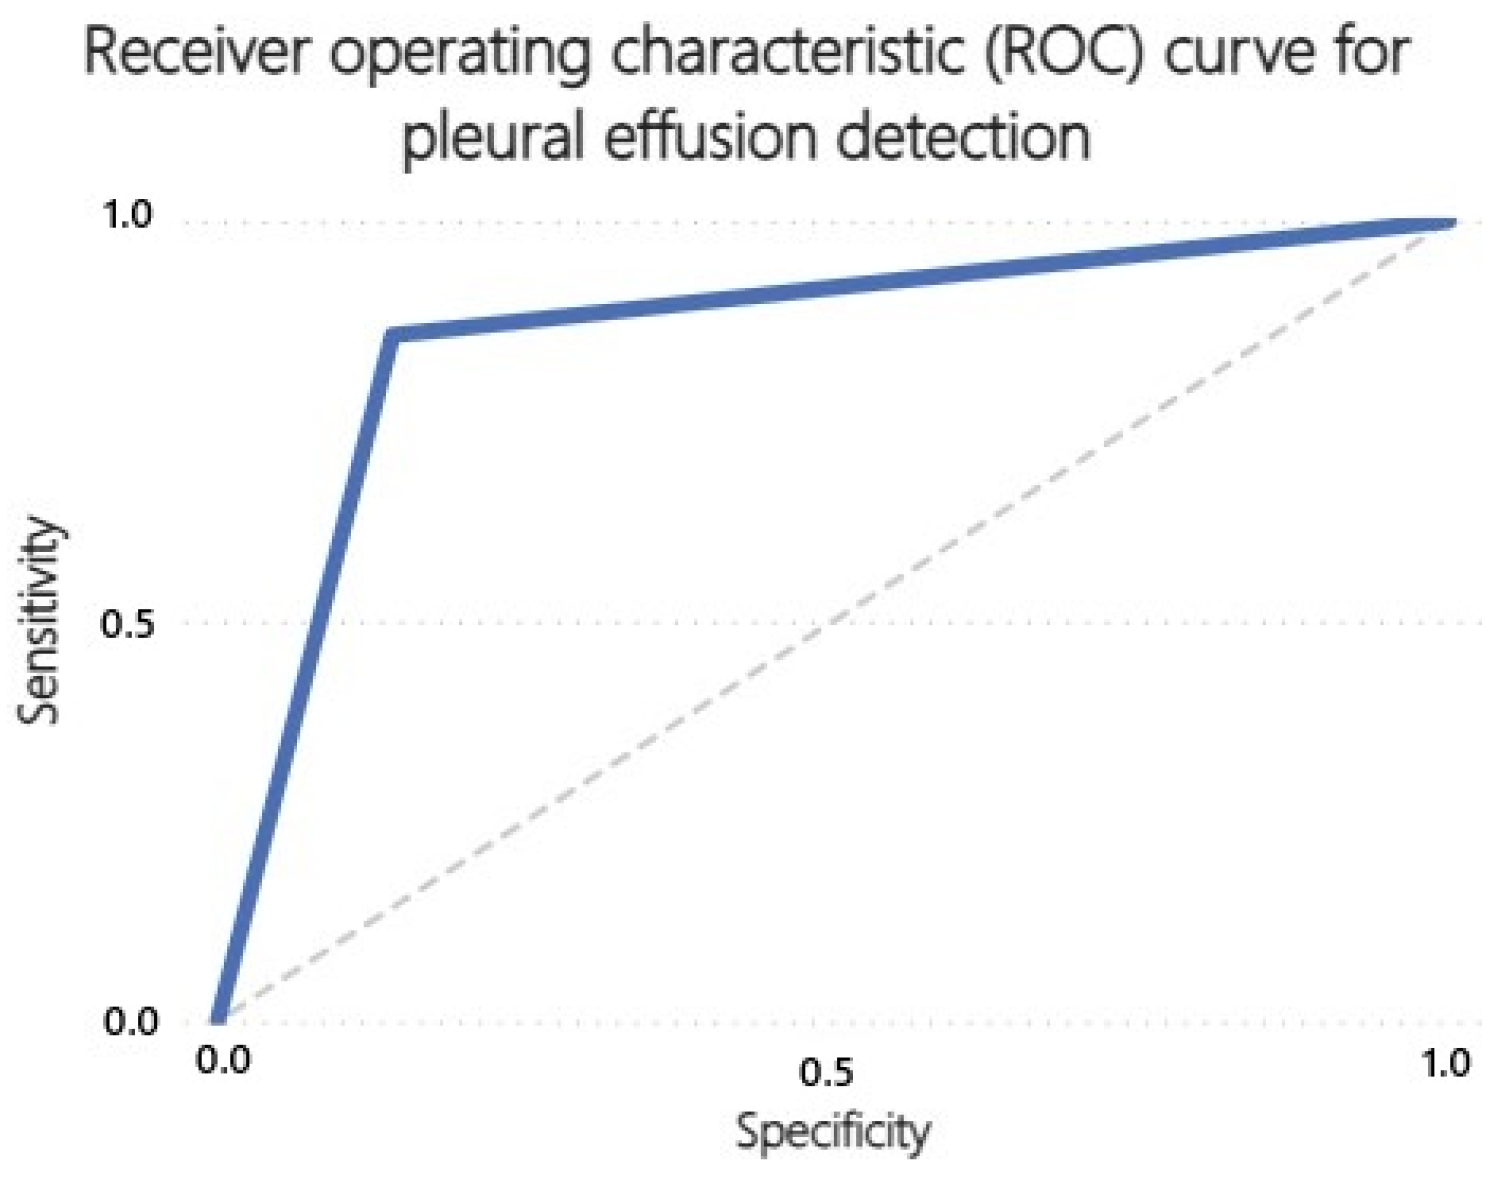
Figure 4.
ROC curve for the detection of cardiomegaly (AUC = 0.77).
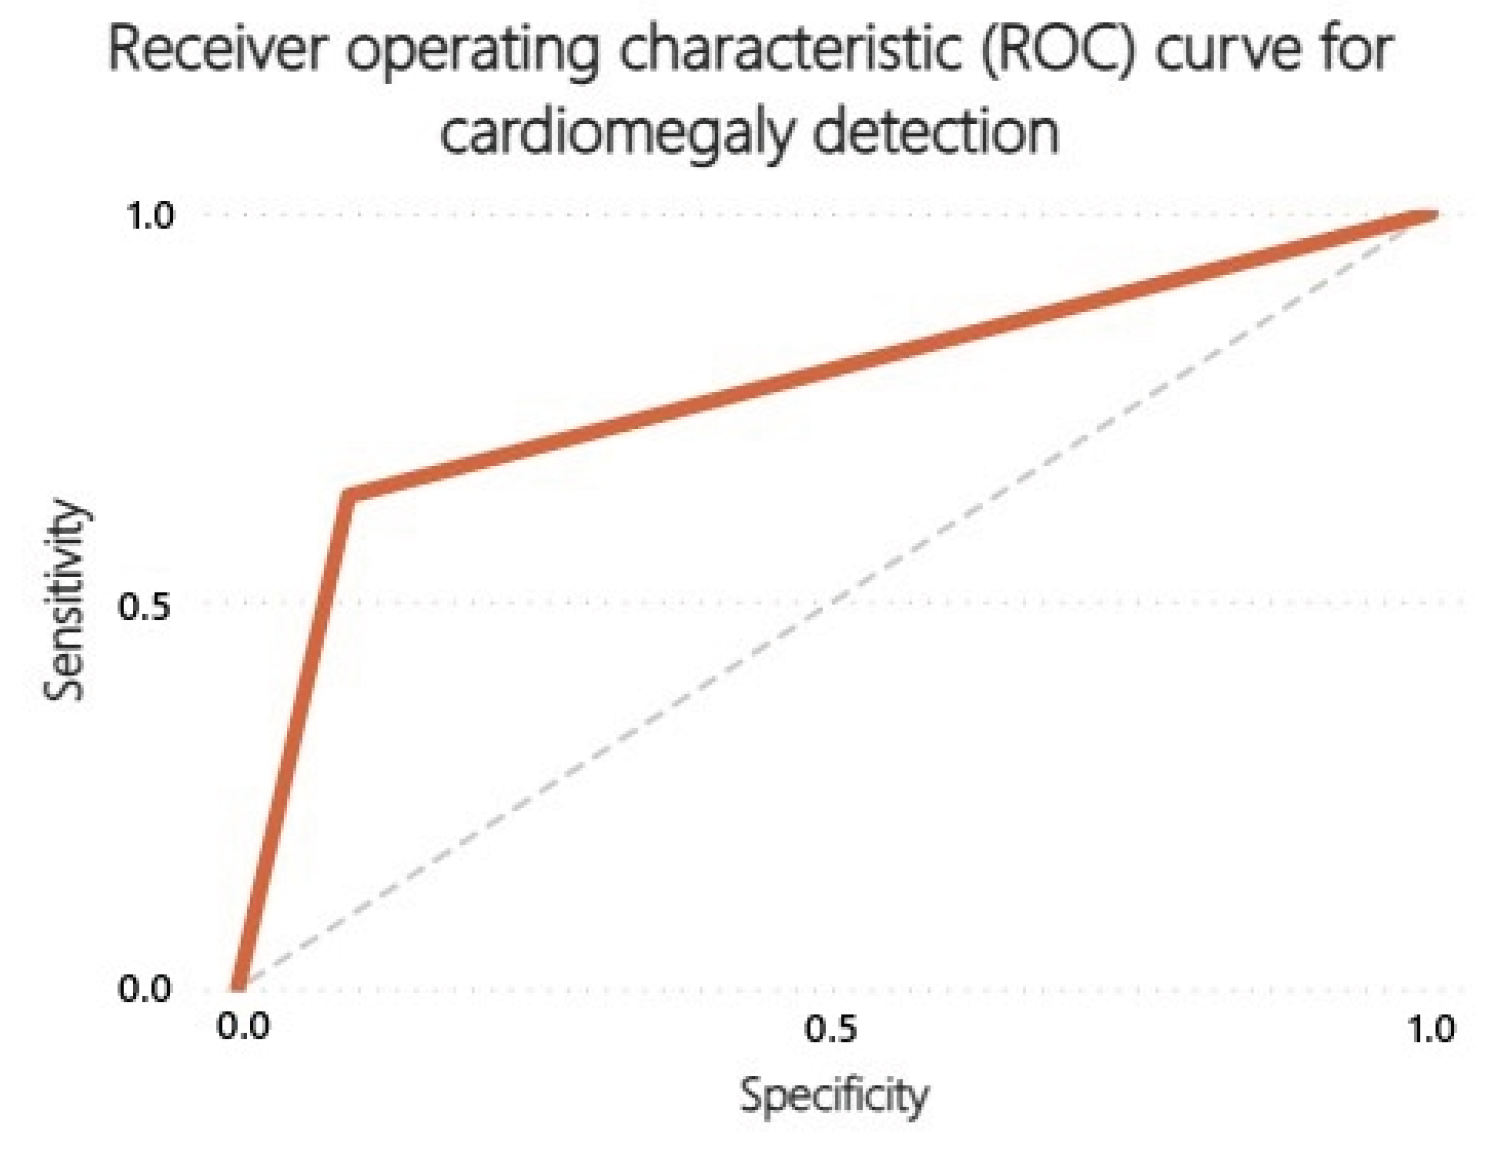

Table 1.
Distribution of True and False Results by Radiological Sign.
| Radiological Sign | True Positives | True Negatives | False Positives | False Negatives |
|---|---|---|---|---|
| Pulmonary nodule | 22 | 197 | 23 | 9 |
| Cardiomegaly | 54 | 127 | 13 | 31 |
| Pleural effusion | 42 | 151 | 25 | 7 |
Table 2.
Agreement Statistics Between qXR and Radiologists by Radiological Sign.
| Radiological Sign | Sensitivity | Specificity | PPV | NPV | Cohen’s Kappa |
|---|---|---|---|---|---|
| Pulmonary nodule | 0.71 | 0.90 | 0.49 | 0.96 | 0.51 |
| Cardiomegaly | 0.64 | 0.91 | 0.81 | 0.80 | 0.57 |
| Pleural effusion | 0.86 | 0.86 | 0.63 | 0.96 | 0.63 |
Abbreviations: PPV, positive predictive value; NPV, negative predictive value.
Disclaimer/Publisher’s Note: The statements, opinions and data contained in all publications are solely those of the individual author(s) and contributor(s) and not of MDPI and/or the editor(s). MDPI and/or the editor(s) disclaim responsibility for any injury to people or property resulting from any ideas, methods, instructions or products referred to in the content. |
© 2026 by the authors. Licensee MDPI, Basel, Switzerland. This article is an open access article distributed under the terms and conditions of the Creative Commons Attribution (CC BY) license.
Copyright: This open access article is published under a Creative Commons CC BY 4.0 license, which permit the free download, distribution, and reuse, provided that the author and preprint are cited in any reuse.


