
Submitted:
28 October 2025
Posted:
29 October 2025
You are already at the latest version
Abstract
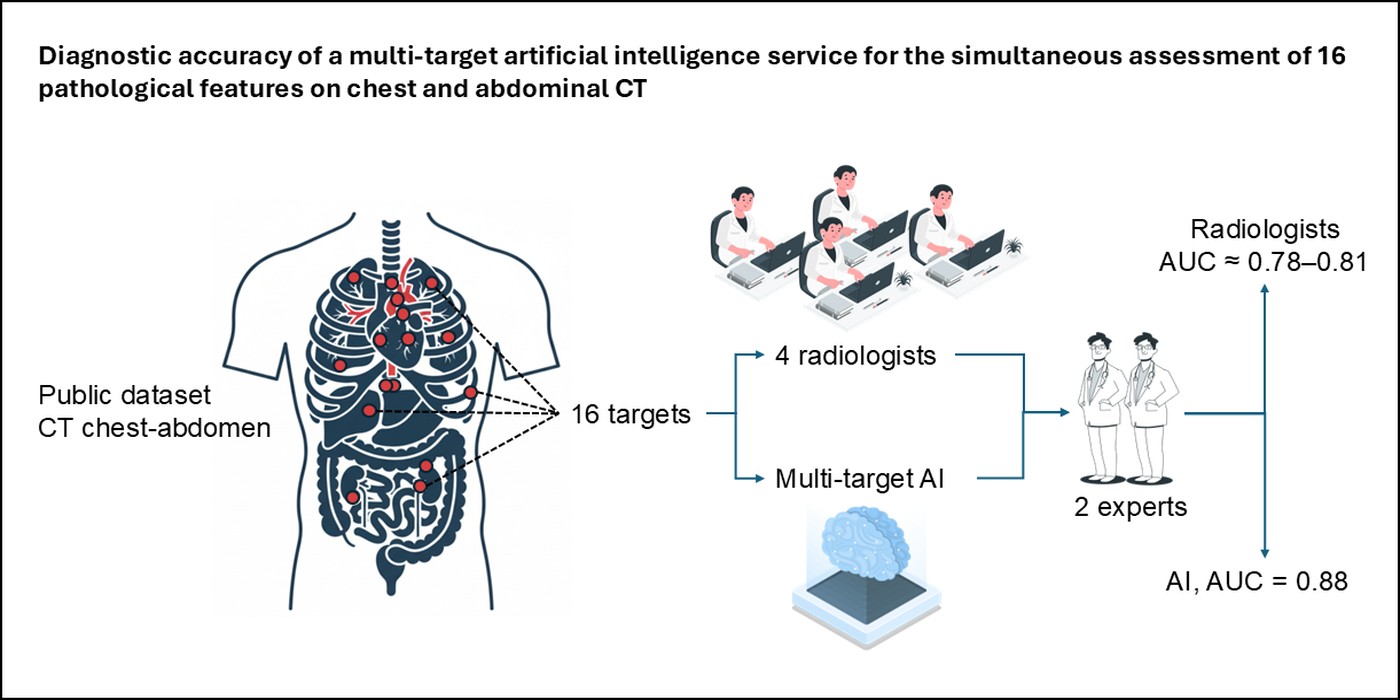
Background: Chest, abdominal, and pelvic computed tomography (CT) with intrave-nous contrast is widely used for tumor staging, treatment planning, and therapy mon-itoring. The integration of artificial intelligence (AI) services is expected to improve diagnostic accuracy across multiple anatomical regions simultaneously. Purpose: To evaluate the diagnostic accuracy of a multi-target AI service in detecting 16 pathological features on chest and abdominal CT images. Methods: We conducted a retrospective study using anonymized CT data from an open dataset. A total of 229 CT scans were independently interpreted by four radiologists with more than 5 years of experience and analyzed by the AI service. Sixteen pathological features were assessed. AI errors were classified as minor, intermediate, or clinically significant. Diagnostic accuracy was evaluated using the area under the receiver operating characteristic curve (AUC). Re-sults: Across 229 CT scans, the AI service made 423 errors (11.5% of all evaluated fea-tures, n = 3664). False positives accounted for 262 cases (61.9%) and false negatives for 161 (38.1%). Most errors were minor (62.9%) or intermediate (31.7%), while clinically significant errors comprised only 5.4%. The overall AUC of the AI service was 0.88 (95% CI: 0.87–0.89), compared with 0.78–0.81 for radiologists. For clinically significant find-ings, the AI AUC was 0.90 (95% CI: 0.71–1.00). Diagnostic accuracy was unsatisfactory only for urolithiasis. Conclusions: The multi-target AI service demonstrated high di-agnostic accuracy for chest and abdominal CT interpretation, with most errors being clinically negligible; performance was limited for urolithiasis.
Keywords:
artificial intelligence
; computer vision
; computed tomography
; chest
; abdomen
1. Introduction
Artificial intelligence (AI) technologies have introduced novel opportunities in radiology, including enhanced diagnostic accuracy, workflow optimization, and the advancement of medical research [1,2]. The integration of AI algorithms into clinical practice is necessitated by the steadily increasing volume of imaging studies, the persistent shortage of radiologists, and the ongoing demand for greater diagnostic precision in imaging modalities [1,2]. Among these modalities, contrast-enhanced computed tomography (CT) of the chest, abdomen, and pelvis remains one of the most accessible and accurate techniques. CT is recommended for the assessment of tumor extent, treatment planning, and evaluation of therapeutic efficacy, and is therefore considered an indispensable component of comprehensive patient management [3]. Nonetheless, radiology reports based on chest CT [4] and abdominal CT [5] are frequently subject to diagnostic errors, most commonly false-negative findings. In this context, the implementation of multipurpose AI-based systems capable of detecting pathological changes across multiple anatomical regions concurrently appears highly relevant. Such systems not only have the potential to reduce diagnostic error rates, but may also contribute to mitigating the increasing clinical workload of radiologists [6]. However, the diagnostic performance of AI tools requires rigorous evaluation, including systematic assessment of potential sources of error and identification of limitations that may constrain their widespread clinical adoption [2].
2. Materials and Methods
2.1. The Study Design
2.2. Study registration
This retrospective diagnostic accuracy study analyzed publicly available, anonymized CT data and therefore did not require separate protocol registration (e.g., ClinicalTrials.gov). Ethical approval was obtained from the local ethics committee of Moscow City Clinical Hospital No. 1. (protocol dated 1 March 2024). The BIMCV-COVID19+ dataset had prior approval from the Hospital Arnau de Vilanova ethics committee (CElm 12/2020, Valencia, Spain) and was funded through regional and EU Horizon 2020 grants. All data were anonymized before release, so informed consent was waived.
2.3. Data Source
Anonymized CT scans were acquired in 2020. Retrospective evaluation by radiologists and the AI system was carried out between March 14, 2024, and November 2, 2024. All CT examinations originated from the publicly available BIMCV-COVID19+ dataset (Valencia Region, Spain), collected in 2020 from 11 public hospitals and standardized to UMLS terminology [9].
Inclusion criteria
Adult chest and abdominal CT images; slice thickness ≤ 1 mm; scan coverage extending from the lung apices to the ischial bones, acquired during deep inspiratory breath-hold.
Exclusion criteria
CT studies with protocol deviations (slice thickness > 1 mm or incomplete anatomic coverage), severe motion or beam-hardening artifacts, non-standard patient positioning, or upload/parse failures. Studies with corrupted DICOM tags or missing key series were also excluded.
2.4. Data preprocessing
No additional data preprocessing was applied beyond standard DICOM parsing of the publicly available BIMCV-COVID19+ dataset; images were analyzed as provided.
2.5. Data Partitions
Assignment of data to partitions
All 229 eligible CT examinations were used solely as an independent test set for the locked AI system. No additional training or validation split was performed.
Level of disjointness between partitions
Each examination (one patient) was treated as a single unit of analysis; no overlap existed between cases.
2.6. Intended sample size
The required sample size was calculated a priori as 236 examinations to estimate sensitivity and specificity with 95% confidence and ±10% error. To account for possible data loss (artifacts, upload failures, or absent non-contrast series), 250 CTs were selected; after exclusions, 229 remained for final analysis.
2.7. De-identification methods
All CT examinations were provided as part of the publicly available BIMCV-COVID19+ dataset, which had been fully anonymized by the data provider before release. Personal identifiers—including patient name, date of birth, medical record numbers, and examination dates—were removed from DICOM headers. Only anonymous study IDs linking imaging data to accompanying radiology reports were retained for analysis. The de-identification procedure of the BIMCV dataset was reviewed and approved by the local ethics committee (CElm: 12/2020, Valencia, Spain).
2.8. Handling of missing data
Studies lacking mandatory series (e.g., contrast-enhanced scans without a corresponding non-contrast series) or with missing annotations/upload failures were treated as technical exclusions. No additional data imputation or image reconstruction was performed; such cases were not included in endpoint analyses.
2.9. Image acquisition protocol
Detailed scanning parameters can be obtained from the original publicly available dataset [9]. Examinations were performed on multislice CT scanners routinely used in hospitals of the Valencia region. Slice thickness was ≤ 1 mm, and coverage extended from the lung apices to the ischial bones. Scans were obtained during deep-inspiration breath-hold. Both non-contrast and contrast-enhanced studies were included; contrast-enhanced examinations lacking a non-contrast series were excluded. Detailed scanner models, reconstruction kernels, and exposure parameters were not available in the public dataset; all scans followed standard clinical protocols for chest–abdomen–pelvis CT in the region.
2.10. Human readers
Seven radiologists participated in the study. Inclusion criteria comprised at least three years of experience in interpreting chest and abdominal CT scans. Exclusion criteria included failure to complete calibration or training according to the study protocol. The radiologists were assigned to three roles: annotators (n = 4), compiler (n = 1), and referees (n = 2). The annotators, all board-certified radiologists with 5–8 years of experience, independently interpreted all CT examinations using RadiAnt DICOM Viewer 2023.1 outside their routine clinical duties. Prior to the study, all readers attended a short calibration session with sample clinical cases to standardize interpretation criteria. Case order was randomized individually, and readers were blinded to AI outputs, clinical data, and one another’s results. For each of the 16 predefined pathologies, findings were recorded for ROC AUC analysis. The compiler (8 years of experience) reviewed all radiologist and AI reports to compile structured tables containing the same 16 pathologies, resulting in five tables (four radiologists and one AI system) covering 229 CT studies. The referees (each with over 8 years of experience) independently reviewed DICOM images and resolved discrepancies by consensus, after which they were granted access to all five result tables for comparative evaluation.
2.11. Annotation workflow
Each of the six radiologists (annotators, n = 4; referees, n = 2) reviewed every CT slice of all 229 examinations to ensure comprehensive assessment. The compiler (n = 1) subsequently analyzed the outputs from the four annotators and from the AI system (IRA LABS AI service), which processed the same 229 CT studies and produced both DICOM SEG annotations and DICOM SR structured reports. For each study, the compiler registered the presence or absence (binary classification) of all 16 predefined pathologies.
2.12. Reference standard
The reference standard for performance evaluation was the consensus of two senior radiologists (>8 years’ experience) who were not involved in the initial readings. They independently reviewed all CT examinations without access to AI outputs or initial reader reports using RadiAnt DICOM Viewer 2023.1. Disagreements were resolved by consensus or, if unresolved, by a third adjudicator. Formal inter-reader variability was not a primary objective; however, prior work highlights substantial variability in CT reporting [13].
Expert annotations for all 229 examinations were documented in a standardized table covering 16 predefined pathological features. Performance comparisons were made among: (1) initial annotations from four radiologists, (2) AI system outputs, and (3) the expert consensus reference standard.
For exploratory error analysis only, the same experts re-examined cases after reviewing AI outputs to categorize AI detections and errors; these post-AI reviews were not used to generate reference standard metrics.
2.13. Model
Model description
A multipurpose AI service (IRA LABS, registered medical device RU №2024/22895) was used for simultaneous detection of 16 predefined pathologies on chest–abdominal CT (Table 1).
The final release version (v6.1, Jan 2024) identical to the one deployed in clinical practice was applied without retraining or parameter changes. Input consisted of DICOM CT series; output was generated as DICOM SEG annotations and DICOM SR structured reports.
AI Service Inclusion and Exclusion Criteria
Inclusion criteria
Software registered as a certified medical device (MD) utilizing artificial intelligence (AI) technology in the official national registry of medical software. Software tested and validated within the Moscow Experiment—a large-scale governmental initiative for clinical deployment of computer vision AI in radiology [12]. Demonstrated diagnostic performance with ROC AUC ≥ 0.81 for each target pathology, in accordance with methodological recommendations [10,11]. Capability to analyze both chest and abdominal CT examinations within a single inference pipeline.
Exclusion criteria
AI products whose participation in the Moscow Experiment was suspended, discontinued, or failed official performance verification [12]. Systems limited to single-region analysis (e.g., chest-only AI) or lacking multiclass pathology detection capability.
The IRA LABS AI service (version 6.1, January 2024) was selected because it fulfilled all inclusion criteria and provided the broadest pathology coverage among eligible AI services participating in the Moscow Experiment [12].
Software and environment
The proprietary system was executed as an off-the-shelf product. Internal architecture, model parameters, and potential ensemble methods are not publicly disclosed by the developer. Inference was run on a workstation with AMD Ryzen 7 7700, 64 GB RAM, 480 GB SSD, and NVIDIA RTX 4060 (8 GB) GPU, using Ubuntu 22.04.
Initialization of model parameters
The pre-trained, production version of the AI model was used as released by the developer. No fine-tuning, weight reinitialization, or hyperparameter modification was performed for this study. The operating point (decision thresholds) was the vendor’s default, locked a priori and not tuned on the test set.
Training
Details of training approach
No additional training or fine-tuning was performed for this study. The AI service was applied as an off-the-shelf, production version (v6.1, Jan 2024) identical to the clinically deployed release.
Method of selecting the final model
The version used was previously chosen and locked by IRA LABS during its clinical validation within the Moscow Experiment on computer-vision technologies. No modifications were made for the present evaluation [12].
Ensembling techniques
The developer has not disclosed whether internal ensemble methods were used. For this study, a single instance of the AI service was applied for CT analysis, providing DICOM SEG annotations and structured text reports.
2.14. Evaluation
Metrics
Diagnostic performance of the AI system and radiologists was quantified using the area under the ROC curve (AUC, 95% CI via DeLong) [25]. For each of the 16 pathologies, True positives (TP), false positives (FP), true negatives (TN), and false negatives (FN) counts were recorded, and classification errors stratified as minor, intermediate, or major.
Robustness analysis
AUC was additionally calculated for clinically significant findings only to assess robustness for critical pathologies.
Methods for explainability
AI outputs were interpreted via DICOM SEG visualizations and structured text reports. Errors were cross-checked against the reference standard and categorized by clinical significance.
Data independence
BIMCV-COVID19+ had not been used in model training; all 229 CT studies were independent of the AI development data. Testing was limited to this single external dataset; no further external validation was available.
Comparison and Evaluation Methodology
Comparative analysis was performed using five structured 229×16 matrices (four human readers and one AI system), each containing binary presence/absence determina tions for all predefined pathologies. These matrices were compared with the expert consensus reference standard established by the two referees to derive the metrics described above.
For pathologies with quantitative thresholds (Table 1), the AI system applied predefined anatomical cut-offs (e.g., ≥ 40 mm for ascending aorta) based on DICOM SR measurements, while radiologists relied on visual assessment and manual measurements.
2.15. Outcomes
Primary outcome
TP, FP, TN, and FN for AI and human readers in detecting each of the 16 predefined pathologies (Table 1). All errors were stratified by clinical significance:
- Minor – no change in patient management or follow-up needed (examples: missed simple cysts <5 mm, false-positive osteosclerosis misclassified as rib fracture).
- Intermediate – unlikely to affect primary disease treatment but requiring further testing or follow-up (examples: false-positive enlarged lymph nodes, over-detection of small pulmonary nodules).
- Major – likely to change treatment strategy or primary diagnosis (examples: missed liver/renal masses, missed intrathoracic lymphadenopathy suggestive of metastases).
Expert radiologists assigned these classifications during consensus review based on potential impact on clinical decision-making.
Secondary outcomes
Area under the ROC curve (AUC) with 95% confidence intervals for each pathology and for the aggregated set, for both AI and radiologists.
Comparative analysis of AI versus radiologists using multi-reader multi-case (MRMC) methods.
Exploratory error review by experts after viewing AI outputs to categorize AI detections (not used as reference standard).
2.16. Sample size calculation
The minimum required sample size was estimated using the formula for a single proportion: n = Z² × P × (1-P) / d², where Z = 1.96 (95% confidence), P = 0.81 (expected sensitivity/specificity), and d = 0.10 (margin of error). This yielded approximately 59 cases with pathology. Assuming an average disease prevalence of 25% across the evaluated pathologies, the total required sample size was N = 59/0.25 ≈ 236 examinations. To compensate for potential data loss (artifacts, annotation errors) and the multifocal nature of the study (chest + abdomen), the planned sample was increased to 250. After exclusions, 229 studies remained for final analysis.
2.17. Statistical analysis
Statistical analysis was performed using RStudio (Build 467; RStudio, PBC, Boston, MA, USA) [29] with the irr [27] and pROC [24] packages. Data visualization was carried out with GraphPad Prism version 10.2.2 (GraphPad Software Inc., San Diego, CA, USA) [28]. Descriptive statistics were reported as absolute numbers (n) and proportions (%). Diagnostic performance was assessed using ROC analysis with calculation of AUC and 95% confidence intervals via DeLong’s method [25]. Comparisons between AI and radiologists used multi-reader multi-case DBM/OR analysis (RJafroc) [26]. To control for multiple testing across 16 pathologies, Benjamini–Hochberg correction (q = 0.05) was applied. A two-sided p < 0.05 was considered statistically significant.
3. Results
3.1. Overall diagnostic performance
In 229 chest–abdominal CT examinations independently interpreted by four radiologists and the AI system, the AI system produced 423 errors (11.5% of all evaluated features).
False positives predominated (n = 262; 61.9%) over false negatives (n = 161; 38.1%), whereas radiologists showed more false negatives (470–562) than false positives (5–27) (Figure 2).
3.2. Clinical significance of errors
All errors were stratified by clinical significance. For both radiologists and AI, minor errors were most frequent, followed by intermediate, with major errors being rare (Figure 3).
3.3. Breakdown of clinically significant AI errors
Major errors (false negatives, n = 20):
- Liver lesions (8);
- Renal lesions (2);
- Adrenal lesions (2);
- Impaired lung aeration (atelectasis, 2);
- Enlarged intrathoracic lymph nodes (3);
- Pulmonary nodule (1);
- Low vertebral body density (1);
- Urolithiasis (1) (Figure 4).
Intermediate errors (mostly false positives, n = 91):
- Intrathoracic lymph nodes (16);
- Pulmonary nodules (15);
- Impaired aeration (15);
- Aortic dilatation/aneurysm (10);
- Adrenal thickening (10) (Figure 5).
Minor errors (n = 266):
3.4. ROC analysis and AUC values
AUCs were calculated for each pathology and in aggregate for radiologists and AI (Table 2).
Aggregate AUC: AI = 0.88; highest radiologist = 0.81 (Figure 7).
Clinically significant findings only: mean AI AUC = 0.90 (Table 3).
3.5. Diagnostic performance categories
According to standard diagnostic categories, AI performance was predominantly excellent or good.
Urolithiasis was the only feature where AI showed inadequate performance.
Radiologists demonstrated poor or inadequate performance for several features, including:
- Aortic dilatation/aneurysm;
- Vertebral compression fractures;
- Rib fractures;
- Pulmonary artery dilatation;
- Low vertebral body density;
- •Increased epicardial fat volume here.
4. Discussion
In this multi-reader evaluation of 229 chest and abdominal CT examinations comprising 3,664 feature-level assessments, the multi-target AI service achieved an aggregate AUC of 0.88 (95% CI 0.87–0.89), outperforming the four independent radiologists (AUC 0.78–0.81) (Table 2, Figure 7). Diagnostic performance was good to excellent for most of the 16 predefined targets. The AI demonstrated clear advantages in vascular, osseous, and morphometric findings, while showing relative deficits for solid-organ masses and airspace disease. The only unsatisfactory target was urolithiasis (AUC ≈ 0.52), which persisted in sensitivity analysis (AUC 0.55). Across modalities, commercial AI shows target-dependent performance, e.g., for airspace disease on chest radiographs [17].
Although the AI system produced more false positives than false negatives (61.9% vs 38.1%), clinically important AI errors were rare—only 0.63% of all assessed instances—and were mainly missed focal lesions. Stratification of errors revealed that 94.6% of AI mistakes were minor or intermediate. Intermediate false positives often reflected adjacency or merging artifacts and vascular–nodal confusion, whereas minor errors were primarily tiny cysts and rib fracture overcalls. The AI’s superiority in measuring diameters, densities, calcifications, and vertebral deformities likely stems from stable morphometric cues, whereas parenchymal textures and small solid-organ lesions remain more challenging. Its underperformance in urolithiasis plausibly relates to protocol sensitivity: many cases were contrast-enhanced only, whereas optimal stone detection requires non-contrast CT [22].
Although our final sample size (n=229) was slightly below the a priori calculated requirement (n=236), the impact on precision was minimal, increasing the margin of error from ±10.0% to ±10.2%. The narrow confidence intervals observed for most AUC estimates suggest adequate statistical power was maintained
Our aggregate results align with recent meta-analyses [20,21] reporting that state-of-the-art imaging AI reaches AUC ≈ 0.86–0.94 and, in selected tasks, can match or surpass individual radiologists [21,23]. The complementary patterns of liberal AI (more FP) and conservative readers (more FN) suggest that hybrid strategies—such as triage or double-reading—may reduce important misses while managing FP burden [23]. Incorrect AI outputs can influence readers’ decisions, underscoring the need for guardrails in hybrid workflows [18]. Similar FP–FN patterns have been synthesized in systematic reviews of AI error characteristics [16].
4.1. Strengths and limitations
Key strengths include:
Multi-reader design with blinded interpretation and expert consensus reference standard;
Simultaneous evaluation of 16 diverse targets, enabling a comprehensive view of performance;
Stratification of errors by clinical significance, which provides insights beyond raw sensitivity and specificity.
Interpretive pitfalls and potential automation bias necessitate procedural safeguards and reader training [15].
Limitations include:
Single external dataset, limiting generalizability across protocols and institutions;
Protocol heterogeneity within BIMCV-COVID19+ and incomplete non-contrast phases for some studies;
Lack of transparency regarding the proprietary model’s architecture and potential ensembling strategies;
Translation from curated datasets to clinical applicability can vary across modalities and tasks [14];
Absence of formal inter-reader variability analysis and external validation on independent cohorts. Limitations of AI services observed in radiography evaluations further argue for protocol-aware validation [19].
4.2. Public Health Implications
Use of multi-target CT AI may improve early detection of significant findings, speed up reporting, and optimize resource use—critical for systems facing radiologist shortages. Such deployment could enhance population-level outcomes and reduce costs from delayed diagnoses, but requires careful monitoring of error profiles, protocol harmonization, and adherence to evidence-based standards to ensure equitable, safe benefits.
4.3. Future directions
Perform multi-center replication with protocol-aware validation to ensure robustness across scanners and acquisition techniques;
Explore operating point calibration or task-specific thresholds to optimize the FP–FN balance;
Develop targeted refinements for small solid-organ lesions, parenchymal textures, and urolithiasis detection;
Investigate workflow integration strategies, including triage, double reading, or AI-assisted decision support, to translate performance gains into clinical benefit.
Evaluate the economic and public health impact of multi-target AI deployment, including cost-effectiveness analyses, resource allocation, and potential reductions in population-level morbidity and healthcare expenditures.
5. Conclusions
A clinically deployed multi-target AI service demonstrated high diagnostic accuracy on chest and abdominal CT across 16 predefined features, outperforming individual radiologists on several vascular, osseous, and morphometric targets while underperforming on urolithiasis and small solid-organ lesions. Clinically important AI errors were rare and predominantly involved missed focal lesions. These findings support the use of multi-target AI as a complementary second reader, provided protocol alignment is ensured and error profiles are prospectively monitored. Future multi-center validations and workflow studies are warranted to confirm generalizability and define optimal integration strategies in routine practice.
Author Contributions
Conceptualization, V.A. Gombolevskiy and V.Y. Chernina; methodology, V.A. Nechaev, N.Y. Kashtanova, E.V. Kopeikin, U.M. Magomedova, V.Y. Chernina and V.A. Gombolevsky; validation and formal analysis, V.A. Nechaev, N.Y. Kashtanova, E.V. Kopeikin and U.M. Magomedova, M.S. Gribkova; investigation and data curation, V.A. Nechaev, N.Y. Kashtanova, E.V. Kopeikin, U.M. Magomedova, A.V. Hardin, V.D. Sanikovich and M.I. Sekacheva; writing—original draft preparation, V.A. Gombolevskiy and V.A. Nechaev; writing—review and editing, all authors; visualization, V.A. Nechaev and M.S. Gribkova; supervision, V.Y. Chernina and V.A. Gombolevsky; project administration, V.A. Gombolevskiy; funding acquisition, not applicable. All authors have read and agreed to the published version of the manuscript.
Funding
This research received no external funding. The APC was funded by the authors’ institutions.
Institutional Review Board Statement
The study was conducted in accordance with the Declaration of Helsinki and was approved by the Institutional Review Board of Moscow City Clinical Hospital No. 1 (protocol approved on 1 March 2024). The original BIMCV-COVID19+ dataset had prior ethical approval from the Hospital Arnau de Vilanova, Valencia (CElm: 12/2020).
Informed Consent Statement
Patient consent was waived because only de-identified, publicly available data were analyzed, and no individual could be identified from the materials used in this study.
Data Availability Statement
Publicly available data from the BIMCV-COVID19+ initiative were analyzed in this study (https://bimcv.cipf.es/bimcv-projects/bimcv-covid19/ – accessed on 16 September 2025). Derived, de-identified result tables and R/GraphPad summaries are available from the corresponding author on reasonable request.
Acknowledgments
We thank the BIMCV consortium and the Valencia-region hospitals for curating and sharing the dataset, and our colleagues for valuable feedback on early drafts of this manuscript. Editorial assistance was provided using ChatGPT (GPT-5, OpenAI) for language refinement. The authors reviewed and edited all content and are fully responsible for the final version.
Conflicts of Interest
Several authors are employees or advisors of IRA LABS, the producer of the evaluated AI service. To address potential conflicts a priori, we (i) prespecified the evaluation protocol, eligibility criteria, endpoints, and statistical analysis plan; (ii) used a public dataset (BIMCV-COVID19+) external to IRA LABS for all imaging; (iii) ensured that initial readings, discrepancy resolution, and the consensus reference standard were performed solely by radiologists who are not IRA LABS employees and were blinded to developer identities; (iv) instituted a data lock before manuscript drafting; (v) limited IRA LABS contributors’ role to providing the off--the--shelf, commercially released AI service at its default operating point; and (vi) excluded IRA LABS personnel from re--reading or adjudicating AI outputs. The company had no influence on inclusion/exclusion of cases or results. All authors affirm that these safeguards were implemented and that the analyses faithfully represent the findings.
Abbreviations
The following abbreviations are used in this manuscript:
| AI | Artificial intelligence |
| CT | Computed tomography |
| AUC | Area under the ROC curve |
| ROC | Receiver operating characteristic |
| CI | Confidence interval |
| DICOM | Digital Imaging and Communications in Medicine |
| SR | Structured report |
| IRB | Institutional review board |
| APC | Article processing charge |
| MRMC | Multi-reader multi-case |
| HU | Hounsfield unit |
| TP | True positive |
| FP | False positive |
| TN | True negative |
| FN | False negative |
| CAC | Coronary artery calcification |
| UMLS | Unified Medical Language System |
| BIMCV-COVID19+ | Biomedical Imaging and COVID-19 dataset (Valencia region) |
References
- Katal, S.; York, B.; Gholamrezanezhad, A. AI in Radiology: From Promise to Practice—A Guide to Effective Integration. Eur. J. Radiol. 2024, 181, 111798. [Google Scholar] [CrossRef]
- Buijs, E.; Maggioni, E.; Mazziotta, F.; et al. Clinical Impact of AI in Radiology Department Management: A Systematic Review. Radiol. Med. 2024, 129(11), 1656–1666. [Google Scholar] [CrossRef]
- Pokataev, I.A.; Dudina, I.A.; Kolomiets, L.A.; et al. Ovarian Cancer, Primary Peritoneal Cancer, and Fallopian Tube Cancer: Practical Recommendations of RUSSCO, Part 1. 2. Malignant Tumors [In Russian]. 2024, 14(3s2), 82–101. [Google Scholar] [CrossRef]
- Chernina, V.Yu.; Belyaev, M.G.; Silin, A.Yu.; et al. Diagnostic and Economic Evaluation of a Comprehensive Artificial Intelligence Algorithm for Detecting Ten Pathological Findings on Chest Computed Tomography. Digit. Diagnostics [In Russian]. 2023, 4(2), 105–132. [Google Scholar] [CrossRef]
- Wildman-Tobriner, B.; Allen, B.C.; Maxfield, C.M. Common Resident Errors When Interpreting Computed Tomography of the Abdomen and Pelvis: A Review of Types, Pitfalls, and Strategies for Improvement. Curr. Probl. Diagn. Radiol. 2019, 48(1), 4–9. [Google Scholar] [CrossRef]
- Nechaev, V.A.; Vasiliev, A.Yu. Risk Factors for Perception Errors among Radiologists in the Analysis of Imaging Studies. Vestnik SurGU. Medicine [In Russian]. 2024, 17(4), 14–22. [Google Scholar] [CrossRef]
- Mongan, J.; Moy, L. Kahn, C.E., Jr. Checklist for Artificial Intelligence in Medical Imaging (CLAIM): A Guide for Authors and Reviewers. Radiol. Artif. Intell. 2020, 2(2), e200029. [Google Scholar] [CrossRef] [PubMed]
- Bossuyt, P.M.; et al. STARD 2015: An Updated List of Essential Items for Reporting Diagnostic Accuracy Studies. BMJ 2015, 351, h5527. [Google Scholar] [CrossRef] [PubMed]
- de la Iglesia Vayá, M.; Saborit-Torres, J.M.; Serrano, J.A.M.; et al. BIMCV COVID-19: A Large Annotated Dataset of RX and CT Images from COVID-19 Patients. IEEE Dataport 2021. https://doi.org/10.21227/m4j2-ap59 (accessed on 16 September 2025).
- Gombolevskiy, V.A.; Masri, A.G.; Kim, S.Y.; Morozov, S.P. Manual for Radiology Technicians on Performing CT Examination Protocols. Methodological Guidelines No. 17; SBHI “SPCC for Diagnostics and Telemedicine Tech.”, Moscow Healthcare Dept.: Moscow, Russia, 2017; 56 p. [In Russian].
- Morozov, S.P.; Vladzimirskiy, A.V.; Klyashtorny, V.G.; et al. Clinical Trials of Software Based on Intelligent Technologies (Radiology). Best Practices in Radiology and Instrumental Diagnostics, Issue 23; SBHI “SPCC for Diagnostics and Telemedicine Tech.”: Moscow, Russia, 2019; 33 p. [In Russian].
- Vasiliev, Yu.A., Ed. Computer Vision in Radiology: The First Stage of the Moscow Experiment, 2nd rev. and exp. ed.; Izdatelskie Resheniya: Moscow, Russia, 2023; 376 p. [In Russian].
- Kulberg, N.S.; Reshetnikov, R.V.; Novik, V.P.; et al. Variability of Reports in CT Interpretation: One for All and All for One. Digit. Diagnostics [In Russian]. 2021, 2(2), 105–118. [Google Scholar] [CrossRef]
- Pedrosa, J.; Aresta, G.; Ferreira, C.; et al. Assessing Clinical Applicability of COVID-19 Detection in Chest Radiography with Deep Learning. Sci. Rep. 2022, 12, 6596. [Google Scholar] [CrossRef]
- Behzad, S.; Tabatabaei, S.M.H.; Lu, M.Y.; et al. Pitfalls in Interpretive Applications of AI in Radiology. AJR Am. J. Roentgenol. 2024, 223(4), e2431493. [Google Scholar] [CrossRef]
- Zeng, A.; Houssami, N.; Noguchi, N.; et al. Frequency and Characteristics of AI Errors in Screening Mammography: A Systematic Review. Breast Cancer Res. Treat. 2024, 207(1), 1–13. [Google Scholar] [CrossRef]
- Lind Plesner, L.; Müller, F.C.; Brejnebøl, M.W.; et al. Commercially Available Chest Radiograph AI Tools for Detecting Airspace Disease, Pneumothorax, and Pleural Effusion. Radiology 2023, 308(3), e231236. [Google Scholar] [CrossRef]
- Bernstein, M.H.; Atalay, M.K.; Dibble, E.H.; et al. Can Incorrect AI Results Impact Radiologists? A Multi-Reader Pilot Study of Lung Cancer Detection with Chest Radiography. Eur. Radiol. 2023, 33(11), 8263–8269. [Google Scholar] [CrossRef] [PubMed]
- Vasiliev, Yu.A.; Vladzimirskiy, A.V.; Arzamasov, K.M.; et al. Limitations in the Application of AI Services for Chest Radiograph Analysis. Digit. Diagnostics [In Russian]. 2024, 5(3), 407–420. [Google Scholar] [CrossRef]
- Vasiliev, Yu.A.; Vladzimirskiy, A.V.; Omelyanskaya, O.V.; et al. A Review of Meta-Analyses on the Application of AI in Radiology. Med. Vis. [In Russian]. 2024, 28(3), 22–41. [Google Scholar] [CrossRef]
- Aggarwal, R.; Sounderajah, V.; Martin, G.; et al. Diagnostic Accuracy of Deep Learning in Medical Imaging: A Systematic Review and Meta-Analysis. NPJ Digit. Med. 2021, 4(1), 65. [Google Scholar] [CrossRef]
- Räty, P.; Mentula, P.; Lampela, H.; et al. Intravenous Contrast CT versus Native CT in Acute Abdomen with Impaired Renal Function (INCARO): Study Protocol. BMJ Open 2020, 10(10), e037928. [Google Scholar] [CrossRef]
- Seah, J.C.Y.; Tang, C.H.M.; Buchlak, Q.D.; et al. Effect of a Comprehensive Deep-Learning Model on Chest X-Ray Interpretation Accuracy: A Retrospective MRMC Study. Lancet Digit. Health 2021, 3(8), e496–e506. [Google Scholar] [CrossRef]
- Robin, X.; Turck, N.; Hainard, A.; et al. pROC: An Open-Source Package to Analyze and Compare ROC Curves. BMC Bioinform. 2011, 12, 77. [Google Scholar] [CrossRef]
- DeLong, E.R.; DeLong, D.M.; Clarke-Pearson, D.L. Comparing the Areas under Two or More Correlated ROC Curves: A Nonparametric Approach. Biometrics 1988, 44(3), 837–845. [Google Scholar] [CrossRef]
- Chakraborty, D.P. Observer Performance Methods for Diagnostic Imaging: Foundations, Modeling, and Applications with R-Based Examples; CRC Press: Boca Raton, FL, USA, 2017.
- Gamer, M.; Lemon, J.; Fellows, I.; Singh, P. irr: Various Coefficients of Interrater Reliability and Agreement. R Package Version 0.84.1. Available online: https://CRAN.R-project.org/package=irr (accessed on 16 September 2025).
- GraphPad Software. GraphPad Prism, Version 10.2.2; 2024. Available online: https://www.graphpad.com/ (accessed on 16 September 2025).
- RStudio Team. RStudio (Posit); 2023. Available online: https://posit.co/ (accessed on 16 September 2025).
Figure 1.
Study Design. From 250 CT examinations screened, 21 were excluded for technical/protocol deviations, yielding 229 studies. Four radiologists independently interpreted each study; one compiler radiologist converted all reports (4 radiologists + AI) into standardized tables; two expert referees reviewed original DICOM images and tables to establish the consensus reference standard. Performance of AI and radiologists was then evaluated against this reference.
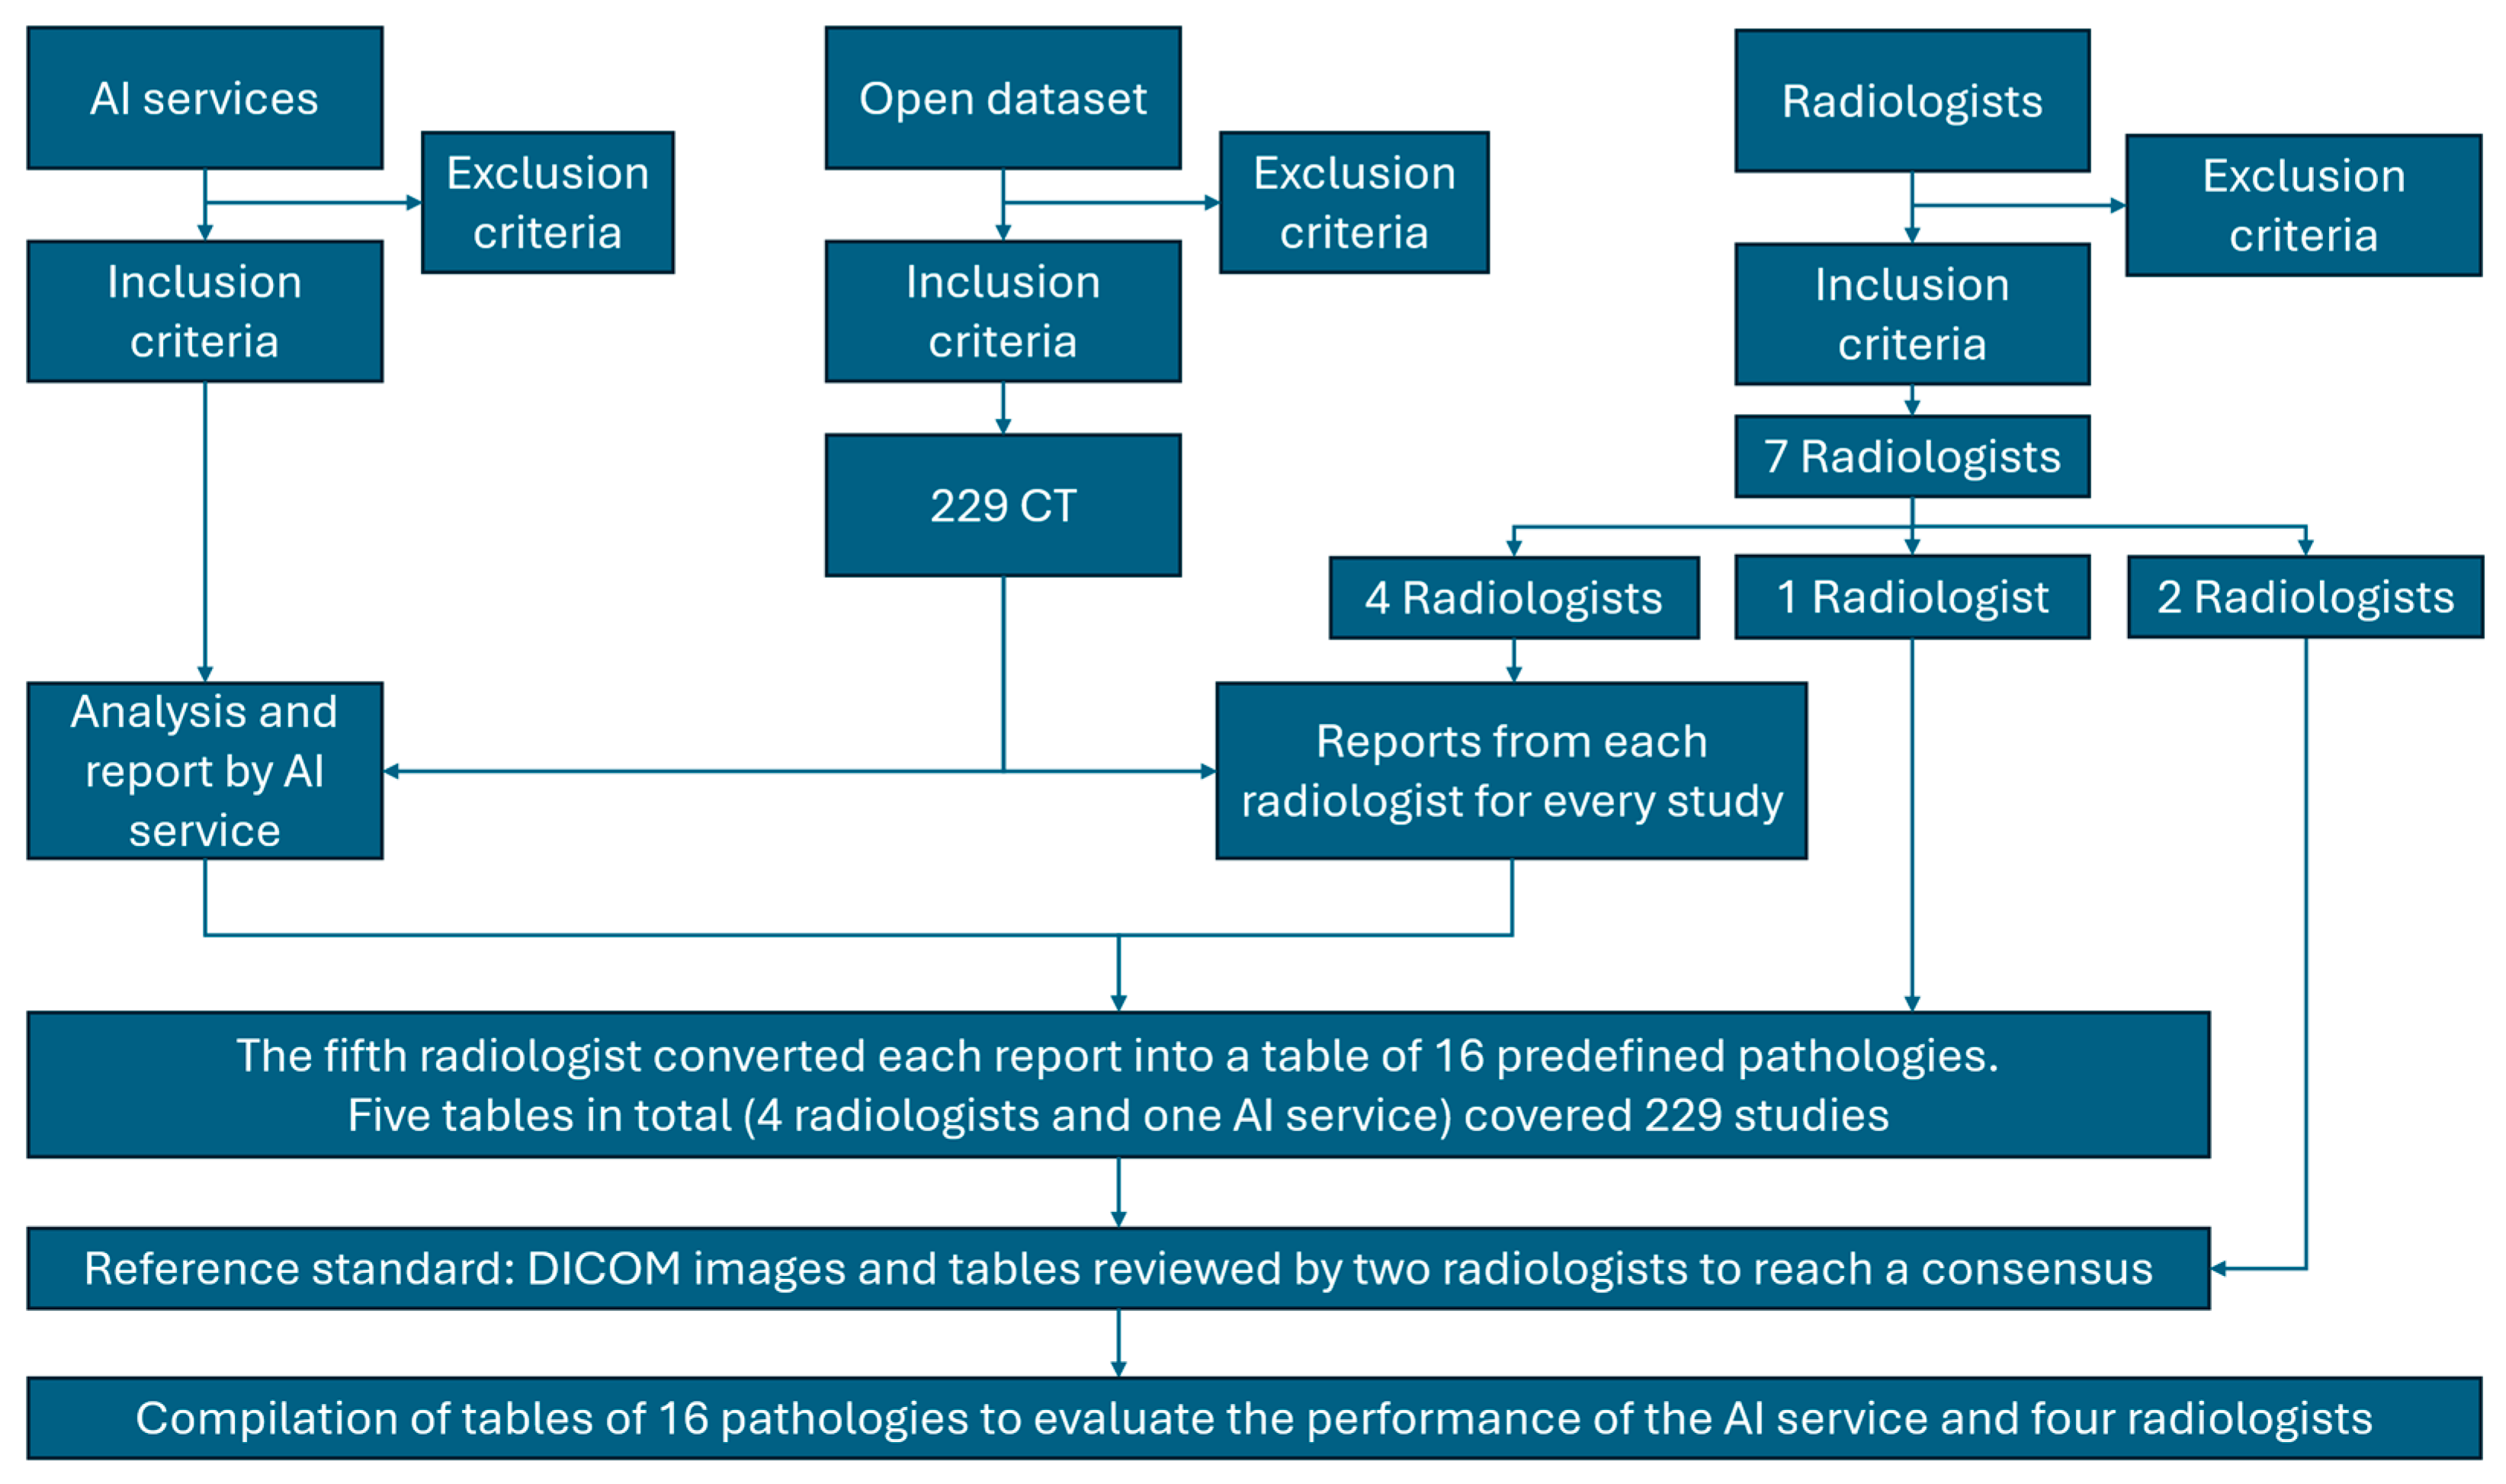
Figure 2.
Bar charts showing the relative numbers of TP, TN, FP, FN, true (TP+TN) and false (FP+FN) responses; whiskers = 95% CI.. AI exhibited a more liberal operating point (higher FP, lower FN) than individual radiologists.
Figure 2.
Bar charts showing the relative numbers of TP, TN, FP, FN, true (TP+TN) and false (FP+FN) responses; whiskers = 95% CI.. AI exhibited a more liberal operating point (higher FP, lower FN) than individual radiologists.
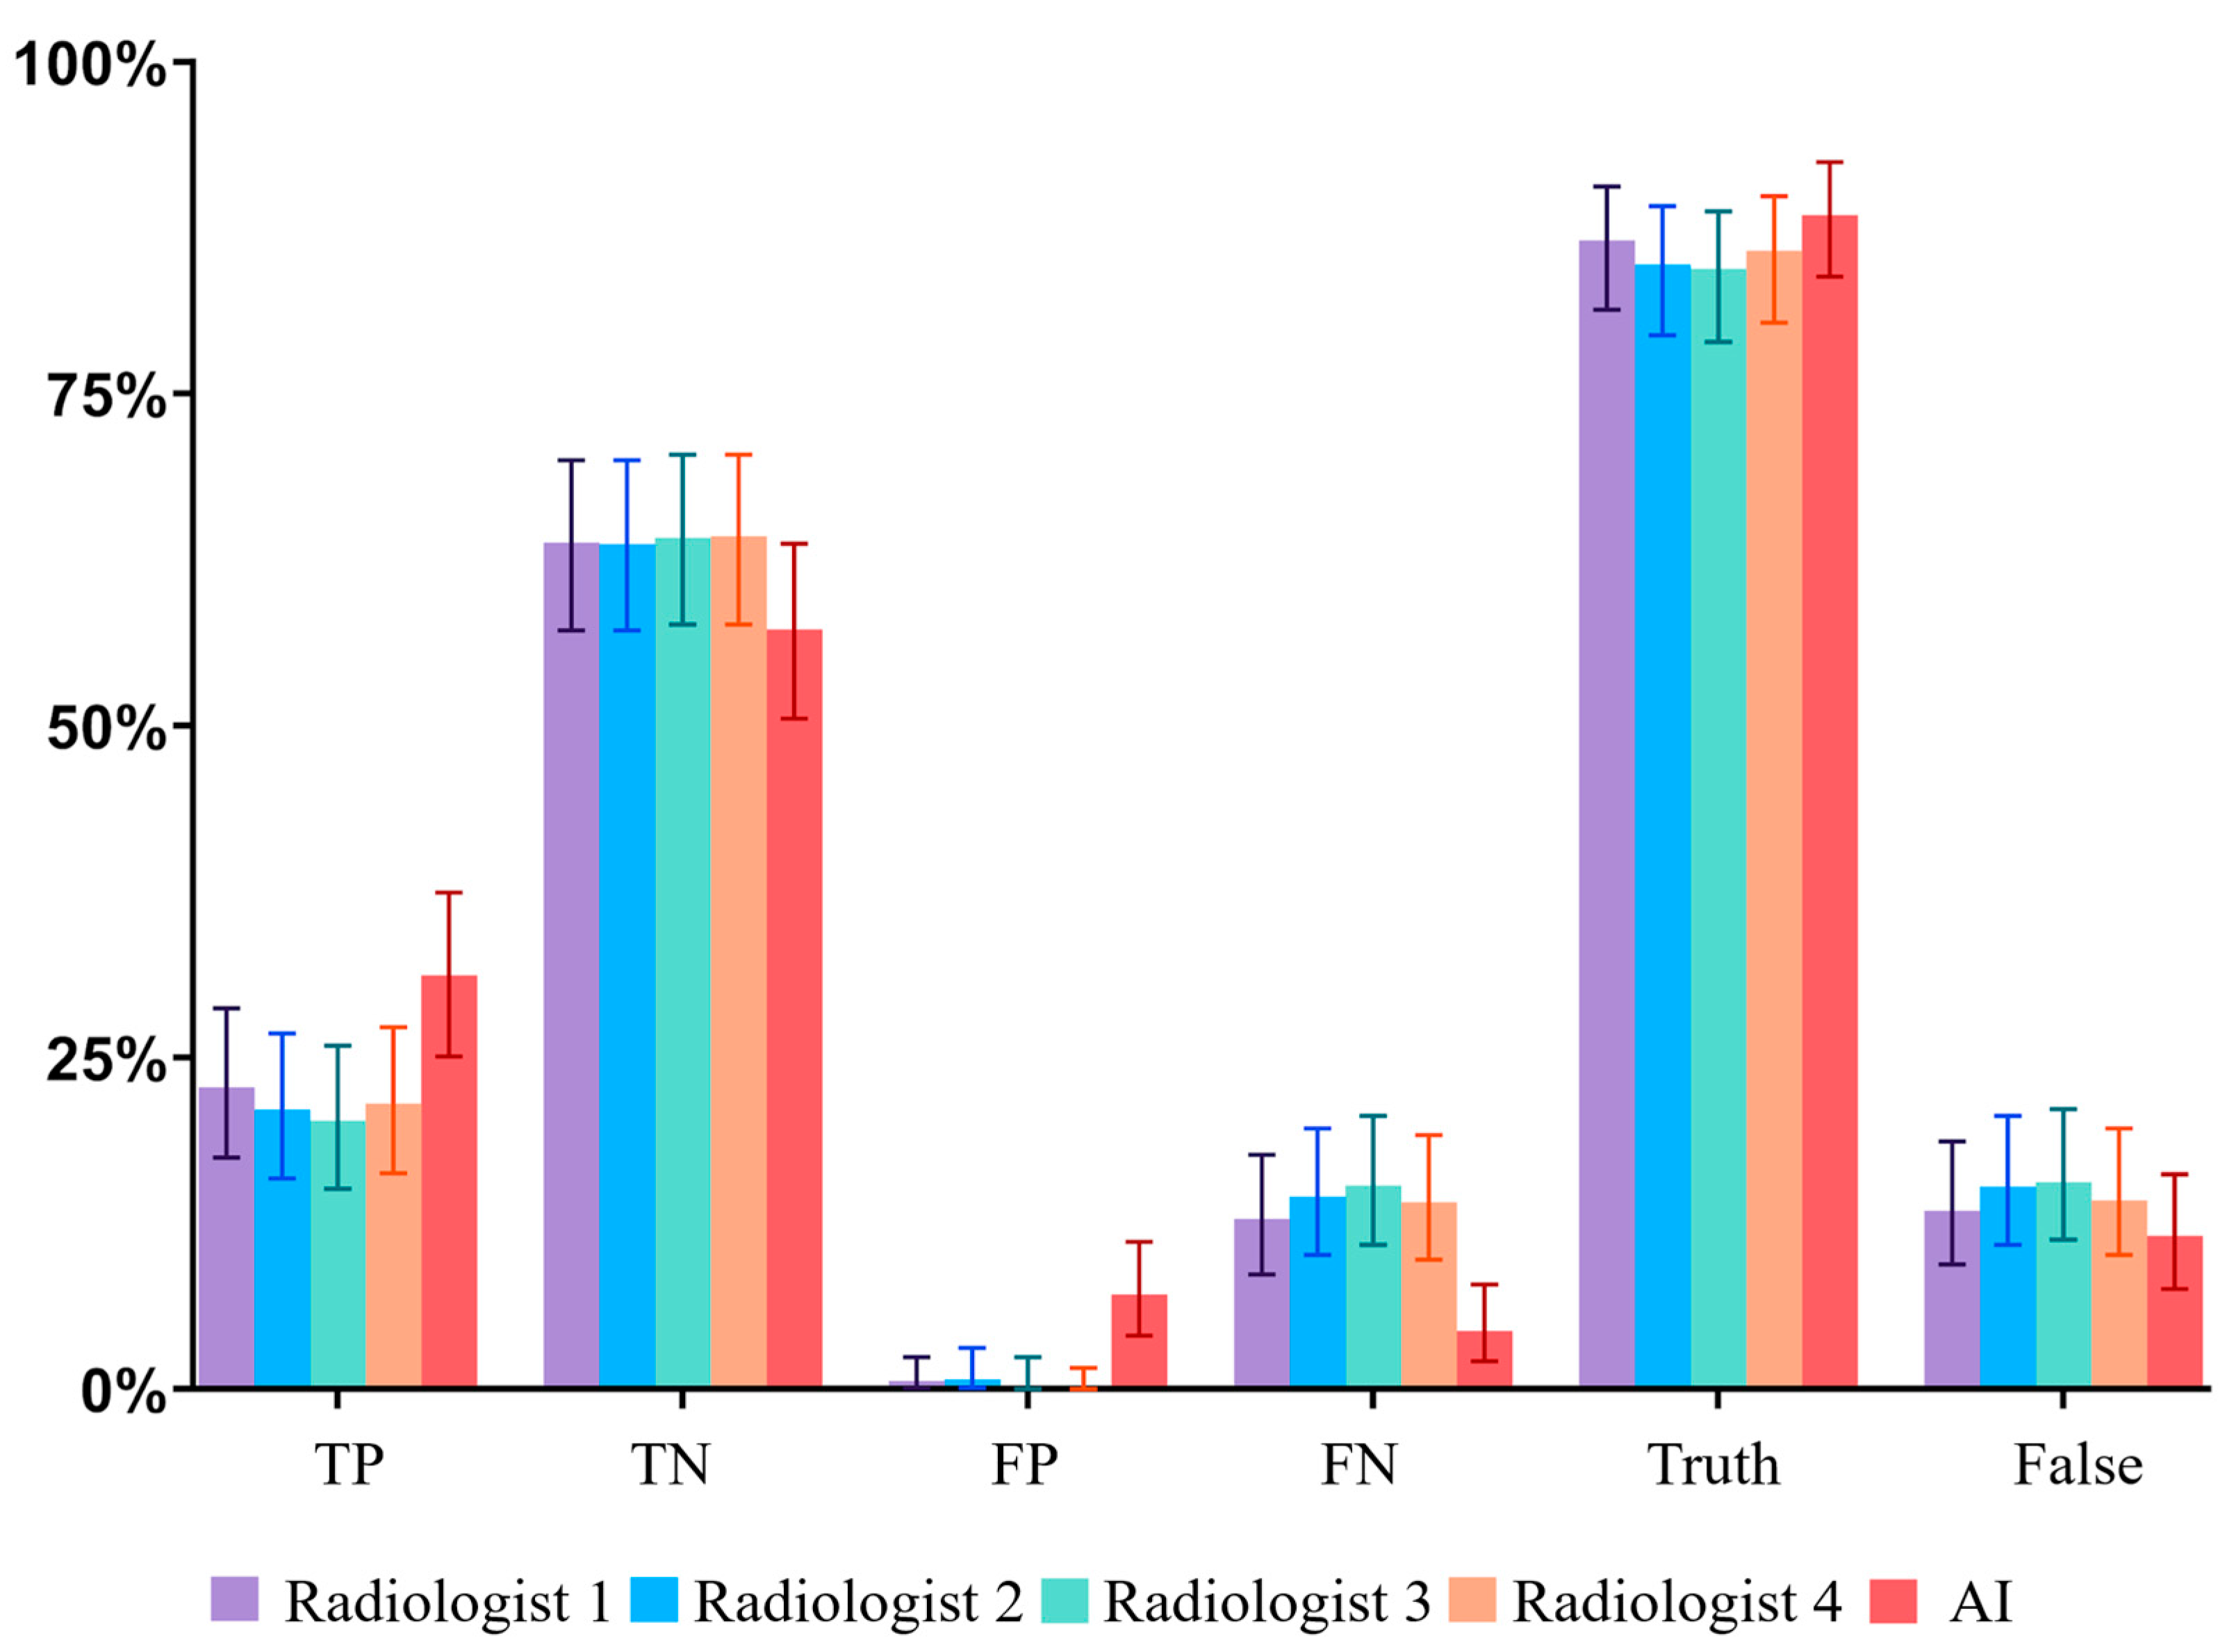
Figure 3.
Absolute numbers of false responses (FP+FN) by clinical significance for physicians and AI. Only 5.4% of AI errors were classified as important; ≈0.63% of all assessed instances represented clinically important AI errors.
Figure 3.
Absolute numbers of false responses (FP+FN) by clinical significance for physicians and AI. Only 5.4% of AI errors were classified as important; ≈0.63% of all assessed instances represented clinically important AI errors.
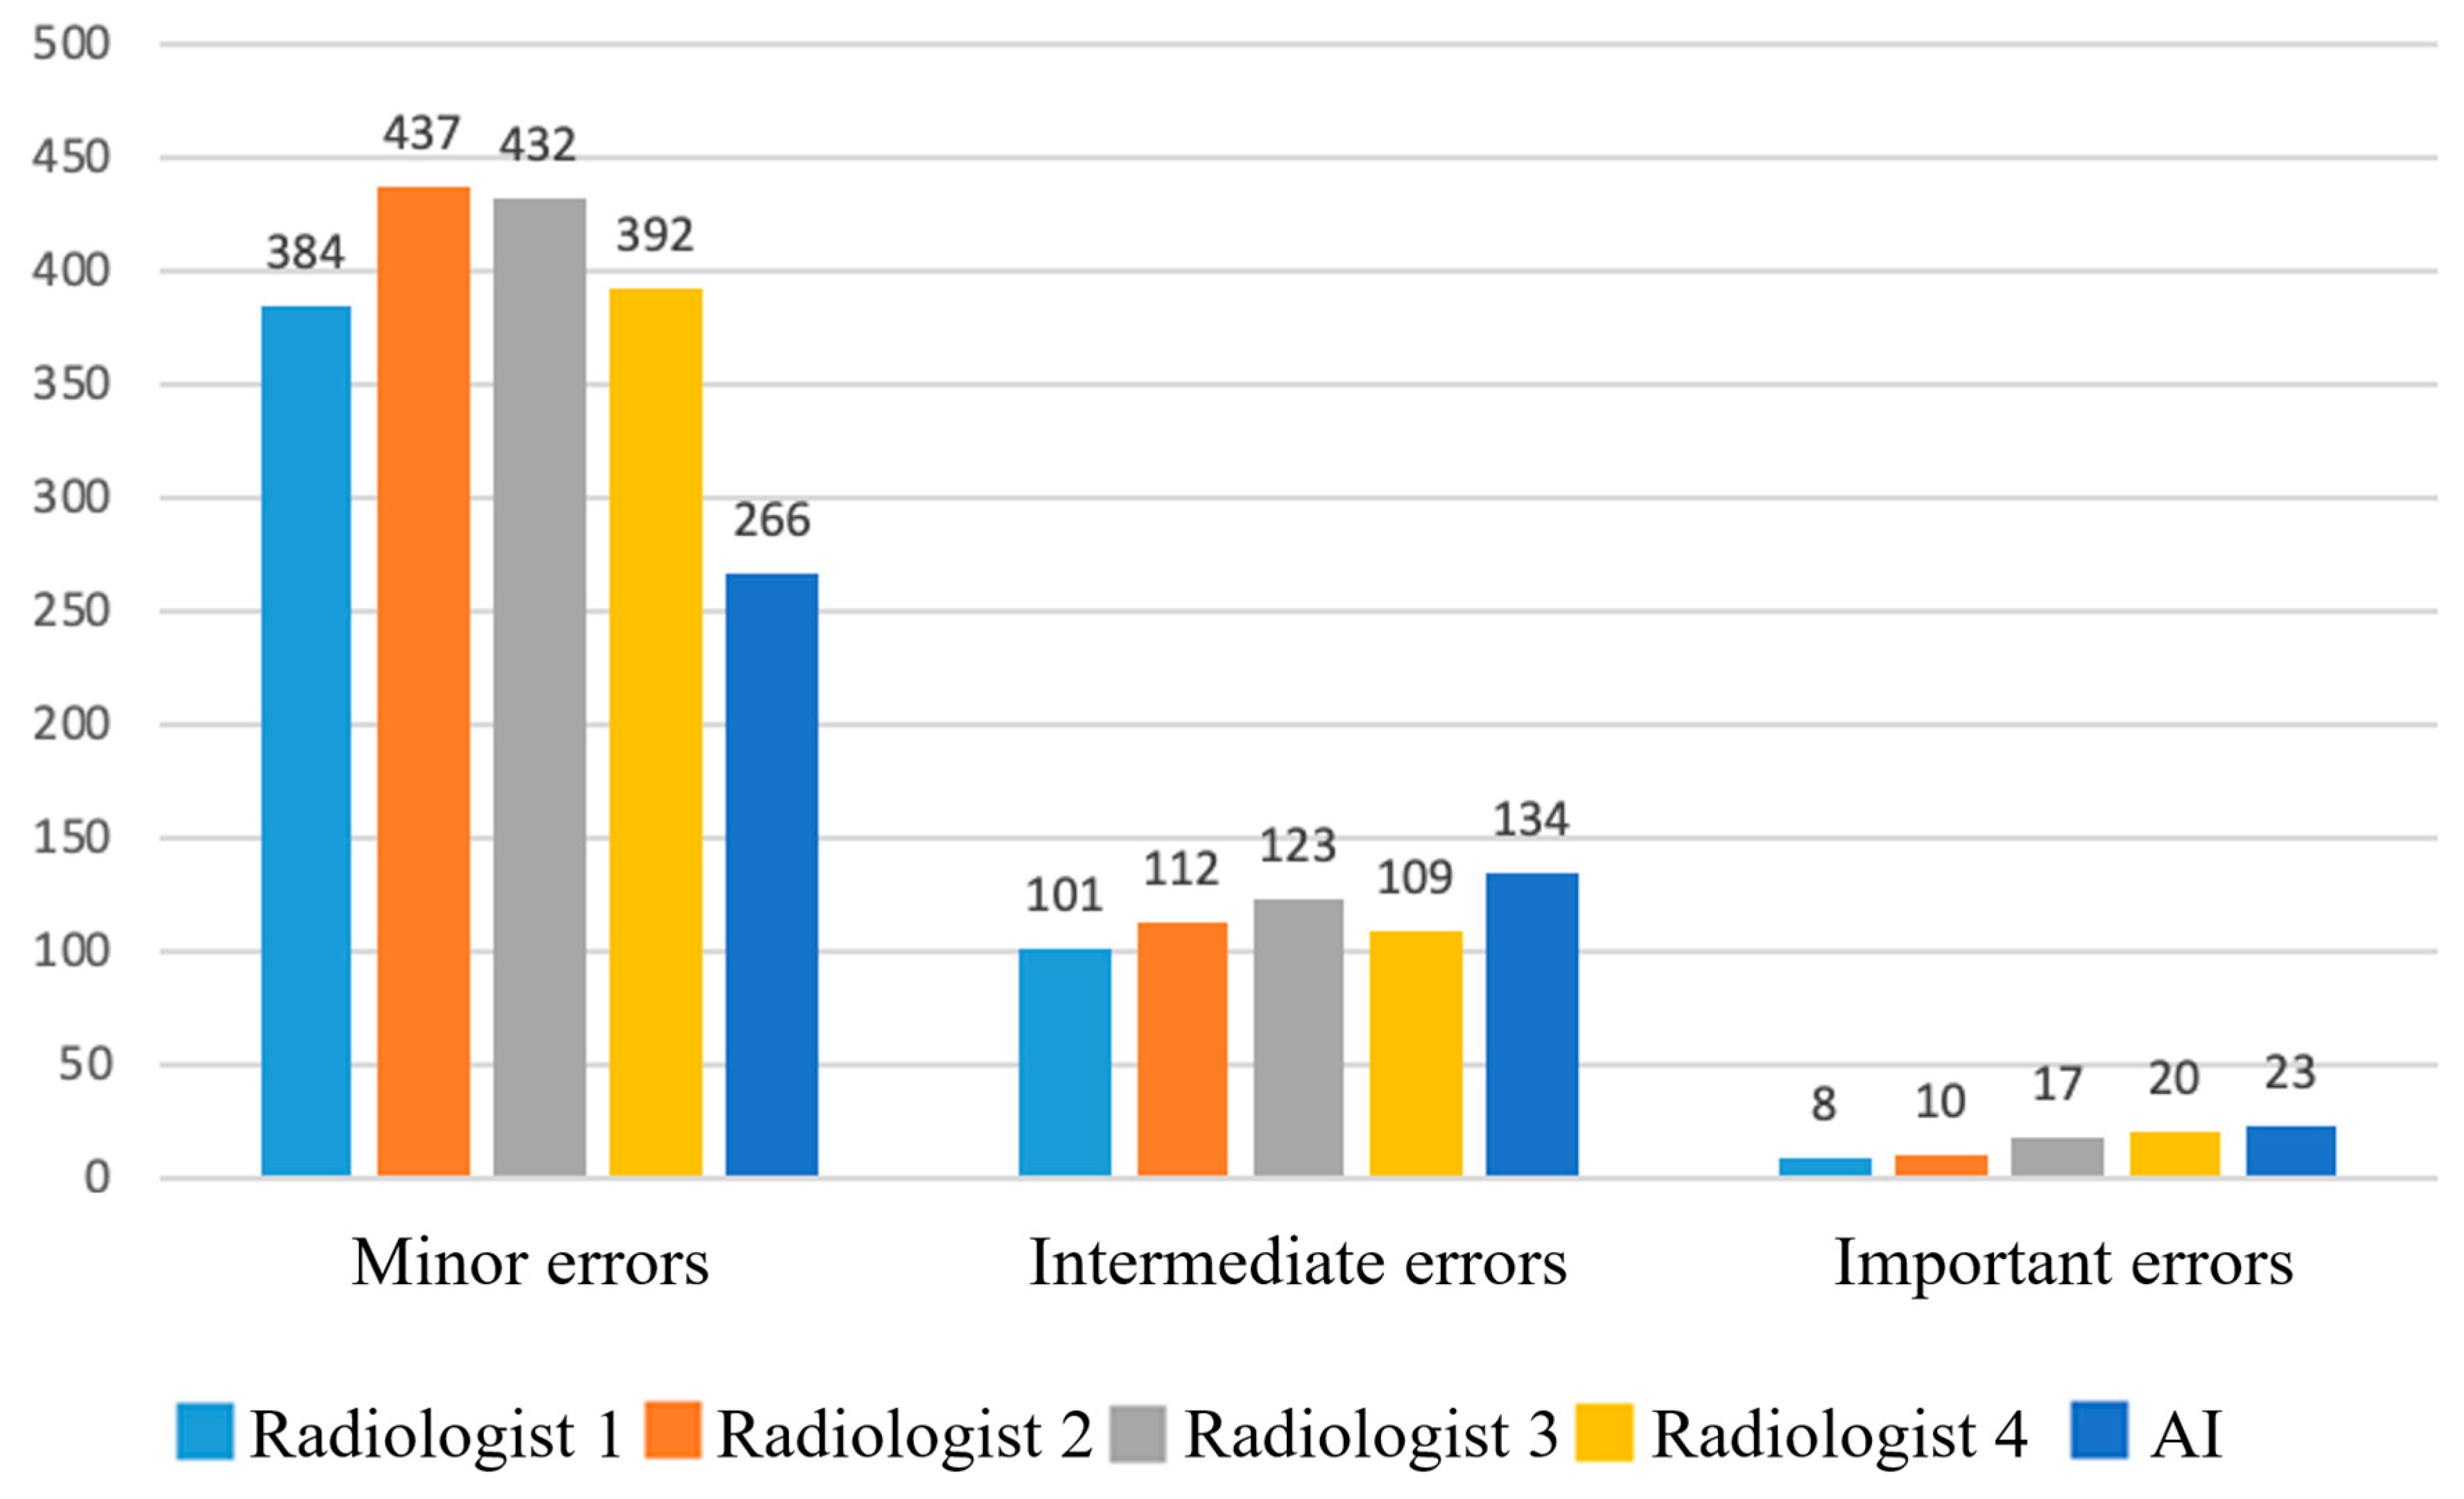
Figure 4.
CT of the chest (a) and abdomen (b–d) after AI processing. Clinically significant findings missed by the AI that could substantially affect patient outcomes (false-negative errors). No segmentation (missed pathology): (a) Enlarged intrathoracic lymph nodes (black arrow), possibly representing metastases. False-negative error by the AI service. In addition, the AI correctly labeled the pulmonary lesion and rib numbering. (b) Left adrenal mass (white arrow), possibly a tumor or metastasis. False-negative error by the AI service. The AI correctly measured the abdominal aortic diameter and labeled rib numbering. (c) Hypovascular liver mass (yellow arrow), possibly a metastasis. False-negative error by the AI service. The AI correctly measured the abdominal aortic diameter and labeled rib numbering. (d) Right renal mass (orange arrow), possibly a tumor. False-negative error by the AI service. The AI correctly measured the abdominal aortic diameter and labeled rib numbering.
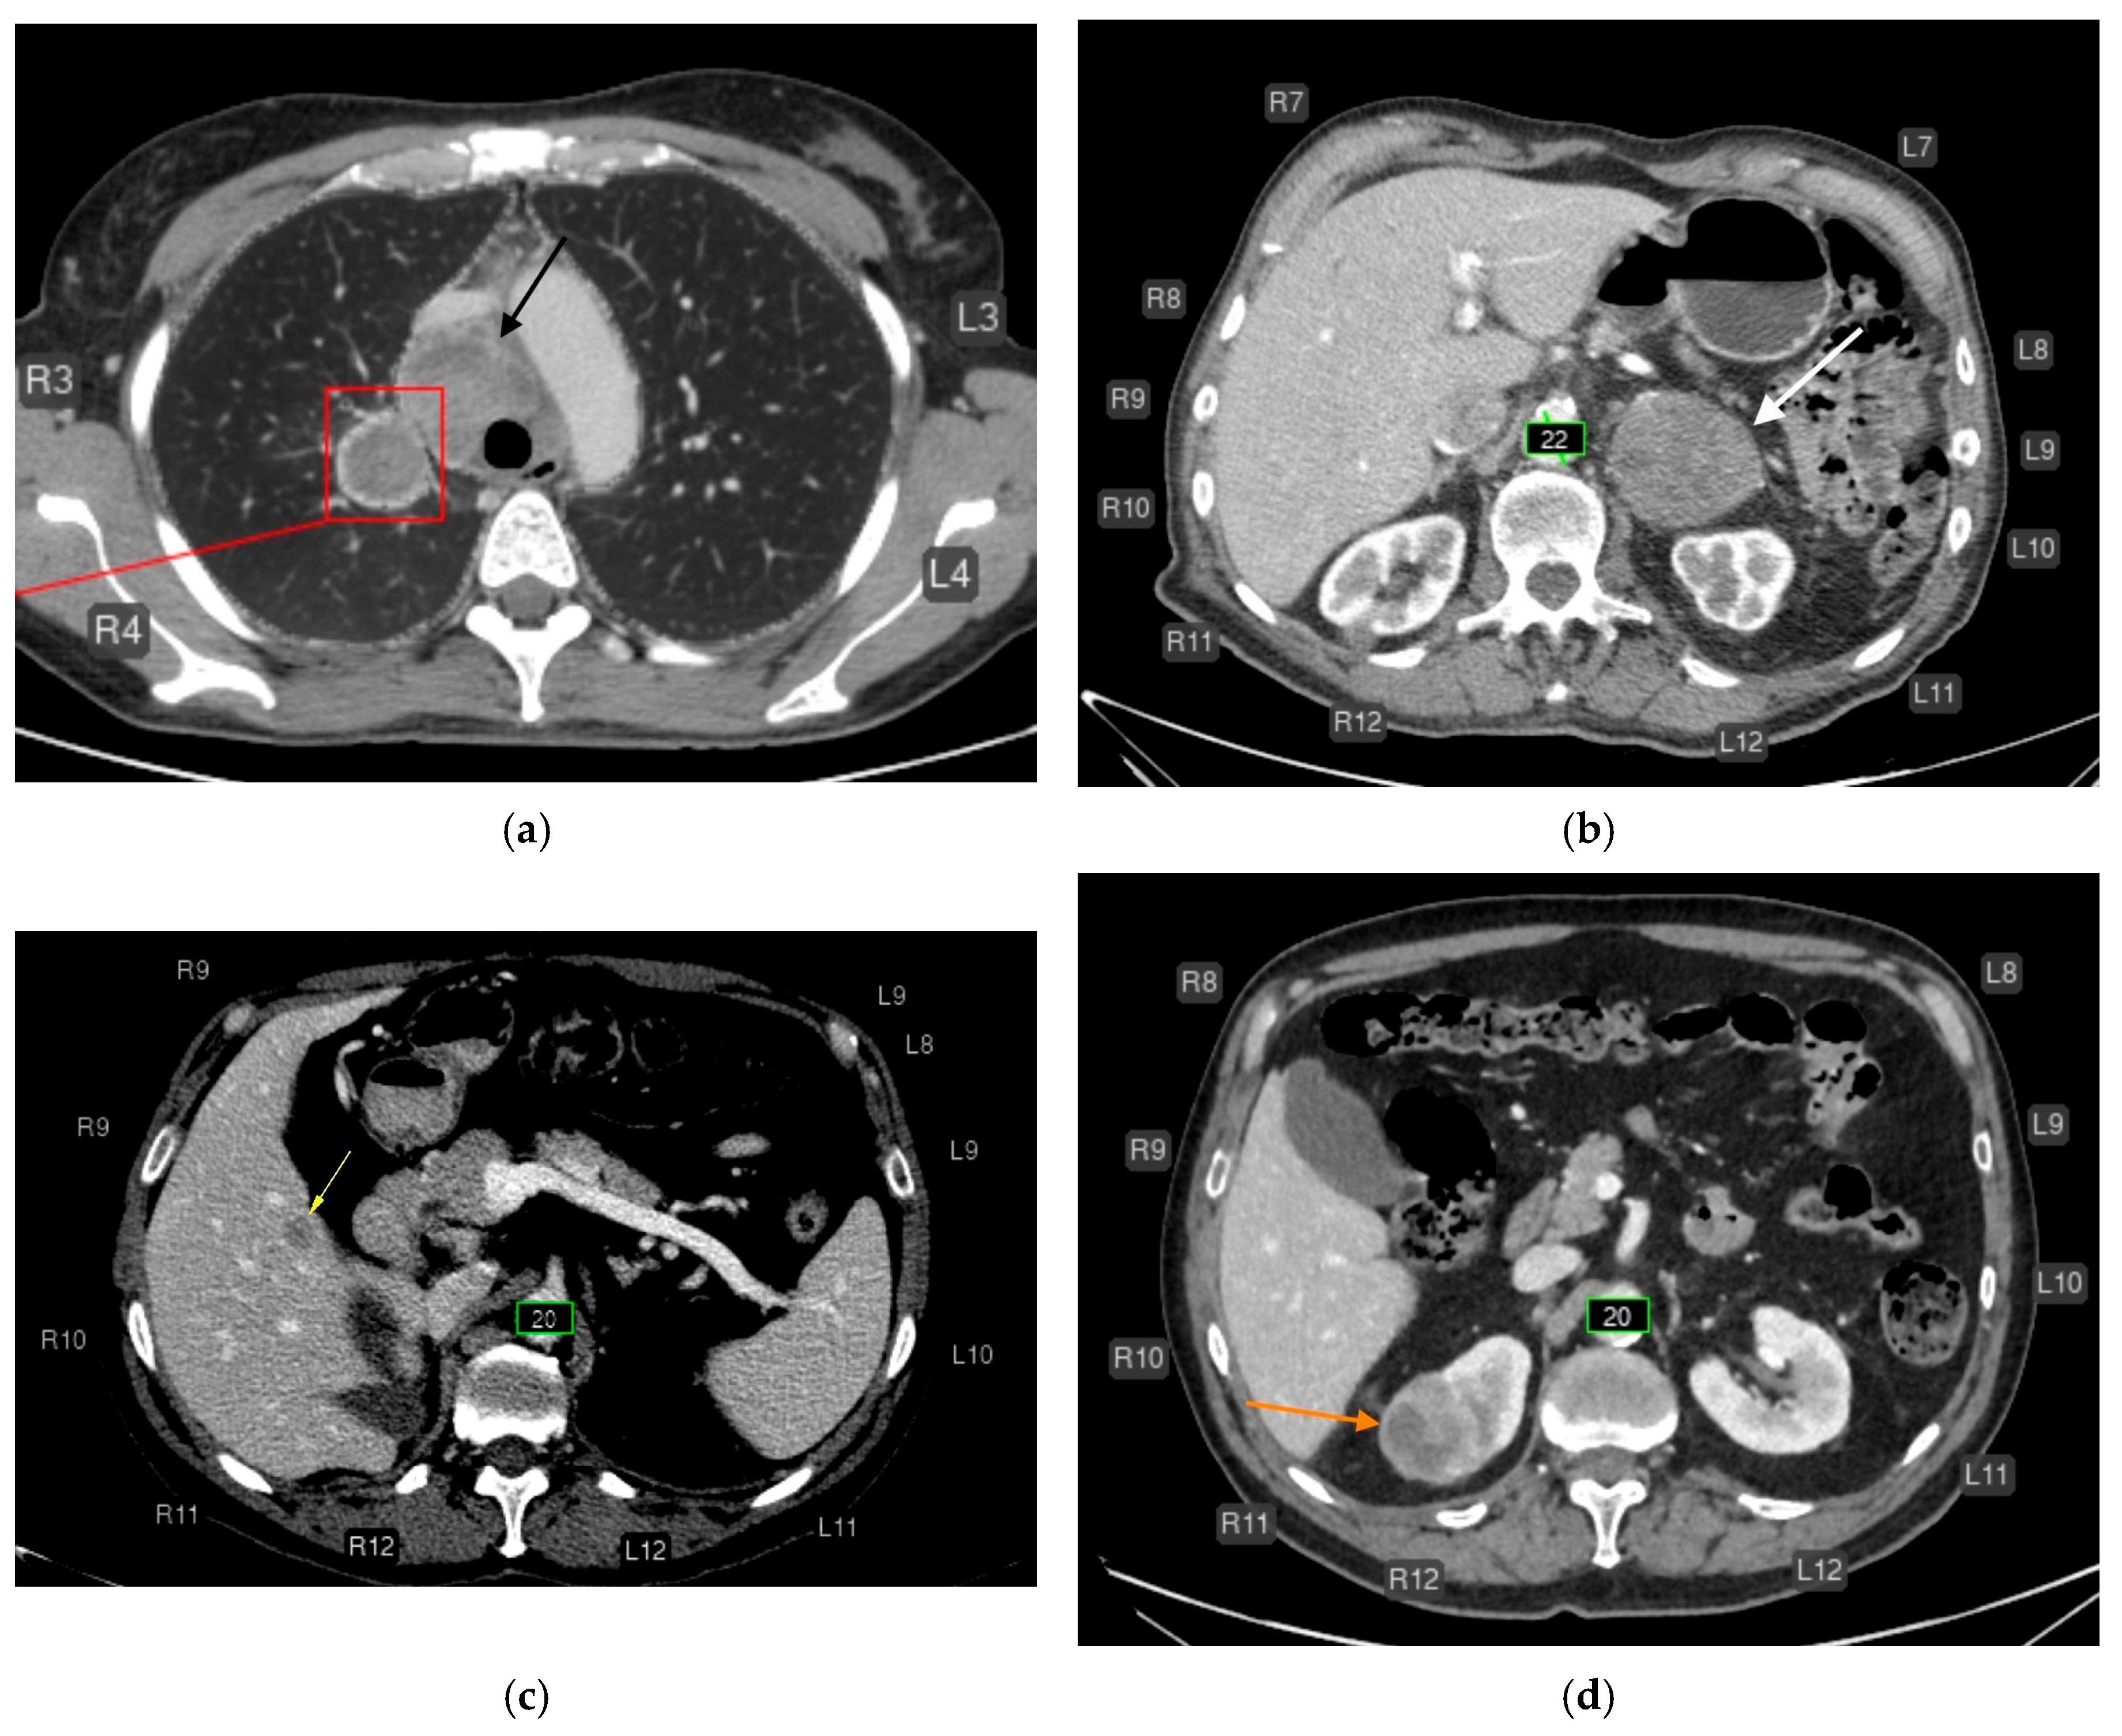
Figure 5.
Chest CT before (a, c) and after AI processing (b,d). Intermediate errors. (a,c) Two adjacent, non-enlarged bifurcation lymph nodes (white arrow) are segmented by the AI as a single enlarged node (false-positive error). Although a radiologist can recognize this error, it may be challenging for less experienced readers. The AI service correctly identified bilateral pleural effusion (blue contour), measured the diameters of the ascending and descending thoracic aorta (green), coronary calcifications (orange), paracardial fat (dark green), emphysema (brown), and a small focus of pulmonary infiltration associated with COVID-19. (b,d) A thrombus in the right pulmonary artery (yellow arrow) is misclassified as enlarged intrathoracic lymph nodes (false-positive error). The AI was not trained to detect pulmonary artery thrombi but was trained to identify enlarged lymph nodes in this region. Due to limited training examples containing both lymphadenopathy and thrombi, the model misinterpreted the lesion as lymph node enlargement. Nevertheless, the detected abnormality could prompt a radiologist to recognize a potential thrombus. The AI correctly measured the diameters of the ascending and descending thoracic aorta (green), coronary calcifications (orange), and paracardial fat (dark green).
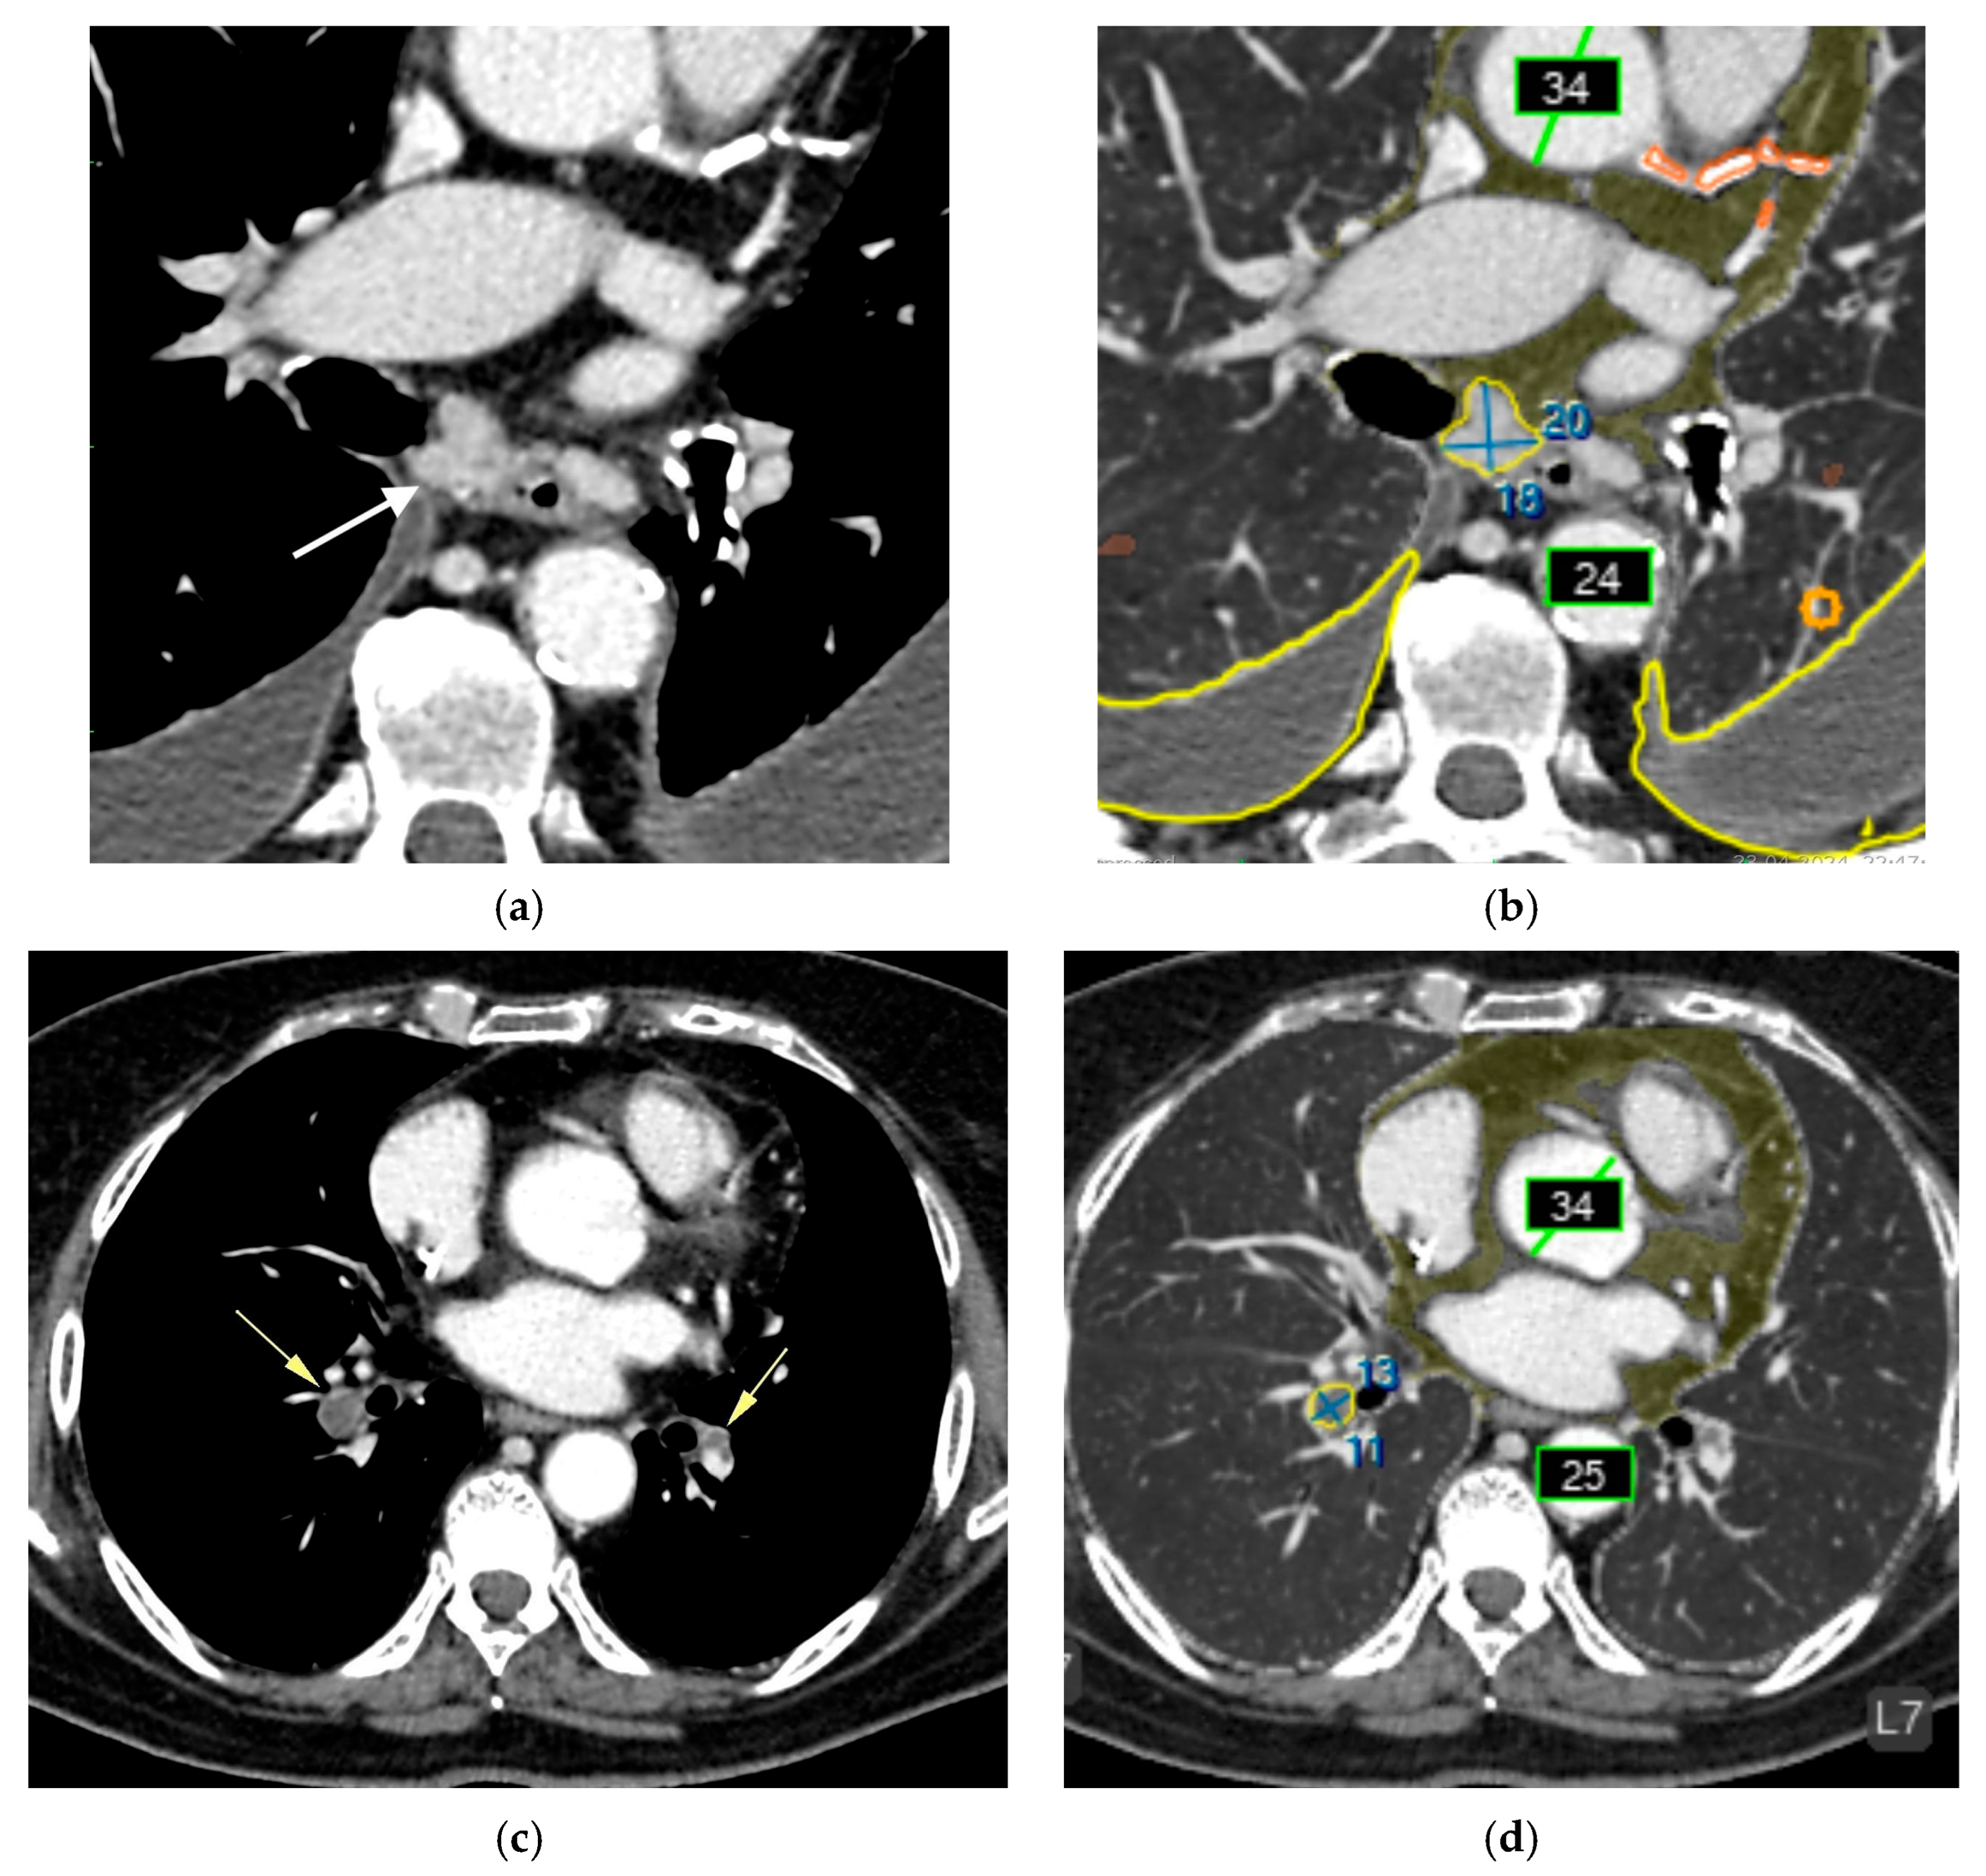
Figure 6.
Axial CT of the abdomen (a) and chest (b) after AI processing. Missed findings without clinical significance. (a) A simple cyst in the left kidney measuring approximately 4–5 mm (yellow arrow) was not segmented (false-negative error). This is most likely a simple cyst that does not require follow-up. The AI correctly measured the abdominal aortic diameter (green) and labeled rib numbering. (b) A focal area of osteosclerosis in the anterior segment of the right 6th rib was highlighted as a consolidated fracture (yellow box; false-positive error). This finding does not require follow-up. The AI correctly labeled rib numbering and measured the aortic diameter.

Figure 7.
ROC curves comparing radiologists and AI for all features. The AI shows excellent discrimination for vascular, osseous, and emphysema targets, with lower performance on urolithiasis and small solid-organ lesions.
Figure 7.
ROC curves comparing radiologists and AI for all features. The AI shows excellent discrimination for vascular, osseous, and emphysema targets, with lower performance on urolithiasis and small solid-organ lesions.
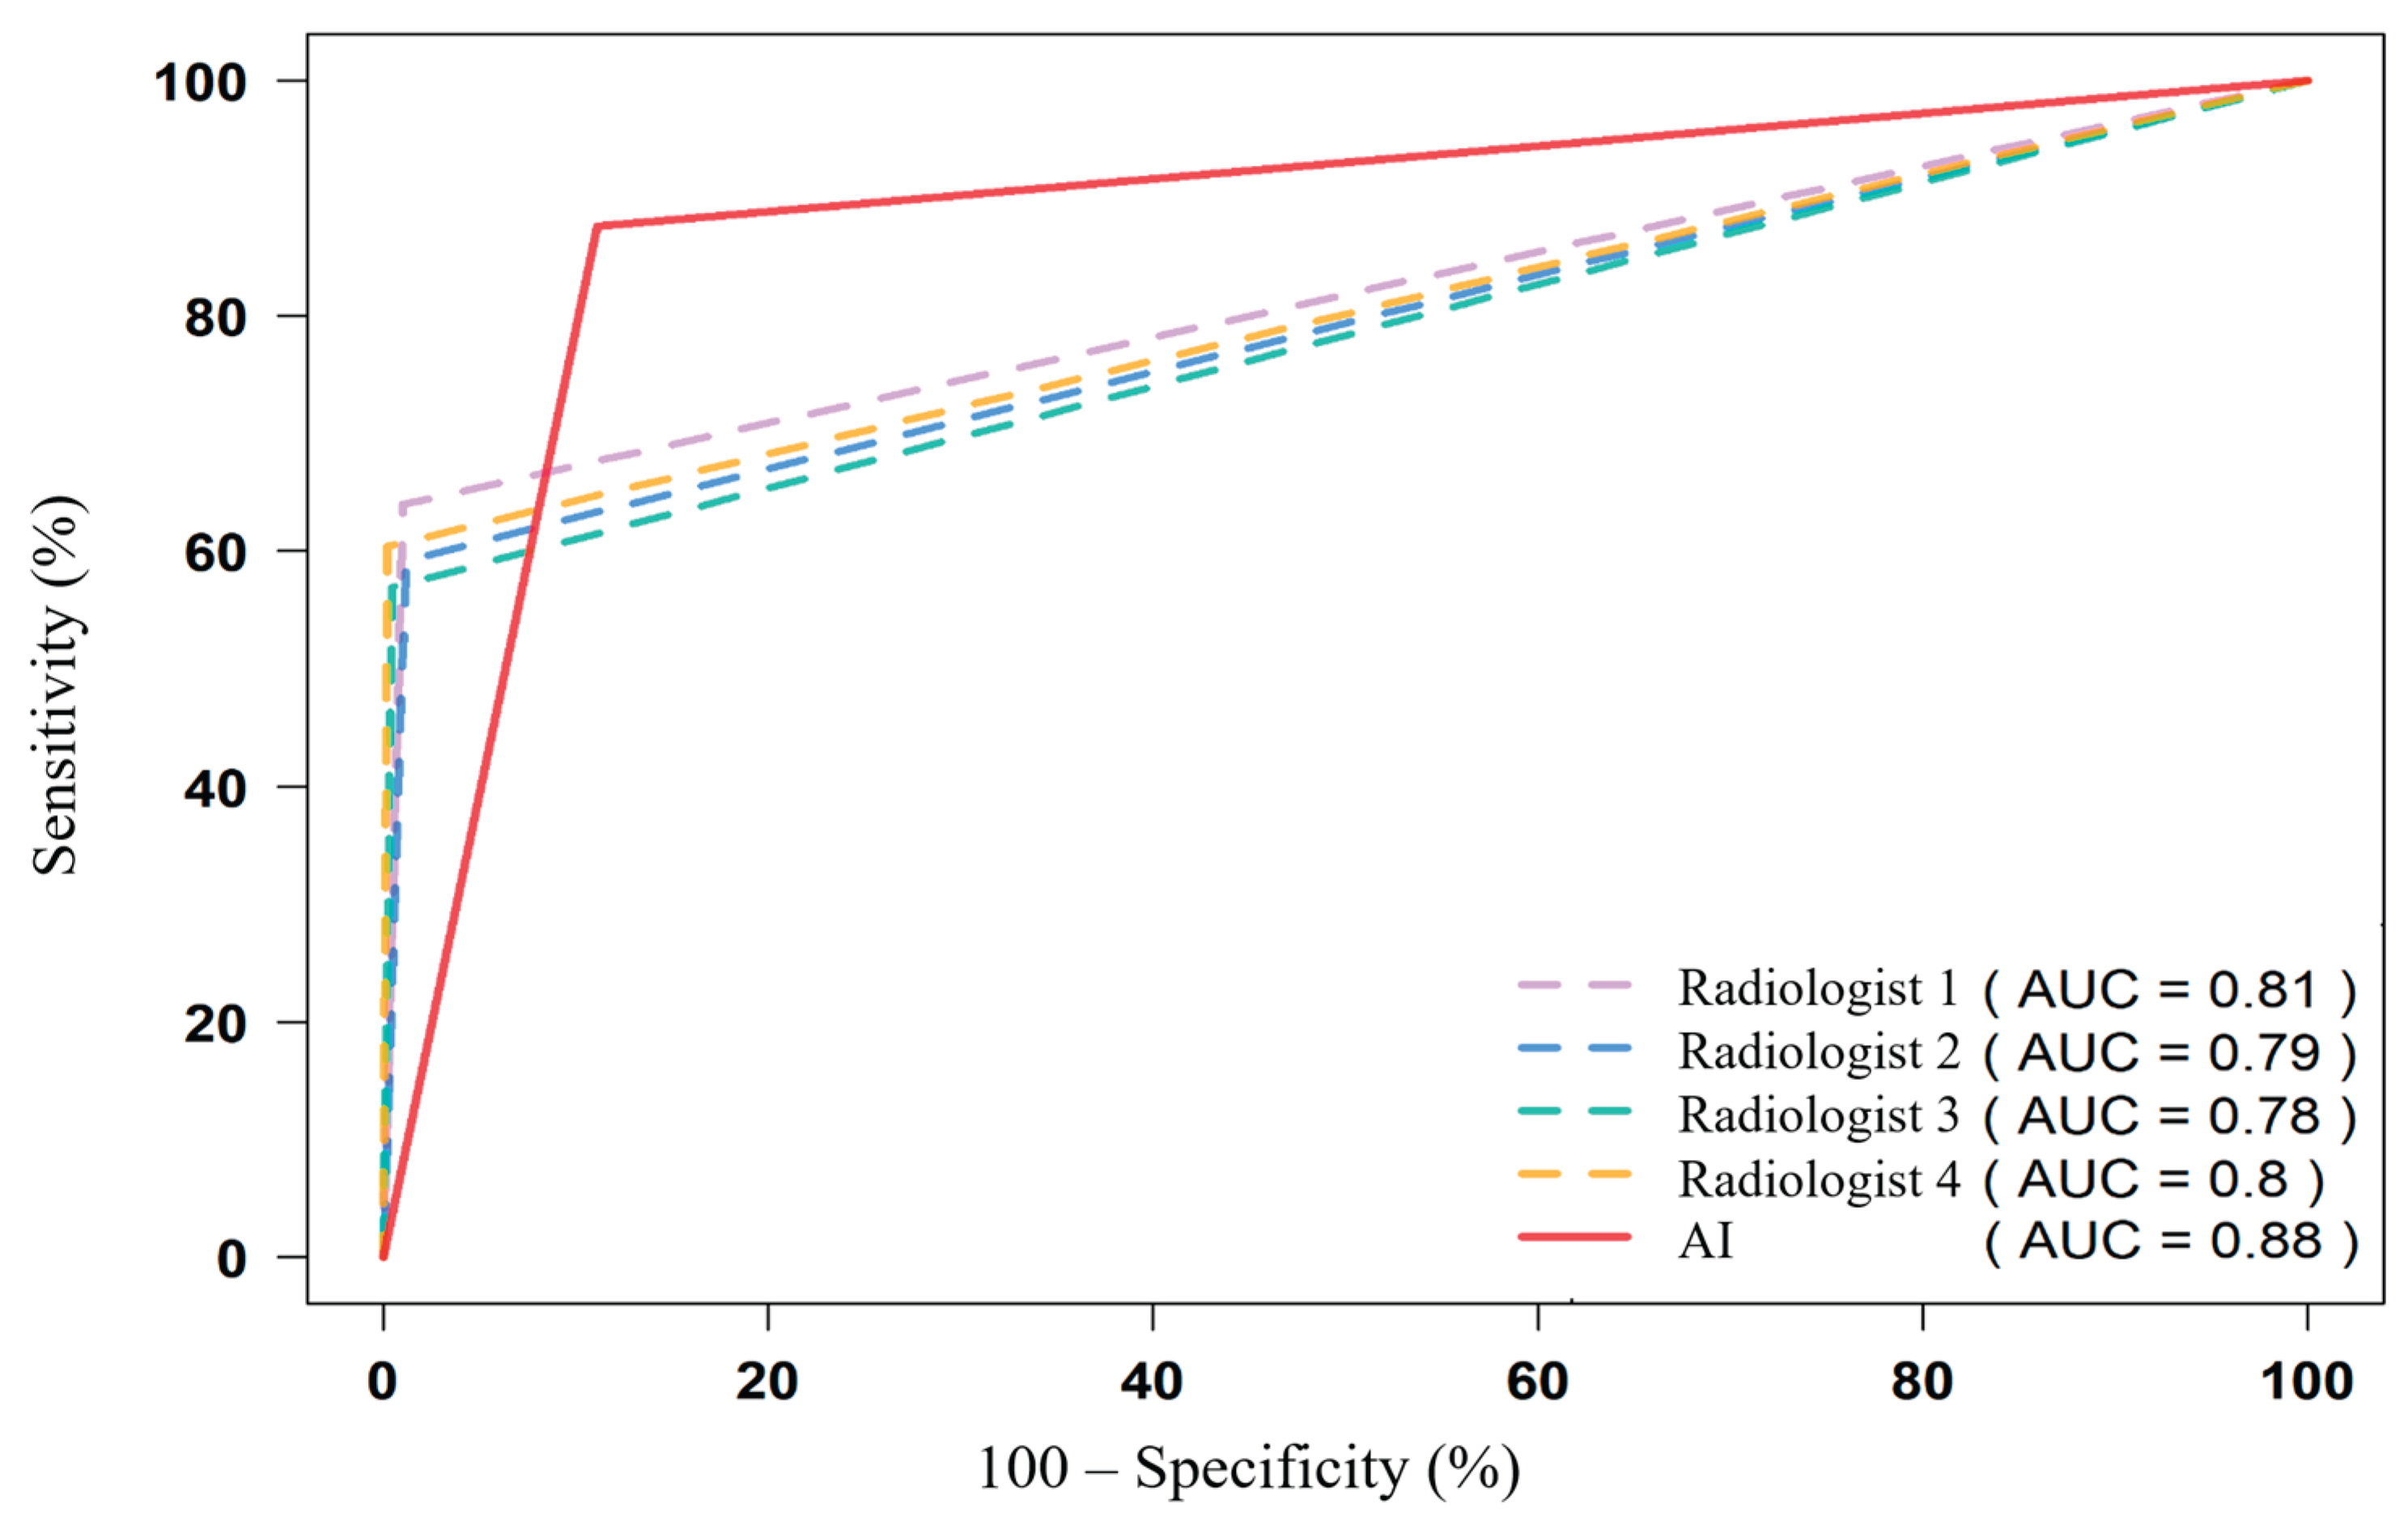

Table 1.
Thresholds for pathologic changes assessed by the multi-target AI service. Thresholds were defined according to institutional methodological guidance [10,11].
| Abnormalities | Thresholds |
|---|---|
| Pulmonary nodules | Presence of at least one pulmonary nodule or lesion larger than 6 mm in short-axis diameter |
| Airspace opacities (including consolidations/infiltrates) | Presence of any size/volume |
| Emphysema | Presence of any volume |
| Aortic dilatation/aneurysm | For aortic dilatation, the threshold diameters were defined as follows: ≥40 mm for the ascending aorta and aortic arch, ≥30 mm for the descending thoracic aorta, ≥25 mm for the abdominal aorta. For aortic aneurysm, the threshold was defined as a diameter >55 mm in any segment. |
| Pulmonary artery dilatation | >30 mm in diameter |
| Coronary artery calcium | Agatston score >1 |
| Enlarged intrathoracic lymph nodes | Presence of at least one intrathoracic lymph node enlarged to >15 mm in short-axis diameter |
| Adrenal thickening | Presence of thickening >10 mm |
| Urolithiasis | Presence of at least one urinary calculus |
| Rib fractures | Presence of at least one fracture |
| Low vertebral body density | Attenuation <+150 HU |
| Vertebral compression fractures | Vertebral body deformity >25% (Genant grade 2) |
Table 2.
Area under the ROC curve for diagnostic performance of four radiologists and AI.
| Pathology (number of true positive findings from 229) | AUC [95% CI] | ||||
|---|---|---|---|---|---|
| Radiologist 1 | Radiologist 2 | Radiologist 3 | Radiologist 4 | AI | |
| Enlarged intrathoracic lymph nodes (55) | 0.952 [0.916-0.989] |
0.964 [0.932-0.996] |
0.891 [0.836-0.946] |
0.936 [0.892-0.981] |
0.854 [0.803-0.904] |
| Aortic dilatation/aneurysm (32) | 0.681 [0.593-0.769] |
0.567 [0.505-0.629] |
0.567 [0.505-0.629] |
0.55 [0.495-0.605] |
0.947 [0.926-0.969] |
| Vertebral compression fractures (51) | 0.6 [0.544-0.656] |
0.55 [0.508-0.592] |
0.56 [0.515-0.605] |
0.55 [0.508-0.592] |
0.943 [0.913-0.972] |
| Coronary artery calcification (CAC) (162) | 0.838 [0.784-0.893] |
0.73 [0.665-0.794] |
0.837 [0.788-0.885] |
0.864 [0.825-0.903] |
0.875 [0.824-0.926] |
| Lung nodules (96) | 0.906 [0.867-0.945] |
0.887 [0.845-0.929] |
0.849 [0.803-0.895] |
0.909 [0.87-0.948] |
0.863 [0.818-0.909] |
| Urolithiasis (22) | 0.818 [0.715-0.921] |
0.773 [0.666-0.879] |
0.795 [0.69-0.901] |
0.773 [0.666-0.879] |
0.523 [0.478-0.567] |
| Airspace opacities (infiltrates, consolidations) (144) | 0.92 [0.89-0.95] |
0.941 [0.915-0.967] |
0.948 [0.923-0.973] |
0.965 [0.944-0.986] |
0.81 [0.757-0.862] |
| Liver masses (97) | 0.969 [0.945-0.993] |
0.918 [0.88-0.955] |
0.852 [0.806-0.898] |
0.928 [0.893-0.963] |
0.793 [0.741-0.846] |
| Renal masses (148) | 0.964 [0.94-0.988] |
0.949 [0.924-0.974] |
0.949 [0.924-0.974] |
0.967 [0.945-0.989] |
0.778 [0.732-0.824] |
| Rib fractures (63) | 0.574 [0.529-0.619] |
0.574 [0.529-0.619] |
0,557 [0,517-0,598] |
0.541 [0.506-0.576] |
0.899 [0.868-0.929] |
| Pleural effusion (73) | 0.942 [0.905-0.979] |
0.952 [0.918-0.986] |
0.952 [0.918-0.986] |
0.938 [0.9-0.976] |
0.929 [0.9-0.959] |
| Pulmonary artery dilatation (54) | 0.574 [0.526-0.622] |
0.565 [0.52-0.61] |
0.528 [0.497-0.559] |
0.519 [0.493-0.544] |
0.959 [0.929-0.988] |
| Low vertebral body density (126) | 0,504 [0,496-0,513] |
0.513 [0.498-0.528] |
0.504 [0,496-0,513] |
0.509 [0.497-0.521] |
0.9 [0.863-0.937] |
| Adrenal thickening (69) | 0.848 [0.793-0.903] |
0.75 [0.691-0.81] |
0.726 [0.666-0.786] |
0.768 [0.709-0.827] |
0.849 [0.795-0.902] |
| Emphysema (98) | 0.738 [0.687-0.79] |
0.704 [0.654-0.755] |
0.742 [0.691-0.793] |
0.78 [0.729-0.83] |
0.941 [0.914-0.968] |
| Epicardial fat (increased) (38) | 0.5 [0.5-0.5] |
0.5 [0.5-0.5] |
0.5 [0.5-0.5] |
0.5 [0.5-0.5] |
1 [1-1] |
| All pathologies (1328) | 0.815 [0.802-0.828] |
0.790 [0.777-0.804] |
0.782 [0.769-0.796] |
0.801 [0.788-0.814] |
0.883 [0.872-0.894] |
Table 3.
AUC analysis for AI on clinically significant findings only.
| Pathology | AUC [95% CI] |
|---|---|
| Airspace opacities (infiltrates, consolidations) | 0.90 [0.85-0.95] |
| Emphysema | 1.00 [0.95-1.00] |
| Lung nodules | 0.97 [0.93-1.00] |
| Enlarged intrathoracic lymph nodes | 0.94 [0.89-0.99] |
| Pleural effusion | 1.00 [0.98-1.00] |
| Aortic dilatation/aneurysm | 1.00 [1.00] |
| Coronary artery calcification (CAC) | 0.96 [0.69-1.00] |
| Adrenal thickening | 0.95 [0.93-1.00] |
| Rib fractures | 0.98 [0.89-1.00] |
| Vertebral compression fractures | 0.73 [0.32-1.00] |
| Liver masses | 0.87 [0.79-0.95] |
| Renal masses | 0.86 [0.69-1.00] |
| Urolithiasis | 0.55 [0.00-1.00] |
| Average value for all pathologies | 0.9 [0.71-1.00] |
Disclaimer/Publisher’s Note: The statements, opinions and data contained in all publications are solely those of the individual author(s) and contributor(s) and not of MDPI and/or the editor(s). MDPI and/or the editor(s) disclaim responsibility for any injury to people or property resulting from any ideas, methods, instructions or products referred to in the content. |
© 2025 by the authors. Licensee MDPI, Basel, Switzerland. This article is an open access article distributed under the terms and conditions of the Creative Commons Attribution (CC BY) license (http://creativecommons.org/licenses/by/4.0/).
Copyright: This open access article is published under a Creative Commons CC BY 4.0 license, which permit the free download, distribution, and reuse, provided that the author and preprint are cited in any reuse.


