Submitted:
06 January 2026
Posted:
07 January 2026
You are already at the latest version
Abstract
The increasing penetration of converter-interfaced generation raises critical concerns for power system stability, especially during rapid transients and system split events that are not yet adequately addressed in current grid code compliance tests. This paper assesses the resilience of a Virtual Synchronous Machine (VSM) compared with a grid-following photovoltaic (PV) inverter using a combined framework of standardized benchmark tests and realistic system-split scenarios. In benchmark testing, the VSM provided synthetic inertia by delivering a transient power burst from 0.30 p.u. to 0.545 p.u. under a -0.4 Hz/s frequency ramp, corresponding to an equivalent inertia constant of approximately 15s. With the Limited Frequency Sensitive Mode-Underfrequency (LFSM-U) function enabled, it sustained additional active power up to 0.61 p.u. once the frequency fell below 49.8Hz. The PV inverter, by contrast, demonstrated compliance with conventional grid requirements: it curtailed power through LFSM-O during overfrequency conditions. It injected 0.25 p.u. of reactive current during a fault ride-through (FRT) event at 1.129 p.u. voltage. In system-split tests, the VSM absorbed surplus PV generation, stabilizing frequency after a transient rise to 52.8 Hz and preventing voltage excursions exceeding 1.2 p.u. During imbalance stress, it absorbed 1.266 MW against its 1.0~MW rating, corresponding to a 26.6 % overload. These results demonstrate that while the PV inverter contributes valuable voltage support, only the grid-forming VSM maintains frequency stability and ensures secure islanded operation. The novelty of this study lies in integrating standardized compliance tests with system-split scenarios, thereby providing a comprehensive framework for evaluating grid-forming controls from both regulatory and resilience-oriented perspectives and informing the evolution of future grid codes.
Keywords:
virtual synchronous machine (VSM)
; grid-forming inverter
; grid-following photovoltaic inverter
; system split and Islanding
; electromagnetic transient (EMT) simulation
; converter-dominated grids
; frequency and voltage stability
1. Introduction
The transition toward converter-dominated power systems has fundamentally altered the stability landscape of transmission and distribution networks [1]. Unlike synchronous machines, conventional converter-interfaced generation contributes little or no rotational inertia, which makes the system more sensitive to fast disturbances such as frequency ramps, voltage collapses, and islanding events [2,3]. Recent blackouts and near-miss incidents, including the Continental Europe system separation of 2006 [4], the South Australia blackout of 2016 [5], and the Texas 2021 winter event [6], have demonstrated the vulnerabilities of low-inertia systems.
Grid codes worldwide have evolved to mitigate these risks by mandating basic support functions such as frequency ride-through, fault ride-through (FRT), and limited frequency-sensitive modes [7,8]. In Europe, ENTSO-E defines compliance-oriented tests, while IEEE 1547-2018 and IEC 62786:2020 prescribe voltage and frequency support requirements for distributed energy resources (DERs)[9,10,11]. These frameworks secure fundamental grid stability but do not explicitly address system split resilience, leaving a critical gap in qualification procedures.
A fundamental distinction exists between grid-following (GFL) and grid-forming (GFM) control strategies. Grid-following inverters operate as controlled current sources that synchronize to the grid through phase-locked loops (PLLs) [12]. While this allows accurate current injection under normal conditions, it renders them dependent on a strong grid reference and limits their ability to provide frequency or voltage support [13,14]. Their performance deteriorates under weak-grid conditions, and they typically disconnect during islanding or major disturbances. In contrast, grid-forming inverters behave as voltage sources that establish their own frequency and voltage references. This enables them to contribute synthetic inertia, enhance transient stability, provide black-start capability, and sustain autonomous operation during islanding [15,16]. As a result, GFMs are increasingly recognized as key enablers for the reliable operation of future converter-dominated grids.
Among the different grid-forming approaches, the Virtual Synchronous Machine (VSM) has received particular attention as it directly emulates the dynamics of synchronous generators by embedding the swing equation into the converter control loop [17,18]. This enables VSMs to provide synthetic inertia, damping, and frequency support in a way that is functionally comparable to traditional rotating machines [3]. Recent studies have demonstrated that VSM-based inverters can improve transient stability [19], enhance weak-grid operation [20], and coordinate effectively with conventional synchronous machines [21]. Large-scale research programs, including the EU MIGRATE project [22] and the UNIFI initiative [23], have benchmarked VSMs against other GFM controls under standardized testing protocols. Similarly, the framework developed by Kersic et al. [24] specifies the expected characteristics of grid-forming converters and provides detailed procedures for their validation [24]. These initiatives have established a solid foundation for evaluating grid-forming controls under compliance-oriented conditions.
Nevertheless, compliance-oriented tests alone are insufficient to guarantee resilience. While they assess inertia response, LFSM, and FRT, they do not capture extreme system events such as abrupt phase-angle shifts and frequency excursions during system splits, where multiple stressors occur simultaneously [25]. Addressing this gap requires complementary testing frameworks that extend beyond compliance and systematically evaluate inverter performance under resilience-oriented conditions.
The main contributions of this paper are summarized as follows:
- Benchmark testing of the VSM: A Virtual Synchronous Machine (VSM) was implemented and rigorously benchmarked against standardized protocols (Fraunhofer ISE, Kersic), including inertia response, LFSM-U, fault ride-through (FRT), and critical RoCoF [24,26]. The VSM delivered an equivalent inertia constant of ∼15 s, provided sustained LFSM-U support, injected reactive current during FRT, and maintained synchronization under ±2 Hz/s RoCoF.
- Testing of the PV inverter: A grid-following photovoltaic (PV) inverter was evaluated against compliance-oriented functions. It curtailed active power via LFSM-O during overfrequency, injected reactive current during FRT, and supported voltage recovery. However, as expected for a GFL unit, it was unable to regulate frequency or sustain islanded operation.
- System split and comparative analysis: A novel islanding test case was developed to evaluate resilience beyond compliance. Results showed that while the PV inverter provided reactive voltage support, only the VSM maintained frequency stability and ensured secure islanded operation, even under overload stress.
- Novelty: This work introduces a unified evaluation framework that combines standardized compliance tests with resilience-oriented system split scenarios. Unlike prior studies, it provides a comprehensive basis for qualifying grid-forming converters and directly informs the evolution of future grid codes.
2. Methodology
This study evaluates Virtual Synchronous Machines (VSMs) through two complementary steps. First, a benchmark feeder with a single VSM is tested under standardized scenarios to quantify core grid-forming properties. Second, a mixed feeder with a VSM and a grid-following (GFL) PV inverter is used to assess resilience during system splits. Both cases are implemented in the electromagnetic transient (EMT) domain using DIgSILENT PowerFactory, which provides detailed representation of converter dynamics and grid interactions.
3. VSM Benchmark Distribution Grid
3.1. System Description
A benchmark feeder was developed in DIgSILENT PowerFactory to evaluate the grid-forming capabilities of a standalone Virtual Synchronous Machine (VSM). The test setup, shown in Table 1, consists of a 20 MVA VSM inverter dispatched at 5 MW with unity power factor, connected at the Point of Common Coupling (PCC). The feeder is energized by a 20 kV three-phase grid simulator, interfaced through a 3 MVA series reactor (, ) and a controllable breaker that emulates the upstream transmission system. A general load is connected downstream of the PCC to provide realistic power exchange conditions.
This setup is used for standardized testing of grid-forming converters, including evaluation of voltage source behavior, inertial response under active power disturbances, and fault ride-through capability. The corresponding schematic is shown in Figure 1.
3.2. Virtual Synchronous Machine (VSM) Control
The Virtual Synchronous Machine (VSM) is a grid-forming control strategy that emulates the electromechanical dynamics of a synchronous generator [27]. Its main objective is to provide synthetic inertia, damping, and autonomous voltage–frequency support, ensuring stable operation in converter-dominated grids [28].
3.2.1. Swing Equation Representation
At the core of the VSM lies the swing equation, which governs the rotor dynamics of synchronous machines and is reproduced by the converter. In torque form, the dynamics are written as:
where J is the virtual inertia constant, the instantaneous angular frequency, the nominal angular frequency, the reference active power, P the measured active power, and the damping coefficient in torque units. expressing the swing equation in terms of power:
This ensures consistent physical units .
Alternatively, in per-unit form (commonly used in power system analysis), the swing equation is
where H is the inertia constant in seconds and is the per-unit damping coefficient.
The rotor angle is obtained by integrating the frequency:
This formulation enables the VSM to reproduce inertial response and oscillation damping similar to a synchronous machine.
3.2.2. Governor and Active Power–Frequency Droop
Primary frequency regulation is introduced through a governor mechanism that adjusts the power reference denoted as according to frequency deviation:
where is the scheduled active power, the frequency setpoint, and the droop coefficient. This allows the VSM to share frequency control in proportion to load deviations, mimicking the behavior of conventional governors.
3.2.3. Reactive Power–Voltage Droop Control
Voltage regulation is achieved through a Q–V droop law that adapts the internal voltage magnitude to reactive power exchange:
where E is the generated internal voltage, the reference voltage, Q the measured reactive power, the scheduled reactive setpoint, and the reactive droop constant.
Figure 2.
Virtual Synchronous Machine Control with Active Power–Frequency and Reactive Power–Voltage Droop Dynamics
Figure 2.
Virtual Synchronous Machine Control with Active Power–Frequency and Reactive Power–Voltage Droop Dynamics
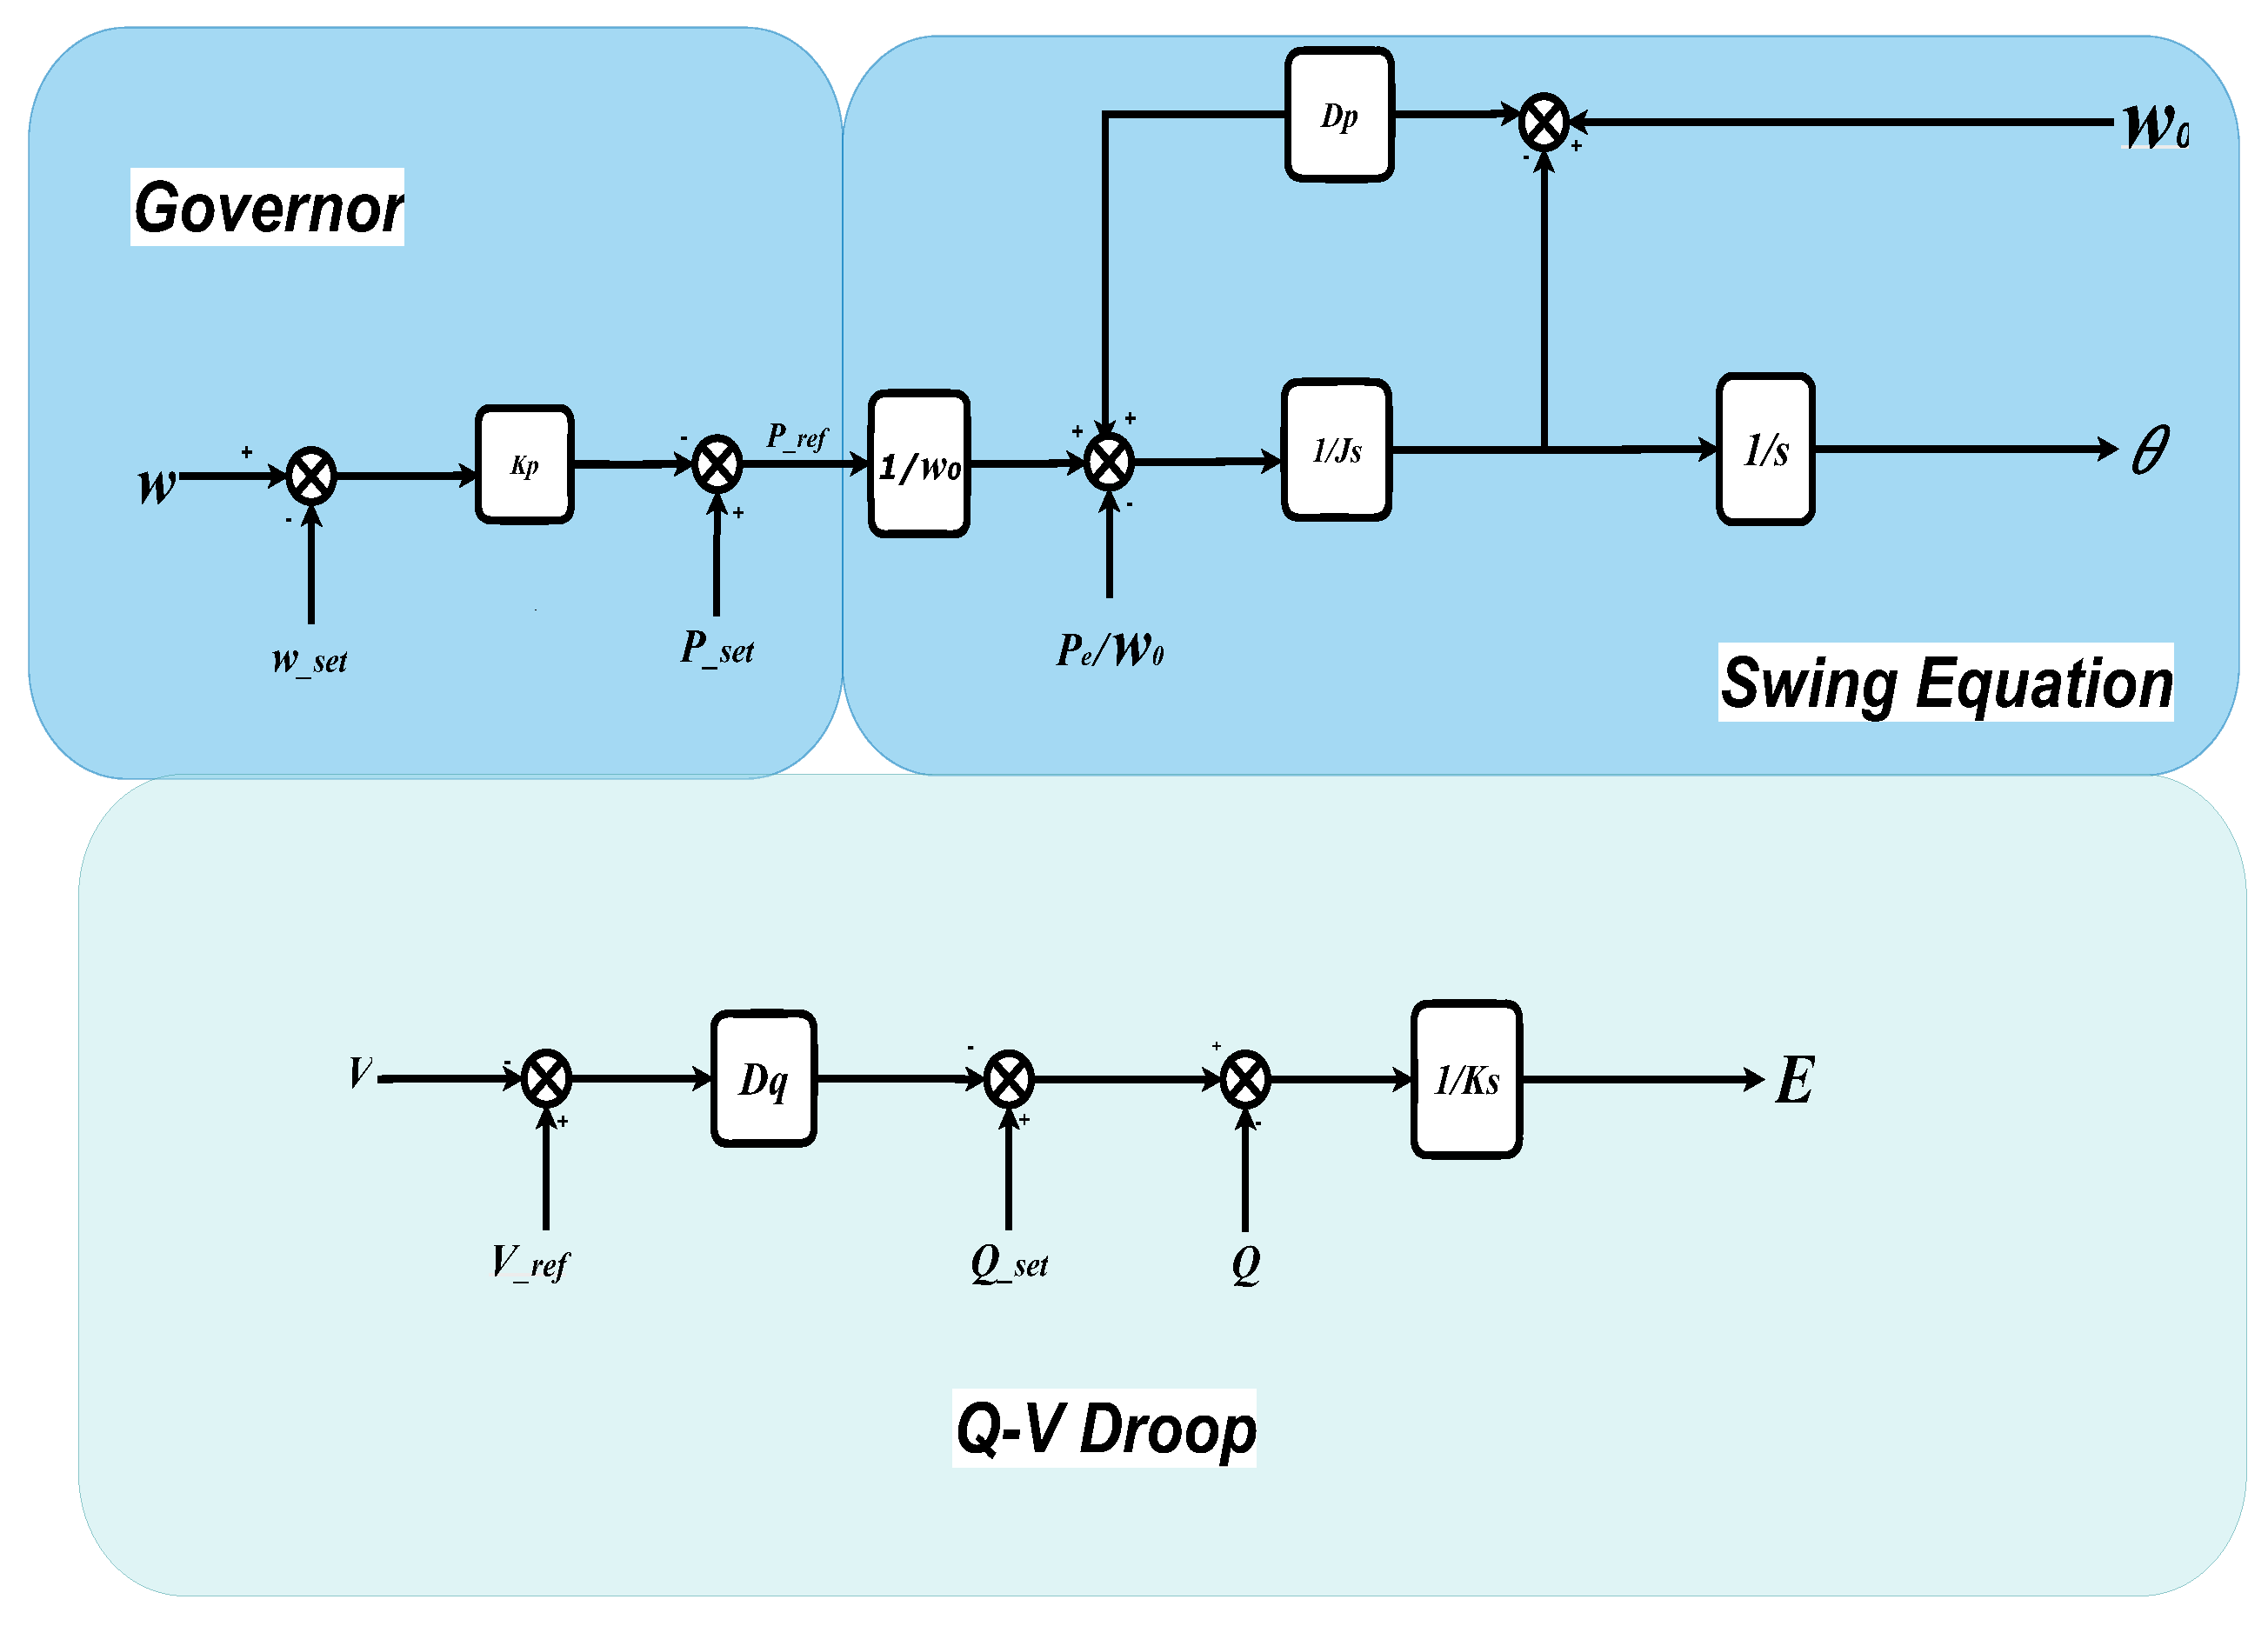
3.2.4. Control Architecture and Features
The overall VSM architecture consists of three main elements: (i) a governor loop enforcing P–f droop (5), (ii) the swing equation block capturing inertia and damping (2)–(4), (iii) and the Q–V droop controller (6),
Together, these blocks enable the VSM to reproduce the key attributes of synchronous machines, namely: synthetic inertia and damping, autonomous frequency and voltage support, fault ride-through capability, and stable islanded operation.
3.3. Implementation in PowerFactory
In DIgSILENT PowerFactory, the VSM was implemented as a composite model linking the canonical equations (2)–(6) with measurement and interface blocks suitable for EMT simulations. This structure ensures that the theoretical control dynamics are directly reproduced in a form applicable to standardized testing and system split studies.
3.3.1. Composite Model Structure
The composite arrangement (Figure 3) includes:
- A Voltage and current measurement blocks for PCC quantities;
- A Power calculation unit computing with optional filtering;
- A Virtual impedance block for stability shaping, current limiting, and fault support;
- The AC voltage controller regulating terminal voltage;
- A VSM core implementing governor, swing equation, and Q–V droop control;
- A Converter interface generating EMT-level voltage references;
- Optional frequency-sensitive mode (FSM) adapting active power during frequency events.
3.3.2. DIgSILENT Simulation Language (DSL) Implementation
The internal dynamics were programmed in PowerFactory’s DSL using interdependent control layers:
- Swing equation core: inertia J, damping , and frequency/angle tracking.
- Governor action: active power–frequency droop for primary regulation.
- Voltage-dependent power limiting: reduces under low-voltage conditions.
- Stabilizing filters: lead–lag and low-pass filtering on P, Q, and for EMT stability.
- Overload protection: corrective frequency shift for ride-through.
- Reference: generates generated to set frequency and phase.
This layered implementation allows the VSM to replicate synchronous machine behavior while ensuring numerical stability in EMT simulations. It provides a robust framework for benchmarking and resilience analysis in converter-dominated grids.
3.4. Standardized Testing Protocol
To validate the VSM implementation against emerging international standards, a series of standardized test cases was defined. The methodology follows the Fraunhofer ISE Grid-Forming Benchmark Procedures [26] and the Kersic guidelines [24] on grid-forming converter characteristics, providing reproducible and hardware-relevant frameworks.
The selected tests capture essential grid-forming properties:
- Fault ride-through (FRT): evaluates stability during voltage dips and post-fault recovery in both grid-connected and islanded modes.
- Voltage source properties: assesses whether the VSM establishes a stiff terminal voltage, including impedance shaping and setpoint tracking.
- Inertial response: quantifies the synthetic inertia contribution through the swing equation under applied frequency deviations.
- Overload conditions: examines current limiting and overload protection functions.
- Combined event: superimposes multiple disturbances (e.g., fault and load step) to test coordinated response and recovery.
Together, these tests reflect the core grid-forming attributes and also establish a rigorous benchmark for the implemented VSM, and enable fair comparison with the grid-following PV inverter.
3.5. Standardized Testing Results and Discussions
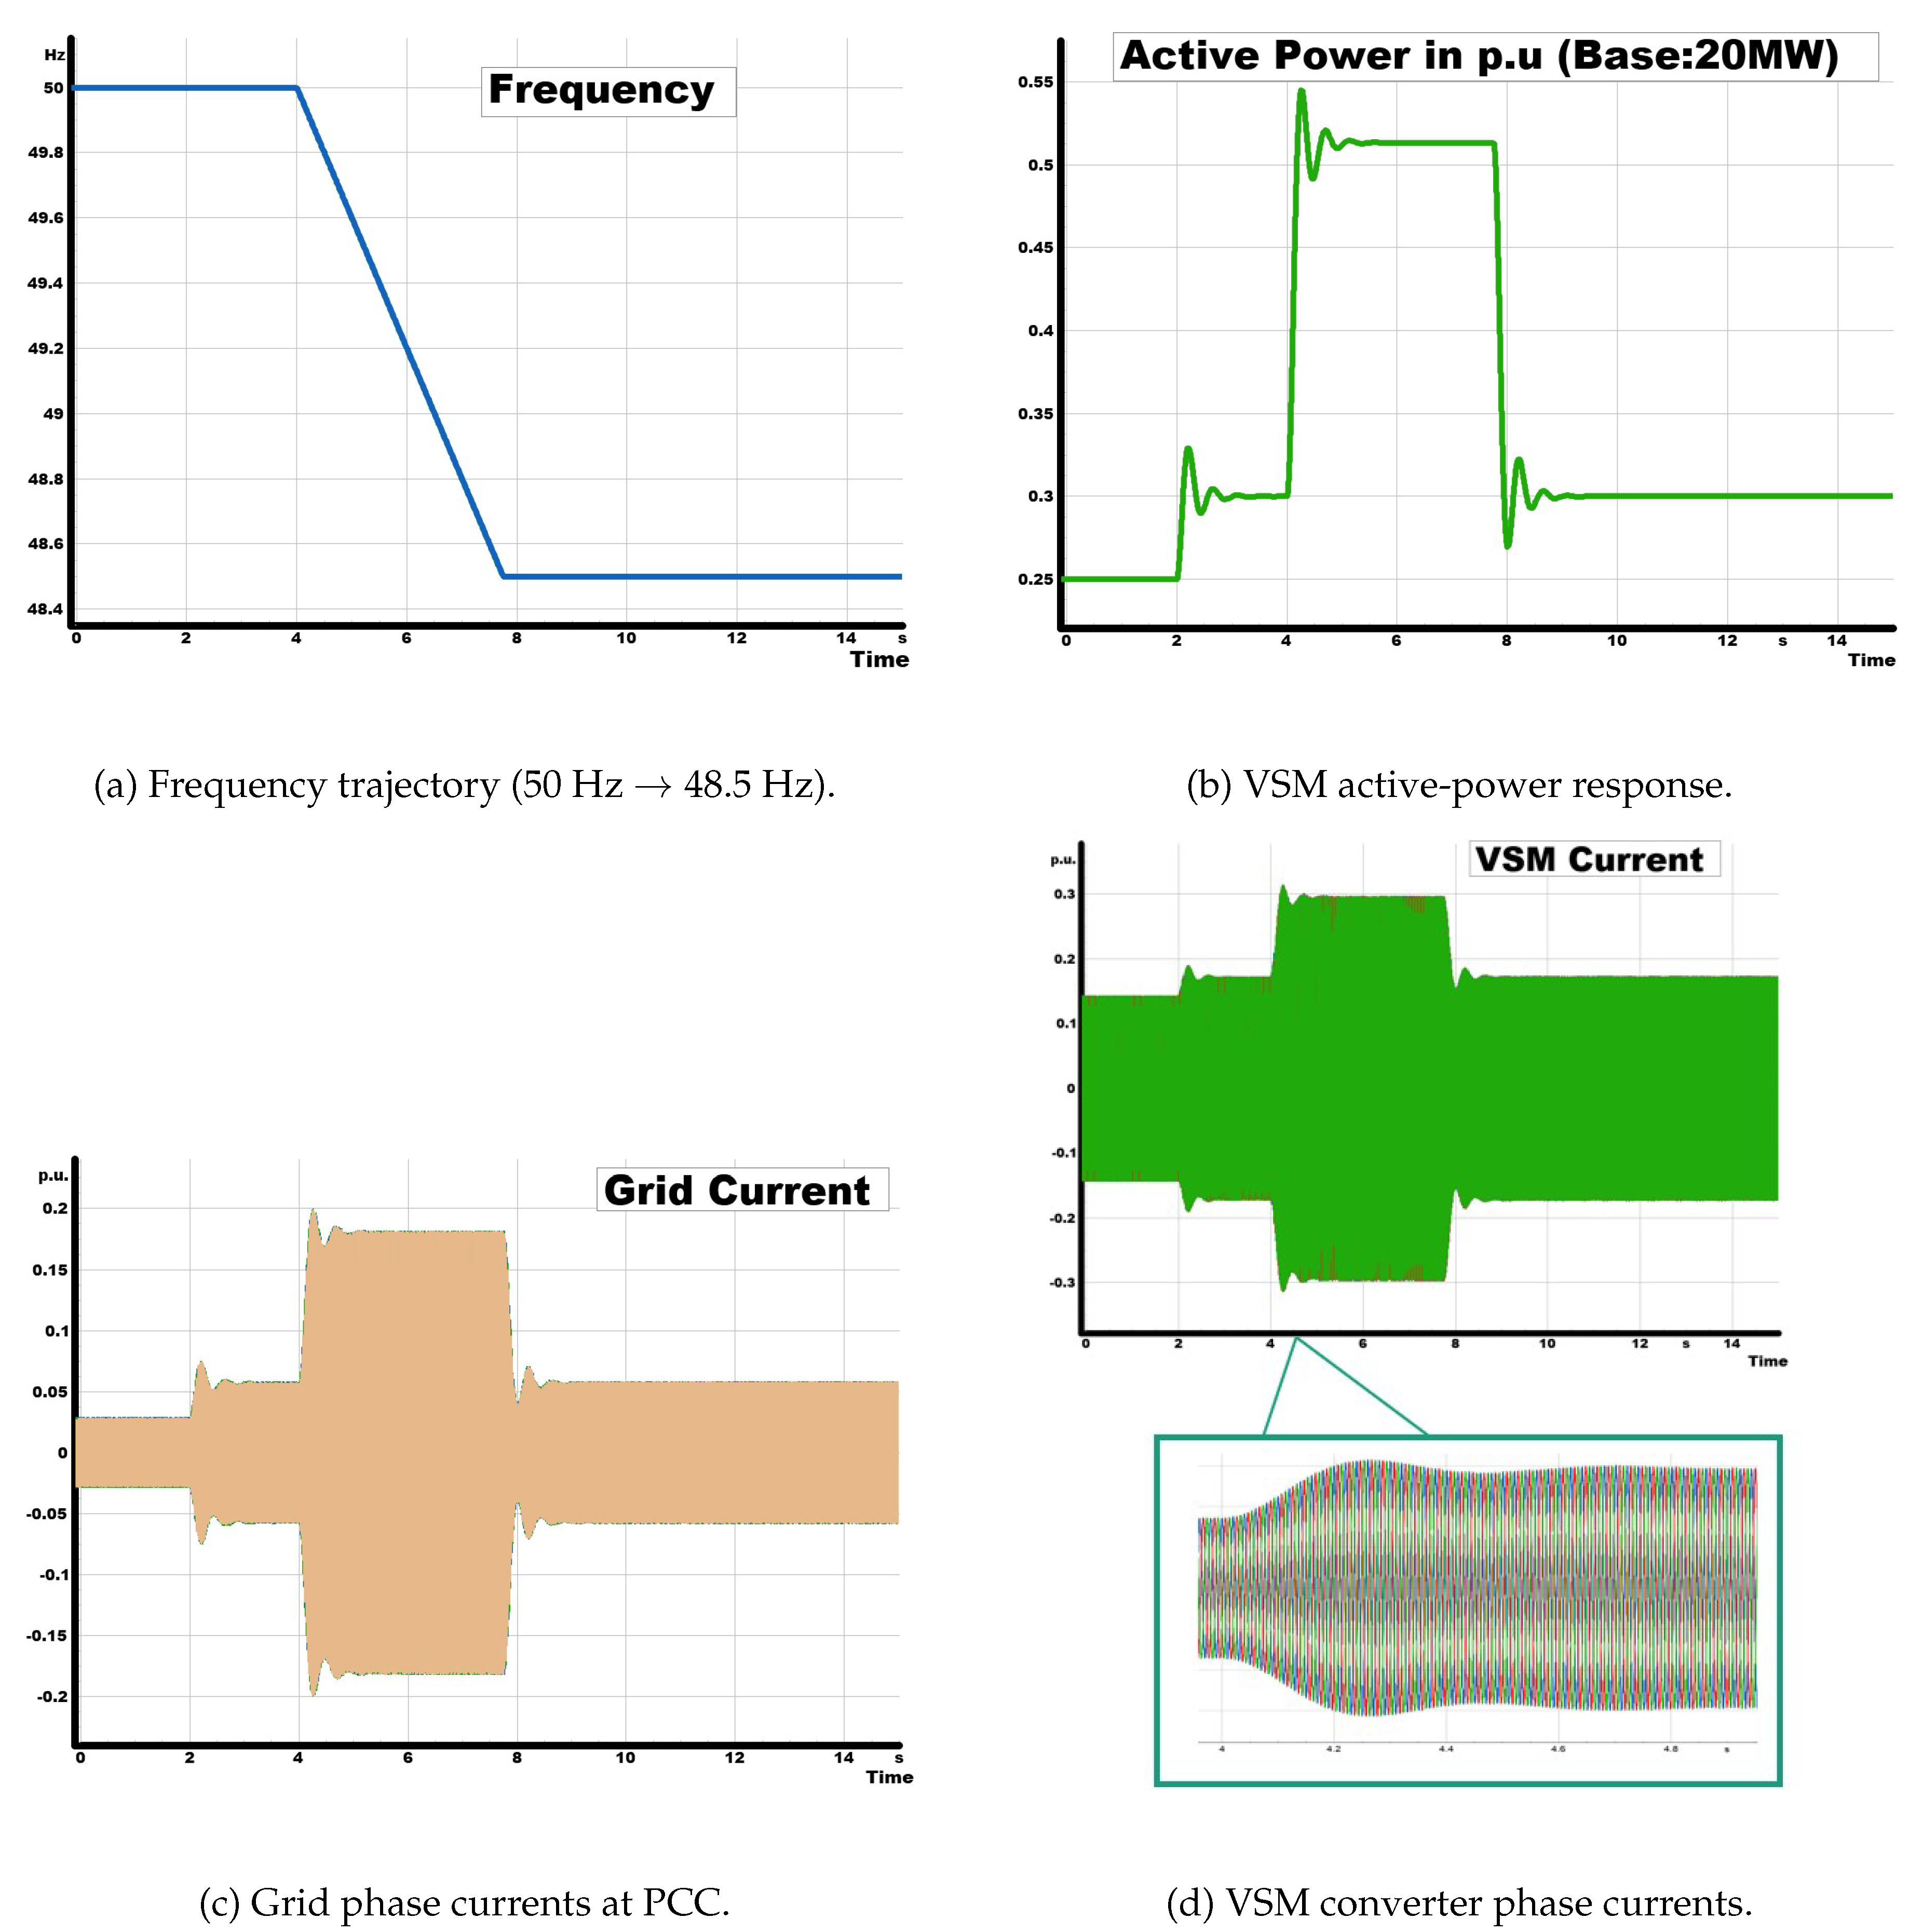
3.5.1. Inertia Response Test
The inertia contribution of the Virtual Synchronous Machine (VSM) was evaluated by subjecting it to a controlled frequency ramp applied through the grid simulator. Prior to the disturbance, the converter was operating steadily at approximately active power. At , the active-power setpoint was increased to . This preloading step is intentional: it ensures the VSM operates at a stable non-zero baseline, enabling the inertial burst governed by the swing term to manifest as a clear deviation around the scheduled operating point.
At , the system frequency was reduced linearly from to , corresponding to a rate of change of frequency (RoCoF) of approximately . In response, the VSM delivered a transient power surge. The active power rose from its preloaded value of to a peak of
A corresponding increase in converter current was also recorded, consistent with the transient power injection.
An inertial headroom, relative to the scheduled preloaded output, of
The corresponding per-unit frequency slope is
and applying the swing relation
yields an equivalent inertia constant of
On a 20 MVA base, this corresponds to a stored kinetic energy of
and an equivalent virtual inertia of
These results confirm that the VSM effectively provides synthetic inertia. The controller injects active power proportional to the imposed RoCoF magnitude, thereby supporting the system frequency during the decline, and subsequently returns smoothly to the scheduled operating point without instability or current-limit violations.
Figure 4.
Inertia response of the VSM to a programmed frequency ramp. The VSM injects additional active power during the negative RoCoF (inertial support), with a proportional rise in converter current, and settles back toward the scheduled operating point after the ramp.
Figure 4.
Inertia response of the VSM to a programmed frequency ramp. The VSM injects additional active power during the negative RoCoF (inertial support), with a proportional rise in converter current, and settles back toward the scheduled operating point after the ramp.
3.5.2. Inertia Response with LFSM-U Test
The setup mirrors the inertia-only case: a linear ramp from to starts at , and the VSM is preloaded to at . In line with ENTSO-E, LFSM-U triggers below and increases active power in proportion to the frequency shortfall, sustained for the event duration.
- Control law implemented.
Let f be the measured frequency, , . The LFSM-U droop parameter entered as droop in %/Hz is converted to
Amplitude limiting to is denoted by .
(1) Activation gate (piecewise):
(2) Gated droop request (unlimited):
(3) Amplitude limit:
(4) Slew limit (explicit, no shorthand): Let
Then
(5) Sum and smoothing (PT1):
(6) Plant reference:
Equivalence to the internal DSL. With the internal deviation ,
because and gates the action at .
- Observed behaviour and compliance
From Figure 5, it can be observed that as the frequency f declined, the VSM first delivered the inertial burst , lifting power to When f crossed , LFSM-U engaged and the sustained droop raised output to – at . With droop (i.e., ), a shortfall gives ; after the amplitude/slew limits and the s filter, this settles to the measured –
The two ENTSO-E points—accurate trigger at and sustained support—are satisfied.
3.5.3. Fault Ride-Through (FRT) and Islanding Test
This test evaluated the behaviour of the VSM under a combined short-circuit and islanding event. At s, a three-phase fault was applied at the PCC, reducing the grid-side voltage from about p.u. to p.u. The fault was cleared at s, allowing the external grid voltage to recover to nominal. During the fault, the upstream breaker was opened at s, isolating the feeder and leaving the VSM as the sole grid-forming source.
The results show that the VSM maintained sinusoidal and stable terminal voltage despite the external short-circuit, while the grid voltage exhibited a clear sag. Once the breaker opened, the VSM seamlessly transitioned into islanded operation, autonomously establishing the local voltage reference. Grid currents rose sharply during the fault, peaking at about p.u., but collapsed to zero immediately after disconnection. In contrast, the VSM current continued supplying the load, confirming a smooth and uninterrupted transition from grid-connected to islanded mode.
Figure 6 shows that the Reactive power dynamics highlight the supportive behaviour of the controller. During the fault, the VSM injected reactive current, with reactive power rising rapidly to approximately – p.u., consistent with fault ride-through requirements. After islanding, the reactive power decayed and stabilised around p.u., reflecting the balance dictated by the islanded load and voltage regulation objectives.
These results confirm that the VSM remained stable and compliant during a severe grid disturbance and sustained independent operation after separation. This demonstrates the robustness of grid-forming control, providing both fault ride-through support and reliable islanding performance.
3.5.4. Critical RoCoF Test
This test investigated the performance of the VSM under severe frequency transients using a predefined sequence of ramps and hold phases. The schedule began with an initial 20 s steady operation at 50 Hz, followed by a ramp at Hz/s down to 48 Hz, a short hold, and a subsequent return to 50 Hz at Hz/s. The profile then included a further ramp to 52 Hz, a sustained hold, and finally a Hz/s ramp back to nominal frequency. This sequence imposed alternating RoCoFs of up to Hz/s with stabilization intervals at 48, 50, and 52 Hz, representing a critical stress case for converter-dominated systems.
The results in Figure 7 confirm that the VSM maintained synchronism throughout the entire profile. During negative RoCoFs, the converter injected additional active power, reaching peaks of about – p.u., while during positive RoCoFs it absorbed power, dipping to approximately – p.u. Active power then returned smoothly to its p.u. setpoint without sustained oscillations, demonstrating good damping of inertial bursts.
Current measurements further support this behaviour. As shown in Figure 7c, both grid and VSM phase currents remained sinusoidal, with amplitude increasing during steep ramps but remaining within p.u., indicating that current limits were not violated. The VSM therefore delivered synthetic inertia and RoCoF support without compromising stability or incurring excessive current stress.
This test demonstrates that the VSM can withstand critical RoCoFs of Hz/s while preserving synchronization, providing proportional inertial support, and respecting current constraints. This confirms the suitability of grid-forming control for challenging dynamic conditions in low-inertia systems.
Current measurements show that both grid and converter currents remained sinusoidal and within rated limits, even during the steepest ramps. The rise in current amplitude was effectively constrained by the implemented virtual impedance and overload-limiter functions, ensuring stability and avoiding protective triggers.
Overall, the VSM demonstrated robust synthetic inertia performance under RoCoFs of up to Hz/s, maintaining stable operation and current compliance across all phases. These results underline the capability of VSM-based control to handle severe frequency disturbances, thereby meeting one of the key resilience requirements for grid-forming inverter qualification.
3.5.5. Combined Event – Phase Angle Change and RoCoF
This test examined the robustness of the VSM under a combined disturbance consisting of a sudden phase-angle shift followed by staged RoCoF events. At s, the grid’s phase angle was abruptly shifted from to , representing the type of phase jump that can occur during system split events. Immediately after this disturbance, the grid frequency was varied according to which introduced successive RoCoF stages with both positive and negative ramps as well as short hold periods.
The results in Figure 8 demonstrate the layered response of the VSM. Figure 8a shows that despite the phase-angle step, the VSM rapidly re-synchronized with the shifted reference and stabilized the frequency during the following RoCoF ramps, preventing sustained deviation from nominal. Figure 8b highlights the active-power dynamics: the VSM injected additional power during the frequency decline, with power rising by approximately to p.u. above the baseline before smoothly settling as the frequency stabilized.
Current behaviour provides further evidence of resilience. The grid current, shown in Figure 8 (c), rose sharply during the disturbance, with peaks approaching p.u., but returned to steady levels once the VSM counteracted the imbalance. Importantly, the converter current in Figure 8 (d) remained well within its rated envelope throughout the event, indicating that the VSM supplied the required support without experiencing overloading.
This combined test confirms that the VSM can withstand simultaneous angular and frequency disturbances without loss of synchronism or violation of current limits. Such resilience is critical for system split scenarios, where multiple stressors often occur together rather than in isolation, and highlights the capability of grid-forming control to sustain stability under compounded disturbances.
4. System Split case with VSM and PV Inverter
4.1. System Description
The second configuration introduces a grid-following (GFL) PV inverter alongside the VSM, creating a mixed-resource feeder representative of converter-dominated grids. The PV unit is rated at 1.15 MVA (1.0 MW dispatch, unity power factor) and connected at the 0.4 kV side of a 2.5 MVA, 0.4/20 kV Dyn step-up transformer. It is modeled as a current-controlled inverter synchronized through a Phase-Locked Loop (PLL).
In parallel, a 1.15 MVA VSM inverter operates as the grid-forming source. During normal operation, the external grid defines the system voltage and frequency. A system split is emulated by opening the upstream breaker, which isolates the feeder into an island powered solely by the VSM and PV inverter.
This setup enables direct comparison between the two control paradigms during islanding. The analysis focuses on frequency stability, voltage regulation, and continuity of supply when the system relies entirely on converter-based resources. The schematic of this configuration is shown in Figure 9.

Table 2.
Key parameters of the VSM–PV system split configuration.
| Component | Value |
|---|---|
| VSM inverter | 1.15 MVA, grid-forming |
| PV inverter | 1.15 MVA, 1.0 MW dispatch, grid-following |
| Transformer | 2.5 MVA, 0.4/20 kV, Dyn |
| Breaker | Upstream disconnection at PCC |
| Load | Generic feeder load |
4.2. Grid-Following PV Inverter Control
The grid-following photovoltaic (PV) inverter was implemented using the standard DIgSILENT PowerFactory library model, ensuring consistency with established benchmark practices and reproducibility. To allow a fair comparison with the VSM, the default control parameters were adapted in line with ENTSO-E grid code requirements and the objectives of this study.
The implemented inverter follows a conventional grid-following (GFL) control structure, where synchronization is achieved through a Phase-Locked Loop (PLL) that aligns the converter with the external voltage phase. The main functionalities are:
- PLL-based synchronization: tracks grid phase and frequency for current injection in synchronism with the grid voltage.
- Low-voltage fault ride-through (FRT): injects reactive current during voltage dips, supporting post-fault voltage recovery in accordance with ENTSO-E requirements.
- Limited frequency-sensitive mode (LFSM-O): reduces active power output proportionally during overfrequency events, contributing to primary frequency control.
- Current limitation and power curtailment: enforces operational limits and prevents overcurrent conditions.
Figure 10 illustrates the control architecture, showing the interaction of PLL synchronization, power control, FRT, LFSM-O, and current limiting.
5. Results and Discussion
This section presents and discusses the simulation results obtained from the PV System Grid following and System split tests, which are implemented in DIgSILENT PowerFactory.
5.0.1. LFSM-O Test of the PV Inverter
Before assessing the full system split scenario, the standalone grid-following (GFL) PV inverter was validated under the Limited Frequency Sensitive Mode–Overfrequency (LFSM-O) function. According to ENTSO-E requirements, LFSM-O is triggered once the system frequency exceeds Hz, leading to a proportional reduction of active power output.
Figure 11 illustrates the inverter’s response. As the grid frequency rose above the Hz threshold, the PV inverter curtailed its active power output in proportion to the deviation. The reduction was stepwise and proportional, with power falling from the initial operating level of approximately – MW toward zero as the frequency reached its maximum excursion above 52 Hz. The frequency rise was thereby moderated, and the inverter maintained synchronism and stable operation throughout the event.
This confirms that the implemented PV inverter complies with ENTSO-E specifications for frequency support under overfrequency conditions. The LFSM-O function was correctly triggered at the prescribed threshold, applied proportional active-power curtailment, and remained stable without oscillations or instability. The inverter configuration is therefore validated and suitable for subsequent comparative analysis with the VSM in the system split scenarios.
5.0.2. Fault Ride-Through (FRT) Test of the PV Inverter
In addition to frequency support, the PV inverter was validated for fault ride-through (FRT) under overvoltage conditions. When the terminal voltage exceeds a threshold (here ), the reactive current reference follows a proportional droop law,
where k is the overvoltage reactive current gain (droop coefficient, in p.u./p.u.).
In the observed event, the measured peak voltage was
Equivalently, when referenced to nominal (),
With a configured droop coefficient of , the theoretical reactive current command is
Figure 12 shows that the inverter injected approximately of reactive current, in close agreement with (10). At the same time, the inverter curtailed active power to remain within current limits. The response was prompt when V exceeded and was sustained until the voltage returned toward nominal, demonstrating effective overvoltage support and compliance with FRT requirements.
5.0.3. System Split Test: Island Test
The resilience of the mixed system under islanding was assessed through a system split test. At s, the upstream breaker was opened, disconnecting the feeder from the main grid. Before the disconnection, both the VSM and the PV inverter were synchronized to the external grid and delivering active power.
Once the grid was disconnected, the operating conditions changed abruptly. The VSM was forced to establish the local voltage and frequency reference, while also absorbing the surplus active power generated by the PV inverter. As shown in Figure 13, this imbalance triggered a rapid frequency rise that peaked at approximately Hz before being stabilised by the VSM. In parallel, Figure 13 shows a voltage excursion above p.u., which activated the PV inverter’s reactive current injection. The PV delivered about p.u. of reactive current in proportion to the deviation, providing valuable voltage support.
The active power dynamics are shown in Figure 13: while the PV continued to inject active power, the VSM rapidly shifted its output negative, absorbing the surplus generation to counterbalance the mismatch. This action damped the frequency excursion and restored stability around the islanded load demand.
Although the PV contributed effective voltage support, it could not regulate frequency on its own. By contrast, the VSM autonomously stabilised both frequency and voltage, ensuring continuity of supply. This test therefore highlights the complementary roles of the two inverters: the grid-following PV supports voltage through reactive current injection, but only the grid-forming VSM sustains stable islanded operation and provides frequency control after system split.
5.0.4. Power Imbalance During Island Mode and Converter Stress
The impact of active-power imbalance during islanded operation was assessed in a scenario where the PV system was rated at 1.5 MW, while the grid-forming VSM converter had a nominal capacity of 1.0 MW. Following the system split, the VSM was required to absorb the excess generation from the PV. As shown in Figure 14, this resulted in an absorbed power of approximately MW.
The overload can be quantified relative to the converter’s nominal rating as follows:
Such overloading places considerable stress on the converter’s semiconductor devices and thermal management system, leading to increased junction temperatures, accelerated device aging, and reduced long-term reliability. Although the VSM successfully stabilised frequency and voltage in the short term, sustained operation under this condition would be unsafe.
These results explain the importance of supervisory strategies to prevent prolonged overloads. Possible approaches include curtailing PV generation, implementing fast-acting demand-side management, or diverting surplus power into local energy storage. Keeping the VSM within its rated v is essential not only for immediate stability but also for protecting the converter’s lifetime and ensuring reliable long-term operation.
From a compliance perspective, it should be noted that while ENTSO-E grid codes explicitly require frequency support functions such as LFSM-U and fault ride-through capability, they do not mandate overload absorption beyond converter ratings. Therefore, system-level supervisory control is indispensable to ensure that generation and demand remain balanced in islanded operation without exposing the VSM to sustained overstress.
6. Conclusions
This work presented a comprehensive assessment of Virtual Synchronous Machines (VSMs) as grid-forming inverters in converter-dominated networks. Two complementary case studies were carried out in DIgSILENT PowerFactory: a standalone benchmark feeder and a mixed feeder subjected to a system split event.
The benchmark results showed that the VSM consistently reproduced synchronous machine characteristics. It provided synthetic inertia during fast frequency ramps, delivered sustained active power through LFSM-U in accordance with ENTSO-E requirements, and remained stable under severe RoCoF conditions. In addition, the VSM demonstrated fault ride-through capability and maintained autonomous voltage and frequency regulation in islanded operation.
The system-split test highlighted the complementary yet distinct roles of grid-forming and grid-following converters. The PV inverter (GFL) met LFSM-O and FRT requirements and provided reactive support during voltage excursions. However, when the external grid reference disappeared, it could not maintain stable operation until the VSM re-established a local grid reference (Figure 13). The VSM (GFM) formed the island, restored the voltage–frequency reference, absorbed surplus PV generation, and preserved continuity of supply, with a brief period of controlled overload as shown in Figure 14.
Overall, the results highlight the essential contribution of VSMs to the stability and resilience of converter-dominated grids. They confirm that standardized benchmarks must be complemented by split- and islanding-type scenarios to capture the full range of grid-forming capabilities. Future work will focus on supervisory coordination and storage integration to alleviate converter overloading and enhance long-term reliability.
References
- Saleh, A.M.; István, V.; Khan, M.A.; Waseem, M.; Ali Ahmed, A.N. Power system stability in the Era of energy Transition: Importance, Opportunities, Challenges, and future directions. Energy Conversion and Management: X 2024, 24, 100820. [Google Scholar] [CrossRef]
- He, C.; Geng, H.; Rajashekara, K.; Chandra, A. Analysis and Control of Frequency Stability in Low-Inertia Power Systems: A Review. IEEE/CAA Journal of Automatica Sinica 2024, 11, 2363–2383. [Google Scholar] [CrossRef]
- Saeedian, M.; Pournazarian, B.; Seyedalipour, S.S.; Eskandari, B.; Pouresmaeil, E. Emulating Rotational Inertia of Synchronous Machines by a New Control Technique in Grid-Interactive Converters. Sustainability Publisher Multidisciplinary Digital Publishing Institute. 2020, 12, 5346. [Google Scholar] [CrossRef]
- van der Vleuten, E.; Lagendijk, V. Transnational infrastructure vulnerability: The historical shaping of the 2006 European “Blackout”. Energy Policy 2010, 38, 2042–2052. [Google Scholar] [CrossRef]
- Yan, R.; Masood, N.A.; Kumar Saha, T.; Bai, F.; Gu, H. The Anatomy of the 2016 South Australia Blackout: A Catastrophic Event in a High Renewable Network. IEEE Transactions on Power Systems 2018, 33, 5374–5388. [Google Scholar] [CrossRef]
- Bell, K. The Texas blackouts and security of supply challenges in Britain.
- Zeb, K.; Islam, S.U.; Khan, I.; Uddin, W.; Ishfaq, M.; Curi Busarello, T.D.; Muyeen, S.; Ahmad, I.; Kim, H. Faults and Fault Ride Through strategies for grid-connected photovoltaic system: A comprehensive review. Renewable and Sustainable Energy Reviews 2022, 158, 112125. [Google Scholar] [CrossRef]
- Rodrigues, J.; Moreira, C.; Lopes, J.P. Fault-Ride-Through Approach for Grid-Tied Smart Transformers without Local Energy Storage. Energies Multidisciplinary Digital Publishing Institute. 2021, 14, 5622. [Google Scholar] [CrossRef]
- Johnson, A. ENTSO-E Requirements for Generators - Interpretation.
- Vartanian, C. Introduction to IEEE 1547 Standard For Interconnecting Distributed Energy Resources with Electric Power Systems.
- Sturzeanu, M. Report on the contribution to standardization.
- Geng, S.; Hiskens, I.A. Unified Grid-Forming/Following Inverter Control. IEEE Open Access Journal of Power and Energy 2022, 9, 489–500. [Google Scholar] [CrossRef]
- Chatterjee, Debjyoti. From Grid Following to Grid Forming: Modeling, Control and Applications to Inverter-based Resources; Publisher: Unpublished, 2022. [Google Scholar] [CrossRef]
- Liu, Y.; Zhu, L.; Xu, X.; Li, D.; Liang, Z.; Ye, N. Transient Synchronization Stability in Grid-Following Converters: Mechanistic Insights and Technological Prospects—A Review. Energies Publisher Multidisciplinary Digital Publishing Institute. 2025, 18. [Google Scholar] [CrossRef]
- Lasseter, R.H.; Chen, Z.; Pattabiraman, D. Grid-Forming Inverters: A Critical Asset for the Power Grid. IEEE Journal of Emerging and Selected Topics in Power Electronics 2020, 8, 925–935. [Google Scholar] [CrossRef]
- Ahmed, F.; Al Kez, D.; McLoone, S.; Best, R.J.; Cameron, C.; Foley, A. Dynamic grid stability in low carbon power systems with minimum inertia. Renewable Energy 2023, 210, 486–506. [Google Scholar] [CrossRef]
- Shadoul, M.; Ahshan, R.; AlAbri, R.S.; Al-Badi, A.; Albadi, M.; Jamil, M. A Comprehensive Review on a Virtual-Synchronous Generator: Topologies, Control Orders and Techniques, Energy Storages, and Applications. Energies Multidisciplinary Digital Publishing Institute. 2022, 15, 8406. [Google Scholar] [CrossRef]
- Unruh, P.; Nuschke, M.; Strauß, P.; Welck, F. Overview on Grid-Forming Inverter Control Methods. Energies Multidisciplinary Digital Publishing Institute. 2020, 13, 2589. [Google Scholar] [CrossRef]
- Chen, Z.; Yao, J.; He, W.; Luo, Y.; Xie, H.; Zou, Z. Transient stability enhancement control strategy based on grid dispatching for multi-paralleled grid forming inverters during LVRT. International Journal of Electrical Power & Energy Systems 2024, 157, 109836. [Google Scholar] [CrossRef]
- Villada-Leon, C.A.; Posada Contreras, J.; Rosas-Caro, J.C.; Núñez-Rodríguez, R.A.; Valencia, J.C.; Valdez-Resendiz, J.E. Control Algorithm for an Inverter-Based Virtual Synchronous Generator with Adjustable Inertia. Eng 2025, 6, 231. [Google Scholar] [CrossRef]
- Alassi, A.; Feng, Z.; Ahmed, K.; Syed, M.; Egea-Alvarez, A.; Foote, C. Grid-forming VSM control for black-start applications with experimental PHiL validation. International Journal of Electrical Power & Energy Systems 2023, 151, 109119. [Google Scholar] [CrossRef]
- Massive InteGRATion of power Electronic devices | MIGRATE | Project | Fact Sheet | H2020 | CORDIS | European Commission.
- Kroposki, B. UNIFI Specifications for Grid-Forming Inverter-Based Resources: Version 2.
- Kersic, M.; Müller, T.; GmbH, B.; Lewis, E.; Schaupp, T.; Denninger, R.; Ernst, P.; Reichert, S.; Rogalla, S.; Singer, R.; et al. Testing Characteristics of Grid Forming Converters Part I: Specification and Definition of Behaviour.
- Dsilva, S.; Zare, A.; Shadmand, M.; Bayhan, S.; Abu-Rub, H. Towards Resiliency Enhancement of Network of Grid-Forming and Grid-Following Inverters 2023.
- Rogalla, S.; Greulich, A.; Lehner, J.; Lens, H.; Ernst, P.; Schaupp, T.; Singer, R.; Ungerland, J.; Schöll, C.; Denninger, R.; et al. Grid forming converters in interconnected systems - final results from the joint research project VerbundnetzStabil. In Proceedings of the 20th International Workshop on Large-Scale Integration of Wind Power into Power Systems as well as on Transmission Networks for Offshore Wind Power Plants (WIW 2021); 2021; Vol. 2021, pp. 135–140. [Google Scholar] [CrossRef]
- Quintero-Durán, M.J.; Candelo-Becerra, J.E.; González-Niño, M.E.; Hernández-Moreno, S.A.; Váz, R.F. Synchronverter Control Strategy: A Review of Different Improvements and Applications. Energies Publisher Multidisciplinary Digital Publishing Institute. 2025, 18, 3574. [Google Scholar] [CrossRef]
- Anttila, S.; Döhler, J.S.; Oliveira, J.G.; Boström, C. Grid Forming Inverters: A Review of the State of the Art of Key Elements for Microgrid Operation. Energies Publisher Multidisciplinary Digital Publishing Institute. 2022, 15, 5517. [Google Scholar] [CrossRef]
Figure 1.
VSM Benchmark Distribution Grid
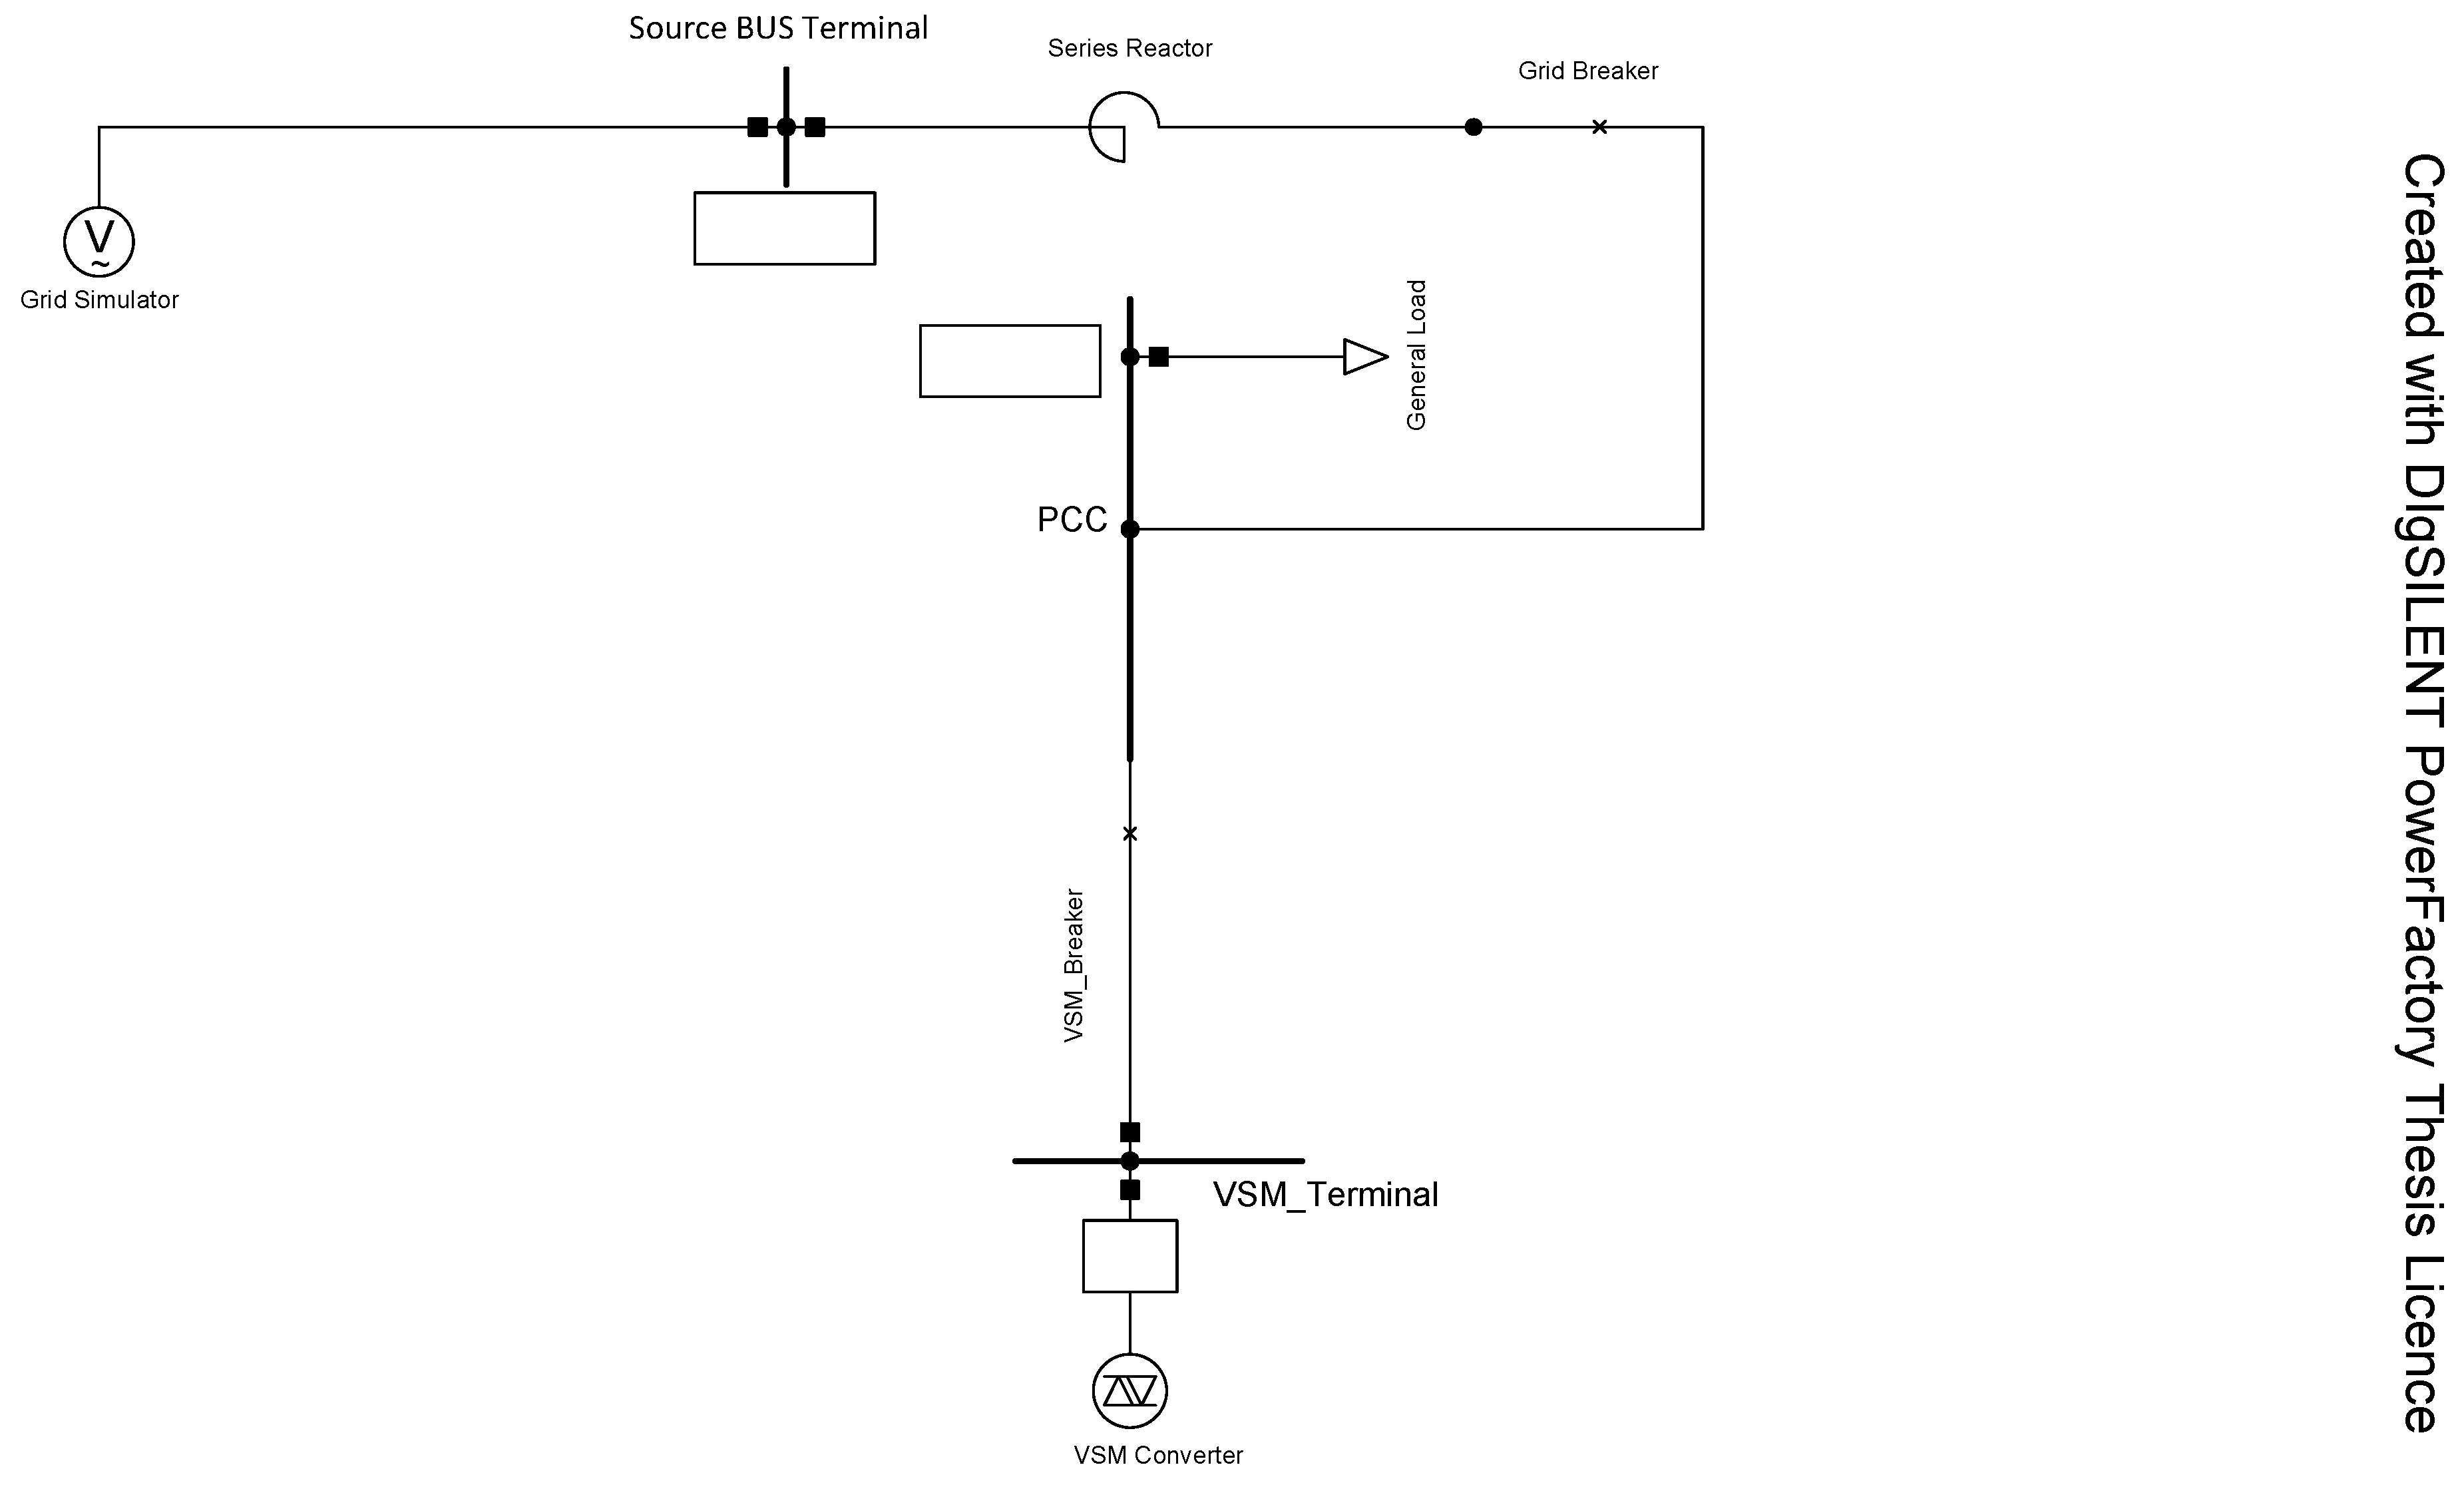
Figure 3.
Composite VSM model in PowerFactory: measurements and power calculation feed the VSM core and AC voltage controller; virtual impedance and inner loops condition the converter references.
Figure 3.
Composite VSM model in PowerFactory: measurements and power calculation feed the VSM core and AC voltage controller; virtual impedance and inner loops condition the converter references.
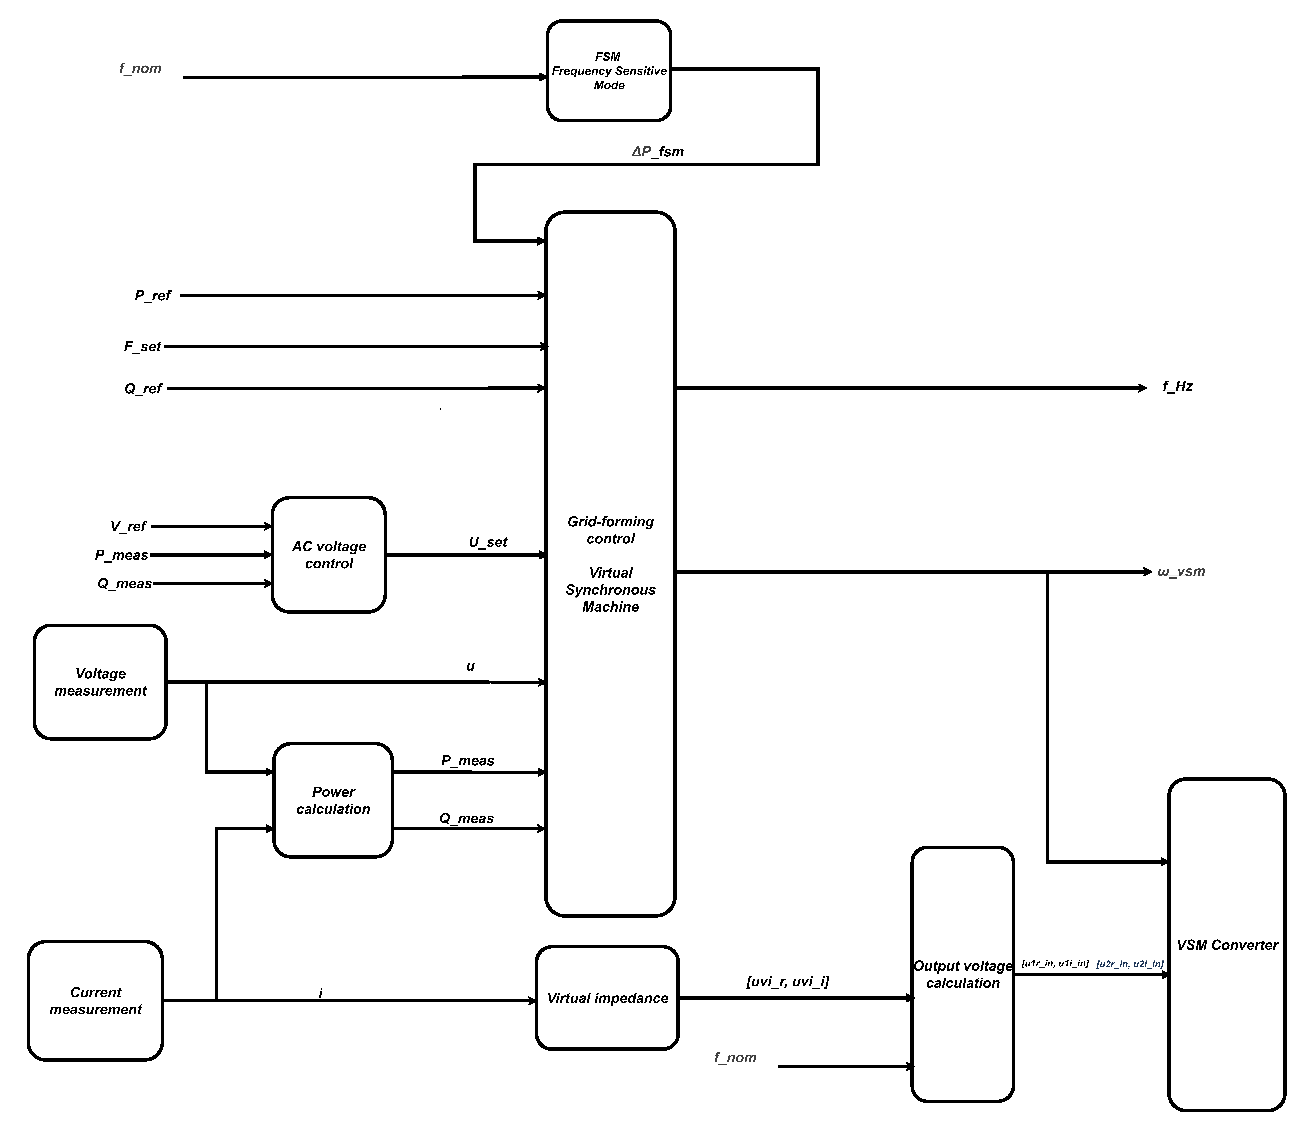
Figure 5.
Inertia and LFSM-U response of the VSM. The converter first injects additional active power due to synthetic inertia during the negative RoCoF, and subsequently sustains power injection once the LFSM-U threshold (49.8 Hz) is crossed, with a proportional rise in converter current.
Figure 5.
Inertia and LFSM-U response of the VSM. The converter first injects additional active power due to synthetic inertia during the negative RoCoF, and subsequently sustains power injection once the LFSM-U threshold (49.8 Hz) is crossed, with a proportional rise in converter current.
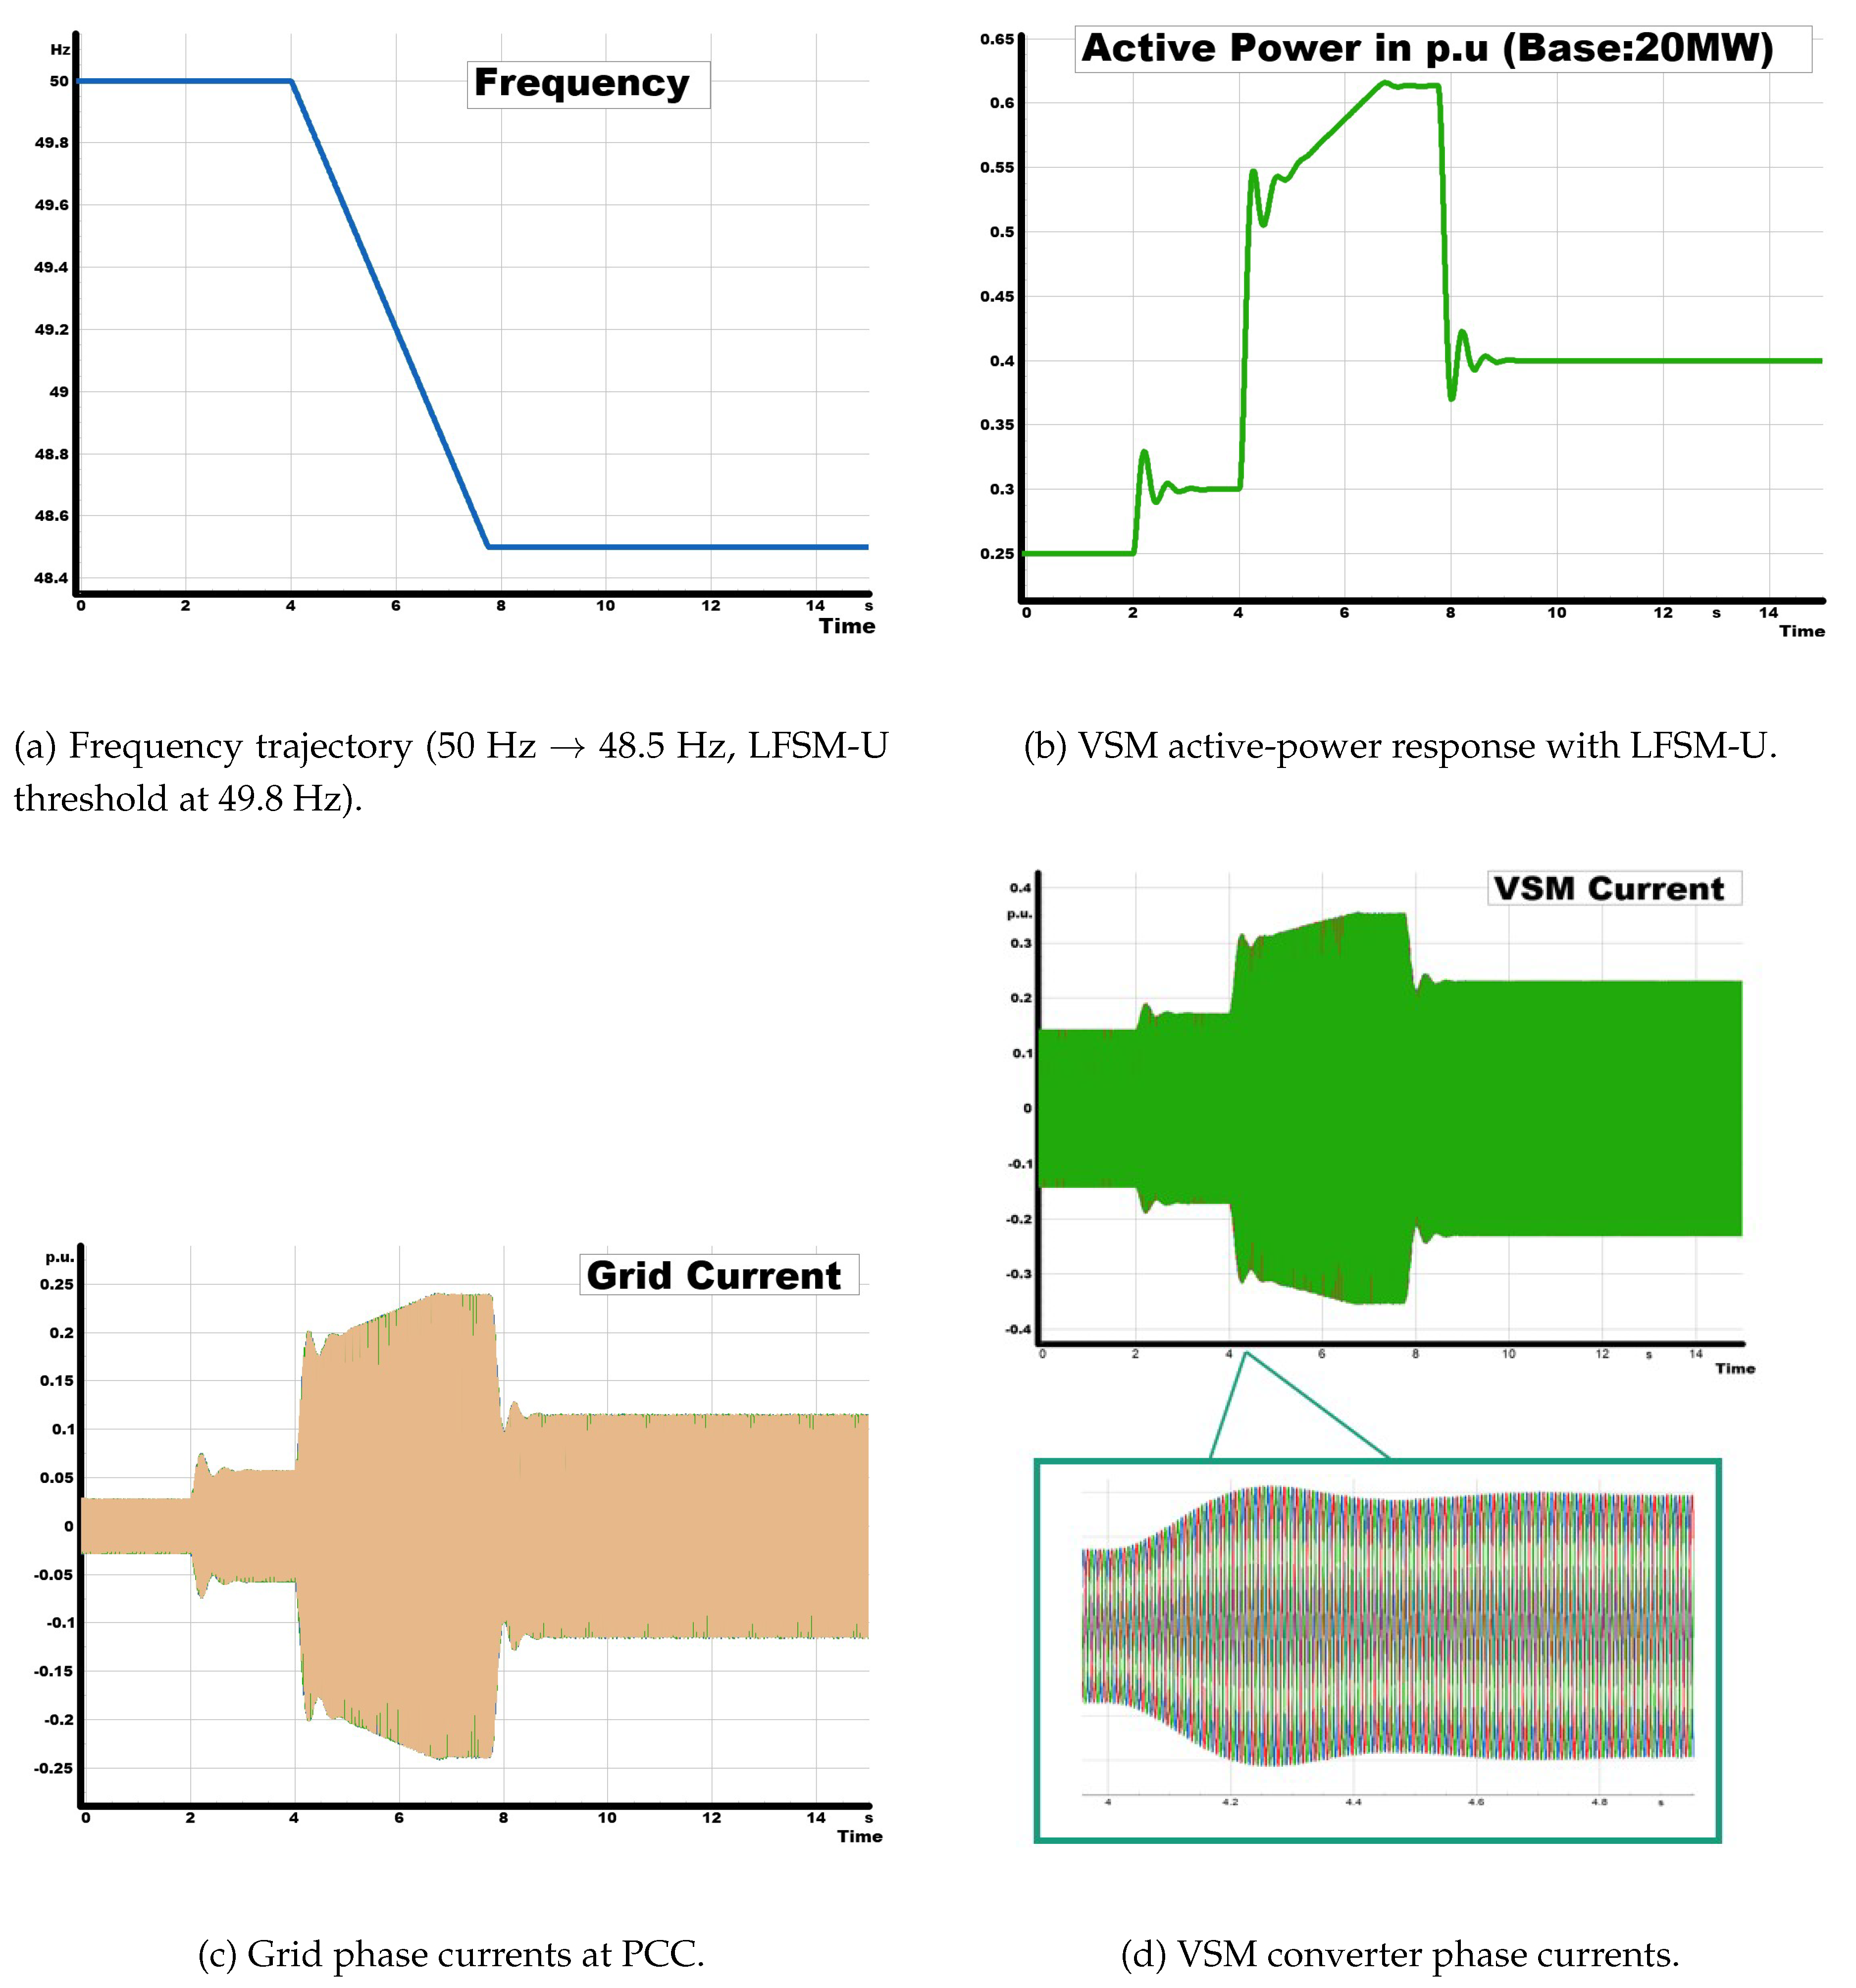
Figure 6.
VSM performance during fault ride-through (FRT) and islanding. (a) The VSM maintains sinusoidal voltage despite a short-circuit and after grid disconnection. (b) Grid current collapses after islanding, while VSM current sustains the load. (c) Reactive power injection supports FRT and stabilizes in islanded mode.
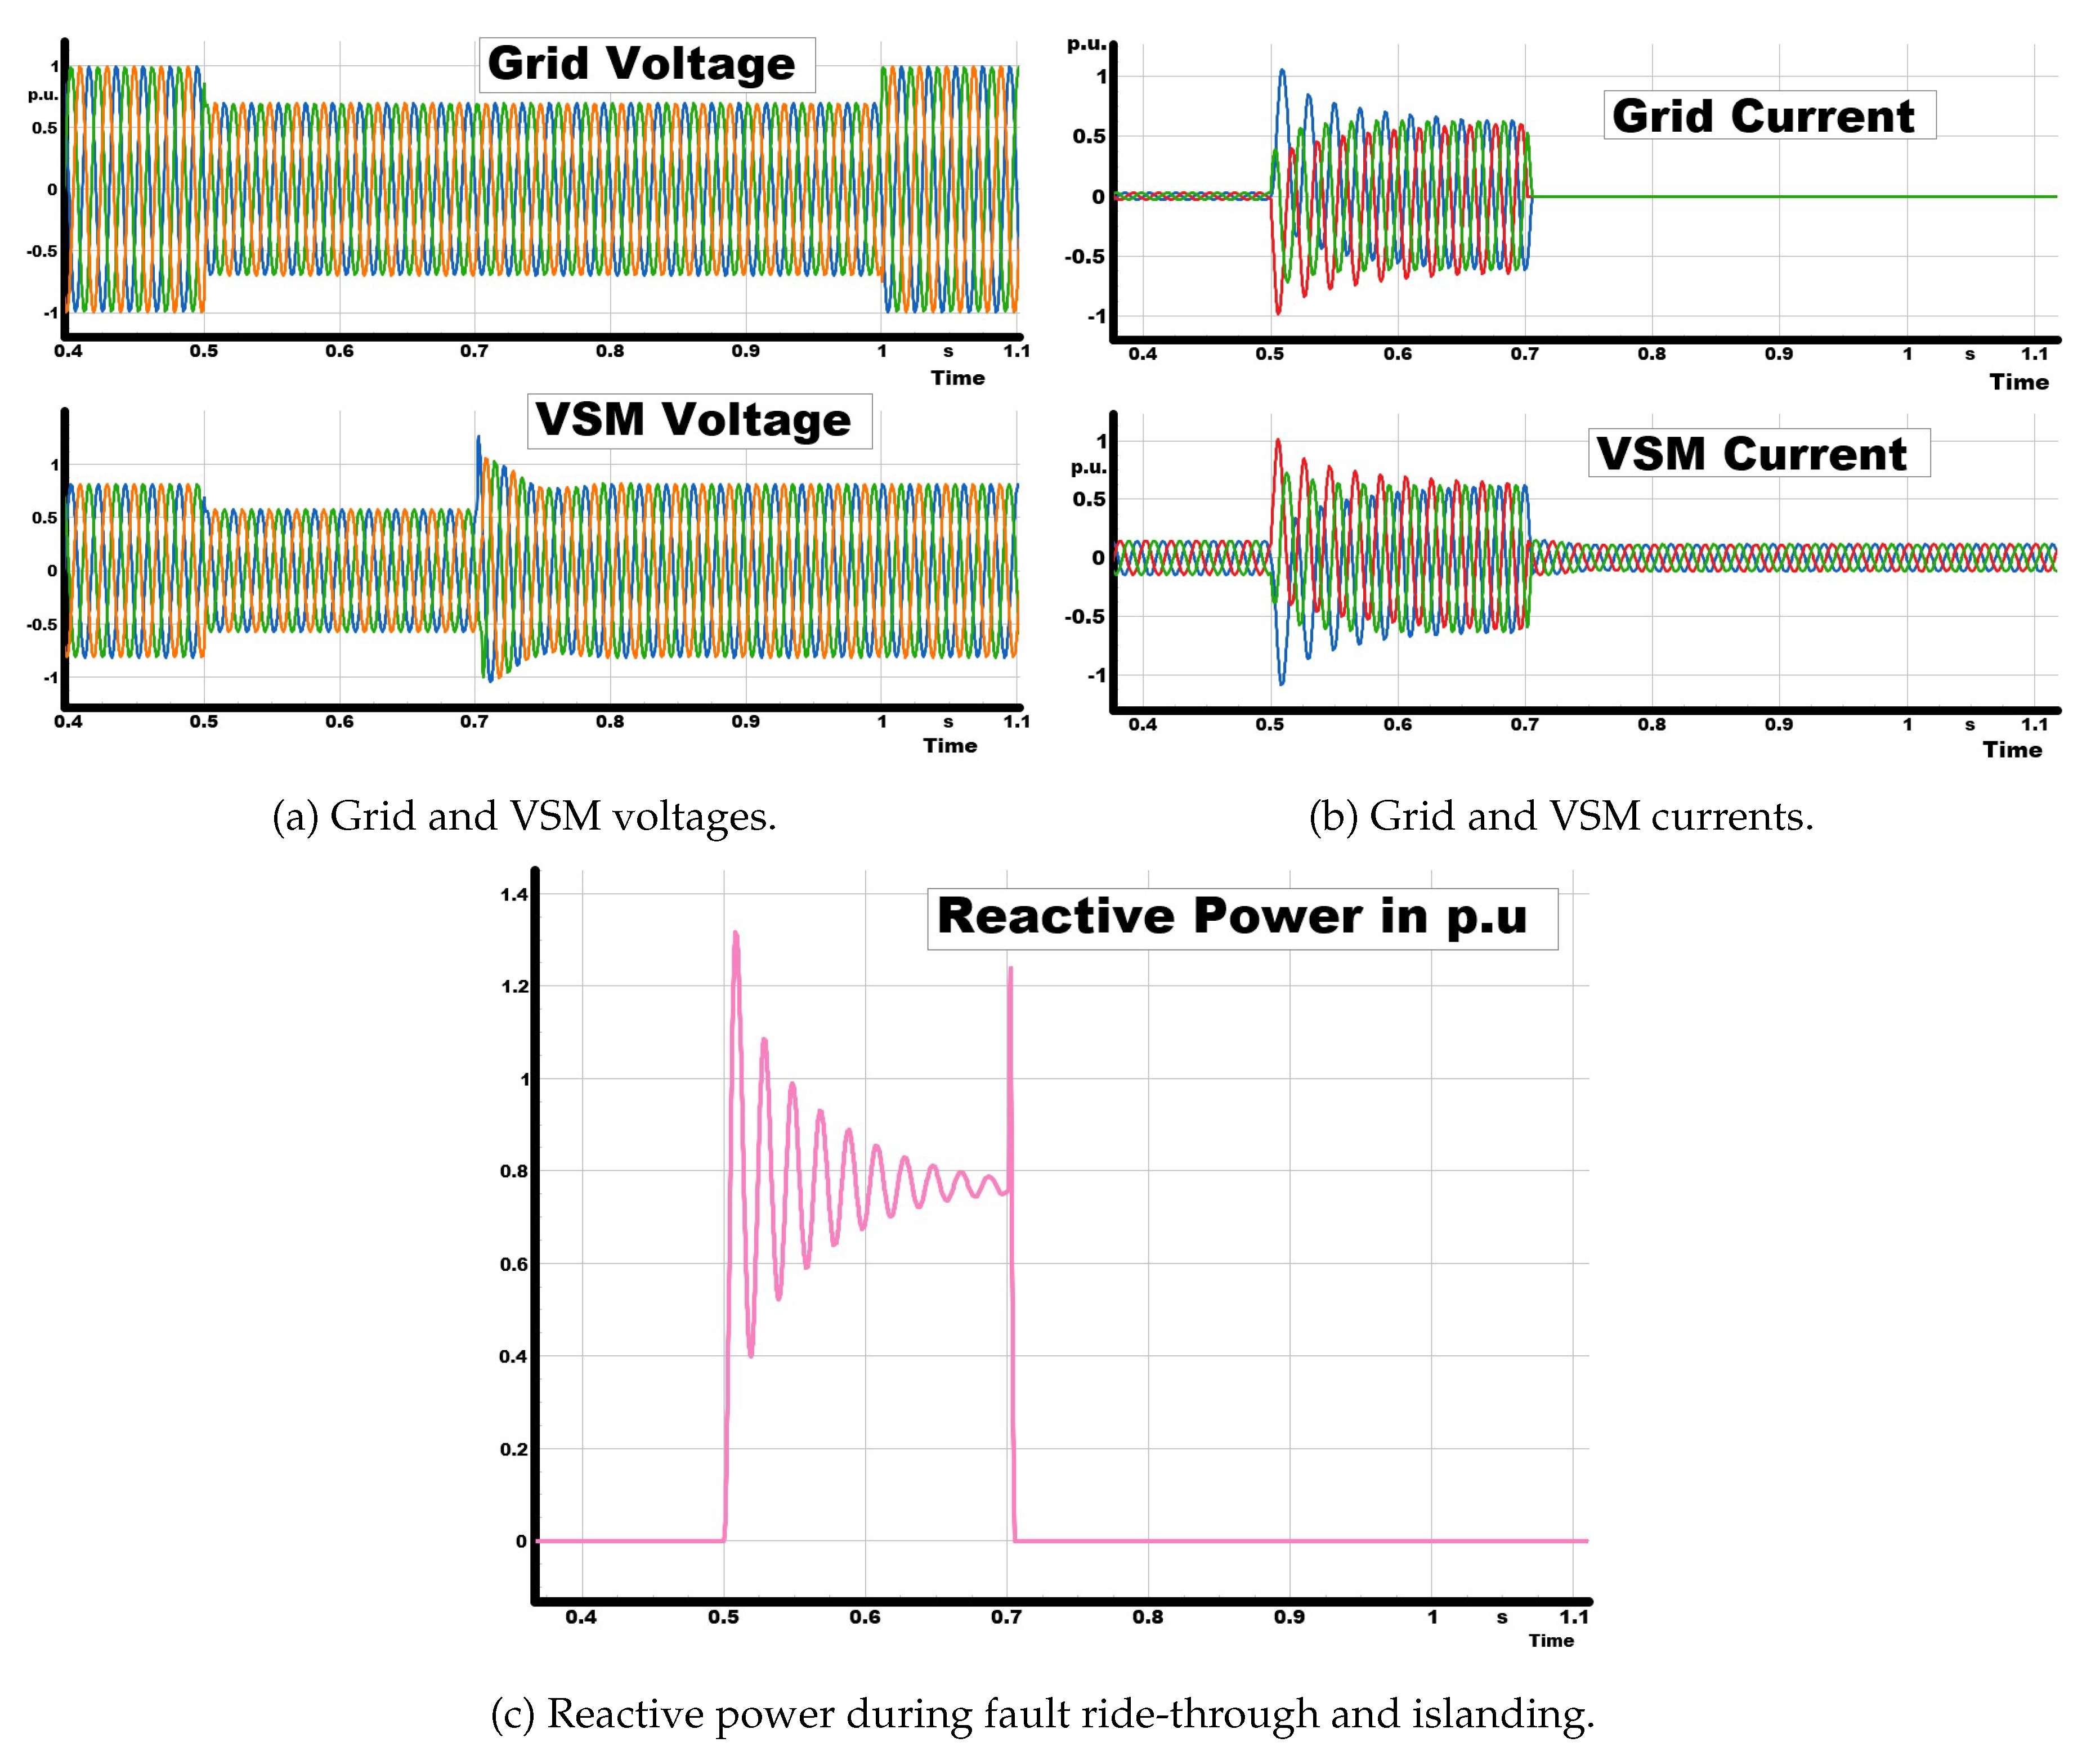
Figure 7.
Critical RoCoF performance of the VSM under Hz/s frequency ramps. The converter sustains synchronization, provides virtual inertia, and respects current limits across all phases.
Figure 7.
Critical RoCoF performance of the VSM under Hz/s frequency ramps. The converter sustains synchronization, provides virtual inertia, and respects current limits across all phases.
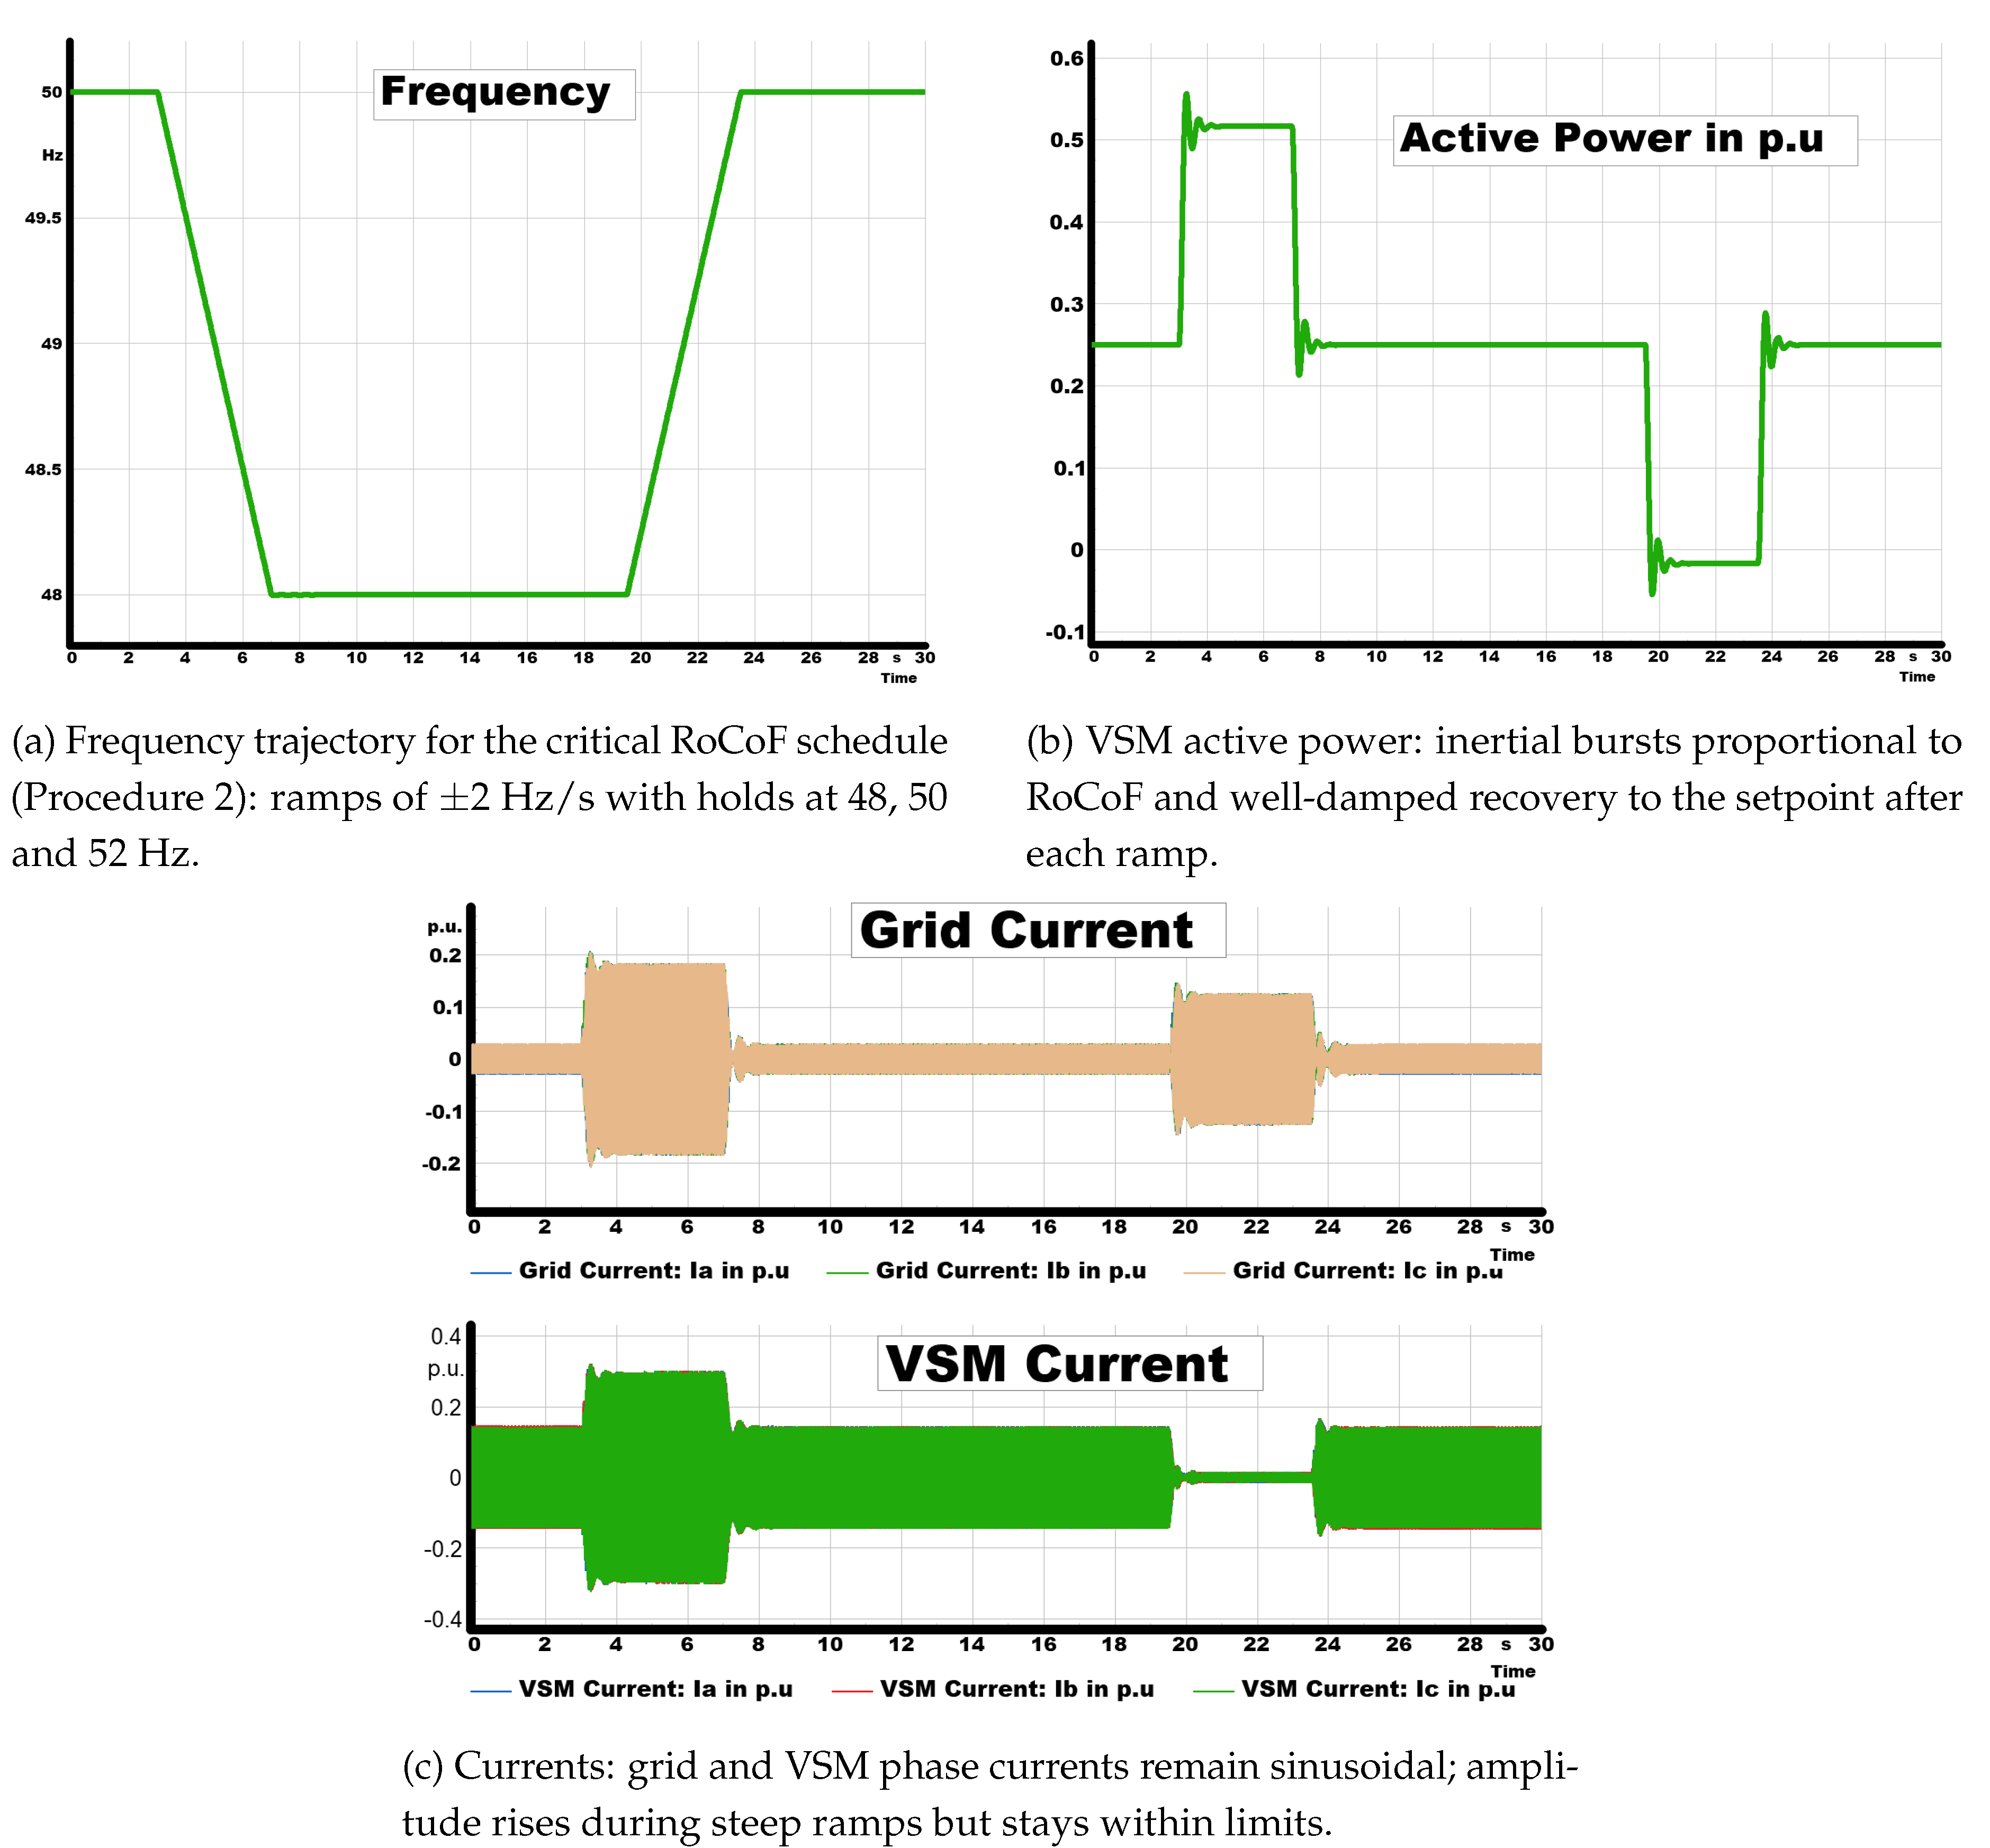
Figure 8.
Combined event results: (a) frequency response, (b) VSM active power, (c) grid current, and (d) VSM current during the phase-angle and RoCoF disturbance. The VSM converter maintains grid support by injecting active power and ensuring stable current delivery.
Figure 8.
Combined event results: (a) frequency response, (b) VSM active power, (c) grid current, and (d) VSM current during the phase-angle and RoCoF disturbance. The VSM converter maintains grid support by injecting active power and ensuring stable current delivery.
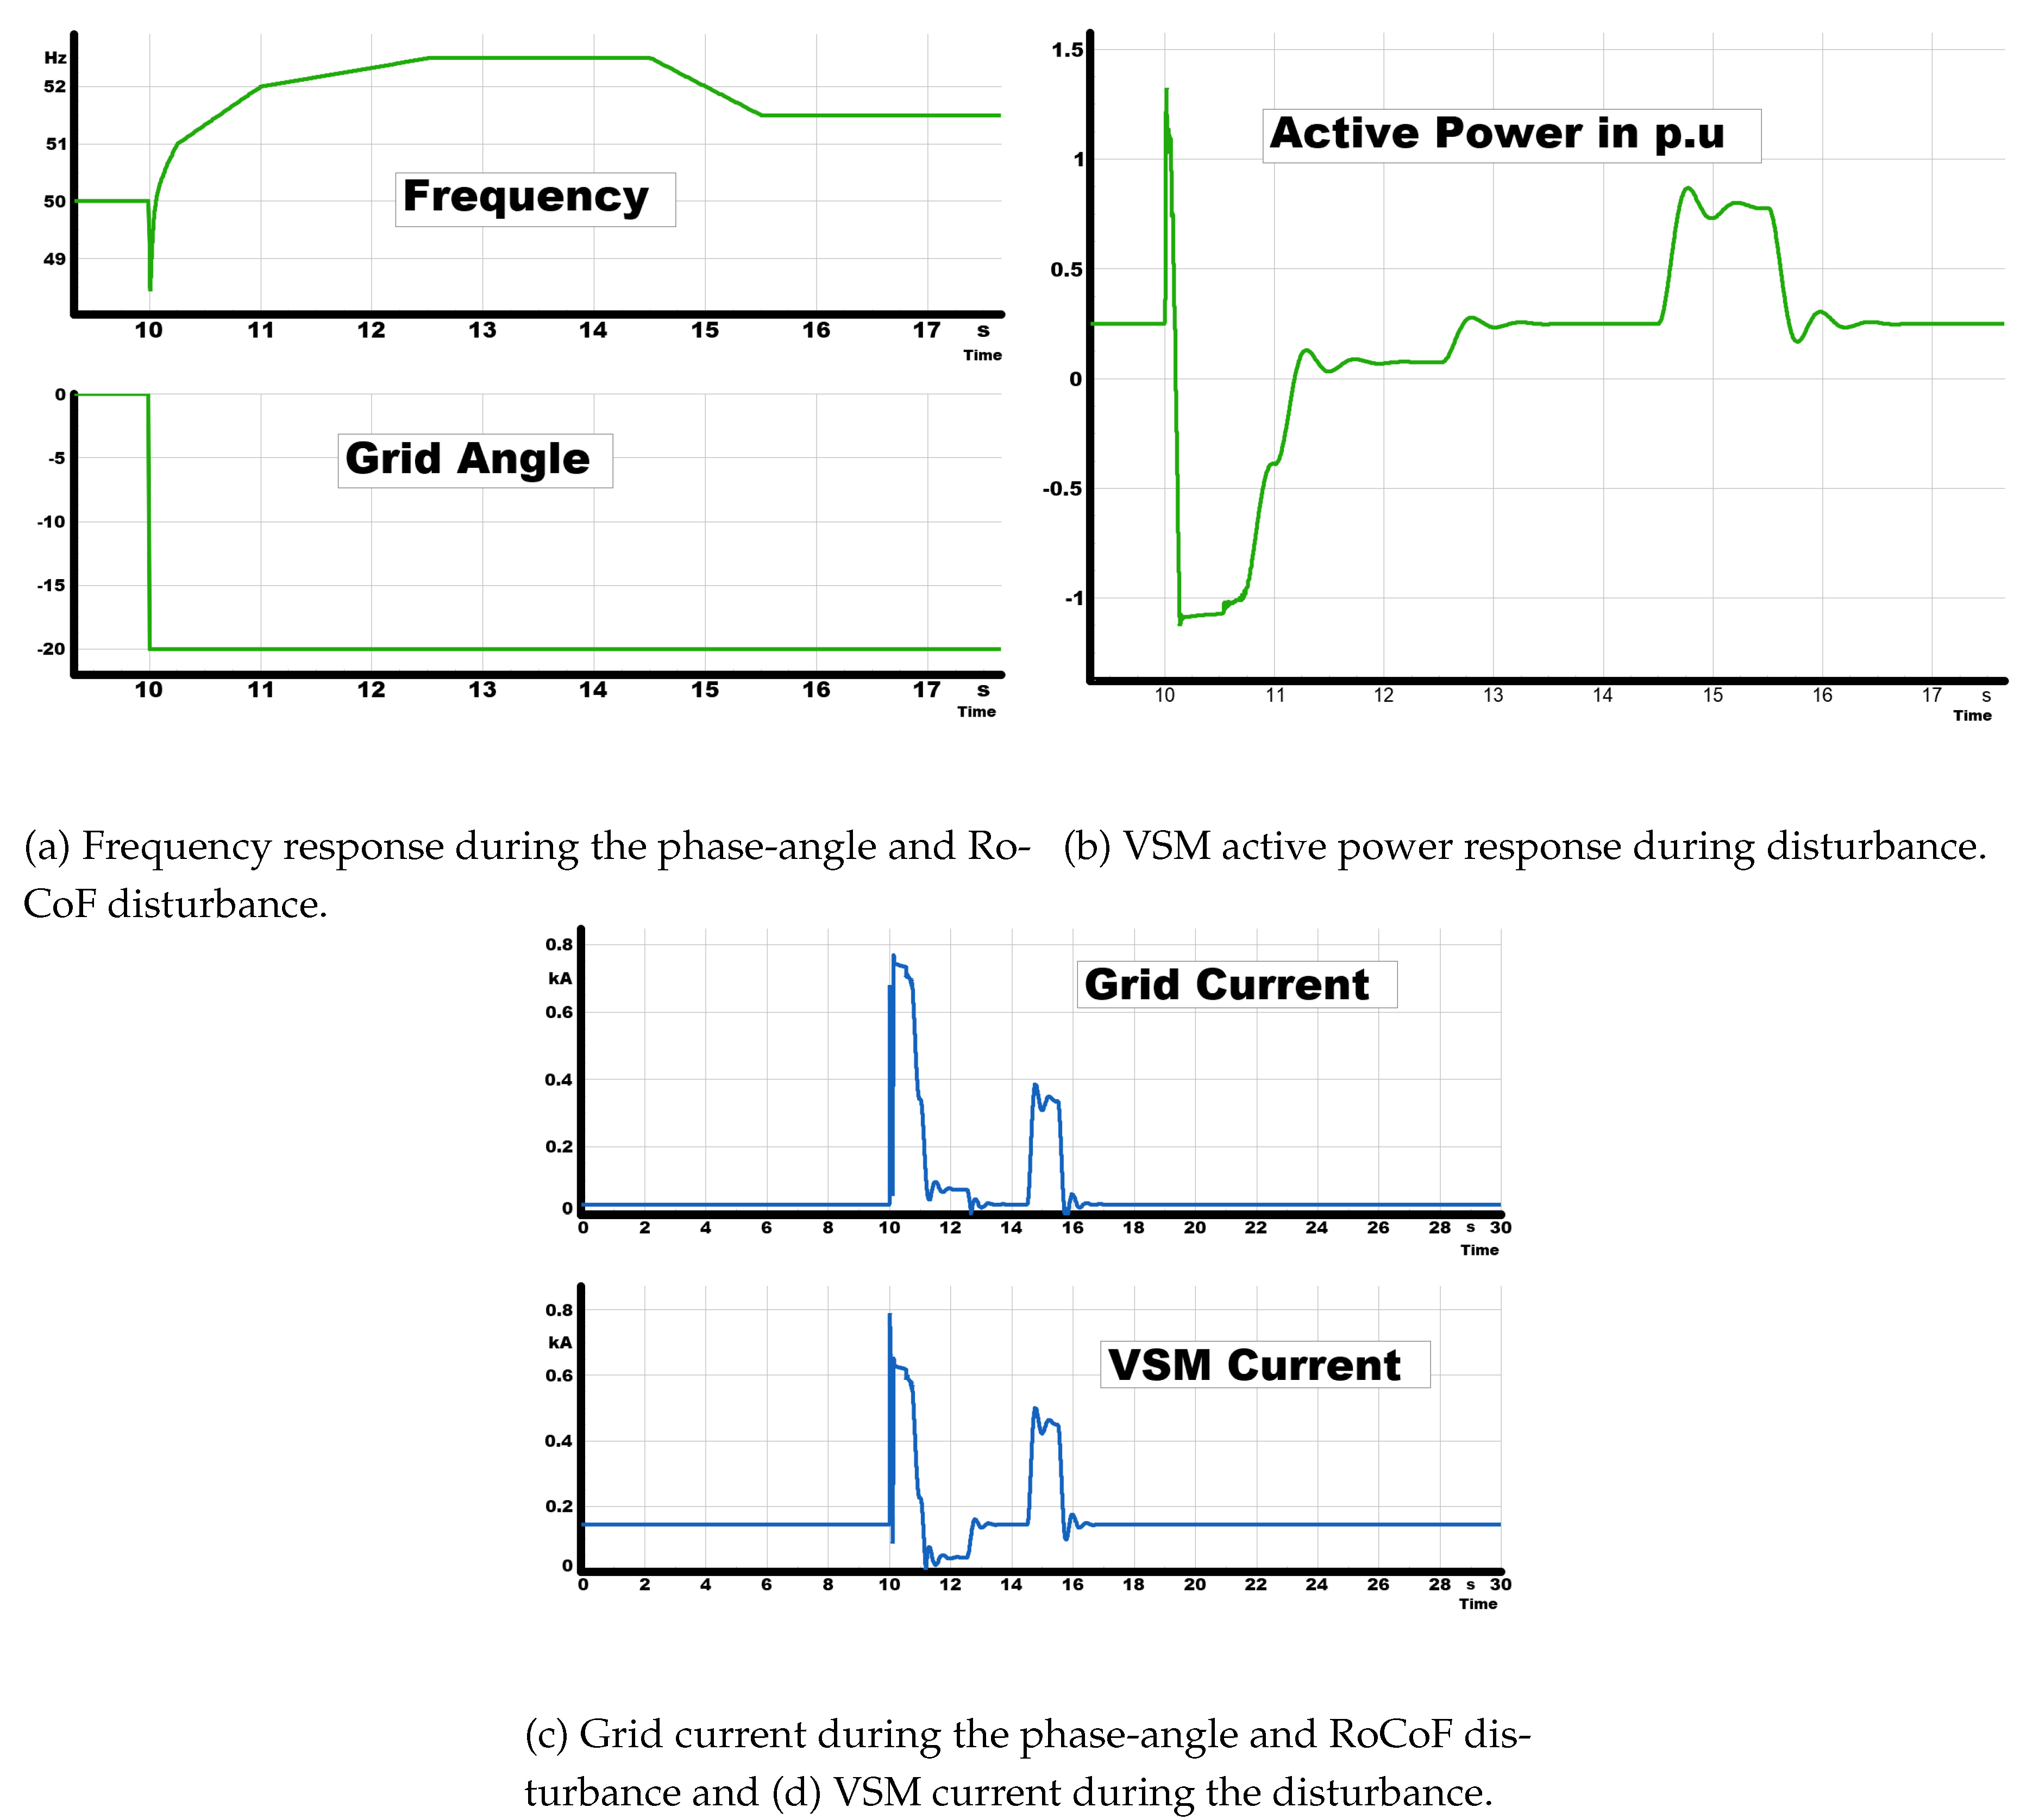
Figure 9.
System Split with VSM and Grid-Following PV

Figure 10.
Simplified control structure of the grid-following PV inverter, including PLL synchronization, power control, LFSM-O, FRT, and current limitation.
Figure 10.
Simplified control structure of the grid-following PV inverter, including PLL synchronization, power control, LFSM-O, FRT, and current limitation.
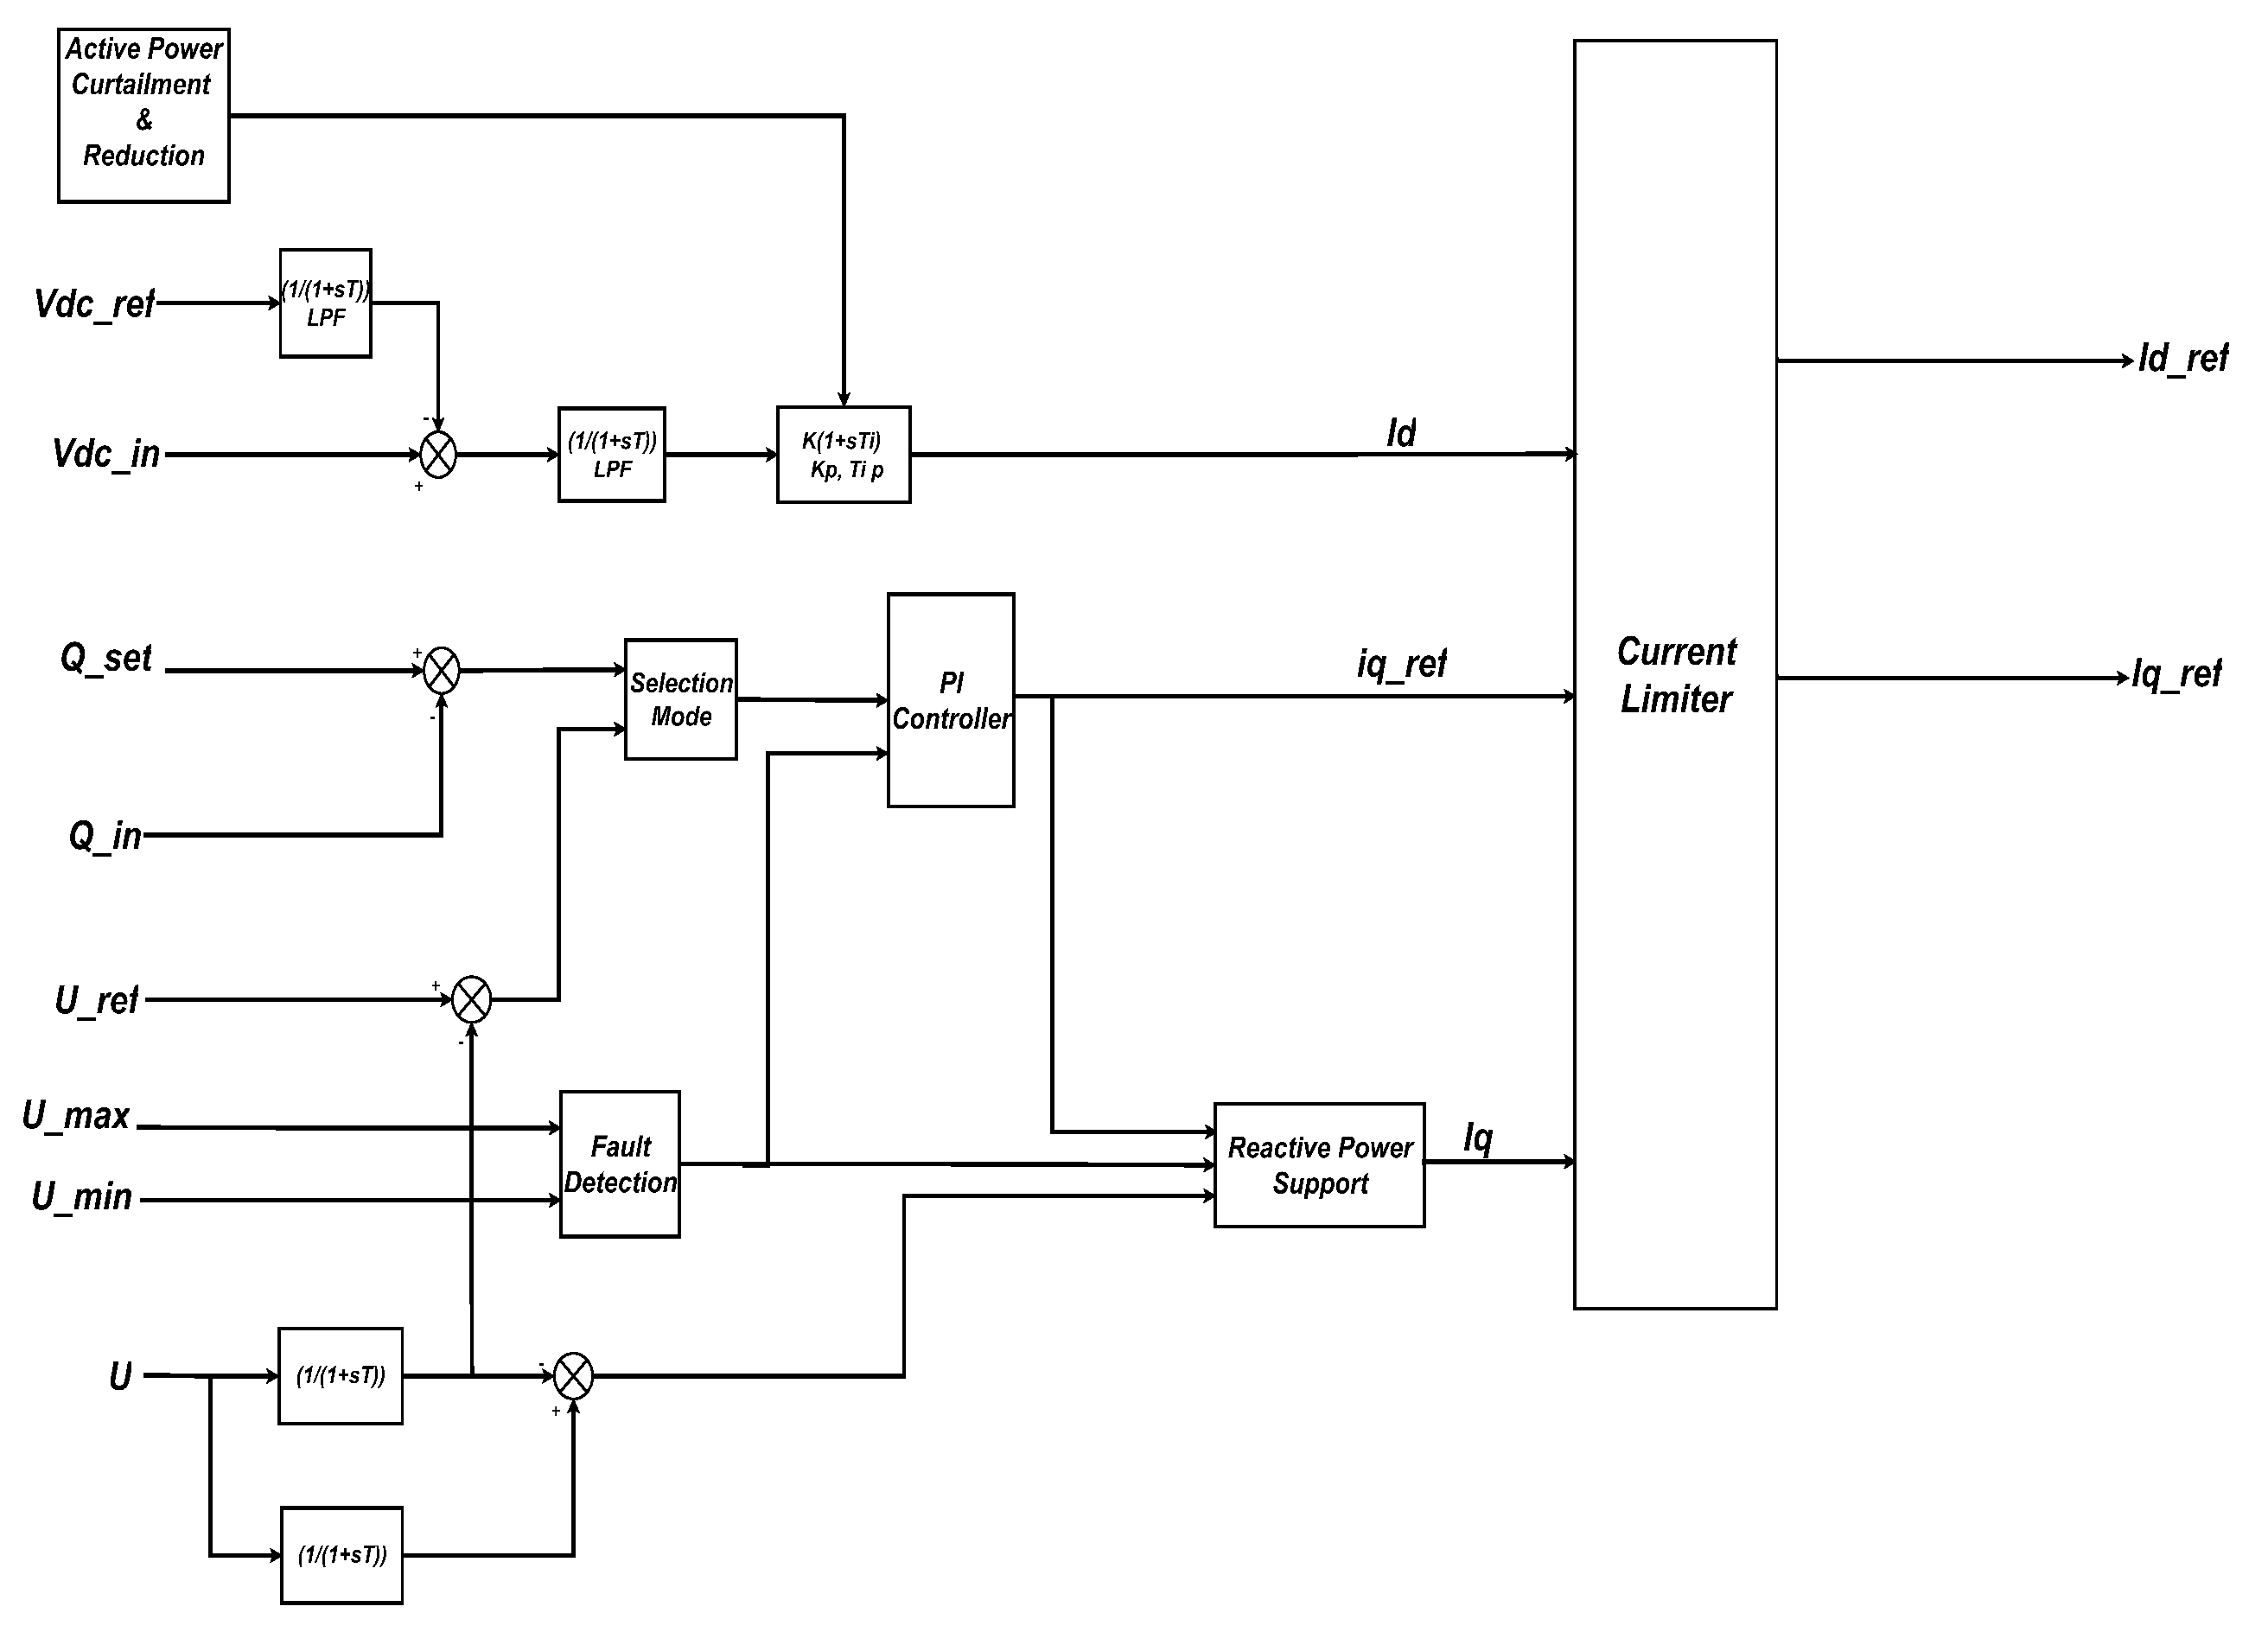
Figure 11.
LFSM-O test of the grid-following PV inverter. The inverter curtails active power once the frequency rises above the 50.2 Hz threshold, ensuring compliance with ENTSO-E requirements.
Figure 11.
LFSM-O test of the grid-following PV inverter. The inverter curtails active power once the frequency rises above the 50.2 Hz threshold, ensuring compliance with ENTSO-E requirements.
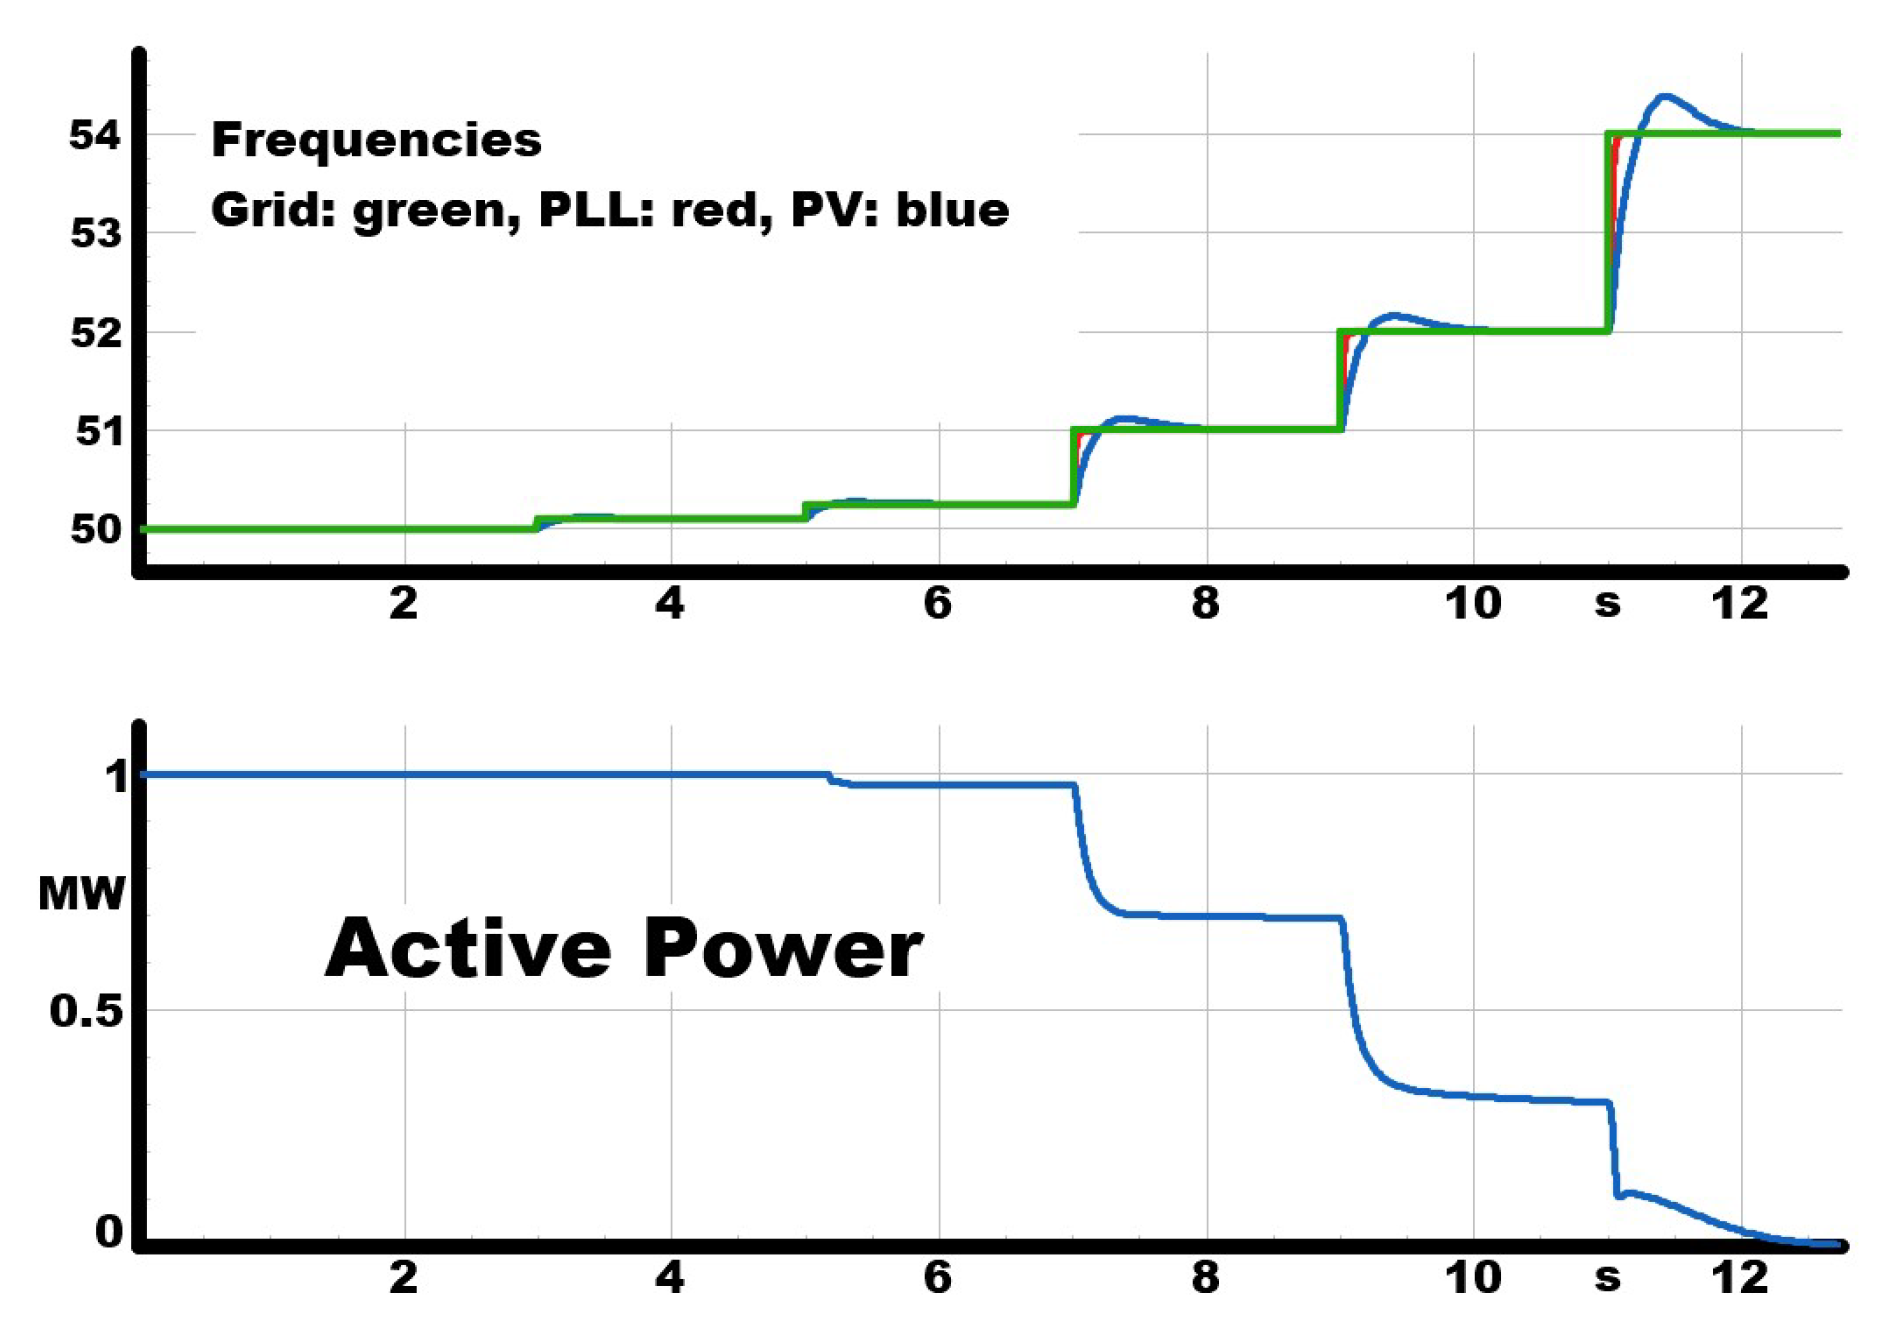
Figure 12.
FRT test of the grid-following PV inverter. The inverter injects reactive current according to the droop law when the grid voltage exceeds 1.1 p.u., reaching p.u. and supporting voltage recovery.
Figure 12.
FRT test of the grid-following PV inverter. The inverter injects reactive current according to the droop law when the grid voltage exceeds 1.1 p.u., reaching p.u. and supporting voltage recovery.
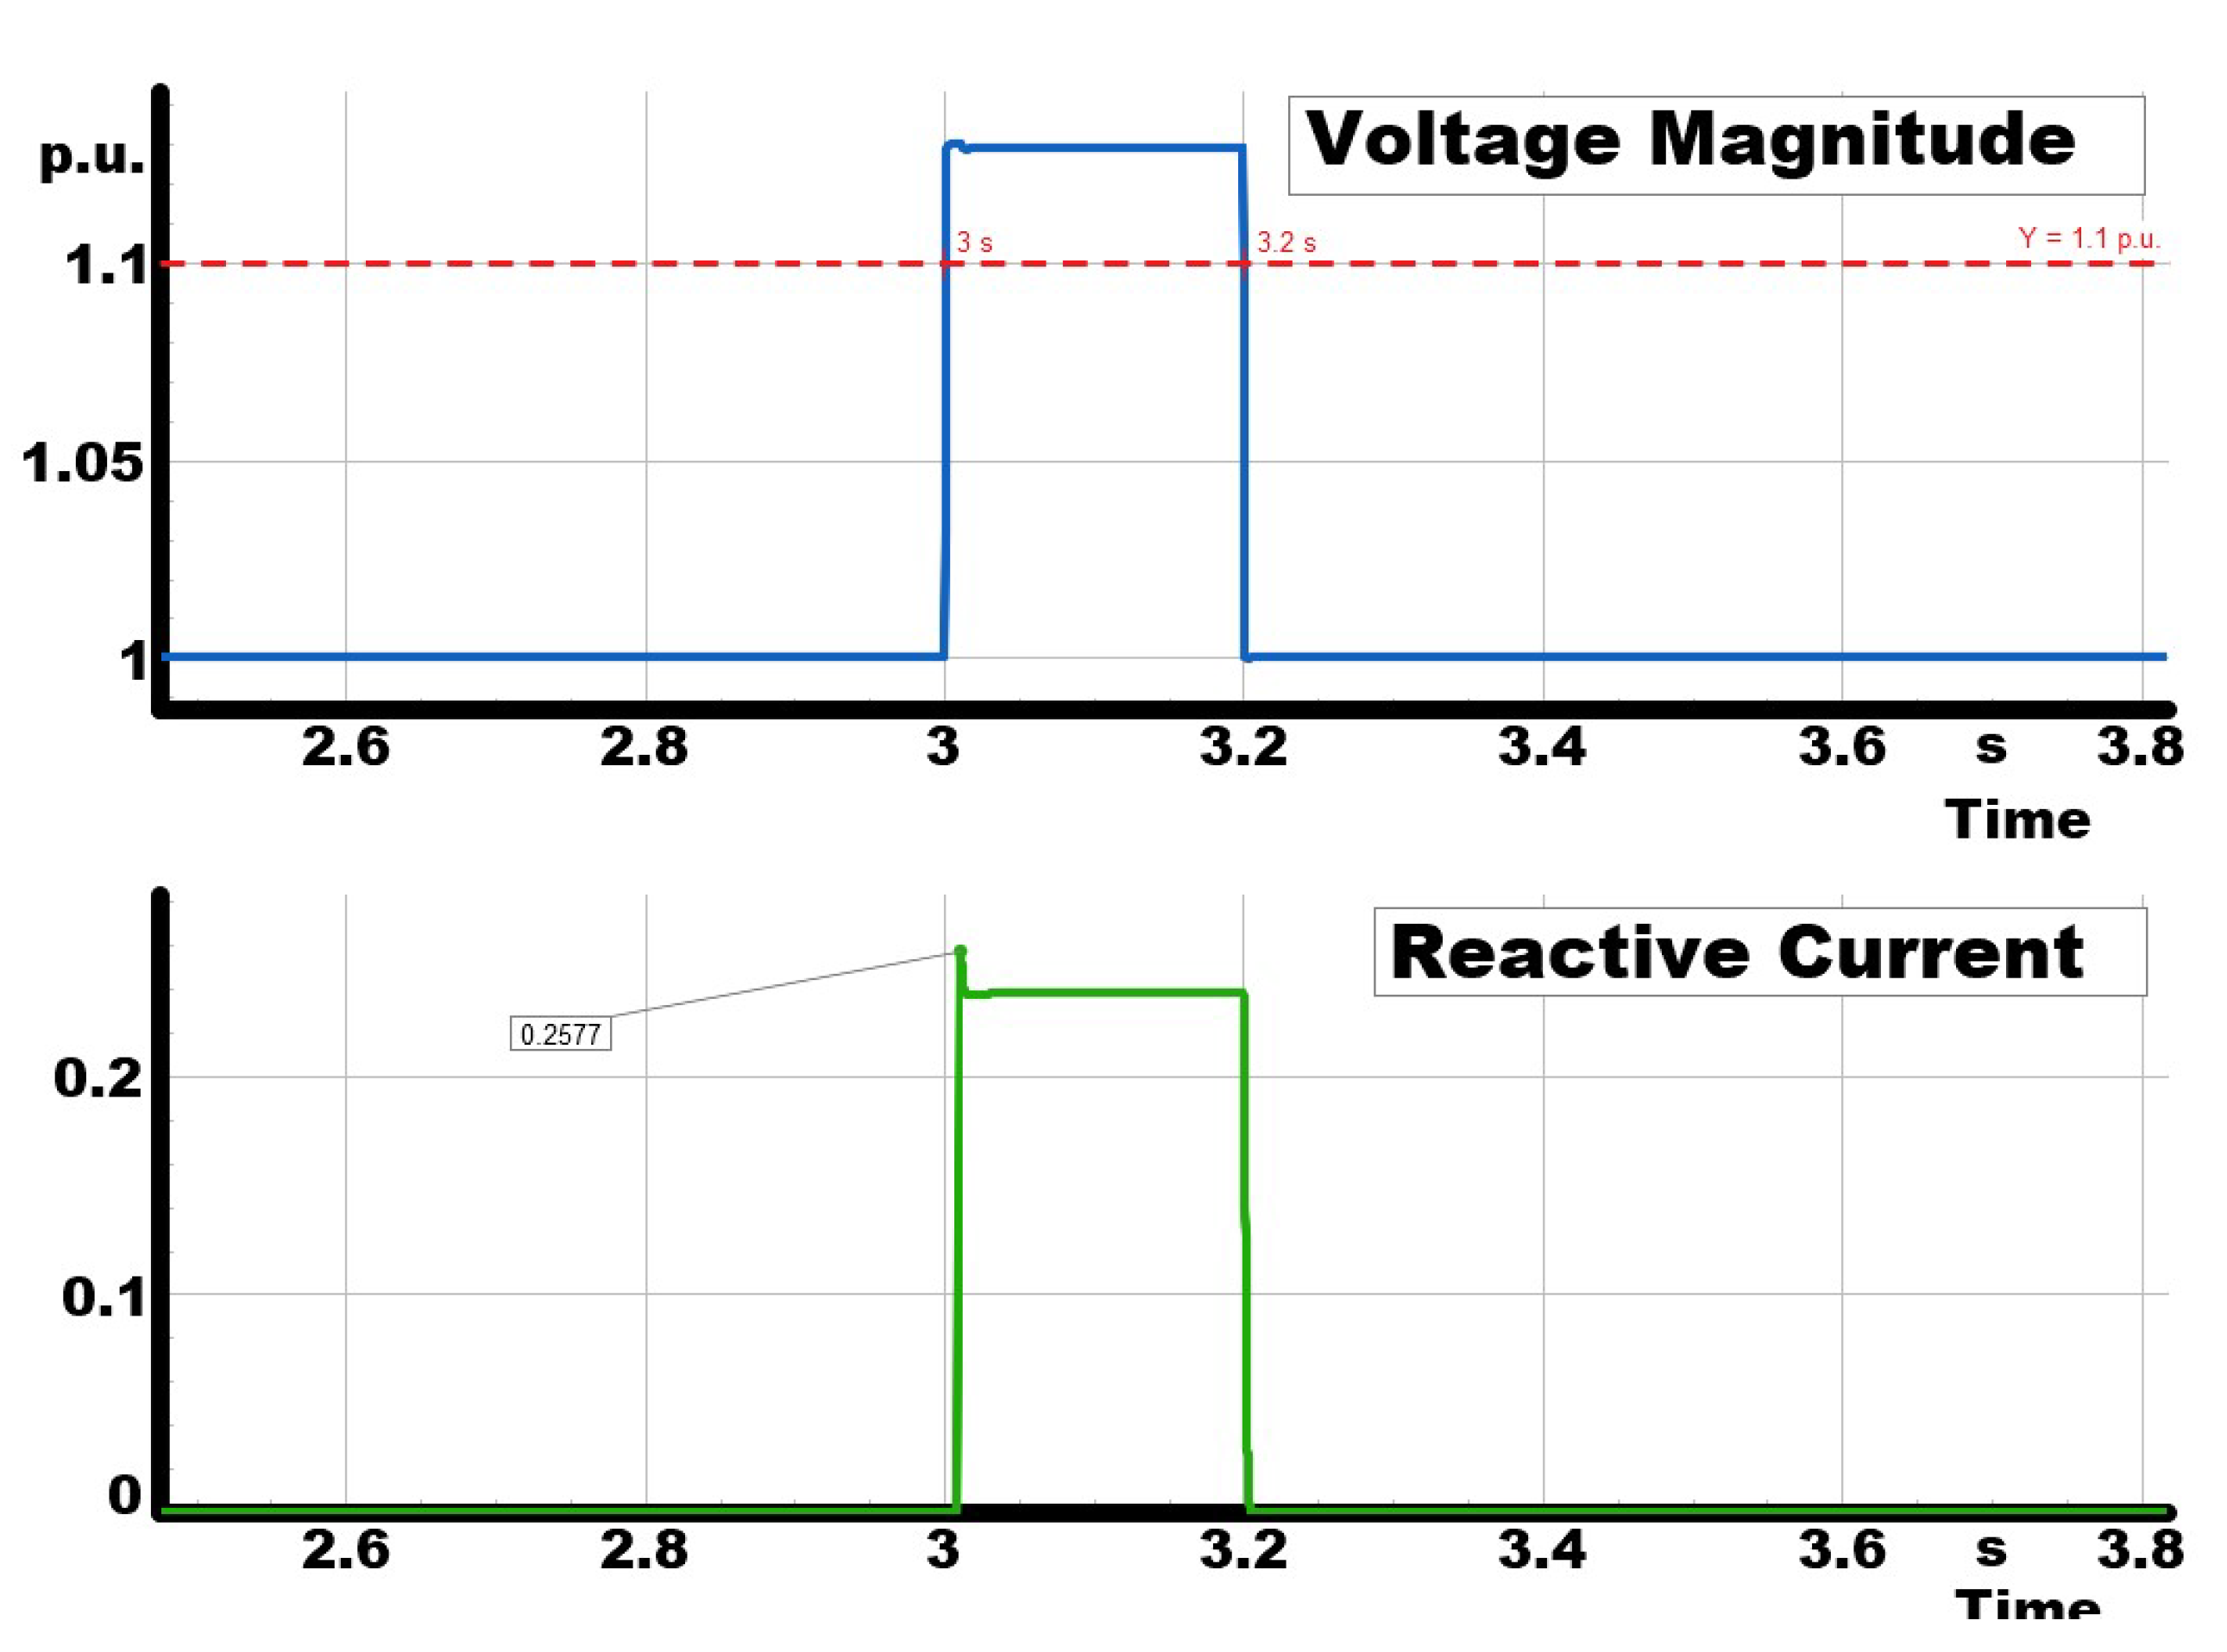
Figure 13.
System behavior during the split test, showing voltage, power, and frequency dynamics.
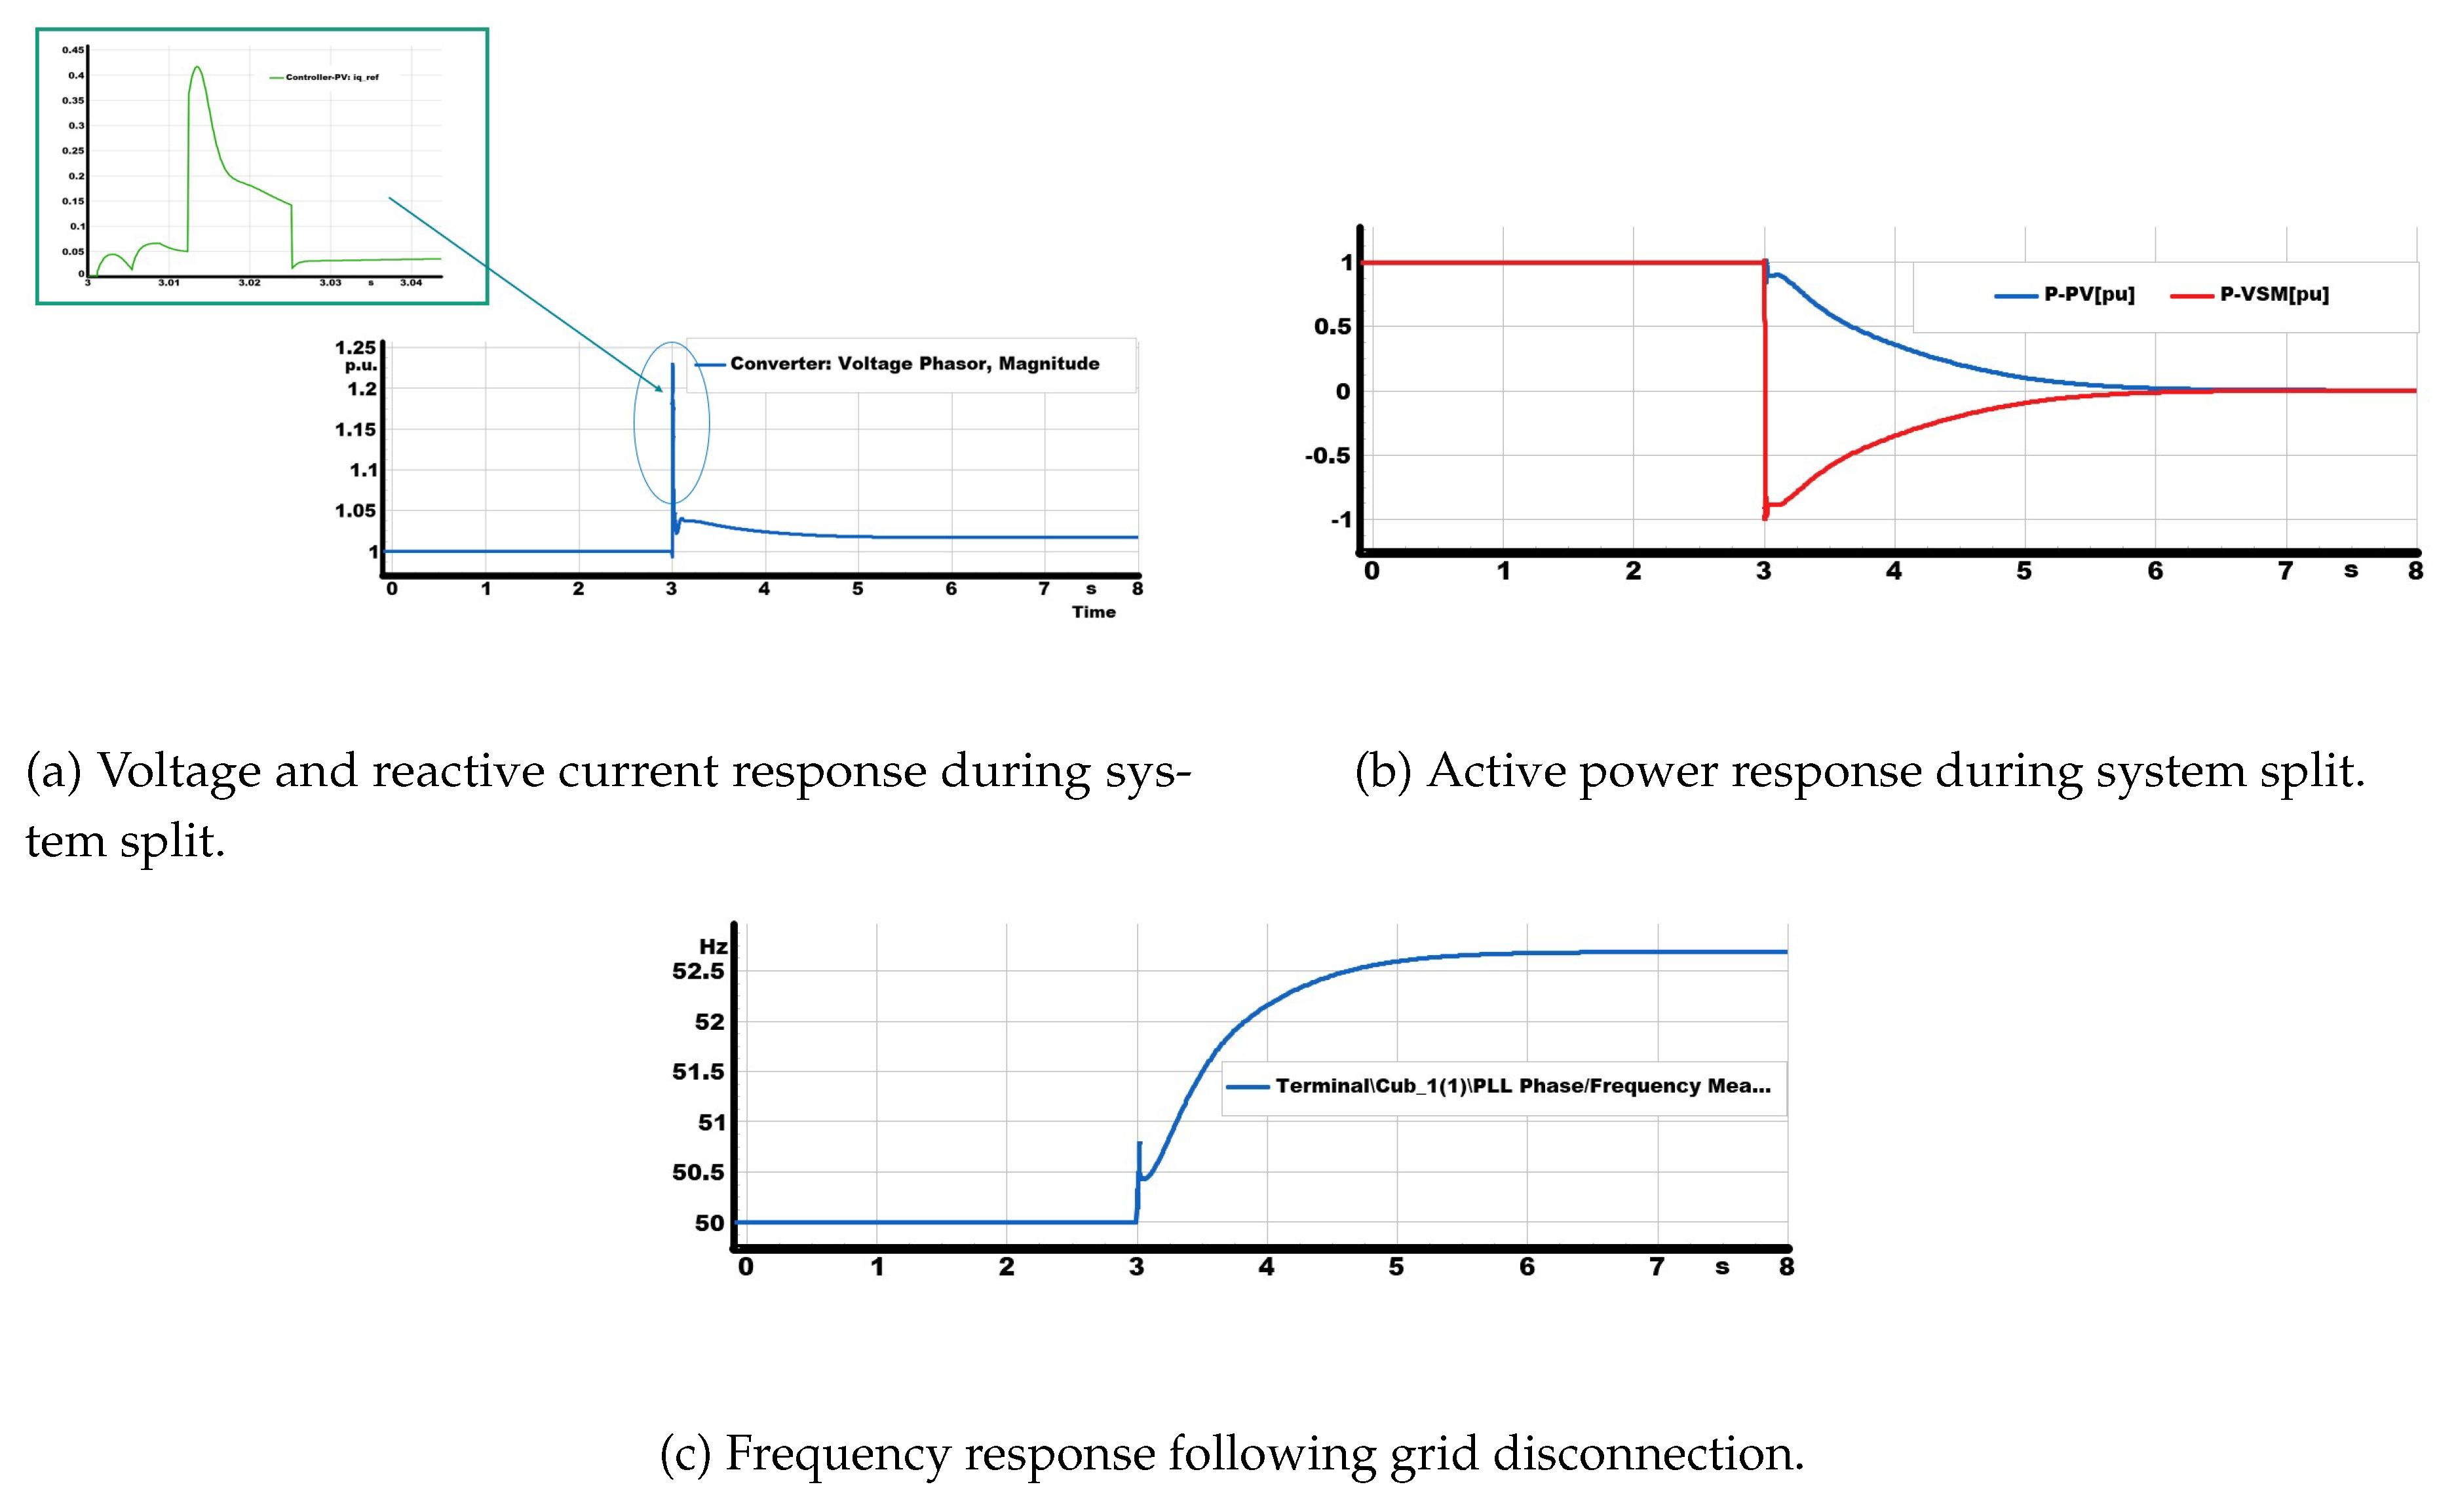
Figure 14.
Active power absorption of the GFM during islanded operation, showing exceedance of rated limits.
Figure 14.
Active power absorption of the GFM during islanded operation, showing exceedance of rated limits.
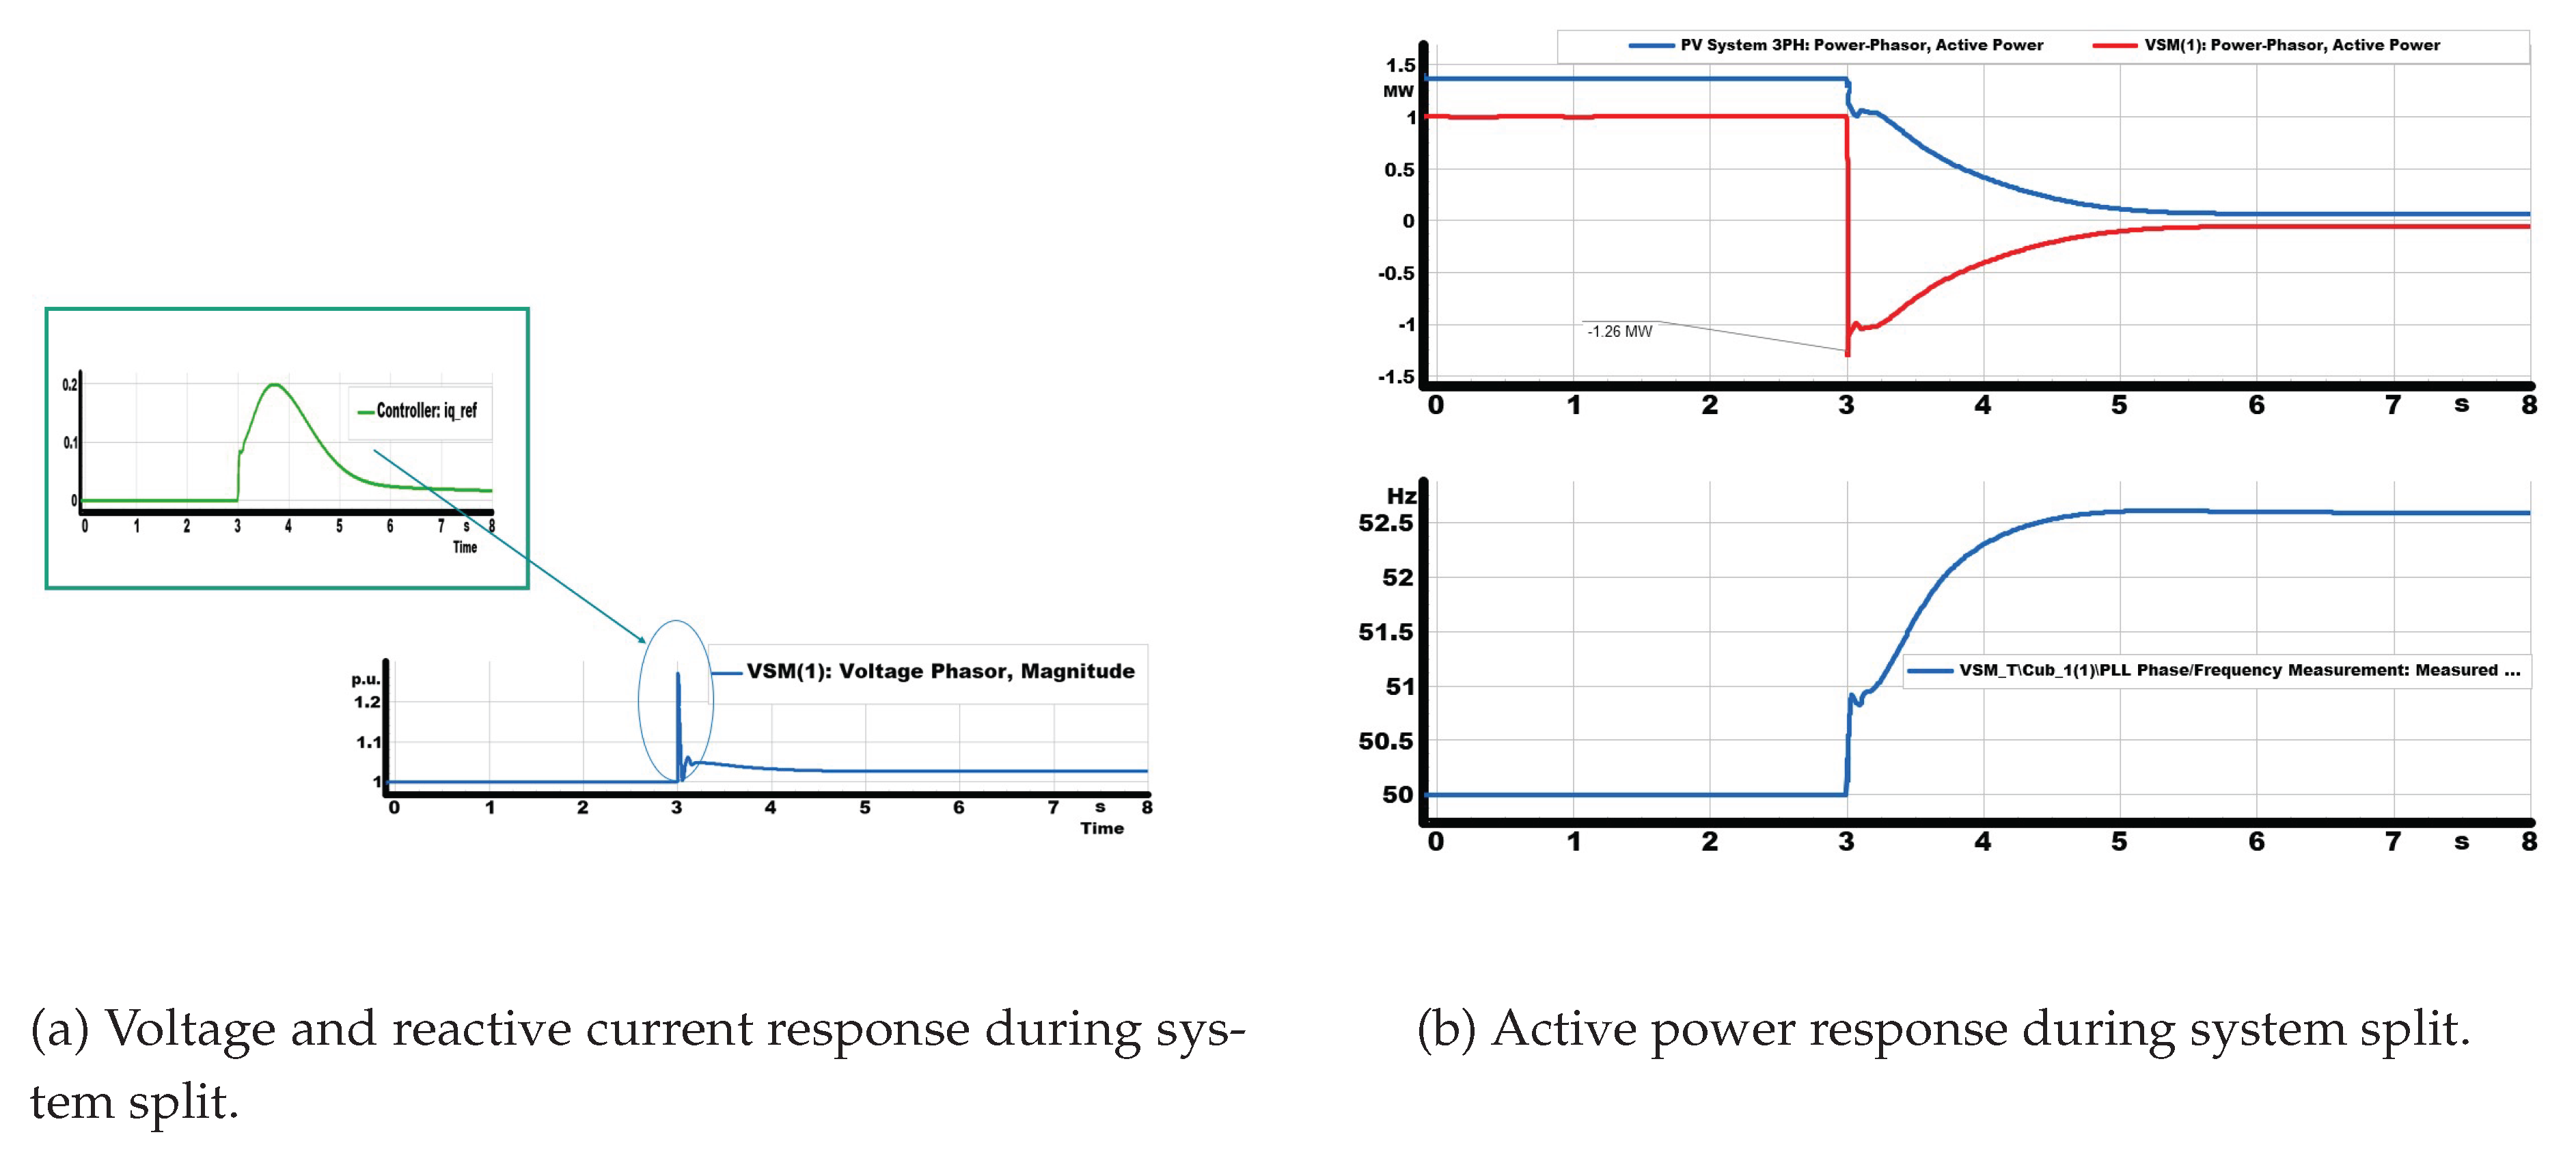
Table 1.
Parameters of the standalone VSM benchmark system.
| Component | Value |
|---|---|
| VSM rating | 20 MVA, 5 MW dispatch |
| Grid simulator voltage | 20 kV, 3-phase |
| Series reactor | 3 MVA, , |
| Breaker | Controllable PCC disconnection |
| Load | Generic PCC load |
Disclaimer/Publisher’s Note: The statements, opinions and data contained in all publications are solely those of the individual author(s) and contributor(s) and not of MDPI and/or the editor(s). MDPI and/or the editor(s) disclaim responsibility for any injury to people or property resulting from any ideas, methods, instructions or products referred to in the content. |
© 2026 by the authors. Licensee MDPI, Basel, Switzerland. This article is an open access article distributed under the terms and conditions of the Creative Commons Attribution (CC BY) license (http://creativecommons.org/licenses/by/4.0/).
Copyright: This open access article is published under a Creative Commons CC BY 4.0 license, which permit the free download, distribution, and reuse, provided that the author and preprint are cited in any reuse.


