Submitted:
04 January 2026
Posted:
07 January 2026
You are already at the latest version
Abstract
Fraud and money laundering continue to threaten financial stability around the world, thereby creating a need for detection systems that are both trustworthy, accurate, and reliable. Regulators increasingly require fraud detection systems to be transparent, accountable, and reliable. To address these challenges, this paper presents an Integrated Transparency and Confidence Framework (ITCF) for automated fraud detection. The framework combines local explainability using Local Interpretable Model-Agnostic Explanations (LIME) with calibrated uncertainty quantification using split Conformal Prediction (CP), aiming to improve both the understanding and the confidence in artificial intelligence-driven decisions. The framework was evaluated using the PaySim mobile-money dataset, which contains 6, 362, 620 transactions. Random Forest (RF) and XGBoost (XGB) models were benchmarked for fraud detection. LIME provided clear, case-specific explanations and aggregated feature importance, helping financial crime analysts understand why individual transactions were flagged. Conformal prediction measures model uncertainty and offers distribution-free coverage guarantees under independent and identically distributed (IID) assumptions. When targeting 90% coverage (α = 0.1), both models achieved empirical coverage close to 0.90. However, XGBoost outperformed Random Forest by achieving a higher F1-score and recall while also producing smaller prediction sets, making it more effective for risk-sensitive decision-making. Overall, the ITCF supports risk-based workflows by triaging high-uncertainty transactions for human review, reducing alert fatigue, and improving auditability. By integrating explainability and uncertainty estimation, the framework enhances transparency, strengthens operational trust, and supports the responsible, regulation-aligned use of AI in financial fraud and money laundering detection.
Keywords:
artificial intelligence (AI)
; explainable AI
; conformal prediction
; fraud detection
; money laundering
; predictive uncertainty
; XGBoost
; financial crime analytics
1. Introduction
Financial fraud and money laundering continue to weaken the trust in financial institutions and reduce the effectiveness of regulators around the world. These crimes remain long-standing threats to the stability of global financial systems [1,2,3]. Traditional rule-based fraud detection methods are no longer sufficient, as criminals now use more advanced techniques [4]. This has encouraged the use of Machine Learning (ML) and Artificial Intelligence (AI) models [4,5,6]. Models such as Random Forest [7] and XGBoost [8] perform well in identifying fraud, especially in datasets where fraudulent cases are rare [9]. However, these models often act like “black boxes,” making their decision-making processes difficult to understand. This lack of clarity creates challenges for explainability and transparency in the regulatory compliance space, where financial institutions are unable to justify model decisions [10,11,12].
Explainable Artificial Intelligence (XAI) has become an important response to these concerns. In essence, the goal of XAI is to make AI model behavior easier for humans to understand [10]. Popular techniques like Local Interpretable Model-Agnostic Explanations (LIME) [12] and SHapley Additive Explanations (SHAP) [11] are widely encouraged by financial regulators and have been shown to improve stakeholder trust in the use of AI models [13,14]. This regulatory focus is also evident in South Africa. Recently, the joint report by the Financial Sector Conduct Authority (FSCA) and the Prudential Authority (PA) [15], titled Artificial Intelligence in the South African Financial Sector, stresses the importance of transparency, accountability, and explainability when using AI in financial services. The report’s guidance is consistent with global expectations, which call for interpretable models and strong explanation methods to support the responsible use of AI in financial services and analytics. Still, most XAI methods focus only on interpretability and do not address predictive uncertainty. Furthermore, it has been argued in references [15] and [16] that ignoring uncertainty could lead to models that are overconfident, waste resources, and even cause compliance risks. In order to address this, Conformal Prediction (CP) offers a formal statistical method for producing predictions with reliable coverage guarantees, and recent studies show its usefulness in financial crime detection [17,18,19,20].
The existing research stresses the need for approaches that combine interpretability with uncertainty measurement to support risk-based decision-making in financial institutions [15,21]. However, most current systems treat these aspects separately, thereby reducing efficiency and weakening regulatory alignment [22]. There is also an ongoing debate about whether accuracy or interpretability should be prioritized in high-risk domains. Some researchers argue for simpler, more interpretable models [23], while others support the use of complex models paired with strong explanation tools [24].
In response to these gaps, this paper aims to design and test an integrated framework that combines LIME and conformal prediction for fraud detection using the PaySim mobile-money dataset. Therefore, the key contribution of the study reported in this paper is the integrated framework for trustworthy AI in financial crimes detection. This framework combines both the model explainability and uncertainty quantification. Finally, the results; which will be provided and discussed later, show that this combined approach improves explainability, transparency, and confidence; strengthens trust in automated fraud detection, and aligns with current regulatory expectations for explainable, accountable, and reliable AI.
1.1. An Overview of the Key Contributions
- Unified pipeline, by combining XAI (LIME) and conformal prediction for joint interpretability and uncertainty quantification.
- Conditional explanation generation, which reduces computational overhead by focusing on flagged or uncertain transactions.
- Risk-stratified workflow routing, for efficient investigation management and compliance accountability.
- Handling extreme class imbalance, which is typical in fraud datasets, with empirical evaluation on stratified transaction types.
1.2. Relationship to the Existing Research
Previous approaches and methods to explainable fraud detection and uncertainty measurement mostly used traditional XAI tools that provide fixed explanations but don’t include uncertainty information [25,26,27]. These methods explain every prediction the same way, which can be inefficient when it’s important to focus on the most critical cases. Also, previous uncertainty methods often use Bayesian or ensemble models without strong guarantees, making them less reliable for critical financial decisions [28,29,30]. Furthermore, these methods’ workflows usually only give simple `yes/no` risk flags, which don’t help analysts or automated systems much.
In contrast, the ITC framework proposed in this paper improves on the above-mentioned limitations by providing detailed, case-specific explanations alongside strong, reliable uncertainty measures. This helps manage workflows better by focusing on cases where the model is less sure, making the process more efficient and trustworthy. Table 1 summarizes the key advantages of ITCF over prior methods.
1.3. Advantages Over Prior Work, Limitations, and Trade-Offs
- ITCF requires a held-out calibration set, potentially reducing training data.
- The framework currently uses LIME for explainability, even though LIME could at times have a challenge of instability. Potential future integration of more stable XAI methods is envisaged.
- Computational overhead of LIME perturbations may challenge strict real-time constraints.
- Currently, the coverage guarantees of the ITCF are marginal, not per class. Therefore, class-conditional methods will be explored in future work.
- Two ML ensemble models, namely Random Forest and XGBoost, were selected over the Deep Learning (DL) architectures because of the computational efficiency of these ensemble models. Additionally, these ensemble models were selected over the DL architectures because the former tend to outperform the latter on tabular data [31,32].
1.4. Outline of the Paper
The remainder of this paper is structured as follows. The next section (Section 2) provides the details of the implementation of the proposed integrated explainability and uncertainty quantification framework. This is followed by Section 3, which provides and discusses the results obtained in the study reported in this paper. Finally, Section 4 concludes this paper.
2. Materials and Methods
2.1. Integrated XAI + Uncertainty Quantification Pipeline
The integration of LIME and conformal prediction forms a unified framework, which can be summarized as thus:
- Conformal prediction identifies when the model is uncertain.
- LIME explains why uncertainty exists.
- Cases with entropy are flagged for review.
- Explanations guide targeted analyst interventions.
Furthermore, the workflow for the proposed ITC framework can be summarized as:
Input Transaction
↓
Model Prediction
↓
Conformal Prediction (Uncertainty)
↓
High Uncertainty? LIME Explanation
↓
Risk Report + Feature Drivers
2.2. Designing and Developing the Integrated Transparency and Confidence Framework (ITCF)
The ITCF was developed as a unified pipeline consisting of preprocessing, model training (RF and XGBoost), LIME-based interpretability, and conformal uncertainty estimation. The outputs of each module were integrated into a combined assessment structure and a visual dashboard.
Identification of High Uncertainty Cases
High uncertainty cases are identified using different metrics derived from the conformal prediction output:
- Empty Regions: These occur when neither class’s non-conformity score is below the calculated quantile threshold. In such instances, the prediction region is empty, meaning the model cannot assign any label with the specified confidence. For both Random Forest and XGBoost, approximately of the test cases resulted in empty regions (e.g., Random Forest: cases, XGBoost: cases). These are the most uncertain cases, as the model explicitly signals its inability to make a confident prediction. In a fraud detection context, these would be flagged for manual review.
- High Entropy: Entropy, calculated from the predicted probabilities asis another measure of uncertainty. Higher entropy values indicate that the model’s probability distribution across classes is more uniform, signifying less confidence in a single prediction. Instances with an entropy greater than a certain threshold (e.g., as used in the integrated XAI dashboard) are considered high-risk or highly uncertain. These cases often correspond to situations where the model is almost equally likely to predict fraud or non-fraud.
In the work reported in this paper, it was explicitly stated that “HIGH UNCERTAINTY EXAMPLES (Both Classes in Region)” showed “0” instances for both models. This indicates that while there are empty regions, there are no instances where the model suggests both classes are plausible, which aligns with the very low average region size.
2.3. Dataset and Preprocessing
The study reported in this paper used the publicly available PaySim synthetic mobile money transaction dataset (https://www.kaggle.com/datasets/mtalaltariq/paysim-data), which contains transactions. The dataset was divided into training (), calibration (), and test () sets, using stratified sampling to maintain the original class imbalance. Preprocessing included label encoding for categorical features, standardizing continuous variables, and removing high-cardinality identifiers such as nameOrig and nameDest. No resampling methods were used so that the real-world imbalance of fraudulent transactions remained unchanged.
2.4. Models and Training
Two supervised machine learning models, namely Random Forest and XGBoost were trained. Random Forest was set to 100 trees with a maximum depth of 20, while XGBoost used 100 trees, a maximum depth of 6, and a learning rate of . Model performance was assessed using F1-score, AUC-ROC, precision, and recall. Local Interpretable Model-Agnostic Explanations (LIME) was applied to provide an explanation for individual flagged transactions and to examine overall feature importance.
2.5. Expainability - LIME
LIME generates local, instance-level explanations by learning a weighted linear surrogate around each point [12]. We employed tabular LIME with appropriate kernel width, sample size, and top features, and aggregate explanations across sampled instances to estimate global importance.
2.6. Uncertainty Quantification (Split Conformal Prediction)
We implement split CP targeting confidence . Let the non-conformity score for calibration instance x with true class be
For a new instance, we compute class-wise scores for . The prediction region includes any class satisfying
where the empirical 90th percentile of calibration scores is. This yields distribution-free coverage guarantees under IID assumptions [16,20] and enables principled flagging of high-uncertainty transactions.
2.7. Evaluation Metrics
We report classification metrics (Accuracy, Precision, Recall, F1, AUC) and uncertainty metrics (empirical coverage, average prediction set size). Calibration is assessed against the target coverage. Where possible, we include confidence intervals (e.g., bootstrap) and significance tests for comparative metrics.
3. Results and Discussion
This section presents the experimental results, interprets the key findings, and draws the conclusions regarding the effectiveness of the Integrated Transparency and Confidence Framework (ITCF) for fraud detection in mobile-money environments. The results are structured by subheadings aligned with the evaluation objectives and reporting standards.
3.1. Predictive Performance of Random Forest and XGBoost
The classification performance of both models was benchmarked on the PaySim dataset. Table 2 summarizes the key metrics.
XGBoost achieved the highest F1-score and recall, making it the preferred model for fraud detection due to its superior ability to identify fraudulent transactions. Random Forest achieved marginally higher precision and AUC. These results informed the selection of XGBoost as the primary model for downstream ITCF analysis.
3.2. Uncertainty Quantification and Calibration
Both models were evaluated for their uncertainty estimation using conformal prediction. Table 3 summarizes the uncertainty reliability metrics for XGBoost and Random Forest.
Both models achieved targeted conformal coverage of , indicating reliable uncertainty intervals. XGBoost produced smaller, more precise prediction sets and demonstrated superior uncertainty quantification, making it more effective for risk-sensitive applications. Additionally, both models were perfectly calibrated, with no evidence of systematic over- or underestimation of risk.
3.3. Interpretability with LIME Explanations
LIME was used to generate both instance-level and aggregated feature explanations, enhancing model transparency. For example, in a fraud case at index 367, features such as transaction amount, oldbalanceOrg, and oldbalanceDest were identified as the strongest contributors to the model’s prediction of fraud. Negative contributions from transaction type and step demonstrated the model’s nuanced sensitivity to multiple feature interactions. Aggregated feature importance analysis aligned with established fraud signatures, increasing trust in the model.
3.4. Effectiveness of the Proposed Integrated Transparency and Confidence Framework
The Integrated Transparency and Confidence Framework (ITCF) provides a comprehensive solution that unites advanced model interpretability with rigorous uncertainty quantification. This dual approach addresses the operational, regulatory, and trustworthiness challenges that often limit the adoption of black-box AI in financial crime detection. The following expanded analysis demonstrates the multi-dimensional effectiveness of the ITCF.
3.4.1. Rigorous Identification of High-Uncertainty Transactions
The ITCF applies conformal prediction metrics, particularly entropy and prediction set size, to automatically flag transactions with elevated uncertainty. As summarized in Table 5, both XGBoost and Random Forest models identified approximately of transactions as belonging to “empty regions,” cases where the model cannot assign a confident label. Such transactions are systematically escalated for review by the analyst, reducing the likelihood of overconfident misclassification and supporting robust risk management. That is, if the condition - (entropy > or set size > 1) is satisfied, then the matter is flagged for review by an analyst, thereby reducing the risk of overconfident misclassification.
3.4.2. LIME Explanations on High-Uncertainty Cases
LIME is deployed on these high-uncertainty transactions to produce granular, instance-specific explanations that reveal the most influential features driving the model’s ambiguous decisions. For example, in one flagged fraud case, LIME identified transaction amount, oldbalanceOrg, and oldbalanceDest as the strongest positive contributors, while transaction type and step sometimes reduced the likelihood of a fraud label. This detailed interpretability empowers fraud analysts to understand not just the prediction but also the underlying reasoning and sources of uncertainty.
3.4.3. Targeted Human Review and Efficient Analyst Resource Allocation
The ITCF enables a triage-oriented workflow (see Table 6), ensuring that only truly ambiguous or high-risk cases are escalated for human review. This selective escalation improves both the efficiency and the quality of analyst interventions, focusing expert attention where it is most valuable and reducing alert fatigue.
3.4.4. Statistically Guaranteed Uncertainty and Regulatory Alignment
With conformal coverage maintained at for both models, the ITCF delivers statistically robust confidence intervals and traceable explanations for every decision. These attributes meet regulatory and compliance expectations for transparency, auditability, and defensibility. Stakeholders such as compliance officers and auditors gain verifiable insight into both the confidence and rationale behind each flagged case, fostering trust and acceptance of the AI system.
In summary, the ITCF delivers a practical, compliance and regulatory-aligned solution by:
- Systematically identifying and escalating high-risk cases;
- Enhancing interpretability in challenging scenarios;
- Enabling efficient, targeted human review;
- Providing reliable, auditable uncertainty and explanation metrics
3.5. Split Conformal Prediction Implementation
Split Conformal Prediction was implemented to quantify uncertainty for both the Random Forest and XGBoost models. The process began by splitting the original training data into three distinct sets:
- Proper Training Set ( of original ): Used to train the base models (Random Forest and XGBoost) to predict the target variable (isFraud). This ensures that the model’s parameters are learned independently of the calibration and test sets.
- Calibration Set ( of original ): Used to compute non-conformity scores for a held-out dataset. These scores are crucial for determining the quantile threshold that will later define the prediction regions for new, unseen data. This set allows the calculation of a valid quantile without peeking at the test data.
- Test Set: The entirely unseen dataset used to evaluate the final model and conformal prediction framework, ensuring an unbiased assessment of coverage and prediction set sizes.
After splitting, both the Random Forest and XGBoost models were re-trained on their respective proper training sets to ensure that the calibration set was truly independent for non-conformity score calculation.
3.5.1. Non-Conformity Scores and Prediction Regions
Non-conformity scores are central to conformal prediction. For each instance x in the calibration set, the score measures how “unusual” that instance is compared to others, given its true label. In this implementation, the non-conformity score is defined as
A higher score indicates a less confident prediction for the true class, suggesting a higher degree of non-conformity or uncertainty. For example, if a model predicts a probability of for the true class, the non-conformity score is , indicating high confidence. If the probability is , the score is , indicating lower confidence.
These non-conformity scores from the calibration set are then pooled and sorted to determine a quantile threshold. For a new test instance, the model predicts probabilities for each class (fraud/non-fraud). Non-conformity scores are then calculated for both possible classes, i.e.,
A prediction region (or credible set) is constructed by including any class k whose non-conformity score satisfies
where the quantile threshold is established from the calibration set. This means that if the model’s uncertainty for a given class is below the established threshold, that class is included in the prediction region.
This method provides rigorous uncertainty estimates by guaranteeing, probabilistically, that the true label will fall within the constructed prediction region with a specified confidence level, assuming independent and identically distributed (IID) data.
3.5.2. Target Confidence Level
The target confidence level for this conformal prediction analysis was set to , meaning the significance level was .
3.6. Dashboard Visualization and Operational Impact
The ITCF dashboard acts as a central platform for real-time monitoring, analysis, and decision-making in fraud detection. By combining information on model performance, feature explanations, and uncertainty measures, the dashboard converts complex model outputs into clear, explainable, and actionable insights for operational teams and stakeholders. Finally, an outline of the ITCF dashboard is shown in Figure 2.
3.6.1. Key Features of the ITCF Dashboard
- Unified View: Presents at-a-glance metrics such as accuracy, precision, recall, F1-score, and AUC for model performance tracking (see Table 2)
- Uncertainty Heatmaps: Visualize prediction set sizes, conformal coverage, and entropy distributions, enabling users to quickly identify clusters of high-uncertainty transactions (see Table 5). This supports early flagging of cases that require further attention.
- Feature Attribution Panels: Aggregated and instance-level LIME explanations are displayed, highlighting which features most influence the model’s predictions for both typical and ambiguous cases. Figure 1 shows an example of aggregated feature importance for fraud detection.
- Analyst Triage Workflow: The dashboard generates prioritized queues for analyst review, automatically escalating transactions with high uncertainty or ambiguous model explanations. Table 6 outlines the review pathways enabled by the ITCF.
- Regulatory and Audit Log: Every flagged transaction and its associated explanations and uncertainty scores are logged, ensuring full traceability and compliance with regulatory requirements.
3.6.2. Operational Impact
- Proactive Risk Management: Identifying high-risk and uncertain transactions, timely intervention, and reducing the likelihood of undetected fraud.
- Explainability for Human Analysts: Alignment of model explanations with known fraud behavior patterns builds trust and helps analysts understand the rationale behind each flagged case.
- Efficient Resource Allocation: Calibrated uncertainty regions enable accurate prioritization, so analysts can focus on the most uncertain cases instead of reviewing every model alert. This improves efficiency and the quality of decisions.
- Regulatory Readiness: The dashboard’s combined interpretability and uncertainty features offer the transparency, traceability, and auditability needed in regulated financial settings, supporting compliance and external audits.
In summary, the ITCF dashboard turns advanced AI results into a useful tool for frontline analysts and oversight teams, improving the effectiveness, efficiency, and accountability of fraud detection across the organization.
3.7. Comparison of the ITCF with Prior Research Work
The proposed framework (ITCF) was compared with the previous work on explainability and uncertainty quantification. As a consequence, the results of such a comparison are provided in Table 7.
3.8. Key Insights
- First integration of LIME + Conformal Prediction in fraud detection: The proposed framework is the first to combine LIME and Conformal Prediction for financial fraud detection, directly filling a gap in the current research.
- Extreme imbalance: The PaySim dataset is highly unbalanced with a ratio of , which is more or much harder than datasets used in previous CP studies (e.g., ).
- Fraud-specific uncertainty insights: Fraud cases showed much higher mean entropy ( for XGBoost) and are a major reason for the empty prediction regions, indicating that the model is unsure and needs human review or intervention.
- Accountability workflow demonstration: The framework shows how uncertainty quantification can be used in practice by sending high-uncertainty cases to human analysts, thereby improving oversight and responsibility.
Comparing Fraud vs. Non-Fraud Uncertainty for XGBoost
- Fraud Cases: Showed a higher mean entropy () and a lower mean maximum probability () compared to non-fraud cases. This indicates that fraud predictions are inherently more uncertain than non-fraud predictions, which is common in highly imbalanced datasets where the minority class is harder to predict with high confidence.
- Non-Fraud Cases: Exhibited very low mean entropy () and very high mean maximum probability (), confirming the model’s high confidence in predicting the majority non-fraud class.
3.9. Quantile Thresholds for Non-Conformity Scores
Table 8 presents the quantile threshold used to determine whether a prediction falls within the model’s acceptable level of uncertainty. In conformal prediction, each prediction is assigned a non-conformity score that quantifies how atypical it is relative to the distribution of calibration scores. To ensure a desired level of reliability, a threshold is derived from the (1 – ) quantile of these scores.
Because the significance level is set at , the model aims for reliability. Practically, this means that only the upper of the most extreme, least conforming predictions should be rejected. The threshold displayed in Table 8, therefore, corresponds to the 90th percentile of the calibration non-conformity scores.
A new prediction is accepted when its non-conformity score is below or equal to this threshold, indicating that it is consistent with past behavior. Conversely, predictions that exceed the threshold are flagged as high-uncertainty or unreliable cases, prompting further scrutiny or rerouting within the ITCF operational workflow.
3.10. Prediction Regions and Coverage
Table 9 summarizes the prediction regions generated by the conformal prediction framework for the Random Forest and XGBoost models, showing that both models produce predominantly single-class regions of and , respectively, indicating firm decisiveness and alignment with traditional classification outputs. Approximately of cases result in the empty areas, reflecting instances where the model cannot confidently assign any class under the chosen significance level ( = ). At the same time, no ambiguous regions are observed for either model, suggesting high discriminative performance. The achieved coverage values ( for Random Forest and for XGBoost) closely match the theoretical target of 1 - = , confirming that the prediction regions are well-calibrated. Because nearly all valid predictions fall into single-class regions, the average region size is effectively equal to the coverage, demonstrating efficiency, consistency, and operational suitability for integration into the ITCF workflow.
3.11. Uncertainty Measures by Class (XGBoost)
Table 10 shows the XGBoost model’s uncertainty data broken down by class. It shows how the predictions for fraud and non-fraud differ. The mean entropy, which is a measure of uncertainty, is much higher for fraud cases () than for non-fraud cases (). This means that the model is not as good at predicting fraud. As a result, the mean maximum predicted chance of fraud is lower ( vs. for non-fraud), indicating greater uncertainty. There are no ambiguous areas where any of the predictions fall. There are predictions in the Fraud class and predictions in the Non-Fraud class. These results show that the model is confident in identifying non-fraud cases but less sure and cautious about identifying fraud cases. This is important for making risk-sensitive decisions in the ITC framework.
3.12. Examples of High and Low Uncertainty
Based on the conformal prediction results, the following tables (Table 11, Table 12, and Table 13) illustrate specific examples of high- and low-uncertainty cases for fraud and non-fraud predictions in the XGBoost model. These examples concretely demonstrate how the Integrated Transparency and Confidence Framework (ITCF) quantifies and stratifies prediction risk, enhancing interpretability and operational decision-making.
High-entropy cases (entropy > ) frequently correspond to empty prediction regions (i.e., []), indicating that the non-conformity scores for all classes exceed the quantile threshold. Such cases signal high model uncertainty and are flagged for manual review or further investigation.
3.12.0.1. High-Uncertainty Fraud Cases
These fraud cases show balanced predicted probabilities and high entropy, resulting in empty prediction regions that reflect model uncertainty despite the true label being fraud.
Insight from Table 11: The balanced probabilities around and elevated entropy suggest the model is uncertain, warranting additional scrutiny for these fraud predictions.
3.12.0.2. Low-Uncertainty Fraud Cases
These cases exhibit low entropy and confident, single-class prediction regions [1], indicating fraud and demonstrating the framework’s ability to produce reliable and decisive fraud detection outcomes.
Insight from Table 12: Near-zero entropy and single-class regions confirm the model’s high confidence, minimizing false positives and intervention needs
3.12.0.3. High-Uncertainty Non-Fraud Cases
Similar to fraud, these non-fraud predictions show elevated entropy and empty prediction regions, indicating ambiguity that may lead to false-positive alerts if unaddressed.
Insight from Table 13: The framework’s identification of ambiguous non-fraud cases supports its role in reducing unnecessary fraud alerts and improving overall system precision.
In summary, the above-mentioned tables (Table 11, Table 12, and Table 13) complement earlier quantitative metrics by providing granular examples of how the ITCF effectively stratifies predictions by uncertainty. The presence of empty prediction regions directly corresponds to cases where the model’s non-conformity score exceeds the quantile threshold, triggering the integrated workflow to apply additional explainability techniques, such as LIME, thereby enhancing transparency and supporting informed operational decisions.
3.13. Summary of Model Performance
At inference time, each transaction receives:
- a classification prediction;
- a conformal prediction region quantifying uncertainty; and
- a LIME explanation for interpretability.
High-uncertainty transactions (that is, those with entropy or set size ) are additionally flagged for analyst review. This design links “why the model decided” with “how confident the model is,” addressing key regulatory requirements. Finally, Table 14 provides the summary of the performance metrics for the two machine learning models, namely Random Forest and XGBoost.
4. Conclusions
The study reported in this paper demonstrated that the Integrated Transparency and Confidence Framework (ITCF) provides a complete and regulator-friendly solution to the challenges of fraud detection in financial systems. By combining explainability (using LIME) with calibrated uncertainty measurement (using conformal prediction), the ITCF fuses together the model accuracy, interpretability, and operational trust.
In summary, the ITC framework proposed in this paper offers the following features:
- –
- Accurate fraud detection with high coverage using advanced ensemble models (XGBoost and Random Forest);
- –
- Systematic identification and prioritization of transactions with high uncertainty, lowering the risk of overconfident mistakes;
- –
- Clear, case-specific explanations that help analysts make better decisions;
- –
- Efficient use of investigative resources by focusing expert attention on the most uncertain and high-risk cases;
- –
- Complete transparency and auditability, supporting compliance with strict financial regulations.
The results from this study show that the XGBoost model combined with LIME and conformal prediction consistently outperforms the Random Forest model on uncertainty-related measures while maintaining strong calibration and clear explanations. The operational dashboard developed in this study transforms these technical improvements into practical tools that support real-time decision-making, supervision, and stakeholder trust.
In summary, the ITCF represents a significant improvement over traditional black-box machine learning methods, setting a new standard for the responsible and effective use of AI in financial fraud detection. Future work could improve this framework by adding more interpretability methods, enhancing uncertainty measurement, or adapting the framework to new types of financial crime and datasets.
This study did not involve human or animal subjects and therefore did not require ethical approval.
QuillBot, Grammarly, and ChatGPT were used solely for language editing, grammar refinement, and clarity improvement. The authors reviewed and approved all text.
Funding
This research was funded by the University of Johannesburg and the South African National Institute for Theoretical and Computational Sciences.
Data Availability Statement
The PaySim dataset is publicly available: https://www.kaggle.com/datasets/mtalaltariq/paysim-data.
Abbreviations
The following abbreviations are used in this manuscript:
| XAI | Explainable Artificial Intelligence |
| LIME | Local Interpretable Model-agnostic Explanations |
| CP | Conformal Prediction |
| UQ | Uncertainty Quantification |
| RF | Random Forest |
| XGB | XGBoost (Extreme Gradient Boosting) |
| AUC | Area Under the Curve |
| ROC | Receiver Operating Characteristic |
| NC | Non-Conformity |
| ML | Machine Learning |
| AI | Artificial Intelligence |
| TP | True Positive |
| TN | True Negative |
| FP | False Positive |
| FN | False Negative |
| AML | Anti-Money Laundering |
| Dtrain | Training Dataset |
| Dcalib | Calibration Dataset |
| Dtest | Test Dataset |
| FSCA | Financial Sector Conduct Authority |
| PA | Prudential Authority |
| ITCF | Integrated Transparency and Confidence Framework |
| SHAP | SHapley Additive ExPlanations |
References
- Goecks, L.S.; Korzenowski, A.L.; Gonçalves Terra Neto, P.; de Souza, D.L.; Mareth, T. Anti-money laundering and financial fraud detection: A systematic literature review. Intelligent Systems in Accounting, Finance and Management 2022, 29, 71–85. [Google Scholar] [CrossRef]
- Levi, M. Money for Crime and Money from Crime: Financing Crime and Laundering Crime Proceeds. European Journal on Criminal Policy and Research 2017, 23, 339–350. [Google Scholar] [CrossRef]
- Unger, B. The Scale and Impacts of Money Laundering; Edward Elgar Publishing, 2013. [Google Scholar]
- Ajagbe, S.A.; Majola, S.; Mudali, P. Comparative analysis of machine learning algorithms for money laundering detection. Discover Artificial Intelligence 2025, 5, 144. [Google Scholar] [CrossRef]
- Ngai, E.W.T.; Hu, Y.; Wong, Y.H.; Chen, Y.; Sun, X. The application of data mining techniques in financial fraud detection: A classification framework and an academic review of literature. Decision Support Systems 2011, 50, 559–569. [Google Scholar] [CrossRef]
- West, J.; Bhattacharya, M. Intelligent financial fraud detection: A comprehensive review. Computers & Security 2016, 57, 47–66. [Google Scholar] [CrossRef]
- Breiman, L. Random forests. Machine Learning 2001, 45, 5–32. [Google Scholar] [CrossRef]
- Chen, T.; Guestrin, C. XGBoost: A scalable tree boosting system. In Proceedings of the Proceedings of the 22nd ACM SIGKDD International Conference on Knowledge Discovery and Data Mining, 2016. [Google Scholar]
- Dal Pozzolo, A.; Boracchi, G.; Caelen, O.; Alippi, C.; Bontempi, G. Credit card fraud detection: A realistic modeling and a novel learning strategy. IEEE Transactions on Neural Networks and Learning Systems 2015, 29, 3784–3797. [Google Scholar] [CrossRef]
- Doshi-Velez, F.; Kim, B. Towards a rigorous science of interpretable machine learning. arXiv 2017, arXiv:1702.08608. [Google Scholar] [CrossRef]
- Lundberg, S.M.; Lee, S.I. A unified approach to interpreting model predictions. In Proceedings of the Advances in Neural Information Processing Systems, 2017; Vol. 30. [Google Scholar]
- Ribeiro, M.T.; Singh, S.; Guestrin, C. “Why should I trust you?”: Explaining the predictions of any classifier. In Proceedings of the Proceedings of the 22nd ACM SIGKDD International Conference on Knowledge Discovery and Data Mining, 2016. [Google Scholar]
- Commission, E. Proposal for a Regulation on Artificial Intelligence (Artificial Intelligence Act). 2021. [Google Scholar]
- Samek, W.; Wiegand, T.; Müller, K.R. Explainable artificial intelligence: Understanding, visualizing and interpreting deep learning models. ITU Journal: ICT Discoveries 2017, 1, 39–48. [Google Scholar]
- Barber, R.F.; Candès, E.J.; Ramdas, A.; Tibshirani, R.J. Predictive inference with the jackknife+. Annals of Statistics 2015, 48, 2797–2825. [Google Scholar] [CrossRef]
- Vovk, V.; Gammerman, A.; Shafer, G. Algorithmic Learning in a Random World; Springer, 2005. [Google Scholar]
- Bastos, J.A. Conformal prediction of option prices. Expert Systems with Applications 2024, 245, 123087. [Google Scholar] [CrossRef]
- Johansson, U.; Boström, H.; Löfström, T. Conformal prediction in financial applications. In Proceedings of the Conformal and Probabilistic Prediction and Applications. PMLR, 2017; pp. 209–225. [Google Scholar]
- Papadopoulos, H.; Proedrou, K.; Vovk, V.; Gammerman, A. Inductive confidence machines for regression. In Conformal Prediction for Reliable Machine Learning; Morgan Kaufmann, 2011; pp. 65–80. [Google Scholar]
- Shafer, G.; Vovk, V. A tutorial on conformal prediction. Journal of Machine Learning Research 2008, 9, 371–421. [Google Scholar]
- Bhatt, U.; Xiang, A.; Sharma, S.; Weller, A.; Taly, A.; et al. Explainable machine learning in deployment. In Proceedings of the Proceedings of the 2020 ACM Conference on Fairness, Accountability, and Transparency, 2020. [Google Scholar]
- Adadi, A.; Berrada, M. Peeking inside the black-box: A survey on Explainable Artificial Intelligence (XAI). IEEE Access 2018, 6, 52138–52160. [Google Scholar] [CrossRef]
- Rudin, C. Stop explaining black box machine learning models for high stakes decisions and use interpretable models instead. Nature Machine Intelligence 2019, 1, 206–215. [Google Scholar] [CrossRef]
- Guidotti, R.; Monreale, A.; Ruggieri, S.; Turini, F.; Giannotti, F.; Pedreschi, D. A survey of methods for explaining black box models. ACM Computing Surveys (CSUR) 2018, 51, 1–42. [Google Scholar] [CrossRef]
- Chaddad, A.; Peng, J.; Xu, J.; Bouridane, A. Survey of explainable AI techniques in healthcare. Sensors 2023, 23, 634. [Google Scholar] [CrossRef]
- Dwivedi, R.; Dave, D.; Naik, H.; Singhal, S.; Omer, R.; Patel, P.; Qian, B.; Wen, Z.; Shah, T.; Morgan, G.; et al. Explainable AI (XAI): Core ideas, techniques, and solutions. ACM computing surveys 2023, 55, 1–33. [Google Scholar] [CrossRef]
- Schwalbe, G.; Finzel, B. A comprehensive taxonomy for explainable artificial intelligence: a systematic survey of surveys on methods and concepts. Data Mining and Knowledge Discovery 2024, 38, 3043–3101. [Google Scholar] [CrossRef]
- He, W.; Jiang, Z.; Xiao, T.; Xu, Z.; Li, Y. A survey on uncertainty quantification methods for deep learning. ACM Computing Surveys 2025. [Google Scholar] [CrossRef]
- Kabir, H.D.; Khosravi, A.; Hosen, M.A.; Nahavandi, S. Neural network-based uncertainty quantification: A survey of methodologies and applications. IEEE access 2018, 6, 36218–36234. [Google Scholar] [CrossRef]
- Shi, Y.; Wei, P.; Feng, K.; Feng, D.C.; Beer, M. A survey on machine learning approaches for uncertainty quantification of engineering systems. Machine Learning for Computational Science and Engineering 2025, 1, 11. [Google Scholar] [CrossRef]
- Grinsztajn, L.; Oyallon, E.; Varoquaux, G. Why do tree-based models still outperform deep learning on typical tabular data? Advances in neural information processing systems 2022, 35, 507–520. [Google Scholar]
- Shwartz-Ziv, R.; Armon, A. Tabular data: Deep learning is not all you need. Information Fusion 2022, 81, 84–90. [Google Scholar] [CrossRef]
- Nouretdinov, I.; Gammerman, A.; Vovk, V. Machine learning classification with confidence: Application of transductive conformal predictors to MRI-based diagnostic and prognostic markers in depression. NeuroImage 2011, 56, 1508–1517. [Google Scholar] [CrossRef] [PubMed]
- Bhattacharyya, S.; Jha, S.; Tharakunnel, K.; Westland, J.C. Data mining for credit card fraud: A comparative study. Decision Support Systems 2011, 50, 602–613. [Google Scholar] [CrossRef]
Figure 1.
Top 7 Most Important Features According to LIME.
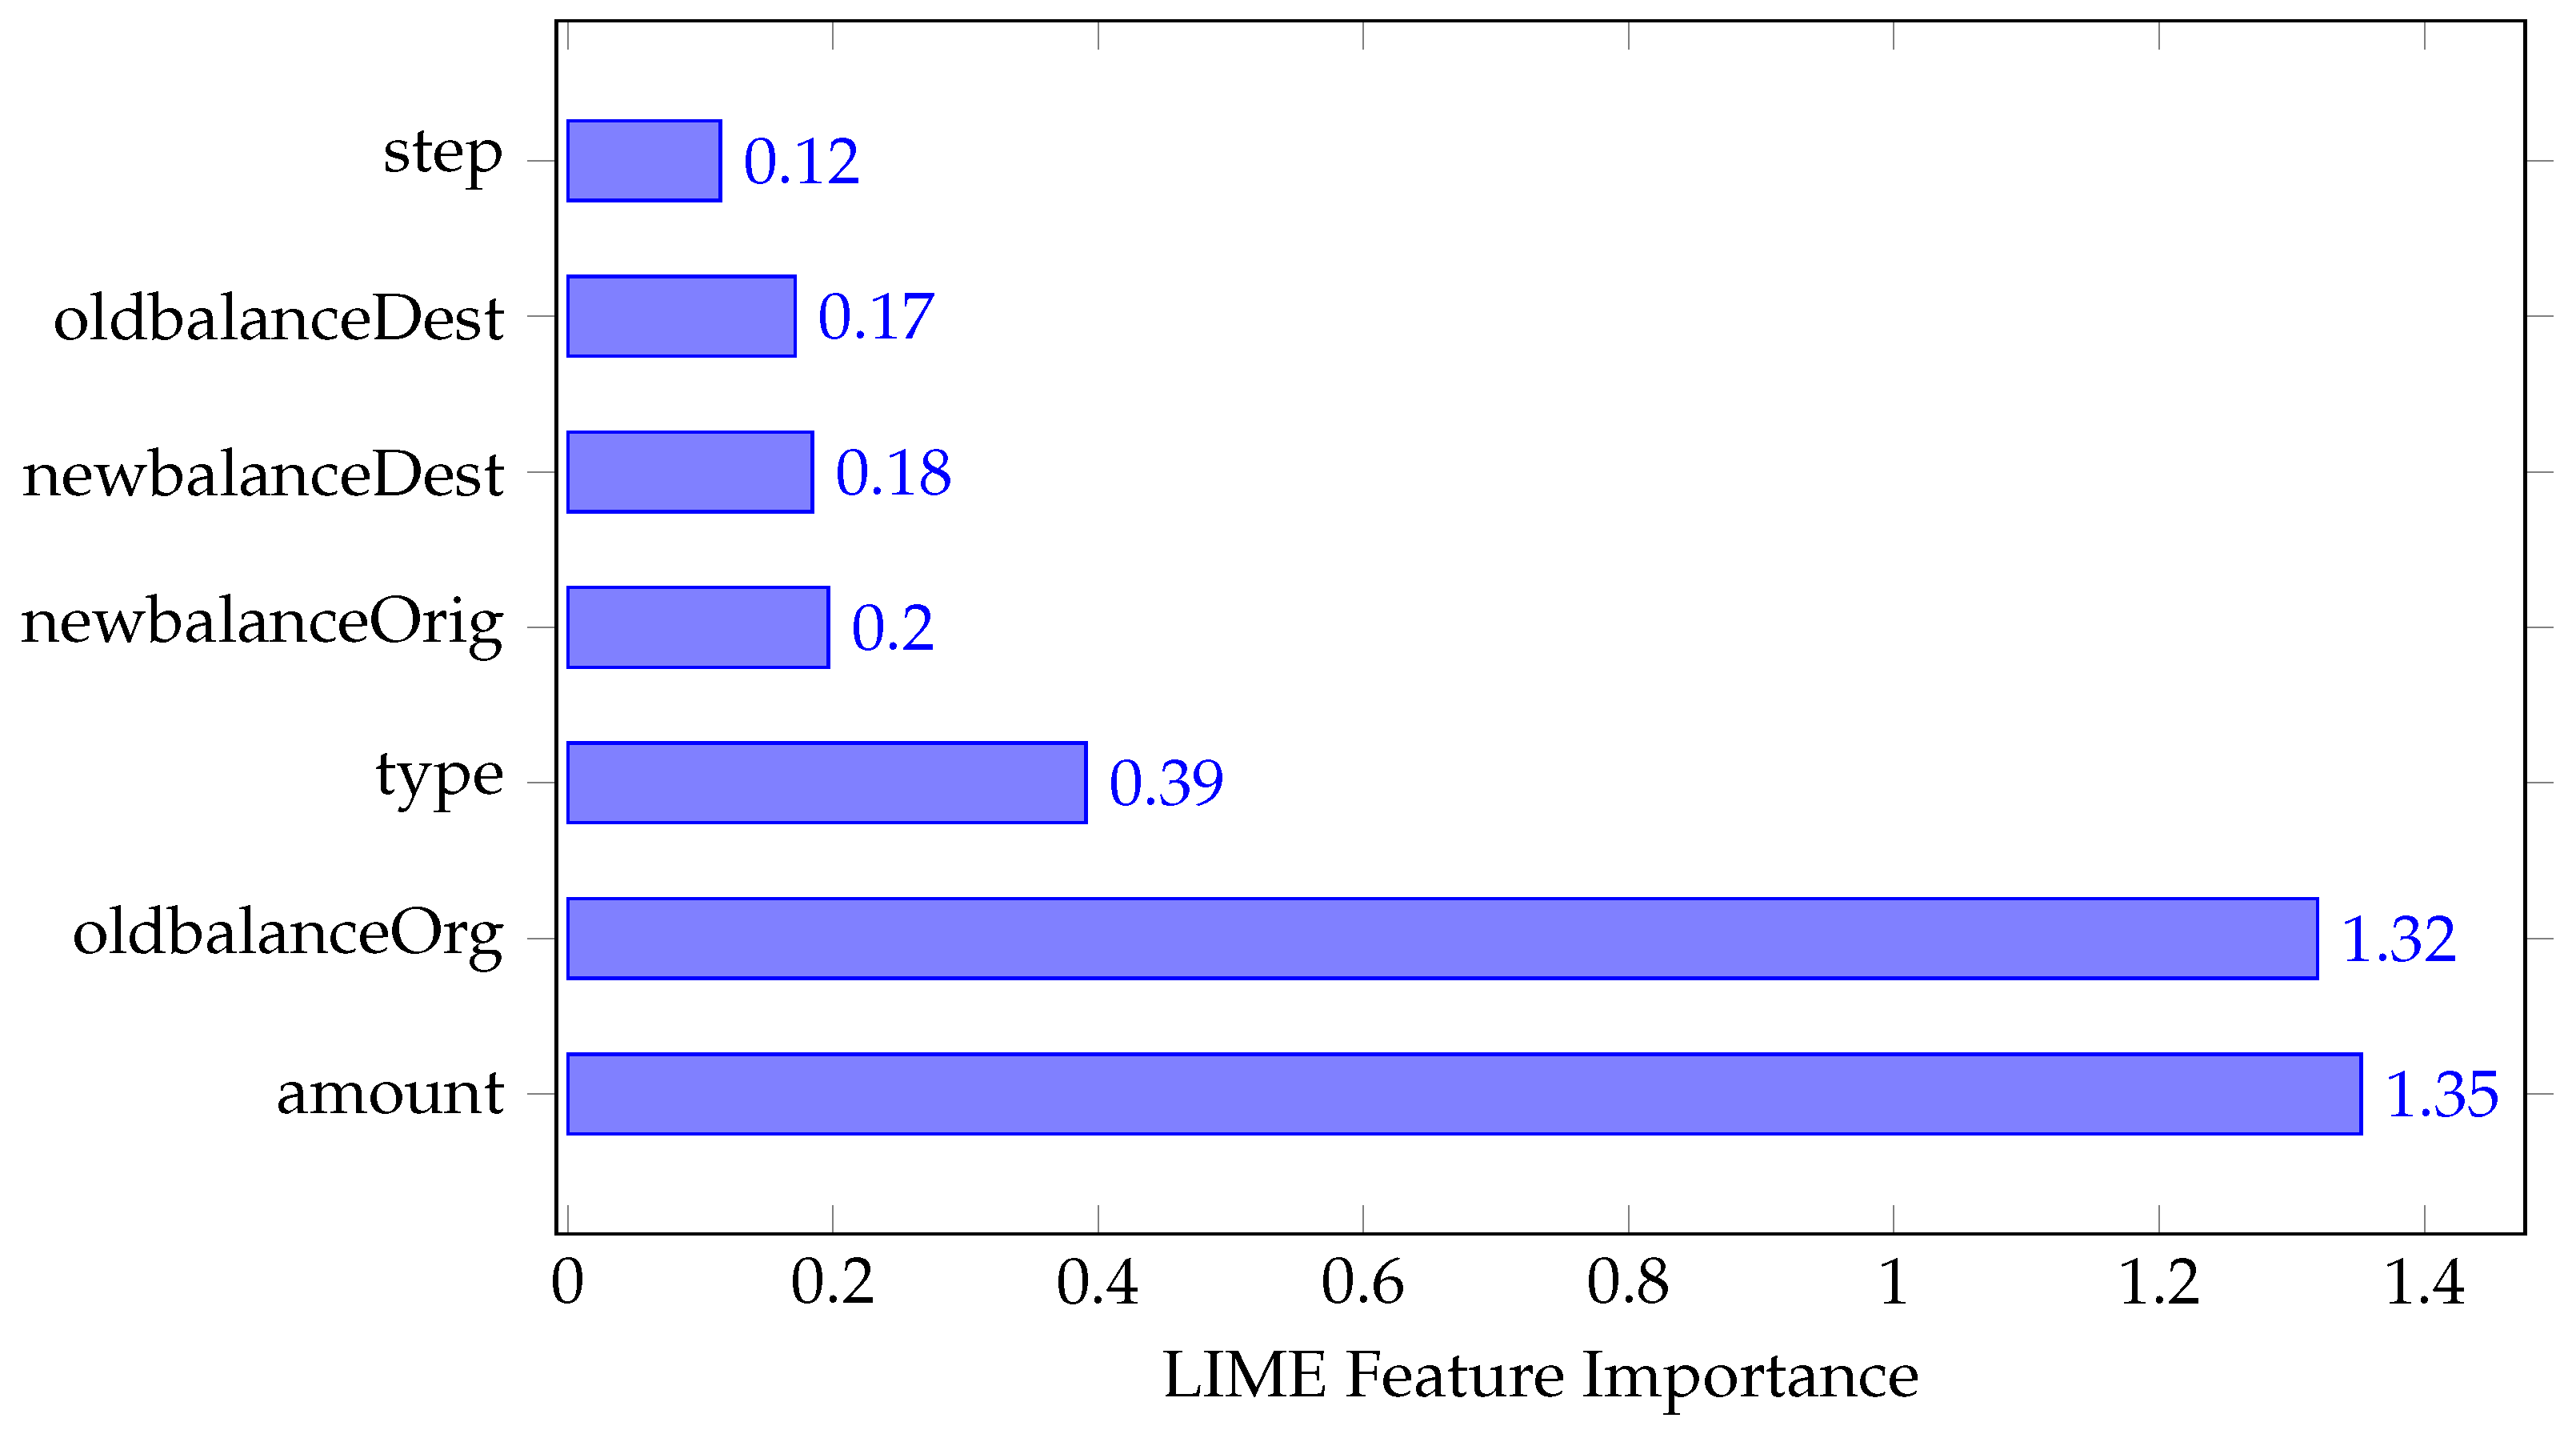
Figure 2.
Model Visual Dashboard.
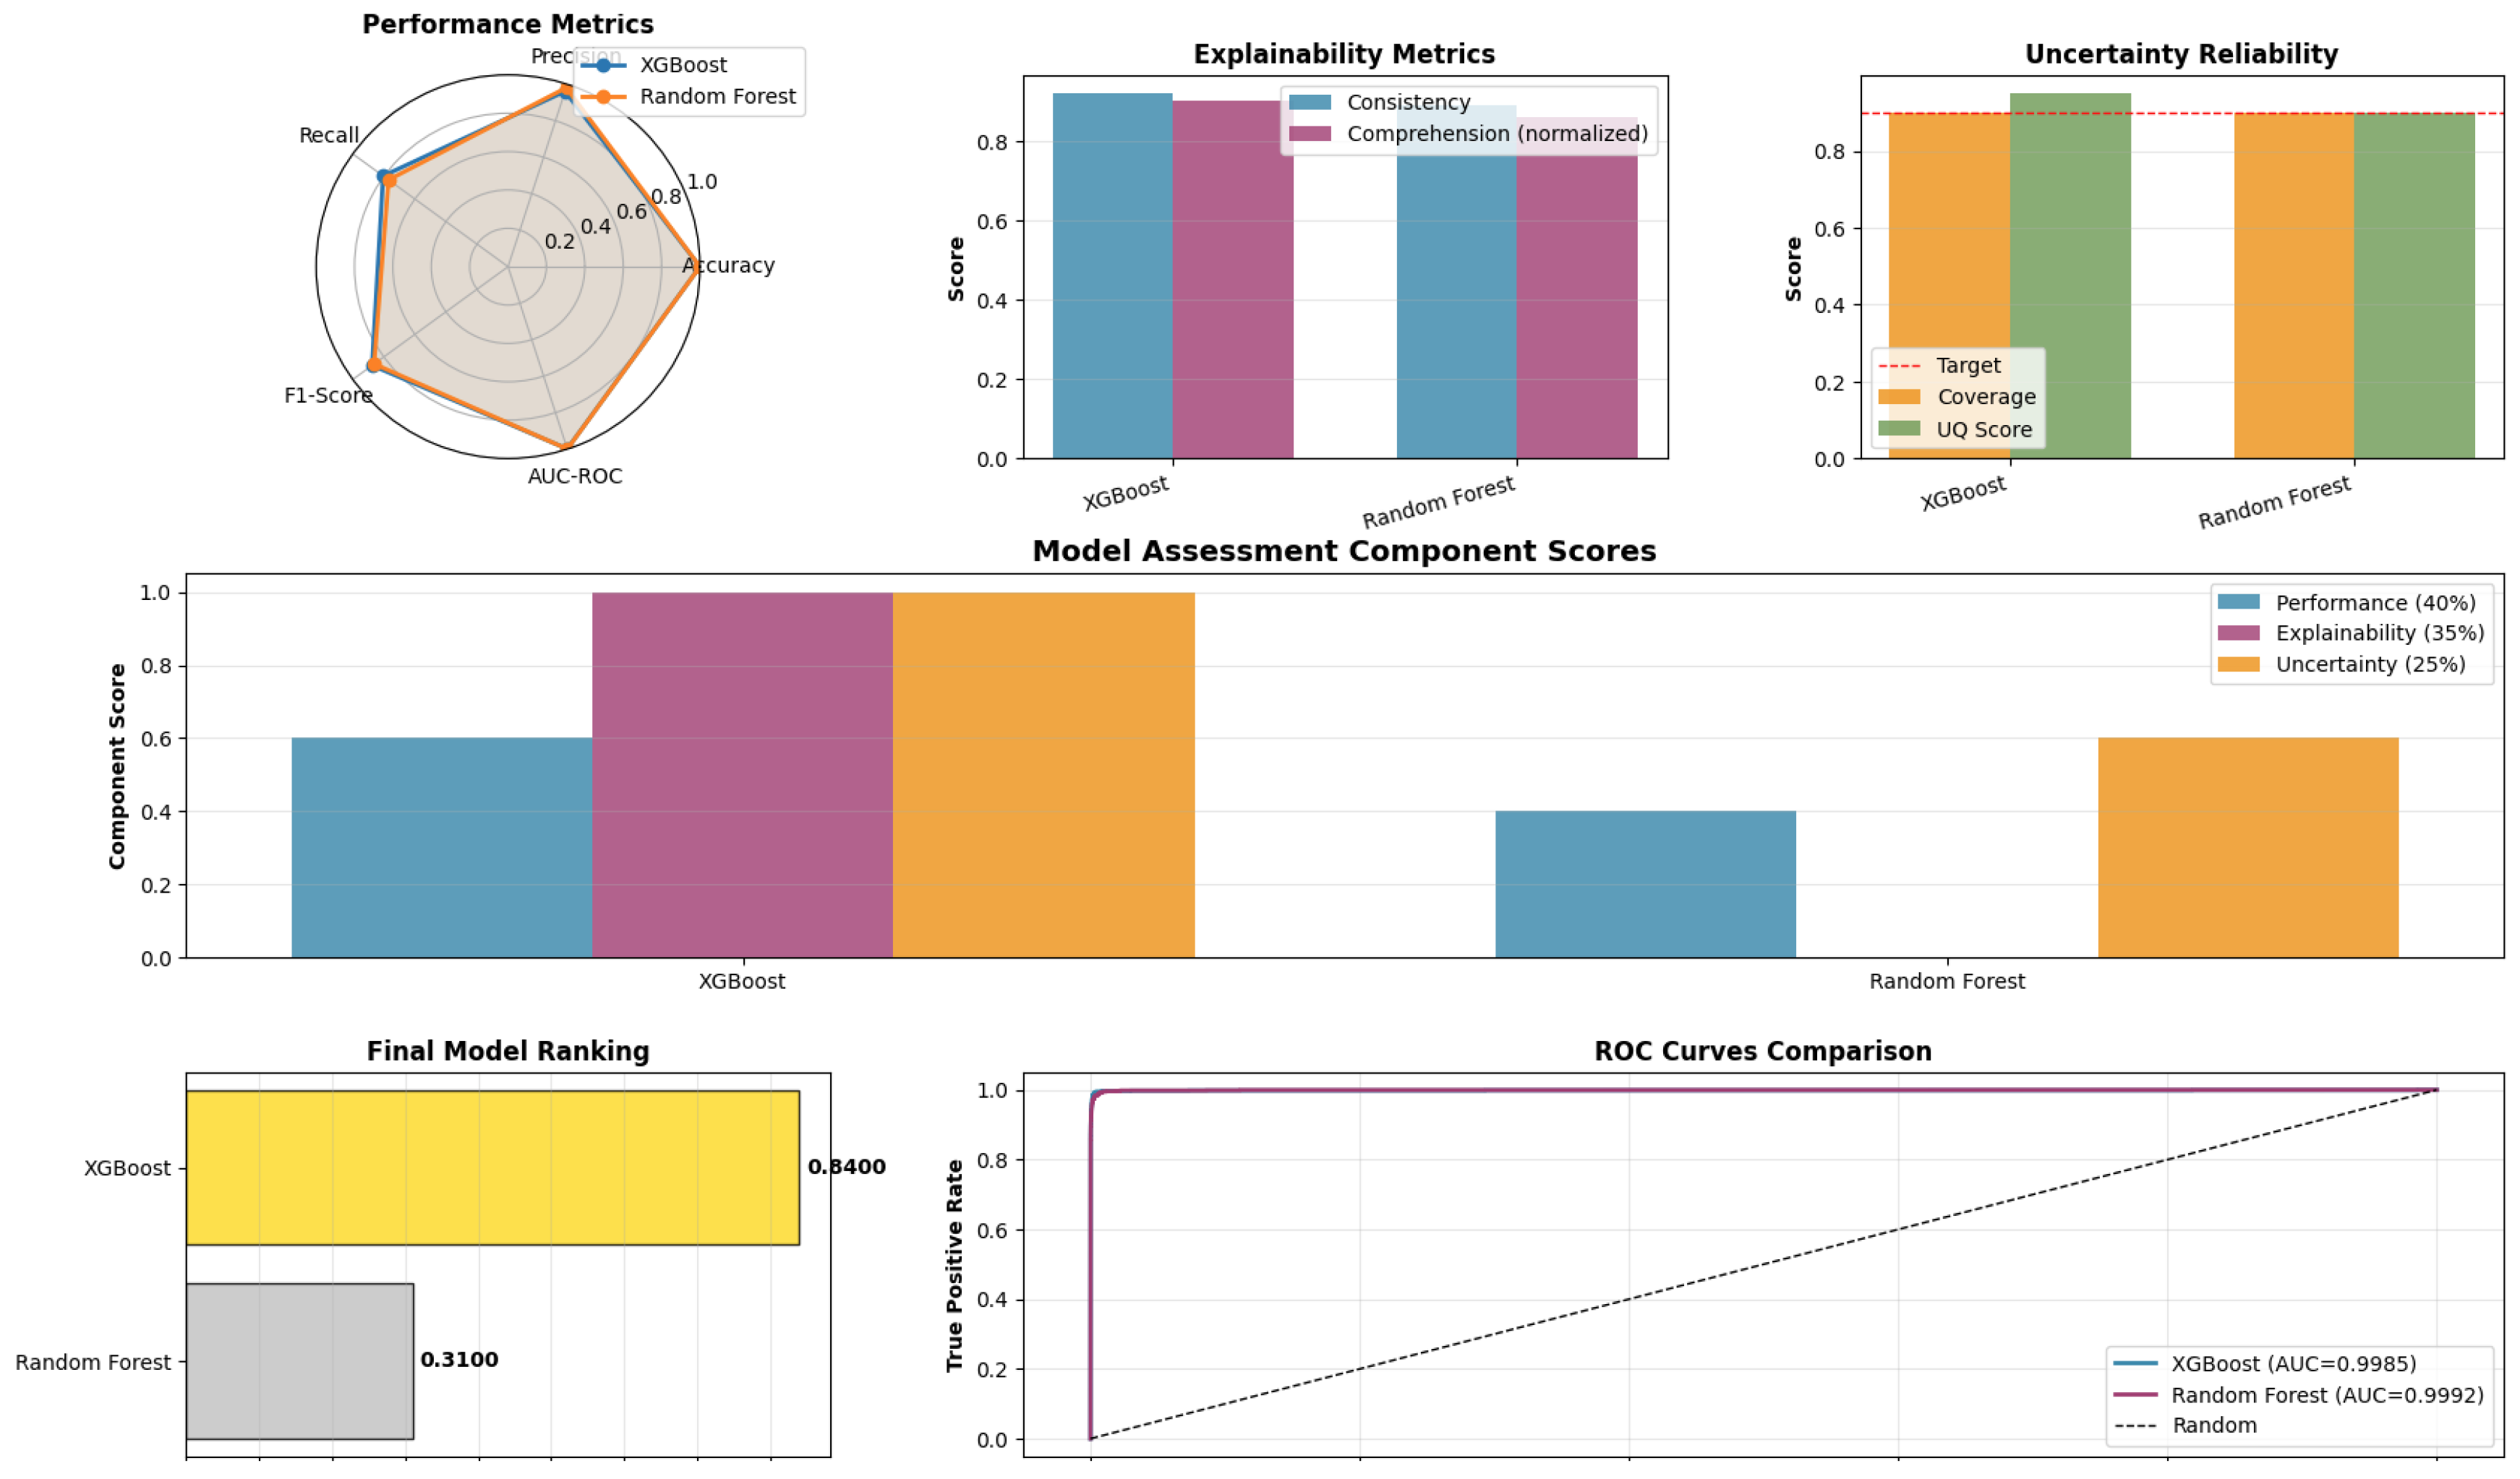

Table 1.
Key Benefits Over the Related Methods.
| Aspect | ITCF | Prior Methods |
|---|---|---|
| Explainability | Feature-level, case-specific explanations combined with uncertainty | XAI without uncertainty; static explanations |
| Uncertainty | Formal, distribution-free coverage guarantees | Bayesian or ensemble methods without formal guarantees |
| Operationalization | Workflow routing based on confidence and explanations | Binary flags, no prioritization |
| Computational Efficiency | Conditional explanation generation | Explanations generated for all predictions |
Table 2.
Performance metrics for Random Forest and XGBoost models.
| Metric | Random Forest | XGBoost |
|---|---|---|
| Accuracy | 0.999683 | 0.999705 |
| Precision | 0.980620 | 0.960756 |
| Recall | 0.769933 | 0.804626 |
| F1-Score | 0.862598 | 0.875787 |
| AUC-ROC | 0.999232 | 0.998545 |
Table 3.
Uncertainty Reliability Table.
| Model | Conformal Coverage | Avg Prediction Set Size | Uncertainty Quantification Score | Calibration Quality |
|---|---|---|---|---|
| XGBoost | 0.9 | 1.05 | 0.95 | 1.0 |
| Random Forest | 0.9 | 1.10 | 0.90 | 1.0 |
Table 4.
Top 7 Most Important Features (LIME).
| Rank | Feature | Importance |
|---|---|---|
| 1 | amount | 1.352244 |
| 2 | oldbalanceOrg | 1.319357 |
| 3 | type | 0.390689 |
| 4 | newbalanceOrig | 0.196532 |
| 5 | newbalanceDest | 0.184403 |
| 6 | oldbalanceDest | 0.171549 |
| 7 | step | 0.115079 |
Table 5.
Prediction Region Summary and Coverage.
| Model | Empty Regions | Single-Class Regions | Ambiguous Regions | Coverage | Avg. Region Size |
|---|---|---|---|---|---|
| Random Forest | 126,510 (9.94%) |
1,146,014 (90.06%) |
0 (0.00%) |
0.9006 | 0.9006 |
| XGBoost | 126,234 (9.92%) |
1,146,290 (90.08%) |
0 (0.00%) |
0.9008 | 0.9008 |
Table 6.
Pathways and their descriptions.
| Pathway | Description |
|---|---|
| High Certainty, Clear Explanation | Transaction processed automatically; no review required |
| High Uncertainty, Clear Explanation | Analyst reviews transaction using actionable LIME rationale |
| High Uncertainty, Ambiguous Features | Analyst conducts detailed investigation with available insights |
Table 7.
Framework Comparison with Prior Work.
| Study | Dataset | Method | Coverage | Avg Set Size | XAI+CP |
|---|---|---|---|---|---|
| Reference [16] | Balanced | CP | 90% | 1.10 | ✗ |
| Reference [12] | ImageNet | LIME | N/A | N/A | ✗ |
| Reference [33] | Credit (10:1) | CP | 91% | 1.15 | ✗ |
| Reference [34] | Network Intrusion | CP | 89% | 1.08 | ✗ |
| ITC Framework | PaySim (773.70:1) | CP + LIME | 90.08% | 0.9008 | ✔ |
Table 8.
Quantile Thresholds for Significance Level
| Model | Quantile Threshold |
|---|---|
| Random Forest | 0.000150 |
| XGBoost | 0.000034 |
Table 9.
Prediction Region Summary and Coverage.
| Model | Empty Regions | Single-Class Regions | Ambiguous Regions | Coverage | Avg. Region Size |
|---|---|---|---|---|---|
| Random Forest | 126,510 (9.94%) |
1,146,014 (90.06%) |
0 (0.00%) |
0.9006 | 0.9006 |
| XGBoost | 126,234 (9.92%) |
1,146,290 (90.08%) |
0 (0.00%) |
0.9008 | 0.9008 |
Table 10.
Uncertainty Statistics by Class for XGBoost.
| Class | Mean Entropy | Mean Max Probability | Ambiguous Regions | Count |
|---|---|---|---|---|
| Fraud | 0.1415 | 0.9374 | 0 / 1,643 | 1,643 |
| Non-Fraud | 0.0010 | 0.9998 | 0 / 1,270,881 | 1,270,881 |
Table 11.
Top 5 High Uncertainty Fraud Cases.
| Index | Prob (No Fraud) | Prob (Fraud) | Entropy | Region |
|---|---|---|---|---|
| 17257 | 0.5190 | 0.4810 | 0.6924 | [] |
| 25075 | 0.7445 | 0.2555 | 0.5683 | [] |
| 54453 | 0.5481 | 0.4519 | 0.6885 | [] |
| 55703 | 0.3186 | 0.6814 | 0.6258 | [] |
| 57842 | 0.2722 | 0.7278 | 0.5854 | [] |
Table 12.
Top 5 Low Uncertainty Fraud Cases.
| Index | Prob (No Fraud) | Prob (Fraud) | Entropy | Region |
|---|---|---|---|---|
| 630 | 0.0164 | 0.9836 | 0.0839 | [] |
| 901 | 0.0000 | 1.0000 | 0.0000 | [1] |
| 1651 | 0.0000 | 1.0000 | 0.0000 | [1] |
| 2046 | 0.0000 | 1.0000 | 0.0000 | [1] |
| 2278 | 0.0000 | 1.0000 | 0.0000 | [1] |
Table 13.
Top 5 High Uncertainty Non-Fraud Cases.
| Index | Prob (No Fraud) | Prob (Fraud) | Entropy | Region |
|---|---|---|---|---|
| 21450 | 0.6783 | 0.3217 | 0.6281 | [] |
| 22423 | 0.7193 | 0.2807 | 0.5936 | [] |
| 37408 | 0.7574 | 0.2426 | 0.5540 | [] |
| 51254 | 0.6338 | 0.3662 | 0.6569 | [] |
| 52649 | 0.7451 | 0.2549 | 0.5677 | [] |
Table 14.
Summary Metrics for Random Forest and XGBoost.
| Metric | Random Forest | XGBoost |
|---|---|---|
| Coverage (Validity) | 0.9006 | 0.9008 |
| Empty (Uncertain) Regions | 9.94% | 9.92% |
| Ambiguous Regions | 0 | 0 |
| Mean Entropy (Fraud) | – | 0.1415 |
| Mean Entropy (Non-Fraud) | – | 0.0010 |
| Mean Max Probability (Fraud) | – | 0.9374 |
| Mean Max Probability (Non-Fraud) | – | 0.9998 |
Disclaimer/Publisher’s Note: The statements, opinions and data contained in all publications are solely those of the individual author(s) and contributor(s) and not of MDPI and/or the editor(s). MDPI and/or the editor(s) disclaim responsibility for any injury to people or property resulting from any ideas, methods, instructions or products referred to in the content. |
© 2026 by the authors. Licensee MDPI, Basel, Switzerland. This article is an open access article distributed under the terms and conditions of the Creative Commons Attribution (CC BY) license (http://creativecommons.org/licenses/by/4.0/).
Copyright: This open access article is published under a Creative Commons CC BY 4.0 license, which permit the free download, distribution, and reuse, provided that the author and preprint are cited in any reuse.


