Submitted:
04 January 2026
Posted:
06 January 2026
You are already at the latest version
Abstract
Sustainable climate adaptation in Bangladesh's highly vulnerable char regions is critically constrained by a financing gap between household commitment and financial capacity. This study diagnoses this “capacity-commitment gap” and proposes a novel blended finance solution. Applying the Contingent Valuation Method to 400 households in Bangladesh’s climate-vulnerable char regions, we employ Probit and Tobit models to analyze Willingness to Pay (WTP). We find strong motivation (65% WTP) but severely constrained capacity, with 90% of contributions capped at ≤400 BDT/month. Econometric analysis reveals that human capital (education) and experiential learning (disaster experience) are more powerful drivers of WTP than income alone, while a paradox of low institutional trust correlates with higher stated contributions—indicating fatalistic self-reliance. Crucially, stated WTP amounts reflect a strict affordability ceiling, not marginal valuation, invalidating user-pays models. We translate this diagnostic evidence into an innovative financial architecture: a Char Resilience Bond. This instrument securitizes the aggregate value of formalized in-kind community co-investment (labor, local knowledge) to credit-enhance and leverage external capital. Our study provides an actionable blueprint for transforming demonstrated local need into bankable adaptation investments, advancing the literature on financing public goods in subsistence economies.
Keywords:
climate adaptation finance
; willingness to pay (WTP)
; contingent valuation method (CVM)
; institutional trust
; char regions
; blended finance
; resilience bonds
; bangladesh
; capacity-commitment gap
1. Introduction
Bangladesh’s char regions—transient riverine islands—epitomize compound climate vulnerability, where geomorphological instability intersects with profound socio-economic marginalization (Rahman, 2017; Hossain et al., 2022). The resulting cycles of displacement and poverty create a critical challenge for sustainable adaptation. Climate change amplifies these risks through intensified cyclones, erratic rainfall, and rising temperatures, trapping char communities in cycles of displacement, poverty, and food insecurity (Sarker et al., 2021; Hossain, 2023). In response, the Government of Bangladesh and development partners have initiated various top-down adaptation programs, including embankments and early warning systems (Kabir et al., 2021). However, the efficacy of these interventions is often limited by financial shortfalls, governance deficits, and a lack of integration with local knowledge systems (Hossain, 2023; Rahaman, 2023). While community-based adaptation (CBA) is championed for its efficacy and equity (Haque, 2020; Rahaman, 2023), its scalability is hamstrung by a persistent financing gap. Communities possess willingness, local knowledge, and labor but lack the capital for substantive infrastructure or technology transfer (Kabir et al., 2021). This presents a core economic problem: how to finance public goods in contexts where willingness to pay (WTP) is decoupled from the ability to pay.
The Contingent Valuation Method (CVM) is a standard tool for eliciting WTP to inform resource allocation (Luzar & Cosse, 1998). However, its application in extreme poverty contexts is conceptually contested, as financial constraints may reveal an “affordability ceiling” rather than true valuation (Luzar & Cosse, 1998). Furthermore, existing studies in Bangladesh have focused on coastal zones or technical options, largely overlooking the role of institutional trust—a key mediator of the social contract and financial commitment in weak-state contexts (Bashar & Niaz, 2023). An integrated analysis of socio-economic capacity, experiential drivers, and institutional trust in shaping financial behavior in char regions is absent.
This study directly addresses this gap by performing a dual diagnostic and design exercise. First, we empirically diagnose the disconnect between household commitment and financial capacity for climate adaptation in two distinct char regions. Moving beyond simple WTP quantification, we integrate institutional trust and perceived need for external aid into our econometric models to explain financial behavior. Second, and crucially, we use this diagnostic evidence not to argue for marginal policy adjustments but to design a novel blended finance mechanism. We demonstrate that household WTP, properly interpreted as a signal of prioritized demand and a potential source of in-kind co-investment, can be structured to leverage external capital.
2. Literature Review
The pursuit of effective climate adaptation financing in vulnerable regions requires grounding in three interconnected bodies of literature: the unique socio-ecological vulnerability of the target context, the evolution of adaptation approaches and their financing dilemmas, and the economic valuation methods used to quantify community willingness to contribute.
2.1. The Nexus of Vulnerability: Socio-Ecological Precariousness in Char Regions
Bangladesh’s char regions are archetypes of compound climate vulnerability, where geomorphological instability and socio-economic marginalization create a vicious cycle of risk. Physically, these transient riverine landforms are defined by continuous erosion and accretion, undermining the very foundation for permanent settlement and agricultural sustainability (Rahman, 2017). This environmental precarity intersects with a socio-economic profile of profound disadvantage: char populations are frequently marginalized, landless, and exhibit limited access to formal education, healthcare, and credit (Abedin et al., 2018; Mamun et al., 2022). Livelihoods are predominantly tied to climate-sensitive sectors like rain-fed agriculture and fishing, making them directly vulnerable to hydrological variability, temperature rise, and saline intrusion (Sarker et al., 2021; Khatun et al., 2022). This creates a feedback loop wherein environmental shocks degrade livelihood assets, which in turn cripples the capacity to invest in resilience, entrenching households in a cycle of poverty and exposure (Hossain, 2023; Hossain et al., 2022). Recent empirical work has quantified this linkage, identifying climate-induced displacement and asset loss as primary drivers of food insecurity and economic fragility in these areas (Hossain et al., 2022). This literature establishes that vulnerability in the chars is not merely environmental but a product of intersecting physical and socio-economic forces, setting the stage for a financing challenge rooted in structural poverty.
2.2. The Adaptation Approach Debate: From Top-Down Infrastructure to Community-Based Action and its Financing Gap
Governmental and non-governmental responses have historically emphasized structural, top-down measures such as embankments, cyclone shelters, and early warning systems (Kabir et al., 2021). While providing critical protection, these interventions often face challenges related to high cost, maintenance burdens, and a lack of integration with local socio-ecological contexts, sometimes leading to maladaptation or the exacerbation of equity issues (Hossain, 2023). In contrast, a robust body of literature champions Community-Based Adaptation (CBA), which leverages indigenous knowledge, promotes local agency, and is often more culturally acceptable and sustainable (Haque, 2020; Rahaman, 2023). Empirical evidence from chars demonstrates the efficacy of localized CBA practices, including the adoption of salt-tolerant crops, homestead elevation, and livelihood diversification (Sarker et al., 2022; Uddin, 2023).
However, a critical and under-addressed barrier persists: the financial scalability of CBA. While communities can contribute labor and knowledge, the significant upfront capital required for communal infrastructure or technology transfer often exceeds local means (Kabir et al., 2021). This exposes a fundamental financing gap: CBA is advocated for its sustainability and equity, yet its replication and scaling are hamstrung by a lack of viable funding models that bridge minimal local capacity with necessary external capital. This gap points unequivocally to the need for innovative hybrid or blended finance models that can leverage community commitment to unlock larger-scale investment.
2.3. Valuing Adaptation: The Contingent Valuation Method in Contexts of Poverty
Placing an economic value on non-market goods like climate security is essential for policy design and resource allocation. The Contingent Valuation Method (CVM), a stated-preference survey technique, is a established method for eliciting Willingness to Pay (WTP) by presenting respondents with hypothetical markets (Luzar & Cosse, 1998). In climate adaptation research, CVM has been applied globally to value interventions from flood defenses to early warning systems. Its strength lies in capturing both use and non-use values. In Bangladesh, studies have utilized CVM primarily in coastal areas, finding WTP to be positively influenced by income, education, and direct disaster experience (Abedin et al., 2018; Khalid & Rahman, 2023).
Nevertheless, critical methodological and contextual critiques are relevant. First, standard applications often overlook behavioral and institutional variables like trust in implementing agencies, which can significantly influence hypothetical valuation and lead to “protest zeros” (Bashar & Niaz, 2023). Second, and more fundamentally, the application of CVM in extreme poverty contexts is conceptually contested. Scholars caution that in subsistence economies, WTP surveys may measure “willingness to wish” or intensity of need rather than a reliable revelation of ability to finance, as financial constraints overwhelmingly dictate responses (Luzar & Cosse, 1998). This critique suggests that in contexts like the chars, WTP amounts may reveal more about an affordability ceiling than a true marginal valuation of different goods. This literature necessitates a careful interpretation of WTP data, framing it not as a source of revenue but as a signal of demand, priority, and a legitimizing tool for securing progressive external finance.
2.4. Determinants of WTP: A Synthetic Framework and the Unaddressed Role of Institutional Trust
A synthesis of global and regional studies reveals consistent determinants of willingness to pay (WTP) for environmental goods, which can be grouped into three interrelated clusters. First, socio-economic capacity—encompassing household income and asset ownership—directly shapes the ability to pay, while education enhances risk perception and comprehension of long-term benefits, showing a strong positive correlation with WTP (Kabir et al., 2021; Abedin et al., 2018). Second, risk perception and experience play a critical role; although subjective risk awareness driven by climate knowledge is influential, personal experience with climate-related disasters proves to be a stronger predictor by making threats tangible and immediate (Abedin et al., 2018; Hossain et al., 2022). Third, institutional and social factors remain notably understudied in char contexts, where trust in managing institutions is essential—low trust can suppress WTP due to skepticism about efficacy or governance rather than a lack of value (Bashar & Niaz, 2023)—and social capital, often fostered through community organizations, can facilitate collective action and further influence willingness to contribute.
The existing literature on Bangladesh provides a foundation but exhibits clear limitations. Studies have either focused on general WTP in coastal zones or on technical adaptation options without a detailed, integrative analysis of financial behavior in the unique riverine char system. A systematic analysis that simultaneously incorporates the tripartite framework of socio-economic capacity, experiential drivers, and critically, institutional trust, is absent. This study fills that integrated gap. By applying CVM within a robust econometric framework that includes trust and perceived external aid necessity as key variables, it provides a diagnostic view of the financial viability of community-driven adaptation and directly informs the design of the blended finance models that the CBA literature identifies as necessary.
3. Methodology
3.1. Study Area and Site Selection Rationale
This study was conducted in two geographically and hydrologically distinct char regions to capture a spectrum of climate vulnerabilities within Bangladesh. The purposive selection was designed to test the robustness of findings across different hazard profiles and socio-ecological systems, thereby enhancing the external validity and generalizability of the results
- Bahadurpur, Rajbari District (Padma River Basin, Map -1,Figure 1): This site represents chars facing chronic, seasonal flooding and gradual riverbank erosion. The primary livelihood is settled agriculture, and risks are recurrent but somewhat predictable.
- Vasarpara, Fulchhari, Gaibandha District (Brahmaputra River Basin, Map -2,Figure 1): This site represents chars exposed to acute, flash flooding and rapid erosion/sandbar formation. Livelihoods are more diversified (agriculture, fishing, labor) and risks are more sudden and disruptive.
The specific comparison is valuable because it allows us to investigate whether the fundamental “capacity-commitment gap” and the determinants of WTP hold true across differing hazard types (chronic vs. acute) and major river systems. If consistent patterns emerge despite these contextual differences, it strengthens the argument for a unified policy framework applicable to char regions nationwide.
3.2. Sampling Framework and Implementation
A stratified random sampling technique was employed to ensure representation across key socio-economic strata known to influence adaptive capacity and WTP.
- Population & Sampling Frame: The sampling frame consisted of all households residing in the two selected char villages. Local government (Union Parishad) voter lists were used as the baseline frame, updated via field verification.
-
Stratification: Households were stratified along three dimensions:
- 1.
- Income Category (Low: <5,000 BDT; Medium: 5000-10,000 BDT; Higher medium: 10,001-20,000 BDT; High: 20001-30000 BDT; Top-high; > 30000 BDT) – as a proxy for payment capacity.
- 2.
- Primary Occupation (Agriculture, Fishing, Day Labor, Small Business, Service/Other) – as a proxy for climate sensitivity.
- 3.
- Education Level of Household Head (No formal education, Primary, Secondary and above) – as a proxy for risk awareness.
- Sample Size Determination: A target sample size of 400 households (200 per site) was determined using the standard formula for finite populations, targeting a 95% confidence level and a 5% margin of error, and adjusted for a design effect of 1.5 due to stratification.
- Selection: Within each stratum, households were selected using a random number generator. If a selected household was unavailable or declined, the next randomly selected household from the same stratum was approached.
3.3. Survey Instrument and CVM Scenario Development
Data were collected through structured, face-to-face interviews using a pre-tested questionnaire. The instrument development followed a multi-stage process:
- Qualitative Reconnaissance: Focus group discussions (FGDs) with community leaders and key informant interviews (KIIs) were conducted to identify locally relevant adaptation strategies, understand perceived costs, and design a credible payment vehicle.
-
Questionnaire Design: The final questionnaire contained five modules:
- ○
- Module A: Socio-demographic and economic characteristics.
- ○
- Module B: Climate risk perception, awareness, and personal disaster history.
- ○
- Module C: Institutional trust, access to finance, and experience with external aid.
- ○
- Module D: CVM Core Section. This presented a detailed, neutral scenario describing a hypothetical, community-managed “Climate Adaptation Fund.” The scenario specified that contributions would be collected monthly, managed by a committee of elected community members and local government officials, and used exclusively for pre-identified, prioritized projects in their own locality. The consequences of the fund’s success (reduced losses, safer shelter) and failure (continued vulnerability) were outlined.
- ○
- Module E: Elicitation of WTP for specific strategies (flood shelter, embankment, etc.) and debriefing questions to identify protest bids.
- Pre-testing and Refinement: The questionnaire and CVM scenario were pre-tested with 30 households (15 per site). Cognitive debriefing techniques were used to check for understanding of the hypothetical market, the payment vehicle, and the valuation good. Wording was refined accordingly.
3.4. Elicitation Method: Payment Card with Follow-Up
WTP was elicited using a payment card format followed by an open-ended question. This method was selected over dichotomous choice formats for its efficiency and lower cognitive burden on respondents in a low-literacy setting, and its ability to provide a distribution of values directly.
- Payment Card: Respondents were presented with a card showing five ordered monthly payment ranges (PC-1: 0-200 BDT to PC-5: 801-1000 BDT), determined from FGDs and pre-testing to cover the plausible range of contributions.
- Elicitation Question: “Given the described Adaptation Fund, which of these monthly contribution ranges would be the maximum you would be willing and able to pay for your household?”
- Open-Ended Follow-Up: Respondents selecting a range were then asked: “Could you tell me the exact maximum amount within that range you would agree to pay?” This helped pinpoint values and reduce range bias. The self-reported exact amount was used as the continuous variable for econometric analysis.
- Protest Zero Identification: Respondents stating zero WTP were asked a follow-up question to distinguish true economic zeros (cannot afford) from protest zeros (object to the scenario or distrust). Protest zeros were recorded and excluded from the primary WTP analysis.
It has been given more emphasis to elicit WTP using a Payment Card format followed by an Open-Ended question as it was chosen over the double-bounded dichotomous choice (DBDC) format for two primary reasons, specific to our context:
- Cognitive Suitability: The DBDC format, while statistically efficient, can be confusing for respondents with low literacy and numeracy skills, potentially leading to unreliable “yea-saying” or “nay-saying” (Carson & Groves, 2007). The payment card offers a visual, range-based anchor that is easier to comprehend in our survey context.
- Mitigating Range Bias: The standalone payment card can induce “range bias,” where respondents cluster at the mid-points of presented intervals. Our hybrid approach—asking for a specific amount within the chosen range—directly mitigates this bias, allowing us to recover a more precise continuous value for econometric analysis while maintaining the cognitive ease of the initial range selection.
3.5. Econometric Model Specification
To fully analyze the determinants of WTP, we employed two complementary econometric models that address the dual, censored nature of our dependent variable.
Model 1: Probit Model for the Binary Decision to Pay
This model estimates the probability that a household has a positive WTP (WTPi = 1). It is specified as:
P(WTPi = 1 | X) = Φ(γ0+γ1X1i+γ2X2i+γ3X3i+γ4X4i+γ5X5i+γ6X6i+γ7X7i+γ8X8i+γ9X9i)
where Φ(·) is the cumulative distribution function of the standard normal distribution and Xs are independent variables. This model is appropriate as the decision is binary and we assume the error term follows a normal distribution. It identifies factors that push a household over the threshold from unwillingness to willingness.
Model 2: Tobit (Censored Regression) Model for the Amount to Pay
This model estimates the determinants of the latent, desired WTP amount (WTP), acknowledging that we only observe this amount when it is positive (censored from below at zero). It is specified as:
WTP*i = β0 + β1X1i + β2X2i + β3X3i + β4X4i + β5X5i + β6X6i + β7X7i + β8X8i + β9X9i + ϵi
The observed WTP amount is: WTPi = WTP*i if WTP*i > 0; WTPi = 0 if WTP*i ≤ 0; where εi ~ N(0, σ2). The Tobit model is estimated via Maximum Likelihood Estimation (MLE), which provides consistent and efficient estimates in the presence of censoring. It tells us how the independent variables influence the underlying willingness amount, conditional on being willing.
3.6. Operationalization, Measurement and Theoretical Justification of Variables
The variables nominated to assess the economic, experiential, and perceptual drivers of households’ WTP for adaptation strategies comprehensively are presented in Table 1.
The selection of independent variables is grounded in the tripartite theoretical framework synthesized in the literature review (Socio-Economic Capacity, Risk Perception/Experience, Institutional Context), supported by prior empirical work.
- Socio-Economic Capacity (X1, X2, X3, X8): Income is the fundamental determinant of ability to pay. Education enhances risk comprehension and future orientation, consistently linked to higher WTP (Abedin et al., 2018). Occupation in climate-sensitive sectors increases perceived vulnerability and thus WTP (Kabir et al., 2021). Savings Access proxies for liquidity and financial resilience.
- Risk Perception and Experience (X5, X6): Climate Awareness captures cognitive risk perception. Direct Disaster Experience is a powerful motivator for protective investment, making risks salient and personal (Hossain et al., 2022).
- Institutional Context (X7, X9): Trust in Government Effectiveness is crucial; low trust can suppress WTP due to skepticism about fund management (Bashar & Niaz, 2023). The perceived need for External Assistance indicates recognition of the limits of self-financing and willingness to engage in co-investment models.
The relationship is conceptualized as follows: Socio-economic capacity sets the objective budget constraint. Risk perception and experience, moderated by education, generate the motivation to allocate resources to adaptation. The institutional context (trust, perceived external need) acts as a filter or catalyst, determining whether motivation translates into stated financial commitment (WTP) within the given budget constraint.
3.7. Hypotheses
Based on the theoretical framework and literature, we test the following directional hypotheses:
- H1: Education level and direct disaster experience have a positive and significant effect on both the probability (Probit) and the latent amount (Tobit) of WTP.
- H2: Household income positively influences WTP, but its marginal effect will be smaller than that of education and disaster experience.
- H3: Lower trust in government effectiveness increases the likelihood of a “protest zero” but, conditional on willingness to pay, may be associated with a higher stated WTP amount, reflecting a compensatory logic of self-reliance.
- H4: The perception that external assistance is necessary for adaptation has a positive effect on WTP, signaling community openness to blended finance models.
3.8. Model Justification
Selecting Dual-Model Approach is highly rationale because it involves two latent processes: first, a participation decision (to pay or not), and second, conditional on participation, a contribution decision (how much to pay). Using a single model (e.g., OLS on all data, including zeros) would yield biased estimates because it fails to account for the clustering of observations at zero and the fact that the factors influencing the initial participation decision may differ in magnitude or significance from those influencing the amount. Our two-model strategy is standard in the valuation literature for capturing this two-stage process without bias. The Probit model is ideal for understanding the factors that push a household over the threshold from unwillingness to willingness. The Tobit model is necessary because OLS regression on the observed WTP_Amount (including zeros) would yield biased and inconsistent estimates, as it fails to account for the clustering of observations at the limit (zero). Using both models allows us to distinguish whether a variable influences the likelihood of paying, the amount paid, or both.
3.9. Data Collection and Analytical Tools
A team of six trained enumerators, fluent in the local dialect, conducted the surveys between January and March 2024. Prior to each interview, enumerators read a standardized consent script explaining the study’s purpose, the voluntary and anonymous nature of participation, and the right to withdraw at any time. Verbal informed consent was obtained. Interviews lasted approximately 40-50 minutes. Data were recorded electronically on tablets using the KoboToolbox platform, which included built-in logic checks to minimize entry errors.
All statistical analyses were performed using Stata 18 and Eviews 14. Data cleaning and descriptive statistics were conducted first, followed by the estimation of the Probit and Tobit models. Robust standard errors were used to account for potential heteroskedasticity. Multicollinearity was assessed using Variance Inflation Factors (VIFs), with all VIFs below 3, indicating no severe multicollinearity concerns.
4. Empirical Findings
4.1. Socio-Demographic Profile of Respondents
A total of 400 households were surveyed across the two study sites. The socio-demographic and economic characteristics are summarized in Table 2. The sample reflects an older, economically vulnerable, and educationally disadvantaged population typical of these regions. The majority of respondents (60.5%) were aged 46 or above. Educational attainment was low, with 53.1% having no formal education and only 6.3% having completed higher secondary or above. Income distribution was polarized: 21.0% reported monthly incomes above 30,000 BDT, while 32.3% earned less than 10,000 BDT, including 9.8% in the lowest bracket (<5,000 BDT). Household sizes were predominantly medium (4-6 members, 74.3%), and a majority (58.8%) were landless.
4.2. Aggregate Willingness to Pay: Evidence of a Capacity-Commitment Gap
Survey results indicate strong foundational support for community-based climate adaptation, with 65% (n=260) of respondents expressing a willingness to contribute financially (Figure 2). This indicates significant perceived value and a collective willingness to invest in local resilience. However, the substantial minority (35%) who are unwilling to pay highlights important barriers—such as potential cost concerns, skepticism, or differing priorities—that must be addressed.65.0% (n=260) of respondents expressed a positive willingness to pay (WTP) for community-based adaptation (CBA).
However, analysis of the specific amounts respondents are willing to pay reveals a significant capacity-commitment gap. As detailed in Table 3, while most respondents are willing to pay, their commitments are heavily concentrated at lower levels. Over half (51.54%) would pay between 0 and 200 monetary units, and another 38.46% between 201 and 400 units. Only a small fraction (less than 10%) are willing to pay more than 400 units.
The right-skewed distribution of WTP, evidenced by a mean (221.01) higher than the median (194.03) and a large standard deviation (146.00), confirms this gap. The average is inflated by a minority willing to pay high amounts, while the typical respondent’s commitment is more modest. This disparity highlights that translating general willingness into actionable and equitable funding requires mechanisms that address varying financial capacities and concerns over cost, which likely underpin the 35% unwilling to pay at all.
4.3. Motivational Drivers and Institutional Context
The survey assessed several motivational and contextual factors that inform households’ stance toward adaptation investment. The descriptive statistics for these factors, recoded into binary variables for analysis, are presented in Table 4. The results indicate near-universal direct exposure to climate hazards, with 100% of respondents having experienced a major disaster in the past five years and 85.5% perceiving local climate risk as moderate to very high. Reflecting this experience, a significant majority (73.0%) considered investing in adaptation important to extremely important. The institutional context reveals a more complex picture: while a moderate proportion (51.8%) expressed some level of belief in government effectiveness, no respondent (0.0%) reported awareness of any ongoing local adaptation project. Furthermore, a strong consensus (81.0%) emerged on the necessity of external assistance for adaptation. Additional context shows that 62.3% were moderately to extremely confident in their household’s recovery capacity, 41.0% had access to savings or credit, and 34.5% had previously contributed to a community project. The prevalence of these factors is visualized in Figure 3, and their ranking by stated importance is shown in Figure 4.
4.4. Occupational Vulnerability and Payment Patterns
Consistent with the hypothesis that climate-sensitive livelihoods drive WTP, occupational analysis revealed clear patterns. As detailed in Table 5 and Figure 6, individuals in directly exposed sectors constituted the majority of those willing to pay: Agriculture (39.2%), Day Labor (24.6%), and Fishing (20.0%). Together, these three groups represented 83.8% of all positive WTP responses. Table 6 further reveals that these same groups were overwhelmingly concentrated in the lowest payment brackets (PC-1 and PC-2). For example, 79.4% of willing farmers and 92.2% of day laborers were in these brackets. This pattern underscores that those with the most to lose from climate impacts are the most motivated to contribute, yet they are also the most financially constrained, highlighting a targeting dilemma for equitable cost-sharing policies.
Figure 5.
Occupation-wise Distribution of Respondents Willing to Pay. Source: Author Estimation (2025).
Figure 5.
Occupation-wise Distribution of Respondents Willing to Pay. Source: Author Estimation (2025).
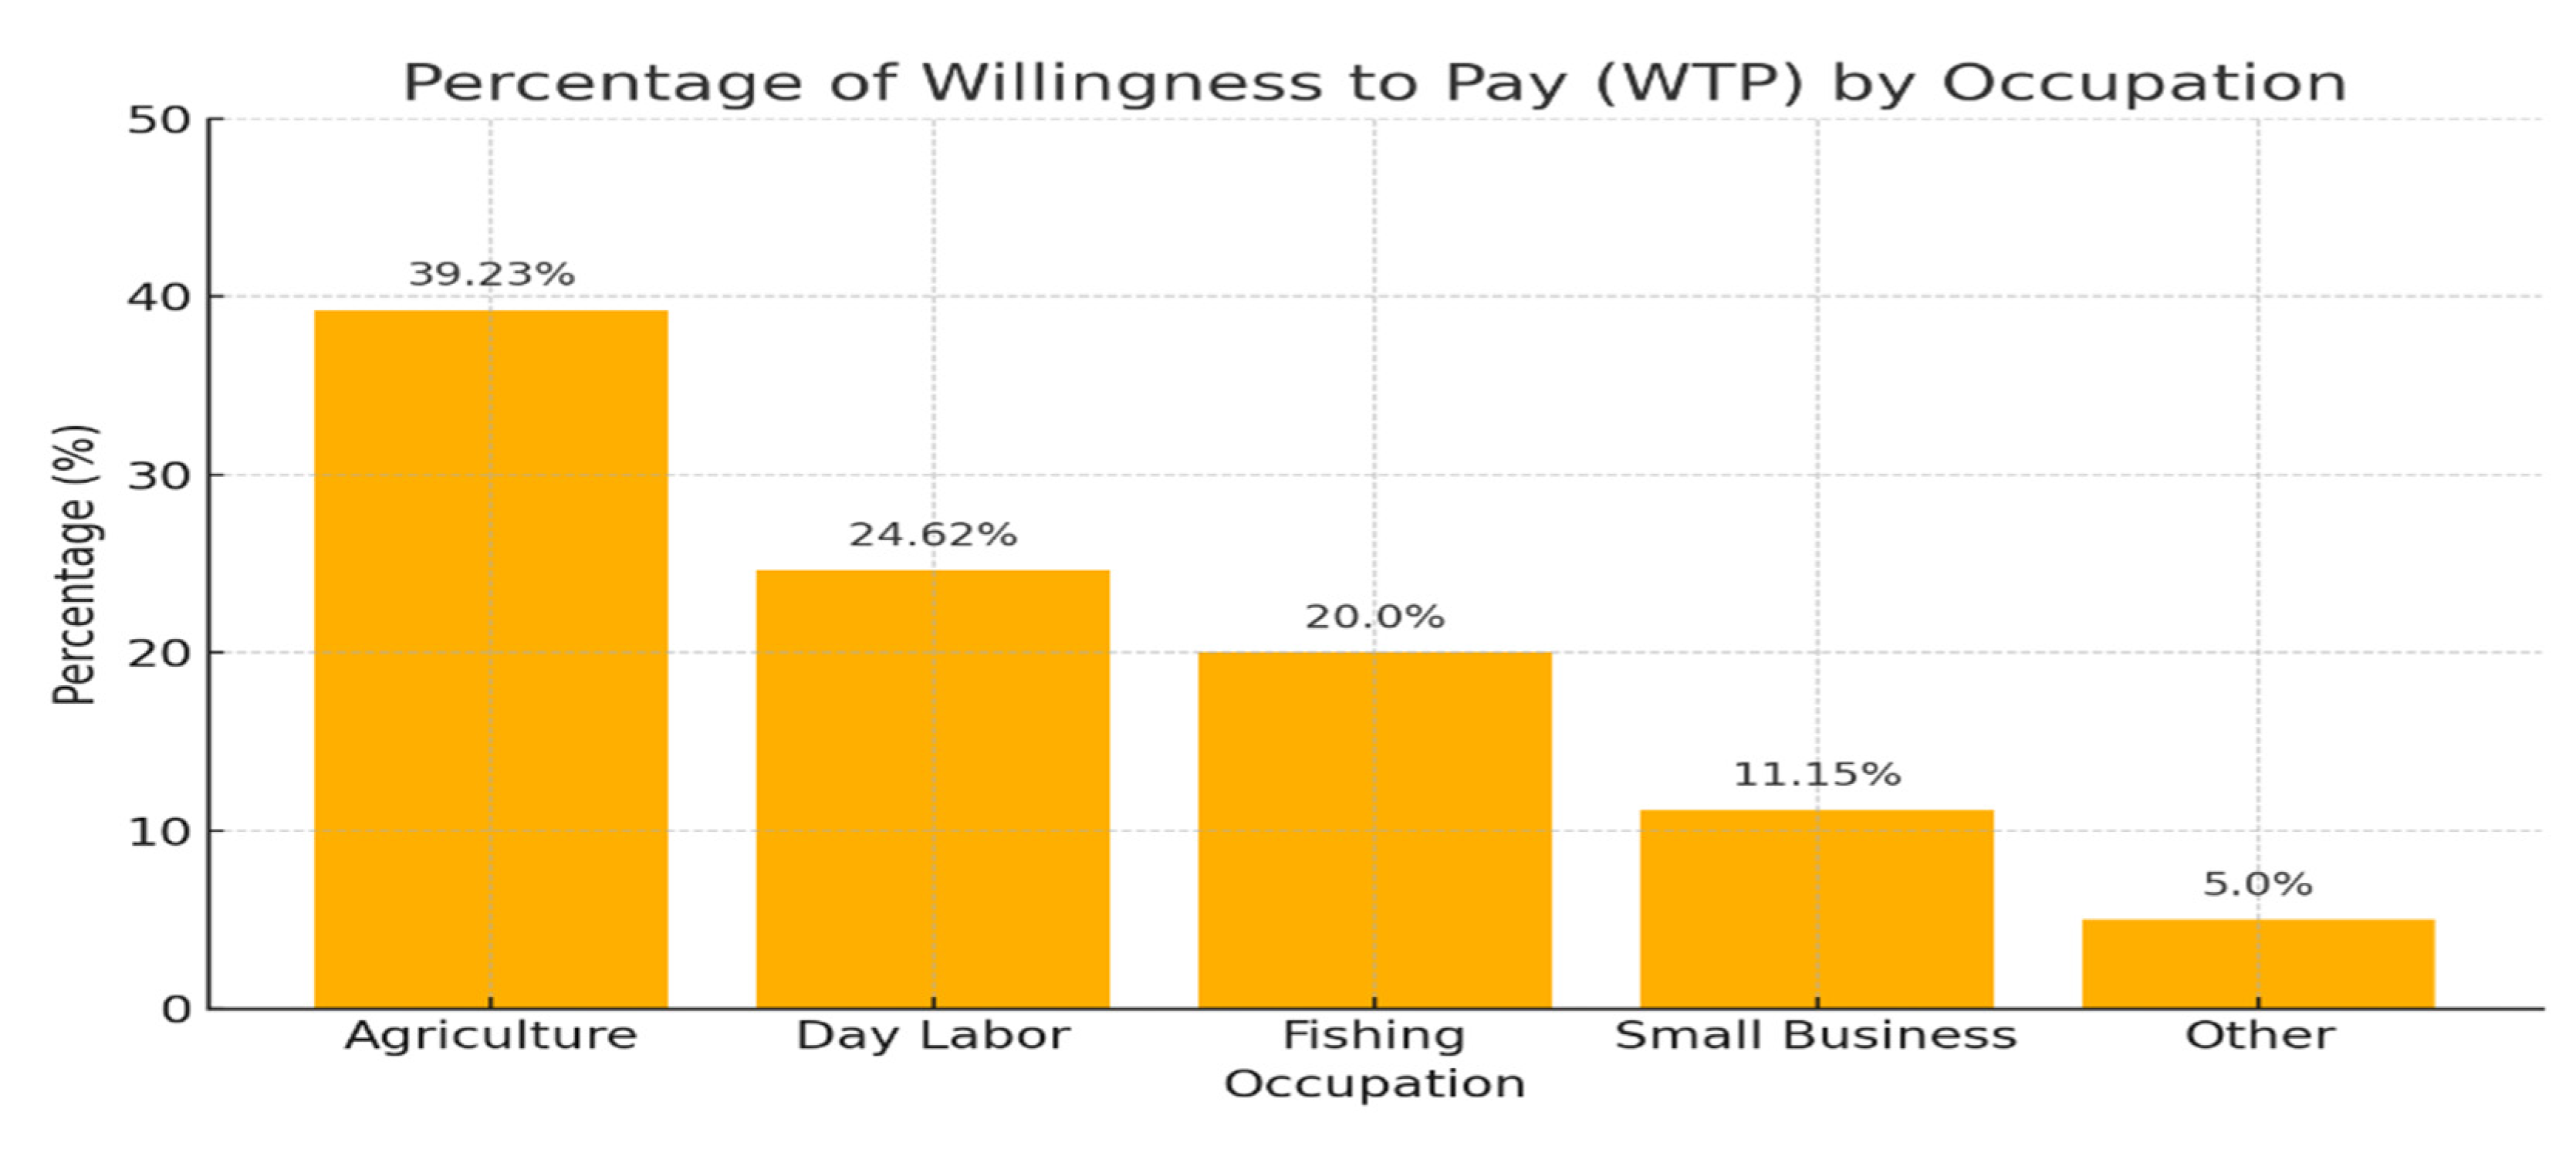
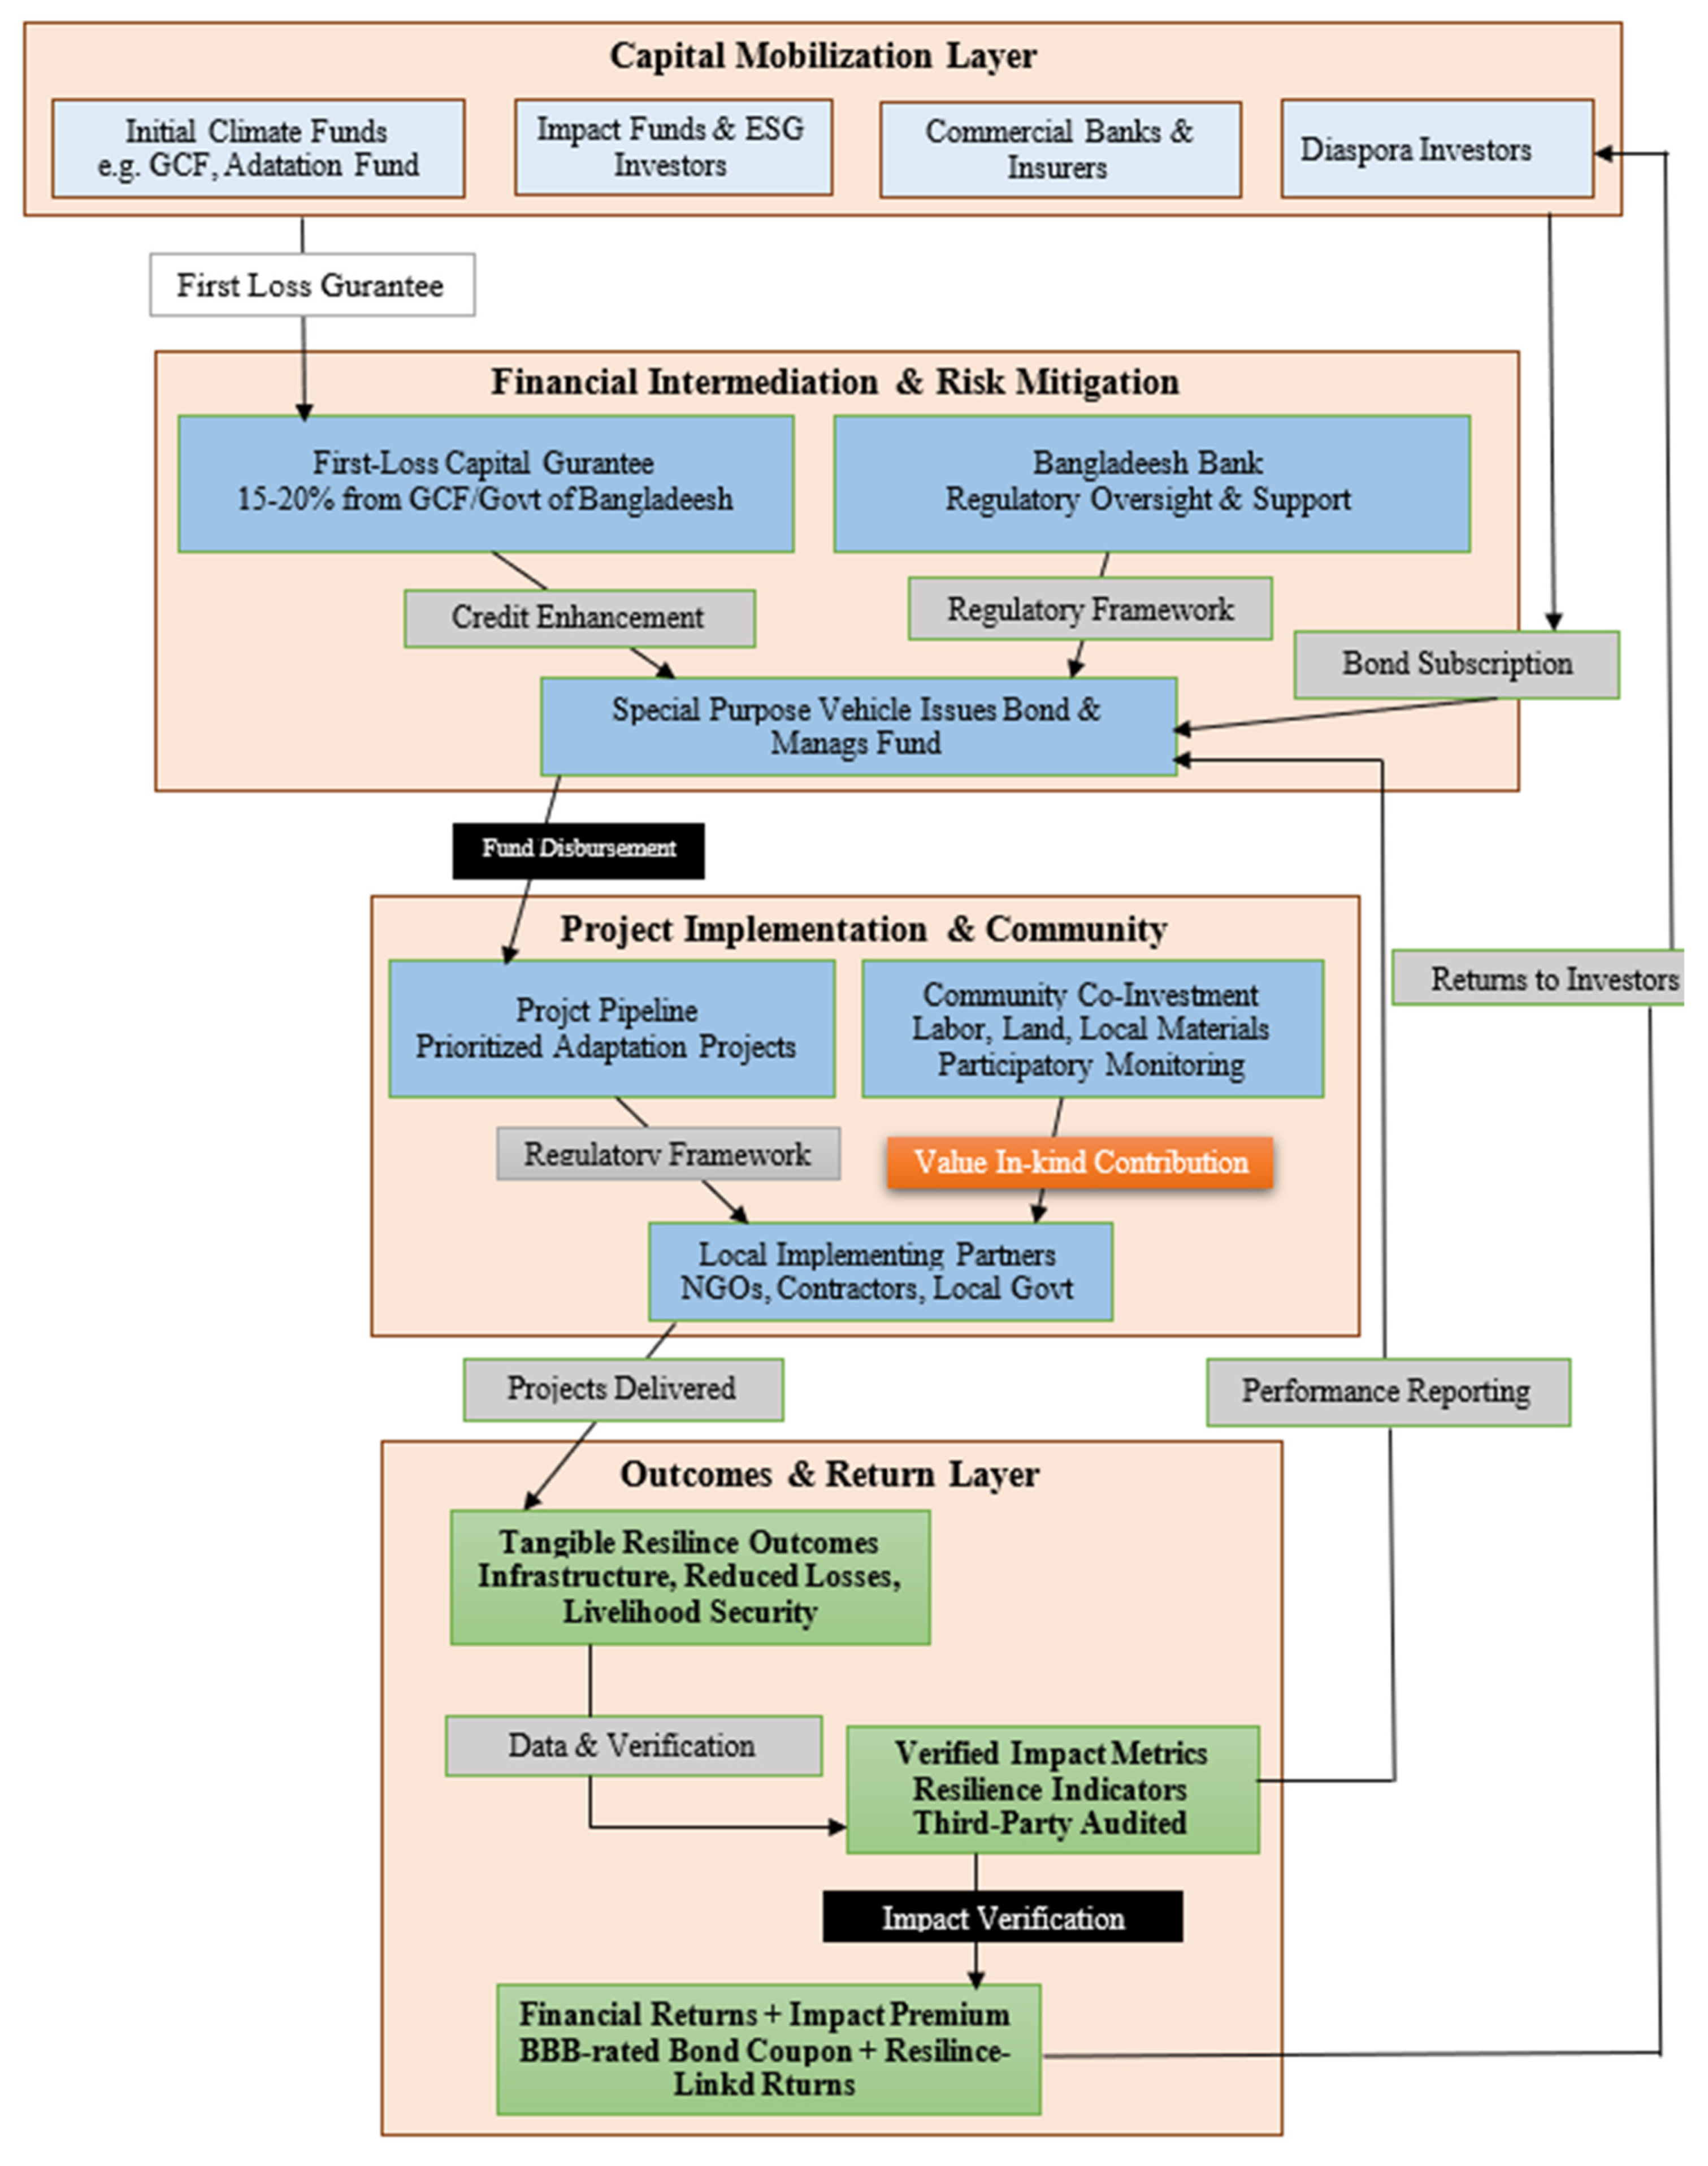
Figure 6.
The Char Resilience Bond Mechanism: Translating Community Commitment into Bankable Investments.
Figure 6.
The Char Resilience Bond Mechanism: Translating Community Commitment into Bankable Investments.
4.5. Reasons for Unwillingness to Pay
The analysis of unwillingness to pay (Table 7) underscores a critical challenge for adaptation financing: while affordability is a key barrier (30.0%), a majority of reasons are rooted in perceptions of efficacy and trust. Over 49% of unwilling households cited either a lack of trust in project effectiveness (23.6%) or uncertainty about benefits (25.7%). This finding highlights that securing community financial buy-in requires not only addressing poverty but also building trust and clearly demonstrating the value of adaptation investments.
4.6. Preferences and Valuation for Specific Adaptation Strategies
WTP for specific strategies was elicited to understand priorities and value differentiation. Results, presented in Table 10, demonstrate a consistent pattern of extremely constrained valuation across all options, with near-universal clustering in PC-1 (0-200 BDT). The most striking finding is the overwhelming concentration of stated WTP in the lowest payment bracket (PC-1: 0-200 BDT), which functions as a strict affordability ceiling for the community. For high-cost communal infrastructure like flood shelters and river embankments, which are highly valued for direct protection, 89.66% and 95.11% of valuations, respectively, fall within this lowest tier. The presence of a small minority (10.34% and 4.89%) in the PC-2 bracket for these structures suggests a marginally higher valuation for life- and livelihood-saving public goods, but the capacity to pay remains severely constrained. For all other strategies—including improved seeds, rainwater harvesting, climate education, early warning systems, and other unspecified strategies—100% of willing respondents are constrained to the PC-1 category. This unanimous convergence, including for the niche category (n=5), indicates that for both common and less-standardized adaptations, the pledged amount is not a reflection of their perceived utility but a universal indicator of maximum affordable contribution. This pattern leads to a crucial methodological and policy insight: the stated monetary amounts cannot be used to rank preferences between strategies, as they are uniformly capped by purchasing power. Instead, the data underscores that financial capacity, not differential valuation, is the primary determinant of WTP levels. The high number of respondents willing to pay something for prioritized strategies (e.g., 217 for early warning systems) signals strong demand, but the near-zero price point confirms that market-based or significant cost-recovery approaches are unfeasible. Consequently, these findings powerfully reinforce the necessity for externally subsidized financing models, where community contributions are symbolic of buy-in rather than a primary funding source, to implement the adaptation measures households clearly need and want. The inclusion of other strategies strengthen the conclusion by showing that even for adaptation options outside the standard list, the same financial constraint applies universally, leaving no exception to the observed “capacity-commitment gap.” The unanimous convergence on the lowest payment bracket across all strategy types is a decisive finding: financial capacity, not preference, is the primary determinant of stated WTP amount.
4.7. Econometric Analysis of Determinants
To disentangle the factors influencing the decision to pay and the amount pledged, Probit and Tobit models were estimated. Results are presented in Table 11. Based on the consolidated regression results, we reveal that education and direct disaster experience are the most powerful and consistent drivers across both stages of the contribution decision. These factors exhibit highly significant positive coefficients in both models, indicating that they strongly increase both the likelihood of being willing to pay and the amount households are prepared to contribute. In contrast, while household income shows a statistically significant positive effect, its relative magnitude—particularly in the Tobit model for the WTP amount—is notably smaller than that of education and disaster experience. This underscores that human capital and experiential learning are more critical motivators than raw financial capacity alone in this vulnerable context.
The results also uncover nuanced roles for institutional and perceptual variables. The perceived need for external assistance is a significant positive determinant in both models, signaling community openness to co-financed adaptation models. A critical finding is the divergent effect of trust in government effectiveness: it is statistically insignificant in the Probit model but negative and marginally significant in the Tobit model. This suggests that while low institutional trust does not deter the initial decision to contribute, it is associated with a lower pledged amount among those who are willing, possibly reflecting skepticism about the efficient use of larger contributions. Other variables, including occupation (marginally significant for the amount), climate awareness (significant in both models), and age and savings access (insignificant), complete the diagnostic picture. Collectively, these findings highlight that financial commitment is shaped by a complex interplay of socio-economic capacity, personal experience, and institutional confidence, with profound implications for designing equitable and viable adaptation finance mechanisms.
5. Discussion and Justification of the Findings
5.1. Interpreting the Capacity-Commitment Gap
The study’s core empirical contribution is the diagnosis of a stark “capacity-commitment gap.” While a significant majority (65%) expressed willingness to pay, the actual pledged amounts were heavily constrained, with 90% confined to the lowest two brackets (≤400 BDT). This finding challenges the neoclassical premise that contingent valuation in a hypothetical market can reveal true monetary valuation for public goods. In contexts of structural poverty and subsistence livelihoods, our results align with the critique that WTP surveys often measure “willingness to wish” or intensity of perceived need rather than actionable financial capacity (Luzar & Cosse, 1998). The monetary value becomes a capped signal, reflecting a stringent affordability ceiling rather than a marginal rate of substitution between income and climate security. Consequently, the primary policy takeaway is not the specific WTP amount, but the evidence of high demand coupled with profound financial incapacity. This invalidates pure “user-pays” or significant cost-recovery models and instead positions household WTP as a crucial indicator of community prioritization and a legitimizing tool for securing and leveraging progressive external capital.
5.2. Drivers of WTP: The Primacy of Human Capital and Experiential Learning over Income
The econometric results provide a nuanced understanding of WTP determinants that extends standard economic theory. While income exhibited a significant positive effect, its marginal influence was notably surpassed by education and direct disaster experience. This finding contests a narrow focus on financial capacity alone. Education’s role as the strongest predictor suggests that in high-risk environments, the cognitive ability to comprehend complex, long-term threats and the benefits of collective action is a more powerful driver of financial commitment than short-term disposable income (Kabir et al., 2021). This underscores human capital as a foundational enabler of adaptive behavior, highlighting the critical intersection between climate adaptation policy, basic education, and targeted climate literacy programs.
Furthermore, the powerful effect of disaster experience underscores the mechanism of “experiential learning” (Abedin et al., 2018). When risks become personally salient and tangible through recent loss, the motivation to invest in protection surges. However, building long-term resilience policy on the foundation of recent trauma is both ethically problematic and unstable, as risk salience decays over time. Therefore, adaptation initiatives must develop mechanisms—such as community risk archives or participatory scenario planning—to institutionalize this lived experience into continuous, forward-looking planning processes.
5.3. The Institutional Trust Paradox: Fatalistic Self-Reliance and the Imperative for Co-Governance
A critical and nuanced finding is the paradoxical role of institutional trust. While not a barrier to initial willingness, lower perceived government effectiveness was associated with a higher pledged WTP amount among contributors. This counterintuitive result diverges from studies where low trust suppresses WTP (Bashar & Niaz, 2023). We interpret this as evidence of fatalistic self-reliance: in the absence of credible public assurance, households internalize responsibility for their own security, expressing a higher hypothetical personal financial commitment as a compensatory mechanism. This reflects a breakdown in the social contract and a rational, if distressed, adaptation to perceived state incapacity.
This paradox carries a vital policy implication: waiting for high institutional trust as a prerequisite for action is a fallacy. Instead, the process of establishing transparent, community-co-managed financial mechanisms—like the Climate Adaptation Fund presented in our CVM scenario—can itself be a primary vehicle for building trust. The insignificant role of savings access further reinforces that trust-building must be coupled with mechanisms designed for extreme liquidity constraints, not assumed financial inclusion.
5.4. From Expressed Willingness to Actionable Finance: Rethinking the Unit of Contribution
The occupational analysis reveals a targeting dilemma: those most vulnerable and willing to pay (farmers, fishers, laborers) are also the most cash-constrained. This renders a cash-centric contribution model both inequitable and inefficient. It necessitates a fundamental reconceptualization of the “unit” of community contribution within blended finance models, drawing on principles from development economics.
The solution lies in formalizing in-kind contribution equivalencies. The primary capital of the poor in these regions is not cash but labor, local knowledge, and materials. A participatory system that assigns a standard monetary value to a day of community labor or donated indigenous seedlings can convert willingness into an actionable, equitable resource. This transforms community input from a symbolic token into a substantive investment that can be aggregated and used to credit-enhance external finance, such as matching grants or resilience bonds. This approach aligns with the CBA literature’s emphasis on local assets (Rahaman, 2023; Hossain, 2023) while directly addressing the financing gap it identifies (Kabir et al. 2021).
6. Conclusion and Policy Framework
This study investigated the financial viability of community-driven climate adaptation in Bangladesh’s char regions. The findings reveal a stark capacity-commitment gap: while 65% of households are willing to contribute, 90% are financially constrained to ≤400 BDT/month. The drivers of this commitment extend beyond income, with education and direct disaster experience being more powerful predictors. The paradoxical finding that lower trust in government effectiveness correlates with higher stated WTP suggests communities are resorting to fatalistic self-reliance. Collectively, these results demonstrate that household cash contributions are structurally insufficient, rendering conventional user-pays models infeasible.
Our diagnosis necessitates a fundamental shift in financing strategy—from extracting community cash to leveraging community commitment as collateral for external capital. Informed directly by our findings, we propose a Char Resilience Bond, consisting of a foundational governance institution and a scalable financing instrument, as the cornerstone of a blended finance framework. We think that this propose bond will work well as its structure does not rely on significant cash contributions. Instead, it formalizes in-kind community co-investment (labor, local materials, knowledge), valued through participatory methods. This aligns with our evidence that the poor’s primary capital is non-financial. The bond’s governance structure is embedded within Climate Resilience Hubs, co-managed by communities and local authorities. This transparent, local governance model directly addresses the trust paradox, using the financing process itself to rebuild the social contract.
Now, a million dollar question is ‘how can fund be collected by implementing climate resilient bond mechanism. We have produced a good answer of the question, which is shown in
Figure 6
. Basically,
Figure 6
presents a cohesive blended finance model. This architecture directly answers the fundamental question of fund collection and deployment, transforming the documented household willingness to pay into a mechanism for securing institutional investment for climate adaptation.
The proposed framework (
Figure 6
) is structured across four interconnected layers to ensure efficient capital flow and impact delivery. At the foundation, the Capital Mobilization Layer identifies diverse funding sources, including concessionary climate funds and public capital—which often provide essential first-loss guarantees—alongside private and impact investors such as commercial banks, insurers, diaspora networks, and ESG-focused funds, all attracted by blended financial and social returns. Moving to the Financial Intermediation & Risk Mitigation Layer, capital is channeled through a Special Purpose Vehicle (SPV) that issues the bond and manages the fund. A critical risk mitigant is a first-loss guarantee covering 15–20% of potential losses, provided by public or concessional sources, which credit-enhances the bond to a BBB rating and is overseen by regulatory bodies such as Bangladesh Bank. In the Project Implementation & Community Co-Investment Layer, the SPV disburses funds to a pipeline of prioritized adaptation projects, executed by local partners, while formally integrating community co-investment in the form of labor, land, or materials—valued through participatory systems to ensure local ownership and reduce cash costs. Finally, the Outcomes & Return Layer closes the cycle: verified resilience outcomes, audited against predefined metrics, support financial returns for investors through bond coupons, potentially augmented by an impact premium, thereby linking investment performance directly to tangible community adaptation benefits. This framework provides a concrete, evidence-based pathway to transform the documented “willingness to pay” of char communities into the “ability to invest” at scale, creating a replicable model for financing adaptation in the world’s most climate-vulnerable frontiers.
While this study offers robust diagnostic evidence, its limitations suggest valuable directions for future research. First, the contingent valuation scenario specified a community-managed fund, which may conflate WTP with governance preferences; testing alternative governance models would clarify this. Second, the cross-sectional design constrains causal claims about experiential learning; longitudinal surveys pre- and post-disaster would better capture dynamic changes in risk perception and commitment. Third, intra-community power structures and social networks—potential determinants of collective contributions—were not examined; qualitative or social network analysis could reveal these relational factors. Finally, extending the study to coastal chars exposed to cyclones and salinity would test the generalizability of the capacity-commitment gap and the proposed finance framework across different hazard profiles.
References
- Abedin, M. A.; Collins, A.; Habiba, U.; Shaw, R. Climate change, water scarcity, and health adaptation in southwestern coastal Bangladesh. International Journal of Disaster Risk Science 2018, 10(1), 28–42. [Google Scholar] [CrossRef]
- Ahmed, S. H.; Ahmed, R. Valuing flood adaptation options: Willingness to pay in Bangladesh’s vulnerable char regions. Environmental Development 2023, 22(4), 79–92. [Google Scholar]
- Anik, S. I.; Khan, M. A. S. A. Climate change adaptation through local knowledge in the northeastern region of Bangladesh. Mitigation and Adaptation Strategies for Global Change 2012, 17(8), 879–896. [Google Scholar] [CrossRef]
- Bashar, M. A.; Niaz, M. Willingness to pay for sustainable flood protection: Evidence from Bangladesh’s river islands. Environmental Economics and Policy Studies 2023, 26(1), 12–30. [Google Scholar]
- Carson, R. T.; Groves, T. Incentive and informational properties of preference questions. Environmental and Resource Economics 2007, 37(1), 181–210. [Google Scholar] [CrossRef]
- Haque, M. M. Vulnerability of the charland dwellers to climate change: Various adaptation practices in Bangladesh; Palgrave Macmillan, 2020; pp. 75–85. [Google Scholar] [CrossRef]
- Haque, S. E.; Nahar, N. Bangladesh: Climate change issues, mitigation, and adaptation in the water sector. ACS ES&T Water 2023, 3(6), 1484–1501. [Google Scholar] [CrossRef]
- Haque, S. T. M.; Yousuf, M. Bangladesh; Edward Elgar Publishing, 2024; pp. 409–412. [Google Scholar] [CrossRef]
- Hossain, B.; Shi, G.; Ajiang, C.; Sarker, N.; Sohel, M.; Zhou, S.; Yang, Q. Climate change–induced human displacement in Bangladesh: Implications for the livelihoods of displaced riverine island dwellers. Frontiers in Psychology 13 2022, Article 964648. [Google Scholar] [CrossRef] [PubMed]
- Hossain, M. Vulnerability and adaptation to climate change: A focus on marginalized communities in Bangladesh. Journal of Environmental Science and Policy 2023, 29(3), 98–114. [Google Scholar]
- Hossain, M. A. Livelihood vulnerability of char land communities to climate change and natural hazards in Bangladesh: An application of the livelihood vulnerability index. Natural Hazards 2023, 115(2), 1411–1437. [Google Scholar] [CrossRef]
- Hossain, M. A.; Rahman, S. Assessing climate change adaptation policies: Impacts on vulnerable communities in Bangladesh’s char regions. Global Environmental Change 2023, 35(3), 150–164. [Google Scholar]
- Hossain, M. Z. Climate change adaptation in rural Bangladesh: A review of policies and practices. Environmental Development 2022, 20(3), 43–57. [Google Scholar]
- Islam, S.; Khatun, S. Resilience-building strategies in Bangladesh’s char regions: A case study of agricultural adaptation. International Journal of Climate Change 2021, 19(1), 112–128. [Google Scholar]
- Kabir, A.; Amin, N.; Roy, K.; Hossain, S. Determinants of climate change adaptation strategies in the coastal zone of Bangladesh. Mitigation and Adaptation Strategies for Global Change 2021, 26(7). [Google Scholar] [CrossRef]
- Kabir, M. A.; Rahman, M. Climate change adaptation strategies and challenges in coastal Bangladesh. Climate Risk Management 2021, 8(4), 220–234. [Google Scholar]
- Khalid, S.; Rahman, M. A contingent valuation approach to estimating willingness to pay for climate adaptation strategies in Bangladesh’s coastal areas. Global Environmental Change 2023, 35(3), 150–164. [Google Scholar]
- Khan, I. A.; Ali, Z.; Asaduzzaman, M.; Bhuyan, M. H. R. The social dimensions of adaptation to climate change in Bangladesh; World Bank, 2010. [Google Scholar]
- Khan, N.; Rahman, A. Climate change impacts and adaptive responses in Bangladesh’s riverine regions. Journal of Environmental Management 2020, 14(5), 295–311. [Google Scholar]
- Khatun, F.; Islam, M. A. Building community resilience to climate change through participatory approaches: Insights from char areas. Community Development Journal 2023, 18(2), 150–165. [Google Scholar]
- Khatun, M.; Baten, M.; Farukh, M. Climate change–induced major livelihood changes among char dwellers in northern Bangladesh. SAARC Journal of Agriculture 2022, 19(2), 317–330. [Google Scholar] [CrossRef]
- Luzar, E. J.; Cosse, K. J. Willingness to pay or intention to pay: The attitude–behavior relationship in contingent valuation. Journal of Socio-Economics 1998, 27(3), 427–444. [Google Scholar] [CrossRef]
- Mamun, M. A.; Islam, M. A. Poverty and its linkages with climate vulnerability: Evidence from Bangladesh. International Journal of Environmental Research 2022, 17(2), 122–137. [Google Scholar]
- Rahaman, M. Community-based adaptation to climate change: Lessons from the char regions of Bangladesh. Sustainability Science 2023a, 18(1), 89–104. [Google Scholar]
- Rahaman, M. Exploring community-based adaptation strategies: An anthropological study on local knowledge in Bangladesh. South Asian Journal of Social Sciences and Humanities 2023b, 4(3), 39–53. [Google Scholar] [CrossRef]
- Rahman, M. The role of traditional knowledge in climate adaptation: Lessons from char communities in Bangladesh. Sustainability and Climate Change 2023, 17(2), 144–158. [Google Scholar]
- Rahman, S. M. Coastal livelihood vulnerability to climate change: A case study of Char Montaz, Bangladesh. American Journal of Modern Energy 2017, 3(4), 58. [Google Scholar] [CrossRef]
- Rahman, S. M.; Nizam, M. Climate change adaptation and community-based approaches in Bangladesh’s vulnerable char regions. Sustainability Science 2023, 18(1), 130–146. [Google Scholar]
- Saifullah, N. M. Char dwellers’ adaptation to climate change; BRAC University, 2010. [Google Scholar]
- Sarker, M. A.; Hossain, M. A. Adaptation strategies for climate-resilient agriculture in Bangladesh’s char regions. Agricultural Systems 2022, 24(1), 52–68. [Google Scholar]
- Sarker, M. A.; Islam, M. S.; Mollah, M. S. Climate change–induced migration and its impact on char communities in Bangladesh. Geography and Development Studies 2021, 14(1), 34–45. [Google Scholar]
- Sarker, M.; Kabir, F. Adaptation strategies to mitigate climate vulnerability in the char regions of Bangladesh. Journal of Climate Change and Sustainability 2022, 8(1), 45–60. [Google Scholar]
- Sarker, M.; Kabir, F. Assessing the impacts of climate change on socioeconomic conditions of char communities in Bangladesh. Journal of Rural Development 2023, 42(1), 44–60. [Google Scholar]
- Sarker, M.; Kabir, R. Livelihood diversification as an adaptation strategy in climate-impacted communities: Evidence from char regions of Bangladesh. Environmental Economics and Policy Studies 2022, 24(3), 233–246. [Google Scholar]
- Sarker, N.; Wen, J.; Yang, B.; Yusufzada, S.; Huda, N.; Mahbub, F. Environmental governance and disaster vulnerability in rural Bangladesh. Growth and Change 2021, 52(2), 1155–1171. [Google Scholar] [CrossRef]
- Sarker, U.; Kaysar, M.; Uddin, R.; Hassan, S.; Hassan, M. Farmers’ perspectives on cropping patterns for sustainable production in Bangladesh’s char areas. Sustainability 2022, 14(3), Article 1745. [Google Scholar] [CrossRef]
- Tashmin, N.; Islam, S.; Farzana, S.; Naher, S. Challenges of local coping capacities due to climate change in coastal Bangladesh. Journal of Geoscience and Environment Protection 2018, 6(8), 66–86. [Google Scholar] [CrossRef]
- Uddin, M. Livelihood changes of char women through participation in development programs in Bangladesh. Asian Journal of Agricultural Extension, Economics & Sociology 2023, 41(11), 121–137. [Google Scholar] [CrossRef]
- Uddin, M. A.; Rahman, M. Empowering women in climate adaptation: The role of micro-enterprises in Bangladesh’s char regions. Gender, Development, and Climate Change 2021, 10(2), 101–115. [Google Scholar]
- Uddin, M.; Sarker, T. Public valuation of flood risk mitigation in Bangladesh’s char regions: A contingent valuation study. Environmental Science and Policy 2023, 22(5), 15–28. [Google Scholar]
Figure 1.
Study Area.
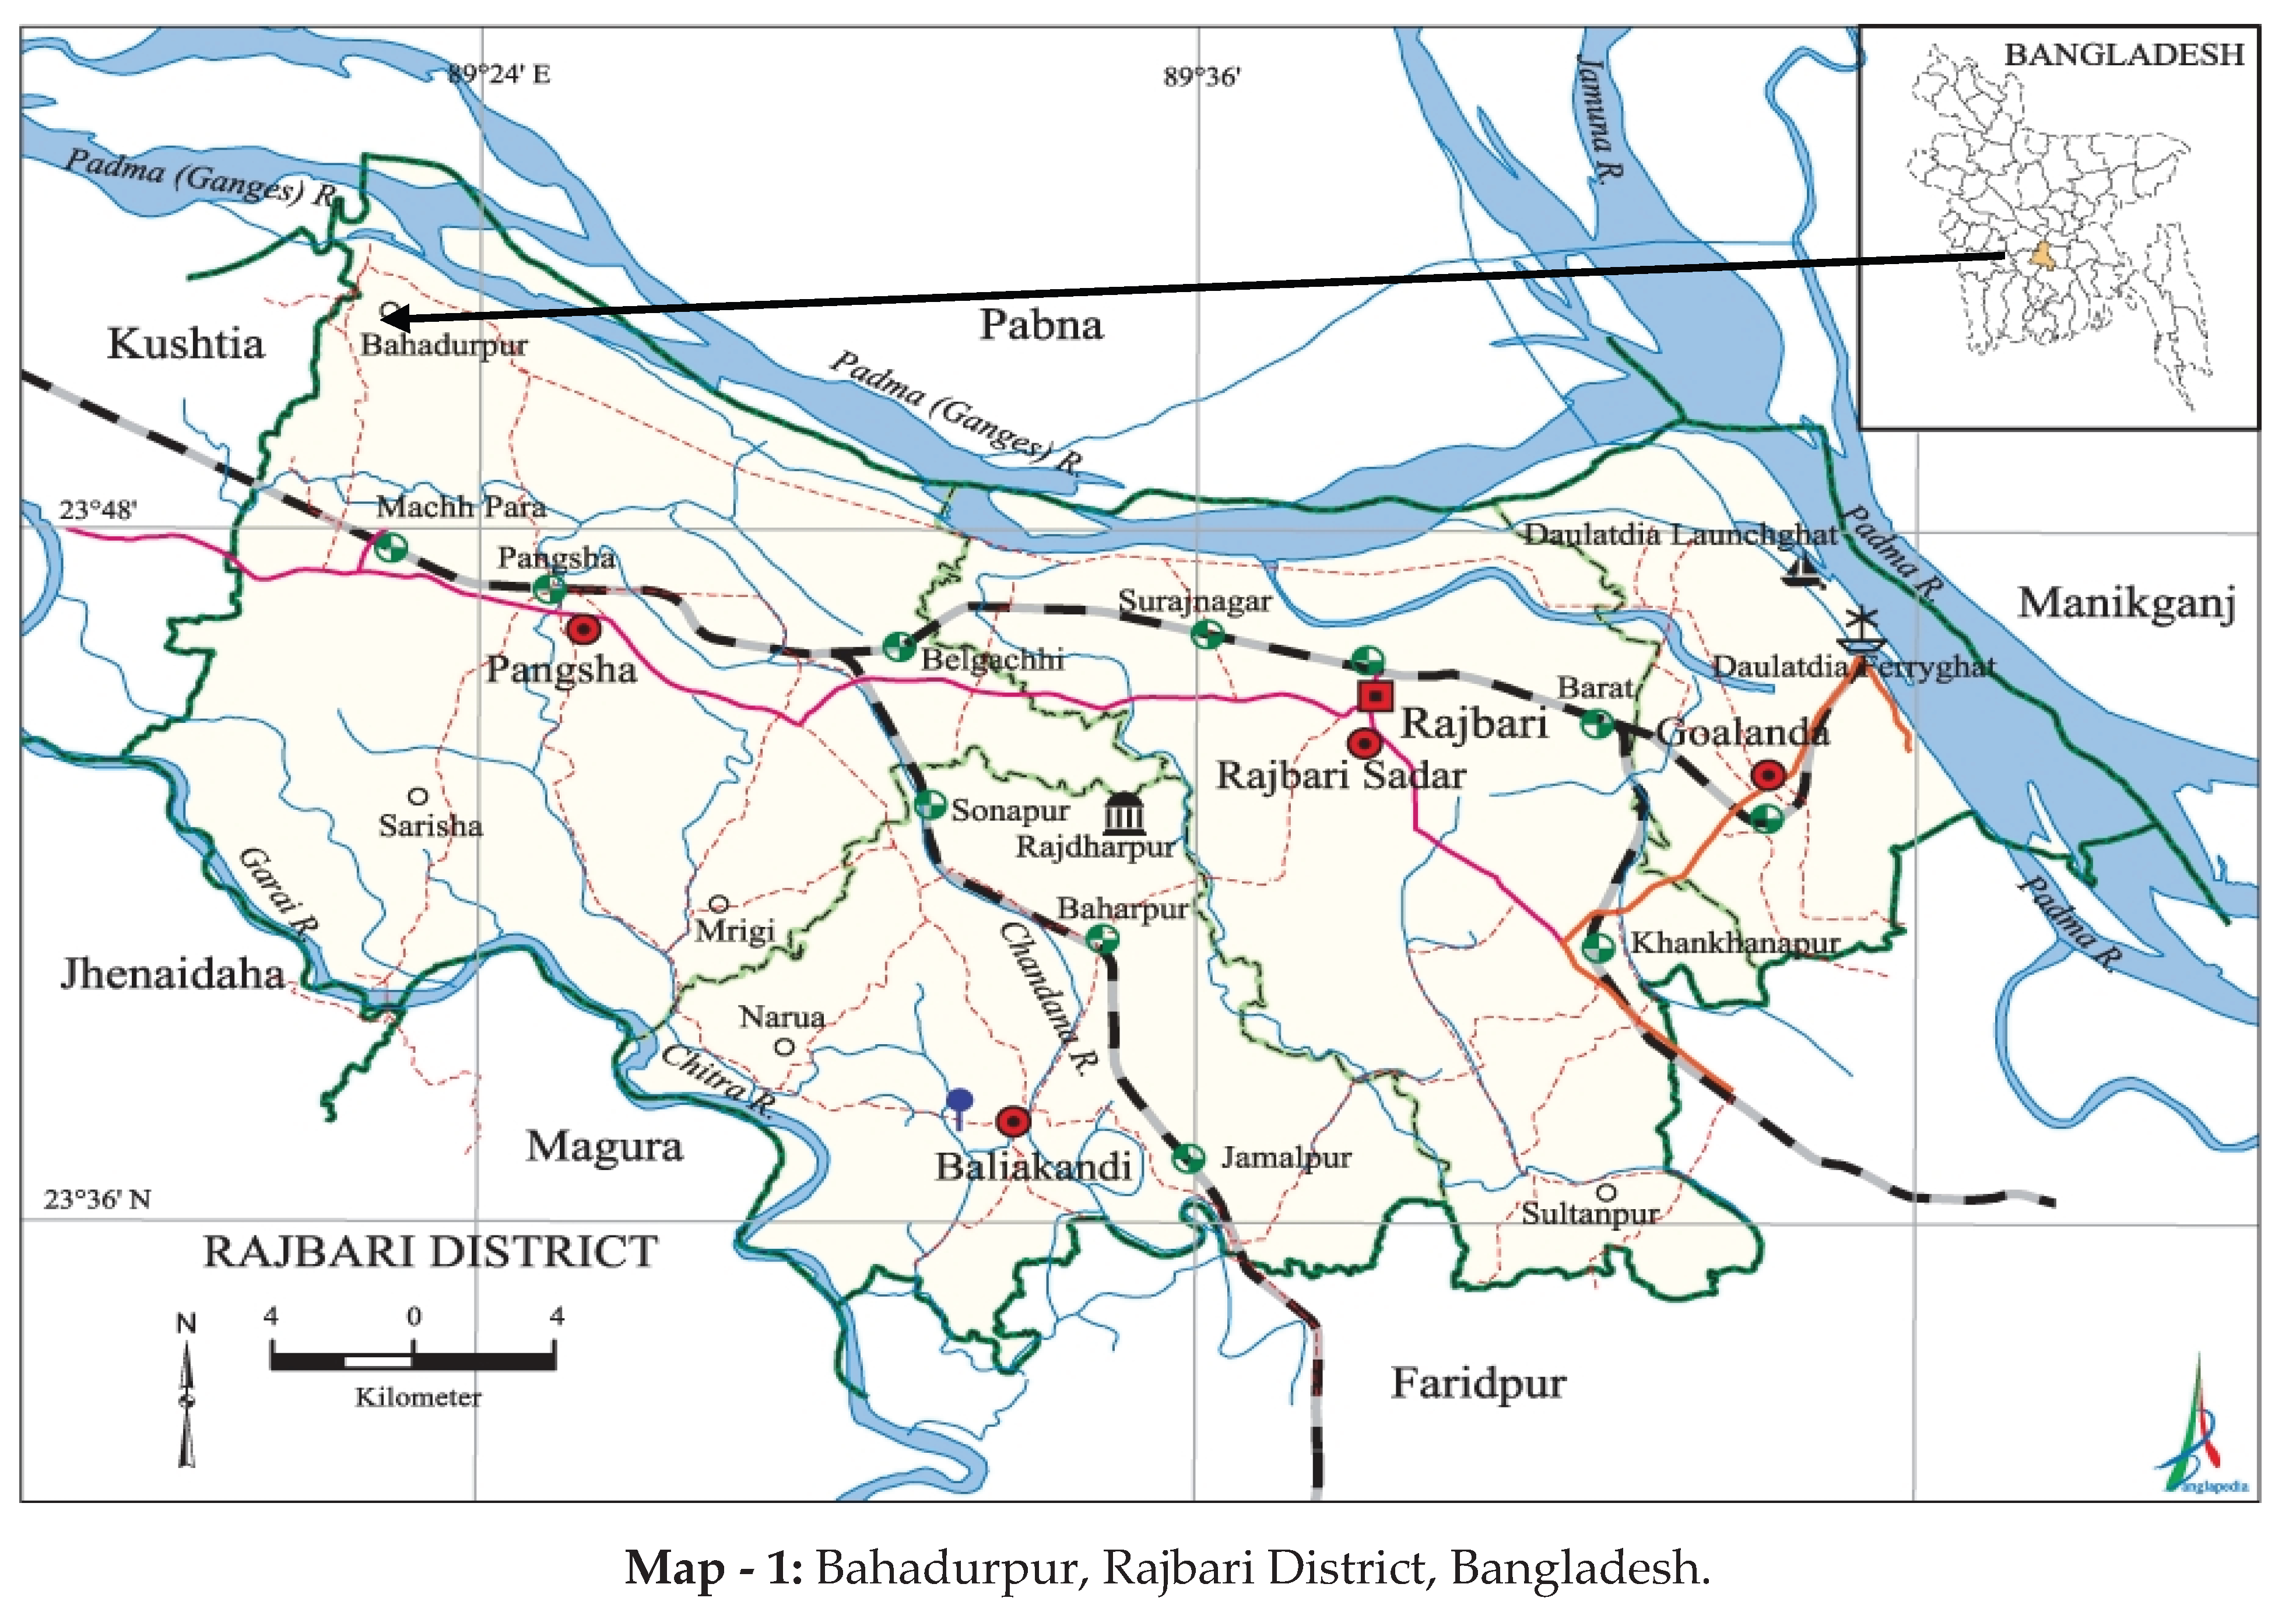
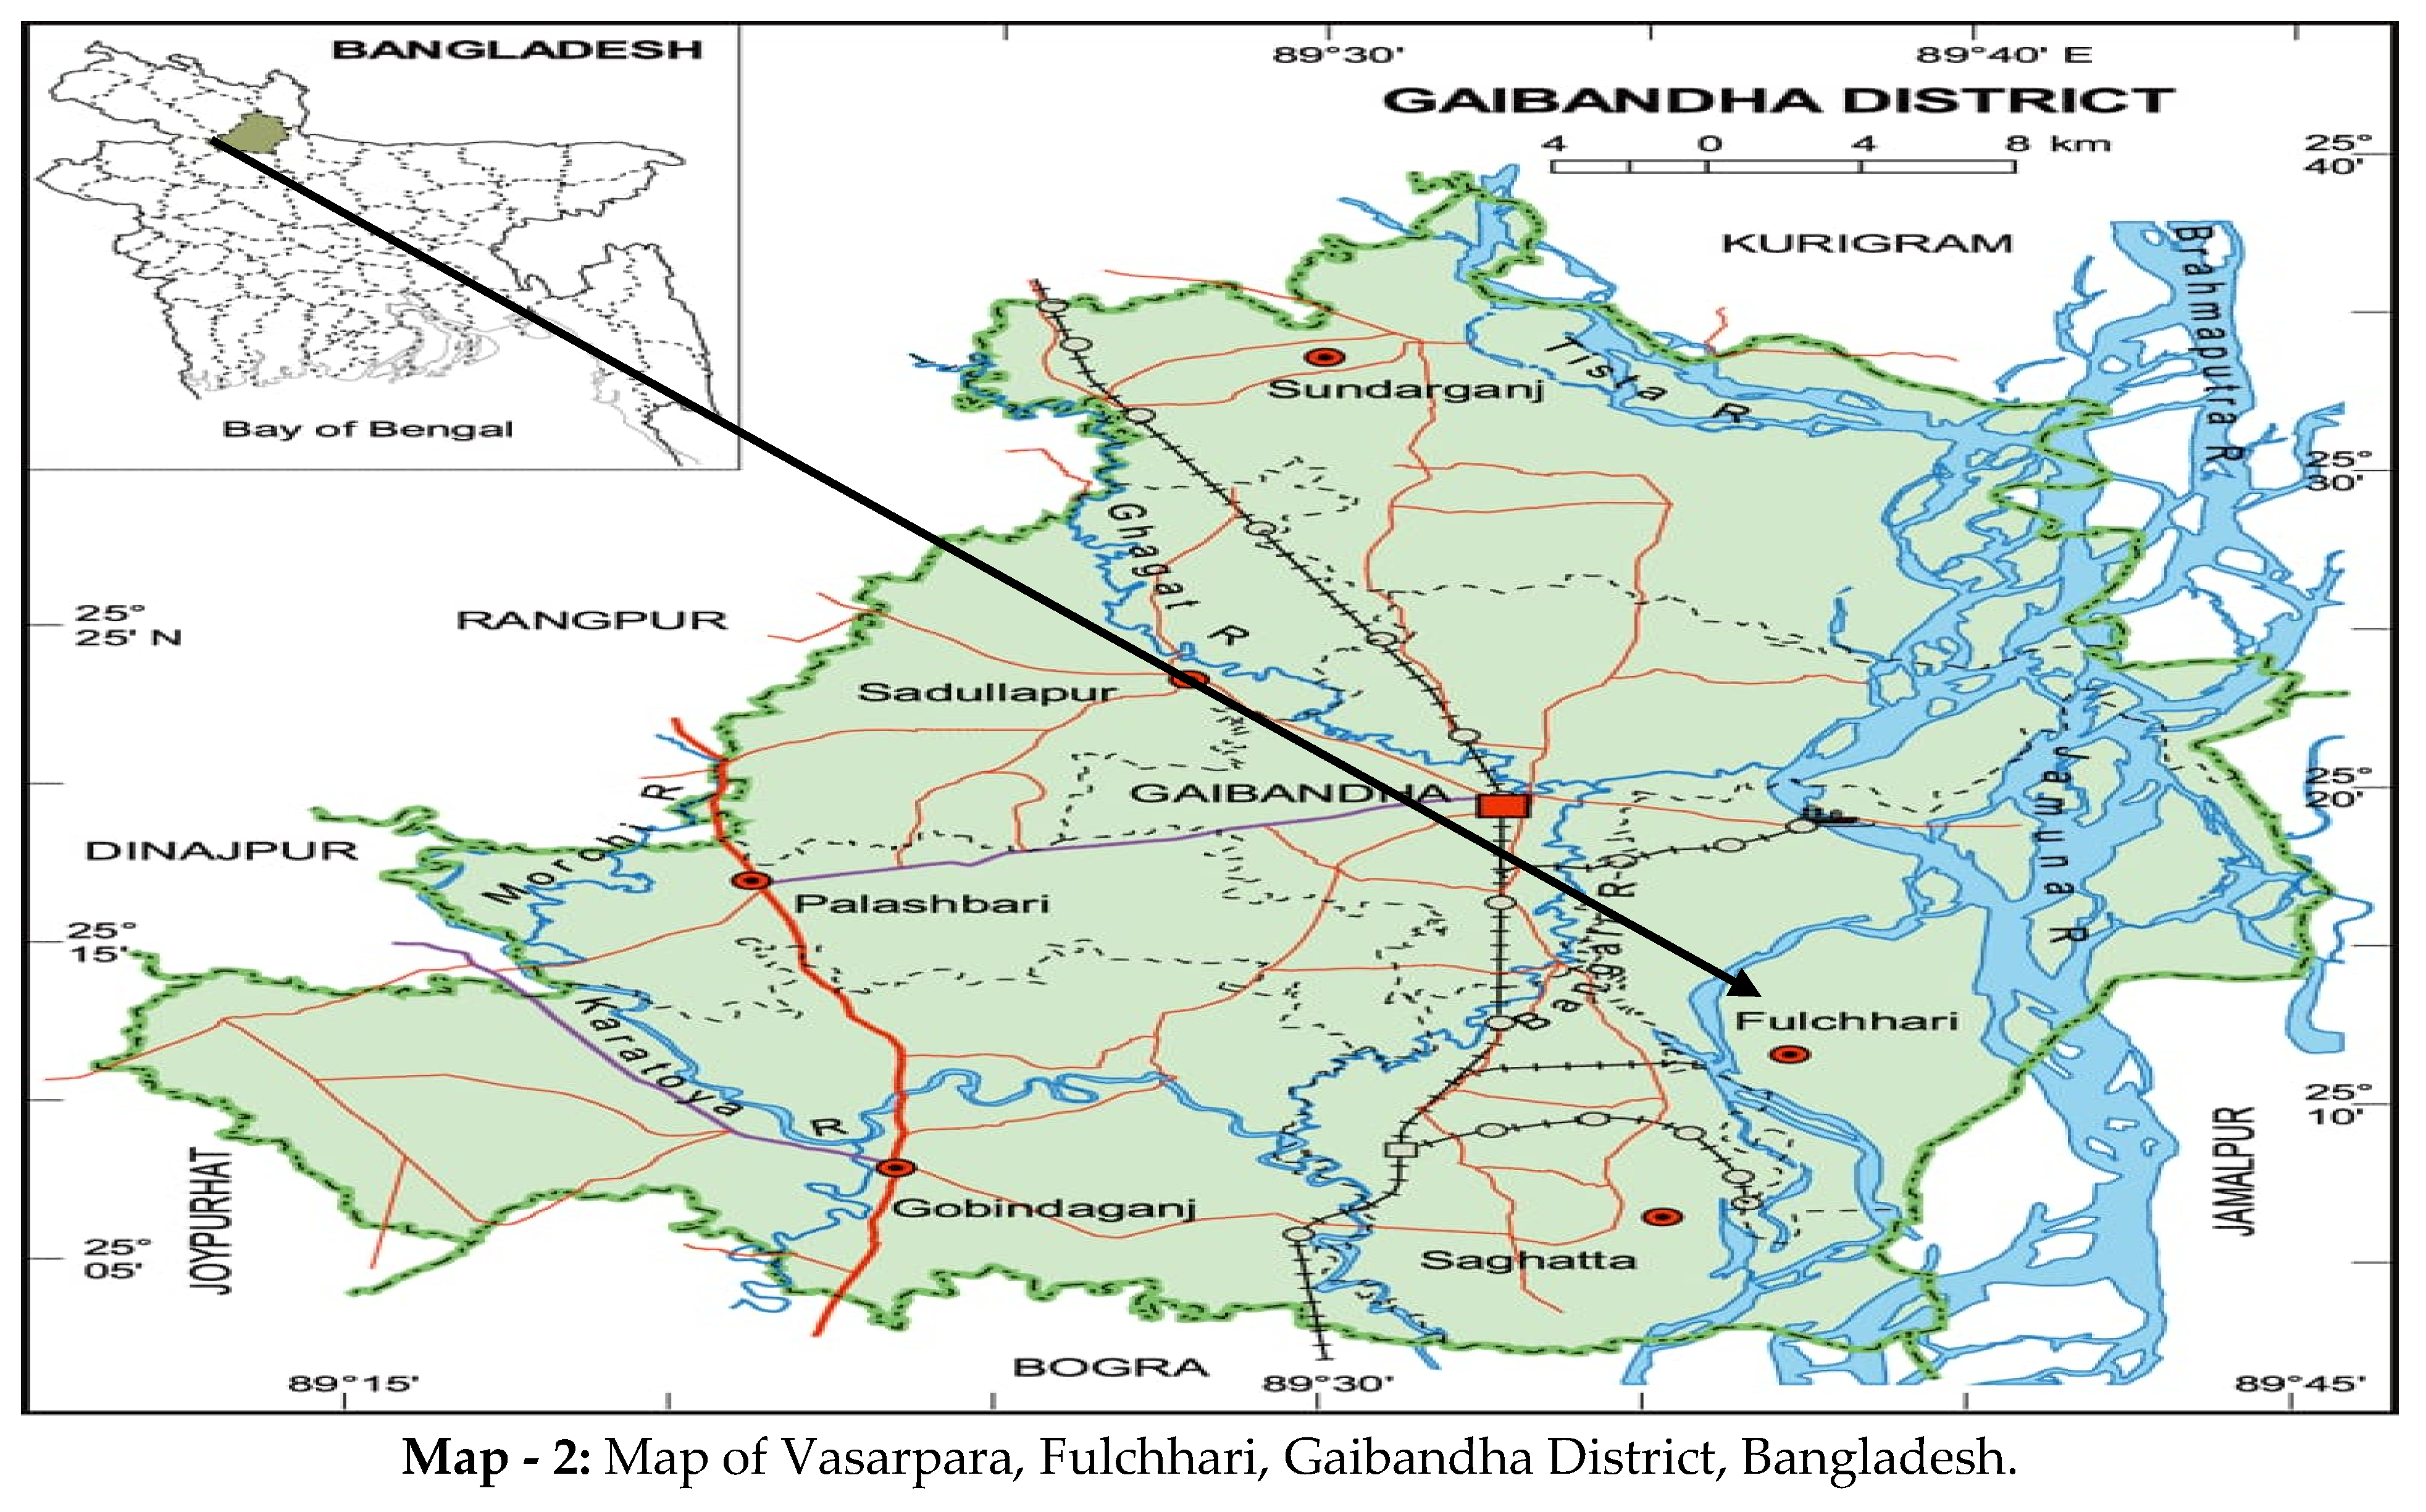
Figure 2.
Percentage For Respondents Willing to Pay for CBA. Source: Author Estimation (2025).
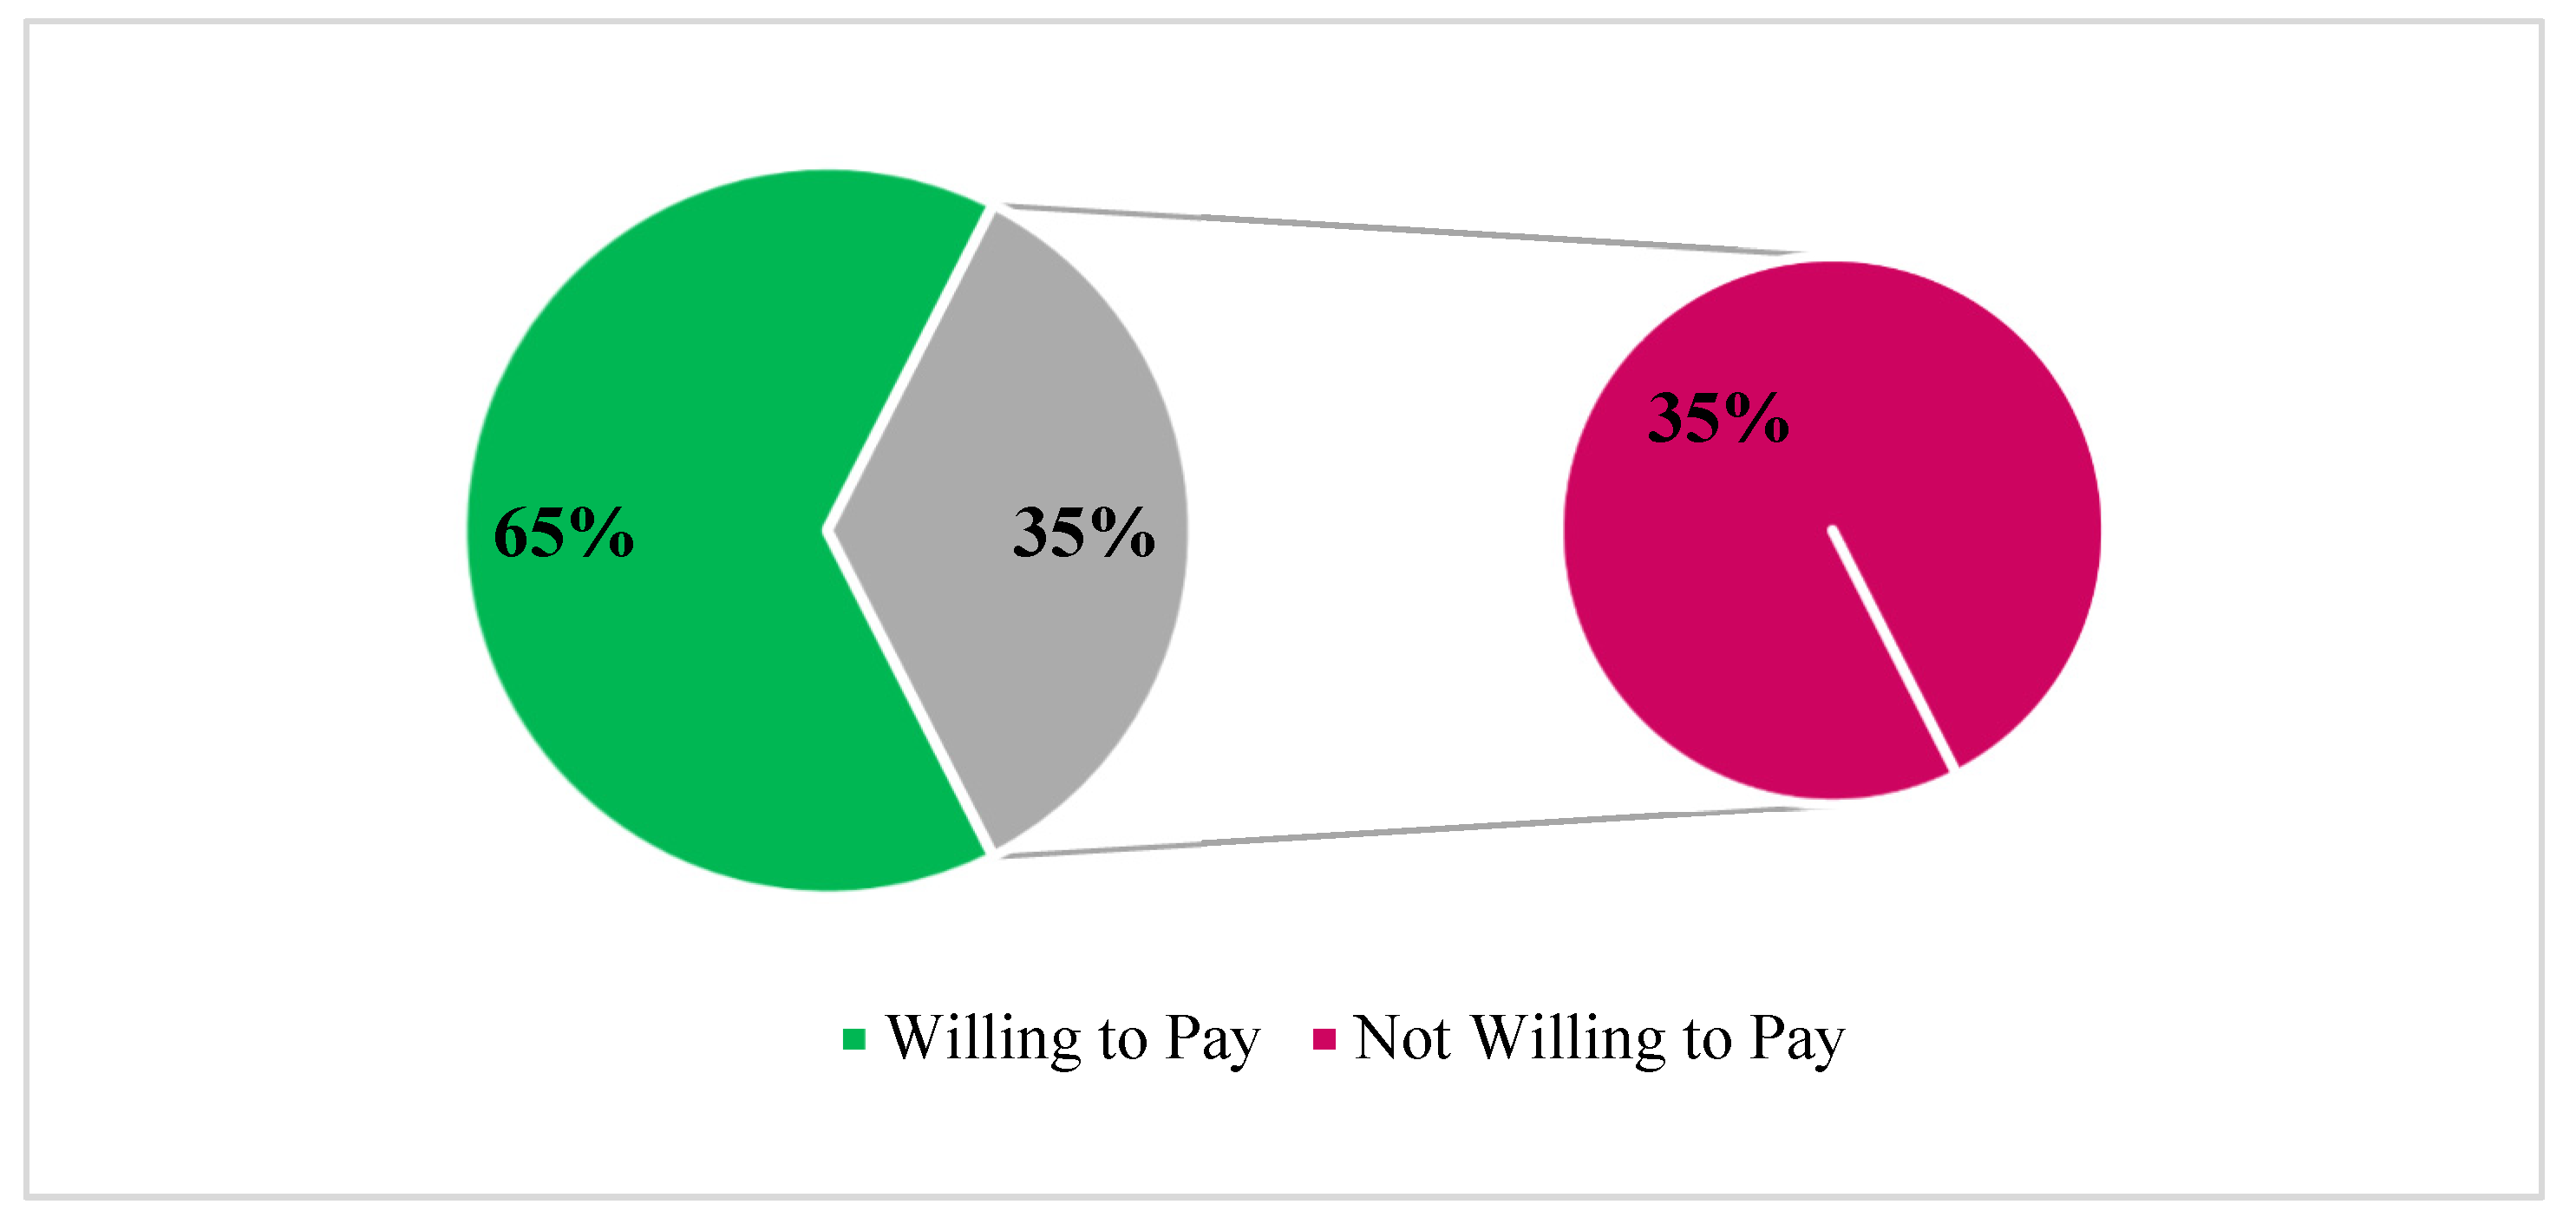
Figure 3.
Motivational Factor For WTP. Source: Author Estimation (2025).
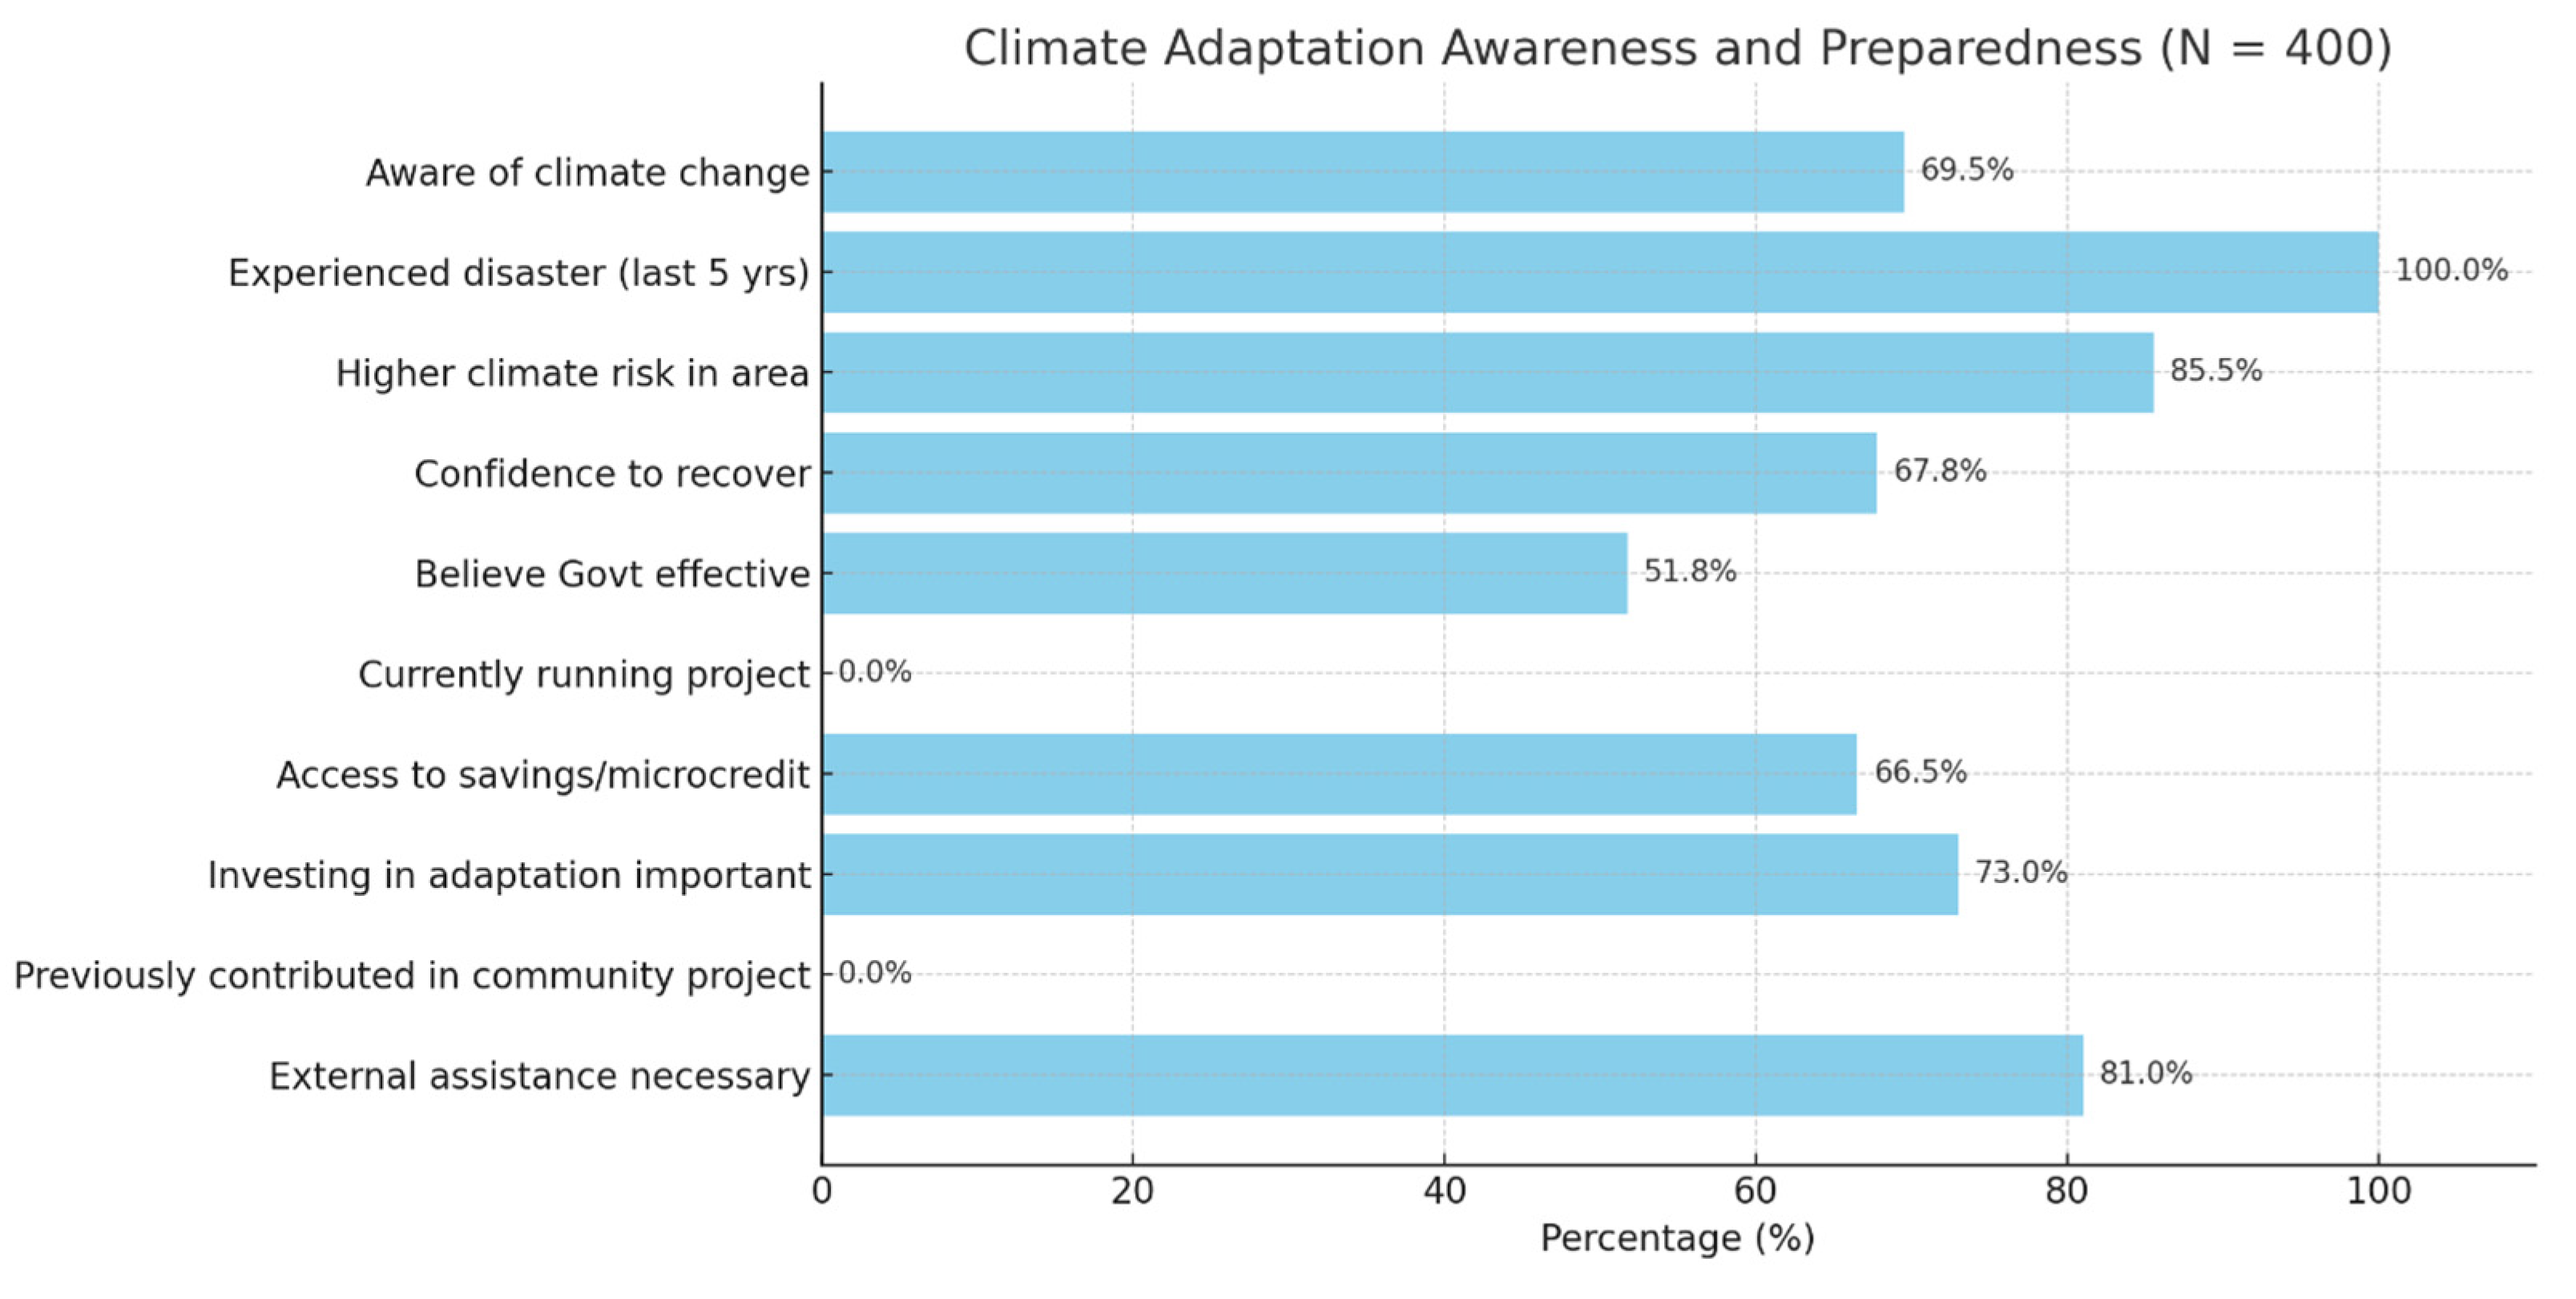
Figure 4.
Ranking For motivational Factor for WTP. Source: Author Estimation (2025).
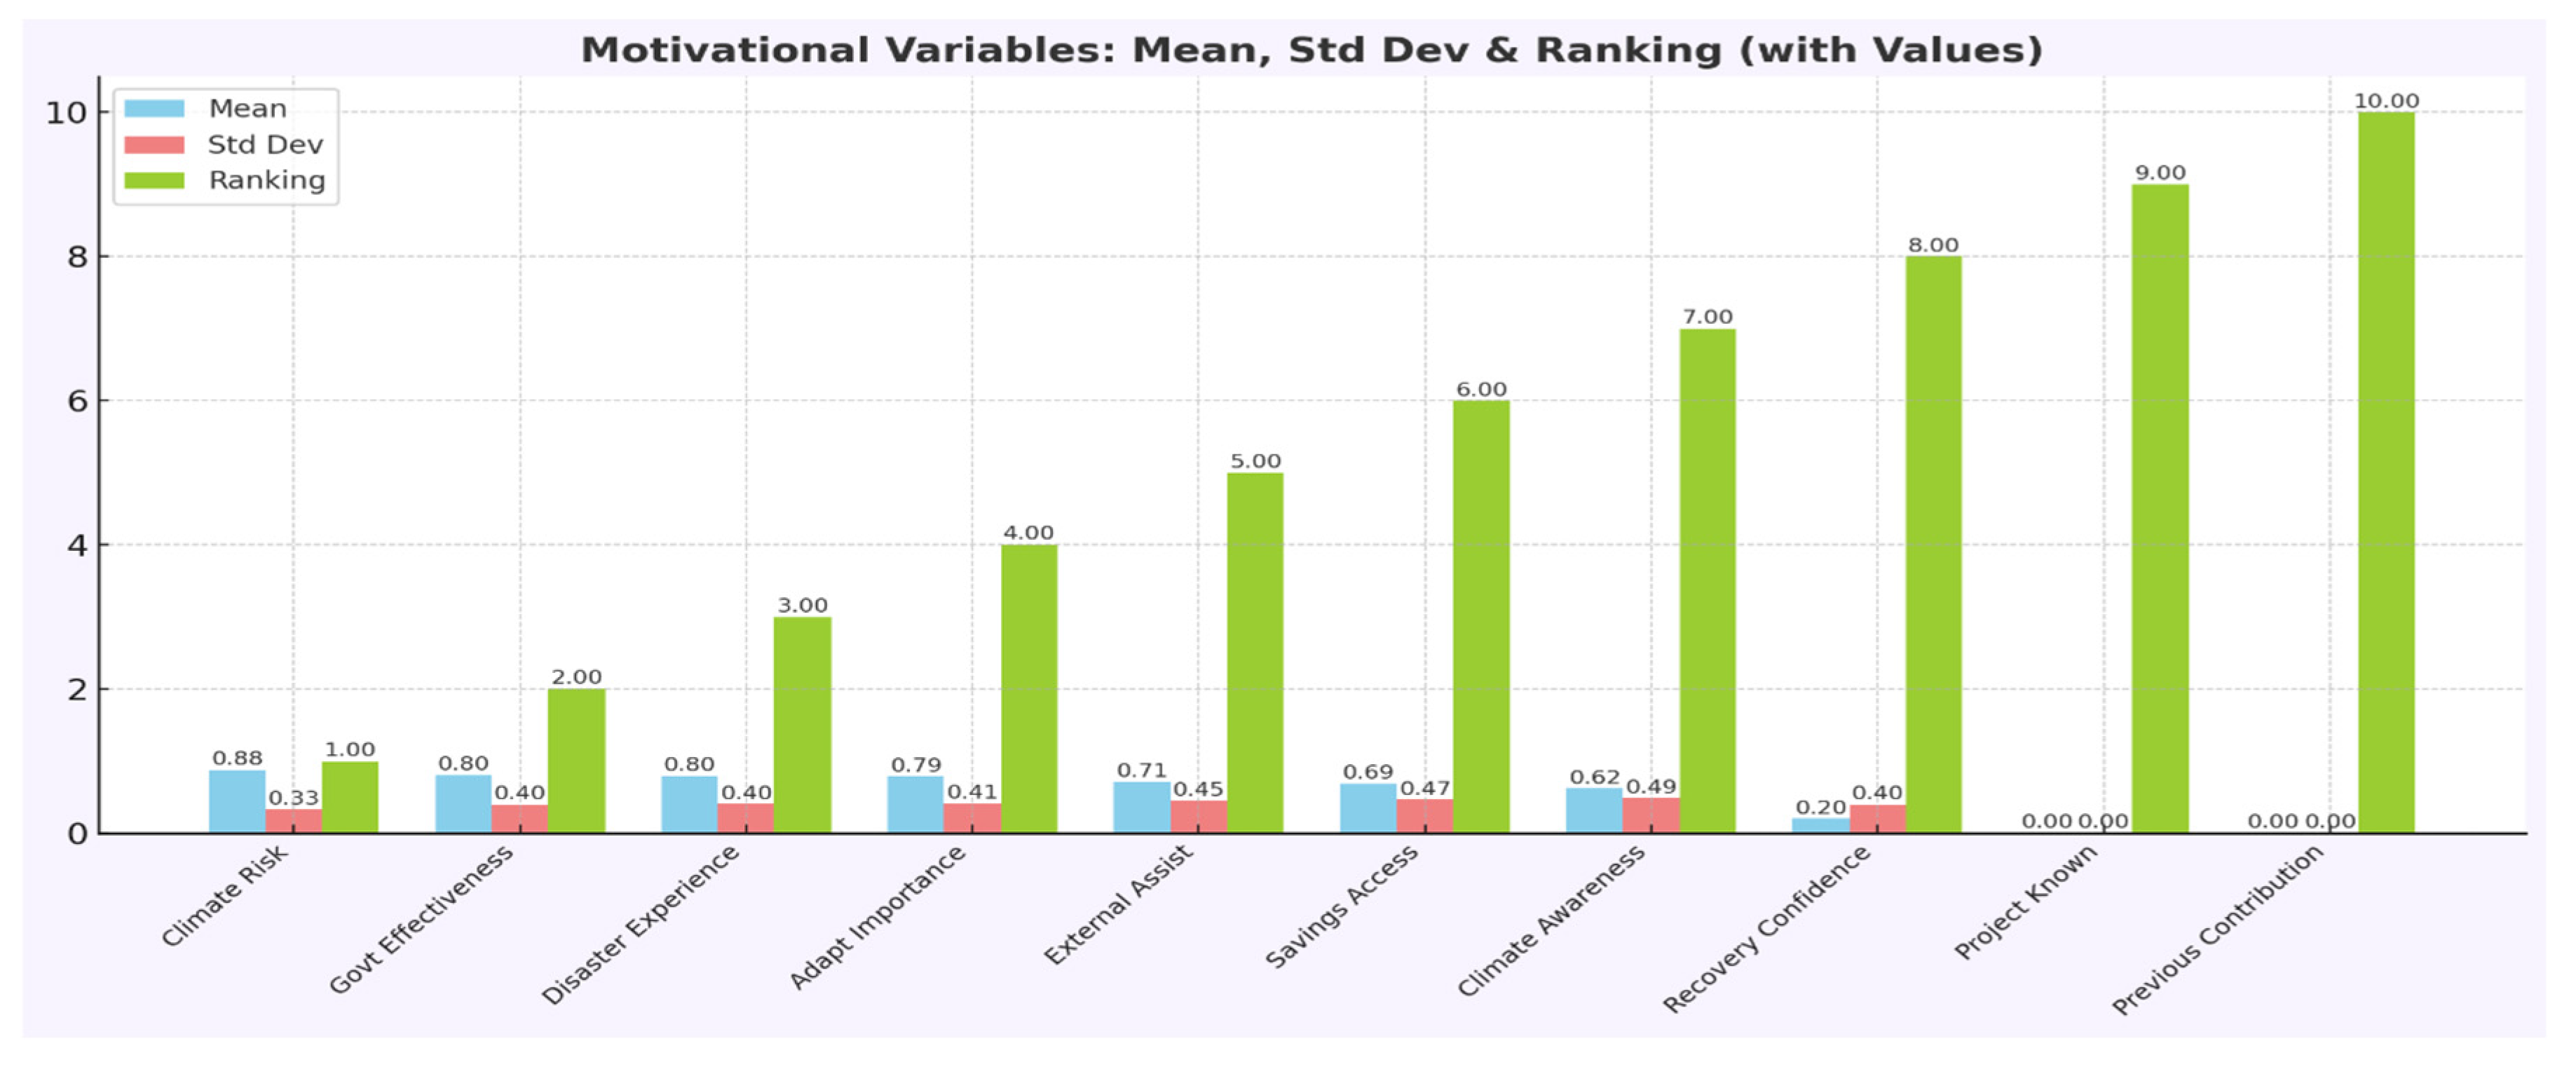

Table 1.
Variables included in the Probit and Tobit models.
| Variables | Description of the variables | Category | |
|---|---|---|---|
| Dependent Variable | WTP (Probit) | WTP for Climate Change Adaptation | 1= Willingness to pay, 0= Not willingness to pay |
| WTP Max amount (Tobit) | Amount willing to pay (BDT/month) | Continuous (Censored) |
|
| Independent Variables | Income (X1) | Monthly Household Income | 1=Less Than 5000, 2=5000-10000, 3=10001-20000, 4=20001-30000, 5=Above 30000 |
| Education (X2) | Level of Education | 1= No Formal Education, 2=Primary, 3=secondary, 4=Higher Secondary,5= Graduate or Above | |
| Occupation (X3) | Main Occupation | 1=Agriculture, 2=Fishing, 3= Day Labor, 4=Small Business.5= GOVT/Private Service, 6=Others | |
| Age (X4) | Age of respondents | ||
| Climate Awareness (X5) | I aware about climate change and It’s effect | 1= Yes,0=No | |
| Disaster Experience (X6) | I have experienced any climate related disaster in the last 5 years. | 1=Yes, 0=No | |
| Government Effectiveness (X7) | I believe the GOVT/local authorities are effective in managing climate risks. | 1=Strongly Disagree, 2=Disagree, 3=Neutral, 4=Agree, 5=Strongly Agree | |
| Saving Access (X8) | I have access to any savings or microcredit. | 1=Yes,0=No | |
| External Assistance (X9) | I think external assistance is necessary for adaptation in my area. | 1=Yes,0=No | |
Source: Author Estimation (2025.
Table 2.
Socio Economic Characteristics of the Respondents.
| Age | Frequency | Percentage |
|---|---|---|
| 18-30 | 38 | 9.5 |
| 31-45 | 121 | 30.25 |
| 46-60 | 120 | 30 |
| 60 and above | 121 | 30.25 |
| Education Level | ||
| No Formal Education | 212 | 53.13 |
| Primary | 131 | 32.83 |
| Secondary | 31 | 7.77 |
| Higher Secondary | 11 | 2.76 |
| Graduate or Above | 14 | 3.51 |
| Income Range | ||
| <5000 | 39 | 9.75 |
| 5000-10000 | 90 | 22.5 |
| 10001-20000 | 117 | 29.25 |
| 20000-30000 | 70 | 17.5 |
| >30000 | 84 | 21 |
| Household Size Range | ||
| 1-3 | 91 | 22.75 |
| 4-6 | 297 | 74.25 |
| Above 6 | 12 | 3 |
| Land Owned | ||
| No | 235 | 58.75 |
| Yes | 165 | 41.25 |
Source: Author Estimation (2025).
Table 3.
Distribution of Willingness-to-Pay (WTP) Amounts and Descriptive Statistics.
| Payment Class | Descriptive Statistics | ||||
| Class | Amount | Frequency | % | Statistic | Value |
| PC-1 | 0-200 | 134 | 51.54 | Mean | 221.01 |
| PC-2 | 201-400 | 100 | 38.46 | Median | 194.03 |
| PC-3 | 401-600 | 23 | 8.85 | Std Deviation | 146 |
| PC-4 | 601-800 | 1 | 0.38 | Maximum | PC-5 |
| PC-5 | 800-1000 | 2 | 0.77 | Minimum | PC-1 |
| N | 260 | Most Frequent PC | PC-1 | ||
| Least Frequent PC | PC-4 | ||||
Source: Author Estimation (2025).
Table 4.
Descriptive Statistics of Motivational Factors.
| Factor | Description of Recoding | Original Measure (From Survey) | % of Sample Coded as “High/Yes” |
|---|---|---|---|
| High Climate Risk | Combined responses of “Moderate,” “High,” and “Very High” perceived local climate risk. | 5-point Likert scale (1=Very Low to 5=Very High) | 85.5% |
| Disaster Experienced | Experienced at least one major climate disaster (flood, erosion, cyclone) in the last 5 years. | Binary (Yes/No) | 100.0% |
| High Recovery Confidence | Combined “Moderately,” “Very,” and “Extremely” confident in household’s ability to recover from a future shock. | 5-point Likert scale (1=Not Confident to 5=Extremely Confident) | 62.3% |
| Believes in Govt. Effectiveness | Combined “Neutral,” “Agree,” and “Strongly Agree” that government/local authorities are effective in managing climate risks. | 5-point Likert scale (1=Strongly Disagree to 5=Strongly Agree) | 51.8% |
| Aware of Ongoing Project | Knowledge of any currently running climate adaptation project in their locality. | Binary (Yes/No) | 0.0% |
| Has Savings/Credit Access | Has access to any formal or informal savings mechanism or microcredit. | Binary (Yes/No) | 41.0% |
| High Adaptation Importance | Believes investing in adaptation is “Important,” “Very Important,” or “Extremely Important.” | 5-point Likert scale (1=Not Important to 5=Extremely Important) | 73.0% |
| Previously Contributed | Has ever contributed cash or labor to a community project. | Binary (Yes/No) | 34.5% |
| External Aid Necessary | Believes external (non-local) assistance is necessary for adaptation in their area. | Binary (Yes/No) | 81.0% |
Source: Author’s calculation based on survey data (2024).
Table 5.
Occupation-wise Distribution of Respondents Willing to Pay.
| Serial | Occupation | WTP Count |
|---|---|---|
| 1 | Agriculture | 102 |
| 2 | Day Labor | 64 |
| 3 | Fishing | 52 |
| 4 | Small Business | 29 |
| 5 | Other | 13 |
Source: Author Estimation (2025).
Table 6.
Occupation VS Payment Class.
| Occupation | PC-1 | PC-2 | PC-3 | PC-4 | PC-5 |
|---|---|---|---|---|---|
| Agriculture | 50 | 39 | 11 | 1 | 1 |
| Day Labor | 38 | 21 | 4 | 0 | 1 |
| Fishing | 21 | 28 | 3 | 0 | 0 |
| Other | 7 | 3 | 3 | 0 | 0 |
| Small Business | 18 | 9 | 2 | 0 | 0 |
Source: Author Estimation (2025).
Table 7.
The reason for unwillingness to pay.
| Reason | Frequency | Percentage |
|---|---|---|
| Cannot Afford | 42 | 30.0% |
| Do Not Trust Effectiveness | 33 | 23.6% |
| Uncertain About Benefit | 36 | 25.7% |
| Other | 29 | 20.7% |
| Total | 140 | 100% |
Source: Author Estimation (2025).
Table 10.
Percentage Distribution of Household WTP Across Payment Classes for Specific Adaptation Strategies.
Table 10.
Percentage Distribution of Household WTP Across Payment Classes for Specific Adaptation Strategies.
| Climate Change Adaptation Strategy | n (Willing Households) | PC-1 (0–200 BDT) |
PC-2 (201–400 BDT) |
PC-3 (401–600 BDT) |
PC-4 (601–800 BDT) |
PC-5 (801–1000 BDT) |
|---|---|---|---|---|---|---|
| Flood Shelter | 145 | 89.66% | 10.34% | 0% | 0% | 0% |
| River Embankment | 184 | 95.11% | 4.89% | 0% | 0% | 0% |
| Early Warning System | 217 | 100% | 0% | 0% | 0% | 0% |
| Climate Education/Training | 169 | 100% | 0% | 0% | 0% | 0% |
| Improved Seeds/Crops | 97 | 100% | 0% | 0% | 0% | 0% |
| Rainwater Harvesting | 93 | 100% | 0% | 0% | 0% | 0% |
| Other Strategies | 5 | 100% | 0% | 0% | 0% | 0% |
Source: Author’s calculation based on survey data (2024).
Table 11.
Determinants of Willingness to Pay for Climate Adaptation: Probit and Tobit Model Results.
Table 11.
Determinants of Willingness to Pay for Climate Adaptation: Probit and Tobit Model Results.
| Variable | Probit Model (Binary WTP) | Tobit Model (WTP Amount in BDT) | ||||||
|---|---|---|---|---|---|---|---|---|
| Coefficient | Std. Error | z-Statistic | Prob. | Coefficient | Std. Error | z-Statistic | Prob. | |
| Income | 0.485359 | 0.129422 | 3.750192 | 0.0002*** | 19.32511 | 9.118064 | 2.119431 | 0.0341** |
| Education | 1.464200 | 0.203516 | 7.194531 | 0.0000*** | 101.3859 | 9.642333 | 10.51467 | 0.0000*** |
| Occupation | 0.502046 | 0.137494 | 3.651407 | 0.0003*** | 15.87736 | 8.705342 | 1.823864 | 0.0682* |
| Age | 0.001152 | 0.010905 | 0.105660 | 0.9159 | -0.099092 | 0.715063 | -0.138578 | 0.8898 |
| Climate Awareness | 0.741866 | 0.314239 | 2.360838 | 0.0182** | 45.30415 | 21.61384 | 2.096071 | 0.0361** |
| Govt Effectiveness | -0.073750 | 0.156435 | -0.471441 | 0.6373 | -17.88071 | 9.726791 | -1.838295 | 0.0660* |
| Disaster Experience | 1.494296 | 0.388143 | 3.849864 | 0.0001*** | 153.8539 | 32.84248 | 4.684600 | 0.0000*** |
| Savings Access | -0.450831 | 0.352032 | -1.280652 | 0.2003 | 15.87519 | 21.90322 | 0.724788 | 0.4686 |
| External Assist | 1.083212 | 0.320763 | 3.376983 | 0.0007*** | 76.31050 | 24.39916 | 3.127587 | 0.0018*** |
| Constant (C) | -8.169606 | 1.360223 | -6.006078 | 0.0000*** | -461.7239 | 68.85393 | -6.705846 | 0.0000*** |
| SCALE (σ) | 159.2858 | 7.226610 | 22.04156 | |||||
| Model Fit | ||||||||
| McFadden R2 | 0.813310 | |||||||
| Log likelihood | -48.34871 | -1734.285 | ||||||
| LR statistic | 421.2599 | |||||||
| Prob(LR statistic) | 0.000000 | |||||||
Notes: ***, **, * denote statistical significance at the 1%, 5%, and 10% levels, respectively. Probit Model: Dependent variable is binary WTP (1 if willing to pay, 0 otherwise). Tobit Model: Dependent variable is maximum WTP amount in BDT/month, censored at 0. Source: Author’s estimation (2025).
Disclaimer/Publisher’s Note: The statements, opinions and data contained in all publications are solely those of the individual author(s) and contributor(s) and not of MDPI and/or the editor(s). MDPI and/or the editor(s) disclaim responsibility for any injury to people or property resulting from any ideas, methods, instructions or products referred to in the content. |
© 2026 by the authors. Licensee MDPI, Basel, Switzerland. This article is an open access article distributed under the terms and conditions of the Creative Commons Attribution (CC BY) license (http://creativecommons.org/licenses/by/4.0/).
Copyright: This open access article is published under a Creative Commons CC BY 4.0 license, which permit the free download, distribution, and reuse, provided that the author and preprint are cited in any reuse.


