
Submitted:
22 March 2025
Posted:
25 March 2025
You are already at the latest version
Abstract
A cross-sectional study of climate change vulnerability (CCV) on 205 ultra-poor households of Bauphal Upazila of southern coastline were conducted. Exposure, sensitivity and adaptation practices were evaluated for this study. About 70% families of treatment group provided positive feedback to adjust to CCV. The endline CCV had dropped by 18% compared to baseline score. Exposure and adaptable capacity had grown by 14% and 13%, respectively. Besides, endline sensitivity was dropped 11% than baseline score. The adaptation indices for social organizations, personal savings, training on climate change topics, and loan facilities from various bank types were all high (>0.90). Significant progress has been made in the community's volunteerism for local development projects, during disasters. Under the treatment condition, there was a significant improvement in livestock farming (0.20), planted trees (0.34), rainwater harvesting (0.23), GO-NGOs' support (0.37), and social event attendance (0.34). However, understanding of farm services (0.107) and the early warning system/messages (0.14) showed a discernible improvement. The sequence of adaptation measures to climate change are as follows: livelihood>livestock>social and financial security>health-sanitation>water security>knowledge on comprehension warning systems,> social inclusivity. The results of this study may assist policymakers in developing appropriate measures prior developing a disaster management framework for coastal areas.
Keywords:
ultra‐poor graduation framework
; climate change vulnerability
; adaptive capacity
; coastal communities
; Bangladesh
1. Introduction
Climate change, a global concern [1] is influencing environmental crises worldwide. Other associated events along with climate change are posing significant risks in environmental and socioeconomic aspects [2]. Most of the areas in delta, coastal, and small island countries have been affected by climate change emerged problems. In fact, climate affected developing countries are getting vulnerable over time. Among the climate vulnerable countries, Bangladesh is one of the supreme climate victims where all climatic evidences exist. Every year huge number of lands, physical properties, and resources were affected by climate change impacts which created adverse situation for sustainable development.
The southern parts in Bangladesh are highly exposed with the climate change consequences, such as saline water intrusion, floods, cyclone, storm surge, and river/coastal erosion [3,4,5,6]. Since 1970, the country has experienced 36 cyclonic storms, resulting in nearly 450,000 deaths and incalculable economic losses [7]. Between 1877 and 1995, the country was affected by 154 cyclones (including 43 severe cyclonic storms, 43 cyclonic storms, and 68 tropical depressions. Following Cyclone Aila in 2009, cyclones Mahasen (2013), Roanu (2016), Fani (2019), Bulbul (2019), and Amphan (2020) struck Bangladesh's coastal strip, causing huge property loss, agricultural destruction, and fatalities. The literature demonstrated that Bangladesh is affected by a strong storm at every three years [8]. The frequency and magnitude of the cyclonic storm surges has been increased gradually in the last few decades [9]. Recently, salinity water intrusion is getting more severe problems in the groundwater and surface water resources in the coastal districts [10]. The scarcity of drinking water caused by salinity is a major public health concern in the coastal areas in Bangladesh [10,11].
About 40 million people live along the coastal belt of Bangladesh where 35 million people are highly exposed to salinity intrusions [12] and consequently facing severe drinking water scarcities [10]. However, both cyclone and salinity intrusions typically increase vulnerabilities among coastal communities [13] such as health problems, economic losses, and social crises [14]. Besides, the negative consequences of the coastline disaster worsened problems for vulnerable groups of people, such as physically challenged people, children, and women [15]. The potential of disaster risk between men and women are quite different, with the potential for long-term detrimental effects for women because of their commitments housekeeping that women shoulder in times of crisis [16,17] Nevertheless, disasters have a variety of consequences on women due to lack of economic governance, inequalities in resource distribution, and a limited scope on decision-making [17,18]. Climatic vulnerabilities are reported on several studies [13,19,20,21]. Available previous studies focused on contemporary vulnerabilities among the affected communities, however, there was a lack of specific attention on ultra-poor communities where how a development project intervention could contribute on adaptive capacity among the ultra-poor communities.
Composite indexing techniques were used to evaluate the vulnerabilities by exposure, sensitivity, and adaptive capacity analysis. Indicators were selected based on IPCC model (2001) and other relevant literatures. Composite indices were prevalent to find the vulnerability of decision-making processes. The ability of indexes to present the big picture while summarizing complex or multi-dimensional topics is part of their appeal [22,23]. As a result, indices have been used to evaluate strengths and weaknesses, as well as to identify appropriate management strategies and forecast future situations [24,25]. However, these tools have limits as decision-making tools, including issues with disaggregation and traceability for management [26,27].
According to BRAC (2020), ultra-poor can be defined as the poor which are typically food insecure, have few or no assets, very little income (< $0.70-$0.80 per day), lack of education, and have a limited access of health care facilities. Nearly 1.0 billion people worldwide still live below the international extreme poverty line of $1.90 per day. This ‘ultra-poor’ group has been particularly hard to reach with anti-poverty programmes. Living in the poorest villages in the developing/least developed countries, most of the ultra-poor members of the world are women. In reality, they are lack of skills and required capital to lift themselves out of poverty. The study area Bauphal, was affected by cyclones, floods, waterlogging, and saline water intrusions. The ultra-poor communities in this area were severely impacted by the repetitive action of cyclonic storm surges that caused a significant loss and damages. Experimentally, this strategy was applied by Brac from 2019 to 2021 among ultra-poor coastal communities to strengthen their adaptive capacity to address climate-related crises at the local level.
Ultra-poor communities should be mainstreaming along with the development project for ensuring the SDGs. Hence, it was important to conduct a study focusing the vulnerability assessment and adaptation strategies’ before and after implementing the project. The novelty of this study was the evaluation of relationship between the interventions of ultra-poor graduation framework and adaptation performance in the climate change influenced coastal community in Bangladesh. Hence, the overall aim of this study was to evaluate the likely impact of the ultra-poor graduation framework/interventions to improve the adaptive capacity among the vulnerable community Bauphal upazila of coastal area.
The term ‘vulnerability’ is treated as multi-dimensional (e.g., physical, environmental, economic, social and political dimension), scale-dependent (unit of analysis) and dynamic concept [28]. Vulnerability refers to “the degree to which geophysical, biological and socio-economic systems are susceptible to and unable to cope with climate change” [29,30]. The 5th assessment report of the IPCC has clearly defined vulnerability as a function of exposure, sensitivity and coping capacity [31]. In this study, the vulnerability is accordingly related to the degree of exposure, sensitivity, and lack of adaptive capacity. In the context of coastal Bangladesh, local people are exposed to multiple hazards, including cyclones, storm surges, and salinity intrusion. Therefore, it was assumed that all the relevant factors can be associated with their vulnerable conditions, while multiple hazards occur a lot of challenges for economic losses and damages. If the system is highly exposed and sensitive to hazards and is unable to cope with them, the vulnerability will increase [32]. This study attempted to identify many of the crucial factors related to sensitivity, adaptive capacity and exposure for figuring out the vulnerability among the ultra-poor communities.
Sensitivity: Sensitivity is defined as “the degree to which a system is affected, either adversely or beneficially”, by climate-related stimuli. The effect may be direct (e.g., a change in crop yield in response to a change in the mean, range, or variability of temperature) or indirect (e.g., damage caused by an increase in the frequency of coastal flooding due to sea level rise) [33]. Sensitivity was expressed by five components (Table 1): 1) food, 2) water, 3) health, 4) economy, and 5) nature dependency. Food (1) included homegrown food, availability of three meals a day, a food crisis, and food preservation. Water (in no. 2) is characterized by drinking water sources, drinking water collection, water scarcity, and water-related conflict. Health (in no. 3) included sickness, distance of health care center, long-term sickness, infectious diseases, vector borne diseases, and disable family member. Economy (in no. 4) composed of agro-based income, aquaculture-based income, livestock-based income, seasonal migration, child worker, and child marriage. Nature dependency (in no. 5) is categorized by fire wood for cooking and fishing.
Adaptive capacity: adaptive capacity is defined as “the ability of a system to adjust to climate change effect (including climate variability and extremes) to moderate potential damages, to take advantage of opportunities, or to cope with the consequences” [33]. In this study, adaptive capacity is characterized by six major components: 1) socio-demographic profile, 2) livelihood strategies, 3) awareness, 4) physical infrastructure, 5) social networks, and 6) financial capital. Each of the major components were composed with several sub-components which are shown in Table S1.
1) Socio-demographic, the first component includes dependent family member, head of household, educational qualification, income of household head, migration, and training.
2) Livelihood strategies, the second component is accounted for livelihoods, occupation/types of works, household livestock, and agricultural services.
3) Awareness, the third component included the disaster experiences, household participation, understanding of early warning message, training, and homestead plants.
4) The fourth components cover physical infrastructure which is composed of Paka (concrete) house, energy access, latrine, electronic device (e.g., radio/TV), cell phone, road, tube-well, rainwater harvesting techniques, and cyclone shelter.
5) Social networks, the fifth component is consisted with voting ability, participation in local meeting, voluntary services, household loan, helping attitudes to others, leadership, and non-governmental and governmental services.
6) The sixth component represents financial capitals which included the monthly income and savings.
Exposure: Exposure is defined as “the nature and degree to which a system is exposed to significant climatic variations” [33]. Exposure was characterized by climate variability and climate change-induced extreme events as shown in Table S1. Climate variability and climate change induced the extreme events mostly temperature, rainfall, dry season, salinity, water logging, lightening, cyclone, storm surges, cyclone shelter, early warning, flood, loss and damage, and climate-induced illness.
2. Materials and Methods
2.1. Study Area
This study was carried out in the Bauphal Upazilla of Patuakhali District (Figure 1). It is located at 22.3542°N and 90.3181°E. Bauphal Upazilla consists of 14 unions with the population of 1,535,854 where the population density is 480/km2. The percentage of males and female population were 56.2% and 52%, respectively with the average literacy was 54%. The average annual precipitation was 2830 mm and the average temperature was 25.6 °C. The majority of people depend on agriculture and fishing for their livelihood. Geomorphologically, Bauphal is a low-lying coastal area and is recognized as one of the most disaster-prone areas in Patuakhali. The area is extremely experienced with cyclones, storm surges, floods, saline water incursions, and riverbank erosions. Due to climate change effects, drinking water is scarce nowadays, and sanitation system is very poor in this study area. In addition, during dry season, increased salinity in groundwater aquifer causes a drinking water scarcity in the community.
2.2. About the Target Group
The majority population in the Bauphal Upazilla is vulnerable due to climate change impacts and its associated hazards, such as cyclones, storm surge and coastal flood. This study followed two major approaches, where the first approach sustained a consecutive method before selecting participants, which included identifying poverty-prone areas, rapport building, social mapping, wealth ranking. Questionnaire survey was carried out before respondent selections, and finalization with verification. Secondly, the flowing criteria were used to choose target groups: irregular income (which signifies inconsistency in livelihoods), income limits (5000 BDT per month), and ownership of <30 decimals of land. It was assumed that the ultra-poor people were highly vulnerable to climate change effect due to lack of sufficient adaptive capacity. Depending on the availability of resource and potential of vulnerability, about 205 households were selected for this study. The number of indicators 7, 12, and 23 were designed for exposure, sensitivity, and adaptive capacity, respectively that would determine the vulnerability and adaptive capacity. A cross-sectional study was carried out on classified samples of about 205 ultra poor households. To enhance the adaptive capacity of ultra-poor communities, actions/interventions of ultra-poor graduation programs were mainly focused on social protection, financial inclusion, livelihood promotion, and social empowerment. Monitoring and evaluation of interventions were assessed based on a pre-determined date and time.
2.3. Data Collection
A structured questionnaire was applied for collecting data from ultra-poor communities following the four parts: 1) demographic profile, 2) exposure, 3) sensitivity, and 4) adaptive capacity. A total of 82 parameters were selected from the indicators for the questionnaire survey. Demographic factors, sensitivity, exposure, and adaptive capacity were assessed using the guided indicators of IPCC (2001) which were shown in Table S1. A total of 205 respondents were surveyed for questionnaire. Females were chosen as respondent that was given to the target ultra-poor group twice. In December 2019, the first survey was performed before the project launched, which was called the ‘baseline survey’, and then the second survey was performed at the end of the project in November 2021, which was called the ‘end-line survey’. The required time for each of the questionnaire surveys was 1 and a half hours. Ethical issues were confirmed by seeking their verbal consent before starting the questionnaire survey. It was confirmed that the respondents’ name and personal details were not disclose due to confidentiality of the response. Finally, the questionnaire data sets were coded in Microsoft Excel for further statistical analysis.
2.4. Index Calculation
In the first step, the data was normalized to maintain the equal weight of all variables maintain the United Nations Development Program guidelines to formulate a human development index [34]. The normalization process followed the order of maximum and minimum values of each variable that was exclusively used for other scientific studies [10,19,29,35]. The equation for index calculation was given below:
whererepresented the index score of xth indicators, indicated the original value of each indicator, and represented the maximum and minimum values of each indicator, respectively. The minimum and maximum values were used for the standardization of indicator values to maintain an equal weight among the measured indicators and that were selected depending on the frequencies of the measurements. For example, "percentage of sickness causing work or school missing," while percentage of households did not have the case of sickness causing work or school missing, the minimum value was characterized as a minimum of zero (0) and the opposite maximum of hundred (100). The normalized values were ranged from +1 to -1. The vulnerability scale was divided into three sub-categories: -1.0 to -0.4 = not vulnerable, -0.41 to 0.30 = moderately vulnerable, and 0.31 to 1.0 = highly vulnerable [36].
After getting the normalized values of each indicator, major component values were calculated by taking the average of indicators corresponding to individual major components. The equation employed for this purpose was given below:
where was one of the twelve major components. indicated the indicators, which was indexed by , consisting of each major component. In addition, indicated total number of indicators under each major component. To determine IPCC (2001) contributing factors such as sensitivity, adaptive capacity, and exposure, the following equation (Eq. (3)) was utilized, as used by Hahn et al. [37]:
Where, indicated the IPCC contributing factor index (). represented the weight of each major component. demonstrated each major component’s value. Indicated the number of major components of each IPCC contributing factor.
Climate change vulnerability index (CVI) was calculated using the IPCC (2001) framework [35]. The index score of the IPCC contributing factors were exposure, sensitivity, and adaptive capacity, which were calculated by several corresponding major components. Exposure was composed of climatic variability and climate-induced extreme events. Sensitivity consisted of food, water, health, the economy, and natural dependency. Adaptive capacity was involved with socio-demographic profiles, livelihood strategies, awareness, physical infrastructure, and financial capital. Most of the components were adopted from the IPCC report. CVI was calculated by combining the three IPCC contributing factors, including sensitivity, exposure, and adaptive capacity. The CVI calculation equation was given below:
Where, indicated the climate change vulnerability index. represented the exposure, adaptive capacity, and sensitivity. The values ranged from -1 (least vulnerable) to +1 (most vulnerable).
3. Results and Analysis
3.1. Histogram Analysis
The bell-shaped curve in Figure 2a appeared to be an edge peak distribution, more precisely a normal distribution. The data in the graph was not significantly skewed and was viewed almost symmetrical. Possibly the most used method for extrapolating conclusions from experimental data is regression analysis (Figure 2b), where fitting a function that closely reflects the data trend is the fundamental concept underlying it. Predictions regarding the variables involved can then be made using the function. The prediction's accuracy increases with the strength of the linear relationship between the independent and dependent variables. Regression accuracy and results can be distorted by data points with high leverage and/or large residuals (outliers). The impact of removing a specific observation is measured by Cook's distance [38]. In the analysis, points having a high Cook's distance are thought to be worthy of more scrutiny [39]. Cook's distance (0.70) in this study indicated that item at number 26 (Figure 2b) might be an outlier.
3.2. Analysis of Data Under Treatment Condition
3.2.1. Exposure Assessment
According to IPCC (2024) dimension of livelihood vulnerable indices (LVI), the obtained indices result in this study were categorized as positive and negative indices. The results of the treatment and controlled groups were presented in Table 2, Table 3 and Table 4 and Figure 3 and Figure 4. The comparative assessment of controlled and treatment groups was presented at Figure 3a, b. The Figure 3a showed that there was a significant upgradation of indicators treatment condition where Figure3b showed very little changes of indicators under controlled condition. The variation of indicators in Figure 4 and Table 2 showed that the high indices values were observed for personal savings (0.94), training and awareness (0.94), loan facilities (0.92), participation of disaster management events. In addition, there was a satisfactory improvement on sanitary latrine (0.53). Besides, there were some visible changes on children droop out from school, higher education of HH, migration, people migrate other areas for livelihood, afford radio/TV, access-built road, well-constructed tubewell, volunteer work for local development initiatives, getting help from neighbors during disaster etc. There was a significant level of improvement on livestock (0.20), planted trees (0.34), rainwater harvesting (0.23), receiving support from GO and NGOs (0.37) and invitation at the social occasion (0.34) (Figure 4).
However, a considerable advancement on the communication capacity with the local leaders (0.18), understanding early warning system/messages (0.14), agriculture services (0.107) and participation in voting/local government election system (0.102) (Table 2). Some progresses were observed at the low level that were household head (0.039), work diversity (0.46), disaster management capacity (0.0048), delivering early warning system (0.0146), afford Paka house (0), solar or grid electricity connection (0.053), latrine/toilet (0.054), mobile and internet access (0.088), grew awareness to use shelter (0.091), participation of locally arranged meeting (0.029). There were some progresses on monthly income (0.028) and taking personal/community loan (0.039) from the bank and financial institutions.
The positive indices were further clustered as high, medium, considerable/low and very low (Table 3) where it was demonstrated that the overall positive change of exposure indices was 70%. Among that, 11.90% were high, 11.90% were medium, 11.90% were considerable and 33.33% were low. The rest 30% values showed negative impact (Table 3).

Table 3.
Scenario of Index increment of interventions of adaptive capacity under treatment group.
| No | Indicators | Index difference from baseline to endline | Index increment (%) | Categorization of increment |
|---|---|---|---|---|
| 1 | Participated in disaster management events organized by GoB or NGOs | 0.912 | % | |
| 2 | Received training on climate change | 0.941 | 11.91% |
High |
| 3 | Get loan or financial support from bank or society | 0.927 | ||
| 4 | Have savings | 0.941 | ||
| 5 | Have sanitary latrine | 0.532 | ||
| 6 | Have livestock | 0.205 |
11.91% |
Medium |
| 7 | Planted trees in homestead | 0.337 | ||
| 8 | Rainwater harvest | 0.234 | ||
| 9 | Invited in the social occasion in last 1 year | 0.341 | ||
| 10 | Received services from Govt or non-govt organizations | 0.371 | ||
| 11 | Number of HH members | 0.136 |
11.91% |
Considerable |
| 12 | Received agriculture services | 0.107 | ||
| 13 | Understand early warning messages | 0.141 | ||
| 14 | Voted in the last selection | 0.102 | ||
| 15 | Communicated with local leaders for getting help | 0.180 | ||
| 16 | Dependent member (<15 years) | 0.070 |
0.33% |
Low |
| 17 | Dependent member (>65 years) | 0.027 | ||
| 18 | Husband is the household head | 0.039 | ||
| 19 | Involved with different types of works | 0.046 | ||
| 20 | Experienced in managing disaster in last 30 years | 0.005 | ||
| 21 | Early warning messages delivered | 0.015 | ||
| 22 | Living in paca house | - | ||
| 23 | Have solar or grid electricity connection | 0.054 | ||
| 24 | Have latrine in the HH | 0.054 | ||
| 25 | Have mobile phone/ internet access | 0.088 | ||
| 26 | Time needs to go to the nearest shelter | 0.091 | ||
| 27 | Actively participated in local meetings in last 1 year | 0.029 | ||
| 28 | Get loan from local people | 0.039 | ||
| 29 | Monthly income | 0.028 | ||
| 30 | Education of HH head | 0.023 |
26.19% |
Negative indicator |
| 31 | HH members involved in income | 0.016 | ||
| 32 | Highest educated HH member | 0.048 | ||
| 33 | Children dropout from school | 0.024 | ||
| 34 | Migrated HH | 0.054 | ||
| 35 | HH members working in other areas for livelihood | 0.033 | ||
| 36 | Have radio/TV | 0.005 | ||
| 37 | Have access to build road | 0.088 | ||
| 38 | Have tubewell in the HH | 0.371 | ||
| 39 | Well-constructed tubewell platforms | 0.751 | ||
| 40 | Worked voluntarily in the local development initiatives | 0.054 | ||
| 41 | Get help form neighbors at the time of disaster | 0.083 |
Positive impact=69%, No/negative impact-31%.
3.2.2. Sensitivity Assessment
3.2.2.1. Climate Change Intensity
Figure 5 showed that local temperature (0.05), erratic and intense rainfall (0.054) were increased at the endline data. In addition, short duration heavy rainfall (0.039) was also showed the higher values at the endline data. As a results, the indices values showed very higher values of shifting of seasonal pattern (0.43). Besides, short winter (0.23) and drought like situation (0.41) were observed in the dry season at the endline data. Cyclone (0.04) and lightening were increased (0.097) over the few decades though the frequency of flood reduced to (0.165) due to construction of flood protecting embankment (Supplementary Table).
3.2.2.2. Water Security
The major source of drinking water in the study area is pondwater and 99% of the HH said that there was a significant changes of water sources. About 99.51% HH thought the water used from pond was safe, there was not any change of their thinking about the safety of drinking water at the endline survey. About 96.09% HH said that the water was available over the year round and about 99.51% agreed the year-round availability of water from pond (Supplementary Tables). Salinity was increased (0.28) at the endline condition comparing the baseline though there was a considerable amount of reduction of water logging (0.05) after siltation over the floodplain (Figure 5). Hence, drinking water was scarce and the HH had to have collect potable water from the other available sources. A minimum distance to the source of drinking water collection was 83 meters and the required time was 13 minutes at the base line condition. At the endline condition, the distance was 15 meters and the required time was 8 minutes. At the baseline condition 54% HH said that there was a conflict among the HH for distribution of water, however, at the endline condition the conflict reduced to 18%. Hence, after the successful implementation of intervention, the social conflict reduced to 35%.
3.2.2.3. Health Condition
The baseline data showed that about 28.29% of the HH faced illness in the last three months whereas at the endline condition the situation improved slightly (2%) and the values reduced to 26.82%. The required travel time to reach the healthcare center at the baseline condition was 50 minutes and at the endline survey the required time was 25 minutes. About 25.85% HH had the long-term sick members in the family and at the endline condition the number was 16.10% that reduced about 10% of the previous record. The Table 3 showed that infectious disease was observed about 43.41% HH at the baseline condition, and the situation improved and the value reduced to 8.29% at the end line condition. The reduction of infectious disease was 35% that was tremendous improvement of the intervention. The water borne or vector borne diseases outbreak in the family was 25.85% at the baseline condition but at the endline condition that was 9.27% that significant improvement from the interventions. The index value showed the improvement of illness (0.13) at the endline condition (Supplementary Table and Figure 4).
3.2.2.4. Economic Condition
At the baseline condition agro-based income of the HH was 12.68% but at the endline survey the value was 14.63%. The development was 2% after 2 years. At the baseline condition fisheries and livestock-based income were 14.63% and 32.20%, respectively. Whereas, at the endline condition the results were 14.63% and 47.81%, respectively. At the baseline condition the child labour engagement was 4.88%, at the endline condition the value was 0.49% that was significant reduction of child labor. The percentage of early marriage was 13.17% at the baseline condition but the endline survey showed that was 0.48% that was very satisfactory progress on early marriage. About 95.61% people used traditional firewood’s as energy source at the baseline condition, at the endline survey it was 99.02% which demonstrated considerable progress on traditional energy mode. At the baseline situation fishing from natural sources was 5.36%, however, at the endline condition the value was 1.46%.
Food availability
There was 13.66% HH who were landless farmers and at the endline condition the value was reached 15.60% where the increment was only 3% (Supplementary Table). About 69.76% HH could afford three meals/day at the baseline condition, whereas at the endline survey the data was 97.56% in the year round. The indices of farmland increase, non-food preservation and food crisis were 0.85, 0.84 and 0.30, respectively. This situation was improved after two years and the crisis reduced to 1.69 months/year. The HH that saved food was 15.12% at the baseline condition, however, this number increased up to 77% at the endline condition after two years. The indices of farmland, non-food preservation, and food crisis were 0.84, 0.77 and 0.28, respectively (Table 3 and Figure 5).
3.2.3. Adaptive Capacity Assessment
3.2.3.1. Sociodemographic Profile
Among the HH average age below 15 was 1.63%, and more than 65 was 0.31%. The average family members in HH were 4.5 in number and the average earning members of the HH was 1.25. The total school dropout of children was 6.34% at the baseline situation, however, at the endline condition the situation improved and the value was 3.90% (Supplementary Table). The initial and terminal adaptation indices were 0.063 and 0.50, respectively. The HH translocated/migration was 7.80% at the baseline condition but at the endline condition that was 2.43%. Hence, the decrease of translocation to other areas was 5.37%. The indices values were increased from 0.16 to 0.50. that indicated very significant improvement. At the baseline the technical training obtained by HH was 9.26% and at the endline survey that value was 12.19%. where it was almost 3% increment where the indices values were 0.09 to 0.24, respectively. At the baseline condition, the livestock was 79% (0.19) to HH but at the endline survey the value showed 99.5% (0.74) that was huge development. On the other hand, agriculture indices increased from 0.06 to 0.46 where support received on seed and fertilizer (Figure 6). The climate training improved (0.014 to 0.50) the understanding of signals that helped to increase the adaptive capacity considerably. Other interventions like tree plantation (0.14 to 0.50), electricity and solar (0.19 to 0.50). radio/TV (0.1 to 0.50), internet (0.49 to 0.50). Rainwater harvesting (0.38-0.50), time reduced for reaching cyclone shelter (0.23-0.5). However, the significant improvement was observed on skills training, migration for livelihood, work diversity, livestock, service on agriculture, affordability of radio/TV, rainwater harvest, bank or society support, personal savings, disaster management capacity, early warning messages, understanding early warning system, training on climate change, homestead tree plantation.
3.2.3.2. Livelihood Strategies Development
At baseline condition about 79% HH was involved with livestock’s and at endline condition the value was 99.5%, where the increment was 26%. The change of HH involved with various works was 10% (Supplementary Table). Support received on seed and fertilizer was 35% (6.34 to 17). Livestock’s diversified index increased 26%, agricultural services indices increased 11%, availability of various works indices increased 11%.
3.2.3.3. Awareness Development
The baseline survey data showed that the number of respondents faced disaster was 98% and the endline data showed that it was 98.54%. Here the increment od disaster events are 0.5% within years.
The number of respondents did not have enough knowledge about warning system is 97.56% at the baseline survey. At the endline survey the number is 99%. The increment of knowledge about warming system is about 1.5%. The baseline survey showed that about 84.39% people were known about signal system and it was 98.53% after years that was increased about 14.14%. Training received on climate change related disaster preparedness was 1.46% which increased 95.6% at the endline survey after receiving training from different GO and NGOs.
3.2.3.4. Physical Infrastructure Growth
Tree plantation was practiced by 64.39% respondent in the last year was whereas after two years the number was 98%. The increment of plantation rate was 34% after 2years. At the baseline/controlled stage, 99.02% were katcha house, there are no changes at the endline survey. About 93% able solar/electricity during the baseline survey, however, it was increased up to 98% at the endline survey that is 5% improvement of electricity usage. However, most the people afford solar energy. There are similar development of toilet uses where; the toilet user increases 5% that is from 94% to 99%. The percentage of sanitary toilet users were 46.34% during the baseline survey. There is a remarkable development (99%) of sanitary toilet development during the endline survey. There is not any change (12%) of radio/TV users both of baseline and endline survey. Pacca road 93.65% but during endline survey it was 84%. About 10% roads were destroyed during storm surge and coastal flood. Internet facility was 89.75 initially but at the endline survey it was about 98.53%. The internet facility was increases about 8%. About 68.29% respondents installed rainwater harvesting system at the baseline condition but at the endline survey the number increased to 91.70%. Time for taking cyclone shelter was 36.42 minutes but at the endline survey it was 25 minutes. Hence, People was aware about importance of timing for taking shelter and the people are able to safe shelter by short time (10 minutes).
3.2.3.5. Social Networks Development
Participation in local judgement was 81% at the base line survey but it increased up to 91%. It was increased 10%. Participation of social work at free of cost 86.83% at the baseline condition but it was 92.19% at the endline survey. The values increased 7% within two years. At the baseline survey Loan or debt was 95.12% but at the endline it was 99.02%. the increment was 4%. Help from neighbor 36.09% at the baseline, on the other hand it was 27.80% at the endline survey. This showed that the community developed their ability or reduce dependency to performed their works.
3.2.3.6. Financial Capital Development
At the baseline condition HH income was Tk. 5039 but at the endline condition the increased up to Tk.11465. The increment was about Tk.6500 (Table supplementary). This is very good progress after following the interventions. Hence, the HH was able to reduce financial loan from the neighbors that was 63% and 27% at the baseline and endline condit2ion, respectively. The decrease of loan or financial support of HH from neighbor was about 36%. At the baseline condition saving was 5%, whereas at the endline condition the saving increase to 99%.
3.3. Results Under Controlled Environment
3.3.1. Socio -Demographic Profile
The indices of dependent members in HH under controlled environment (Table 4) showed that the increment was 26% comparing to the baseline condition and education of the head of HH was 9%. The increment of migrated HH to other areas was 7.69%. The indices of other important indicators showed negative values such as income (-5.69%), children dropout from school (-6.35%), HH members received skill training (-11.83%).
Table 4.
Indices values of baseline and endline indices of adaptive capacity under controlled group.
Table 4.
Indices values of baseline and endline indices of adaptive capacity under controlled group.
| ID | Components | Indicator | Baseline Index | Endline Index | Change % |
|---|---|---|---|---|---|
| 1 | Dependent member (<15 years) | 0.233 | 0.294 | 26.18 | |
| 2 | Dependent member (>65 years) | 0.154 | 0.151 | -1.95 | |
| 3 | Husband is the household head | 0.863 | 0.844 | -2.20 | |
| 4 | Socio -Demographic Profile | Education of HH head | 0.419 | 0.458 | 9.31 |
| 5 | Number of HH members | 0.212 | 0.215 | 1.42 | |
| 6 | HH members involved in income | 0.123 | 0.116 | -5.69 | |
| 7 | Highest educated HH member | 0.480 | 0.471 | -1.88 | |
| 8 | Children dropout from school | 0.063 | 0.059 | -6.35 | |
| 9 | Migrated HH | 0.078 | 0.084 | 7.69 | |
| 10 | HH member received skills training | 0.093 | 0.082 | -11.83 | |
| 11 | HH members working in other areas for livelihood | 0.160 | 0.187 | 16.88 | |
| 12 | Livelihood strategies | Involved with different types of works | 0.415 | 0.408 | -1.71 |
| 13 | Have livestock | 0.790 | 0.695 | -13.66 | |
| 14 | Received agriculture services | 0.063 | 0.051 | -23.52 | |
| 15 | Experienced in managing disaster in last 30 years | 0.980 | 0.984 | ||
| 16 | Participated in disaster management events | 0.044 | 0.046 | 4.54 | |
| 17 | Awareness | Early warning messages delivered | 0.976 | 0.980 | 1.03 |
| 18 | Understand early warning messages | 0.844 | 0.854 | 1.18 | |
| 19 | Received training on climate change | 0.015 | 0.016 | 6.66 | |
| 20 | Planted trees in homestead | 0.644 | 0.605 | -6.44 | |
| 21 | Living in Paka house | 0.005 | 0.006 | 20.00 | |
| 22 | Have solar or grid electricity connection | 0.932 | 0.937 | 0.54 | |
| 23 | Have latrine in the HH | 0.941 | 0.951 | 1.06 | |
| 24 | Physical infrastructure | Have sanitary latrine | 0.463 | 0.472 | 1.94 |
| 25 | Have radio/TV | 0.127 | 0.132 | -3.94 | |
| 26 | Have access to build road | 0.937 | 0.809 | -13.66 | |
| 27 | Have mobile phone/ internet access | 0.898 | 0.954 | 6.24 | |
| 28 | Have tubewell in the HH | 0.517 | 0.563 | 8.90 | |
| 29 | Well-constructed tubewell platforms | 0.898 | 0.83 | -8.19 | |
| 30 | Rainwater harvest | 0.683 | 0.707 | 3.51 | |
| 31 | Time needs to go to the nearest shelter | 0.233 | 0.232 | -0.43 | |
| 32 | Voted in the last selection | 0.810 | 0.812 | 0.25 | |
| 33 | Invited in the social occasion in last 1 year | 0.610 | 0.612 | 0.33 | |
| 34 | Actively participated in local meetings in last 1 year | 0.068 | 0.067 | -1.47 | |
| 35 | Worked voluntarily in the local development initiatives | 0.127 | 0.173 | 36.22 | |
| 36 | Social Networks | Get loan from local people | 0.951 | 1.024 | 7.68 |
| 37 | Get help form neighbors at the time of disaster | 0.361 | 0.378 | 4.71 | |
| 38 | Communicated with local leaders for getting help | 0.785 | 0.766 | -2.42 | |
| 39 | Received services from Govt or non-govt organizations | 0.585 | 0.598 | 2.22 | |
| 40 | Monthly income | 0.336 | 0.341 | 1.49 | |
| 41 | Financial capital | Get loan or financial support from bank or society | 0.020 | 0.015 | -25.00 |
| 42 | Have savings | 0.054 | 0.012 | -77.78 |
3.3.2. Livelihood Strategies Development
About 16.88% people hunting works in other areas for livelihood. The indices values of livestock decreased 13.66% at the endline survey. The HH did not receive enough agricultural services comparing to the baseline situation. The negative values of indices at the endline survey were 23.52% (Table 4).
3.3.3. Awareness Development
The data from the baseline and endline survey at the controlled situation showed that the participation in disaster management events slightly increased (4.54%) comparing to the baseline data. Besides, some climate change related training increased (6.66%) that was conducted by different volunteer, NGOs and GO. However, homestead tree plantation decreased to 6.44%.
3.3.4. Physical Infrastructures Growth
The HH afford Paka house that increased 20% from the baseline condition. The user of mobile phone and internet was increased to 6%. The number of tubewell owner was increased to 9% whereas the well-constructed tubewell owner were reduced to 8.19%. The HH had a considerable growth in rainwater harvesting system (3.51%).
3.3.5. Social Networks Development
The baseline and endline data of the controlled group showed that the HH involved the volunteer activities in the development initiatives was increased about 36% for the 2 years. The people who received help from the neighbors was decreased and the amount was 4.71%. The people had to get loan from the local people and the number increased up to 7.68% from the baseline data. Though they received some assistance from the GO and NGOs (2%) that was not significant.
3.3.6. Financial Capital Development
There was a limited increment of monthly income among the HHs (1.49%). The financial support from bank and society also reduced that was about 25%. The baseline and endline indices of financial support from bank social organization were 0.02 and 0.95 (Table 3). There was huge development on this indicator. In fact, the endline data showed that due to financial hardship the savings was very negative that was 78% (Table Supplementary).
4. Discussion
In this study, it was projected that the application of ultra-poor graduation concept could help to improve the adaptive capacity of climate effect by reducing vulnerability in the study areas. In this study, the IPCC (2001) framework was used to analyze climate change vulnerabilities, which include exposure, sensitivity, and adaptation capacity.
Relation between UPGF indicators toexposure
Under the treatment condition, interventions of UPGF applied successfully for climate change adaptation provided very positive feedback (70% HH). However, the results from the HH survey were categorized as high (11.90%), medium (11.90%), considerable 11.90%) and low (33%). Among the interventions, the adaptation indices were high for personal savings, training on climate change issues, loan facilities from bank and society (>0.90). Actually, there were a significant improvement on participation of disaster management program by GO and NGOs. A satisfactory improvement was found on the use of sanitary latrine (0.53). The other interventions such as children droop out from school, migration of HH for livelihood, affordability of radio/TV, well-constructed tubewell, access to build road, volunteer work for local development initiatives, receiving help from neighbors during disaster showed a considerable progress at the treatment condition of HH (0.30). The adaptation indices of livestock farming (0.20), planted trees (0.34), rainwater harvesting (0.23), receiving support from GO and NGOs (0.37) and invitation at the social occasion (0.34) demonstrated considerable improvement at the treatment condition of HH. A noticeable achievement was observed on understanding early warning system/messages (0.14), and agriculture services (0.107) after implementation the interventions. In addition, Table 2 showed that a positive upgradation (<0.05≥0.02) was observed on energy access (solar or grid electricity connection), and consequently increased the access to mobile, internet and electronic devices. As a result, the monthly income of HH increased (0.028). The results also showed that the HH tried to advanced their livelihood by taking personal/community loan (0.039). The HH grew awareness to go to nearest shelter, and participation of locally arranged/community meeting.
The results of exposure showed that many of the households were suffering with health problems where 20% of HH were suffering from chronic illness. On the other hand, around 27% of school-going children had a sort of health complications as a result of drinking water scarcity which was a serious concern in the community. Meanwhile, infectious and water-borne diseases were frequent among the natives. Coastal flooding, saline water intrusion and waterlogging might pose a greater risk to public health by providing suitable habitats for diseases and pathogen-carrying vectors. In this area, healthcare facilities were not available at the convenient location for the community people and they had to travel a long distance to able medical facilities. Fertility of agricultural land had gradually decreased due to salinity increment. People living on aquaculture-based livelihood was also decreasing and still 15% of the people living on agricultural-based livelihood in the study area. It was imperative to demonstrate that the agriculture and aquaculture sectors were found to be extremely vulnerable to the effects of climate change, such as waterlogging, and salinity intrusion. Seasonal migration due to livestock rearing accounted for 40% to 50% of the overall household's income. The literature from Rakib et al. [40] and Chen and Mueller [41] found that the migration rate of ultra-poor community had been increased as a result of increasing salinity in soil and water. Surprisingly, only a small number of households were found to rely on wild fishing.
Relation between UPGF indicators to Sensitivity
In this study, baseline and end-line weighted values of sensitivities were 0.364 and 0.321, respectively (Table 2). These results showed that the end-line sensitivity score was somewhat lower than the baseline value. Most of the women participants stated that local community did not rely on farming for their food, and they faced food emergencies for at least two months of the year. In this study area, agriculture and aquaculture production were found to be very climate sensitive as a result of water logging, saline water incursion, and repetitive cyclonic storm surge actions. According to Khan et al. [42], aquacultural land and crop production had decreased by 48% and 3%, respectively comparing to the last decade. Pests and disease outbreaks were the major causes of production loss in aquaculture, had gained more importance in recent years, posing a risk to the socioeconomic and environmental viability of the shrimp business [43]. It was found that about 80% of the population survived on a hand-to-mouth or daily income-based food purchases. Climate vulnerability reduced agricultural farms' livelihood opportunities. However, aquaculture was found to be a less labor-intensive than other forms of production. Coastal hazards had made it increasingly difficult for coastal communities to restore their livelihoods [44]. Saline water contamination in groundwater aquifer made it difficult for households to meet their basic water needs. Local women claimed that salinity had increased in tube-well water in the last few decades. Hence, the local community faced scarcity of drinking water in this study area. Because of water scarcity, approximately 20% of HH were involved in a conflict with neighbor for water sharing (Table 3). A study from Rakib et al. [40] it was found that residents of Shyamnagar Upazilla of Sathkhira district spent more than an hour (per day) for collecting drinking water. The outcome of this research exposed a relatively modest drinking water crisis in comparison to other coastal areas, which might deteriorate in the near future due to upcoming climatic effects.
Relation between UPGF indicators to adaptive capacity
Due to increment of own land cultivating (3%) the dependency of food import was decreased and majority of HH could ensure 3 meals/day that was significant (30%) improvement from this study (Table 3). The HH could improve the annual food crisis from 3.61 months/year to 1.69 months/year and they would be able to increase the food savings from 15.12% to 77%. The HH of the study areas used pondwater for drinking purposes and there was not any change of water use at the baseline and endline condition. They also said that pond water was available all the year round. However, the considering the distance and time to collect water became shorter after implementation of interventions (from 83 m and 13 minutes to 15 m and 8 minutes). Hence, conflict among the HH for collecting water had been reduced from 53% to 35% (Table 3). Within 2 years, the HH illness improved 2% and the travel time to reach the nearby healthcare center reduced to half that of baseline condition. Even, chronic illness also improved 10% comparing to the baseline condition. From the Table 1, it was observed that there was a significant improvement on infectious disease (from 26% to 9%). Training, development of health care facilities, potable water availability, disaster forecasting and awareness contribute to occur significant development on health status in the study area. There was a considerable improvement in agro-economic condition in the ultra-poor community. After 2 years, 2% economic growth was observed in the agro-based activities. In addition, fisheries and livestock were the most contributing interventions in the economic growth (from 14% to 47%). Initially, there was some engrossment of child labor but at the endline condition child labor was almost concluded. As the stakeholders of the study were ultra-poor, there was a common culture of early marriage but successful implementation of intervention the early marriage was reduced significantly (from 13% to 0.48%).
Role of UPGF interventions to adaptation and vulnerability
Sociodemographic profile
Due to application of various interventions the number of droops out of school going children reduced 2.44%. Specially, children were engaged to collect drinking water from a long distance but after providing rain water harvesting and pond sand filter system the children got relieve from water collection. Because of getting microfinance aid and business training, the ultra-poor people were engaged in agriculture, fishing, small business and developed themselves as a local microentrepreneur. Hence, the rate of migration for livelihood was reduced to 2.43%. Due to the support on livestock, the farming rate was increased significantly (20.5%) and the indices increased about 11.91% that was a remarkable progress in the study area (Table 3). Consequently, there was a significant development on agriculture due to the support of seed and fertilizer along with livestock.
The HH received very effective training on climate change induced adaptation techniques the improvement was almost 93% (1.46%-95.6%). Electricity and solar installation were also increased 5% comparing to the baseline data. About 18% expansion was observed on internet access from the baseline condition. The development of understanding of disaster warning system had been increased satisfactorily that was 14.5% higher from the base level. The reasons behind this progress might be the access of electricity, mobile/internet and building training and awareness. Moreover, the time required for reaching cyclone shelter was reduced 13 min comparing to the baseline condition. Tree plantation had tremendous progress 34% (64%-98%) that also increased the climate change adaptation capacity among the ultra-poor community. A higher progress was observed on the establishment of sanitary toilet (55%) that increased the indicator of health and sanitation. However, the use of tubewell was reduced about 38% due to saline water intrusion that was a big challenge for potable water supply. Alternately, rainwater harvesting had been increased 23% comparing to the baseline condition. From the baseline situation the participation of attending the social event was increased 35%. The participation of social judgement also increased considerably increased over the time period that was about 10%. The most of the applied interventions in the treatment group ensure the social and economic security progress the development of social cohesion among the HH. However, there was not any significant progress of these indicators for the controlled group.
Figure 7a showed that sensitivity was comparatively high at the baseline condition under the treatment group. Food, water, and health indices were significantly low at the baseline condition, however, at the endline condition the situation improved significantly after adoption of ultra-poor framework interventions. Besides, economic condition also improved noticeably at the endline situation under the treatment group. Thathsarania and Gunaratne [45] found that economic assets might play significant role for building adaptive capacity. The outcome from this study might be affective in other vulnerable coastal areas in Bangladesh.
The indices of adaptive capacities at the baseline and endline were 0.452 and 0.582, respectively (see Figure 7b, c). The end-line adaptive capacity increased comparing to the baseline adaptive capacity. Figure 5a demonstrated that awareness, financial capital and livelihood had significant improvement at the endline condition. ource assessed in monetary terms used by smallholder cocoa farmers to buy what they need to make their farming operations efficient. Financial capital has also been documented to influence communities’ adaptive capacity to manage the adverse effects of climate variability [46,47]. The financial support from formal and informal institution (bank, finance companies, leasing companies or social union) may advance the adaptive capacity in the vulnerable group where the similar results was found [48]. A study from Sri Lanka also demonstrated that social capital might enhance the adaptive in the vulnerable community [45]. Interestingly, while the majority of homes have cell phones, only a quarter of them have TVs or radios, indicating a high-level concern of vulnerability to disasters due to the widespread dissemination of disaster-related information through electronic and social media. Nowadays, disaster-related information is disseminated to the local residents by text message t2. Through social media (e.g., facebook, twitter, Youube etc.) and the community people might get easy access using mobile phone. In addition, social networks and livelihood strategies ‘were also provided considerable upgradation among the HH under the treatment group though physical infrastructure and socio-demographic condition had not substantial progress. The absence of or limited access to livelihood assets decrease the ability to build defense against risks and it increases the shocks and stresses to which household is exposed to risk [49].
Hall [50] found that social capital has been recognized as an important indicator to build community capacity to adapt climate risk and confirm sustainable future. The respondents of this study said that around 10% and 8% of the households took part in local participatory meetings and volunteer activities, respectively. Approximately, 28% of the families were observed to be assisting each other's neighbors during calamities. Non-cohesive behaviors of ultra-poor communities might enhance sensitivity within their susceptibility, implying greater possible limits to cope with climatic vulnerability in the context of social resilience and adaptive management. Although financial capital was found to be adequate for establishing adaptive capacity in ultra-poor populations. Discrimination also plays a major role in increasingthe vulnerability of rational and ethnic minorities [51].
Approximately, half of the household heads were found to be illiterate, which was occurred as a result of inadequate facility, financial crisis and the increasing effects of coastal disasters on the household economy. Surprisingly, the results of endline survey showed that roughly 100% of the families had livestock, and 40% of the households' individuals migrated seasonally in Charland for their livestock’s’ grazing. Thus, seasonal migration and livestock rearing at home might both strengthen residents' adaptive potential. Ultra-poor graduation program trained each ultra-poor household how to improve their household economics through the interventions. Women frequently grieve from the impact of vulnerability disproportionately where women have a limited access while making decision is concerned [52]. Keeping this issue in mind, the women of the study area received various sorts of assistance, training, and skill development programs as part of the study. In addition, household women were encouraged and supported to employ their livestock-rearing abilities during the study periods, while their progress was evaluated at certain time intervals. This sort of involvement was an effective scheme to alleviate poverty and reducing malnutrition problems in climate-induced disaster-affected regions.
Having a well-trained woman as an in-charge of house finances the family's finances are quite protective and sustainable which helps a little during and after a calamity. Women were playing roles to progress their adaptive capacity against the vulnerabilities, and sometimes contribute to decision-making processes. Furthermore, active participation of women in decision making process might increase their empowerment status. In this regards, ultra-poor households would upgrade from the ultra-poor to poor status. Gaining this success, the poor would be eligible to receive loan or financial support for their small business from the micro-finance organizations. This method/technique has the potential to be more effective in boosting their home economies and increasing their adaptive capacity to deal with the effects of coastal disasters. It was also found that almost all of the households were engaged in cattle-rearing in addition to other sources of income. Concurrently, seasonal migration for livelihoods was identified to be common at the ultra-poor household level, owing to limited opportunity in agriculture and aquaculture-based livelihoods. Most of the people migrated to other places for searching comparatively higher-paying jobs every six months of a year. On the other hand, males, or household heads were used to migrate mostly on a seasonal basis. Seasonal migration outside the community, as well as intensive livestock rearing at the household level may thus, contribute significantly to enhanced household economic growth.
Figure 7c projected that the indices of exposure and consequent adaptive capacity were significantly higher than the baseline values. On the other hand, the indices of sensitivity were high at the baseline condition comparing the endline values. The indices of climate change exposure at the baseline and endline of the study were 0.74 to 0.85, respectively (Figure 5c). The respondents reported that influencing factors of climate change exposure (temperature, rainfall, dry season periods, cyclones, and storm surges) which had greatly increased in comparison to previous years. Interestingly, the data collected from social survey found that climate-induced parameters such as salinity and water logging had increased significantly. Around 20% of respondents demonstrated that climate change effect had resulted in illness, chronic and communicable disease, and even death. Hence, it was understood that exposure to climate change was related to public health concerns in the study area.
5. Conclusions
The indicators of the three components of vulnerability were examined for the interventions of ultra-poor graduation framework. The overall outcomes of the study provided positive feedback for climate change adaptation practices under the treatment group. About 70% of the indicators’ demonstrated scaling up of indices for climate change adaptation measures. Among the interventions in treatment group, individual savings, community training, personal loan from available banks and livestock farming provided much satisfactory results for adaptation.
Under the treatment group, the indices for end-line survey climate sensitivity were found to be lower than the baseline score. Interestingly, the sensitivity and adaptation performance were contrariwise related with each other. At the end-line study, it was observed that sensitivity was reduced 11% while adaptive capacity was increased 13%. Instead, climate change effect is commonly closely linked to sensitivity and exposure which accelerate vulnerability among the ultra-poor groups. The results showed that most of the interventions in the vulnerable communities performed well for developing adaptive capacity. Despite the fact, education, infrastructure, and social networks were found to be extremely fragile, indicating a lack of their adaptive capacity. Financial and livelihood indicators have been improved substantially as a result of getting support from the interventions under the treatment group. Furthermore, community-based social networks were considered as a more convenient approach in increasing adaptive capacity. The order of potential achievement of climate change adaptation measures were: livelihood>livestock>social and financial security>health and sanitation>water security>awareness and understanding of warning system>migration>social inclusiveness.
Knowledge empowerment and knowledge sharing attitudes might be beneficial in developing long-term adaptive capacity, which might result in greater adaptive capacity in the face of unfavorable climate consequences. Further research on diverse ethnic groups should be performed in light of the coastal vulnerability. The findings of this study could be used to develop vulnerability reduction policy and native adaptation planning in order to protect ultra-poor coastal communities from the effects of climate change. Although sustainability is a major challenge for the vulnerable population, and ultra-poor graduation models can be useful pathways to improve adaptive capacity, resilience, and long-term development.
Supplementary Materials
The following supporting information can be downloaded at the website of this paper posted on Preprints.org.
Acknowledgments
The authors of this study highly acknowledged the BRAC Ultra-Poor Graduation Programme for cooperating the BRAC Climate Change sub-programme for conducting the research. The authors would like to express their appreciation to the BRAC field-level staffs for their tireless assistance during data collection. Anonymous local people and respondents were greatly acknowledging for cordial support and assistance in data collection.
References
- M. S. Ul Din et al., “World nations priorities on climate change and food security,” in Building Climate Resilience in Agriculture: Theory, Practice and Future Perspective, 2021, pp. 265–284. [CrossRef]
- W. N. Adger, S. Huq, K. Brown, C. Declan, and H. Mike, “Adaptation to climate change in the developing world,” Prog. Dev. Stud., vol. 3, no. 3, pp. 179–195, Jul. 2003. [CrossRef]
- M. A. A. Hoque, B. Pradhan, N. Ahmed, B. Ahmed, and A. M. Alamri, “Cyclone vulnerability assessment of the western coast of Bangladesh,” Geomatics, Nat. Hazards Risk, vol. 12, no. 1, pp. 198–221, Jan. 2021. [CrossRef]
- S. Dasgupta, M. S. Islam, M. Huq, and H. Khan, “Z., & Hasib, M,” R. Quantifying Prot. Capacit. mangroves from storm surges Coast, vol. 14, 2019, [Online]. Available. [CrossRef]
- M. A. H. Bhuiyan, S. M. D.-U. Islam, and G. Azam, “Exploring impacts and livelihood vulnerability of riverbank erosion hazard among rural household along the river Padma of Bangladesh,” Environ. Syst. Res., vol. 6, no. 1, p. 1, Dec. 2017. [CrossRef]
- M. A. Rakib, “Export Trend of the Leather Industry of Bangladesh: Challenges to Sustainable Development A R TI C LE I N F O Article History,” BUFT J. Bus. Econ. (BJBE, vol. 1, pp. 163–187, 2020.
- UNDP, “Cyclone Aila: Joint Multi-Sector Assessment and Response Framework. Retrieved,” Bur. Cris. Prev., 2010.
- K. M. Tasnim, T. Shibayama, M. Esteban, H. Takagi, K. Ohira, and R. Nakamura, “Field observation and numerical simulation of past and future storm surges in the Bay of Bengal: case study of cyclone Nargis,” Nat. Hazards, vol. 75, no. 2, pp. 1619–1647, 2015. [CrossRef]
- M. Ahamed, “Community based Approach for Reducing Vulnerability to Natural Hazards (Cyclone, Storm Surges) in Coastal Belt of Bangladesh,” Procedia Environ. Sci., vol. 17, pp. 361–371, 2013. [CrossRef]
- M. A. Rakib et al., “Groundwater salinization and associated co-contamination risk increase severe drinking water vulnerabilities in the southwestern coast of Bangladesh,” Chemosphere, vol. 246, no. 125646, p. 125646, May 2020. [CrossRef]
- M. T. Ur Rahman, M. Rasheduzzaman, M. A. Habib, A. Ahmed, S. M. Tareq, and S. M. Muniruzzaman, “Community Mitigation Approaches to Combat Safe Water Scarcity in the Context of Salinity Intrusion in Coastal Bangladesh,” in Springer Water, Cham: Springer, 2021, pp. 787–797. [CrossRef]
- M. R. R. Talukder, S. Rutherford, D. Phung, M. Z. Islam, and C. Chu, “The effect of drinking water salinity on blood pressure in young adults of coastal Bangladesh,” Environ. Pollut., vol. 214, pp. 248–254, Jul. 2016. [CrossRef]
- S. Das et al., “Social vulnerability to environmental hazards in the Ganges-Brahmaputra-Meghna delta, India and Bangladesh,” Int. J. Disaster Risk Reduct., vol. 53, no. 101983, p. 101983, Feb. 2021. [CrossRef]
- M. N. Ahsan, F. Khatun, P. Kumar, R. Dasgupta, B. A. Johnson, and R. Shaw, “Promise, premise, and reality: the case of voluntary environmental non-migration despite climate risks in coastal Bangladesh,” Reg. Environ. Chang., vol. 22, no. 1, p. 1, 2022. [CrossRef]
- W. Bank, Inclusive Resilience: Inclusion Matters for Resilience in South Asia. World Bank, 2021.
- K. F. Austin and L. A. McKinney, “Disaster devastation in poor nations: The direct and indirect effects of gender equality, ecological losses, and development,” Soc. Forces, vol. 95, no. 1, pp. 355–380, Sep. 2016. [CrossRef]
- R. S. Oktari, S. Kamaruzzaman, F. Fatimahsyam, S. Sofia, and D. K. Sari, “Gender mainstreaming in a Disaster-Resilient Village Programme in Aceh Province, Indonesia: Towards disaster preparedness enhancement via an equal opportunity policy,” Int. J. Disaster Risk Reduct., vol. 52, no. 101974, p. 101974, Jan. 2021. [CrossRef]
- V. Walters and J. C. Gaillard, “Disaster risk at the margins: Homelessness, vulnerability and hazards,” Habitat Int., vol. 44, pp. 211–219, 2014. [CrossRef]
- M. N. Ahsan and J. Warner, “The socioeconomic vulnerability index: A pragmatic approach for assessing climate change led risks-A case study in the south-western coastal Bangladesh,” Int. J. Disaster Risk Reduct., vol. 8, pp. 32–49, Jun. 2014. [CrossRef]
- R. Islam, M. S. Hossain, and M. A. B. Siddique, “Occupational health hazards and safety practices among the workers of tannery industry in Bangladesh,” Jahangirnagar Univ. J. Biol. Sci., vol. 6, no. 1, pp. 13–22, 2017. [CrossRef]
- Y. W. Rabby, M. B. Hossain, and M. U. Hasan, “Social vulnerability in the coastal region of Bangladesh: An investigation of social vulnerability index and scalar change effects,” Int. J. Disaster Risk Reduct., vol. 41, no. 101329, p. 101329, Dec. 2019. [CrossRef]
- M. Saisana and S. Tarantola, State-of-the-art Report on Current Methodologies and Practices for Composite Indicator Development, vol. 214, no. July. European Commission, Joint Research Centre, Institute for the Protection and~…, 2002.
- Kotzee and, B. Reyers, “Piloting a social-ecological index for measuring flood resilience: A composite index approach,” Ecol. Indic., vol. 60, pp. 45–53, Jan. 2016. [CrossRef]
- M. Valipour, “Future of agricultural water management in Africa,” Arch. Agron. Soil Sci., vol. 61, no. 7, pp. 907–927, Jul. 2015. [CrossRef]
- M. Valipour et al., “Agricultural water management in the world during past half century,” Arch. Agron. Soil Sci., vol. 61, no. 5, pp. 657–678, 2015. [CrossRef]
- J. Hinkel, “‘ Indicators of vulnerability and adaptive capacity’: Towards a clarification of the science-policy interface,” Glob. Environ. Chang., vol. 21, no. 1, pp. 198–208, Feb. 2011. [CrossRef]
- R. J. Scholes and R. Biggs, “A biodiversity intactness index,” Nature, vol. 434, no. 7029, pp. 45–49, Mar. 2005. [CrossRef]
- J. X. Kasperson and R. E. Kasperson, “International Workshop on Vulnerability and Global Environmental Change,” Int. Hum. Dimens. Progr. Updat., vol. 01, no. 2001--01, pp. 2–3, 2001.
- H. M. Füssel and R. J. T. Klein, “Climate change vulnerability assessments: An evolution of conceptual thinking,” Clim. Change, vol. 75, no. 3, pp. 301–329, Apr. 2006. [CrossRef]
- Y. A. Izrael et al., The Fourth Assessment Report of the Intergovernmental Panel on Climate Change: Working Group II contribution, vol. 32, no. 9. Cambridge University Press, 2007. [CrossRef]
- The Core Writing Team IPCC, Climate Change 2014: Synthesis Report. Contribution of Working Groups I, II and III to the Fifth Assessment Report of the Intergovernmental Panel on Climate Change. Ipcc, 2015.
- B. Smit and J. Wandel, “Adaptation, adaptive capacity and vulnerability,” Glob. Environ. Chang., vol. 16, no. 3, pp. 282–292, Aug. 2006. [CrossRef]
- N. Arnell, “Climate Change 2001: Impacts, Adaptation and Vulnerability. Contribution of Working Group II to the Third Assessment Report of the Intergovernmental Panel on Climate Change,” IPCC, pp. 191–234, 2001.
- N. R. Das, “Human Development Report 2007/2008 Fighting Climate Change: Human Solidarity in a Divided World, UNDP, New York,” Soc. Change, vol. 39, no. 1, pp. 154–159, 2009. [CrossRef]
- L. Shahzad et al., “Livelihood vulnerability index: a pragmatic assessment of climatic changes in flood affected community of Jhok Reserve Forest, Punjab, Pakistan,” Environ. Earth Sci., vol. 80, no. 7, Apr. 2021. [CrossRef]
- S. Suryanto and A. Rahman, “Application of livelihood vulnerability index to assess risks for farmers in the Sukoharjo regency and Klaten regency, Indonesia,” Jamba J. Disaster Risk Stud., vol. 11, no. 1, p. 739, Jul. 2019. [CrossRef]
- M. B. Hahn, A. M. Riederer, and S. O. Foster, “The Livelihood Vulnerability Index: A pragmatic approach to assessing risks from climate variability and change—A case study in Mozambique,” Glob. Environ. Chang., vol. 19, no. 1, pp. 74–88, 2009. [CrossRef]
- R. D. Cook, “Detection of Influential Observation in Linear Regression,” Technometrics, vol. 19, no. 1, pp. 15–18, 1977. [CrossRef]
- K. A. BOLLEN and R. W. JACKMAN, “Regression Diagnostics: An Expository Treatment of Outliers and Influential Cases,” Sociol. Methods \& Res., vol. 13, no. 4, pp. 510–542, 1985. [CrossRef]
- M. A. Rakib, J. Sasaki, H. Matsuda, and M. Fukunaga, “Severe salinity contamination in drinking water and associated human health hazards increase migration risk in the southwestern coastal part of Bangladesh,” J. Environ. Manage., vol. 240, pp. 238–248, 2019. [CrossRef]
- J. Chen and V. Mueller, “Coastal climate change, soil salinity and human migration in Bangladesh,” Nat. Clim. Chang., vol. 8, no. 11, pp. 981–985, 2018. [CrossRef]
- M. A. Khan and A. J. Ali, “The role of training in reducing poverty: The case of the ultra-poor in Bangladesh,” Int. J. Train. Dev., vol. 18, no. 4, pp. 271–281, 2014. [CrossRef]
- V. Kumar, S. Roy, B. K. Behera, P. Bossier, and B. K. Das, “Acute hepatopancreatic necrosis disease (Ahpnd): Virulence, pathogenesis and mitigation strategies in Shrimp aquaculture,” Toxins (Basel)., vol. 13, no. 8, p. 524, Jul. 2021. [CrossRef]
- M. S. Uddin, C. E. Haque, M. N. Khan, B. Doberstein, and R. S. Cox, “‘Disasters threaten livelihoods, and people cope, adapt and make transformational changes’: Community resilience and livelihoods reconstruction in coastal communities of Bangladesh,” Int. J. Disaster Risk Reduct., vol. 63, p. 10244, 2021. [CrossRef]
- U. S. Thathsarani and L. H. P. Gunaratne, “Constructing and Index to Measure the Adaptive Capacity to Climate Change in Sri Lanka,” Procedia Eng., vol. 212, pp. 278–285, 2018. [CrossRef]
- F. Baffour-Ata et al., “Assessing the adaptive capacity of smallholder cocoa farmers to climate variability in the Adansi South District of the Ashanti Region, Ghana,” Heliyon, vol. 9, no. 3, p. e13994, 2023. [CrossRef]
- R. Salam et al., “Nexus between vulnerability and adaptive capacity of drought-prone rural households in northern Bangladesh,” Nat. Hazards, vol. 106, no. 1, pp. 509–527, 2021. [CrossRef]
- S. Willems and K. A. Baumert, “Institutional capacity and climate actions,” OECD/IEA Clim. Chang. Expert Gr. Pap., 2003, [Online]. Available online: https://api.semanticscholar.org/CorpusID:126897434.
- B. Shahbaz, “Risk, Vulnerability and Sustainable Livelihoods: Insights from Northwest Pakistan,” 2008. [Online]. Available online: https://api.semanticscholar.org/CorpusID:130404515.
- C. M. Hall, “Rethinking Collaboration and Partnership: A Public Policy Perspective,” J. Sustain. Tour., vol. 7, no. 3–4, pp. 274–289, 1999. [CrossRef]
- Fothergill, “An Exploratory Study of Woman Battering in the Grand Forks Flood Disaster: Implications for Community Responses and Policies,” Int. J. Mass Emergencies \& Disasters, vol. 17, pp. 79–98, 1999, [Online]. Available online: https://api.semanticscholar.org/CorpusID:112431609.
- J. D. Morrow, “How Could Trade Affect Conflict?,” J. Peace Res., vol. 36, no. 4, pp. 481–489, 1999. [CrossRef]
Figure 1.
Location and sampling points of the study area.
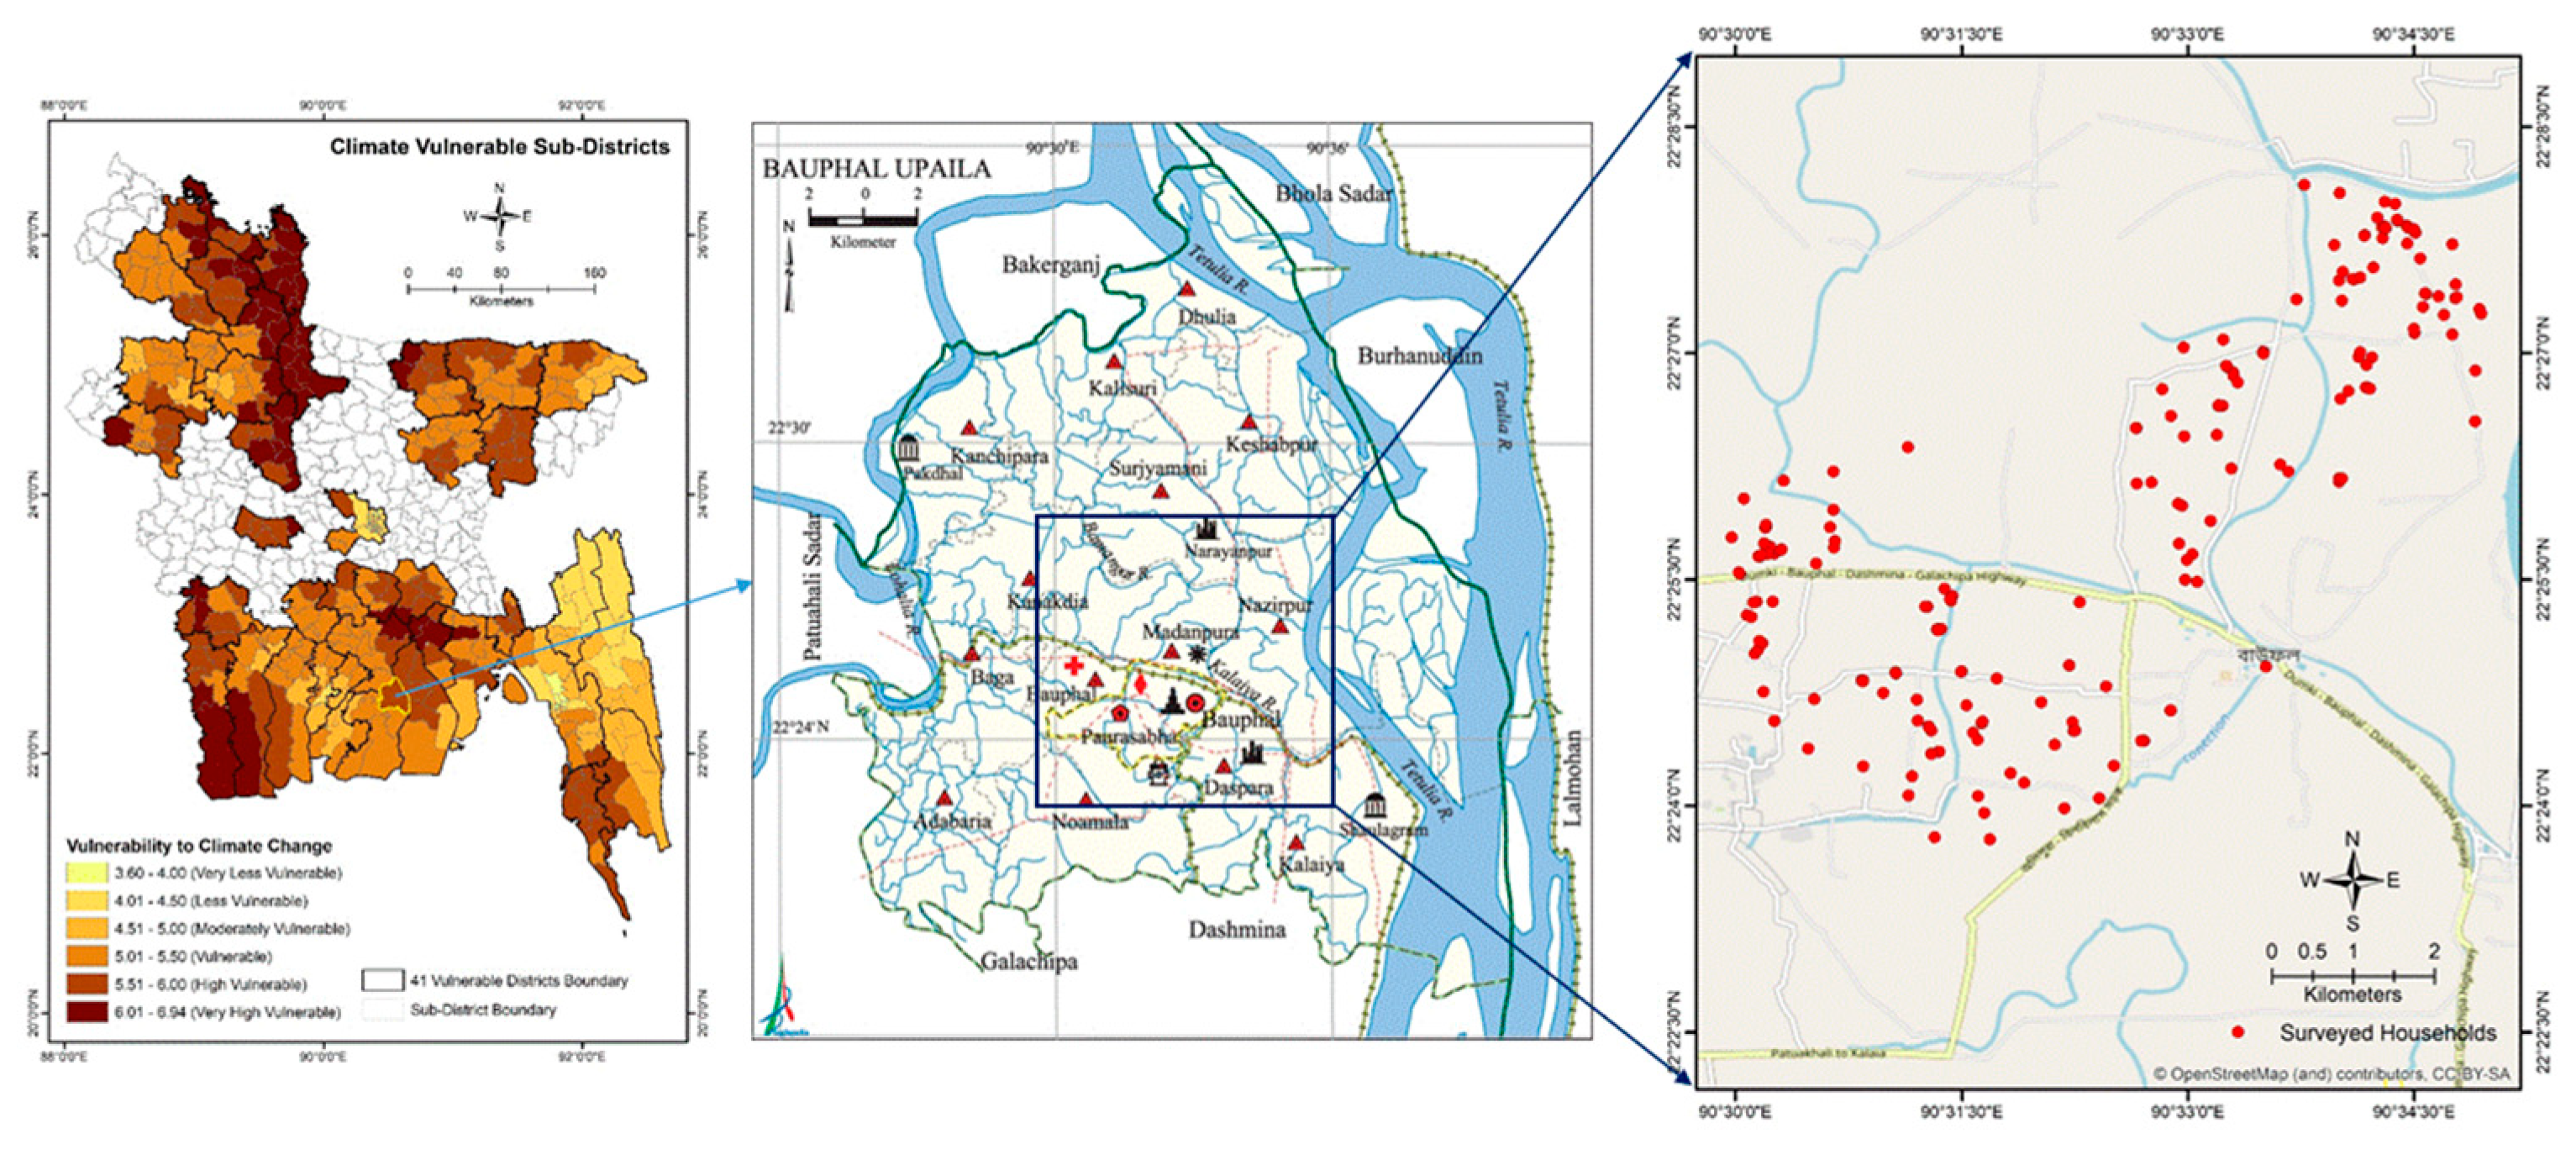
Figure 2.
(a) Histogram and (b) regression analysis of samples.
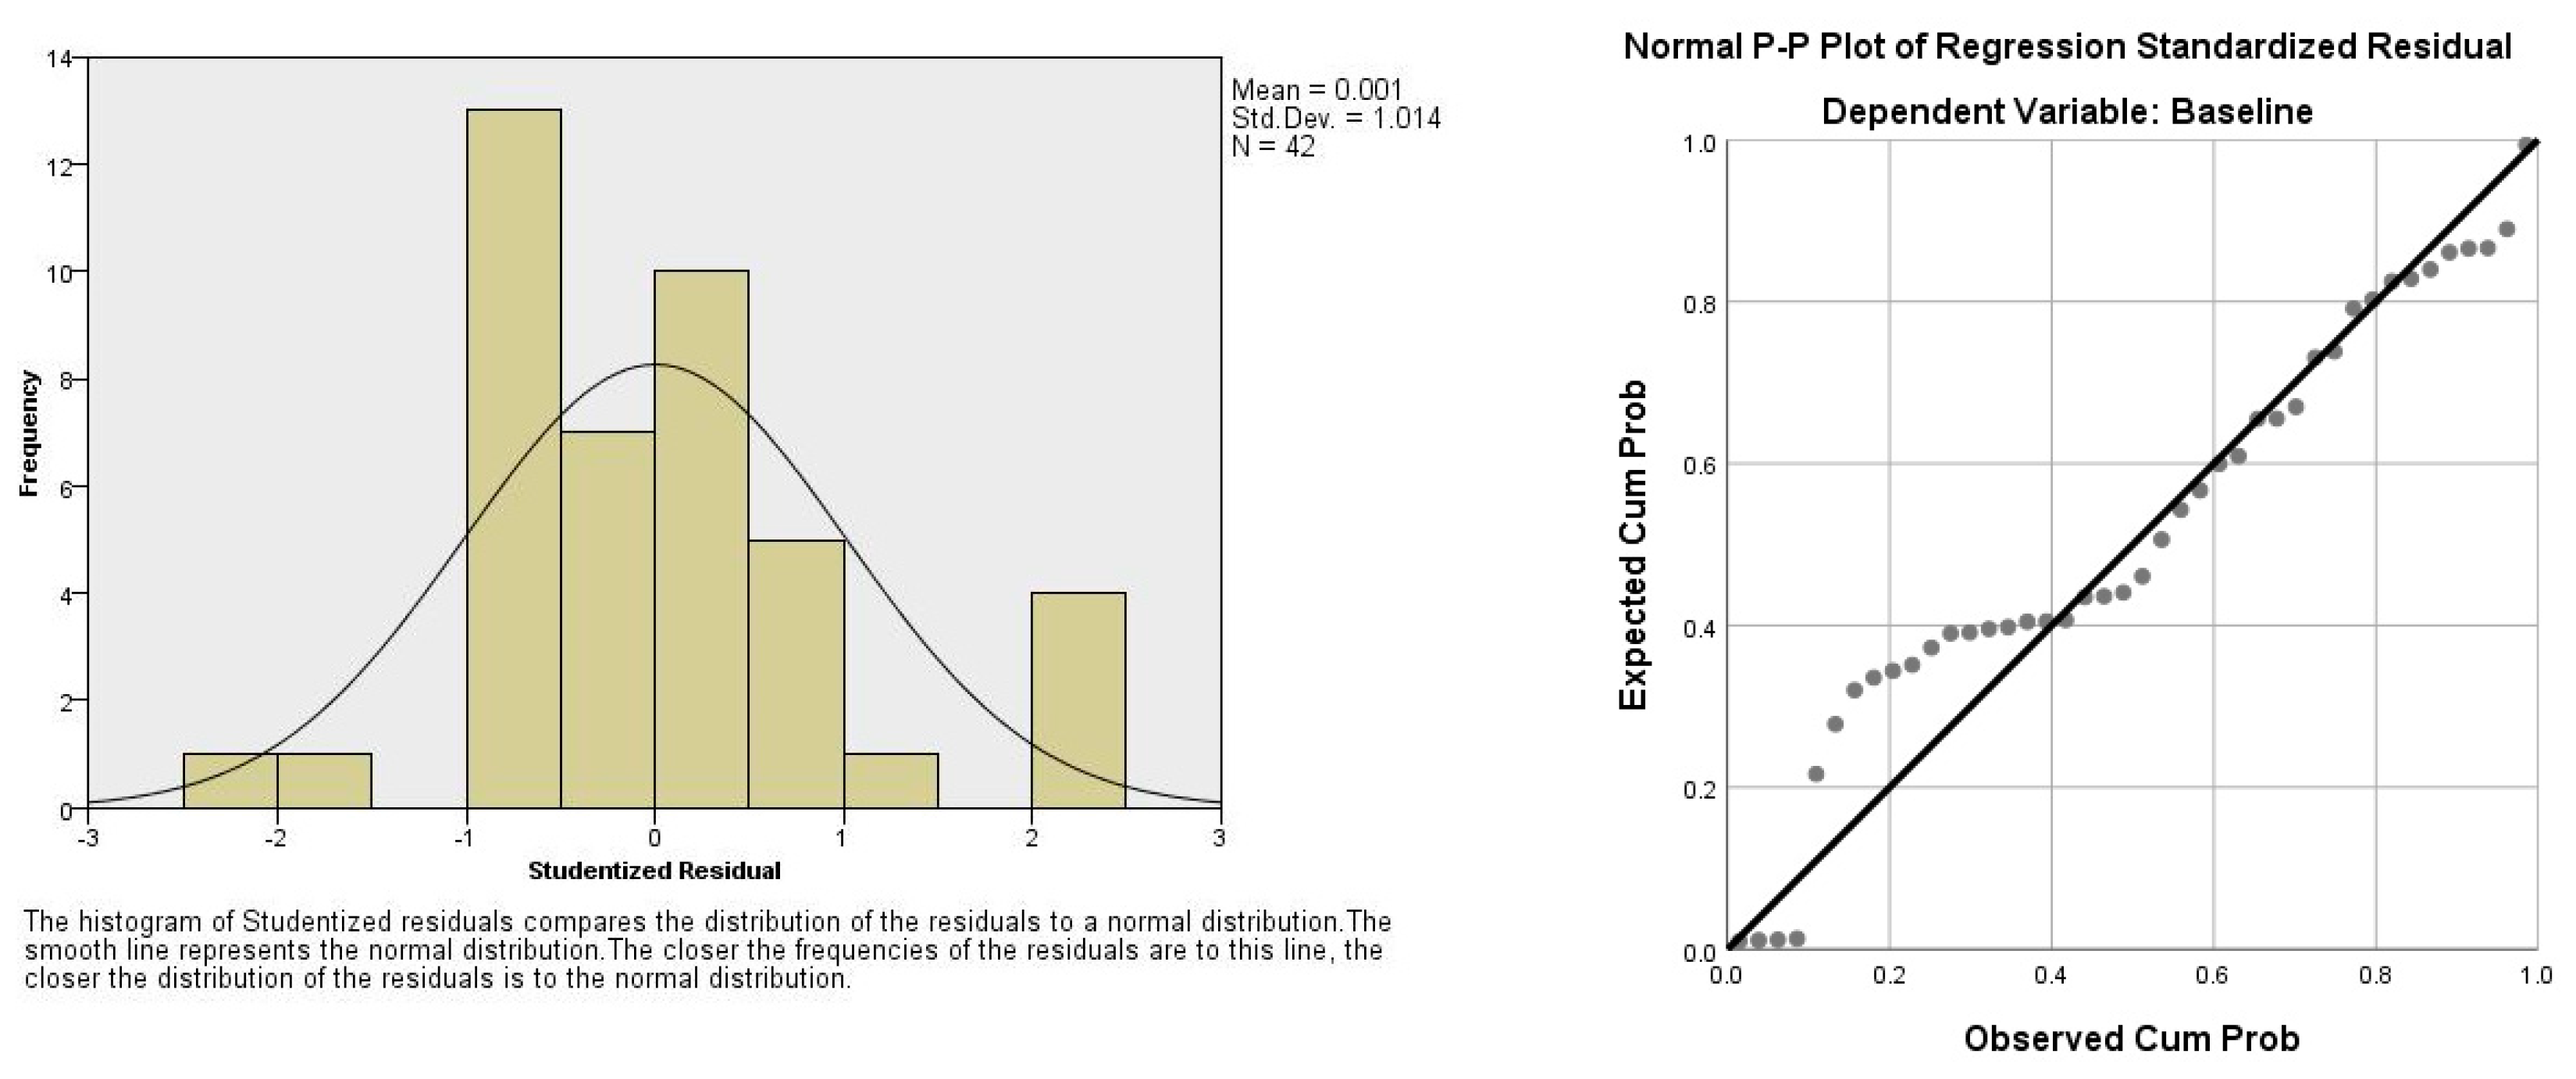
Figure 3.
Variation of indicators at controlled and treatment conditions.
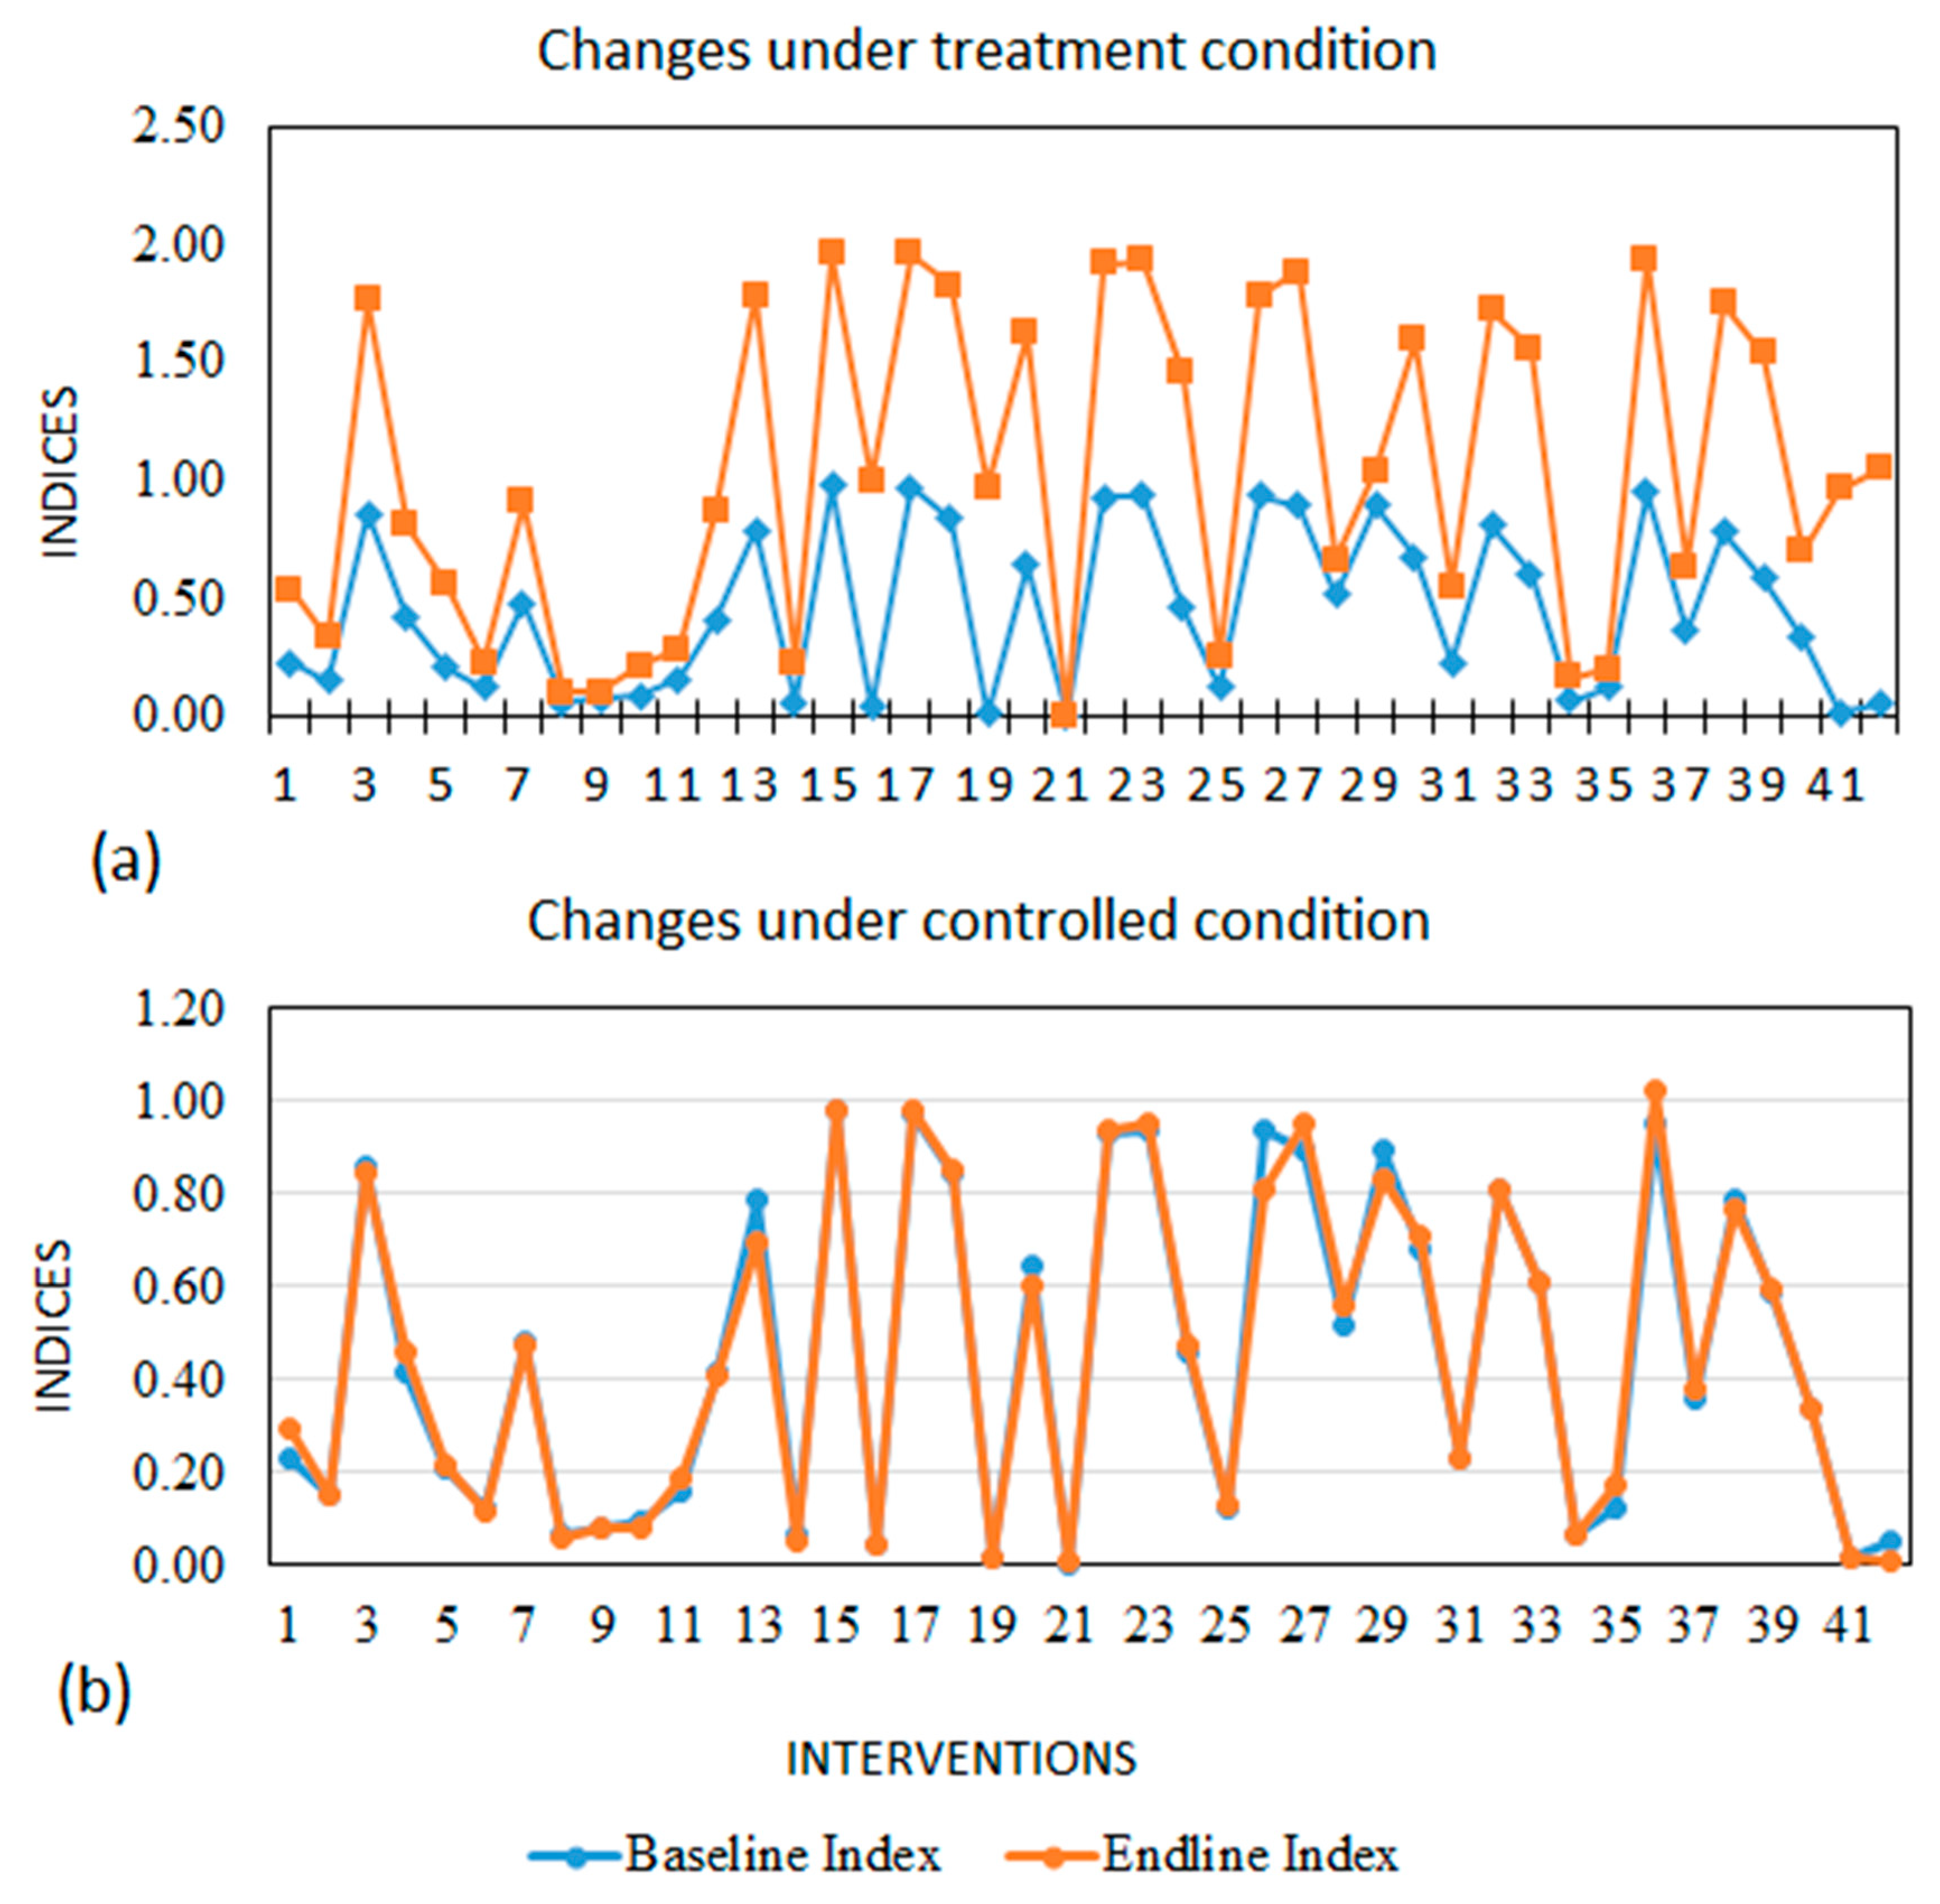
Figure 4.
Changes of indicators at the baseline and endline situation under treatment condition.
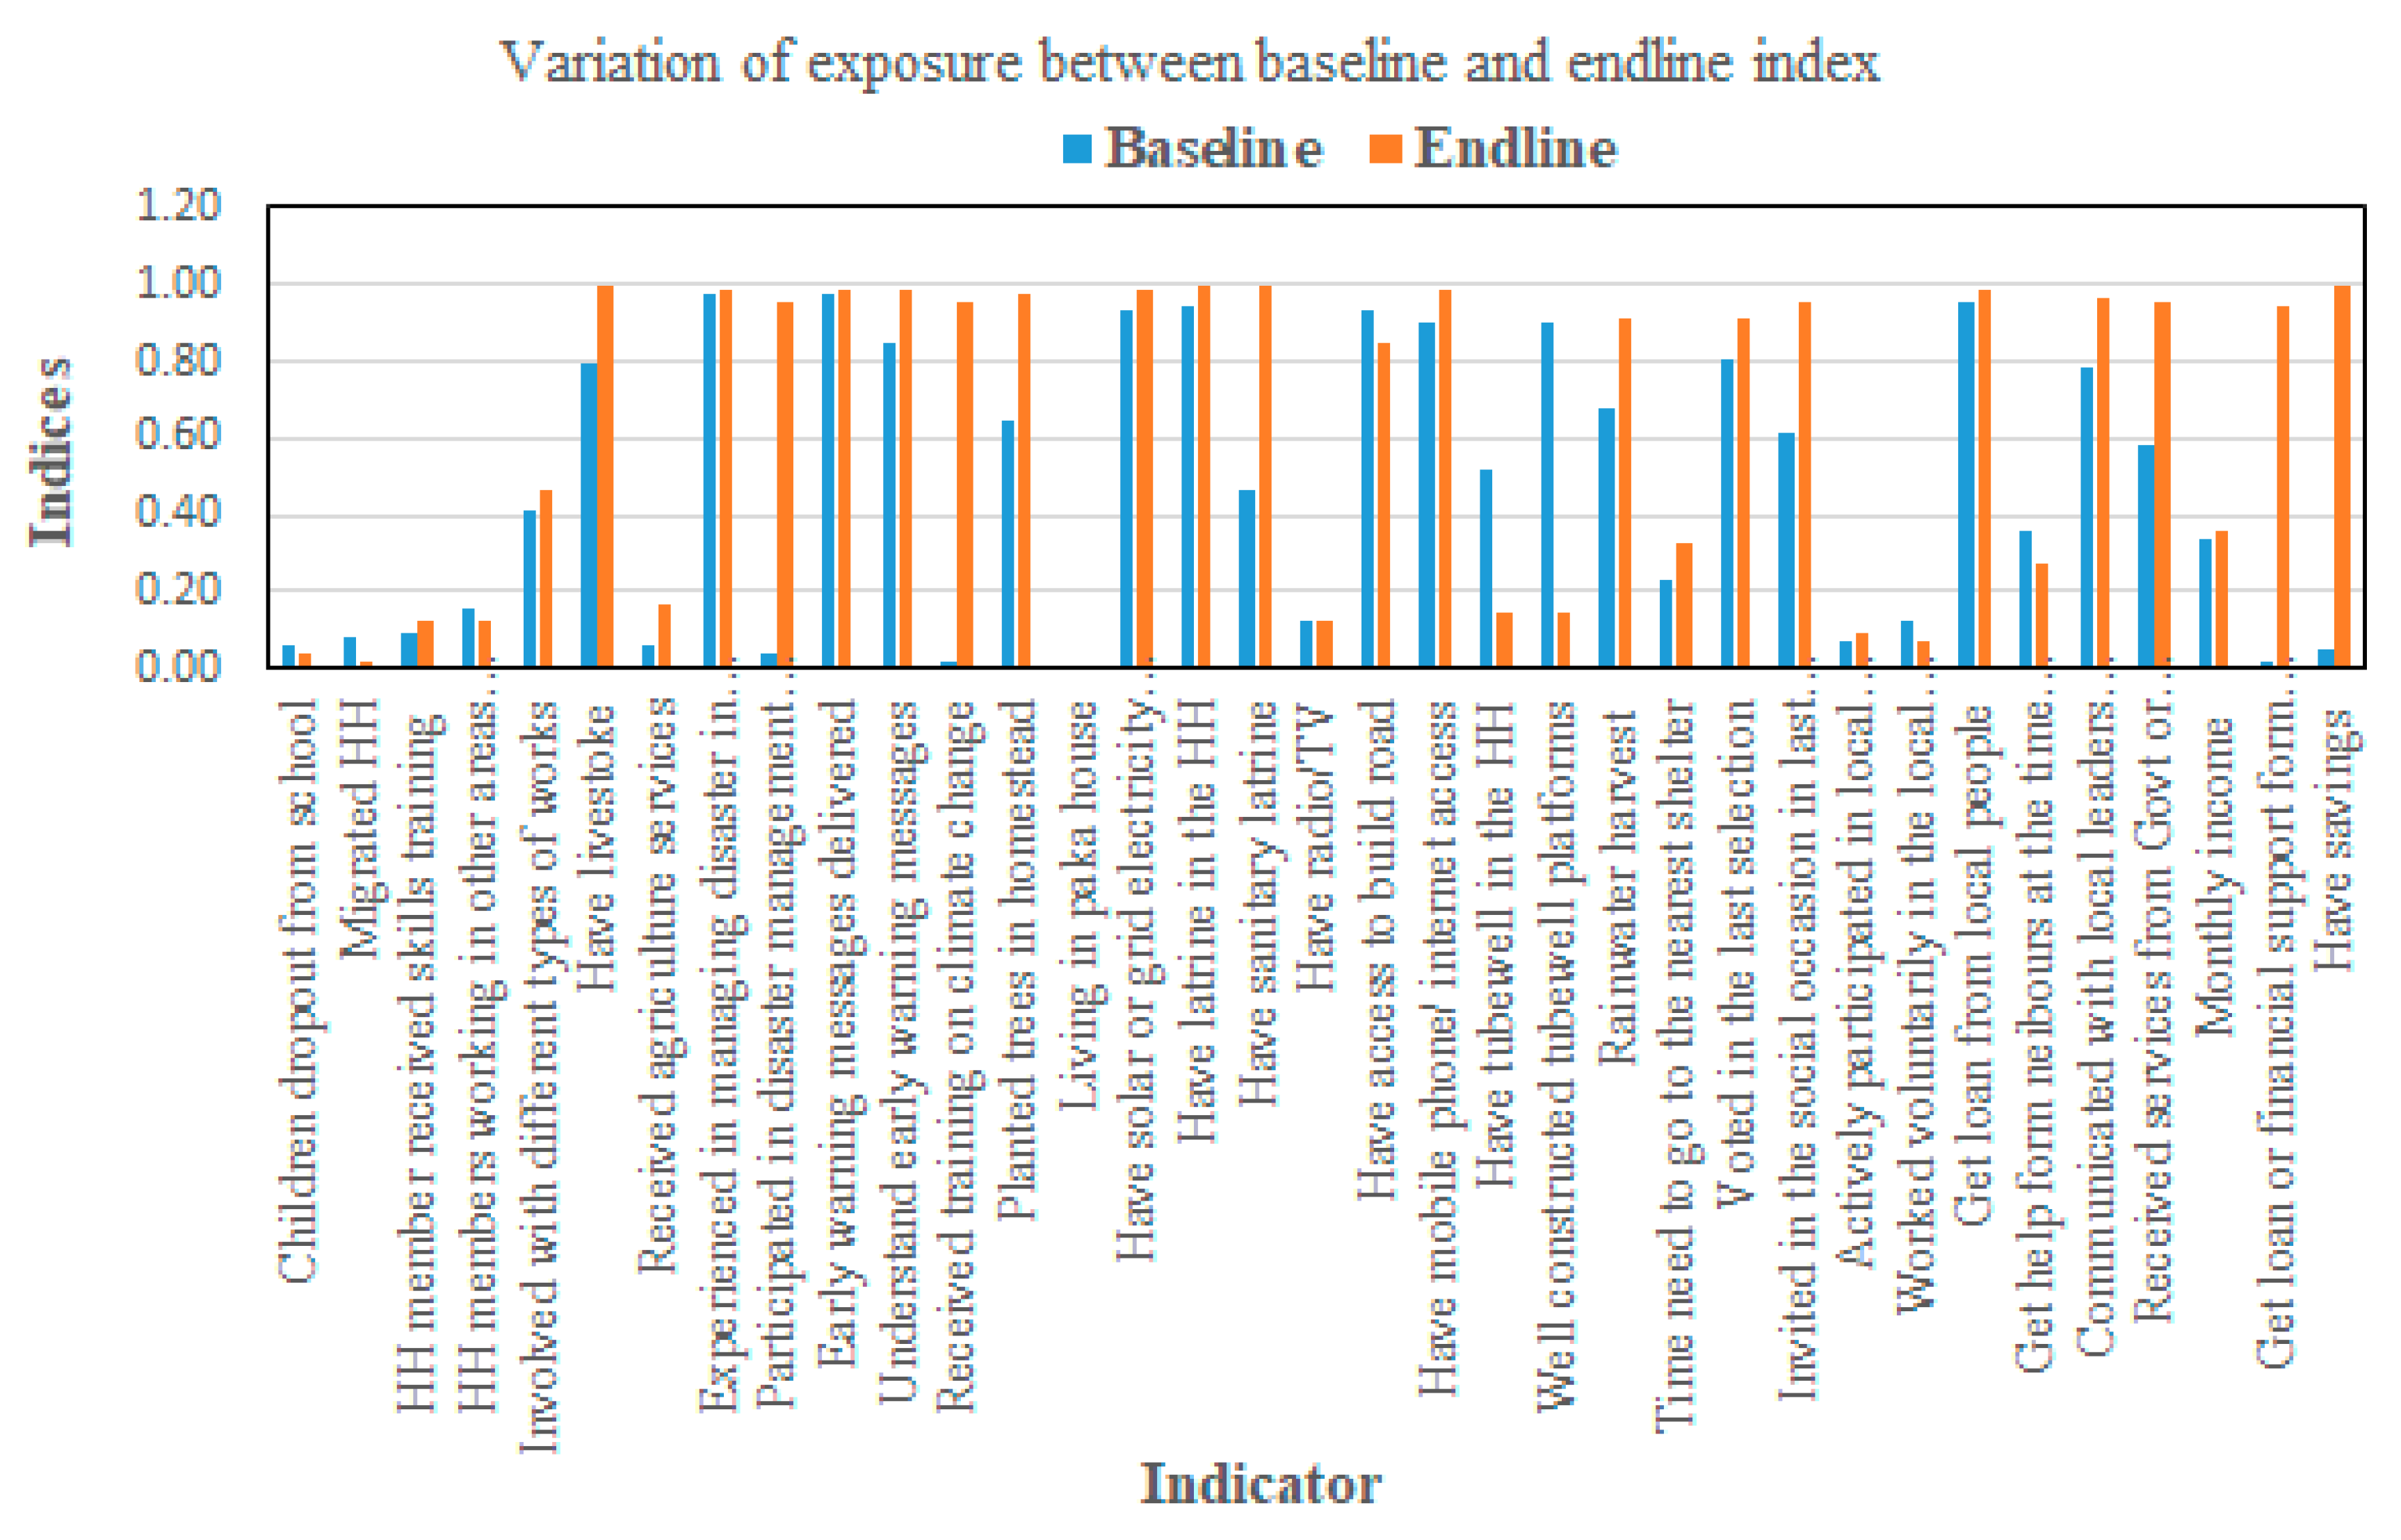
Figure 5.
Changes of sensitivity index of indicators.
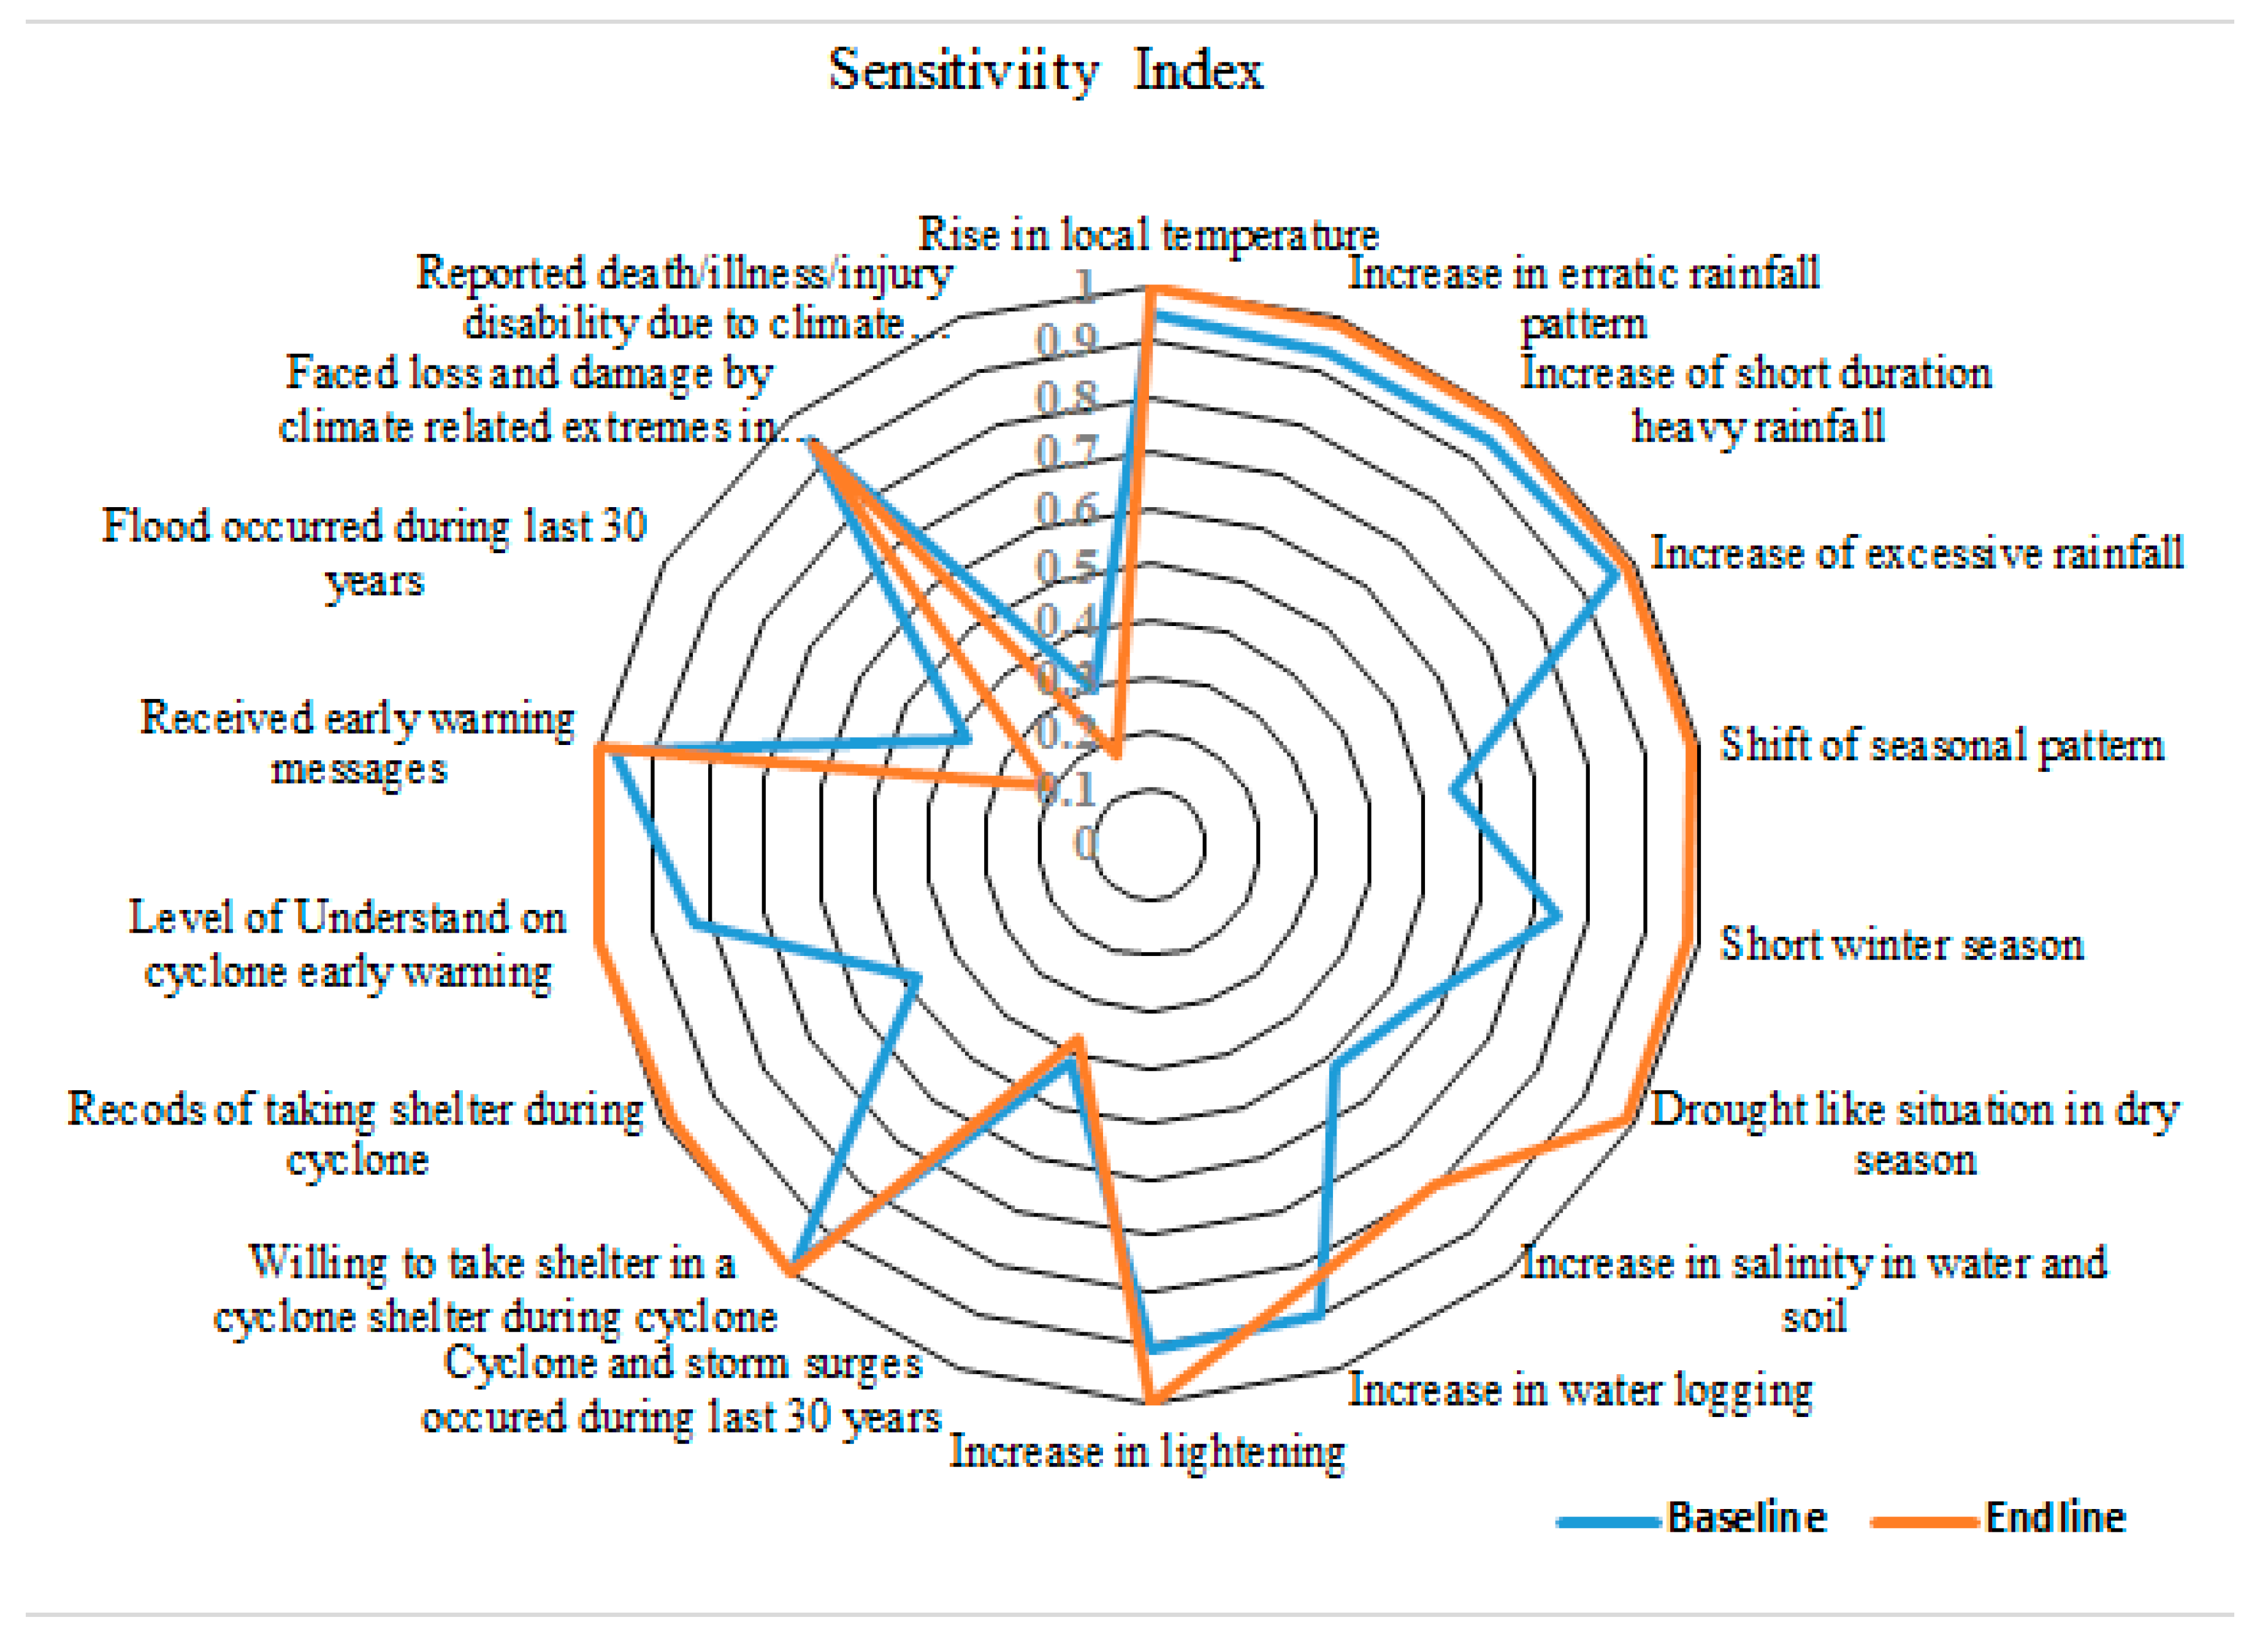
Figure 6.
Changes of adaptive capacity at the baseline and endline condition under the treatment group.
Figure 6.
Changes of adaptive capacity at the baseline and endline condition under the treatment group.
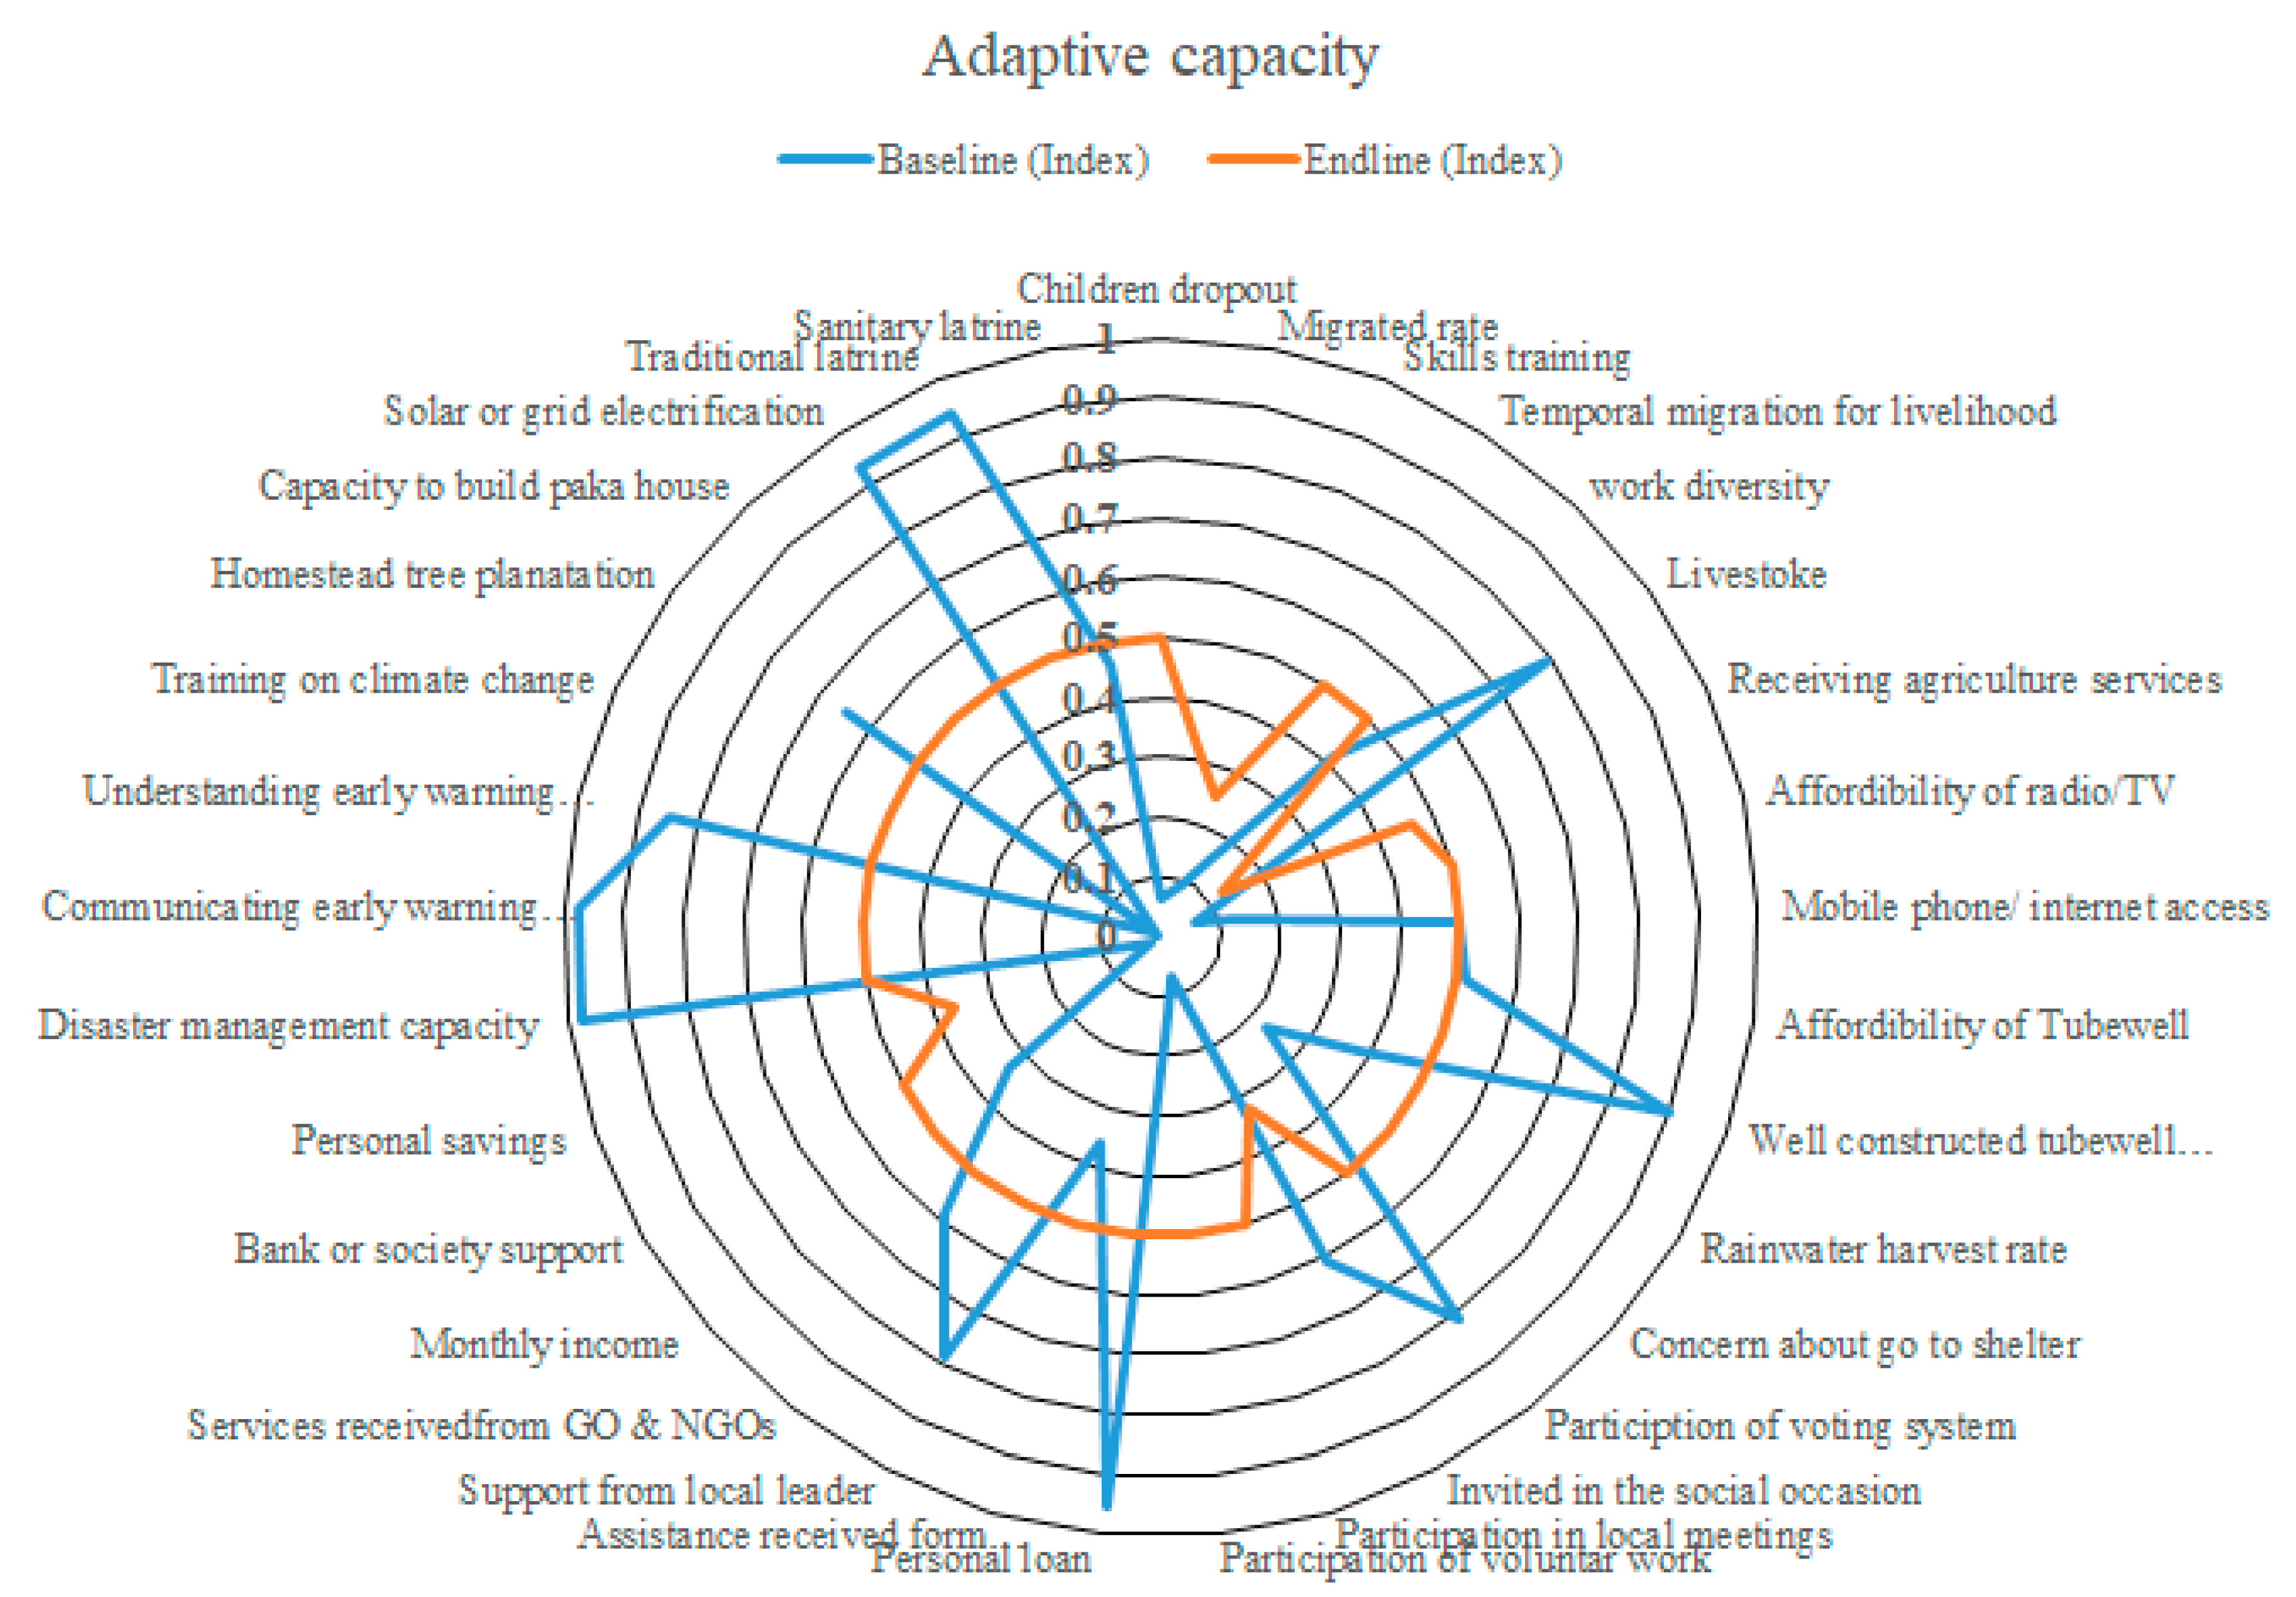
Figure 7.
(a, b, c). Status of sensitivity, adaptive capacity and vulnerability.
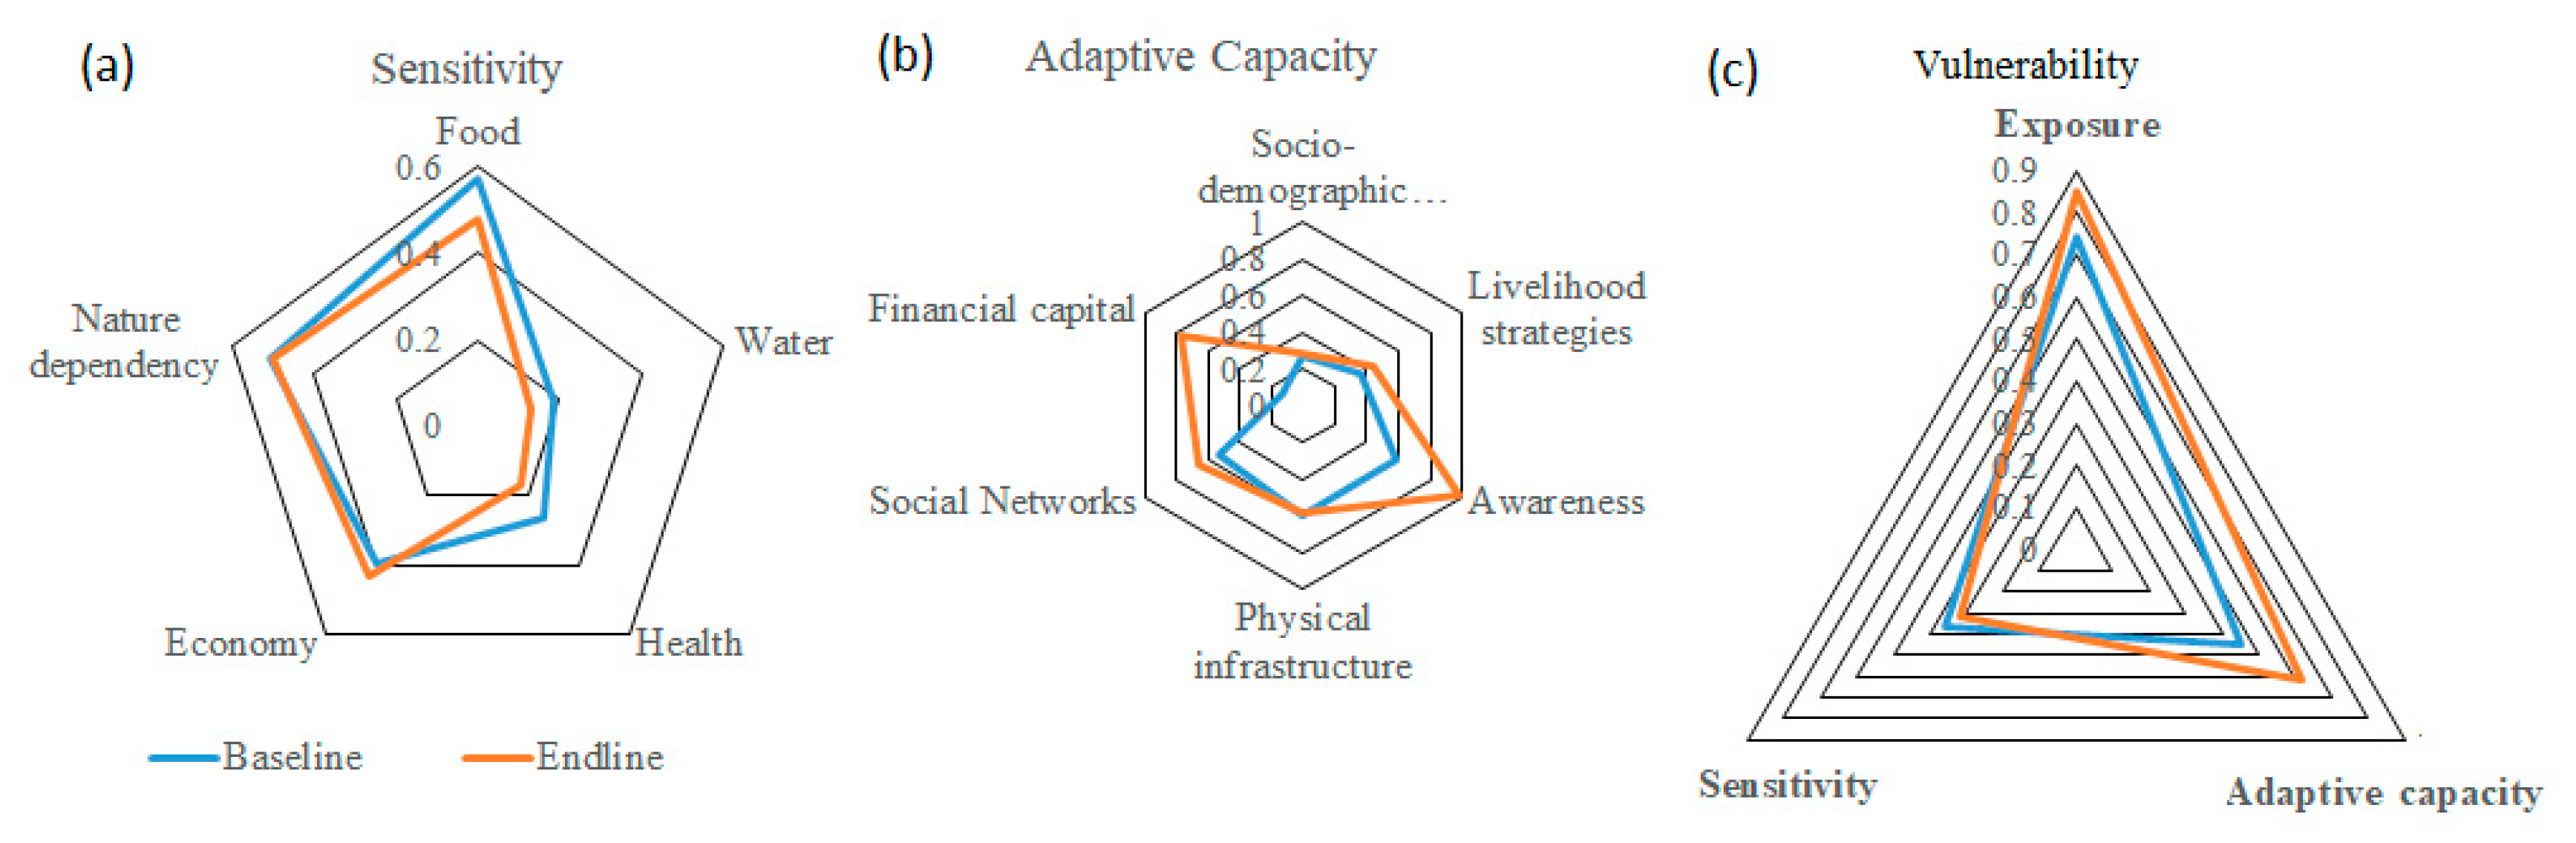
Table 1.
List of interventions employed in the study area.
| No | Name of intervention | No | Name of intervention |
| 1 | Livestock support | 7 | Health care support |
| 2 | Agriculture input | 8 | Microfinancing |
| 3 | Seed capital | 9 | Drinking water (Rainwater harvesting) support |
| 4 | Partial food support/Food bank | 10 | Energy (Solar) system support |
| 5 | Help to create Saving account | 11 | Support of homestead gardening |
| 6 | Training/weekly coaching | 12 | Awareness camping |
Table 2.
Difference between the baseline and endline indices of interventions for adaptive capacity under treatment Group.
Table 2.
Difference between the baseline and endline indices of interventions for adaptive capacity under treatment Group.
| Components | Indicator (make correction in the text) | Baseline Index | Endline Index | Difference (Endline-Baseline) |
|---|---|---|---|---|
| Socio -Demographic Profile |
Dependent member (<15 years) | 0.233 | 0.303 | 0.070 |
| Dependent member (>65 years) | 0.154 | 0.181 | 0.027 | |
| Husband is the household head | 0.863 | 0.902 | 0.039 | |
| Education of HH head | 0.419 | 0.396 | -0.023 | |
| Number of HH members | 0.212 | 0.348 | 0.136 | |
| HH members involved in income | 0.123 | 0.106 | -0.016 | |
| Highest educated HH member | 0.480 | 0.433 | -0.048 | |
| Children dropout from school | 0.063 | 0.039 | -0.024 | |
| Migrated HH | 0.078 | 0.024 | -0.054 | |
| HH member received skills training | 0.093 | 0.122 | 0.029 | |
| Livelihood strategies |
HH members working in other areas for livelihood | 0.160 | 0.127 | -0.033 |
| Involved with different types of works | 0.415 | 0.461 | 0.046 | |
| Have livestock | 0.790 | 0.995 | 0.205 | |
| Received agriculture services | 0.063 | 0.171 | 0.107 | |
| Awareness |
Experienced in managing disaster in last 30 years | 0.980 | 0.985 | 0.005 |
| Participated in disaster management events organized by GoB or NGOs | 0.044 | 0.956 | 0.912 | |
| Early warning messages delivered | 0.976 | 0.990 | 0.015 | |
| Understand early warning messages | 0.844 | 0.985 | 0.141 | |
| Received training on climate change | 0.015 | 0.956 | 0.941 | |
| Planted trees in homestead | 0.644 | 0.980 | 0.337 | |
| Physical infrastructure |
Living in Paka house | 0.005 | 0.005 | 0.000 |
| Have solar or grid electricity connection | 0.932 | 0.985 | 0.054 | |
| Have latrine in the HH | 0.941 | 0.995 | 0.054 | |
| Have sanitary latrine | 0.463 | 0.995 | 0.532 | |
| Have radio/TV | 0.127 | 0.122 | -0.005 | |
| Have access to build road | 0.937 | 0.849 | -0.088 | |
| Have mobile phone/ internet access | 0.898 | 0.985 | 0.088 | |
| Have tubewell in the HH | 0.517 | 0.146 | -0.371 | |
| Well-constructed tubewell platforms | 0.898 | 0.146 | -0.751 | |
| Rainwater harvest | 0.683 | 0.917 | 0.234 | |
| Time needs to go to the nearest shelter | 0.233 | 0.323 | 0.091 | |
| Social Networks |
Voted in the last selection | 0.810 | 0.912 | 0.102 |
| Invited in the social occasion in last 1 year | 0.610 | 0.951 | 0.341 | |
| Actively participated in local meetings in last 1 year | 0.068 | 0.098 | 0.029 | |
| Worked voluntarily in the local development initiatives | 0.127 | 0.073 | -0.054 | |
| Get loan from local people | 0.951 | 0.990 | 0.039 | |
| Get help form neighbors at the time of disaster | 0.361 | 0.278 | -0.083 | |
| Communicated with local leaders for getting help | 0.785 | 0.966 | 0.180 | |
| Received services from Govt or non-govt organizations | 0.585 | 0.956 | 0.371 | |
| Financial capital |
Monthly income | 0.336 | 0.364 | 0.028 |
| Get loan or financial support from bank or society | 0.020 | 0.946 | 0.927 | |
| Have savings | 0.054 | 0.995 | 0.941 |
Disclaimer/Publisher’s Note: The statements, opinions and data contained in all publications are solely those of the individual author(s) and contributor(s) and not of MDPI and/or the editor(s). MDPI and/or the editor(s) disclaim responsibility for any injury to people or property resulting from any ideas, methods, instructions or products referred to in the content. |
© 2025 by the authors. Licensee MDPI, Basel, Switzerland. This article is an open access article distributed under the terms and conditions of the Creative Commons Attribution (CC BY) license (http://creativecommons.org/licenses/by/4.0/).
Copyright: This open access article is published under a Creative Commons CC BY 4.0 license, which permit the free download, distribution, and reuse, provided that the author and preprint are cited in any reuse.


