
Submitted:
05 January 2026
Posted:
07 January 2026
You are already at the latest version
Abstract
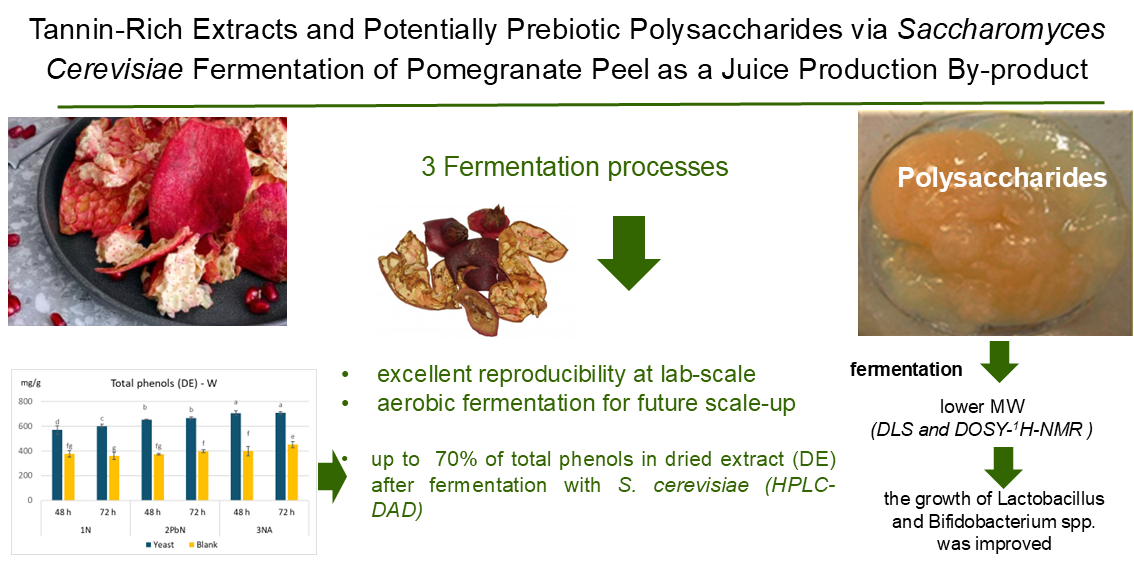
Pomegranate peel, accounting for 35-50% of the fruit's weight, is an underutilized by-product rich in ellagitannins and pectin. Although pomegranate juice has already been subjected to fermentation, this study aimed to demonstrate for the first time, that a simple fermentation process of pomegranate peel using Saccharomyces cerevisiae can yield tannin-rich extracts and enhance the potential prebiotic properties of pomegranate polysaccharides. Peels of ‘Wonderful’ and ‘G1’ cultivars, significantly differing in peel thickness, were used for fermentation applying three processes at room temperature monitored at 48 and 72 h. HPLC-DAD analysis showed that yeast-driven fermentation increased total tannin (up to 70% in dry extracts) compared with spontaneous fermentation (40-43%). A potential enhancement of prebiotic activity was associated with the reduction in the molecular weight of native polysaccharides (from a maximum of 705 kDa down to 26 kDa), as evaluated by DLS and DOSY-1H-NMR. Polysaccharides after fermentation were more effectively utilized by Bifidobacterium breve and Lactobacillus plantarum than those from control samples, as demonstrated by in vitro assays. These findings highlight a promising strategy for the valorization of pomegranate peel through the production of functional ingredients highly enriched in tannins and containing potentially prebiotic polysaccharides.
Keywords:
Punica granatum L.
; by-product
; ellagitannins
; pectin
; DLS
; DOSY- 1H-NMR
; punicalagins
1. Introduction
The pomegranate fruit (Punica granatum L.) ranks among the top ten most popular fruits worldwide, and since antiquity it has been extensively used in traditional medicine across many cultures. Nowadays, pomegranate is considered a “super fruit” due to its high content of bioactive compounds, particularly anthocyanins and ellagitannins, [1,2,3,4,5,6], but also pectin concentrated in peel, can be used as functional polysaccharides [7,8]. Among the fruit components, the juice is especially rich in anthocyanins, whereas the peel contains high levels of ellagitannins, notably α+β-punicalagins [1,6]. During juice processing, large quantities of peel are generated as waste, accounting for approximately 35–50% of the total fruit weight. This by-product has attracted increasing attention as a promising raw material for the recovery of high-value compounds through simple, sustainable, and efficient processes [1].
Previous researches on different pomegranate varieties including Wonderful [1,6], have demonstrated that the peel (exocarp and mesocarp) contains not only hydrolysable tannins but also a significant amount of pectin and pectic polysaccharides, the latter characterized by a reduced percentage of galacturonic acid, demonstrating that pectin yields from pomegranate peel reach 8–12% on a dry weight basis [1,7,8]. The polysaccharides extracted from the Wonderful cultivar were mainly composed of homogalacturonan (HG), with arabinans and arabinogalactans as side chains. The galacturonic acid content was approximately 56%, with variable degrees of methylation (DM) and acylation (DA), and minor amounts of rhamnogalacturonan detected in some minor fractions [9].
Over the last decades, considerable research has focused on the extraction of phenolic compounds, mainly hydrolysable tannins as punicalagins, from pomegranate peel using a variety of techniques, including conventional solvent extraction, ultrasound-assisted extraction (UAE), hydrodynamic cavitation, and supercritical fluid extraction (SFE) [5,10]. Peel extracts obtained by MAE in water at 100 °C have shown significant in vitro antioxidant, antimicrobial, and anticancer properties [11,12]. Most of these extraction techniques, initially designed to recover phenolics, also co-extract varying amounts of pectin, which can be useful for producing powered extracts (non-hygroscopic dry samples without the need for added maltodextrins) or for use in food formulations due to its gelling ability [7]. A recent review on innovative green extraction technologies applied to pomegranate peel emphasized the scarcity of effective methods for pectin recovery [13].
During the last decade, fermentation has emerged as a promising and sustainable strategy for the valorization of agricultural by-products [13,14]. This biotechnological approach can not only enhance the nutritional and functional properties of various plant food and agricultural by-products but also promotes the release of bioactive compounds [15,16]. Scientific research has associated the consumption of fermented foods with improved health status [17].
Recently, Ezeora et al. [18] reviewed the main findings on pomegranate juice fermentation, highlighting that several studies have explored the possibility of producing: wine through fermentation [18,19,20,21], including the use of S. cerevisiae yeast to achieve ethanol concentration up to 10% [19]. Moreover, when comparing lactic acid bacteria, yeasts, and filamentous fungi, yeasts were found to significantly influence phenolic composition, taste, color and aroma of the juice [21]. On the other hand, and despite the increasing demand for sustainable and efficient methods to recover valuable molecules from agricultural by-products, studies on the fermentation of pomegranate peel alone remain limited to date [2,18]. Liu et al. [16], after peel fermentation with mixed microorganisms, observed an increase in ellagic acid concentration, while Demiray et al. [15], using S. cerevisiae and Pichia stipites, produced ethanol from the peel. In this scenario, to the best of the author’s knowledge, no studies have yet investigated the impact of microbial fermentation on the structure of tannins and pectin of pomegranate peel following fermentation induced by S. cerevisiae. Analogously, another largely unexplored research area concerns the prebiotic potential of pectin derived from fermented peel. It can be crucial to investigate whether fermentation-induced depolymerization could enhance the prebiotic activity of pomegranate polysaccharides. Using an in vitro model combined with a colonic fermentation assay, it was demonstrated that pomegranate peel powder supports the growth and survival of beneficial gut bacteria, such as Lactobacillus acidophilus, contributing to overall host health [22,23]. Yeast fermentation was able to partially degrade apple pomace pectin, reducing its molecular weight [22], while other authors provided systematic evidence that pectin-derived oligosaccharides, obtained through a reduction of their molecular weight, can positively modulate gut microbiota composition and activity [24].
This study aimed to explore for the first time the potential of fermenting pomegranate peel with Saccharomyces cerevisiae to produce tannin-rich extracts and enhance the prebiotic potential of native pectic polysaccharides. Given the objective of developing a fermentation process applicable to peel with varying origins and morphologies, two cultivars were investigated: Wonderful, the most widely cultivated variety globally, and G1, an Italian cultivar selected for its thinner peel compared to Wonderful. Three fermentation methods at room temperature were conducted for up to 72 h. A multimodal analytical approach was employed, combining HPLC-DAD for tannin profiling with advanced techniques (DOSY 1H-NMR and DLS) to monitor polysaccharide molecular weight. The potential prebiotic efficacy of polysaccharides after fermentation was demonstrated through in vitro assays with beneficial microrganisms, specifically Bifidobacterium breve and Lactobacillus plantarum.
2. Materials and Methods
2. 1. Chemicals and Reagents
Food-grade Saccharomyces cerevisiae was obtained from a local supermarket. Solvents for HPLC analyses and D2O for 1H-NMR experiments (analytical grade) were purchased from Merck (Saint Louis, MO 63,103 USA). Gallic acid (purity ≥ 99%) and ellagic acid (≥ 95%) were purchased from Extrasynthese S.A. (Lyon, Nord-Genay, France), while punicalagin (≥ 91%) was purchased from Phytolab (Vestenbergsgreuth, Germany). Maleic acid (98%) was purchased from Merck Life Science S.r.l. (Milano, Italy). Bifidobacterium breve B632 and Lactobacillus plantarum L12 strains were obtained from the microbial strain collection of the Department of Agro-Environmental Science and Technology, University of Bologna, Italy.
2. 2. Fermentation of Pomegranate Samples
The peels of two pomegranate varieties, Wonderful and G1, were collected in 2022 and dried according to previous literature [25]. Fermentation experiments were conducted in triplicate, both in the presence of commercial S. cerevisiae (Y) and in its absence (spontaneous fermentation, used as a blank control (B), as outlined in Figure 1. Commercial S. cerevisiae was added to coarsely ground peel samples at a concentration of 25 mg/g of dried peel. A constant matter-to-solvent ratio was applied for all experiments (1g/10 mL, H2O), with incubation periods of 48 and 72 h. For each fermentation method (i.e., 1N, 2PbN, 3Na), six Y and six B samples were produced, allowing for separate analysis of tannins and polysaccharides in triplicate. The three fermentation experiments were conducted as follows:
1N: Spontaneous fermentation in anaerobic conditions. Pomegranate peels were fermented with commercial yeast at 25 °C under anaerobic conditions, with agitation at 380 rpm in an incubator thermo-shaker (PST-60HL Biosan, SIA, Rīga, LV-1067, Latvia) to ensure sample homogeneity.
2PbN: Blanching Followed by Anaerobic Fermentation with S. cerevisiae. Peel samples were pre-treated by blanching at 100 °C for 2 min to inactivate endogenous enzymes and reduce microbial load. Following this, samples were inoculated at 25 °C with a commercial yeast, then incubated under the same anaerobic conditions as in experiment 1N.
3Na: Fermentation with S. cerevisiae in aerobic conditions. Peels with S. cerevisiae were incubated at 25 °C under aerobic conditions. Samples were incubated at 25 °C in tubes capped with cotton plugs to allow area exchange while preventing contamination by environmental microorganisms according to previous literature [26]. During the process, samples were vortexed for 30 s every 8-12 h to facilitate oxygen distribution, homogeneity of the sample and uniform yeast activity.
Following the completion of the anaerobic or aerobic process at 48 and 72 h, all samples were vortexed for 30 s. Ethanol production was determined by q1H-NMR experiments (see Section 2.6), along with visual observation of gas and foam formation.
2. 3. Extraction of Tannins and Polysaccharides
For the analysis of tannins, each sample was centrifuged at 14,000 rpm, and the supernatant was recovered. A 0.5 mL aliquot was diluted twice with water and analyzed by HPLC-DAD-MS. The remaining extract was freeze-dried to obtain the dry extracts (DE) (Figure 1).
Polysaccharides were extracted only from samples obtained after incubation of 72 h. Each sample was mixed with 20 mL of water and subjected to a 60-min decoction. After centrifugation at 5000 rpm for 8 min, the solution was recovered and cooled in an ice bath in the presence of 2 volumes of ethanol for 30 min. The precipitated polysaccharides were recovered by centrifugation (5000 rpm for 10 min at 4 °C), washed with 150 mL of 85% acetone with the aid of a 3-min sonication (ultrasonic cleaner at 40 kHz) to remove traces of entrapped ellagitannins, and recovered by another centrifugation step.
A decoction of unfermented peel was also performed for 60 min at 100 °C with a water/peel ratio of 1:40 g/mL, [8] to recover native polysaccharides. Precipitation and washing steps were conducted as described above. Finally, the polysaccharides were dialyzed using a nitrocellulose membrane with a 12–14 KDa cut-off (Medicell Membranes Ltd., Greenwich, London, UK) and lyophilized. The resulting dry samples were used for DLS and 1H-NMR analyses as well as for quantification of glucuronic acid amount and for the in vitro prebiotic activity assay.
2. 4. Analysis of Tannin Content
The supernatant obtained as described in Section 2.3 was used to quantify tannins in dried peel (DP) and the corresponding dry extract (DE). Tannin analysis was performed using the Agilent HP 1260L liquid chromatograph equipped with a DAD detector (Agilent Technologies, Palo Alto, CA, USA) and coupled with a core-shell Kinetex column C18 (100 × 3 mm, 2.6 μm, Phenomenex USA). Solvents used were (A) 0.1% formic acid in water (pH 3.2) and (B) CH3CN. A multistep linear solvent gradient was applied as follow: 0.1–8 min, 5–25% B; 8–18 min, 25% B; 18–20 min, 25–95% B; 20–26 min, 95% B; 26–28 min, 95–0% B, 28–32 min, 0–5% B. Flow rate was 0.4 mL/min and 10 min of equilibration time were applied. UV–Vis spectra were recorded from 200 to 500 nm. The Mass Spectrometer Detector was an HP 1260 MSD (G6125B) with an API/electrospray interface (Agilent Technologies, Palo Alto, CA, USA). The following ESI parameters were used: nitrogen flow rate 10.5 L/min, drying gas temperature 350 °C, nebulizer pressure 1811 Torr, and capillary voltage 3500 V. Acquisition was performed in negative ionization mode (150-180 V), full scan from 100 to 2000 Da.
Tannins were quantified by HPLC-DAD using five-point calibration curves for three external standards. Gallic acid (0.10-1.11 mg/mL in EtOH 80%) at 280 nm (R2 = 0.9998), used to quantify gallic acid. Ellagic acid (0.08-0.24 mg/mL in MeOH) at 350 nm (R2 = 0.9994), used to quantify ellagic acid and its derivatives. Punicalagins (0.1-0.8 mg/mL in MeOH) at 350 nm (R2 = 0.999), used to quantify punicalagins and their derivatives.
2. 5. Analyses of Polysaccharides by DLS
According to previous studies [9,25,27], Dynamic Light Scattering (DLS) measurements of polysaccharides were carried out using a Zsizer Nanoseries ZS90 (Malvern Instrument, Worcestershire, UK) at 25 °C. Samples were prepared in water at 1.25 mg/mL. Measurements included Z-average (Z-Ave, nm) as size distribution by intensity and polydispersity index (PdI), using a 90° scattering angle. Each sample was analyzed in triplicate; for each independent replicate, results were averaged over 14–19 readings. Data was processed using the 60 × 0 Malvern software package (ver. 7.2).
2. 6. Analyses of Ethanol and Polysaccharides by 1H-NMR and DOSY
1H-NMR spectra of the dialyzed polysaccharides were recorded using a 400 MHz Advance 400 spectrometer (Bruker, Bremen, Germany). To monitor the fermentation process, ethanol content was also determined via 1H-NMR obtaining the data in Table S2. Samples were analyzed after centrifugation, recovery of the supernatant, and addition of 10% D2O. Quantification was based on a calibration curve built with ethanol (99% purity) in the concentration range 0.4–2% (R2, 0.9975). The degree of methylation (DM) and acetylation (DA) of polysaccharides were determined according to guidelines and protocols previously described [27,28]. Briefly, approx. 4 mg of dialyzed polysaccharides were precisely weighed into an NMR tube and dissolved in 1 mL of 0.4 M NaOH in D2O and incubated at room temperature for 2 h. Then, 20 μL of maleic acid (5.2 mg/mL in D2O) were added as internal standard. 1H-NMR spectra were acquired and used to integrate C-methyl signals at 1.80 ppm (acetic acid), 3.22 ppm (methanol), and the internal standard singlet at 6.24 ppm. The number of moles of acetic acid and methanol were calculated using Equation (1).
n, number of moles of acetic acid or methanol
Iistd, integral of the 2 protons of ISTD
ICH3, integral of CH3 group of methanol or of acetic acid
NP, number of the protons of the methyl group of acetic acid or methanol
Nistd, number of protons for ISTD
MWistd, mw of the ISTD (116.1 g/mol)
Wistd, weight of ISTD
Pistd, purity degree of the ISTD.
For galacturonic acid (Gal-Ac) quantification, polysaccharides were hydrolyzed in 2.0 M H2SO4 in D2O at 100 °C for 2.5 h. The α-Gal-Ac and β-Gal-Ac anomeric proton signals were integrated at 5.6 ppm and 4.9 ppm, respectively. Equation 1 was applied, with n representing the number of moles of Gal-Ac and NP the number of anomeric protons for α and β forms. Degree of methylation (DM) and acetylation (DA) were calculated according to Müller-Maatsch et al. [29]:
The DOSY-1H-NMR experiments were carried out on a Bruker FT-NMR Avance III HD 600 MHz spectrometer equipped with a CryoProbe BBO H&F 5 mm (Bruker Biospin GmbH Rheinstetten, Karlsruhe, Germany). After loading the sample into the probe, 5 min were required to achieve thermal equilibrium. Afterward, the magnetic field was locked, the probe head was tuned and matched and the sample shimmed. All the experiments were performed at 300 K and non-spinning. According to previous study [30], the samples were dissolved in D2O at the concentration of 3 mg/mL and 550 μL of the solution were transferred into a WILMAD® NMR tube, 5 mm, Ultra-Imperial grade, 7 in. L, 528-PP (Sigma-Aldrich, Milan, Italy). 3-(trimethylsilyl) propionic-2,2,3,3-d4 acid sodium salt (TSP) was added and used for internal referencing. Two-dimensional diffusion-ordered spectroscopy DOSY-1H-NMR experiments were performed by using the standard Bruker “ledbpgp2s” pulse program using a longitudinal eddy current (LED) bipolar gradient pulse pair and two spoil gradients. Thirty-two gradient steps were used for the diffusion dimension, from 2 to 98% of the linear gradient amplitude, with 65.7 G/cm as maximum gradient intensity. The diffusion time (d20, Δ) was optimized for each sample and varied between 0.1 and 0.3 s. The pulse field gradient length (P30, δ) was set at 2500 μs. For all the samples, the other acquisition parameters were set as follows: number of scans, 32; gradient strength (gpz6), 100%; LED delay (d21), 5 ms and the total acquisition time 1 h and 16 min. The DOSY spectra were processed using Bayesian algorithm implemented in Mnova® 14.1.2 software (Mestrelab Research) and the coefficients of diffusion (D) were determined.
The software allowed a semi-quantitative analysis by integrating the diffusion trace (vertical axis of the 2D spectrum and f1 coordinate (https://mestrelab.com/resources-by-product/resources-nmr/dosy.html). The molecular weights of polysaccharides were calculated by using the linear regression obtained by plotting the Log D versus Log Mw of six standard dextrans with molecular weights from 20 to 500 kDa (purchased from VWR International).
2. 7. In Vitro Evaluation of Prebiotic Properties
Prebiotic activity was assessed by evaluating the effects on the growth of two human gut bacteria: Bifidobacterium breve B632 and Lactobacillus plantarum L12. The polysaccharides recovered after 72 h of fermentation of the peels with S. cerevisiae (Y), or without the yeast (B) were used as substrates. The B. breve B632 strain was cultured in TPY medium for 48 h at 37 °C, while L. plantarum L12 was cultured in MRS medium for 48 h at 37 °C, both under anaerobic conditions (Anaerocult A, Merck, Darmstadt, Germany). The growth experiment for B. breve B632 was carried out using a modified TPY medium (m-TPY) with halved amounts of growth-supporting substrates (tryptone, peptone, and yeast extract) and replacing glucose with different dry polysaccharides (see Section 2.3) at 0.5% (w/v) as the carbohydrate source. A positive growth control was performed for each condition using m-TPY with 0.5% glucose (w/v) and a negative control in m-TPY without any carbon source. The L. plantarum L12 strain was cultured using a modified MRS medium (m-MRS) with halved amounts of substrates such as peptone, yeast extract, and meat extract compared to the original medium. The potential prebiotic activity was evaluated by using the different polysaccharide samples as powder at 0.5% (w/v) in m-MRS. Positive growth control was performed using m-MRS with 0.5% glucose, while for negative control m-MRS without any carbon source was used. After 0, 12, 24, 30, and 48 h of incubation at 37 °C in an anaerobic atmosphere, the total bacterial count was performed on TPY or MRS agar, for B. breve B632 and L. plantarum L12, respectively. The plates were incubated at 37 °C under anaerobic conditions for 48 h and the results expressed as colony forming units per milliliter (CFU/mL). Each test was performed in triplicate.
2. 8. Statistical Evaluation
A three-way ANOVA was conducted on tannin content and extract yield to assess the effects of treatment (Tr), fermentation type (TyF), and fermentation time (ST), including two- and three-way interactions. To find out the significance of the differences among samples data, Fisher Least Significant Difference (LSD) post hoc comparison at p < 0.05 was carried out. ANOVA and LSD analyses were carried out using OriginPro 2023b (Northampton, Massachusetts, USA). Prebiotic activity data were analyzed via one-way ANOVA in R software (www.r-project.org) with significance threshold set at p ≤ 0.05. Homogeneous groups were determined using Tukey’s HSD test.
3. Results and Discussion
3.1. Fermentation Trials on Pomegranate Peels with and Without Addition of S. cerevisiae
Three simple processes with S. cerevisiae were applied to pomegranate peel with the aim of producing aqueous extracts enriched in tannins and lower-molecular-weight pectic polysaccharides compared to the native peel polysaccharides. A parallel spontaneous fermentation was carried out without the addition of yeast (B samples) to assess the actual impact of S. cerevisiae on the chemical composition of the final extracts. Several reasons underpinned the choice of this yeast: i) it is inexpensive, widely available, and commonly used in domestic preparations; ii) only limited data is available on the use of S. cerevisiae for pomegranate peel fermentation, and only for different purposes; iii) the effects of fermentation with S. cerevisiae on pomegranate tannins and peel polysaccharides have not been previously studied. The applied processes were conducted under the experimental conditions summarized in Figure 1. For monitoring fermentation, ethanol production was determined by q1H-NMR, analyzing the solution collected after fermentation and centrifugation of both Y and B samples, after the addition of 10% D2O. In previous research [31], authors fermented pomegranate peel using S. cerevisiae, but the goal was only the optimization of bioethanol production (reaching up to 12.9 g/L yield) and not the recovery of bioactive compounds. In such a study, the authors pre-treated the peel with hot water (115 °C for 40 min), and fermentation was supported by the addition of specific carbon/nitrogen sources (e.g., glucose, sucrose, meat peptone). In contrast, the present study was aimed at employing only S. cerevisiae to ferment the dried peel as is, without supplementation of any external nutrients.
For the applied starter strains, namely S. cerevisiae, or other beneficial bacteria, fermentation times of five days are often adopted to ensure optimal growth and metabolite production, as well as efficient breakdown of complex polysaccharides and other compounds into simpler molecules [2,32,33]. In preliminary tests, fermentation up to 96 h showed no changes compared to 72 h. Monitoring ethanol production confirmed that fermentation was essentially complete at 72 h, with only minimal ethanol increases observed in comparison to the incubation of 48 h. In light of these results, a maximum time of 72 h was chosen for subsequent experiments. Regarding the inoculum, unlike previous authors [31] who used 30 g/L of S. cerevisiae to ferment pomegranate peel, the present study used a significantly lower yeast amount (2.5 g/L), comparable to that typically used for bread dough preparation.
The 1N method was chosen to evaluate spontaneous fermentation by the natural microbiota under anaerobic conditions. Conversely, the 3Na method allowed for the evaluation of the effect of a free oxygen exchange with the sample, taking into account the ability of S. cerevisiae cells of perform ethanol fermentation in the presence of oxygen, a phenomenon known as the Crabtree effect, which shapes the S. cerevisiae lag phase during the switch between different carbon source. Such fermentation in aerobic conditions is frequently described in the literature [26,34,35].
Finally, the 2PbN method included a short blanching step at 100 °C to partially denature endogenous peel enzymes and inactivate naturally present microorganisms, followed by fermentation with S. cerevisiae strain.
3. 2. Tannin Content in Dry Peel (DP) and Dry Extracts (DE)
The supernatants recovered from the three fermentation methods contained tannins, as these are highly water-soluble molecules, whereas polysaccharides were not co-extracted, as their recovery requires hot water extraction (Figure 1). The tannin profiles of the samples collected after 48 and 72 h of fermentation showed excellent reproducibility among samples both in blank samples and samples with yeast (Figure S1). Overall, for each variety, the similarity of tannin profiles among samples with and without yeast across the three methods, even after 72 h and regardless of preliminary peel bleaching (2PbN) or open-air conditions (3Na), indicated that S. cerevisiae did not alter the tannin composition.
The dry extract (DE), obtained by freeze-drying the supernatant, yielded between 28% and 50% relative to the dry peel (Figure 2). Regardless of the fermentation method, in both varieties the yield was significantly lower in samples fermented with S. cerevisiae compared to the corresponding blank samples, likely due to the microbial consumption of part of peel components such as free sugars, mineral salts, proteins. Notably is the difference between B and Y samples: only the extracts from S. cerevisiae appeared as a manageable powder, whereas the corresponding dry extracts from black samples were much more hygroscopic due to their higher free sugars content. Furthermore, ethanol and other organic acids were detected exclusively in the samples with S. cerevisiae as confirmed by 1H-NMR spectra.
To further explore the impact on individual phenolic compounds, samples with and without yeast were compared for each method, assessing the effect of treatment (blank vs. yeast), type of fermentation (1-N, 2-PbN, 3-Na) and fermentation time (48, 72 h) (Figure 3A, Table S1). Gallic and ellagic acids were minor phenols in the peel, with maximum concentrations of approx. 15 mg/g DP for the Wonderful variety. When expressed on DP, little to no significant differences were observed between blank and yeast-treated samples for either variety (Table S1). In contrast, concentration expressed on DE showed highly significant increases in the yeast-treated samples, particularly in the Wonderful variety, across all fermentation methods.
Punicalins and punicalagins (the main tannins in pomegranate) followed a similar trend to phenolic acids (Figure 3B, Table S1). When expressed on DP, a slight but statistically significant effect of the treatment (blank vs. yeast) was observed for punicalins only in G1 samples, while for punicalagins, small yet significant differences were observed in both varieties. However, when expressed on DE, the differences were highly significant in both varieties. The 2-PbN sample from the Wonderful variety exhibited a reduced punicalin content and increased punicalagins levels, suggesting that blanching partially denatured hydrolytic enzymes such as peel esterase. Since in Wonderful variety the conversion of punicalins to punicalagins has occurred in both B and Y samples, it was hypothesized that this transformation was mainly mediated by endogenous enzymes in the peel and not by S. cerevisiae. The G1 variety displayed a different pattern, suggesting lower esterase in its peel.
Total tannin content expressed on DP was similar across fermented samples within each variety, with only small statistically significant differences in some cases (Figure 3C). The dry extracts from samples fermented with S. cerevisiae showed high % of total phenols: 60-70% for Wonderful and 50-70% for G1. The higher phenolic content in these samples, compared to the blanks, can be attributed to the reduced co-presence of other soluble components (e.g., oligosaccharides, mineral salts, proteins), that were consumed during fermentation. For all the three methods, the amount of tannins expressed on DP remained consistent in the Wonderful variety, regardless of yeast addition. Similarly, in the G1 variety, only minor and non-significant differences were found between blanks and yeast samples. Total tannin content in the peel ranged 110-180 mg/g for Wonderful and 140-180 mg/g for G1, with maximum recovery at 72 h.
In line with the trends of individual phenols, total phenol content in DE differed significantly between yeast-treated and blank samples: after 48 and 72 h, yeast-treated samples contained approximately 50% more phenols than the corresponding blanks (Figure 3C). This trend was consistent in both the Wonderful and G1varieties.
It is worth noting that the quality of a botanical extract is determined by the concentration of bioactive compounds in the final product. Therefore, it can be concluded that a simple 2–3-day fermentation with S. cerevisiae can significantly enhance the commercial value of pomegranate peel dry extracts, without causing degradation or loss of the native tannins.
3. 3. Chemical and Biological Properties of Polysaccharides
Decoction was applied as effective method for recovering the polysaccharides after fermentation, since they are usually extracted using hot water, and then precipitated adding ethanol [1,8]. Since the objective was to assess whether fermentation with S. cerevisiae could reduce the molecular weight of pectin, the longest fermentation time, which was expected to favor the breakdown of these complex structures, was chosen for polysaccharides collection (Figure 1).
3.1.1. Extraction Yields
As a first step, the yields (%) of precipitated polysaccharides from Y and B samples were compared (Table 1). For each fermentation method, the highest polysaccharides yield in Wonderful variety were observed in the blank samples (ranging from 8.3 to 10% on a DP basis), while samples fermented with yeast showed lower yields (6.2% to 7.1%). A similar trend was observed in the G1 variety, except for sample Y-1N, which showed a slightly lower yield than its corresponding blank (B-1N). The polysaccharide content reported in Table 1, often expressed in the literature as pectin percentage, was consistent with previously reported values data for the Wonderful variety, which ranged from 8 to 12% on a dry weight basis [7,8,9,36].
3.1.2. DLS Analysis
Polysaccharides extracted from unfermented peel by decoction (W-Dec and G1-Dec) were used as reference samples to compare the molecular weight of native pomegranate pectin with those obtained after fermentation. DLS analysis was applied as preliminary screening for estimating molecular dimensions of polysaccharides in water and detecting the co-presence of structures of different sizes [25,27]. DLS spectra revealed that all Wonderful samples contained one predominant polysaccharide peak (Pk1), accounting for 89-100% of the total area. Overall, the data in Table 2 indicated that fermentation reduces the molecular weight of polysaccharide, as already reported by Liu et al. [22], for both varieties. The Pk1 of W-Dec sample had the largest size, 1059 ± 186 nm, consistent with previous findings on the Wonderful variety [25], while polysaccharides from unfermented G1 sample measured 908 nm. The main polysaccharides from fermented samples using the 1N and 3Na methods, both with and without yeast, were smaller compared to native polysaccharides in W-Dec and G1-Dec, ranging 282-361 nm for Wonderful and 329-461 nm for G1. The only exceptions were the blank samples from the 2PbN method (W-B-2PbN and G1-B-2PbN), which had Pk1 values comparable to those of the unfermented reference samples (W-Dec and G1-Dec). This suggests that rapid blanching of the peel prior to fermentation partially inactivated hydrolytic enzymes of polysaccharides, resulting in negligible molecular weight reduction. In contrast, the addition of S. cerevisiae after blanching, under the same experimental conditions, counteracted this effect resulting in a significant reduction in Pk1 size for W-Y-2PbN (563 nm) and G1- Y-2PbN (498 nm).
3.1.3. 1H-NMR analysis
To characterize the polysaccharides collected after fermentation, 1H-NMR analyses were performed after chemical hydrolysis to determine the content of galacturonic acid (%) and the degree of acylation (DA) and methylation (DM) (Table 3).
3.1.4. DOSY Experiments on Polysaccharides
2D-DOSY-NMR experiments provide the diffusion coefficients (D) of molecules in solution by applying increasing magnetic field gradient strength to track their translational motions, which depend on the molecular size, and have been applied for studying the molar mass or hydrodynamic volume of polysaccharides and their oligomers. In particular, the study of commercial dextran from Leuconostoc spp demonstrated that DOSY analysis can be used to estimate the size of dextrans in aqueous solution even at high molecular weight [37], or used to determine the molecular mass of arabinogalactan and of a new immunostimulatory polysaccharide from Chlorella pyrenoidos [38]. DOSY was also applied to monitor the production of oligomers by enzymatic hydrolysis of ulvan from Ulva Lactuca [30].
In this study DOSY-1H-NMR experiments were conducted to obtain information on the presence of different populations of polysaccharides, particularly to point out the presence of polymers with lower molecular weight not detectable by DLS. Since the D of a molecule is affected by the physical properties of the surrounding environment such as the viscosity, DOSY experiments were performed on diluted solutions. Furthermore, since high dilution of polysaccharides with large molecular weight is not applicable, the performance, accuracy, and reproducibility of DOSY measurements are defined by the quality of the spectra along with the intensity decay curve. An optimal concentration of 3 mg/mL was identified to provide a satisfactory signal-to-noise ratio across the increasing gradient strength steps. At this concentration, the D was comparable to that obtained from a more diluted solution of the same polysaccharide, confirming the reliability of the determination and excluding viscosity-related effects.
For each experiment, the vertical trace was extracted, the area of each diffusion peak was determined, and the relative abundance percentage was calculated obtaining the distribution shown in Table 4.
DOSY results confirmed that polysaccharides from W-Dec were homogeneous in size, with a molecular weight tentatively estimated at around 700 KDa. In contrast, polysaccharides from G1-Dec were more heterogeneous, with two major populations around 500 and 360 KDa, and additional species below 20 KDa. Examination of fermented samples showed that all fermentation conditions led to a reduction in molecular weight compared to native polysaccharides (W-Dec and G1-Dec). Unlike DLS, DOSY experiments displayed the presence of several additional polysaccharides at reduced molecular weight (below 72 KDa) in almost all fermented samples, confirming greater performance of DOSY analysis for polysaccharides characterization, while DLS can be used as a reliable preliminary screening tool. Indeed, testing dextrans with different molecular weights confirmed that 150 KDa was the lower limit of molecular weight determinable by DLS.
The polysaccharides pattern resulting from the three fermentation methods was different between the two varieties, possibly due to differences in peel thickness, thicker in Wonderful and thinner in G1. In Wonderful, fermentation under air-exposure conditions (3Na) completely reduced the size of native polysaccharides, yielding 59% in the 72-50 KDa range in blank samples and 65% in the 159-91 KDa range in yeast-fermented samples. The highest concentration of polysaccharides with molecular weight lower than 159 Da was observed in G1-B-1N sample (sum 76%), confirming extensive depolymerization of G1 pectin under these conditions.
For each fermentation method, comparable depolymerization patterns were observed in both blank and S. cerevisiae-fermented samples. In particular, the highest amounts of populations below 20 KDa in G1 were found in the three blank samples (Table 4). The photograph provided by the DOSY spectra of the samples after fermentation highlighted the strong reduction in molecular weight suggesting a prebiotic potential of these polysaccharides. This hypothesis is supported by two recent studies which demonstrated prebiotic properties of oligosaccharides produced after hydrolysis of pomegranate pectin. Devecioglu et al. (2024) showed that enzymatic hydrolysates of pomegranate pectin promoted the growth of Levilactobacillus brevis and enhanced the production of γ-aminobutyric acid [36]. Similarly, Bachari et al. [39] demonstrated that ultrasonic treatment induced partial hydrolysis of pomegranate peel pectin, significantly reducing its molecular weight and promoting the growth of Bifidobacterium longum and Lactobacillus casei
3.1.5. In Vitro Prebiotic Activity on B. breve and L. plantarum
To investigate the prebiotic properties of pomegranate peels on beneficial gut bacteria, the ability of B. breve B632 and L. plantarum L12 strains to use polysaccharides extracted from both fermented and non-fermented pomegranate peels as carbon source was investigated. Bacterial growth on these substrates was compared with that observed on glucose (used as a positive control, as it is a readily fermentable carbon source) and on a sugar-free medium (used as a negative controls). Both Bifidobacterium and Lactobacillus strains are known to compete with enteric pathogens for nutrients and adhesion sites on the intestinal mucosa, while also stimulating the development of the mucosal immune system [40,41]. Furthermore, B. breve B632 is known for its anti-inflammatory activity and ability to colonize the human gut as well as for the capacity to protect the gut epithelial integrity [42].
The results of the prebiotic activity assays with B. breve B632 strain are shown in Table 5. In the presence of glucose, a 1×10² CFU/mL increase was observed after 12 h compared to time 0, reaching 3.5±0.21×10⁸ CFU/mL. Cell counts slightly increased after 24 h, approaching a growth plateau. At 12 h, all other fermented polysaccharide growth substrates showed bacterial concentrations around 107 CFU/mL—lower than with glucose, but higher than at time 0, and significantly greater than the negative control (no carbon source). Fermented samples also showed higher cell counts than those of the native polysaccharides from non-fermented samples (Dec-W and Dec-G1). After 24 h, notable differences emerged among samples: in both varieties, all samples fermented with S. cerevisiae exhibited higher cell counts (108 CFU/mL) compared to samples fermented without yeast inoculation (107 CFU/mL). Thus, S. cerevisiae-inoculated fermentation produced better prebiotic outcomes than spontaneous fermentation. The highest growth was observed in the W-Y-3Na sample and G1-Y-3Na samples, reaching 109 CFU/mL at 30 h, even exceeding the positive control with glucose. After 48 h, a slight decrease in growth was observed across all samples. Notably, the unfermented samples (i.e., Dec-W and Dec-G1) exhibited significantly lower increase in the bacterial growth.
Regarding L. plantarum L12 (Table 6), high growth was also observed with glucose after 12 h (8.5±0.15×10⁸ CFU/mL), reaching a maximum at 24 h (8.3±0.16 ×10⁹ CFU/mL) before reaching a plateau. Similar to the previous case, all samples fermented with S. cerevisiae exhibited higher cell counts compared to samples fermented without yeast inoculation (B, blank samples). High growth occurred in the W-Y-3Na and G1-Y-3Na samples after 12 h, with cell count of 3.4 ± 0.2 × 10⁸ CFU/mL and 4.3 ± 0.2 × 10⁸ CFU/mL respectively. All S. cerevisiae-fermented after 24 h of incubation, reached 108 or 109 CFU/mL after 30 h. Yeast-free samples (B) showed lower growth at all times than yeast-inoculated samples. Again, the sample with no carbon source and those from unfermented peel (Dec-W and Dec-G1), exhibited a similar growth but significantly lower compared to blank samples from fermentation. Although slightly higher growth was observed in G1 samples throughout the experiment, no significant differences were found between the different fermentation conditions.As for the B. breve strain, L. plantarum growth was higher in yeast-fermented samples compared with those undergoing spontaneous fermentation, with the highest values observed for 3Na method (open-air samples). These results, reached testing two different probiotic microorganisms on samples from two different pomegranate varieties, highlighted the importance to combine S. cerevisiae inoculation and sample’s air exposure to enhance the prebiotic potential of polysaccharides from fermented peel, suggesting that the health-promoting potential of pomegranate peel pectin can be enhanced through fermentation. One of the primary symbiotic functions of the human gut microorganisms is the degradation of complex substrates such as polysaccharides and the provision of directly usable by the host metabolites such as short-chain fatty acids. Lactobacillus and Bifidobacterium spp. employ distinct strategies to convert glycans into beneficial forms to the host [43]. In particular, fermentation with S. cerevisiae under aerobic conditions may release partially digested polysaccharides with lower molecular weight, making them more accessible substrates for human microbial fermentation. Further studies are needed to clarify the structural differences between polysaccharides from peel samples fermented with and without S. cerevisiae, which appear to play a role in modulating the growth of these two beneficial microorganisms.
4. Conclusions
The ultimate aim of this study was to propose an innovative strategy for transforming this by-product into high-value functional ingredients for use in nutraceuticals, thereby supporting both environmental and economic sustainability. The three fermentation methods investigated exhibited excellent reproducibility at laboratory scale and the obtained extracts resulted in very similar tannin contents across samples, with only minor differences observed between those fermented with or without S. cerevisiae. Fermentation did not alter the chemical structure of the tannins, but S. cerevisiae led to a marked increase in total phenolic content in the final extracts through the consumption of oligosaccharides and other fermentable nutrients.
The use of Diffusion-Ordered Spectroscopy Proton Nuclear Magnetic Resonance combined with dynamic light scattering to investigate the depolymerisation of pomegranate pectin allowed monitoring fermentation-induced modifications in peel polysaccharides. Both techniques revealed significant molecular weight reduction of native pectin after fermentation. In particular, DLS proved to be a valuable and rapid screening method for tracking polysaccharide hydrolysis, while DOSY-1H-NMR showed the presence of distinct oligomer and polymer populations after fermentation.
All the applied fermentation methods significantly reduced pectin size compared to the native structures. This reduction likely explains the improved prebiotic potential observed using selected Bifidobacterium breve and Lactobacillus plantarum strains. Notably, aerobic fermentation has shown strong potential for future scale-up, due to its simplicity, low water and energy demand, and minimal operational steps. This process offers a sustainable and economically viable solution for transforming this agri-food by-product into high-value functional ingredients suitable for nutraceutical applications.
Supplementary Materials
The following supporting information can be downloaded at: https://www.mdpi.com/article/doi/s1, Figure S1: Profiles at 370 nm of the triplicates of samples from G1 variety after 48 h of fermentation: B, blank sample and Y sample with yeast. Table S1. Data processing of the main tannins analyzed for Wonderful (A) and G1 (B) varieties. For each variable, results from three-factor ANOVA are reported, where the factors are the treatment (Tr), the type of fer-mentation (TyF) and the fermentation time (ST). The two-way and three-way interactions are also reported. Table S2. Percentage of ethanol after fermentation by Saccharomyces c, at 48 hrs and 72 hrs.
Author Contributions
Conceptualization: M.K and N.M; methodology: M.K. and M.B.; software, L.C.; validation: M.K., N.M., M.B. and L.C.; formal analysis: L.C.; investigation, B.Z., S.d.A., D.B., E.T., E.P., and D.d.G.; resources, N.M., D.B. and D.d.G.; data curation, M.K., L.C., M.B., B.Z. and E.P.; writing—original draft preparation, M.K., L.C., D.B., D.d.G. and N.M.; writing—review and editing: M.K., L.C., D.B., D.d.G. and N.M.; visualization: M.B., E.T., S.d.A., E.P. and B.Z.; supervision: N.M.; project administration: N.M.; funding acquisition: N.M. All authors have read and agreed to the published version of the manuscript.
Funding
This research was supported by the Italian Ministry of Education, University and Re-search (MIUR) and funded by European Union—Next Generation EU (project PRIN2022 MUR, N° 2022X3WZAF). The APC was funded by project PRIN2022 MUR, N° 2022 × 3WZAF.
Data Availability Statement
The data presented in this study are available in the article.
Conflicts of Interest
Authors declared no conflict of interest.
Abbreviations
The following abbreviations are used in this manuscript:
| UAE | ultrasound-assisted extraction |
| MAE | microwave-assisted extraction |
| SFE | supercritical fluid extraction. |
| DE | dry extract. |
| DP | dry peel |
| HPLC-DAD | high-performance liquid chromatography-diode array detector. |
| DOSY-1H-NMR | Diffusion-Ordered Spectroscopy-proton Nuclear Magnetic Resonance. |
| DLS | dynamic light scattering. |
References
- Balli, D.; Cecchi, L.; Khatib, M.; Bellumori, M.; Cairone, F.; Carradori, S.; Zengin, G.; Cesa, S.; Innocenti, M.; Mulinacci, N. Characterization of Arils Juice and Peel Decoction of Fifteen Varieties of Punica Granatum L.: A Focus on Anthocyanins, Ellagitannins and Polysaccharides. Antioxidants 2020, 9. [Google Scholar] [CrossRef]
- Buenrostro-Figueroa, J.J.; Nevárez-Moorillón, G.V.; Chávez-González, M.L.; Sepúlveda, L.; Ascacio-Valdés, J.A.; Aguilar, C.N.; Pedroza-Islas, R.; Huerta-Ochoa, S.; Arely Prado-Barragán, L. Improved Extraction of High Value-Added Polyphenols from Pomegranate Peel by Solid-State Fermentation. Fermentation 2023, 9. [Google Scholar] [CrossRef]
- Grillo, G.; Capaldi, G.; Radošević, K.; Jakopović, Ž.; Markov, K.; Brncic, M.; Gallina, L.; Calcio Gaudino, E.; Cravotto, G. Unlocking the Bioactive Potential of Pomegranate Peels: A Green Extraction Approach. Antioxidants 2023, 12. [Google Scholar] [CrossRef] [PubMed]
- Hegazi, N.M.; El-Shamy, S.; Fahmy, H.; Farag, M.A. Pomegranate Juice as a Super-Food: A Comprehensive Review of Its Extraction, Analysis, and Quality Assessment Approaches. Journal of Food Composition and Analysis 2021, 97. [Google Scholar] [CrossRef]
- Lampakis, D.; Skenderidis, P.; Leontopoulos, S. Technologies and Extraction Methods of Polyphenolic Compounds Derived from Pomegranate (Punica Granatum) Peels. a Mini Review. Processes 2021, 9, 1–14. [Google Scholar] [CrossRef]
- Mulinacci, N.; Khatib, M.; Innocenti, M.; Giuliani, C.; Al- Tamimi, A.; Romani, A. Mesocarp and Exocarp of Laffan and Wonderful Pomegranate Varieties: By-Products as a Source of Ellagitannins. International Journal of Food and Nutritional Science 2017, 4, 60–66. [Google Scholar] [CrossRef]
- Abid, M.; Cheikhrouhou, S.; Renard, C.M.G.C.; Bureau, S.; Cuvelier, G.; Attia, H.; Ayadi, M.A. Characterization of Pectins Extracted from Pomegranate Peel and Their Gelling Properties. Food Chem 2017, 215, 318–325. [Google Scholar] [CrossRef]
- Khatib, M.; Giuliani, C.; Rossi, F.; Adessi, A.; Al-Tamimi, A.; Mazzola, G.; Di Gioia, D.; Innocenti, M.; Mulinacci, N. Polysaccharides from By-Products of the Wonderful and Laffan Pomegranate Varieties: New Insight into Extraction and Characterization. Food Chem 2017, 235, 58–66. [Google Scholar] [CrossRef]
- Balli, D.; Khatib, M.; Cecchi, L.; Adessi, A.; Melgarejo, P.; Nunes, C.; Coimbra, M.A.; Mulinacci, N. Pomegranate Peel as a Promising Source of Pectic Polysaccharides: A Multi-Methodological Analytical Investigation. Food Chem 2022, 397. [Google Scholar] [CrossRef]
- D’Agostino, S.; Cecchi, L.; Khatib, M.; Domizio, P.; Zoccatelli, G.; Civa, V.; Mainente, F.; Breschi, C.; Ugolini, T.; Meneguzzo, F.; et al. 1H-NMR, HPSEC-RID, and HPAEC-PAD Characterization of Polysaccharides Extracted by Hydrodynamic Cavitation from Apple and Pomegranate By-Products for Their Valorization: A Focus on Pectin. Processes 2024, 12. [Google Scholar] [CrossRef]
- Parisio, C.; Lucarini, E.; Micheli, L.; Toti, A.; Khatib, M.; Mulinacci, N.; Calosi, L.; Bani, D.; Mannelli, L.D.C.; Ghelardini, C. Pomegranate Mesocarp against Colitis-Induced Visceral Pain in Rats: Effects of a Decoction and Its Fractions. Int J Mol Sci 2020, 21, 1–16. [Google Scholar] [CrossRef]
- Tortora, K.; Femia, A. Pietro; Romagnoli, A.; Sineo, I.; Khatib, M.; Mulinacci, N.; Giovannelli, L.; Caderni, G. Pomegranate By-Products in Colorectal Cancer Chemoprevention: Effects in Apc-Mutated Pirc Rats and Mechanistic Studies In Vitro and Ex Vivo. Mol Nutr Food Res 2018, 62. [Google Scholar] [CrossRef]
- Faria, G.M.L.; Silva, E.K. Pulsed Electric Field, Ultrasound and Microwave Heating Based Extraction Techniques for Valorization of Pomegranate Peel by-Products: A Review. J Environ Chem Eng 2024, 12. [Google Scholar] [CrossRef]
- Xu, R.; Chen, J.; Yan, N.; Xu, B.; Lou, Z.; Xu, L. High-Value Utilization of Agricultural Residues Based on Component Characteristics: Potentiality and Challenges. Journal of Bioresources and Bioproducts 2025, 10, 271–294. [Google Scholar] [CrossRef]
- Demiray, E.; Karatay, S.E.; Dönmez, G. Evaluation of Pomegranate Peel in Ethanol Production by Saccharomyces Cerevisiae and Pichia Stipitis. Energy 2018, 159, 988–994. [Google Scholar] [CrossRef]
- Liu, H.M.; Xu, P.F.; Cheng, M.Y.; Lei, S.N.; Liu, Q.L.; Wang, W. Optimization of Fermentation Process of Pomegranate (Punica Granatum l.) Peel and Schisandra Chinensis (Turcz.) Baill and the Biological Activities of Fermentation Broth: Antioxidant Activity and Protective Effect against H2o2-Induced Oxidative Damage in Hacat Cells. Molecules 2021, 26. [Google Scholar] [CrossRef]
- Siddiqui, S.A.; Erol, Z.; Rugji, J.; Taşçı, F.; Kahraman, H.A.; Toppi, V.; Musa, L.; Di Giacinto, G.; Bahmid, N.A.; Mehdizadeh, M.; et al. An Overview of Fermentation in the Food Industry—Looking Back from a New Perspective. Bioresour Bioprocess 2023, 10. [Google Scholar] [CrossRef]
- Ezeora, K.C.; Setati, M.E.; Fawole, O.A.; Opara, U.L. Pomegranate Wine Production and Quality: A Comprehensive Review. Fermentation 2024, 10. [Google Scholar] [CrossRef]
- Berenguer, M.; Vegara, S.; Barrajón, E.; Saura, D.; Valero, M.; Martí, N. Physicochemical Characterization of Pomegranate Wines Fermented with Three Different Saccharomyces Cerevisiae Yeast Strains. Food Chem 2016, 190, 848–855. [Google Scholar] [CrossRef] [PubMed]
- Gumienna, M.; Szwengiel, A.; Górna, B. Bioactive Components of Pomegranate Fruit and Their Transformation by Fermentation Processes. European Food Research and Technology 2016, 242, 631–640. [Google Scholar] [CrossRef]
- Valero-Cases, E.; Nuncio-Jáuregui, N.; Frutos, M.J. Influence of Fermentation with Different Lactic Acid Bacteria and in Vitro Digestion on the Biotransformation of Phenolic Compounds in Fermented Pomegranate Juices. J Agric Food Chem 2017, 65, 6488–6496. [Google Scholar] [CrossRef]
- Liu, S.; Hu, J.; Zhong, Y.; Hu, X.; Yin, J.; Xiong, T.; Nie, S.; Xie, M. A Review: Effects of Microbial Fermentation on the Structure and Bioactivity of Polysaccharides in Plant-Based Foods. Food Chem 2024, 440. [Google Scholar] [CrossRef]
- Mall, U.P.; Patel, V.H. Evaluation of Pomegranate (Punica Granatum) Peel for Bioaccessibility of Polyphenols and Prebiotic Potential Using in Vitro Model. Food Chemistry Advances 2023, 2. [Google Scholar] [CrossRef]
- de Oliveira, D.P.; Todorov, S.D.; Fabi, J.P. Exploring the Prebiotic Potentials of Hydrolyzed Pectins: Mechanisms of Action and Gut Microbiota Modulation. Nutrients 2024, 16. [Google Scholar] [CrossRef]
- Cecchi, L.; Khatib, M.; Bellumori, M.; Civa, V.; Domizio, P.; Innocenti, M.; Balli, D.; Mulinacci, N. Industrial Drying for Agrifood By-Products Re-Use: Cases Studies on Pomegranate Peel (Punica Granatum L.) and Stoned Olive Pomace (Pâtè, Olea Europaea L.). Food Chem 2023, 403. [Google Scholar] [CrossRef] [PubMed]
- Jakati, S.V.; Gogineni, R.; Aley, M.S.; Chachada, A.; Atram, H.K.; Mankar, M. Glass Bead Sterilizer Comprehensively Defeats Hot Air Oven in Orthodontic Clinic. Journal of Indian Orthodontic Society 2015, 49, 134–138. [Google Scholar] [CrossRef]
- Khatib, M.; Al-Tamimi, A.; Cecchi, L.; Adessi, A.; Innocenti, M.; Balli, D.; Mulinacci, N. Phenolic Compounds and Polysaccharides in the Date Fruit (Phoenix Dactylifera L.): Comparative Study on Five Widely Consumed Arabian Varieties. Food Chem 2022, 395. [Google Scholar] [CrossRef]
- Ammon, J.; Andlauer, C.; Annweiler, E.; Bauer-Aymanns, H.; Bunzel, M.; Burgmaier-Thielert, E.; Brzezina, T.; Christoph, N.; Dietrich, H.; Dohr, A.; et al. Guide to NMR Method Development and Validation-Part II: Multivariate Data Analysis.
- Müller-Maatsch, J.; Caligiani, A.; Tedeschi, T.; Elst, K.; Sforza, S. Simple and Validated Quantitative 1H NMR Method for the Determination of Methylation, Acetylation, and Feruloylation Degree of Pectin. J Agric Food Chem 2014, 62, 9081–9087. [Google Scholar] [CrossRef]
- Zonfrillo, B.; Bellumori, M.; Truzzi, E.; Khatib, M.; Faraoni, P.; Bertelli, D.; Ranaldi, F.; Mulinacci, N. Ulvan as a Source of Oligosaccharides for Biological Applications: Enzymatic Hydrolysis in a Biocompatible Medium. Food Chem 2025, 492. [Google Scholar] [CrossRef]
- Mazaheri, D.; Orooji, Y.; Mazaheri, M.; Moghaddam, M.S.; Karimi-Maleh, H. Bioethanol Production from Pomegranate Peel by Simultaneous Saccharification and Fermentation Process. Biomass Convers Biorefin 2021. [Google Scholar] [CrossRef]
- Caballero, V.; Estévez, M.; Tomás-Barberán, F.A.; Morcuende, D.; Martín, I.; Delgado, J. Biodegradation of Punicalagin into Ellagic Acid by Selected Probiotic Bacteria: A Study of the Underlying Mechanisms by MS-Based Proteomics. J Agric Food Chem 2022, 70, 16273–16285. [Google Scholar] [CrossRef]
- Chaudhary, A.; Hussain, Z.; Aihetasham, A.; El-Sharnouby, M.; Abdul Rehman, R.; Azmat Ullah Khan, M.; Zahra, S.; Saleem, A.; Azhar, S.; Alhazmi, A.; et al. Pomegranate Peels Waste Hydrolyzate Optimization by Response Surface Methodology for Bioethanol Production. Saudi J Biol Sci 2021, 28, 4867–4875. [Google Scholar] [CrossRef]
- Mensah, J.K.M.; Twumasi, P. Use of Pineapple Waste for Single Cell Protein (SCP) Production and the Effect of Substrate Concentration on the Yield. J Food Process Eng 2017, 40. [Google Scholar] [CrossRef]
- Perez-Samper, G.; Cerulus, B.; Jariani, A.; Vermeersch, L.; Simancas, N.B.; Bisschops, M.M.M.; van den Brink, J.; Solis-Escalante, D.; Gallone, B.; De Maeyer, D.; et al. The Crabtree Effect Shapes the Saccharomyces Cerevisiae Lag Phase during the Switch between Different Carbon Sources. mBio 2018, 9, 1–18. [Google Scholar] [CrossRef] [PubMed]
- Devecioglu, D.; Kara, D.; Tapan, R.; Karbancioglu-Guler, F.; Kahveci, D. Enhanced Production of Gamma-Aminobutyric Acid in Fermented Carrot Juice by Utilizing Pectin Hydrolysate Derived from Pomegranate Waste. Food Sci Nutr 2024, 12, 6534–6547. [Google Scholar] [CrossRef]
- Maina, N.H.; Pitkänen, L.; Heikkinen, S.; Tuomainen, P.; Virkki, L.; Tenkanen, M. Challenges in Analysis of High-Molar Mass Dextrans: Comparison of HPSEC, AsFlFFF and DOSY NMR Spectroscopy. Carbohydr Polym 2014, 99, 199–207. [Google Scholar] [CrossRef]
- Suárez, E.R.; Syvitski, R.; Kralovec, J.A.; Noseda, M.D.; Barrow, C.J.; Ewart, H.S.; Lumsden, M.D.; Grindley, T.B. Immunostimulatory Polysaccharides from Chlorella Pyrenoidosa. A New Galactofuranan. Measurement of Molecular Weight and Molecular Weight Dispersion by DOSY NMR. Biomacromolecules 2006, 7, 2368–2376. [Google Scholar] [CrossRef]
- Bachari, S.; Ghaderi-Ghahfarokhi, M.; Gavlighi, H.A.; Zarei, M. Ultrasonic Depolymerization of Pomegranate Peel Pectin: Effect of Sonication Time on Antioxidant, α-Amylase Inhibitory, and Prebiotic Properties. Food Chem X 2024, 24. [Google Scholar] [CrossRef]
- Grzesiuk, E.; Jankowska, A.; Laubitz, D.; Antushevich, H.; Zabielski, R. Competition of Lactobacillus Paracasei with Salmonella Enterica for Adhesion to Caco-2 Cells. J Biomed Biotechnol 2008, 2008. [Google Scholar] [CrossRef]
- Symonds, E.L.; O’Mahony, C.; Lapthorne, S.; O’Mahony, D.; Sharry, J. Mac; O’Mahony, L.; Shanahan, F. Bifidobacterium Infantis 35624 Protects against Salmonella-Induced Reductions in Digestive Enzyme Activity in Mice by Attenuation of the Host Inflammatory Response. Clin Transl Gastroenterol 2012, 3. [Google Scholar] [CrossRef] [PubMed]
- Aloisio, I.; Prodam, F.; Giglione, E.; Bozzi Cionci, N.; Solito, A.; Bellone, S.; Baffoni, L.; Mogna, L.; Pane, M.; Bona, G.; et al. Three-Month Feeding Integration With Bifidobacterium Strains Prevents Gastrointestinal Symptoms in Healthy Newborns. Front Nutr 2018, 5. [Google Scholar] [CrossRef]
- Koropatkin, N.M.; Cameron, E.A.; Martens, E.C. How Glycan Metabolism Shapes the Human Gut Microbiota. Nat Rev Microbiol 2012, 10, 323–335. [Google Scholar] [CrossRef] [PubMed]
Figure 1.
Flow chart of the experimental plan showing the three fermentation methods applied to powdered dried pomegranate peel from Wonderful (W) and G1 varieties. Six Y and six B samples per fermentation method were produced to obtain three analytical replicates for tannin and polysaccharide analysis. (Y): fermented samples with the yeast Saccharomyces cerevisiae. (B): fermented samples without yeast; DE, dry extracts. * Dried peel in water, 100 °C for 2 min before the addition of the yeast.
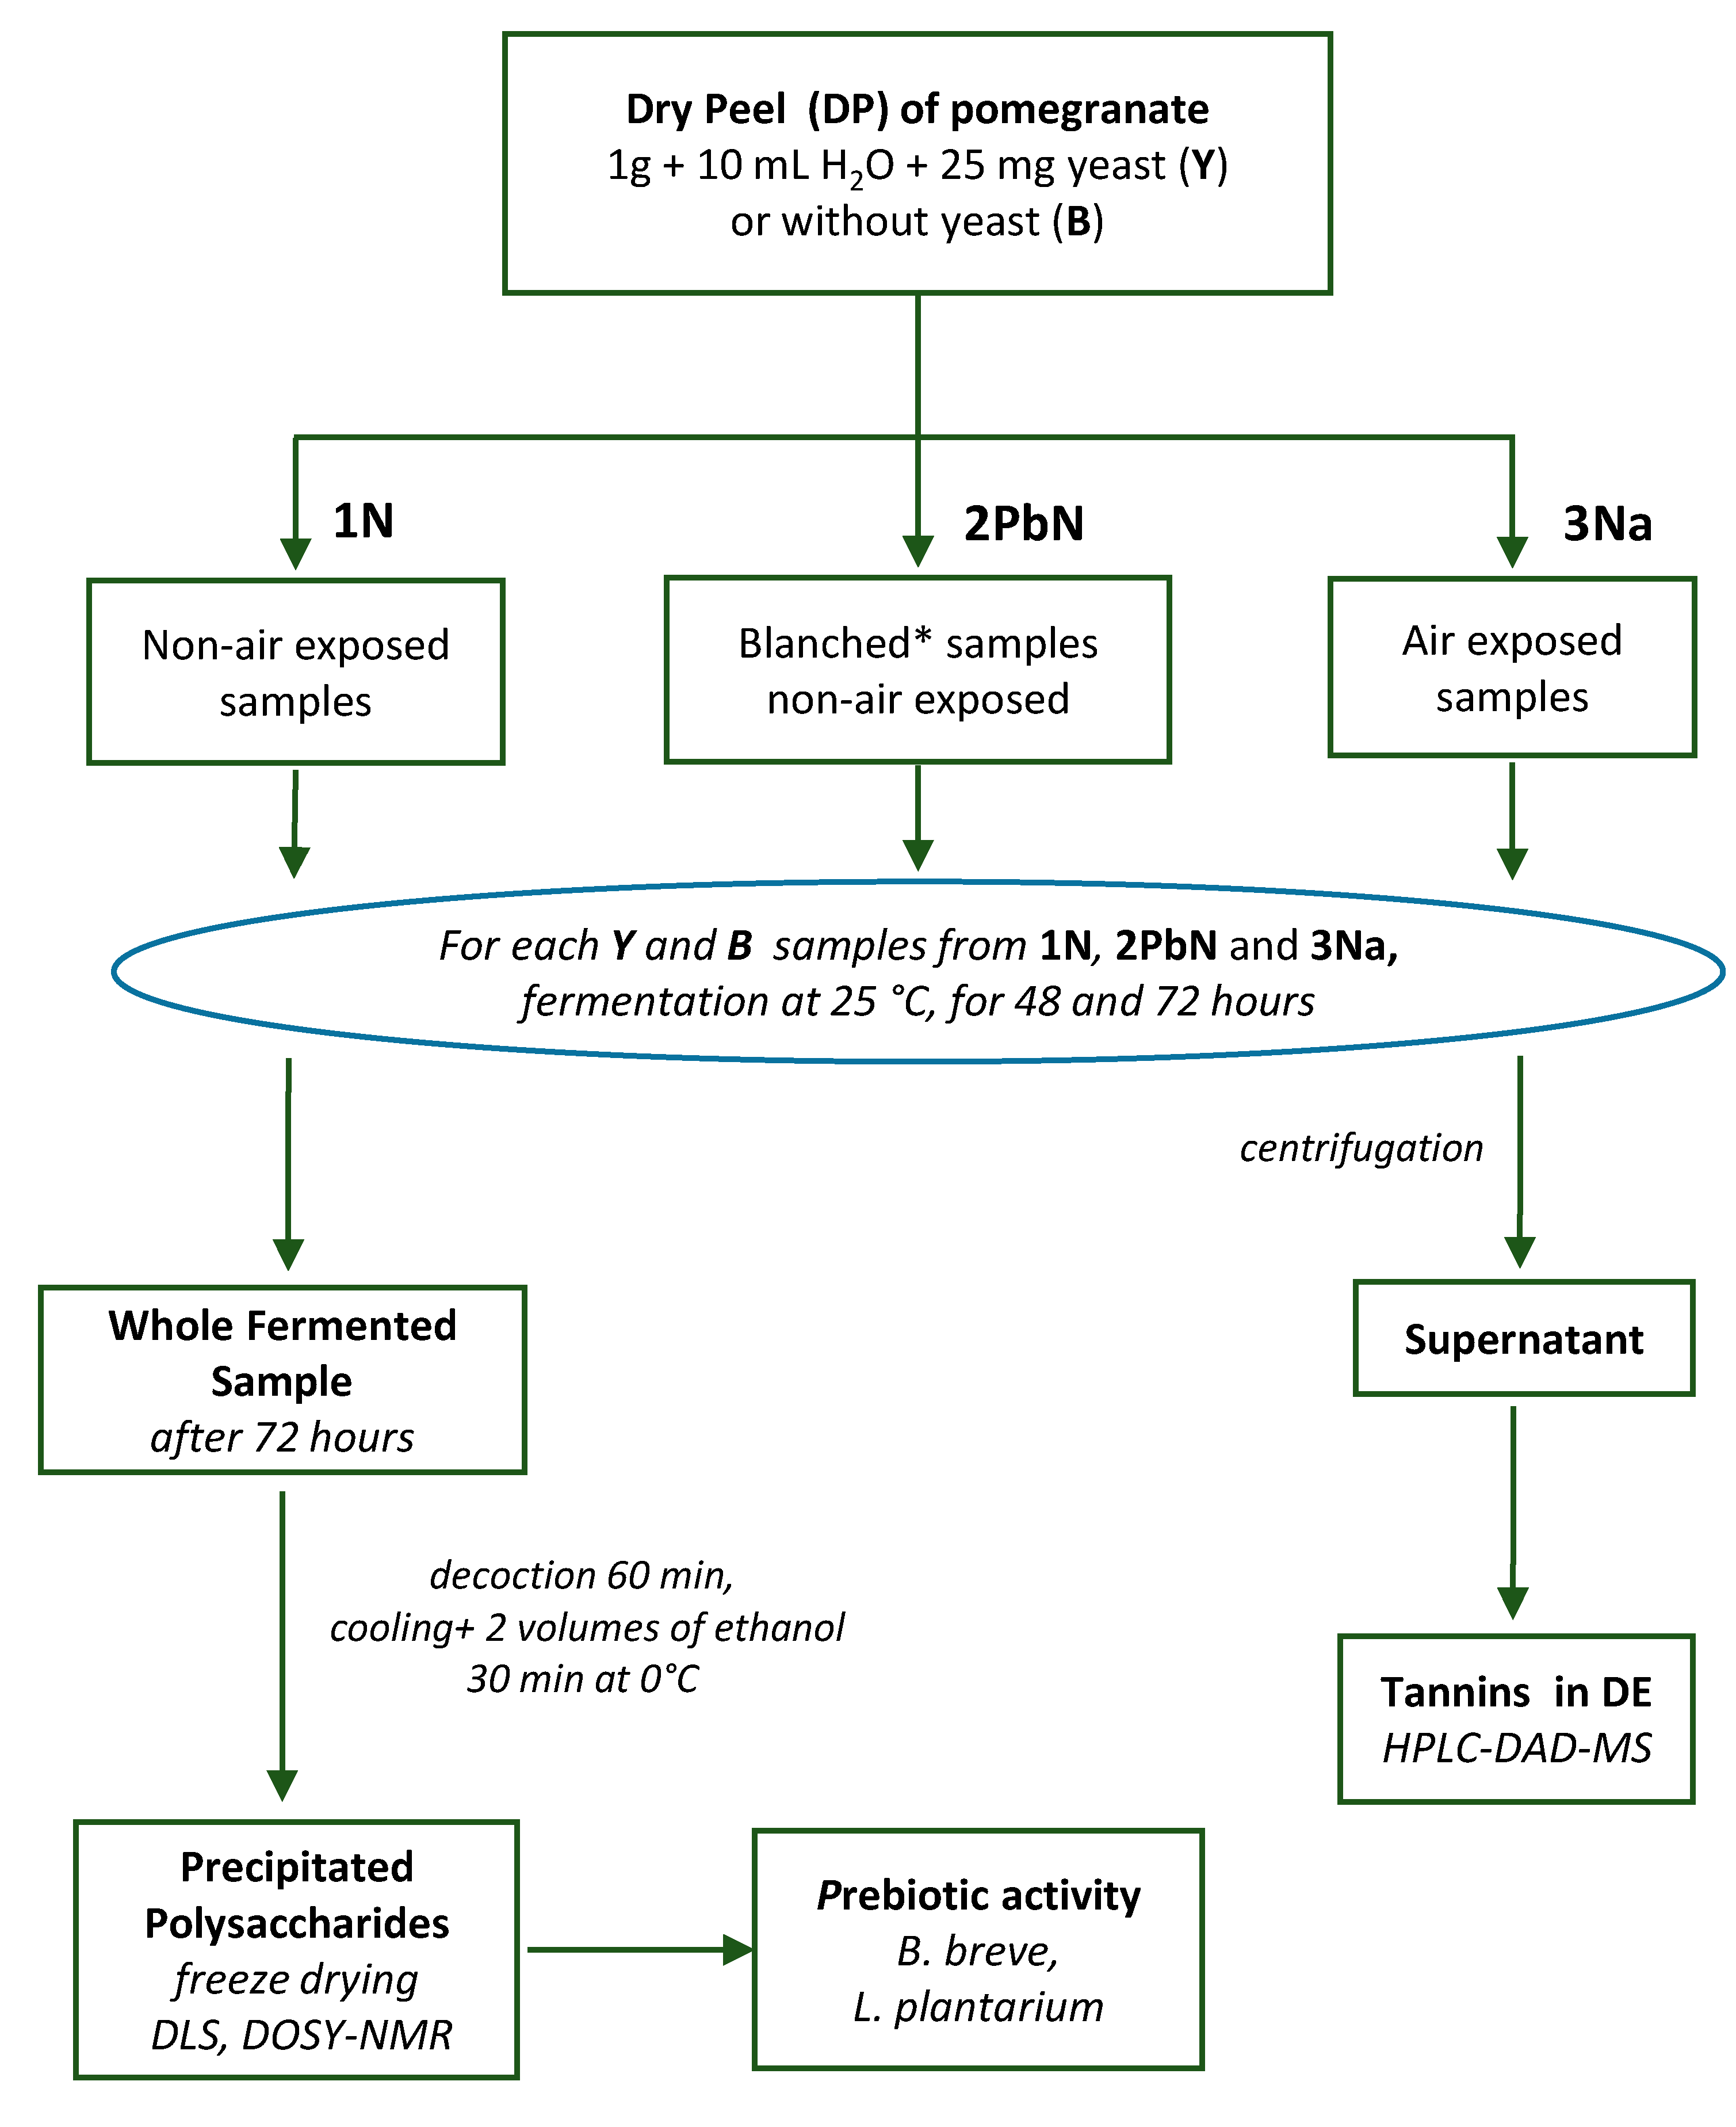
Figure 2.
Yields of the supernatant collected after the fermentation processes (see Figure 1); data are a mean of triplicates expressed as % of dry extracts (DE) on dried peel (DP). W, Wonderful variety (blue); G1, G1 variety (pink). Bar charts represent the variation as a function of type of treatment, fermentation type and fermentation time. Different letters indicate significant differences at p < 0.05.
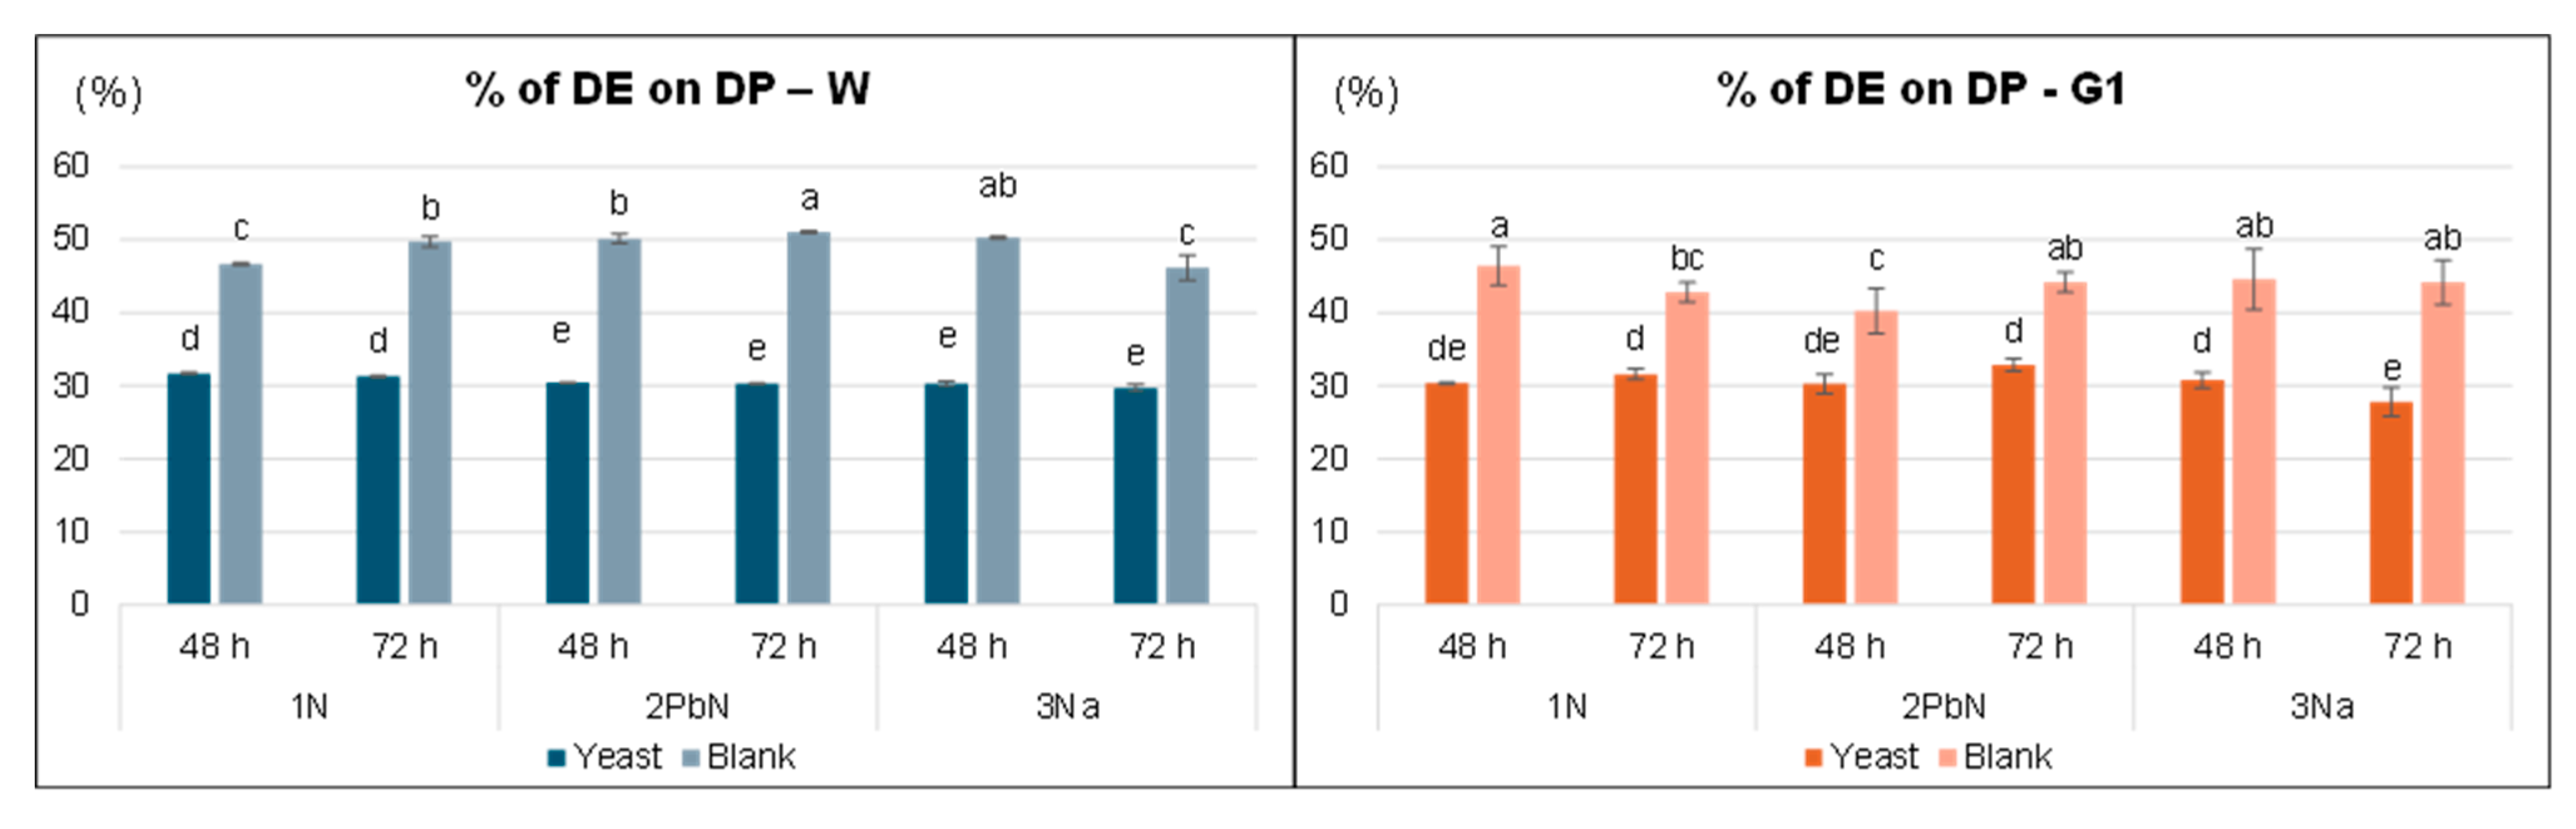
Figure 3.
Phenolic content expressed as mg/g on dried peel (DP) and dried extract (DE) in Wonderful (blue—light blue) and G1 (orange—pink) varieties. Bar charts represent the variation of phenols in samples as a function of treatment, fermentation type and fermentation time. (A) gallic and ellagic acids content; (B) punicalins and punicalagins content; (C) Total phenolic content. Data are from triplicates. For each molecule, including total phenols, different letters in a graphic indicate significant differences at p < 0.05.
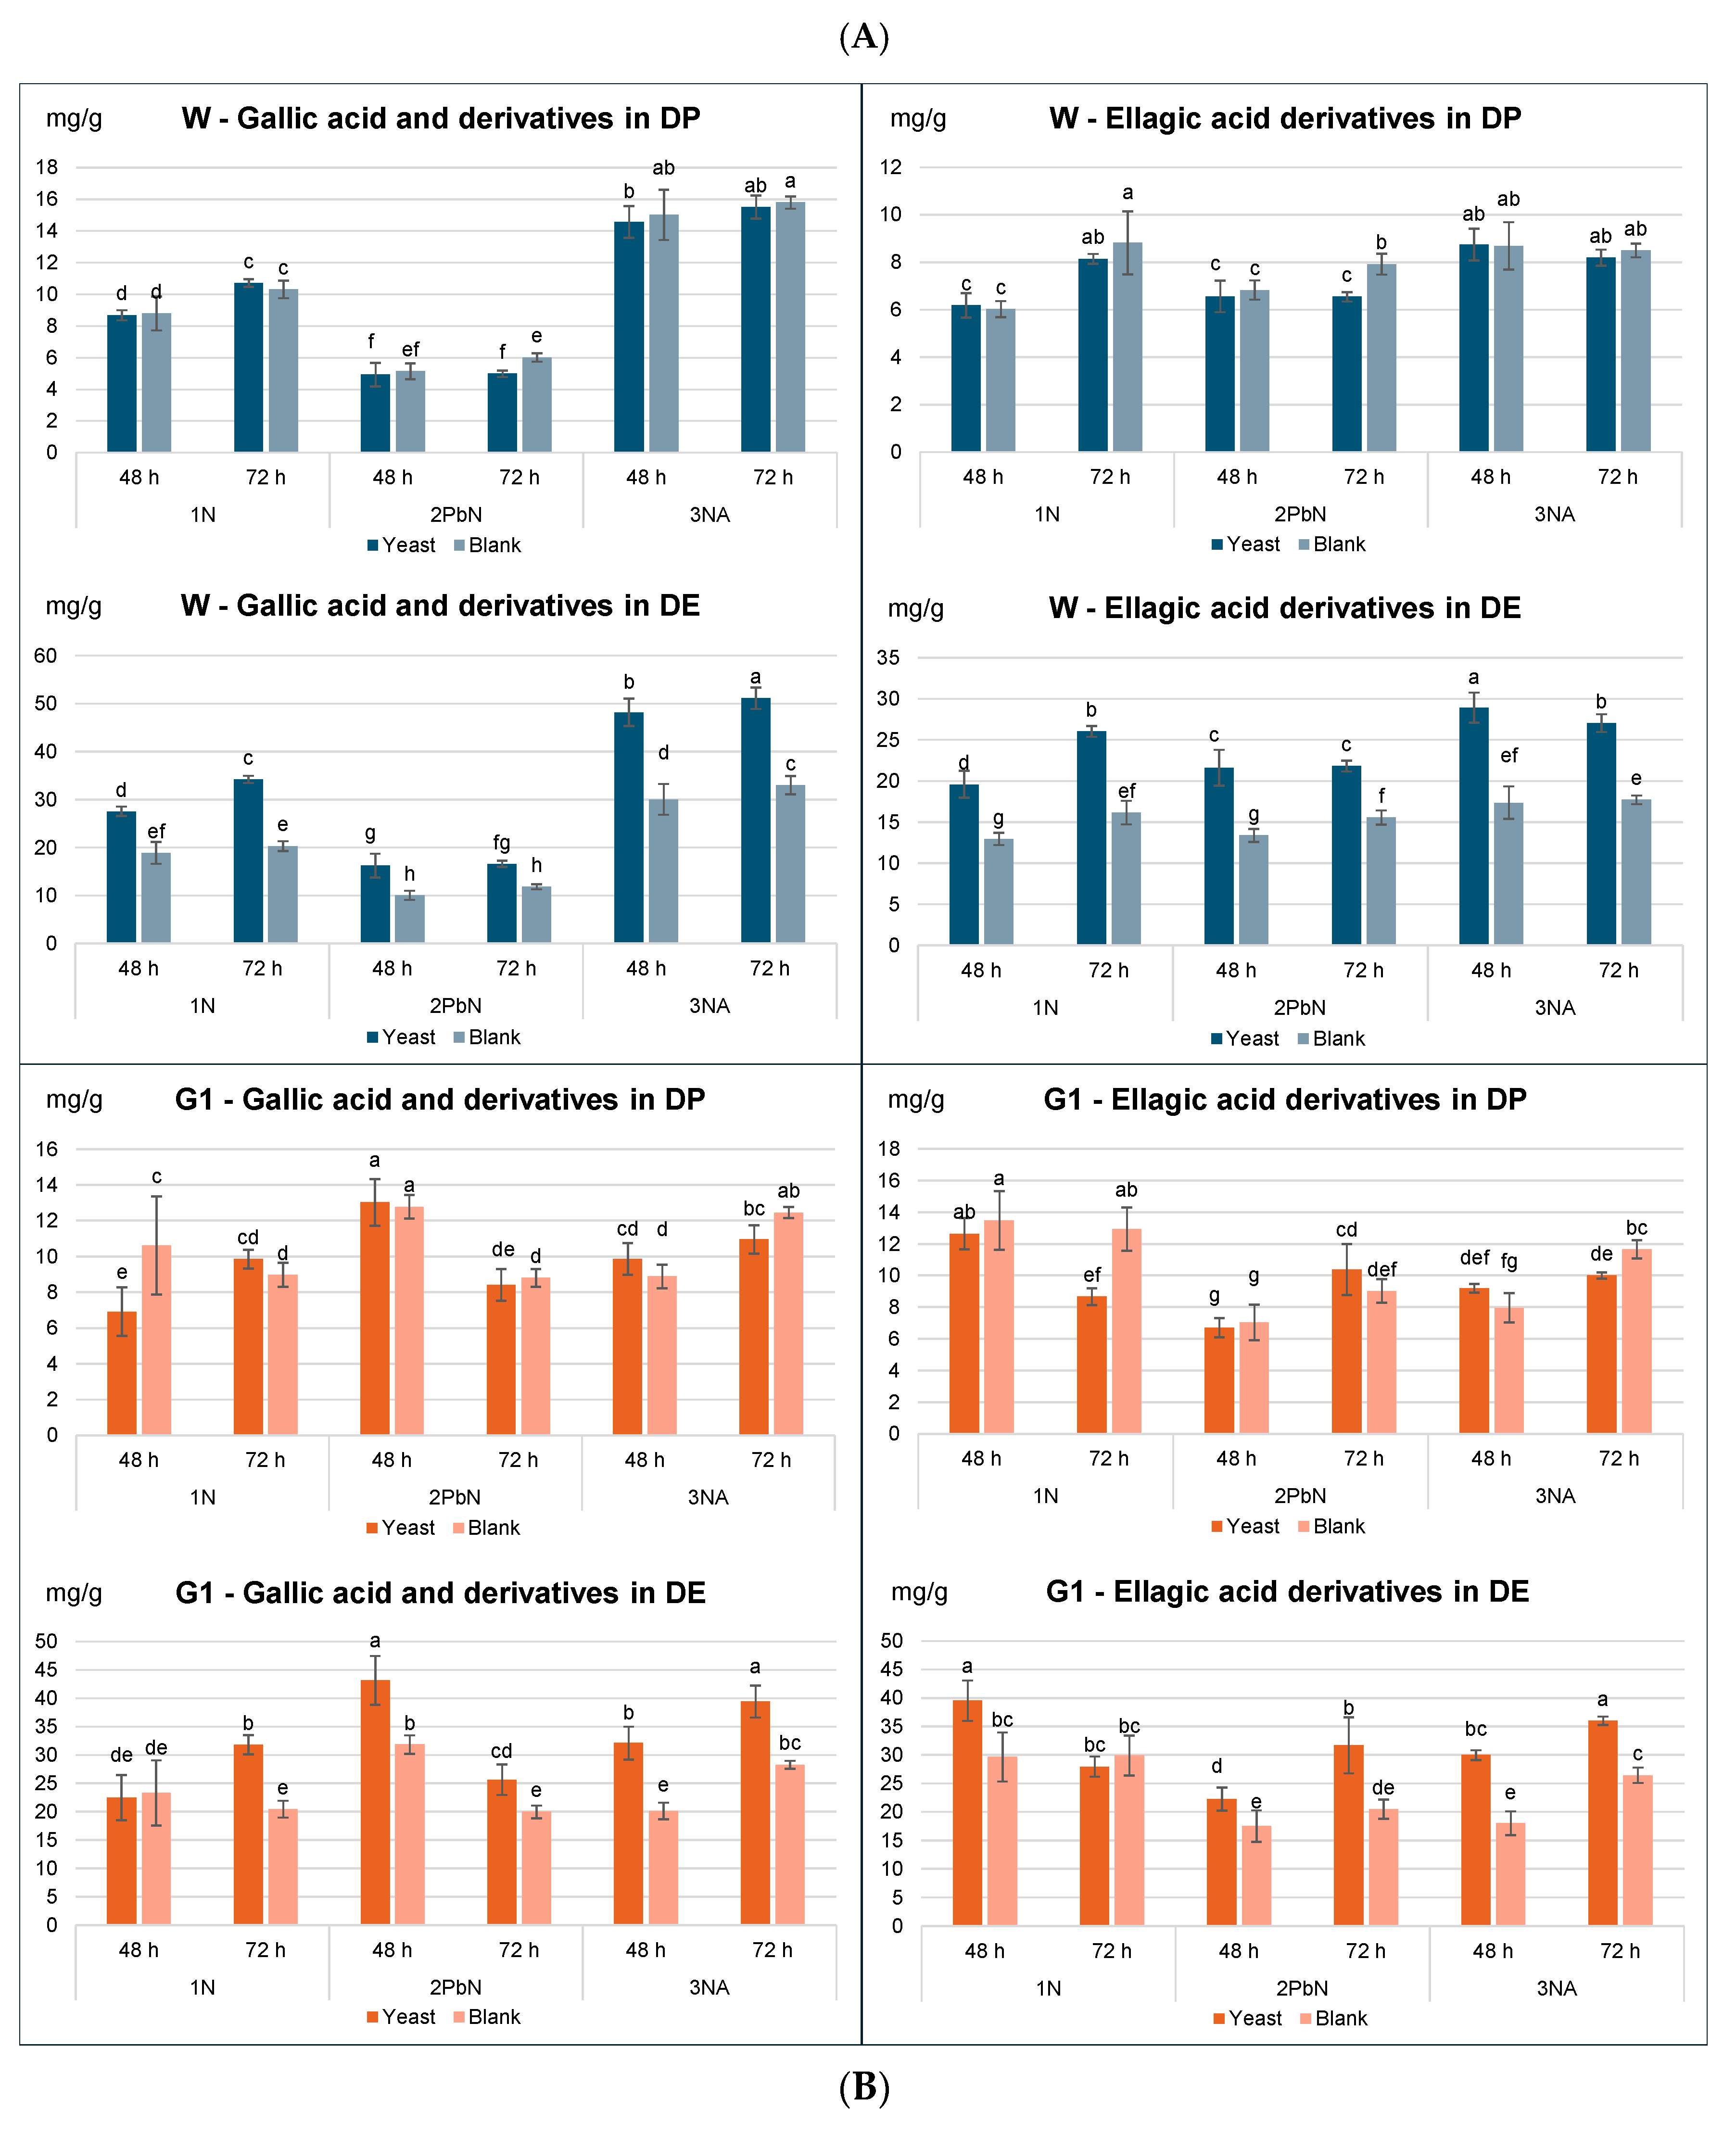
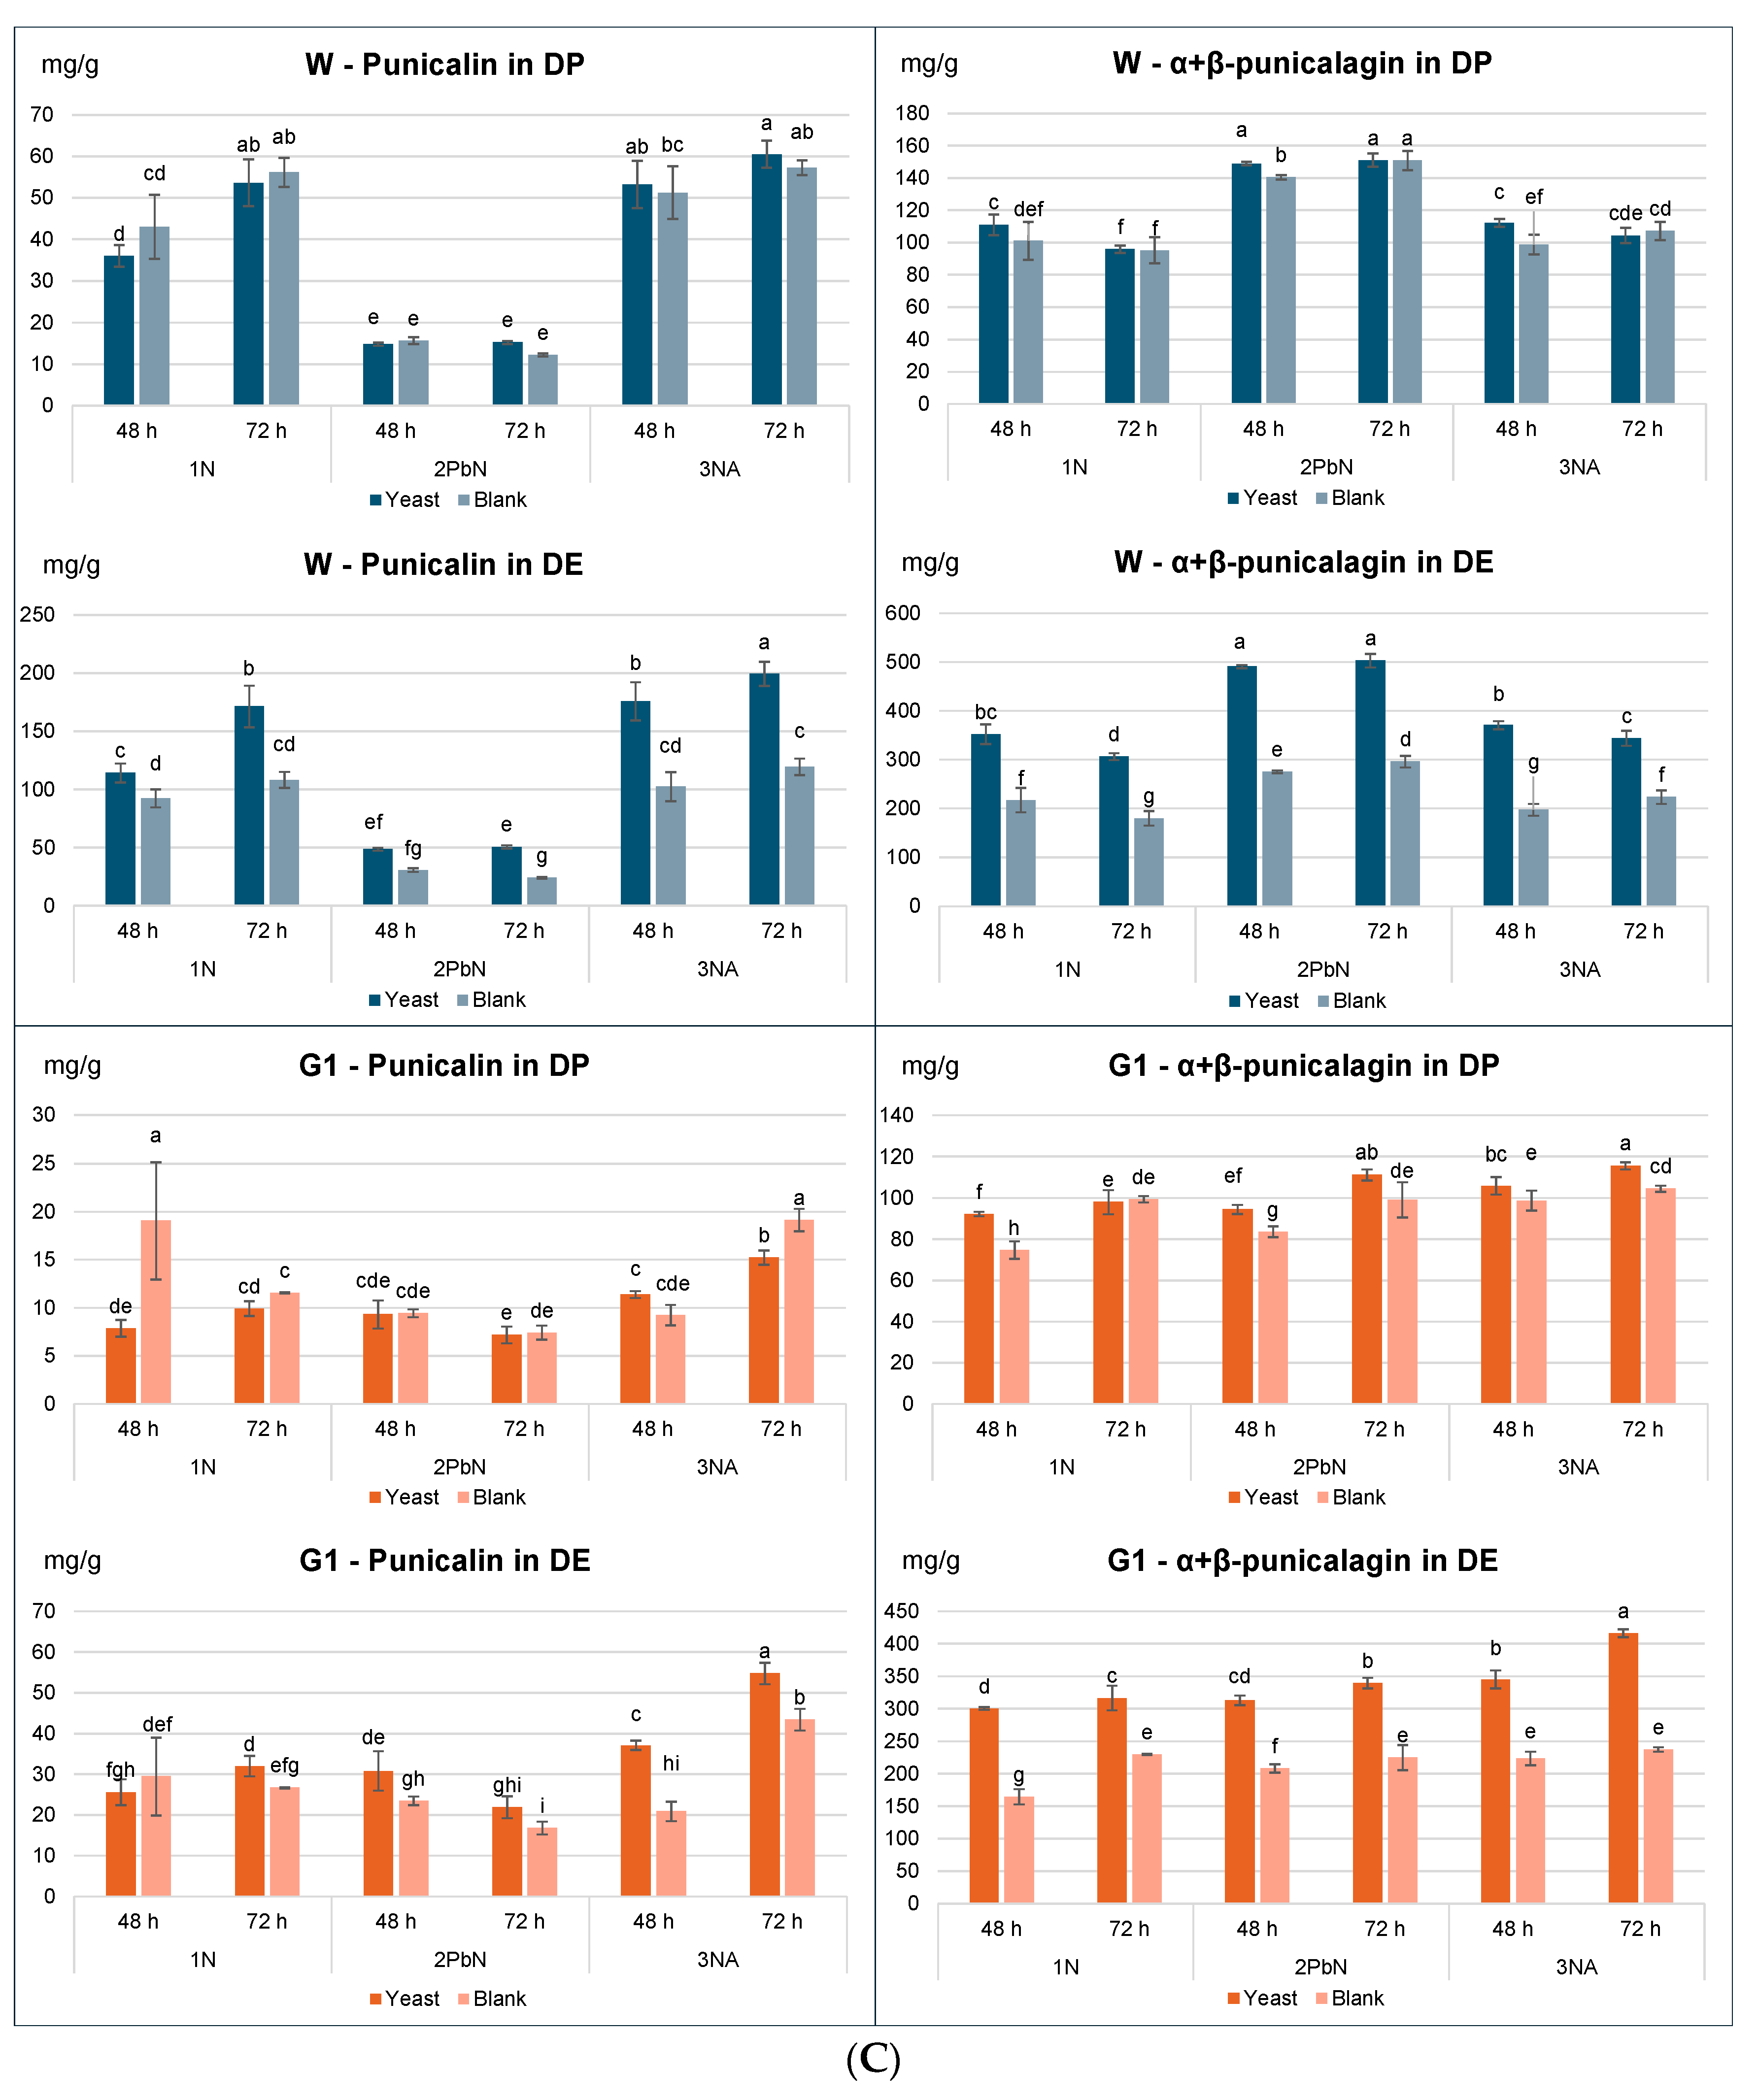
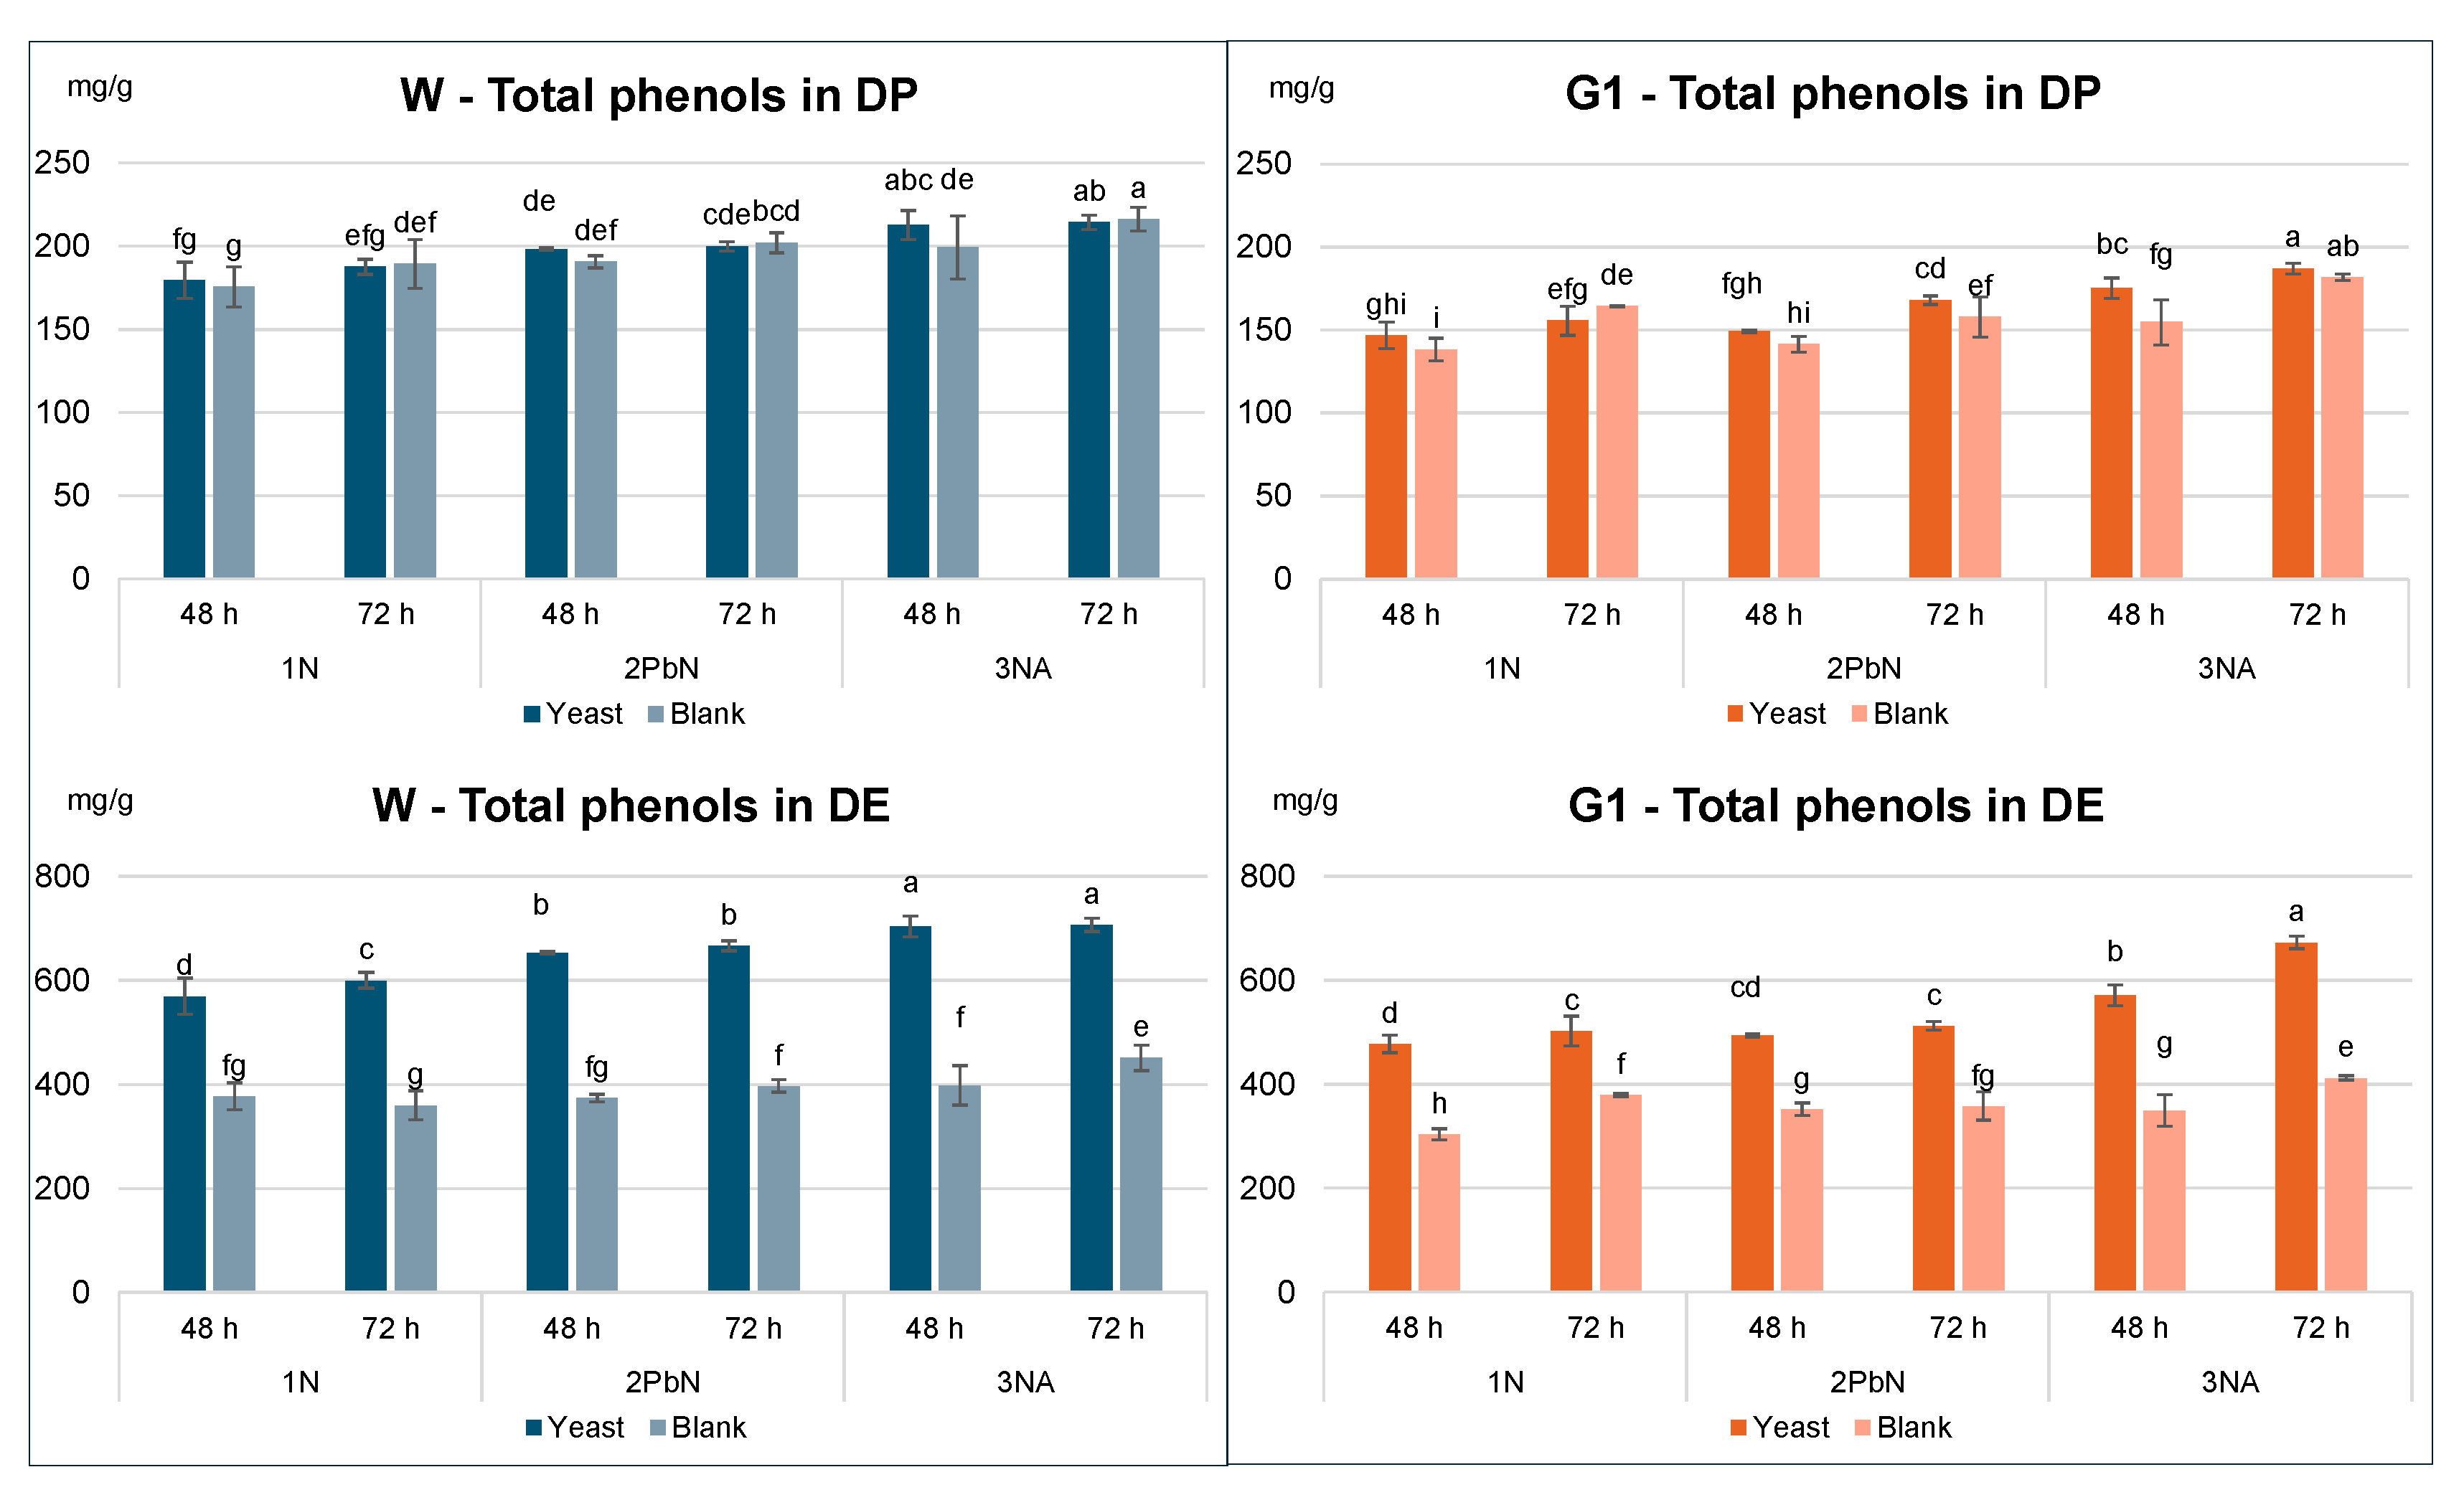

Table 1.
Polysaccharides recovered after 72 h of fermentation of samples from Wonderful and G1 varieties. For each sample, triplicates were pooled to obtain a sufficient amount of polysaccharides. Percentage yields are expressed on DP. Y, sample with Saccharomyces c.; B, blank sample; DP, dry peel.
Table 1.
Polysaccharides recovered after 72 h of fermentation of samples from Wonderful and G1 varieties. For each sample, triplicates were pooled to obtain a sufficient amount of polysaccharides. Percentage yields are expressed on DP. Y, sample with Saccharomyces c.; B, blank sample; DP, dry peel.
| Samples | Polysaccharides yield (% on DP) | |
|---|---|---|
| G1 | Wonderful | |
| B-1N | 6.9 | 8.4 |
| Y-1N | 7.2 | 6.2 |
| B-2PbN | 10.5 | 8.3 |
| Y-2PbN | 8.3 | 6.3 |
| B-3Na | 8.3 | 10 |
| Y-3Na | 6.7 | 7.1 |
Table 2.
Results from DLS analyses of polysaccharides obtained as shown in Figure 1. PdI, polydispersity index; D, diameter measurement; Z-Pk1 average particle size of the main peak; Pk1, Pk2, populations with relative molecular size (KDa); Dec, polysaccharides from decoction of unfermented peel. nd, not detected.
| Samples | PdI | Z-Pk1 | Pk1 | Pk 2 | Pk1 | Pk 2 |
|---|---|---|---|---|---|---|
| D (nm) | D (nm) | D (nm) | Area % | Area % | ||
| W-B-1N | 0.24 ± 0.02 | 342 ± 42 | 441 ± 58 | nd | 100 | nd |
| W-Y-1N | 0.24 ± 0.01 | 361 ± 19 | 463 ± 31 | 91 ± 1 | 99 ± 1 | 0.7 ± 0.2 |
| W-B-2PbN | 0.22 ± 0.02 | 749 ± 24 | 1017 ± 53 | 215 ± 14 | 90 ± 4 | 10.0 ± 3.5 |
| W-Y-2PbN | 0.26 ± 0.01 | 491 ± 14 | 563 ± 66 | 110 ± 11 | 89 ± 1 | 10.9 ± 1.2 |
| W-B-3Na | 0.23 ± 0.01 | 314 ± 10 | 390 ± 13 | nd | 99 ± 1 | 0.4 ± 0.5 |
| W-Y-3Na | 0.22 ± 0.01 | 282 ± 10 | 343 ± 13 | nd | 99 ± 1 | 0.8 ± 0.9 |
| W-Dec | 0.27 ± 0.03 | 716 ± 151 | 1059 ± 186 | 186 ± 12 | 88 ± 12 | 12.2 ± 12.3 |
| G1-B-1N | 0.26 ± 0.08 | 329 ± 8 | 390 ± 25 | 798 ± 25 | 99 ± 1 | 0.3 ± 0.5 |
| G1-Y-1N | 0.27 ± 0.02 | 395 ± 5 | 529 ± 37 | nd | 100 | nd |
| G1-B-2PbN | 0.27 ± 0.02 | 660 ± 29 | 943 ± 87 | 115 ± 11 | 96 ± 6 | 4.5 ± 5.7 |
| G1-Y-2PbN | 0.26 ± 0.01 | 408 ± 10 | 498 ± 24 | nd | 100 | 7.8 ± 1.1 |
| G1-B-3Na | 0.29 ± 0.02 | 461 ± 71 | 526 ± 126 | nd | 100 | nd |
| G1-Y-3Na | 0.33 ± 0.03 | 369 ± 7 | 525 ± 35 | nd | 100 | nd |
| G1-Dec | 0.27 ± 0.04 | 652 ± 1 | 908 ± 7 | 81 ± 15 | 97 ± 4 | 2.8 ± 3.9 |
Table 3.
Results from q1H-NMR analyses of dialyzed polysaccharides obtained after 72 h of fermentation. Values are expressed as percentage on dried sample. DM, degree of methylation; DA, degree of acylation.
Table 3.
Results from q1H-NMR analyses of dialyzed polysaccharides obtained after 72 h of fermentation. Values are expressed as percentage on dried sample. DM, degree of methylation; DA, degree of acylation.
| Samples | CH3OH | CH3COOH | Gal. Ac. | DM | DA |
|---|---|---|---|---|---|
| W-B-1N | 5.89 ± 0.06 | 2.54 ± 0.11 | 39.65 ± 1.20 | 77.96 | 38.91 |
| W-Y-1N | 5.64 ± 0.37 | 2.45 ± 0.24 | 50.71 ± 1.10 | 67.48 | 29.34 |
| W-B-2PbN | 6.05 ± 0.26 | 2.72 ± 0.02 | 46.57 ± 0.92 | 78.78 | 35.47 |
| W-Y-2PbN | 6.22 ± 0.28 | 2.86 ± 0.17 | 50.27 ± 0.95 | 75.08 | 34.56 |
| W-B-3Na | 6.14 ± 0.26 | 2.95 ± 0.07 | 44.77 ± 0.88 | 69.05 | 39.98 |
| W-Y-3Na | 5.83 ± 0.62 | 2.63 ± 0.16 | 52.10 ± 0.78 | 67.91 | 30.82 |
| Dec-W | 5.45 ± 0.15 | 2.61 ± 0.03 | 39.77 ± 1.25 | 74.29 | 33.72 |
| G1-B-1N | 5.66 ± 0.02 | 2.10 ± 0.25 | 45.29 ± 1.40 | 86.66 | 38.11 |
| G1-Y-1N | 6.01 ± 0.60 | 2.88 ± 0.09 | 46.73 ± 0.45 | 75.34 | 35.86 |
| G1-B-2PbN | 6.38 ± 0.08 | 2.37 ± 0.42 | 55.36 ± 0.89 | 69.90 | 37.55 |
| G1-Y-2PbN | 5.77 ± 0.21 | 2.46 ± 0.16 | 55.89 ± 0.98 | 64.52 | 37.21 |
| G1-B-3Na | 6.46 ± 0.06 | 1.97 ± 0.27 | 50.97 ± 1.20 | 64.78 | 35.95 |
| G1-Y-3Na | 5.44 ± 0.38 | 2.65 ± 0.11 | 44.83 ± 0.87 | 73.66 | 37.31 |
| Dec-G1 | 5.92 ± 0.15 | 2.49 ± 0.21 | 44.95 ± 0.72 | 79.88 | 37.76 |
1H-NMR spectra of non-dialyzed polysaccharides from fermented samples showed significantly stronger signals in the 3.2–4.0 ppm region only in blank samples compared to yeast-fermented ones, confirming monosaccharide consumption due to the presence of the yeast. Signals of citric acid (doublets at 2.5 and 2.6 ppm) were found in all fermented samples (at both 48 and 72 h, regardless yeast addition) only in the peel of Wonderful. In all samples the signals around 1.1 ppm (attributed to methyl groups of rhamnose) were of weak intensity, indicating the absence of rhamnogalacturonans. Similarly, low-intensity signals at 1.9-2.0 ppm suggested limited number of acetyl groups bound to the polysaccharides. Furthermore, DM and DA percentages (Table 3) showed no trends between samples fermented with or without S. cerevisiae. The high similarity between all fermented and non-fermented samples was confirmed by the MeOH% and CH3COOH% values determined after acid hydrolysis. The differences observed in DA and DM values (Table 3) seemed not to depend on fermentation, as well as galacturonic acid, for which no correlation was found between values and fermentation applied.
Table 4.
Mean molecular weight (KDa) and relative abundance of pomegranate polysaccharides determined by DOSY 1H-NMR. Population, group of molecules with a homogeneous size; Dec, decoction of unfermented peel.
Table 4.
Mean molecular weight (KDa) and relative abundance of pomegranate polysaccharides determined by DOSY 1H-NMR. Population, group of molecules with a homogeneous size; Dec, decoction of unfermented peel.
| Populations KDa | |||||||
|---|---|---|---|---|---|---|---|
| Samples | 705-690 | 517-429 | 385-197 | 159-91 | 72-50 | 38-26 | < 20 |
| W-B-1N | 690 (10%) * | 516 (37%) | 357 (37%) | 109 (13%) | - | - | - |
| W-Y-1N | 700 (25%) * | 508 (36%) | 264 (17%) | 98 (19%) | 51 (3%) | - | - |
| W-B-2PbN | 701 (18%) * | - | 351 (42%) | 94 (7%) | 51 (5%) | - | < 20 (28%) |
| W-Y-2PbN | 693 (33%) * | 501 (67%) | - | - | - | - | - |
| W-B-3Na | - | - | 367 (21%) | - | 72 (59%) | - | < 20 (20%) |
| W-Y-3Na | - | - | 385 (31%) | 159 (40%) 108 (25%) |
69 (4%) | - | |
| W-Dec | 705 (96%) * | - | - | - | - | - | - |
| G1-B-1N | - | 509 (11%) | 266 (13%) | - | 70 (13%) | - | < 20 (63%)- |
| G1-Y-1N | - | 429 (4%) | 265 (59%) | 155 (16%) | 68 (10%) | - | < 20 (11%) |
| G1-B-2PbN | - | - | 278 (9%) 197 (10%) |
96 (14%) | - | 38 (10%) 26 (10%) |
< 20 (47%) |
| G1-Y-2PbN | - | 499 (69%) | 357 (26%) | - | 67 (5%) | - | - |
| G1-B-3Na | - | 500 (20%) | 356 (27%) | 138 (24%) | 69 (11%) | 38 (18%) | - |
| G1-Y-3Na | - | 495 (17%) | 367 (36%) | 91 (17%) | - | 34 (4%) | < 20 (26%) |
| G1-Dec | - | 517 (39%) | 367 (42%) | - | 71 (7%) | - | < 20 (12%) |
Table 5.
Evaluation of the prebiotic properties of pomegranate peel from Wonderful and G1 cultivars on Bifidobacterium breve B632. Different letters indicate significant difference between the different fermentation samples according to HSD Tukey’s test; ns, ** and ***: effect not significant or significant at p ≤ 0.01 or p ≤ 0.001.
| B. breve | 0h | 12h | 24h | 30h | 48h |
|---|---|---|---|---|---|
| B632 | CFU/mL | CFU/mL | CFU/mL | CFU/mL | CFU/mL |
| W-Y-3Na | (2.1 ± 0.2) × 105 | (3.5 ± 0.2) × 107 b | (9.8 ± 0.2) × 108 a | (2.1 ± 0.3) × 109 a | (8.4 ± 0.3) × 108 a |
| W-Y-1N | (2.2 ± 0.2) × 105 | (2.7 ± 0.2) × 107 b | (6.6 ± 0.2) × 108 a | (8.7 ± 0.2) × 108 c | (2.1 ± 0.3) × 108 e |
| W-Y-2PbN | (2.1 ± 0.2) × 105 | (3.1 ± 0.2) × 107 b | (8.3 ± 0.3) × 108 b | (9.3 ± 0.4) × 108 c | (5.4 ± 0.3) × 108 c |
| W-B-3Na | (2.4 ± 0.2) × 105 | (3.3 ± 0.2) × 107 b | (4.4 ± 0.4) × 107 g | (3.4 ± 0.3) × 108 de | (3.6 ± 0.2) × 107 g |
| W-B-1N | (2.2 ± 0.2) × 105 | (2.5 ± 0.2) × 107 b | (1.8 ± 0.1) × 107 g | (8.6 ± 0.2) × 107 ef | (1.2 ± 0.3) × 107 g |
| W-B-2PbN | (2.4 ± 0.1) × 105 | (2.8 ± 0.1) × 107 b | (2,9 ± 0.2) × 107 g | (1.3 ± 0.3) × 108 ef | (2.5 ± 0.2) × 107 g |
| G1-Y-3Na | (2.3 ± 0.2) × 105 | (3.4 ± 0.2) × 107 b | (7.1 ± 0.3) × 108 c | (1.7 ± 0.2) × 109 b | (6.1 ± 0.3) × 108 b |
| G1-Y-1N | (2.1 ± 0.1) × 105 | (2.9 ± 0.2) × 107 b | (3.4 ± 0.2) × 108 f | (4.9 ± 0.3) × 108 d | (1.3 ± 0.1) × 108 f |
| G1-Y-2PbN | (2.2 ± 0.2) × 105 | (3.0 ± 0.3) × 107 b | (6.6 ± 0.3) × 108 d | (8.8 ± 0.2) × 108 c | (3.2 ± 0.2) × 108 d |
| G1-B-3Na | (2.6 ± 0.2) × 105 | (3.0 ± 0.3) × 107 b | (4.7 ± 0.3) × 107 g | (5.4 ± 0.2) × 108 d | (3.0 ± 0.3) × 107 g |
| G1-B-1N | (2.4 ± 0.2) × 105 | (2.6 ± 0.3) × 107 b | (1.4 ± 0.3) × 107 g | (8.8 ± 0.3) × 107 ef | (1.0 ± 0.5) × 107 g |
| G1-B-2PbN | (2.4 ± 0.1) × 105 | (2.7 ± 0.4) × 107 b | (3.2 ± 0.4) × 107 g | (1.2 ± 0.2) × 108 ef | (1.7 ± 0.3) × 107 g |
| Dec-W | (2.5 ± 0.2) × 105 | (8.4 ± 0.3) × 105 c | (8.4 ± 0.2) × 106 g | (8.2 ± 0.3) × 106 f | (6.7 ± 0.6) × 106 g |
| Dec-G1 | (2.3 ± 0.2) × 105 | (7.7 ± 0.2) × 105 c | (6.8 ± 0.1) × 106 g | (7.6 ± 0.2) × 106 f | (4.5 ± 0.3) × 106 g |
| No Carbon source | (2.1 ± 0.3) × 105 | (2.6 ± 0.2) × 105 c | (3.8 ± 0.2) × 106 g | (4.7 ± 0.3) × 106 f | (1.3 ± 0.2) × 106 g |
| Glucose | (2.2 ± 0.1) × 105 | (3.5 ± 0.2) × 108 a | (4.3 ± 0.2) × 108 e | (3.8 ± 0.3) × 108 de | (2.5 ± 0.2) × 108 e |
| S | ns | *** | *** | ** | *** |
Table 6.
Evaluation of the prebiotic properties of pomegranate peel from Wonderful and G1 cultivars on Lactobacillus plantarum L12. Different letters indicate significant difference between the different fermentation samples according to HSD Tukey’s test; ns, ** and ***: effect not significant or significant at p ≤ 0.01 or p ≤ 0.001.
| L. plantarum L12 | 0h | 12h | 24h | 30h | 48h |
|---|---|---|---|---|---|
| CFU/mL | CFU/mL | CFU/mL | CFU/mL | CFU/mL | |
| W-Y-3Na | (1.8 ± 0.1) × 105 a | (3.4 ± 0.2) × 108 c | (4.7 ± 0.3) × 109 d | (4.2 ± 0.3) × 109 c | (2.3 ± 0.2) × 109 c |
| W-Y-1-N | (1.5 ± 0.2) × 105 a | (1.5 ± 0.2) × 108 e | (3.8 ± 0.2) × 109 e | (3.5 ± 0.2) × 109 d | (1.5 ± 0.4) × 109 b |
| W-Y-2PbN | (1.6 ± 0.2) × 105 a | (2.4 ± 0.2) × 108 d | (3.4 ± 0.4) × 109 e | (3.4 ± 0.2) × 109 d | (1.9 ± 0.2) × 109 cd |
| W-B-3Na | (1.7 ± 0.2) × 105 a | (8.4 ± 0.2) × 107 f | (5.4 ± 0.3) × 108 fg | (3.7 ± 0.2) × 108 ef | (2.8 ± 0.3) × 108 e |
| W-B-1N | (1.4 ± 0.2) × 105 a | (7.5 ± 0.2) × 107 f | (3.5 ± 0.3) × 108 fgh | (1.4 ± 0.2) × 108 ef | (1.8 ± 0.2) × 108 e |
| W-B-2PbN | (1.7 ± 0.2) × 105 a | (7.8 ± 0.6) × 107 f | (4.6 ± 0.2) × 108 fgh | (1.9 ± 0.2) × 108 ef | (2.1 ± 0.4) × 108 e |
| G1-Y-3Na | (1.6 ± 0.2) × 105 a | (4.3 ± 0.2) × 108 b | (7.7 ± 0.4) × 109 b | (6.4 ± 0.3) × 109 b | (4.2 ± 0.2) × 109 a |
| G1-Y-1N | (1.3 ± 0.2) × 105 a | (3.6 ± 0.2) × 108 c | (6.5 ± 0.3) × 109 h | (6.3 ± 0.6) × 109 b | (3.3 ± 0.1) × 109 b |
| G1-Y-2PbN | (1.7 ± 0.2) × 105 a | (2.3 ± 0.4) × 108 d | (7.1 ± 0.3) × 109 b | (6.8 ± 0.2) × 109 b | (4.4 ± 0.4) × 109 a |
| G1-B-3Na | (1.5 ± 0.2) × 105 a | (7.8 ± 0.2) × 107 f | (5.8 ± 0.2) × 108 f | (5.1 ± 0.3) × 108 e | (4.6 ± 0.3) × 108 e |
| G1-B-1N | (1.8 ± 0.2) × 105 a | (4.8 ± 0.2) × 107 fg | (2.6 ± 0.3) × 108 fgh | (2.1 ± 0.3) × 108 ef | (1.8 ± 0.3) × 108 e |
| G1-B-2PbN | (1.9 ± 0.2) × 105 a | (6.6 ± 0.4) × 107 f | (5.9 ± 0.3) × 108 f | (5.7 ± 0.3) × 108 e | (2.7 ± 0.3) × 108 e |
| Dec-W | (1.7 ± 0.2) × 105 a | (8.4 ± 0.3) × 105 g | (8.4 ± 0.4) × 106 gh | (8.2 ± 0.2) × 106 f | (6.7 ± 0.1) × 106 e |
| Dec-G1 | (1.6 ± 0.2) × 105 a | (8.9 ± 0.2) × 105 g | (8.9 ± 0.2) × 106 gh | (1.5 ± 0.2) × 107 f | (2.4 ± 0.2) × 107 e |
| No Carbon source | (1.8 ± 0.2) × 105 a | (6.5 ± 0.1) × 105 g | (5.7 ± 0.2) × 106 b | (8.6 ± 0.3) × 106 f | (1.4 ± 0.3) × 107 e |
| Glucose | (1.4 ± 0.2) × 105 a | (8.5 ± 0.2) × 108 a | (8.3 ± 0.2) × 109 a | (7.8 ± 0.2) × 109 a | (4.5 ± 0.3) × 108 e |
| S | ns | *** | ** | *** | *** |
Disclaimer/Publisher’s Note: The statements, opinions and data contained in all publications are solely those of the individual author(s) and contributor(s) and not of MDPI and/or the editor(s). MDPI and/or the editor(s) disclaim responsibility for any injury to people or property resulting from any ideas, methods, instructions or products referred to in the content. |
© 2026 by the authors. Licensee MDPI, Basel, Switzerland. This article is an open access article distributed under the terms and conditions of the Creative Commons Attribution (CC BY) license (http://creativecommons.org/licenses/by/4.0/).
Copyright: This open access article is published under a Creative Commons CC BY 4.0 license, which permit the free download, distribution, and reuse, provided that the author and preprint are cited in any reuse.


