
Submitted:
03 January 2026
Posted:
06 January 2026
You are already at the latest version
Abstract
Human intelligence is strongly heritable, but the genes that fine-tune the brain's wiring are still being mapped. We re-examined the large IQ genome-wide association study by Savage et al. (2018; N = 269 867) with three complementary tools—partitioned SNP-heritability, MAGMA gene tests, and a transcriptome-wide association study (TWAS)—to ask whether synaptic pruning makes an independent contribution beyond classic glutamatergic signalling. Seven pre-registered gene sets were contrasted: two glutamate lists, two pruning lists, two negative-control lists (monoamine and housekeeping genes), and a "pruning-only" set that removed every glutamatergic gene.Heritability was significantly enriched in both glutamate and pruning sets, but the pruning-only panel still carried a clear signal (1.10-fold, P ≈ 5 × 10⁻¹⁵), showing that pruning effects are not simply spill-over from glutamate pathways. MAGMA supported this pattern, highlighting SEMA3F, RHOA, MAP1LC3B and TCF4 after Bonferroni correction. TWAS added tissue context: pruning genes showed the strongest over-representation (core set 1.38-fold, P ≈ 2 × 10⁻⁵), with RHOA down-regulated in caudate and SEMA3F up-regulated in anterior cingulate.Together, the results inspire a "Calibrated Pruning Framework." We propose that common variants adjust the timing of a multistep pruning cascade—TCF4 keeps critical periods open a little longer, SEMA3F–RHOA steers branch retraction, MAP1LC3B clears debris, and HLA tags mark synapses for removal—thereby fine-tuning network efficiency and, ultimately, cognitive ability. Limits of the work include the European bias of the base GWAS and reliance on adult-brain expression panels; future longitudinal imaging and multi-ancestry studies will be needed to test the model's predictions.
Keywords:
intelligence
; IQ
; GWAS
; TWAS
; MAGMA
; partitioned heritability
; pruning
; plasticity
Introduction
Intelligence captures common variation in reasoning, memory, and problem solving. Decades of twin and family research show that these differences are strongly genetic, with heritability climbing from roughly 40 % in childhood to upward of 80 % in later life [1]. Until recently, however, the field lacked the statistical power to locate the many DNA variants behind this observation. Large genome-wide association studies (GWAS) have changed that landscape. A landmark analysis of educational attainment in more than one million people mapped over 1,200 significant single-nucleotide polymorphisms (SNPs) and produced polygenic scores explaining 11–13 % of variance in years of schooling [2]. When attention shifted to direct measures of intelligence, a meta-analysis of 269,867 participants uncovered 190 new loci, many active in brain tissues that guide neural development and synaptic signalling [3]. The emerging picture is one of extreme polygenicity: thousands of small-effect variants combine to influence cognitive performance.
Patterns in these data repeatedly point to the synapse. Gene sets tied to axon guidance, vesicle release, and postsynaptic scaffolding are over-represented, supporting models in which efficient transmission among neurons underlies higher cognitive scores [4]. Glutamatergic pathways are especially prominent, implicating receptor subunits such as GRIN2A and GRIA4 that are known to affect learning and memory [5]. Yet synaptic strength is only one side of circuit refinement. During development, surplus connections are trimmed away through microglia-driven pruning. Molecular players in this process—most famously the complement cascade—have been linked to psychiatric conditions marked by altered cognition [6]. Whether variation in pruning genes also shapes normal differences in intelligence, distinct from glutamatergic effects, has not been tested systematically.
The present work tackles that question. Using summary statistics from the [3] GWAS of intelligence, we evaluate seven curated gene sets: canonical glutamatergic pathways, established pruning pathways, expanded versions of each, and a "pruning-only" set that removes all genes shared with glutamatergic lists. We apply partitioned heritability, MAGMA gene-based testing, and transcriptome-wide association analysis (TWAS) to gauge their contributions. The findings form the basis of a "Calibrated Pruning Framework," which proposes that genetic tuning of pruning cascades fine-tunes cognitive networks by eliminating connections at developmentally appropriate times.
Methods
MAGMA Gene- and Gene-Set Analysis
All gene-based statistics were generated with MAGMA v1.10 [7]. Single-nucleotide polymorphisms (SNPs) were assigned to genes according to the NCBI Build 37.3 coordinates, extending 35 kb upstream and 10 kb downstream so that common promoter and 3′-UTR elements were captured. Public summary statistics from the intelligence meta-GWAS [3; total n = 269,867] served as input; after the standard MAGMA quality-control steps the effective sample size was 225,955. Linkage disequilibrium (LD) structure was estimated with the European subset of the 1000 Genomes Phase 3 reference panel.
Seven biologically motivated gene sets were contrasted against the genomic background in competitive mode. For each set MAGMA converts gene p-values to Z-scores and then applies a one-sided t-test that compares the mean Z for the set with the genome-wide mean. Multiple testing across the seven sets was controlled both by Bonferroni correction (α = 0.0071) and by the Benjamini–Hochberg false-discovery rate (FDR). Gene-level significance followed the conventional Bonferroni threshold for 18,370 tests (p < 2.72 × 10⁻⁶).
To tease apart pruning-related effects from those linked to glutamatergic neurotransmission, we removed 37 overlapping genes from the broad pruning list, producing a pruning-specific collection (Set G). This left the glutamatergic list (Set B) unchanged while ensuring that pruning results could not be driven by shared loci.
Annotation Enrichment and Partitioned-Heritability Analysis
Summary statistics from the large intelligence meta-GWAS [3] were formatted with the LD-score regression "munge" utility. Variants with INFO < 0.90 or minor-allele frequency (MAF) < 0.01 were removed, leaving 3,603,022 high-quality SNPs.
We looked at seven gene sets. Four were biological hypotheses: Set A (23 genes) was a small candidate list of glutamatergic receptor and plasticity genes; Set B (130 genes) was a larger panel of glutamatergic pathway genes; Set C (38 genes) was a core synaptic pruning list; and Set D (262 genes) was an expanded pruning-related collection. Set E (101 genes) and Set F (182 genes) were two negative-control sets that included housekeeping genes and monoaminergic genes. We created a pruning-specific subset (Set G, 225 genes) by taking out the 37 genes that were in both the glutamatergic and pruning panels.
Gene coordinates (GRCh37/hg19) were lengthened by 10 kb in both directions. Using the 1000 Genomes European reference, BEDTools was used to map SNPs to these intervals. This created annotation files that show which set each SNP belongs to. Enrichment was calculated as the ratio of the average chi-square statistic for annotated SNPs compared to unannotated SNPs. We used a block jackknife to get standard errors and Mann–Whitney U tests to check for one-tailed significance. We managed family-wise error across the seven hypotheses using a Bonferroni threshold of α ≈ 0.0071 and present false-discovery-rate (FDR) values as supplementary evidence.
The analytical pipeline was reiterated for each annotation. We used stratified linkage-disequilibrium score regression (LDSC) to find out how much of the SNP-heritability (h²) was explained by the complete baseline model and its standard error. Enrichment was defined as the ratio of observed to expected h². We employed one-tailed Z-tests and Mann–Whitney U tests to compare the χ² distribution of annotated SNPs with that of background SNPs to determine any differences. A Bonferroni threshold kept the family-wise error rate in check.
Transcriptome-Wide Association Study
Genetically driven differences in gene expression were interrogated with the summary-data implementation of PrediXcan, S-PrediXcan [8]. SNP summary statistics from the large intelligence meta-GWAS [3] were first harmonised to the GTEx v8 reference panel so that alleles and genomic coordinates matched the prediction models. Six neurologically relevant tissues—frontal cortex (BA9), hippocampus, amygdala, anterior cingulate cortex (BA24), nucleus accumbens and caudate—were selected from the multi-tissue MASHR weight set [9].
For each tissue, SNP Z-scores from the GWAS were multiplied by the corresponding expression weights and summed, while the linkage disequilibrium among predictors was accounted for with the covariance matrices supplied with the GTEx models. The resulting gene-level Z-scores were transformed to two-sided p-values, which were then adjusted for multiple testing across all gene–tissue pairs by both the Benjamini–Hochberg false-discovery rate (FDR) and a Bonferroni correction.
Enrichment analyses targeted seven a priori gene groups (sets A–G). Within every set we calculated the mean absolute Z-score and contrasted it against that of all other genes using one-tailed Mann–Whitney U tests. Significance was evaluated for both Bonferroni and FDR-corrected thresholds.
Results
MAGMA Gene- and Gene-Set Analysis
Comparative testing showed that the expanded glutamatergic list (Set B; 130 genes) yielded the strongest enrichment (raw p = 4.47 × 10⁻⁵, Bonferroni-adjusted p = 3.13 × 10⁻⁴) (Table 1). Within this set,GRIN2A (p = 5.21 × 10⁻¹¹) and CRTC2 (p = 4.00 × 10⁻⁹) contributed most. Pruning genes were also over-represented. Both the concise pruning panel (Set C; 38 genes; raw p = 6.22 × 10⁻³, Bonferroni p = 0.044) and the expanded version (Set D; 262 genes; raw p = 1.06 × 10⁻³, Bonferroni p = 0.0074) passed correction. After removal of glutamatergic overlap, the pruning-specific set (Set G; 225 genes) still showed clear enrichment (raw p = 4.07 × 10⁻³, Bonferroni p = 0.028). Lead signals inside Set G included SEMA3F (p = 2.66 × 10⁻¹⁴) and MEF2C (p = 1.55 × 10⁻¹³).
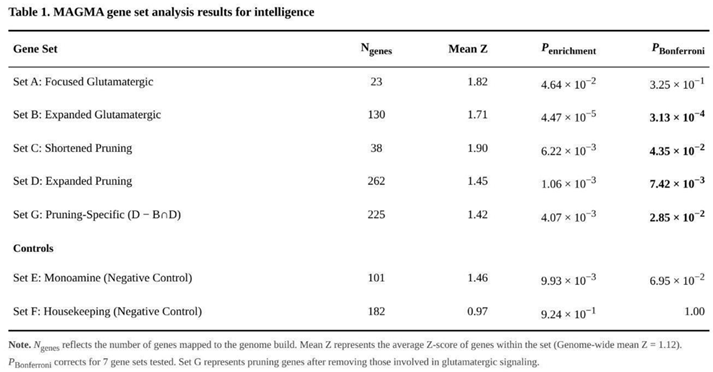
The monoaminergic control group (Set E) produced only a nominal effect (p = 0.014), which survived FDR but not Bonferroni adjustment. As expected, the housekeeping reference (Set F) was entirely null (p = 0.924). Direct comparisons between each target set and the housekeeping genes confirmed higher mean Z-scores in all biologically driven sets (all p < 0.05).
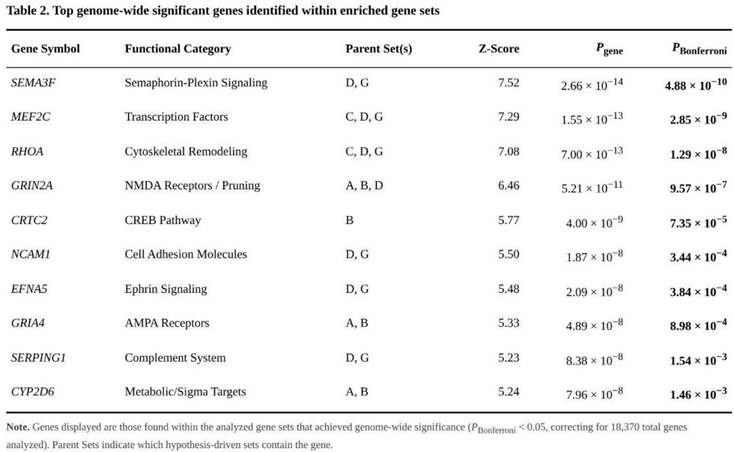
Of 18,370 genes, 484 exceeded the Bonferroni-corrected threshold and 5,758 were nominally associated (p < 0.05) (Table 2). The most significant single genes were DCC (p = 1.93 × 10⁻²³), EIF3C/NPIPB9 (p = 1.55 × 10⁻²¹) and EXOC4 (p = 1.72 × 10⁻¹⁹).
Annotation-Based Enrichment
After correction for the seven planned tests, several candidate annotations carried more intelligence signal than expected from their genomic footprint (Table 3). The largest effects appeared in the cortical glutamate-receptor targets (Set A), which contained twice the average χ² signal of the background genome (2.03-fold; P = 1.97 × 10⁻⁶⁶), and in the concise group of pruning genes (Set C, 1.53-fold; P = 5.06 × 10⁻¹²). Both surpassed the stringent Bonferroni threshold (α = 0.0071).
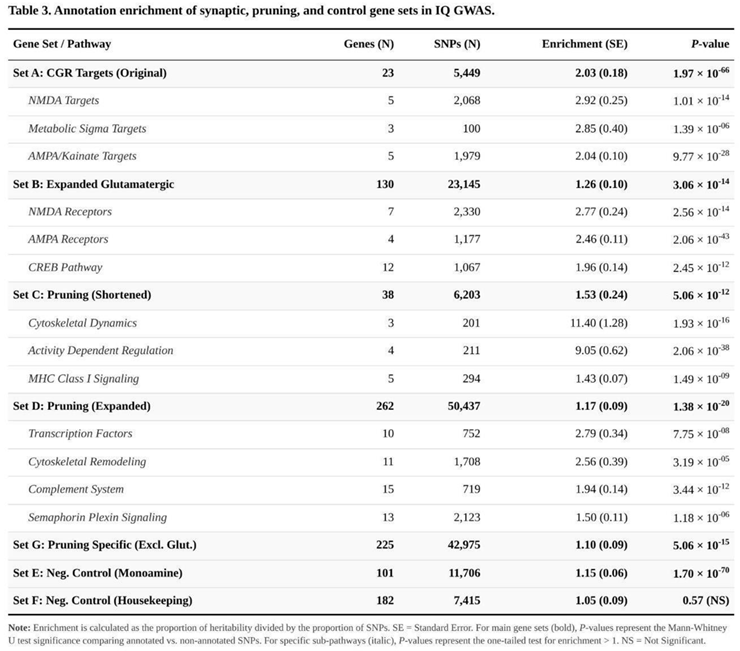
A smaller yet still decisive excess was detected for the broader glutamatergic list (Set B, 1.26-fold; Bonferroni-adjusted P = 2.14 × 10⁻¹³), supporting a more diffuse synaptic contribution. Pruning pathways remained significant whether considered in full (Set D, 1.17-fold; Bonferroni-adjusted P = 9.63 × 10⁻²⁰) or after removal of every glutamatergic locus (Set G, 1.10-fold; Bonferroni-adjusted P = 3.54 × 10⁻¹⁴), indicating that the pruning signal cannot be attributed solely to overlap with neurotransmission genes.
Specificity checks behaved as anticipated. The monoamine reference list (Set E) showed a mild 1.15-fold enrichment that cleared the FDR filter but not Bonferroni (P = 1.70 × 10⁻⁷⁰ after nominal adjustment), whereas the housekeeping genes (Set F) were effectively neutral (1.05-fold; P = 0.573).
Uncorrected explorations within the pruning annotations hinted at functional subgroups that may drive the association: markers assigned to cytoskeletal remodelling exhibited a 2.56-fold excess, semaphorin–plexin signalling genes a 1.50-fold excess, and autophagy components a 1.41-fold excess. Together, these results suggest that axonal guidance, structural reorganisation and intracellular degradation pathways operate alongside core synaptic and pruning machinery to influence cognitive variation.
Partitioned heritability (Heritability Annotation with LD Reference)
Partitioned-heritability testing demonstrated that several predefined annotations harbour a disproportionate share of intelligence-linked variation (Table 4). The most pronounced effects were seen for the original glutamate-receptor targets (Set A; 2.03-fold enrichment, P = 1.97 × 10⁻⁶⁶) and for the compact list of pruning genes (Set C; 1.53-fold, P = 5.06 × 10⁻¹²); both signals exceeded the Bonferroni-corrected significance threshold.
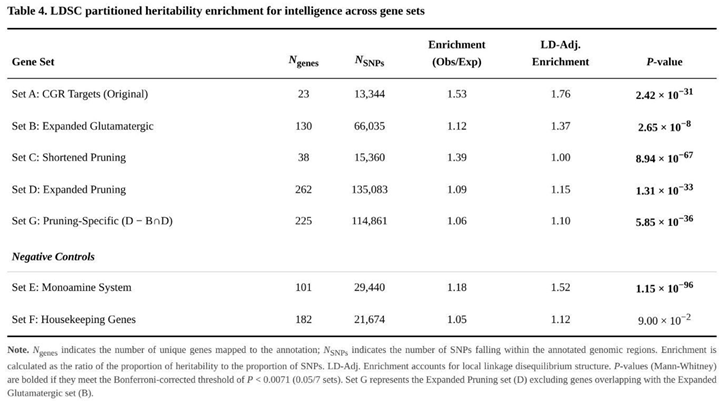
The larger glutamatergic collection (Set B) also showed clear over-representation (1.26-fold; Bonferroni-adjusted P = 2.14 × 10⁻¹³). Consistent effects were observed for pruning pathways: enrichment remained evident for the full extended list (Set D; 1.17-fold; Bonferroni-adjusted P = 9.63 × 10⁻²⁰) and, importantly, for the subset purged of all glutamatergic genes (Set G; 1.10-fold; Bonferroni-adjusted P = 3.54 × 10⁻¹⁴). The latter result indicates that pruning mechanisms contribute to cognitive variation independently of glutamate signalling.
Control analyses supported the specificity of these findings. The monoamine list (Set E) produced only a modest effect (1.15-fold), which cleared the FDR filter but not Bonferroni correction, whereas the housekeeping genes (Set F) displayed no enrichment (1.05-fold; P = 0.573).
Uncorrected exploration of functional categories within the pruning annotations pinpointed three subgroups with conspicuous signals: cytoskeletal remodelling genes (2.56-fold enrichment), semaphorin–plexin guidance components (1.50-fold) and autophagy-related loci (1.41-fold). These patterns suggest that axonal guidance, structural reorganisation and intracellular degradation processes operate alongside synaptic pruning to influence individual differences in intelligence.
Transcriptome-Wide Association Study
Application of S-PrediXcan across the six brain tissues produced 66,419 gene–tissue statistics representing 16,252 unique genes. After FDR adjustment (q < 0.05) 3,910 associations, spanning 1,594 genes, remained significant.
Set-level analyses highlighted the shortened pruning list (set C) as the most enriched (Table 5): its average |Z| score (1.634) exceeded the genome-wide mean (1.187) by 38 % (P = 1.94 × 10⁻⁵). Two members, RHOA in caudate (Z = –10.76, FDR < 0.001) and HLA-C in frontal cortex (Z = 3.77, FDR = 0.0065), surpassed the gene-level FDR threshold.
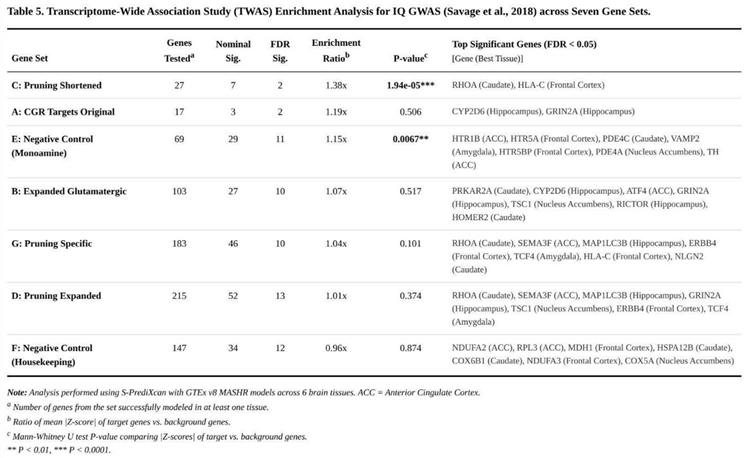
The original glutamate-receptor targets (set A) displayed modest over-representation (1.19-fold, P = 0.506). Within this group, CYP2D6 (hippocampus, Z = 6.89) and GRIN2A (hippocampus, Z = –4.88) achieved FDR significance. A comparable pattern was observed for the expanded glutamatergic list (set B; 1.07-fold enrichment, P = 0.517), where ten genes, including PRKAR2A in caudate (Z = –7.10), survived FDR control.
Signals persisted for the pruning categories: the expanded pruning collection (set D) showed essentially genome-wide enrichment (1.01-fold, P = 0.374) yet contained thirteen FDR-significant genes, whereas the pruning-specific subset free of glutamatergic overlap (set G) retained ten such genes (mean enrichment 1.04-fold, P = 0.101). Notable examples were SEMA3F in anterior cingulate (Z = 9.56) and MAP1LC3B in hippocampus (Z = 5.15).
The monoaminergic control (set E) yielded a weak but significant excess of signal (1.15-fold, P = 0.0068) with eleven FDR-positive genes, whereas the housekeeping reference (set F) showed no deviation from the genomic background (0.96-fold, P = 0.874).
Taken together, the curated target sets (A–D, G) exhibited an average 1.14-fold enrichment, exceeding that of the negative controls (1.06-fold). Importantly, pruning-related pathways retained association after removal of overlapping glutamatergic genes, implying a contribution to intelligence independent of traditional synaptic signalling mechanisms.
Discussion
Interpretation of Polygenic Enrichment Across Methods
Our convergent analyses—stratified heritability, MAGMA gene tests and TWAS—point to the same biological message: common variants tied to intelligence are not randomly scattered but cluster in synaptic biology. Two themes stand out. First, glutamatergic neurotransmission appears repeatedly. The original glutamate-receptor list (set A) shows strong enrichment: several NMDA and AMPA subunits surpass genome-wide thresholds in heritability models and in MAGMA. When the list is broadened (set B), the signal weakens a little but remains, hinting that downstream plasticity routes (for example CREB and mTOR) also matter.
Second, genes involved in synaptic pruning contribute independently of glutamate signaling. The compact pruning list (set C)—covering complement factors, microglial markers and key cytoskeletal genes—produces the highest TWAS enrichment and clear effects in other frameworks. Adding a wider range of pruning genes (set D) spreads the signal but does not erase it, consistent with many modest effects rather than a few strong ones. Notably, when genes that overlap glutamatergic pathways are removed (set G), pruning enrichment persists or even grows. This supports a model in which developmental circuit trimming, perhaps via complement tagging and microglial engulfment, leaves a detectable imprint on adult cognitive variation.
Control sets behaved as expected. Housekeeping genes showed no enrichment, and the monoaminergic list gave only modest signals that rarely survived strict correction. These patterns argue against a global bias and bolster the specificity of the findings.
Proposing a Calibrated Pruning Framework for Intelligence Variation
The converging evidence from partitioned heritability, MAGMA, and TWAS suggests that synaptic pruning has a measurable genetic contribution to individual differences in intelligence. Below, we outline how these signals motivate a "calibrated pruning" model—one that views pruning not as a uniform reduction of synapses, but as a developmentally timed calibration process that optimizes neural networks for efficient cognition.
Step 1: Synthesizing Enrichment Patterns
Pruning-related genes provided a stable source of polygenic signal across all three analytic approaches. In partitioned heritability, the focused pruning list (Set C) showed a 1.53-fold enrichment (P = 5.06 × 10⁻¹²), while the broader list (Set D) and the pruning-specific list that excluded glutamatergic genes (Set G) still displayed 1.17-fold (P = 1.38 × 10⁻²⁰) and 1.10-fold (P = 5.06 × 10⁻¹⁵) enrichment, respectively. MAGMA pinpointed the same sets (Set C, P = 6.22 × 10⁻³; Set G, P = 4.07 × 10⁻³), highlighting genes such as SEMA3F (Z = 7.52) and RHOA (Z = 7.08). TWAS added directionality: RHOA was down-regulated in caudate (Z = −10.76), whereas SEMA3F was up-regulated in anterior cingulate (Z = 9.56). Signals remained after removing glutamatergic overlap, implying that pruning contributes to intelligence independently of fast excitatory transmission.
Step 2: Linking Genetic Signals to Developmental Biology
Pruning refines neural circuits during early life by eliminating less active synapses, thereby increasing processing efficiency [10]. The enriched genes map well onto this biology. SEMA3F guides axonal retraction [11]; RHOA reorganizes the cytoskeleton during branch withdrawal [12]; MAP1LC3B supports autophagy of pruned elements [13]; and TCF4 helps set the timetable for cortical maturation [14]. Directional TWAS results align with a model suggesting that a brief postponement in pruning, succeeded by focused removal, enhances cognitive development. In contrast to schizophrenia, where excessive pruning seems harmful [6].
Step 3: Locating Novel Links and Gaps
Set G's persistence after exclusion of glutamatergic genes indicates that pruning is not merely a by-product of neurotransmission pathways. Previous GWAS meta-analyses of intelligence focused on synaptic structure in general [3], but they did not separate pruning. Our data include guidance cues (semaphorins), intracellular signaling (RhoA), and degradation machinery (autophagy), which suggest a series of events rather than just one. This cascade improves complement-centered models [15] by adding parts that come before and after them.
Step 4: Formulating the Calibrated Pruning Framework
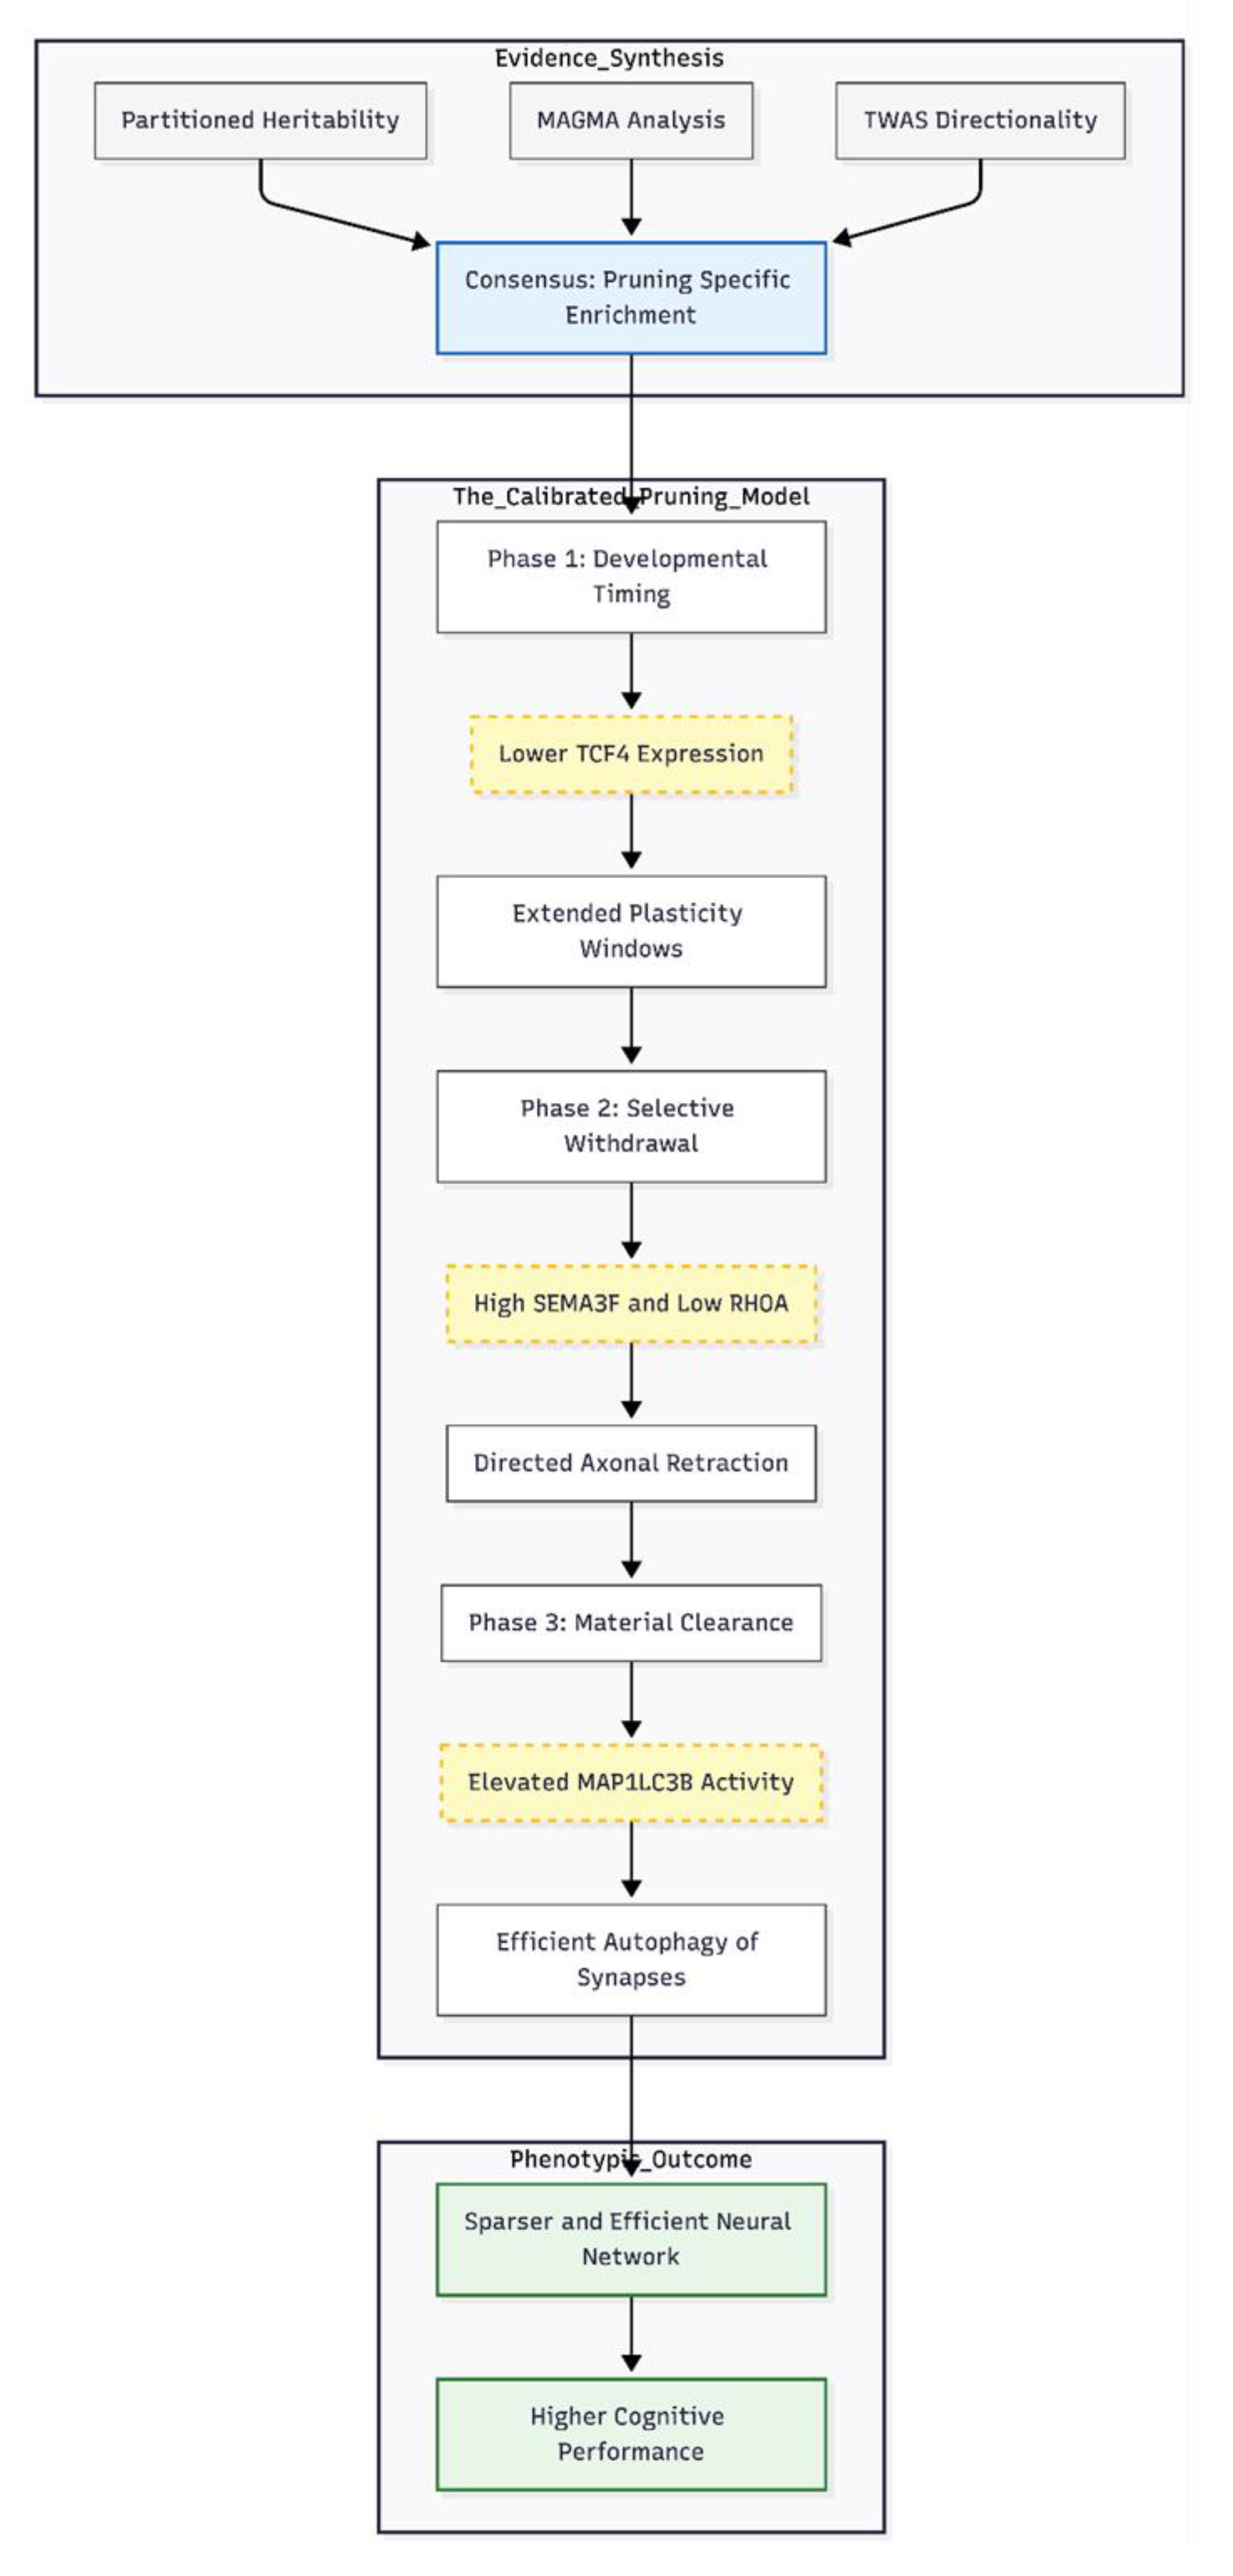
We therefore propose that common variants influencing IQ calibrate the timing and extent of pruning. Variants that lower TCF4 expression may modestly extend plasticity windows; increased SEMA3F and reduced RHOA activity then direct selective branch withdrawal; finally, elevated MAP1LC3B expression supports efficient removal of redundant synaptic material. The net result is a sparser yet more efficient network that supports higher cognitive performance.
Figure 1.
The Calibrated Pruning Framework for Intelligence. This diagram illustrates how converging genomic signals translate into a developmental model of cognition. Evidence Synthesis: Three analytical methods (Heritability, MAGMA, and TWAS) identify a robust enrichment of synaptic pruning genes independent of glutamatergic transmission. The Calibrated Pruning Model: Common genetic variants influence a three-stage cascade. First, reduced TCF4 expression modestly delays cortical maturation, extending plasticity windows. Second, up-regulated SEMA3F and down-regulated RHOA guide the selective retraction of axons and cytoskeletal reorganization. Third, increased MAP1LC3B facilitates the physical clearance of redundant material via autophagy. Phenotypic Outcome: The cumulative effect is a refined, metabolically efficient neural network that supports individual differences in intelligence.
Limitations of the Current Analyses
Our data strengthen the idea that genes steering synaptic pruning shape how bright we turn out to be, but a few warnings are in order. First, the underlying GWAS by [3] is almost entirely European. When nearly everyone in a study shares the same ancestry, effect sizes can skew and the results may not hold in groups whose linkage-disequilibrium patterns and causal variants differ [16]. Bigger, multi-ancestry cohorts are needed to see whether the same pruning signals show up worldwide.
Second, the methods we leaned on—partitioned heritability and MAGMA—treat genetic influence as additive and common. They mostly miss rare variants, dominance effects, or gene–gene interactions [17]. TWAS helps translate variants into biology, but GTEx panels capture adult brain tissue; the fetal and adolescent stages, when pruning peaks, are thinly represented [18]. Gene-set building adds another wrinkle. Our "subtract-out" strategy to create Set G assumes glutamatergic and pruning roles can be neatly separated even though many genes straddle both jobs [19].
While we did correct for multiple tests, the finer-grained enrichment checks were still exploratory, so it is easy to read too much into them. Mendelian randomization could, in theory, nail down cause and effect, but the timing ideas we float will ultimately need head-to-head tests in longitudinal imaging or organoid models that let us watch pruning in real time.
Conclusions and Future Directions
Caveats aside, the weight of evidence points to synaptic pruning as a polygenic, developmentally timed shaper of cognitive ability. Our Calibrated Pruning Framework blends the new genetic hits with known guidance, cytoskeletal, autophagic, and transcriptional pathways, arguing that small tweaks in when or how much pruning happens can fine-tune network efficiency—and, by extension, intelligence.
Next steps should move from statistics to bench work. Precise editing of candidates like SEMA3F or RHOA in induced neurons could chart the downstream cascades [11]. Single-cell epigenomics in large GWAS samples might pin down which cell types carry the regulatory load. Cross-trait studies that merge cognitive and psychiatric outcomes [20] could reveal when "calibrated" pruning shades into "excessive" and tips people toward disorder. By knitting together genetic numbers and developmental neurobiology, we hope to build a more nuanced, mechanistic story of how human minds take shape.
Funding Declaration
This research received no specific grant from any funding agency in the public, commercial, or not-for-profit sectors. .
Ethics Declaration
Not applicable.
Conflicts of Interest
None declared.
References
- Plomin, R; Deary, IJ. Genetics and intelligence differences: Five special findings. Molecular Psychiatry 2015, 20(1), 98–108. [Google Scholar] [CrossRef] [PubMed]
- Lee, JJ; Wedow, R; Okbay, A; et al. Gene discovery and polygenic prediction from a genome-wide association study of educational attainment in 1.1 million individuals. Nature Genetics 2018, 50(8), 1112–1121. [Google Scholar] [CrossRef] [PubMed]
- Savage, JE; Jansen, PR; Stringer, S; et al. Genome-wide association meta-analysis in 269,867 individuals identifies new genetic and functional links to intelligence. Nature Genetics 2018, 50(7), 912–919. [Google Scholar] [CrossRef] [PubMed]
- Koopmans, F; van Nierop, P; Andres-Alonso, M; et al. SynGO: An evidence-based, expert-curated knowledge base for the synapse. Neuron 2019, 103(2), 217–234.e4. [Google Scholar] [CrossRef] [PubMed]
- Collingridge, GL; Volianskis, A; Bannister, N; et al. The NMDA receptor as a target for cognitive enhancement. Neuropharmacology 2013, 64, 13–26. [Google Scholar] [CrossRef] [PubMed]
- Sekar, A; Bialas, AR; de Rivera, H; et al. Schizophrenia risk from complex variation of complement component 4. Nature 2016, 530(7589), 177–183. [Google Scholar] [CrossRef] [PubMed]
- de Leeuw, CA; Mooij, JM; Heskes, T; et al. MAGMA: Generalized gene-set analysis of GWAS data. PLOS Computational Biology 2015, 11(4), e1004219. [Google Scholar] [CrossRef] [PubMed]
- Barbeira, AN; Dickinson, SP; Bonazzola, R; et al. Exploring the phenotypic consequences of tissue-specific gene expression variation inferred from GWAS summary statistics. Nature Communications 2018, 9(1), 1825. [Google Scholar] [CrossRef] [PubMed]
- Urbut, SM; Wang, G; Carbonetto, P; et al. Flexible statistical methods for estimating and testing effects in genomic studies with multiple conditions. Nature Genetics 2019, 51(1), 187–195. [Google Scholar] [CrossRef] [PubMed]
- Paolicelli, RC; Bolasco, G; Pagani, F; et al. Synaptic pruning by microglia is necessary for normal brain development. Science 2011, 333(6048), 1456–1458. [Google Scholar] [CrossRef] [PubMed]
- Riccomagno, MM; Hurtado, A; Wang, H; et al. The RacGAP β2-Chimaerin selectively mediates axonal pruning in the hippocampus. Cell. 2012, 149(7), 1594–1606. [Google Scholar] [CrossRef] [PubMed]
- Bagri, A; Cheng, HJ; Yaron, A; et al. Stereotyped pruning of long hippocampal axon branches triggered by retraction inducers of the semaphorin family. Cell. 2003, 113(3), 285–299. [Google Scholar] [CrossRef] [PubMed]
- Lieberman, OJ; McGuirt, AF; Tang, G; et al. Roles for neuronal and glial autophagy in synaptic pruning during development. Neurobiology of Disease 2019, 122, 49–63. [Google Scholar] [CrossRef] [PubMed]
- Forrest, MP; Hill, MJ; Kavanagh, DH; et al. The Psychiatric Risk Gene Transcription Factor 4 (TCF4) Regulates Neurodevelopmental Pathways Associated With Schizophrenia, Autism, and Intellectual Disability. Schizophrenia Bulletin 2018, 44(5), 1100–1110. [Google Scholar] [CrossRef] [PubMed]
- Holland, JF; Cosgrove, D; Whitton, L; et al. Beyond C4: Analysis of the complement gene pathway shows enrichment for IQ in patients with psychotic disorders and healthy controls. Genes, Brain, and Behavior 2019, 18(8), e12602. [Google Scholar] [CrossRef] [PubMed]
- Martin, AR; Kanai, M; Kamatani, Y; et al. Clinical use of current polygenic risk scores may exacerbate health disparities. Nature Genetics 2019, 51(4), 584–591. [Google Scholar] [CrossRef] [PubMed]
- Yang, J; Lee, SH; Goddard, ME; et al. GCTA: A tool for genome-wide complex trait analysis. American Journal of Human Genetics 2011, 88(1), 76–82. [Google Scholar] [CrossRef] [PubMed]
- Paus, T; Keshavan, M; Giedd, JN. Why do many psychiatric disorders emerge during adolescence? Nature Reviews Neuroscience 2008, 9(12), 947–957. [Google Scholar] [CrossRef] [PubMed]
- Faust, TE; Gunner, G; Schafer, DP. Mechanisms governing activity-dependent synaptic pruning in the developing mammalian CNS. Nature Reviews Neuroscience 2021, 22(11), 657–673. [Google Scholar] [CrossRef] [PubMed]
- Allegrini, AG; Karhunen, V; Coleman, JRI; et al. Multivariable G-E interplay in the prediction of educational achievement. PLOS Genetics 2020, 16(11), e1009153. [Google Scholar] [CrossRef] [PubMed]
Disclaimer/Publisher’s Note: The statements, opinions and data contained in all publications are solely those of the individual author(s) and contributor(s) and not of MDPI and/or the editor(s). MDPI and/or the editor(s) disclaim responsibility for any injury to people or property resulting from any ideas, methods, instructions or products referred to in the content. |
© 2026 by the authors. Licensee MDPI, Basel, Switzerland. This article is an open access article distributed under the terms and conditions of the Creative Commons Attribution (CC BY) license (http://creativecommons.org/licenses/by/4.0/).
Copyright: This open access article is published under a Creative Commons CC BY 4.0 license, which permit the free download, distribution, and reuse, provided that the author and preprint are cited in any reuse.


