Preprint
Article

This version is not peer-reviewed.

Significance of Mineral Nitrogen Transformation and Microbial Community Stabilization Affected by Organic and Biological Amendment in Intensive Cropping System

Submitted:

04 January 2026

Posted:

06 January 2026

You are already at the latest version

Abstract

Due to intensified use of fertilizers and inconsiderable organic matter return, the intensive cropping system is evidently changing soil properties. Even though the changes are hardly predictable spontaneously, it could appear with imbalanced soil mineral nitrogen transformation and decreased biological nitrogen immobilization. To address this uncertainty, we investigated the linkage of soil nitrogen transformation and soil microbial community distribution with the mineral nitrogen fertilization in long-term intensive cropping system during 2019-2022. In this study a three-factor (Factor A: rate of nitrogen (100, 150, 180 and 230 kg N ha−1); Factor B: organic fertilizers (0 and 300 kg ha−1); Factor C: liquid biological activator (0 and 0.1 L ha−1)) experiment carried out on a loam soil (Calcaric Luvisol) in intensive cropping system (in rotation: winter wheat, winter wheat, winter rape and winter wheat). At the study site, soil organic carbon was significantly higher at higher rates of nitrogen application combined jointly with application of organic matter and biological activator. Although the rate of nitrogen fertilization was increasing, either in combination with organic matter or biological activator, induced no significant changes in the accumulation of total nitrogen. Thus, with higher rates of nitrogen fertilization, the content of biologically transformed nitrogen significantly increased. As nitrogen is released from organic matter, it was evident that organic matter inputs affected the biological nitrogen transformation. Organic matter inputs also affected the increase soil fungal community, however, with higher nitrogen inputs soil fungal and bacteria ratio was decreasing. This study highlights the significance of sustainably maintaining of nitrogen and organic matter inputs in intensive cropping systems.

Keywords: 
;  ;  ;  ;  ;  ;  

1. Introduction

The holistic approach of nitrogen (N) management is emphasizing on the balanced nutrient input into the soil, stabilization of soil biological activity, and ecological feedback for the sustain of long-term soil productivity [1]. Along these aspects, soil fertility is settled as not only a function of nutrient supply but also as a complex of biological and biochemical processes that regulate nutrient transformation and availability. However, by the integrating an organic and biological amendments into intensive cropping systems, the natural N cycling can be improved by soil organic matter diverse turnover, microbial diversity, enzymatic activity, and strengthened soil–plant–microbe interactions [2,3,4]. Even though integrative management practices already are promoted, modern intensive agriculture still relies heavily on mineral N fertilizers to maintain high yields of agricultural plants [5,6,7]. Hence, assessing the interactions between N transformations and microbial community responses under integrative amendment practices is crucial for balancing crop productivity with long-term soil health.
The most evident that mineral N fertilization is still the most widely employed method to maintain high crop yields in the intensive cropping systems [8]. The rate of mineral N application are depending on crop, soil fertility, climatic conditions, and management practices. In intensive cereal crop systems, mainly 100–300 kg N ha⁻¹ yr⁻¹ are applied, nevertheless, sustaining high yields continued application of N can even exceed 500 kg N ha⁻¹ yr⁻¹ [9,10,11]. High mineral N inputs are excessing of crop demand and leading to low nitrogen use efficiency, typically below 50 %, with the remaining N lost through leaching, volatilization, or denitrification [12,13]. Imbalanced N fertilization not only represents an economic inefficiency but also contributes to environmental problems, including nitrate pollution of groundwater and emission of nitrous oxide, a potent greenhouse gas [14,15,16]. Consequently, optimizing mineral N application rates according to site-specific soil and crop conditions, while integrating organic and biological amendment, has become a key focus for improving nutrient use efficiency and minimizing ecological risks in intensive agricultural systems.
The application of mineral N fertilizers significantly influences soil chemical and physical properties, hence, long-term N fertilization often leads to negative changes: nutrient solubility and imbalance, soil acidification and soil structure deterioration [17,18,19]. High N application rates are commonly associated with deficiencies in phosphorus, calcium and magnesium, as soil acidification and nutrient competition reduce nutrient availability to plants [20,21,22]. Additionally, high N application rates disturb the balance of stabilized organic matter, thereby negatively affecting soil structure and cation exchange capacity [22,23]. These alterations reduce soil fertility and limit soil to sustain productive cropping systems in the long-term perspective [24,25].
It is estimated that crops are responding positively (increasing in yield) to higher rates of mineral N inputs [26]. However, not only the quantity of crop yield is an important factor on the optimizing mineral N application. On the higher mineral N inputs, crop yield and grain protein content is increasing [27]. Thus, higher mineral N inputs provided lower crop yield benefit but caused crop grain quality imbalance [28]. Even though, increased mineral N inputs can enhance crop plant defense activities and may lead to physiological stress and reduced overall productivity [29]. This can indicate about the changes in symbiotic rhizobia or mycorrhizal fungi reduction, thus, in shift of microbial community with decreasing in plant-microbial associative and beneficial diversity [30].
Higher mineral N inputs influence the structure and function of agricultural soil microbial communities [31]. As high mineral N inputs suppress symbiotic and free-living N fixers (e.g., Rhizobium, Azotobacter spp.), also suppress an arbuscular mycorrhizal fungi and reduces nutrient cycling and soil–plant symbiosis efficiency. Continuous high N application can alter soil enzyme activities related to carbon and phosphorus cycling and accelerate soil acidification, both of which negatively affect microbial balance and soil health [32,33,34]. Consequently, while high N rates may initially enhance plant growth, they can lead to long-term declines in soil microbial diversity, ecosystem stability, and nutrient-use efficiency. Thus, mineral N rate can decline the production of microbial biomass in the soil with implications for soil carbon storage and plant nutrient uptake [35,36].
Nevertheless, few studies have been conducted to clarify the integrated impacts of N application, organic and biological amendment on the correlation with the soil nitrogen transformation and microbial community composition changes. Therefore, knowing the strategies on integrated use of N fertilizers with organic and biological amendments may help in manage the optimal balance between mineral and organic/biological inputs for soil nutrient efficiency, soil biological activity and long-term soil productivity for sustainable management of intensive cropping systems. In this context, the purposes of this research were (1) to investigate the impacts of integrated use of N fertilizers, organic and biological amendments on the soil quality variables including chemical and biological soil parameters and (2) to determine the optimum of mineral N input for field conditions to encourage farmers to reduce mineral N fertilizer use in order to mitigate nutrient use insufficiency. We hypothesized that with reducing mineral N inputs and integrating organic and biological amendments, soil nutrient efficiency and biological stabilization will be improved.

2. Materials and Methods

2.1. Study Area

The experiment was conducted from 2019 to 2022 in an intensive cropping system experimental site located in the south-central part of Lithuania (54°52′ N lat., 23°49′ E long.) with the mid-latitude, transitional climate. The study area, with elevation varying between 68 and 72 m, is developed on loam texture soil with chemically rich limnoglacial parent material. There, the intensive cropping system with long-term winter wheat-winter rapeseed cultivation under conventional tillage continues more than ten years before the start of experiment. At the beginning of the experiment, soil texture and main chemical properties as well as climate indices were estimated (Table 1.).
Since 2012 in study area long-term soil productivity was conserved by adjusting crop residue management practice. An average of 5.4–9.0 t ha⁻¹ of straw residues were retained into the site soil by shallow loosening (up to 10 cm depth) and, only prior winter rapeseed sowing, deep loosening (up to 30 cm depth) was carried out. Intensive cropping system included summer field pea (Pisum sativum L.; during 2016–2017 growing season), winter rapeseed (Brassica napus L.; during 2017–2018 and 2020–2021 growing seasons) and winter wheat (Triticum aestivum L.; during 2018–2019, 2018–2019 and 2021–2022 growing seasons).

2.2. Experimental Design

The field trial comprised three treatments: (1) mineral N fertilizer application (100, 150, 180 and 230 kg N ha−1) (N100, N150, N180 and N230); (2) application of organic fertilizers (OF; 0 and 300 kg ha−1) (O- and O+); (3) application of biological activator (BA; 0 and 0.1 L ha−1) (B- and B+). Experiment plots in size 900 m2 (30 m × 30 m) were arranged in a randomized complete block design with three replications. The experiment corresponding mineral N rates (l ha−1) of urea and ammonium nitrate solution (32% N, density 1.3 kg m−3) was applied with first spring application when vegetation started and 200 kg ha−1 of ammonium sulfate (21% N + 24% SO4) applied with second spring application. Organic fertilizers in form of granulated poultry manure (pHH2O 7.2) contained about 32% organic carbon, 3.6% nitrogen, 3.6% phosphorus, and 2.9% potassium and were applied (300 kg ha¹ of physical weight with 64% of organic matter) in summer on stubble after harvest. Biological activator contained bacteria (Bacilllus megaterium L. and Bacilllus subtilis L. (≥1 × 10⁹ colony forming unit’s ml−1) and filamentous fungi (Trihoderma reesei L., Trihoderma longibrachiatum L. and Trihoderma asperellum L. (≥1 × 10⁷ colony forming unit’s ml−1) strains and was applied (0.1 l ha¹) in summer on stubble after harvest.

2.3. Sampling and Analysis

In the spring of each experiment conducting year before the first mineral N fertilizers application, three mineral soil samples (0–20 cm) were randomly collected using an auger at ten random locations within each plot. A total of 48 soil samples per an experiment year were collected. These samples were combined and sieved through a 5 mm mesh sieve to eliminate visible plant debris and stones. A 0.2 mm sieve was used to separate the soil samples in order to analyze the soil organic carbon content. One part of soil sample was air-dried for the pH, total nitrogen and soil organic carbon content analysis, while the other was refrigerated at 4 °C for the analysis of biologically transformed nitrogen (NH₄–N+NO₃–N) content estimation and soil microbial community counts assessment.
Soil chemical investigations were performed in the Chemical Research Laboratory of the Lithuanian Research Centre for Agriculture and Forestry. Using an IONLAB pH meter, the pHKCl of the soil was measured in accordance with ISO 10390:2005 standard [38] (soil–solution ratio 1:2.5). The Kjeldahl method was used to quantify the total nitrogen (TON) in the soil. The method applied for determining the soil organic carbon content (SOC) was ISO 10694: 1995 [39]. Biologically transformed nitrogen content and soil microbial community counts were estimated in the Agrobiology Laboratory of Vytautas Magnus University Agriculture Academy. The colorimetric method was used to analyze biologically transformed nitrogen (NBIO; NH₄–N+NO₃–N) content in accordance with ISO 14256-2:2005 standard [40]. Soil microbial community (bacteria and microscopic fungi) cultivated using the soil suspensions dilution and plate-count technique with selective media: meat–peptone agar and starch–ammonia agar for bacteria using the mineral source of nitrogen [41], and potato dextrose for filamentous fungi and yeasts/yeast-like fungi [42]. The total microbial abundance (TMA) in colony forming units (CFU) was calculated per gram of dry soil. All cultivations were conducted under aerobic condition at 30°C for a week without shaking. All media were autoclaved at 121°C for 15 min before use.

2.4. Statistical Analysis

Research data was statistically evaluated by applying the method of variance analysis of quantitative characteristics using the statistical program SAS (version 9.4). Primary analysis of all variables was performed using the principle components analysis procedure (PCA, XLSTAT statistical program). The t-test procedure was applied to pairwise comparisons of experimental treatments (SAS). Differences between mineral N application rate, organic fertilizer and biological activator treatments were determined by Tukey's test at a significance level of p≤0.05 (SAS). Results of the study are presented as means ± standard error. Partial Least Square (PLS) model method was used to evaluate the dependence of soil properties on the year, fertilization rate, organic fertilizer and biological activator treatments (XLSTAT). Variance analysis was performed with the SAS GLM procedure.

3. Results

3.1. Soil Chemical Properties

The results of soil chemical properties in the surface soil (0–20 cm) are presented in Table 2. It was estimated, that soil pH was changing along with experiment implementation. Even though in the second year of experiment soil pH had the tendencies to be lower, it increased in the fourth year. The pH was significantly increasing, applying N150 and N230, respectively, in addition with the OF and BA. Thus, soil pHKCl values were stabilized for four years jointly applying the OF and BA with N100 and N150 (from 7.2 to 7.3), but applying N180 and N230, soil pHKCl significantly increased (from 6.8 to 7.5). The TON content ranged from 0.11 mg kg-1 to 0.29 mg kg-1. However, it was significantly increasing with the increased mineral N rate, especially with N180 and N230, and jointly applying the OF and BA. However, the lower mineral N rates (N100 and N150) even with addition of the OF and BA, decreased the TON content over the fourth year of experiment implementation. The C:N ratio in soil was changing to a similar extent from 5.6 to 13.0, however, significant differences in the C:N ratio were estimated then lower mineral N rates (N100 and N150) jointly with the BA were applied. In addition, even the C:N ratio increased with the increased mineral N rate in the fourth year of experiment implementation, but the differences between the treatments were not significant.

3.2. Soil Biological Properties

The mineral N fertilization, the OF and BA application significantly affected soil biological properties in the surface soil (0–20 cm) (Table 3). It was estimated that the increase in the mineral N rates (N180 and N230) decreased the total microbial abundance by 35%. However, increasing mineral N rates and in addition applying the OF and BA, the significant increase in total microbial abundance (TMA varied from 1.6×10⁶ to 2.8×10⁶ CFU) was estimated. The TMA also decreased along with mineral N rate and additionally applied BA. The increase in mineral N rate (N180 and N230) was negatively affected fungi:bacteria ratio, - it was decreasing in average by two times, if compared with N100 rate impact. The significantly higher fungi:bacteria ratio was estimated since applying N180 with the OF and BA addition. However, the NBIO (NH4+ + NO3-) transformation was in lower extent since applying only the mineral N fertilizers. The NBIO content was increasing by applying higher mineral N rates along with the OF addition or combining the OF and BA addition. Thus, the NBIO content was significantly higher applying N180 and combining with the OF and BA addition.

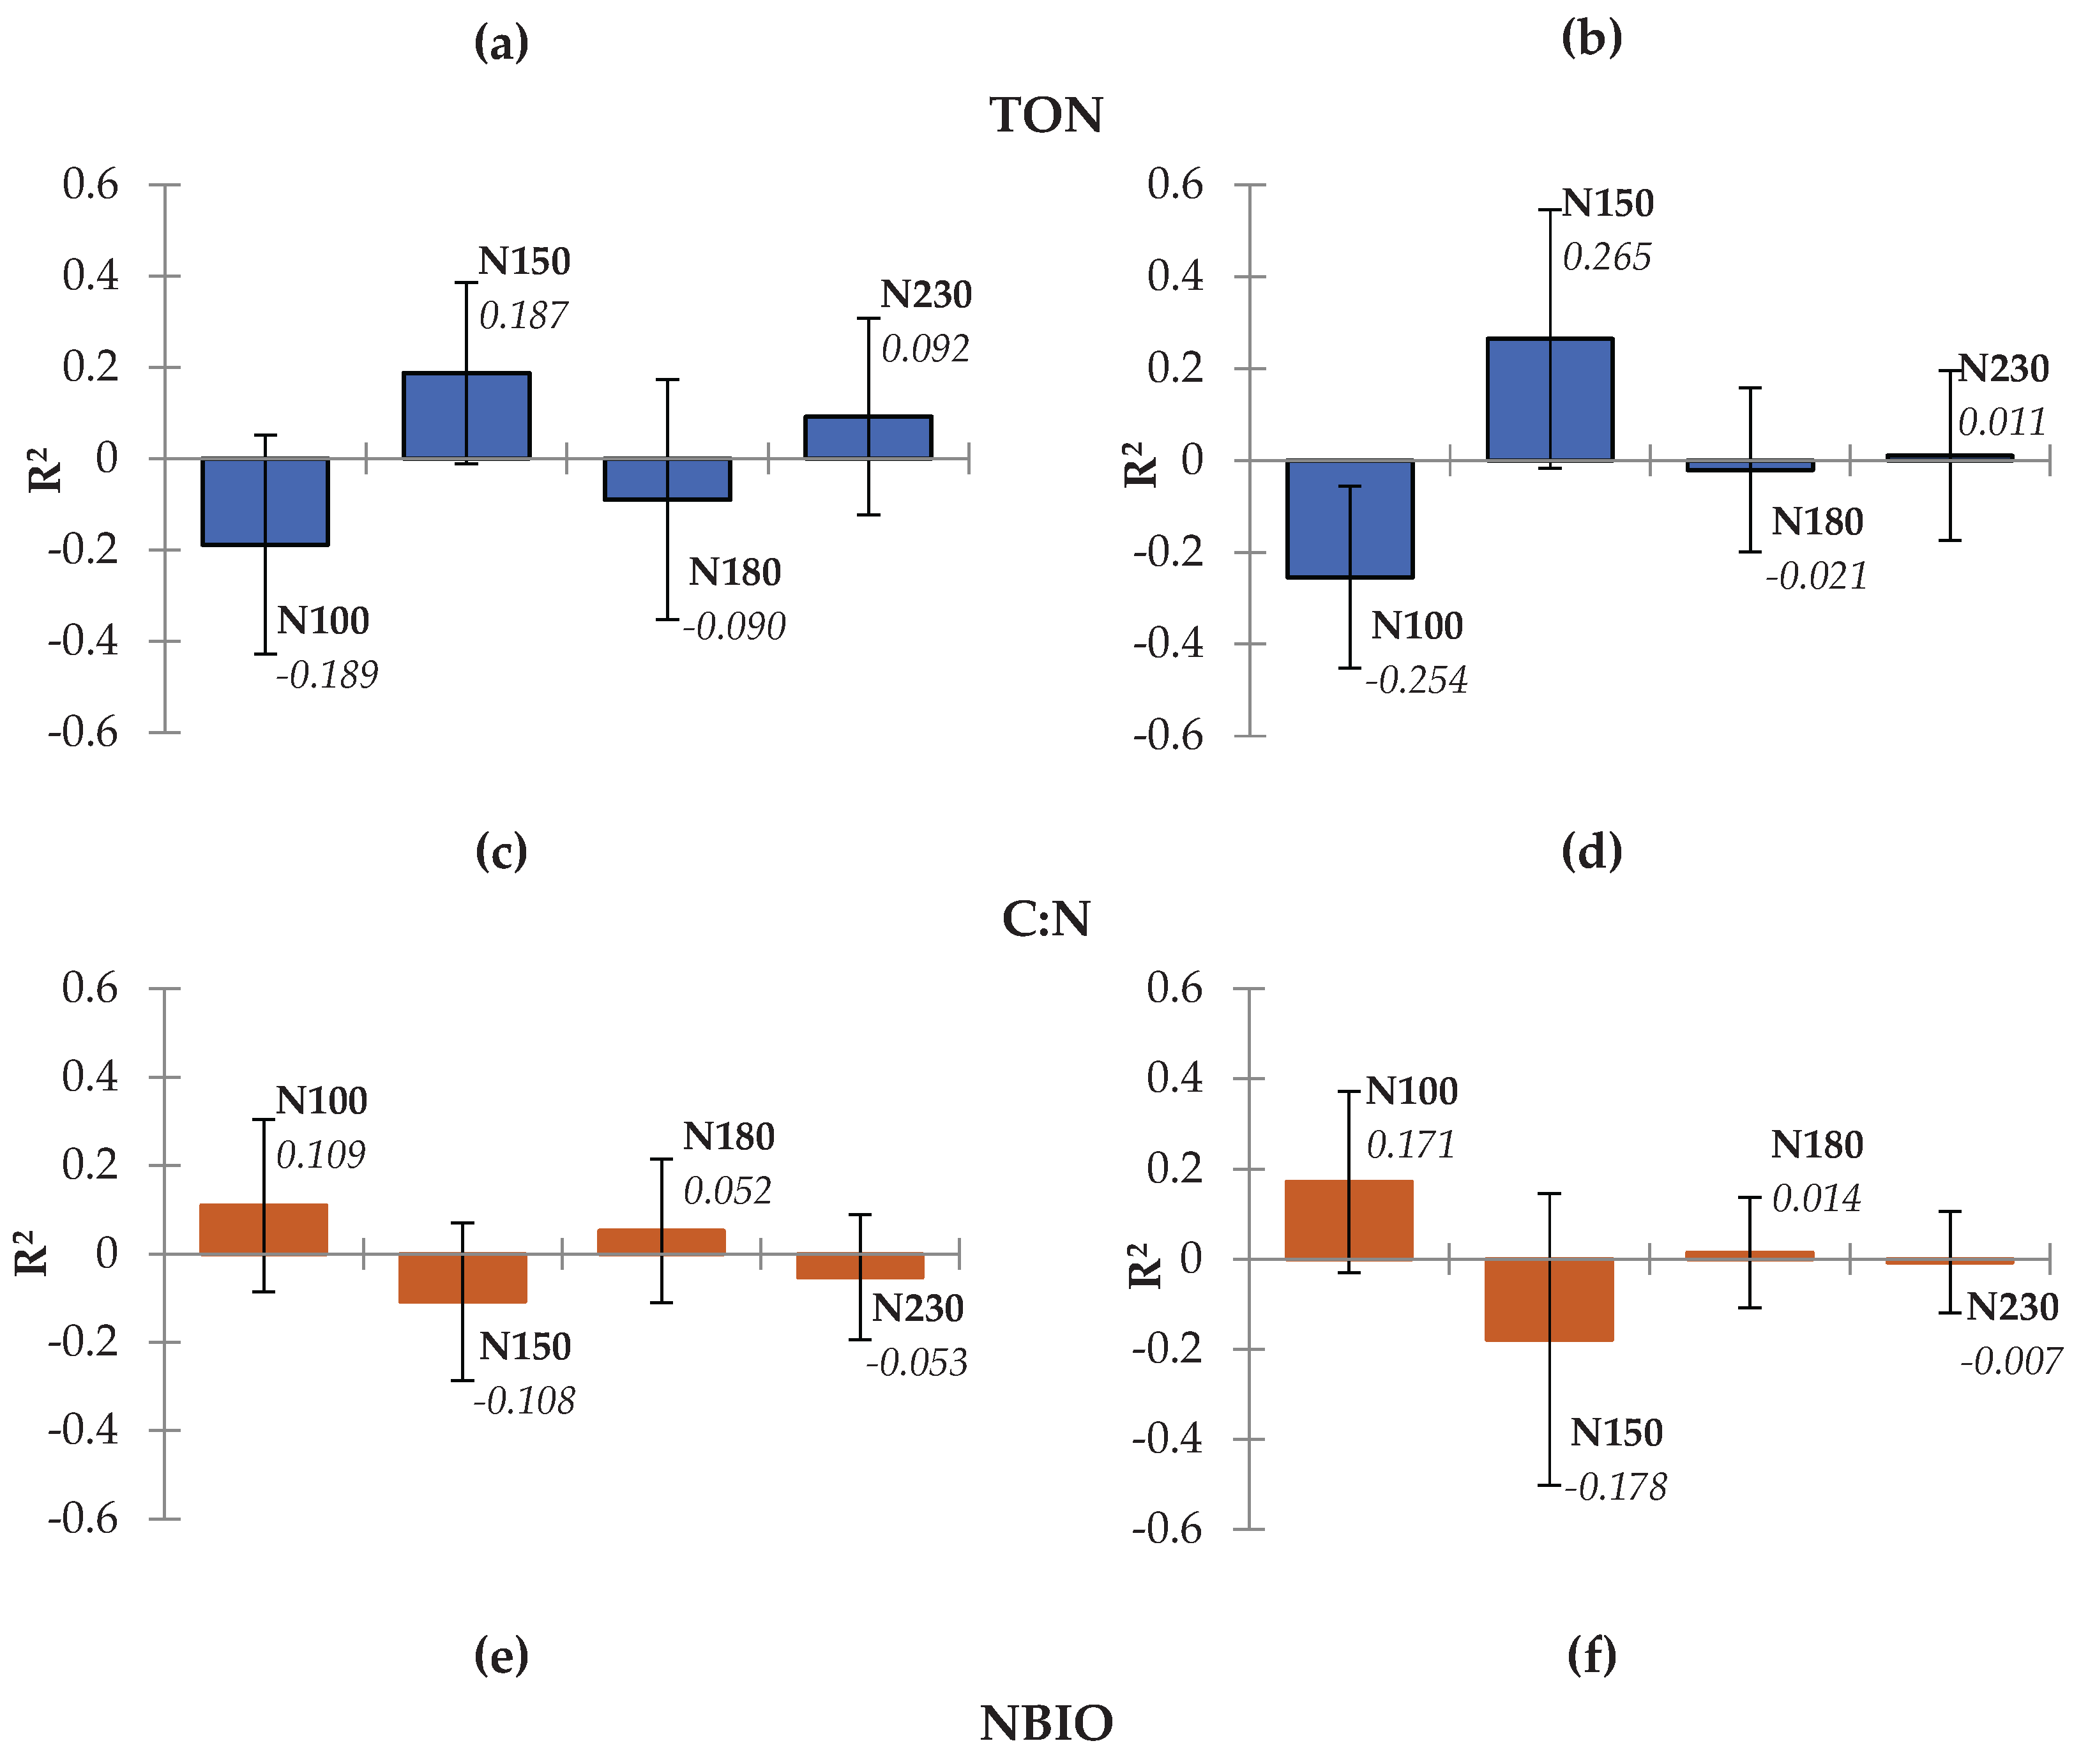
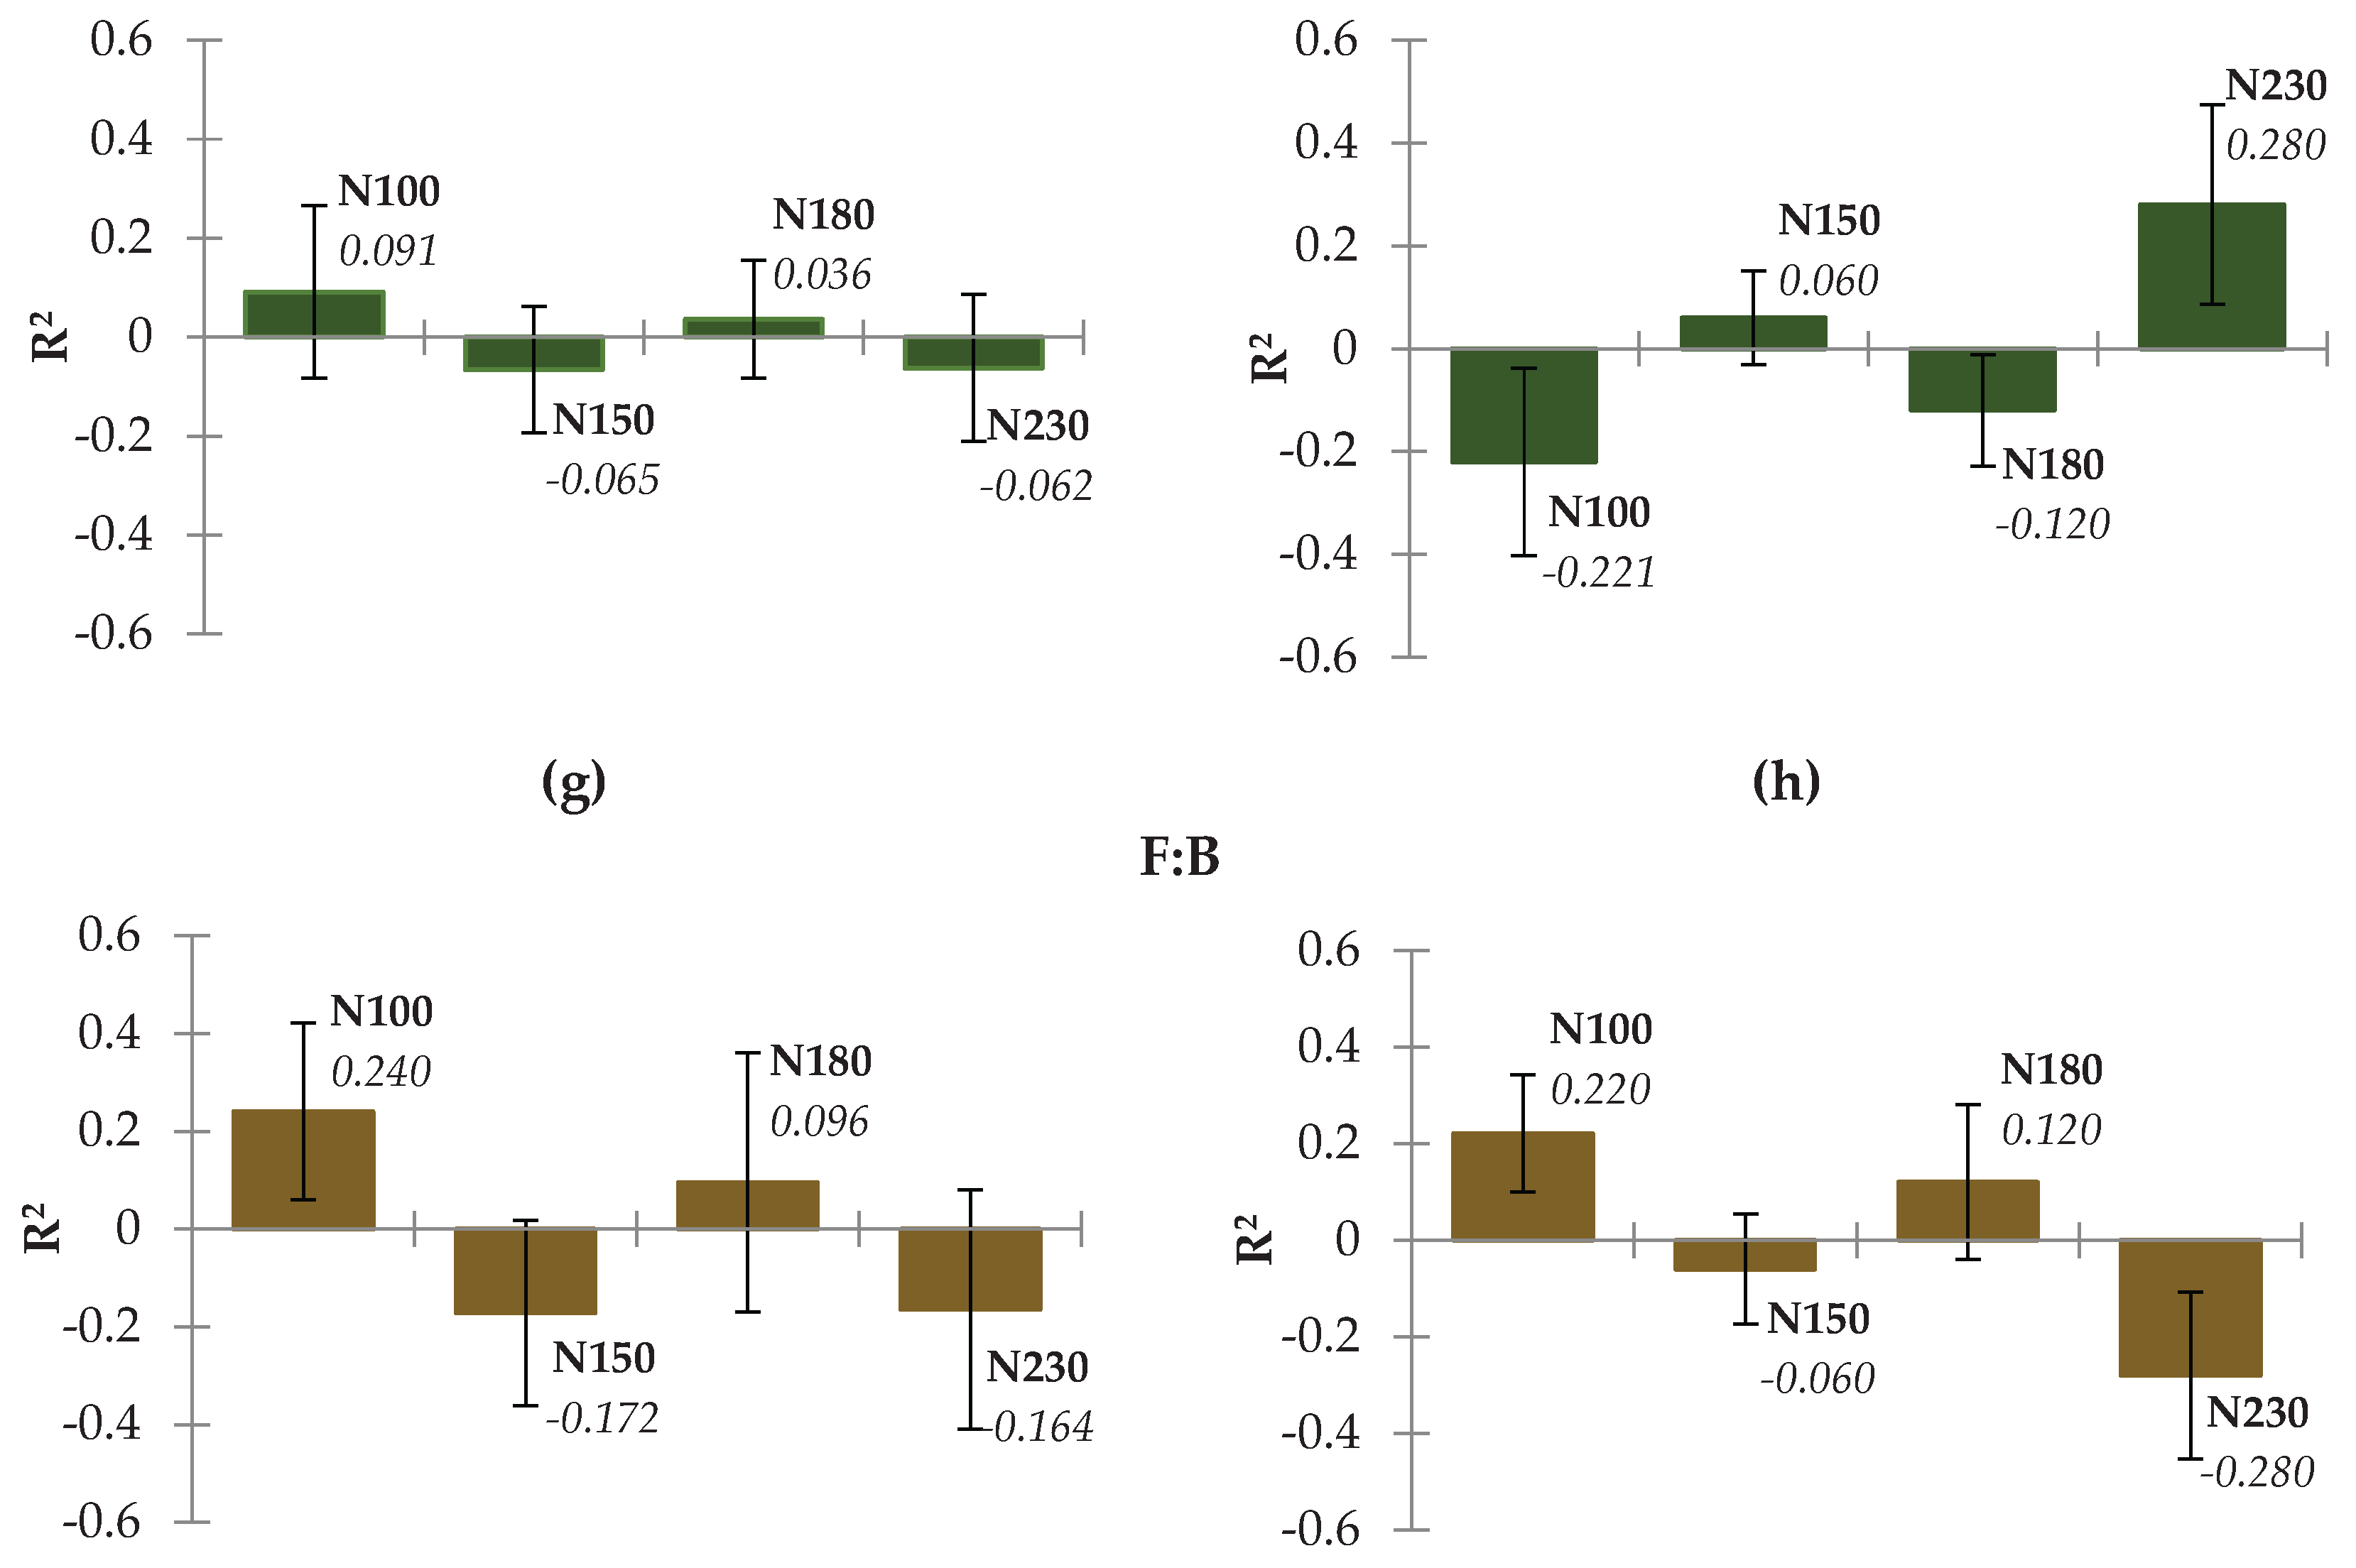
3.3. Relationship Between Applied Fertilization and Soil Properties

The principal component analysis (PCA) was conducted to analyze the effect of fertilization on soil chemical and biological data dispersion (Figure 1). The results showed that data on soil properties dispersion in the second year of experiment implementation (Figure 1 (a)) in the PC1 accounted for 40.1% and in the PC2 accounted for 21.2% of total variance. Due to the mineral N application and the OF and BA combining, the higher data dispersion in the PC1 were indicating the dominance of soil microbial indicators – the TMA (also separately bacteria (BA) and fungi (FA) abundance), fungi:bacteria ratio and the NBIO content. However, in the PC2 data of soil chemical properties – mainly, the TON and SOC were distributed. The distribution of indicators showed that microbiological properties were the main ones affected and caused distinct shifts in soil properties. In the fourth year of experiment implementation, soil chemical and biological data dispersion in the PC1 accounted for 33.5% and in the PC2 accounted for 27.0% of total variance (Figure 1 (b)). Thus, increase in variance by the PC2 could reflect the ongoing long-term fertilization, contributed more to overall variability relative influence. However, the concentration of soil microbial variables in the PC1 reflected the close relation of changing microbial community depending not only on fertilization, but itself affecting nitrogen transformation and also reflecting on the soil C:N ratio changes. The variables of the soil C:N ratio in the PCA components were dynamic (in 2020 and in 2025) and possibly reflecting the changes in the SOC and TON.

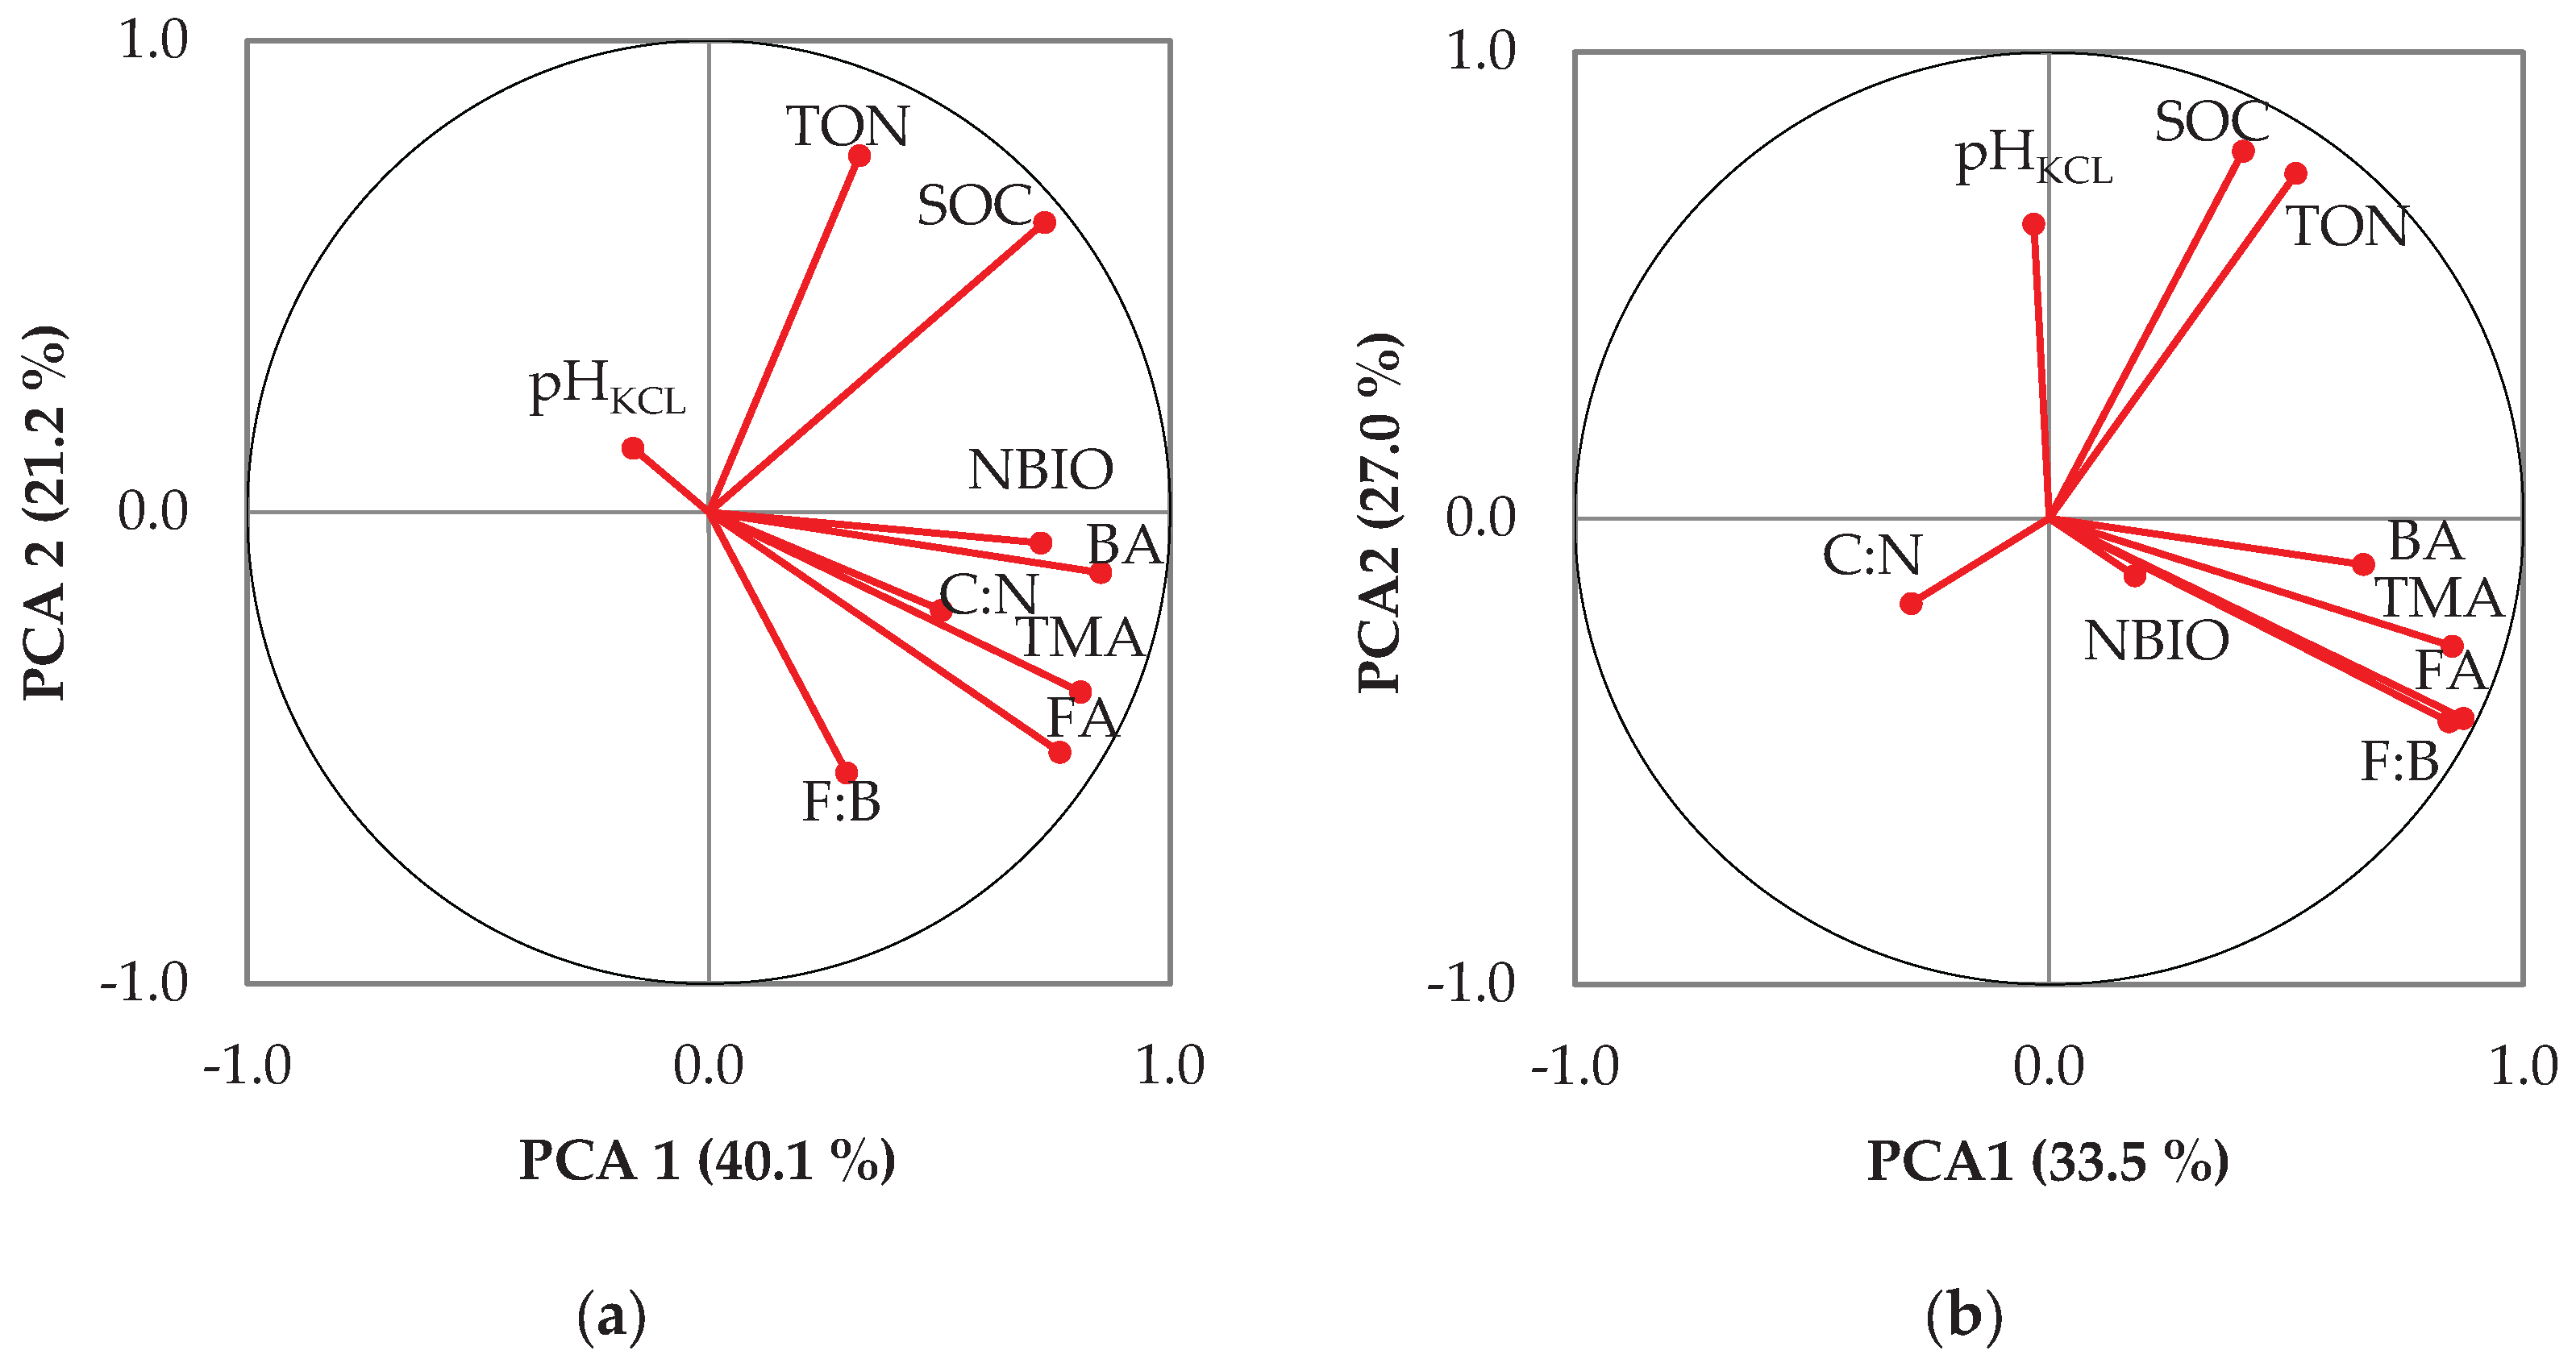
3.4. The PLS Regression for Soil Variables

As in this study, mineral N application and the OF and BA combining slower N releasing rate and increase N use efficiency. However, mineral N application had the most pronounced impact on soil chemical and biological properties. Consequently that, the PLS regression analysis indicated the different variability pathways in soil properties due to the mineral N treatments (Figure 2). It could be noticed that mineral N treatment influenced the variability of TON content (Figure 2a-b). Based on regression coefficient (R2), the N150 contributed more positively to variability of TON content (R2 = 0.187) in soil in the second year of experiment implementation. Thus, even on the fourth year the N150 application strengthened the positive variability of TON content (R2 = 0.265) in soil. In contrast, lower mineral N application rate (N100) contributed negatively to TON content variability (R2 = 0.189 and R2 = 0.254). However, the increasing rate of mineral N contributed negatively or with minor impact on soil TON content variability.
Experimental data on soil C:N ratio indicated about the mineral N availability. However, mineral N application could directly increase crop-derived biomass production but indirectly sustain soil C:N ratio (Figure 2c-d). Based on R2, along the four years of experiment implementation, only the mineral N100 contributed more positively to variability of soil C:N ratio (R2 = 0.171). The increasing rate of mineral N contributed negatively (when N150, R2 = - 0.178) or with minor impact on soil C:N ratio variability (R2 ≤ 0.052). In this case, it was evident that higher mineral N application enhanced to alter N pool lability.
Soil biological N immobilization in our experiment was not corresponding to the mineral N fertilization rate directly, however, mineral N application changed soil microbial community composition. Taking this into account, it could be noticed that even second year of experiment implementation soil NBIO transformation variability (R2 ≤ 0.091) was mostly with minor impact due to the mineral N application (Figure 2e). However, the mineral N application along four years of experiment considered to influence the variability of soil F:B ratio (Figure 2g-h). Higher mineral N application rate (N230) contributed to lower soil F:B ratio (R2 = -0.280), thus, in this case the dominance of bacterial community could increase the ability to intensify immobilization of mineral N (Figure 2f). In contrast, lower mineral N application rates, N100 and N180, contributed more positively to variability of soil F:B ratio (R2 = 0.220 and R2 = 0.120) but negatively to variability of soil NBIO transformation (R2 = - 0.221 and R2 = - 0.120; Figure 2f). In these cases, it is likely that microbial community reduced intensity of mineral nitrogen immobilization. However, N150 application contributed with minor impact on soil F:B ratio and NBIO transformation variability. In fact, N150 application did not strongly alter soil microbial community structure and soil biological N immobilization.

4. Discussion

It is evident that mineral N application is changing soil chemical and biological properties [19,24,30]. However, even the mineral N is applied, soil nutrient balance should be maintained and soil biological functions should be preserved [43,44]. In this study, mineral N management was selected as factor in the indication of soil stability through soil mineral N transformation (Table 2) and microbial community structure shifting (Table 3). It was estimated that the TON content in soil was significantly increasing with the increased mineral N rate and jointly applying the OF and BA. However, the lower mineral N rate even with addition of the OF and BA, decreased the TON content over the fourth year of experiment implementation. These findings explain the importance of soil enrichment in organic matter along with increasing mineral N fertilization rate in intensive cropping system. Similar estimations were found in several long-term field experiments [45,46,47]. However, there is evidence that even in addition of the OF, the mineral N application rates have the limits [48,49]. Mineral N transformation with not intensified nitrate leaching from mineral fertilizers or organic residues found to be with N input about 150–200 kg N ha⁻¹ [50,51,52,53]. In some soils with a potential for mineral N mineralization, nitrate leaching increased exponentially with increasing mineral N application rate even from 120 to 160 kg N ha⁻¹ [54,55]. Based on our results, mineral N application should not exceed up to 150 kg N ha⁻¹ rate, as due to mineral N inputs excessing of crop demand it is increasing probability to disturb soil microbial community and soil biological functions (Table 3).
With increasing mineral N application, carbon availability and microbial activity is becoming limited and leading in reduced efficiency of NBIO transformations [46,49,56]. As it was estimated in our study, the NBIO transformation was decreasing since applying only the mineral N fertilizers (Table 3). However, the NBIO content was significantly increasing by applying mineral N (particularly applying N180) along with the OF addition. It is well known that mineral N application is changing NBIO transformation through settlement of N immobilisation, mineralisation, nitrification or denitrification in soil [57,58]. Thus, mineral N transformation used to be balanced in soils between N immobilisation and mineralization [59]. With higher mineral N rate soil is reducing mineral N transformation balance as N transformation could not be biologically regulated [60]. Higher mineral N application often found to change microbial structure and N transformation functional genes, and sometimes even microbial diversity [59,61,62]. Based on our results, the increase in mineral N application (especially applying N180 and N230) decreased the TMA and F:B ratio (Table 3). According to Grzyb et al. [59] and Khmelevtsova et al. [63], higher mineral N rates changing soil microbial community composition to fast mineral N assimilating bacteria but with less in abundance of capable symbiotic microbial communities. Bacteria dominance in soil accelerates mineral N turnover and increases N availability, however, only for short period as mineral N is held shorter in bacteria biomass, in this way the long-term nitrogen retention becomes impossible [64,65]. These changes indicate that while mineral N increases short-term N availability, excessive inputs interrupt the balance between microbial community structure and soil biological functioning [66,67]. Unlike mineral N fertilizers, BA is aiming to stimulate natural soil microbiological processes without any of fertilization effect [68]. The BA that was used in our study activated soil bacteria communities, however, the increase in TON content was not significantly stimulated (Table 2). According to García-Martínez et al. [69] and Hellequin et al. [70], BA also induced significant changes in the composition of active bacterial and fungal communities without impacting mineral N transformation. However, according to Li et al. [71] the BA combined with mineral N fertilizers increased mineral N transformation. Consisted with our hypothesis, we found that increased mineral N application changed soil microbial community, thus, in the response of soil bacteria dominance, NBIO transformation led to more extent in mineral N availability (Figure 2a-b). As the use of BA only in complex with OF increased mineral N availability on higher mineral N application rate (N230, Table 2). However, mineral N application with addition of the OF supplying additional carbon, promoting soil biological N immobilization and stabilizing mineral N availability (Table 2).

5. Conclusions

It could be concluded that in intensive cropping system mineral N transformation occurred due to stabilized soil microbial community composition and activity. Soil microbial composition remained stabilized only when the TMA and F:B ratio was increasing and mineral N was immobilized when the NBIO content was higher. Thus, NBIO increased with lower mineral N application rates and when mineral N application was done in complex with OF. The mineral N application in complex with OF and BA increased the NBIO content only with the higher rate of mineral N, however, it was not increasing the TON content and N use efficiency either. Mineral N application should not exceed up to 150 kg N ha⁻¹ rate or 180 kg N ha⁻¹ rate if applied in complex with OF, as it is increasing probability to disturb soil microbial community and soil biological functions. Moreover, further research is required to estimate the effectiveness of mineral N application under certain conditions such as soil type and properties, intensive cropping system definitions and the type of on-farm research-based experiment.

Author Contributions

Conceptualization, A.J. and J.A.; methodology, A.J., J.A. and E.S.; software, V.B.; validation, A.J. and V.B.; formal analysis R.S. and E.S.; investigation, A.J. and J.A.; data curation, A.J., J.A. and V.B.; writing—original draft preparation, A.J., J.A. and V.B.; writing—review and editing, A.J., R.S., E.S., V.B. and J.A.; supervision, J.A.; funding acquisition, E.S. All authors have read and agreed to the published version of the manuscript.

Funding

This study received funding from the Research Fund of Vytautas Magnus University, Lithuania.

Data Availability Statement

The data presented in this study are available on request from the corresponding authors.

Acknowledgments

We acknowledge farmer Jonata Pauraitė-Raudonė and her family for the providing access to farm fields for conducting on-farm research-based experiments. We also are grateful to Arnoldas Jurys and Egidijus Vadluga for supply of experimental materials and to Loreta Surginienė for technical assistance.

Conflicts of Interest

The authors declare no conflict of interest.

References

  1. Foskolos, A.; Plomaritou, A., 2023. Holistic nutritional management as a tool to mitigate nitrogen pollution from dairy cattle farming. The Journal of Agricultural Science, 161(3), pp.313-317. [CrossRef]
  2. Vishwakarma, K.; Kumar, N.; Shandilya, C.; Mohapatra, S.; Bhayana, S.; Varma, A., 2020. Revisiting plant–microbe interactions and microbial consortia application for enhancing sustainable agriculture: a review. Frontiers in Microbiology, 11, p.560406. [CrossRef]
  3. Jiang, F., Bennett, J.A., Crawford, K.M., Heinze, J., Pu, X., Luo, A. and Wang, Z., 2024. Global patterns and drivers of plant–soil microbe interactions. Ecology Letters, 27(1), p.e14364. [CrossRef]
  4. Tharanath, A.C., Upendra, R.S. and Rajendra, K., 2024. Soil symphony: A comprehensive overview of plant–microbe interactions in agricultural systems. Applied Microbiology, 4(4), pp.1549-1567. [CrossRef]
  5. Storer, K.E., Berry, P.M., Kindred, D.R. and Sylvester-Bradley, R., 2018. Identifying oilseed rape varieties with high yield and low nitrogen fertiliser requirement. Field Crops Research, 225, pp.104-116. [CrossRef]
  6. Shahini, S., Kachanova, T., Manushkina, T., Petrova, O. and Shevchuk, N., 2023. Using organic nitrogen fertilisers to improve soil health and increase yields. International Journal of Environmental Studies, 80(2), pp.433-441. [CrossRef]
  7. Martre, P., Dueri, S., Guarin, J.R., Ewert, F., Webber, H., Calderini, D., Molero, G., Reynolds, M., Miralles, D., Garcia, G. and Brown, H., 2024. Global needs for nitrogen fertilizer to improve wheat yield under climate change. Nature Plants, 10(7), pp.1081-1090. [CrossRef]
  8. Liu, S., Pubu, C., Zhu, Y., Hao, W., Zhang, G. and Han, J., 2023. Optimizing nitrogen application depth can improve crop yield and nitrogen uptake–A global meta-analysis. Field Crops Research, 295, p.108895. [CrossRef]
  9. Rahman, N., Richards, K.G., Harty, M.A., Watson, C.J., Carolan, R., Krol, D., Lanigan, G.J. and Forrestal, P.J., 2021. Differing effects of increasing calcium ammonium nitrate, urea and urea+ NBPT fertiliser rates on nitrous oxide emission factors at six temperate grassland sites in Ireland. Agriculture, Ecosystems & Environment, 313, p.107382. [CrossRef]
  10. Akkamis, M. and Caliskan, S., 2023. Responses of yield, quality and water use efficiency of potato grown under different drip irrigation and nitrogen levels. Scientific Reports, 13(1), p.9911. [CrossRef]
  11. Zhang, S.Q. and Huang, S.M., 2023. Effects of the combined application of organic and chemical nitrogen fertilizer on soil aggregate carbon and nitrogen: a 30-year study. Journal of Integrative Agriculture, 22(11), pp.3517-3534. [CrossRef]
  12. Porwollik, V., Rolinski, S., Heinke, J., von Bloh, W., Schaphoff, S. and Müller, C., 2022. The role of cover crops for cropland soil carbon, nitrogen leaching, and agricultural yields–a global simulation study with LPJmL (V. 5.0-tillage-cc). Biogeosciences, 19(3), pp.957-977.
  13. Vogeler, I., Hansen, E.M. and Thomsen, I.K., 2023. The effect of catch crops in spring barley on nitrate leaching and their fertilizer replacement value. Agriculture, Ecosystems & Environment, 343, p.108282. [CrossRef]
  14. Böldt, M., Taube, F., Vogeler, I., Reinsch, T., Kluß, C. and Loges, R., 2021. Evaluating different catch crop strategies for closing the nitrogen cycle in cropping systems—Field experiments and modelling. Sustainability, 13(1), p.394. [CrossRef]
  15. Yokamo, S., Milinga, A.S. and Suefo, B., 2023. Alternative fertilization approaches in enhancing crop productivity and nutrient use efficiency: A review. Archives of Agriculture and Environmental Science, 8(2), pp.244-249. [CrossRef]
  16. Norberg, L. and Aronsson, H., 2024. Effects of spring and autumn tillage, catch crops, and pig manure application on long-term nutrient leaching from a loamy sand. European Journal of Agronomy, 156, p.127156. [CrossRef]
  17. Daba, N.A., Li, D., Huang, J., Han, T., Zhang, L., Ali, S., Khan, M.N., Du, J., Liu, S., Legesse, T.G. and Liu, L., 2021. Long-term fertilization and lime-induced soil pH changes affect nitrogen use efficiency and grain yields in acidic soil under wheat-maize rotation. Agronomy, 11(10), p.2069. [CrossRef]
  18. Michael, P.S., 2021. Role of organic fertilizers in the management of nutrient deficiency, acidity, and toxicity in acid soils–A review. Journal of Global Agriculture and Ecology, 12(3), pp.19-30.
  19. Barłóg, P., Grzebisz, W. and Łukowiak, R., 2022. Fertilizers and fertilization strategies mitigating soil factors constraining efficiency of nitrogen in plant production. Plants, 11(14), p.1855. [CrossRef]
  20. Krasilnikov, P., Taboada, M.A. and Amanullah, 2022. Fertilizer use, soil health and agricultural sustainability. Agriculture, 12(4), p.462. [CrossRef]
  21. Jote, C.A., 2023. The impacts of using inorganic chemical fertilizers on the environment and human health. Organic and Medicinal Chemistry International Journal, 13(3), p.555864.
  22. Kuśmierz, S., Skowrońska, M., Tkaczyk, P., Lipiński, W. and Mielniczuk, J., 2023. Soil organic carbon and mineral nitrogen contents in soils as affected by their pH, texture and fertilization. Agronomy, 13(1), p.267. [CrossRef]
  23. Gautam, A., Guzman, J., Kovacs, P. and Kumar, S., 2022. Manure and inorganic fertilization impacts on soil nutrients, aggregate stability, and organic carbon and nitrogen in different aggregate fractions. Archives of Agronomy and Soil Science, 68(9), pp.1261-1273. [CrossRef]
  24. Petraityte, D., Ceseviciene, J., Arlauskiene, A., Slepetiene, A., Skersiene, A. and Gecaite, V., 2022. Variation of soil nitrogen, organic carbon, and waxy wheat yield using liquid organic and mineral fertilizers. Agriculture, 12(12), p.2016. [CrossRef]
  25. Anušauskas, J., Steponavičius, D., Romaneckas, K., Lekavičienė, K., Zaleckas, E. and Sendžikienė, E., 2023. The influence of bacteria-inoculated mineral fertilizer on the productivity and profitability of spring barley cultivation. Plants, 12(6), p.1227. [CrossRef]
  26. Van Groenigen, J. W., Velthof, G. L., Oenema, O., Van Groenigen, K. J., & Van Kessel, C. (2010). Towards an agronomic assessment of N2O emissions: a case study for arable crops. European journal of soil science, 61(6), 903-913. [CrossRef]
  27. Martre, P., Jamieson, P. D., Semenov, M. A., Zyskowski, R. F., Porter, J. R., & Triboi, E. (2006). Modelling protein content and composition in relation to crop nitrogen dynamics for wheat. European Journal of Agronomy, 25(2), 138-154. [CrossRef]
  28. Murphy, K. M., Reeves, P. G., & Jones, S. S. (2008). Relationship between yield and mineral nutrient concentrations in historical and modern spring wheat cultivars. Euphytica, 163(3), 381-390. [CrossRef]
  29. Sun, Y., Wang, M., Mur, L. A. J., Shen, Q., & Guo, S. (2020). Unravelling the roles of nitrogen nutrition in plant disease defences. International journal of molecular sciences, 21(2), 572. [CrossRef]
  30. Tu, C., Booker, F. L., Watson, D. M., Chen, X. I. N., Rufty, T. W., Shi, W. E. I., & Hu, S. (2006). Mycorrhizal mediation of plant N acquisition and residue decomposition: impact of mineral N inputs. Global Change Biology, 12(5), 793-803. [CrossRef]
  31. Pan, S., Wang, Y., Qiu, Y., Chen, D., Zhang, L., Ye, C., ... & Hu, S. (2020). Nitrogen-induced acidification, not N-nutrient, dominates suppressive N effects on arbuscular mycorrhizal fungi. Global Change Biology, 26(11), 6568-6580. [CrossRef]
  32. Jilling, A., Keiluweit, M., Contosta, A. R., Frey, S., Schimel, J., Schnecker, J., ... & Grandy, A. S. (2018). Minerals in the rhizosphere: overlooked mediators of soil nitrogen availability to plants and microbes. Biogeochemistry, 139(2), 103-122. [CrossRef]
  33. Ryan, M. H., & Graham, J. H. (2018). Little evidence that farmers should consider abundance or diversity of arbuscular mycorrhizal fungi when managing crops. New Phytologist, 220(4), 1092-1107. [CrossRef]
  34. Ingraffia, R., Amato, G., Sosa-Hernández, M. A., Frenda, A. S., Rillig, M. C., & Giambalvo, D. (2020). Nitrogen type and availability drive mycorrhizal effects on wheat performance, nitrogen uptake and recovery, and production sustainability. Frontiers in plant science, 11, 760. [CrossRef]
  35. Stark, C., Condron, L. M., Stewart, A., Di, H. J., & O’Callaghan, M. (2007). Influence of organic and mineral amendments on microbial soil properties and processes. Applied Soil Ecology, 35(1), 79-93. [CrossRef]
  36. Ren, N., Wang, Y., Ye, Y., Zhao, Y., Huang, Y., Fu, W., & Chu, X. (2020). Effects of continuous nitrogen fertilizer application on the diversity and composition of rhizosphere soil bacteria. Frontiers in microbiology, 11, 1948. [CrossRef]
  37. IUSS Working Group WRB. World Reference Base for Soil Resources. In International Soil Classification System for Naming Soils and Creating Legends for Soil Maps, 4th ed.; International Union of Soil Sciences (IUSS): Vienna, Austria, 2022.
  38. ISO 10390:2005; Soil Quality—Determination of pH. International Standards Organization: Geneva, Switzerland, 2005.
  39. ISO 10694: 1995; Soil Quality—Determination of Organic and Total Carbon after Dry Combustion (Elementary Analysis). International Standards Organization: Geneva, Switzerland, 1995.
  40. ISO 14256-2:2005; Soil quality — Determination of Nitrate, Nitrite and Ammonium in Field-Moist Soils by Extraction with Potassium Chloride Solution — Part 2. International Standards Organization: Geneva, Switzerland, 2005.
  41. Küster, E. Outline of a comparative study of criteria used in characterization of the actinomycetes. Int. Bull. Bacteriol. Nomencl. Taxon. 1959, 9, 98–104. [CrossRef]
  42. Domsch, K.H.; Gams, W.; Anderson, T.H. Compendium of Soil Fungi; IHW-Verlag: Eching, Germany, 2007; p. 672.
  43. Noulas, C., Torabian, S. and Qin, R., 2023. Crop nutrient requirements and advanced fertilizer management strategies. Agronomy, 13(8), p.2017. [CrossRef]
  44. Chen, Q., Song, Y., An, Y., Lu, Y. and Zhong, G., 2024. Soil microorganisms: Their role in enhancing crop nutrition and health. Diversity, 16(12), p.734. [CrossRef]
  45. Cvetkov, M. and Tajnšek, A., 2009. Soil organic matter changes according to the application of organic and mineral fertilizers within long-term experiments. Acta Agriculturae Slovenica, 93(3), pp.311-320. [CrossRef]
  46. Sosulski, T. and Korc, M., 2011. Effects of different mineral and organic fertilization on the content of nitrogen and carbon in soil organic matter fractions. Ecological Chemistry and Engineering. A, 18(4), pp.601-609.
  47. Kuśmierz, S., Skowrońska, M., Tkaczyk, P., Lipiński, W. and Mielniczuk, J., 2023. Soil organic carbon and mineral nitrogen contents in soils as affected by their pH, texture and fertilization. Agronomy, 13(1), p.267. [CrossRef]
  48. Wang, D., Xu, Z., Zhao, J., Wang, Y. and Yu, Z., 2011. Excessive nitrogen application decreases grain yield and increases nitrogen loss in a wheat–soil system. Acta Agriculturae Scandinavica, Section B-Soil & Plant Science, 61(8), pp.681-692. [CrossRef]
  49. Cameron, K.C., Di, H.J. and Moir, J.L., 2013. Nitrogen losses from the soil/plant system: a review. Annals of applied biology, 162(2), pp.145-173. [CrossRef]
  50. Bender, S.F. and van der Heijden, M.G., 2015. Soil biota enhance agricultural sustainability by improving crop yield, nutrient uptake and reducing nitrogen leaching losses. Journal of Applied Ecology, 52(1), pp.228-239.
  51. Yang, X., Lu, Y., Ding, Y., Yin, X., Raza, S. and Tong, Y.A., 2017. Optimising nitrogen fertilisation: A key to improving nitrogen-use efficiency and minimising nitrate leaching losses in an intensive wheat/maize rotation (2008–2014). Field Crops Research, 206, pp.1-10. [CrossRef]
  52. Elbl, J., Šimečková, J., Škarpa, P., Kintl, A., Brtnický, M. and Vaverková, M.D., 2020. Comparison of the agricultural use of products from organic waste processing with conventional mineral fertilizer: potential effects on mineral nitrogen leaching and soil quality. Agronomy, 10(2), p.226. [CrossRef]
  53. Allende-Montalbán, R., Martin-Lammerding, D., del Mar Delgado, M., Porcel, M.A. and Gabriel, J.L., 2022. Nitrate leaching in maize (Zea mays L.) and wheat (Triticum aestivum L.) irrigated cropping systems under nitrification inhibitor and/or intercropping effects. Agriculture, 12(4), p.478. [CrossRef]
  54. Wachendorf, M., Volkers, K.C., Loges, R., Rave, G. and Taube, F., 2006. Perfor-mance and environmental effects of forage production on sandy soils. IV. Impact of slurry application, mineral N fertilizer and grass understorey on yield and nitrogen surplus of maize for silage. Grass and Forage Science, 61(3), pp.232-242. [CrossRef]
  55. Kayser, M., Benke, M. and Isselstein, J., 2011. Little fertilizer response but high N loss risk of maize on a productive organic-sandy soil. Agronomy for sustainable development, 31(4), pp.709-718. [CrossRef]
  56. Mooshammer, M., Wanek, W., Hämmerle, I., Fuchslueger, L., Hofhansl, F., Knoltsch, A., Schnecker, J., Takriti, M., Watzka, M., Wild, B. and Keiblinger, K.M., 2014. Adjustment of microbial nitrogen use efficiency to carbon: nitrogen imbalances regulates soil nitrogen cycling. Nature communications, 5(1), p.3694. [CrossRef]
  57. Stockdale, E., Hatch, D., Murphy, D., Ledgard, S. and Watson, C., 2002. Verifying the nitrification to immobilisation ratio (N/I) as a key determinant of potential nitrate loss in grassland and arable soils. Agronomie, 22(7-8), pp.831-838. [CrossRef]
  58. Angus, J.F., Gupta, V.V.S.R., Pitson, G.D. and Good, A.J., 2014. Effects of banded ammonia and urea fertiliser on soil properties and the growth and yield of wheat. Crop and Pasture Science, 65(4), pp.337-352. [CrossRef]
  59. Grzyb, A., Wolna-Maruwka, A. and Niewiadomska, A., 2021. The significance of microbial transformation of nitrogen compounds in the light of integrated crop management. Agronomy, 11(7), p.1415. [CrossRef]
  60. Chapagain, T. and Riseman, A., 2015. Nitrogen and carbon transformations, water use efficiency and ecosystem productivity in monocultures and wheat-bean intercropping systems. Nutrient cycling in agroecosystems, 101(1), pp.107-121. [CrossRef]
  61. Bissett, A., Richardson, A.E., Baker, G. and Thrall, P.H., 2011. Long-term land use effects on soil microbial community structure and function. Applied Soil Ecology, 51, pp.66-78. [CrossRef]
  62. Don, A., Böhme, I.H., Dohrmann, A.B., Poeplau, C. and Tebbe, C.C., 2017. Microbial community composition affects soil organic carbon turnover in mineral soils. Biology and fertility of soils, 53(4), pp.445-456. [CrossRef]
  63. Khmelevtsova, L.E., Sazykin, I.S., Azhogina, T.N. and Sazykina, M.A., 2022. Influence of agricultural practices on bacterial community of cultivated soils. Agriculture, 12(3), p.371. [CrossRef]
  64. Han, P., Zhang, W., Wang, G., Sun, W. and Huang, Y., 2016. Changes in soil organic carbon in croplands subjected to fertilizer management: a global meta-analysis. Scientific reports, 6(1), p.27199. [CrossRef]
  65. Olin, S., Lindeskog, M., Pugh, T.A.M., Schurgers, G., Wårlind, D., Mishurov, M., Zaehle, S., Stocker, B.D., Smith, B. and Arneth, A., 2015. Soil carbon management in large-scale Earth system modelling: implications for crop yields and nitrogen leaching. Earth System Dynamics, 6(2), pp.745-768. [CrossRef]
  66. Elrys, A.S., Wang, J., Meng, L., Zhu, Q., El-Sawy, M.M., Chen, Z., Tu, X., El-Saadony, M.T., Zhang, Y., Zhang, J. and Cai, Z., 2023. Integrative knowledge-based nitrogen management practices can provide positive effects on ecosystem nitrogen retention. Nature Food, 4(12), pp.1075-1089. [CrossRef]
  67. Lessmann, M., Ros, G.H., Young, M.D. and de Vries, W., 2022. Global variation in soil carbon sequestration potential through improved cropland management. Global Change Biology, 28(3), pp.1162-1177. [CrossRef]
  68. de Nijs, E.A., Hicks, L.C., Leizeaga, A., Tietema, A. and Rousk, J., 2019. Soil microbial moisture dependences and responses to drying–rewetting: the legacy of 18 years drought. Global Change Biology, 25(3), pp.1005-1015. [CrossRef]
  69. García-Martínez, A.M., Díaz, A., Tejada, M., Bautista, J., Rodríguez, B., Santa María, C., Revilla, E. and Parrado, J., 2010. Enzymatic production of an organic soil biostimulant from wheat-condensed distiller solubles: Effects on soil biochemistry and biodiversity. Process Biochemistry, 45(7), pp.1127-1133. [CrossRef]
  70. Hellequin, E., Monard, C., Chorin, M., Le Bris, N., Daburon, V., Klarzynski, O. and Binet, F., 2020. Responses of active soil microorganisms facing to a soil biostimulant input compared to plant legacy effects. Scientific Reports, 10(1), p.13727. [CrossRef]
  71. Li, J., Ma, H., Ma, H., Lei, F., He, D., Huang, X., Yang, H. and Fan, G., 2023. Comprehensive effects of N reduction combined with biostimulants on N use efficiency and yield of the winter wheat–summer maize rotation system. Agronomy, 13(9), p.2319. [CrossRef]
Figure 1. Principal component analysis (PCA) scores and loading biplot showing clustering of soil chemical and biological properties due to the applied fertilization to explain the variation in the response variables (after fertilization in 2020 (a) and in 2022 (b)). Soil properties variables are indicated with red lines (abbreviations: carbon and nitrogen ratio (C:N), pH value (pHKCl), total mineral nitrogen (TON), soil organic carbon (SOC), biologically transformed nitrogen (NBIO), bacteria abundance (BA), fungi abundance (FA), total microbial abundance (TMA), fungi and bacteria ratio (F:B)).
Preprints 192902 g001
Figure 2. Partial Least Square Regression coefficients (R2) for the soil variables in response to mineral N application. For total mineral nitrogen (TON), carbon and nitrogen ratio (C:N), biologically transformed nitrogen (NBIO), fungi and bacteria ratio (F:B) after fertilization in 2020 (a, c, e, g) and in 2022 (b, d, f, h).
Preprints 192902 g002aPreprints 192902 g002b
Table 1. Site characteristics.
Indices Experimental site
Pedological indices
Soil type Calcaric Luvisol [37]
Soil texture loam
Sand, % 26.1
Silt, % 48.4
Clay, % 25.5
pHKCl 7.42
Soil organic matter, g kg-1 13.8
Ntotal, g kg-1 1.13
Mobile P2O5, mg kg−1 152
Mobile K2O, mg kg−1 161
Climatic indices
Conducting experiment
average (SRC 2019–2022)
Long-term
average (SRC 1974–2020)
Total annual precipitation, mm 572.3 679.7
Annual mean temperature, ◦C 8.4 7.5
Growing season’s total
precipitation, mm
343 425
Growing season’s mean air
temperature, ◦C
14.5 14.3
Note. SRC - standard rate of climate; growing seasons from 4 to 9 months.
Table 2. Soil chemical properties of the 0–20 cm soil layer as a function of the applied fertilization.
Fertilization Treatments pHKCl Mineral nitrogen content (mg kg-1) C:N ratio
Year 2 Year 4 Year 2 Year 4 Year 2 Year 4
N100 B-_O- 6.8±0.00d 7.1±0.03c 0.11±0.004d 0.13±0.018c 13.7±1.03a 12.1±0.62a
B-_O+ 7.3±0.00a 7.4±0.09ab 0.19±0.009abc 0.18±0.039bc 10.1±1.33abc 11.6±0.76a
B+_O- 7.0±0.00c 7.3±0.00bc 0.18±0.012abcd 0.14±0.017c 7.5±0.68c 12.5±0.49a
B+_O+ 7.2±0.00b 7.2±0.09bc 0.17±0.011abcd 0.12±0.005c 9.5±0.48abc 11.6±0.16a
N150 B-_O- 6.8±0.00d 7.4±0.03ab 0.21±0.015abc 0.22±0.030abc 9.6±0.63abc 11.4±0.69a
B-_O+ 7.3±0.00a 7.7±0.10a 0.20±0.031abc 0.29±0.022a 9.8±1.07abc 5.6±0.20b
B+_O- 7.0±0.00c 7.5±0.09ab 0.20±0.017abc 0.16±0.012bc 7.4±1.13c 12.9±1.19a
B+_O+ 7.2±0.00b 7.3±0.03bc 0.18±0.007abcd 0.16±0.009bc 9.9±1.37abc 12.0±0.93a
N180 B-_O- 7.2±0.00b 7.3±0.00bc 0.17±0.018abcd 0.16±0.04bc 8.8±0.75abc 10.9±0.18a
B-_O+ 7.0±0.00c 7.3±0.06bc 0.14±0.009cd 0.17±0.021bc 10.8±0.22abc 11.8±0.33a
B+_O- 7.3±0.00a 7.5±0.03ab 0.24±0.020a 0.17±0.018bc 7.8±0.44bc 13.0±0.80a
B+_O+ 6.8±0.00d 7.3±0.00bc 0.15±0.014abcd 0.21±0.011abc 12.7±1.48ab 10.8±0.43a
N230 B-_O- 7.2±0.00b 7.2±0.12bc 0.18±0.010abcd 0.14±0.020bc 9.1±0.31abc 11.3±0.19a
B-_O+ 7.0±0.00c 7.4±0.06ab 0.15±0.006bcd 0.15±0.018bc 10.2±0.80abc 11.0±0.49a
B+_O- 7.3±0.00a 7.6±0.03a 0.20±0.024abc 0.18±0.011bc 9.9±1.54abc 11.9±0.38a
B+_O+ 6.8±0.00d 7.5±0.03ab 0.23±0.007abcd 0.24±0.023ab 8.7±0.93abc 11.0±0.11a
Note: highest and lowest values are in bold. Different lowercase letters represent significant differences (P ≤ 0.01). Values are Mean ± SE (n = 3).
Table 3. Soil biological properties of the 0–20 cm soil layer as a function of the applied fertilization.
Fertilization Treatments Soil total microbial
abundance, ×106 CFU
Fungi:bacteria
ratio
Biological nitrogen
(NH4+ + NO3-) (mg kg-1)
Year 2 Year 4 Year 2 Year 4 Year 2 Year 4
N100 B-_O- 2.0±0.04cd 2.0±0.13bcd 0.018±0.0018abcd 0.030±0.0015b 114±4.3efg 117±3.6ef
B-_O+ 2.0±0.01cd 2.4±0.08abc 0.020±0.0007abc 0.032±0.0009b 174±10.4ab 121±2.7def
B+_O- 2.0±0.03cd 1.3±0.12e 0.015±0.0009def 0.020±0.0018cde 161±4.6abcd 127±5.3cdef
B+_O+ 1.8±0.03de 2.6±0.08ab 0.015±0.0006de 0.029±0.0015bc 122±16.5cdefg 120±4.3def
N150 B-_O- 1.7±0.05ef 1.6±0.09de 0.010±0.0009fg 0.014±0.0009e 118±10.7defg 120±1.5def
B-_O+ 1.9±0.02d 2.4±0.03abc 0.016±0.0006bcd 0.025±0.0023bcd 117±6.7defg 133±5.1abcde
B+_O- 1.6±0.06f 1.6±0.14de 0.011±0.0007ef 0.015±0.0019e 137±4.1bcdefg 121±4.1def
B+_O+ 2.4±0.06a 2.8±0.21a 0.014±0.0003def 0.032±0.0010b 166±6.7abc 145±0.6abc
N180 B-_O- 1.7±0.02ef 1.3±0.08e 0.010±0.0003g 0.019±0.0012cde 110±3.6fg 109±4.6f
B-_O+ 1.9±0.05d 2.7±0.24ab 0.016±0.0009bcd 0.032±0.0019b 154±3.3abcdef 137±7.1abcd
B+_O- 1.6±0.05ef 1.4±0.11de 0.016±0.0007cd 0.018±0.0018de 108±7.2g 121±0.0def
B+_O+ 2.3±0.04ab 2.8±0.12a 0.021±0.0009a 0.047±0.0026a 183±10.0a 151±4.9a
N230 B-_O- 1.6±0.02ef 1.3±0.15e 0.010±0.0012fg 0.014±0.0017e 157±15.1abcde 147±5.2ab
B-_O+ 2.1±0.06bc 1.8±0.04cde 0.014±0.0007def 0.017±0.0006de 134±9.4bcdefg 150±3.2a
B+_O- 1.7±0.03ef 1.5±0.05de 0.008±0.0003g 0.014±0.0015e 108±1.5g 132±1.0abcde
B+_O+ 1.7±0.03ef 2.7±0.12a 0.020±0.0009ab 0.028±0.0035bc 124±4.6cdefg 128±1.5bcdef
Note: highest and lowest values are in bold. Different lowercase letters represent significant differences (P ≤ 0.01). Values are Mean ± SE (n = 3).
Disclaimer/Publisher’s Note: The statements, opinions and data contained in all publications are solely those of the individual author(s) and contributor(s) and not of MDPI and/or the editor(s). MDPI and/or the editor(s) disclaim responsibility for any injury to people or property resulting from any ideas, methods, instructions or products referred to in the content.
Copyright: This open access article is published under a Creative Commons CC BY 4.0 license, which permit the free download, distribution, and reuse, provided that the author and preprint are cited in any reuse.
Prerpints.org logo

Preprints.org is a free preprint server supported by MDPI in Basel, Switzerland.

Subscribe

Disclaimer

Terms of Use

Privacy Policy

Privacy Settings

© 2026 MDPI (Basel, Switzerland) unless otherwise stated