
Submitted:
05 January 2026
Posted:
05 January 2026
You are already at the latest version
Abstract
Cracks and holes are commonly found in wooden components, and ancient Chinese wooden buildings represented by Yingxian Wooden Pagoda demonstrate the ability to work with defects. This study systematically investigated the effects of longitudinal cracks and circular holes on the load-bearing capacity of wooden beams through four point bending experiments on 1580 samples. The study focuses on load-bearing capacity as the core indicator and provides calculation formulas for section weakening coefficient and damage tolerance coefficient to quantitatively evaluate the impact of cracks. Research has found that the harmfulness of damage strongly depends on its position within the wooden beam. In the horizontal direction, when the longitudinal crack is located in the pure bending section of the wooden beam, it has little effect on the load-bearing capacity of the wooden beam. Once it deviates to the transverse bending section, the load-bearing capacity of the wooden beam significantly decreases. The hole is most dangerous when it is located in the horizontal center of the wooden beam, and it is also dangerous when it is near the loading point. In the vertical direction, the crack has the greatest impact on the load-bearing capacity of the wooden beam when it is located in the neutral layer, while its impact decreases when it is close to the upper and lower surfaces of the wooden beam. Holes have the least impact when approaching the neutral layer, which is different from the impact pattern of cracks. In addition, the hazard increases when the hole is located in the tension zone of the wooden beam, and decreases when it is located in the compression zone. The anisotropy and fiber structure of wood are the microscopic basis for the damage tolerance mechanical behavior of timber beams.
Keywords:
wooden beam
; longitudinal crack
; circular hole
; damage tolerance
; load-bearing capacity
1. Introduction
Wood, as a natural biomass with a long history of application and renewable properties, plays an indispensable role in load-bearing structures such as buildings, bridges, and furniture due to its excellent specific strength, ease of processing, and unique ecological environment properties [1]. However, unlike homogeneous and isotropic engineering materials, wood, as a bio-composite material, inevitably has inherent characteristics such as knots, insect holes, and uneven texture inside. More commonly and noteworthy is that during its service, wooden components are prone to geometric defects such as cracks [2] and holes [3] due to the release of drying shrinkage stress [4,5] and growth stress [6] caused by changes in environmental humidity, or factors such as human processing and accidental damage. The simple understanding of ancient Chinese craftsmen that "wood invariably cracks" not only includes an understanding of the mechanical characteristics of wood anisotropy [7], but also profoundly reveals the universality and inevitability of cracks, especially longitudinal cracks along the direction of wood fibers, in wooden components. And hole-damage is also widely present, from naturally formed wormholes and scars, to artificial openings required for structural connections, pipeline layout, or maintenance reinforcement, all of which often result in wooden components coexisting with defects. The existence of these defects poses a potential threat to the safety and durability of wooden structures, especially the key load-bearing components - wooden beams.
From the perspective of classical continuum mechanics and fracture mechanics, cracks and holes in components are considered as potential causes of structural failure. There is a singular stress field at the crack tip, which may lead to unstable crack propagation under external loads [8]; Holes can significantly alter the stress field around them and lead to stress concentration, thereby weakening the effective load-bearing area of the component [9]. According to this theory, traditional engineering evaluations often hold a highly conservative attitude towards these defects, tending to believe that they will significantly reduce the safety margin of the structure, and even consider them as a precursor to structural failure. However, a large number of engineering practices, especially the millennium long existence of ancient Chinese wooden architecture represented by the Yingxian Wooden Pagoda, provide vivid examples that contradict this "zero tolerance for defects" viewpoint. The wooden beams in these ancient buildings generally have historical cracks and holes, but they can still effectively bear loads. This contradictory phenomenon suggests that wood and its wooden components may possess a unique "damage tolerance" ability that goes beyond conventional engineering material cognition.
The concept of "damage tolerance" originated in the aviation industry in the mid-20th century and was a revolutionary change in engineering design philosophy after experiencing a series of catastrophic accidents caused by fatigue cracks. The core idea is to acknowledge that there must be initial defects or damages in the structure during manufacturing and use, but through reasonable material selection, detailed design, and the establishment of scientific inspection and maintenance cycles, these damages can be detected in a timely manner before expanding to critical dimensions, thereby ensuring the safety of the structure in a "damaged working" state. Damage tolerance design has been successfully applied in fields such as aerospace, nuclear power, and major equipment, becoming an important pillar of modern structural safety assessment. It is interesting that the wisdom embodied in ancient Chinese wooden architecture, such as "cracking is not a disease" and "walls collapse but houses do not collapse", is highly consistent with modern damage tolerance theory both in concept and practical effect. This resonance across time and space prompts us to ponder: what are the micro mechanisms and macro laws behind the natural damage tolerance characteristics of wood and wood structures?
To reveal this scientific issue, scholars have conducted beneficial explorations from different perspectives. In the field of crack research, previous studies have explored the weakening law of prefabricated crack depth on the bending strength of wooden beams [10], revealed the propagation mechanism and damage evolution process of shrinkage cracks using digital image correlation technology [11], provided the location and distribution pattern of cracks [12], or analyzed the toughening mechanisms such as microcracks and fiber bridging in wood crack propagation through double cantilever beam experiments [13], and analyzed the propagation mechanism of cracks in wooden beams through extended finite element method [14]. In terms of hole research, scholars have analyzed the influence of hole position on the bending strain distribution and neutral axis offset of wooden beams [15], evaluated the influence of different sizes of holes on the load-bearing capacity of glued laminated timber beams through experiments and numerical simulations [16], studied the residual strength of pine load-bearing components with small wormholes [17], and attempted to use probabilistic fracture mechanics methods to analyze the strength of wooden beams with holes [18]. These studies provide valuable experimental data and local insights for us to understand the impact of single type defects.
However, there are still some areas that urgently need to be further explored and integrated in current research: firstly, most studies focus on a single type of crack or hole, lacking systematic comparative analysis and mechanistic correlation between the two under a unified theoretical framework, and failing to answer the core engineering concern of which is more dangerous under the same degree of weakening, crack or hole. Secondly, there is no unified evaluation index for the impact of defects. Existing research either uses absolute load-bearing capacity loss, stress concentration factor, or fracture toughness parameters, making it difficult to conduct lateral comparisons and universal evaluations. A unified quantitative indicator that can intuitively reflect the safety status of components and is convenient for engineering applications urgently needs to be proposed. Finally, for anisotropic and multi-scale composite materials such as wood, the explanation of the mechanism of defect influence still needs to be deepened. It is necessary to more closely combine macroscopic mechanical properties with microscopic fiber structure, fracture morphology, and microscopic stress field distribution.
In view of this, this study proposes a systematic and comparative study on the damage tolerance characteristics of wooden beams with cracks and holes, using load-bearing capacity as the core criterion. The load-bearing capacity directly reflects the safety reserve of the component after damage and is the most direct and critical parameter in engineering safety assessment. This paper aims to establish a damage tolerance evaluation framework based on load-bearing capacity analysis, in order to quantitatively study the influence of cracks (considering length and position) and holes (considering position) on the ultimate bending moment (i.e. the direct manifestation of load-bearing capacity) of wooden beams through systematic four point bending experiments, and draw their relationship curves; In addition, a unified evaluation coefficient is proposed to assess the impact of crack and hole damage on the bearing capacity of wooden beams, achieving comparison and grading of the harmfulness of defects of different types and positions; It is best to combine fracture morphology analysis and finite element simulation to deeply explain the micro mechanical mechanisms of wood's different tolerance capabilities for cracks and holes from the perspectives of stress redistribution, crack propagation paths, fiber failure modes, etc.
This research combines experimental data with theoretical analysis to provide a scientific basis and practical method based on the concept of damage tolerance for the safety diagnosis and maintenance decision-making of in-service wooden components. This study not only helps deepen the scientific understanding of the mechanical behavior of wood, a complex biomaterial, and promotes the cross integration of fracture mechanics and wood science, but also provides new theoretical assistance and practical guidance for the scientific protection of ancient wooden buildings and the reliable design of modern wooden structures.
2. Materials and Methods
2.1. Material selection
This study selected Pinus sylvestris var. mongolica from the Krasnoyarsk Krai in Russia as the experimental material (with a standard air dry density of ρ0=477 kg/m3) [19]. This type of wood has the advantages of wide application, moderate strength, good durability, easy processing, and low cost, and is often used as a material for wooden beams in timber structures [20,21]. To reduce the uncertainty of experimental results caused by individual differences in specimens, large sample sizes were used in the experiments for each defect parameter, and with a total sample size of 1580. In order to avoid excessive consumption of wood and reduce the difficulty of specimen processing and energy consumption, small-sized specimens were used for testing in this study.
2.2. Experimental Testing Methods and Methods for Correcting Experimental Results
Figure 1 presents the key parameters of the experimental wooden beam, with Figure 1(a) showing the loading method, dimensions, and defect sizes of the wooden beam; Figure 1(b) visually illustrates the relationship between the eccentricity values (eL,eH) and defect locations; Figure 1(c) illustrates the prefabrication method for cracks in wooden beams.
Considering that the position of the neutral layer in a load-bearing beam determines the load-bearing characteristics of the beam, especially when the longitudinal crack is located exactly at the neutral layer position of the wooden beam, its impact on the load-bearing capacity of the wooden beam is most severe [22]; In addition, the maximum shear stress generated by the transverse bending section of the wooden beam occurs at the neutral layer, indicating that when the damage is located at the neutral layer, it is easy to induce shear-crack propagation. Therefore, it is necessary to analyze the influence of longitudinal cracks and circular holes at the neutral layer on load-bearing capacity of wooden beams. The fiber structure of wood causes its tensile elastic modulus to be slightly higher than its compressive elastic modulus, resulting in the neutral layer of the wooden beam being slightly higher than its central axis position [23]. However, the offset problem of the neutral layer can make the processing and theoretical analysis of the specimen too complex. Therefore, this study considers that the actual offset of the neutral layer is very small, and still assumes that the position of the neutral layer in the wooden beam coincides with the axis of the wooden beam. This makes both theoretical analysis and experimental specimen processing more convenient.
In order to facilitate the comparison of experimental measurement results of different wooden beams and minimize the uncertainty of experimental results caused by differences in processing dimensions and density of specimens, this study limits the relationship between the span and height of wooden beams to l = 10 h, and uses specimens with uniform dimensions and spans (l0 = 150 mm, h0 =15 mm, b0= 10 mm, L0= 160 mm ). In the experiment, a four point bending loading method with a loading point distance of half the span of the wooden beam was used to test the wooden beam, and the maximum load value before fracture of each wooden beam was measured.
Before testing, 60 specimens without macroscopic defects, as well as 700 specimens with different longitudinal-crack parameters and 820 specimens with different circular-hole parameters, were processed. Wooden beam specimens with longitudinal cracks were prepared using a special method: an ultra-thin small diameter saw blade with a thickness of only 0.5 mm was used to cut the cracks, and the crack shape was subsequently trimmed using a thin cutting blade. The specific processing method is shown in Figure 1(c). The processed specimens were stored in a dedicated drying oven with a moisture content controlled at 12.0% ± 1.5%.
Before starting the experiment, a portable induction type wood moisture meter (KT50 upgraded version) was used to retest the moisture content of the specimens (4 × 5 specimens are bundled and stacked for measurement to make the measurement results of moisture content more accurate) and ensure that the moisture content of the specimens meets the requirements. Then the cross-sectional width (b), cross-sectional height (h), and total length (L) of specimens were measured using a vernier caliper, and static mass (m) of specimens were measured using an electronic balance with a resolution of 0.01g.
In the experiment, specimens were placed on a dedicated metal hinge support with a span of l = 150 mm, and subjected to fracture and failure loading using a universal mechanical testing machine (PUYAN980, maximum load 20 kN, load measurement resolution 0.01 N) in conjunction with a four point bending loading head. Firstly, the specimens without macroscopic defects were tested. Subsequently, the specimens with cracks and holes were tested, and the maximum loading-force (P) of each specimen during the fracture process was recorded. To reduce the uncertainty of experimental results caused by differences in the size and density of specimens, it is necessary to adjust the tested loading-force P to an equivalent value Pe:
Pe = P·Cρ·CW
Where Cρ is the density influence coefficient used to adjust the impact of density differences on experimental results; CW is the coefficient of influence on cross-sectional dimensions, used to adjust the impact of machining deviations on experimental results. The physical meaning of the equivalent fracture load value is the fracture load value of a wooden beam with standard density and identical cross-sectional dimensions, which is calculated based on the assumption that the load-bearing capacity of the wooden beam is proportional to its density.
The calculation formula for the density influence coefficient Cρ is:
Cρ=ρ0/ρ
Where ρ0 is the standard air dry density of Pinus sylvestris var. mongolica wood (taken as 477 kg/m3); ρ is the actual air dry density of the wooden beam. For defect-free wooden beams, those with cracks, and those with holes, the specific calculation formula for ρ can be calculated separately through formulas (3), (4), and (5).
ρ(defect-free-beam)=m/bhL
ρ(cracked-beam)=m/(bhL-bδl′)
ρ(circular-hole-beam)=m/(bhL-0.25πbφ2)
Where b, h, L and m are the width, height, length and the static mass of the wooden beam, respectively; l′ is the length of the crack, and φ is the diameter of the circular hole. It can be seen that the calculation formulas takes into account the volume of wood removed due to processing cracks or holes, making the calculated density more accurate. In addition, when measuring the static mass of wooden beams, based on the condition of a moisture content of 12%, it is ensured that the calculated ρ is the actual air dry density of the wooden beam.
The calculation method for the influence coefficient CW of cross-sectional dimensions is shown in formula (6):
CW=b0h02/(bh2)
Where b0 and h0 are the standard width and height of the wooden beam (b0=10.0 mm, h0=15.0 mm), respectively; b and h are the actual cross-sectional width and height of the wooden beam measured by a vernier caliper (accuracy 0.1 mm).
By introducing density influence coefficient and cross-sectional influence coefficient to adjust the experimental results, the influence of density differences between specimens and processing errors in specimen size on the experimental results can be significantly reduced. Examples of the fracture load adjustment in this study are shown in Table 1.
From the process of adjusting the fracture load in the table, it can be seen that if the cross-sectional size and density of the wooden beam are below the standard value, the adjusted fracture load value will increase compared to the actual measured value; If the cross-sectional size and density of the wooden beam are exceeding the standard value, the adjusted fracture load value will decrease compared to the actual measured value. By using this method for adjustments, the influence of size and density differences between specimens on experimental results can be reduced, making the experimental results more credible.
Despite the use of adjustment methods, individual differences in the mechanical properties of wooden beams still induce uncertainty in experimental results. This study aims to reduce the influence of random factors through a larger sample size. In cases that it is difficult to distinguish between high and low load-bear capacity, a sample size of 60 or 80 was used, while in other cases, a sample size of 40 was used. The specific sample sizes for each working condition are shown in Tables 2~5.
Considering the large amount of data in this study, the research team used a self-developed script combined with Excel 2019 to input, organize, calculate, and analyze key experimental data such as specimen size, mass, density, density influence coefficient, cross-sectional size influence coefficient, and fracture load (including maximum, minimum, average, and coefficient of variation), in order to improve the automation level of data analysis, accelerate data analysis speed, and reduce the workload of manual data analysis.
2.3. Quantitative Description Method for the Bearing Capacity of Defective Wooden Beams
In order to facilitate the measurement of the impact of crack and hole on load-bearing capacity of wooden beams, three coefficients were defined in this study, namely the "load-bearing capacity coefficient (R)", "section weakening coefficient (λ)", and "damage tolerance coefficient (ζ)".
The physical meaning of the load-bearing capacity coefficient is the ratio of the equivalent fracture load value of defective wooden beams to the fracture load value of defect-free wooden beams under the same conditions. Its calculation formula is
R=Ped/Pe
Where Ped is the equivalent fracture load value of a defective wooden beam, and Pe is the equivalent fracture load value of a defect-free wooden beam. Due to the fact that the fracture load value of defective wooden beams is usually smaller than that of defect-free wooden beams, R is usually less than 1.0.
The section weakening coefficient is the ratio of the bending section coefficient of the defective wooden beam to that of a defect-free wooden beam.
The calculation formula for the section weakening coefficient of wooden beams with longitudinal cracks is
λ=1-(δ3+12δcH2)/h3
Where δ is the width of the crack, cH is the distance from the centerline of the crack to the centerline of the wooden beam in the vertical direction, and h is the height of the wooden beam.
The calculation formula for the section weakening coefficient of wooden beams with a circular hole is
λ=1-(φ3+12φcH2)/h3
Where φ is the diameter of the circular hole, and cH is the distance between the center of the hole and the centerline of the wooden beam in the vertical direction.
This study defines the damage tolerance coefficient as the ratio of the load-bearing capacity coefficient to the section weakening coefficient, that is
ϛ=R/λ
After introducing the section weakening coefficient and damage tolerance coefficient, there is a relationship between the fracture load of defective and defect-free wooden beams as follows:
Ped=Peλϛ
3. Results
3.1. Fracture Load of Defect-Free Wooden Beams
Test result of the average equivalent fracture load of 60 cracked wooden beams was 1367 N, with a maximum value of 2672 N and a minimum value of 801 N. The coefficient of variation (CV) of the experimental measurement values was 21.0%. The reason for the relative high CV is that Pinus sylvestris var. mongolica wood is mainly composed of tubular cells at the microscopic level, and there are natural differences in cell wall thickness, arrangement direction (fiber angle), and chemical composition (such as cellulose and lignin) among samples. The random distribution of microstructures and defects directly leads to a significant dispersion of fracture loads, which is the fundamental reason for the CV reaching 21%. Due to the use of a large sample size for averaging, the average fracture load obtained from the experiment can be credible. In the subsequent analysis, the fracture load of all longitudinal-crack and circular-hole wooden beams will be compared with the defect-free wooden beams, and the related phenomena and mechanisms of defects affecting the bearing capacity of wooden beams will also be analyzed and discussed.
3.2. The Relationship Between the Fracture Load and the Vertical Position of Defects
Table 2 shows the comparison of fracture loads of wooden beams with longitudinal cracks centered horizontally (eL=0) but located at different vertical positions. Due to the fact that longitudinal cracks centered horizontally require a significant length to have a noticeable impact on the load-bearing capacity of wooden beams, this study used wooden beams with larger crack lengths (l′=4L/5) to investigate the effect of longitudinal cracks at different vertical positions (eH =0,±0.25,±0.50,±0.75) on the load-bearing capacity of wooden beams.
Table 3 compares the fracture loads of wooden beams with circular holes located at different heights. Since large holes are uncommon in wooden beams and small holes minimally affect load-bearing capacity, a standardized hole diameter of φ=h/5 was selected for this experimental study. Circular holes were placed at multiple vertical positions: (eH=0,± 0.25, ± 0.50, ± 0.75, ± 1).
In order to visually compare and demonstrate the variation of the load-bearing capacity of longitudinal-crack wooden beams and circular-hole wooden beams with the vertical position of damage, the key coefficients listed in Table 2 and Table 3 were plotted as curves, with the load-bearing capacity coefficient curve shown in Figure 2 and the damage tolerance coefficient curve shown in Figure 3.
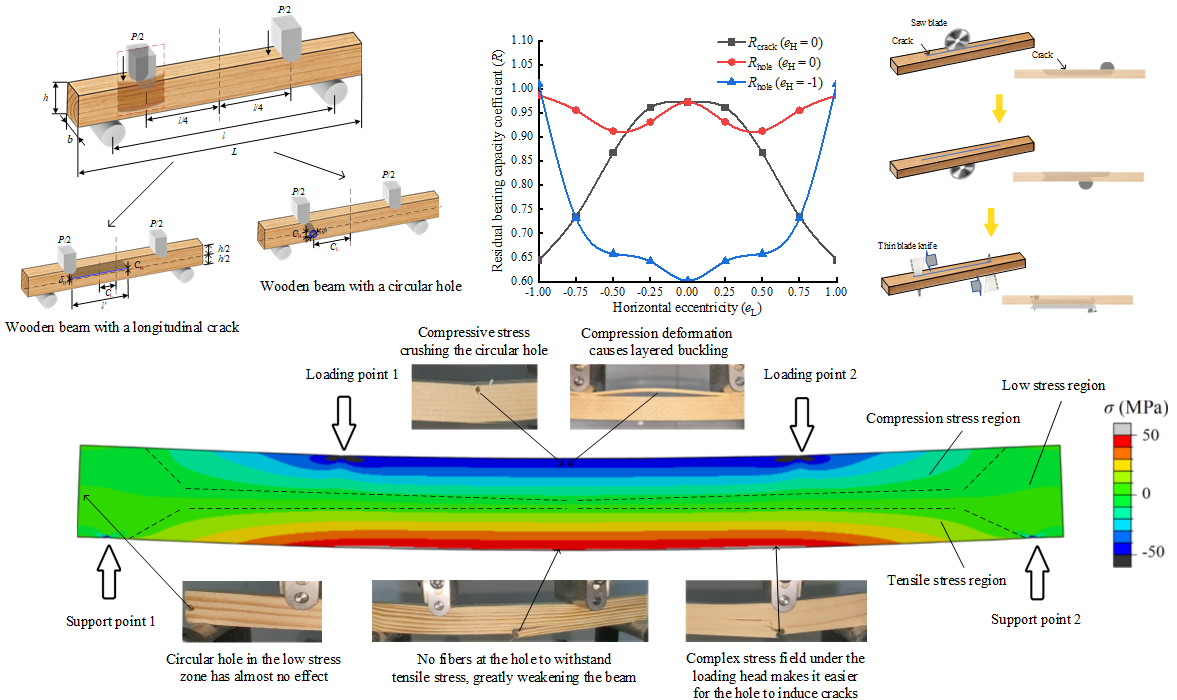
Figure 2 shows that the load-bearing capacity coefficient of the wooden beam is lowest when the hole is at the bottom (eH = −1). As the hole rises from eH = −1 to −0.5, the coefficient increases almost linearly. Beyond eH = -0.5, the increase becomes more gradual until the peak is reached at the neutral layer (eH = 0). Above the neutral layer, the coefficient gradually declines as the hole moves upward. Notably, the coefficient at the top position (eH = 1) remains significantly higher than that at the bottom (eH = −1). This behavior can be explained by stress distribution. The bottom hole lies in the maximum tensile stress zone, where it severs tension-bearing wood fibers (Figure 6a). In contrast, the top hole is located in the maximum compressive stress zone; although local crushing may occur, the material around the hole can still sustain compressive stress (Figure 6b).
The trend for cracked beams is opposite to that observed for beams with circular holes: the load-bearing capacity coefficient peaks at eH = ±1 and reaches a minimum at eH = 0. This reversal can be explained by the crack’s effect on structural continuity. At eH = ±1, the crack breaches the beam surface, so it no longer acts as an internal discontinuity; consequently, the beam behaves similarly to an uncracked member, yielding the highest strength. On the other hand, a crack at the neutral layer (eH = 0) bisects the beam into two separate regions, critically weakening its integrity and resulting in the lowest load-bearing capacity.
A crack located near the lower surface (eH = −0.75) yielded a load-bearing capacity coefficient about 3.6% higher than one near the upper surface (eH = 0.75). This is because the wood layer immediately above a crack (when positioned near the upper face) experienced buckling, which caused it to lose its compressive capacity, as illustrated in Figure 6(c). Consequently, the beam's overall strength was more significantly compromised. Conversely, for a crack near the lower surface, the corresponding wood layer below it did not buckle, leading to a comparatively smaller reduction in load-bearing capacity.
From the damage tolerance coefficient curve in Figure 3, it can be seen that the wooden beam has the lowest damage tolerance coefficient for longitudinal cracks at the neutral layer (eH=0), and the farther the crack is from the neutral layer of the wooden beam, the higher the damage tolerance coefficient of the wooden beam to the crack; The damage tolerance coefficient of wooden beams to circular holes is relatively close in most vertical positions, and only when the hole is close to the upper surface of the wooden beam, the damage tolerance coefficient of the wooden beam to the hole will significantly increase. It should be noted that the damage tolerance coefficient curve is a curve drawn after considering the weakening effect of defects on wooden beams. A higher damage tolerance coefficient represents that "the defect is not as dangerous as people intuitively feel".
3.3. The Relationship Between the Fracture Load and the Horizontal Position of Defects
Table 4 compares the fracture loads of wooden beams with a longitudinal crack located at different horizontal positions.
To ensure comparability across different horizontal eccentricities and a measurable impact on load-bearing capacity, a crack with a length of l′=L/3 located at the neutral layer (eH=0) of the wooden beam was examined, and the effects of cracks at different horizontal positions (eL=0,±0.25,±0.50,±0.75,±1) on the load-bearing capacity of the wooden beam were investigated.
Table 5 shows the experimental data of wooden beams with a circular hole located at different horizontal positions. Holes with eH=−1 (highest tensile stress) and eH =0 (highest shear stress) were selected for investigation, and the hole diameter was still adopted as φ=h/5. Wooden beams with a circular hole located at a horizontal position (eL=0, ± 0.25, ± 0.50, ± 0.75, ± 1) were investigated.
In order to visually compare and illustrate how the load-bearing capacity of defective wooden beams varies with the horizontal position of defects, key coefficients from Table 4 and Table 5 were plotted as curves. Figure 4 shows the load-bearing capacity coefficient curve, while Figure 5 presents the damage tolerance coefficient curve.
From Figure 4, it can be observed that when a longitudinal crack is located at the neutral layer (eH=0) of the beam, its load-bearing capacity coefficient decreases as the crack moves closer to either the left or right edge. This occurs because when the crack is near the horizontal center of the beam, it lies entirely within the pure bending region where shear stress is negligible. Additionally, since normal stress at the neutral layer is zero, there is no driving force for crack propagation, resulting in a relatively high load-bearing capacity coefficient (see Figure 6d). Conversely, when the crack approaches the left or right sides of the beam (e.g., eL < −0.5 or eL > 0.5), it enters the transverse bending region where shear stress is present. Under shear stress, the crack tends to propagate, thereby reducing the load-bearing capacity of the beam and leading to a decline in the load-bearing capacity coefficient (see Figure 6e).
The influence of circular holes located at the neutral layer (eH=0) of wooden beams on their load-bearing capacity is closely related to the position of the loading head: the closer the hole is to the loading head, the lower the load-bearing capacity coefficient of the wooden beam. When eL = ±0.5, the hole is located directly below the loading head, and the complex stress state caused by the loading head can easily induce the occurrence and propagation of cracks in the hole. The load-bearing capacity coefficient of the wooden beam is the lowest (see Figure 6f). In the center and left-right side positions of the wooden beam, the load-bearing capacity coefficient is relatively high. Especially on the left and right sides of the wooden beam (eL = ±1), the holes have completely entered the low stress zone, so it almost does not affect the load-bearing capacity of the wooden beam (see Figure 6g); The hole with eL= ±0.75 is located in the maximum shear stress range of the wooden beam, which may also lead to crack formation. Therefore, the hole here still has a weakening effect on the load-bearing capacity of the wooden beam (see Figure 6h).
The circular hole located on the lower surface of the wooden beam (eH=−1) shows a more severe decrease in the load-bearing capacity of the beam as it approaches the middle span position (eL=0) of the beam. The closer it is to the left or right side of the wooden beam, the smaller the impact on its load-bearing capacity. However, when the hole reaches the left or right side of the wood beam (eL=±1), it completely enters the low stress zone and has almost no effect on wooden beam load-bearing capacity.
It can be seen from figure 5 that the more severe the horizontal deviation of the crack at the neutral layer, the poorer the tolerance of the wooden beam to crack damage. The damage tolerance of wooden beams to holes in the neutral layer also fluctuates with the position of the holes, but the overall change does not exceed 10%. The damage tolerance coefficient of the hole tangent to the lower surface (eH=−1) of wood beams changes more dramatically: the closer the hole is to the left and right sides of the wooden beam, the stronger the wooden beam's ability to withstand damage. The damage tolerance coefficient of the holes on the left and right sides (eL= ± 1) of the wooden beam can reach 1.7 times that of the holes in the middle (eL = 0). Furthermore, the center position of the wooden beam (eH =eL=0) is a special location, and any defect located here has a damage tolerance coefficient of approximately 1.0 for the wooden beam.
4. Discussion
By analyzing the morphology photos of the wooden beam fracture, it is possible to visually display the characteristics of the damage that causes the wooden beam fracture under different conditions. By further combining the simulation results of finite element analysis (FEA), the mechanism of related damage and failure phenomena can be elucidated. This study established finite element (FE) models of Pinus sylvestris var. mongolica wooden beams under various damage and failure conditions, and set the wood constitutive parameters with anisotropic material properties based on the elastic constant measurement data of Pinus sylvestris var. mongolica in existing literature [24], as shown in Table 6. It can be seen that the mechanical properties of Pinus sylvestris var. mongolica along the fiber direction (L) are much higher than those in the radial direction (T) and tangential direction (R). This extremely strong anisotropy is an important reason for the special fracture mechanical properties of damaged wooden beams.
When a crack with l′=L/3 is located in the center position of the wooden beam (eH=eL= 0), the resulting decrease in the load-bearing capacity of the wooden beam is only 2.8%. In this case, the failure mode of the wooden beam is that the fibers under the crack experience tensile fracture. Once the crack deviates to a position where eL<−0.25 or eL>0.25, the load-bearing capacity of the wooden beam significantly decreases. The failure mode is that the crack propagated and layered the wooden beam, and then the phenomenon of wood fiber tensile fracture under the cracks occurs. This paper names this threshold phenomenon of horizontal crack position as the "switch effect".
Through FE simulation, the stress field in wooden beams can be visualized. The normal stress distribution cloud map in the wooden beam is shown in Figure 6(i), and the shear stress distribution cloud map is shown in Figure 6(j). Comparing the maximum stress values of the two stress fields, it can be seen that the maximum normal stress in the wooden beam is about 10 times its maximum shear stress. However, due to the anisotropic nature of wood, normal stress causes the wood fibers to stretch or compress, while shear stress can easily lead to shear cracking between the wood fibers. Although shear stress is much smaller than normal stress, its danger is not less than normal stress.
The crack with a length of L/3 and located in the horizontal center of the wooden beam (eL=0) corresponds exactly to the green area (low stress zone) in the FE cloud map; If the crack is located at the horizontal deviation position (eL<-0.25 or eL>0.25), its tip will enter the blue or red area (shear stress zone) in the FE cloud map, see fig(j).
The above analysis indicates that in order to evaluate the impact of defect in wooden beams on their load-bearing capacity, as well as the potential hazards they may bring, it is not only necessary to look at the size of the defect, but also to examine its location and conduct a comprehensive evaluation based on existing experimental results and FEA.
5. Conclusions
This study focuses on the load-bearing capacity as the core indicator, and through systematic experiments and theoretical analysis, reveals the damage tolerance characteristics and microscopic mechanism of Pinus sylvestris var. mongolica wooden beams with longitudinal cracks and circular holes. The experimental results indicate that the influence of defects on the load-bearing capacity of wooden beams depends not only on their geometric dimensions, but also crucially on their spatial position in the stress field of the wooden beam.
In the vertical direction, the harm of longitudinal cracks reaches its maximum in the neutral layer (eH=0), seriously weakening the integrity of the wooden beam; The closer the longitudinal crack is to the upper and lower surfaces of the wooden beam, the smaller its impact. On the contrary, circular holes cause the most severe loss of load-bearing capacity in the tensile zone at the bottom of the beam (eH=-1), as they directly cut off the tensile fibers; When the hole moves to the top compression zone (eH=1), the damage tolerance coefficient can reach 1.424 due to the ability of wood fibers to collapse and continue to bear, exhibiting strong damage tolerance characteristics.
In the horizontal direction, the influence of longitudinal cracks and circular holes on the load-bearing capacity of wooden beams has a common pattern, that is, they are both dominated by whether they are located in high stress zones. If the crack is located in the mid span pure bending section of the wooden beam (low shear stress zone), its impact is weak; Once the crack enters the transverse bending section of the wooden beam (high shear stress zone), it triggers a "switch effect" and the load-bearing capacity of the wooden beam sharply decreases. Similarly, the hole is most dangerous when it is located at the mid span of the wooden beam and close to the lower surface of the beam (high tensile stress zone), and it is also dangerous near the loading point (complex stress zone). And in the low stress zone near the end of the wooden beam, the influence of the holes is significantly reduced. In summary, the harm of cracks mainly depends on whether they induce delamination propagation (controlled by shear stress), while the harm of holes is related to the tensile/compressive state of local fibers. However, the ultimate impact of both on load-bearing capacity fundamentally depends on their precise position in the stress field under specific loads.
This study successfully quantified and compared the harmfulness of defects of different types, sizes, and positions by proposing load-bearing capacity coefficient, section weakening coefficient, and damage tolerance coefficient. The strong anisotropy and fiber structure of wood are the microscopic basis of its damage tolerance ability: defects in the tensile zone are significantly damaged by direct cutting of fibers; Defects in the compression zone or low stress zone can obtain tolerance characteristics through stress redistribution and hole collapse. FE cloud map further verified that the coupling mechanism between defect location and stress field is the key driving force for damage propagation and ultimate failure.
Wood and wooden components have inherent damage tolerance based on stress field and material anisotropy. The "defect-type→location→load-bearing capacity" evaluation framework established in this study provides scientific basis and practical methods for the safety diagnosis, maintenance and reinforcement of in-service wooden components, and strongly supports the protection of ancient buildings and the reliability design of modern wooden structures based on the concept of damage tolerance.
6. Patents
The Chinese utility model patent "A Prefabricated Wooden Beam Crack Device" (patent number ZL202322195580.1) is closely related to the research work in this article.
Supplementary Materials
The following supporting information can be downloaded at: https://www.mdpi.com/article/doi/s1, Figure S1: title; Table S1: title; Video S1: title.
Author Contributions
Conceptualization, Xiaoyi Hu; methodology, Xiaoyi Hu and Le Zhou; software, Dalie Liu; validation, Xiaoyi Hu and Dalie Liu; formal analysis, Xiaoyi Hu and Le Zhou; investigation, Xiaoyi Hu and Yujing Nie; resources, Xiaoyi Hu and Yujing Nie; Xiao yi Hu and Lingrong Liu; writing—original draft preparation, Xiaoyi Hu; writing—review and editing, Xiaoyi Hu and Dalie Liu; visualization, Xiaoyi Hu; supervision, Xiaoyi Hu; project administration, Xiaoyi Hu; funding acquisition, Xiaoyi Hu, Dalie Liu and Yujing Nie. All authors have read and agreed to the published version of the manuscript.
Funding
This research was funded by the National Natural Science Foundation of China, grant number 32171700.
Acknowledgments
The authors gratefully acknowledge the support from the National Natural Science Foundation of China, Grant No. 32171700. The corresponding author would like to express special thanks to his wife for her support in the work of the paper.
Conflicts of Interest
The funders had no role in the design of the study; in the collection, analyses, or interpretation of data; in the writing of the manuscript; or in the decision to publish the results.
Abbreviations
The following abbreviations are used in this manuscript:
| FEA | Finite element analysis |
| FE | Finite element |
| CV | Coefficient of variation |
References
- Zhou, J.; Tian, Q.; Nie, J.L.; Cao, P.; Tan, Z.F. Mechanical properties and damage mechanisms of woods under extreme environmental conditions. Case Stud. Constr. Mater. 2024, 20:e03146, . [CrossRef]
- Hu, X.Y.; Liu, Z.L.; Zhuang, Z. XFEM study of crack propagation in logs after growth stress relaxation and drying stress accumulation. Wood Sci. Technol. 2017,51(6):1447-1468, . [CrossRef]
- Xu, N.; Li, M.; Fang, S.Y.; Huang,C.L.; Chen,C.; Zhao,Y.; Mao,F.L.; Deng,T.T.; Wang,Y. Research on the detection of the hole in wood based on acoustic emission frequency sweeping. Constr. Build. Mater. 2023, 400: 132761, . [CrossRef]
- Chi, X.; Tang, S.; Song, X.; Ren,Z.C.;Han,G.P.;Cheng,W.L.;Avramidis,S. Visible dynamic changes in the mechanism of water evaporation surface formation during wood drying. Wood Sci. Technol. 2023, 57:1061-1076, . [CrossRef]
- Jerzy, M.; Maciej, S. Analysis of stress development during kiln drying of beech timber. Eur. J. Wood Wood Prod. 2023, 81:1189-1200, . [CrossRef]
- Jospeh,G.; Delphine,J.; Sandrine,B.; Hiroyuki,Y. Tree growth stress and related problems. J. Wood Sci. 2017, 63: 411-432, . [CrossRef]
- Sadaf, K.; Hassan, K.; Benoit, P.G.; Shanmuganathan,G. A study on enhanced mechanical properties of wood in the parallel-to-grain direction in timber-filled-steel tubular columns. Eng. Struct. 2025,331:119973, . [CrossRef]
- Liu,Y.;Moran,B. Tearing a neo-Hookean sheet. Part II: asymptotic analysis for crack tip fields. Int. J. Fract.2023,240:93-117, . [CrossRef]
- Vikas,G.; Suresh,V.; Garg,R.K. Reduction in stress concentration around a pair of circular holes with functionally graded material layer. Acta Mech. Sin. 2018, 129, 1045-1060, . [CrossRef]
- Bai,X.C; Yang,X.J.; Tan,Y.J.; Liu,J.M.;Wang,C.J. Flexural bearing capacity of crack damaged solid wood beams. Chin. J. For. Eng.2023, 8(2): 46-51, . [CrossRef]
- Zhang,B.Z.; Xie,Q.F.; Xue.J.Y. Study on the flexural behavior evolution of timber beams with natural shrinkage cracks in historic timber structure. Struct. 2025, 73:108429, . [CrossRef]
- Anna,H.; Szymon,S. Analysis of behavior and failure modes of timber beams prestressed with CFRP strips. Comp. Struct. 2022, 301:116171, . [CrossRef]
- Marek,R.; Maciej,G. The effect of crack orientation on the mode I fracture resistance of pinewood. Int. J. Fract.2024, 248: 27-48, . [CrossRef]
- Qiu, L.P.; Zhu,E.C.;Kuilen,J.W.G. Modeling crack propagation in wood by extended finite element method. Eur. J. Wood Prod. 2014, 72:273-283, . [CrossRef]
- Wen,Y.X.; Yang.Y.; Zhao,J.; Zhao,D. Theoretical and experimental considerations on the neutral axis of wood beams with a hole in different locations. Holzforschung, 2018, 72(9): 769-777, . [CrossRef]
- Okamoto,S; Akiyama,N.;Araki,Y.; Kenji,A.; Masahiro,I. Study on the strength of glued laminated timber beams with circular holes: difference in structural performance between homogeneous-grade and heterogeneous-grade timber. J Wood Sci .2021, 67: 8, . [CrossRef]
- Parracha,J.L.; Pereira,M.F.C.; Mauricío, A.; José,S.M.;Faulina,F.;Lina,N. A semi-destructive assessment method to estimate the residual strength of maritime pine structural elements degraded by anobiids. Mater. Struct. 2019, 52(3): 54, . [CrossRef]
- Danielsson,H.;Gustafsson, P.J. A probabilistic fracture mechanics method and strength analysis of glulam beams with holes. Eur. J. Wood Wood Prod. 2011, 69(3): 407-419, . [CrossRef]
- Cheng,J.Q.; Yang,J.J.; Liu,P. Characteristics and Utilization of Wood. In Chronicle of Chinese Timber, 1st ed. China Forestry Publishing House:Beingjing, China, 1992: 67-694.
- Li,Z.; Tao,X.; Zhao,Z.C.; Sun,H.Y.;Lei,Z. Mechanical properties and crack propagation for camphor pine during compression process. Forg. Stamp. Technol. 2024,49(11):87-93, . [CrossRef]
- Xiong,L.M.;Xing,X.F.;Lin,L.Y.; Zhou,Y.D.;Fu,F. Effects of high-field-intensity microwave treatment on macroscopic cracks in mongolian scotch pine. China Wood Ind. 2020, 34(6):1-4, . [CrossRef]
- Mikko,T.; Sami,P.; Hüseyin,E.I. Effect of cracks on the load-carrying capacity of glulam. Wood Mater. Sci. Eng. 2025, 20(1):1-12, . [CrossRef]
- Philip,M.D.;Rakesh,G.;Arijit,S. Revisiting the neutral axis in wood beams. Holzforschung. 2012,66:497-503, . [CrossRef]
- He ,S. Study of Finite Element Modeling Analysis for Pinus sylvestris L. var. mongolicaLitv. Finger-jointed Lumber. Master's Thesis, Nanjing Forestry University, Nanjing, China, 2011.6.19.
Figure 1.
Dimensions of the wooden beam and loading method used in the experiment, parameters of cracks and holes, and processing method for prefabricated cracks.
Figure 1.
Dimensions of the wooden beam and loading method used in the experiment, parameters of cracks and holes, and processing method for prefabricated cracks.
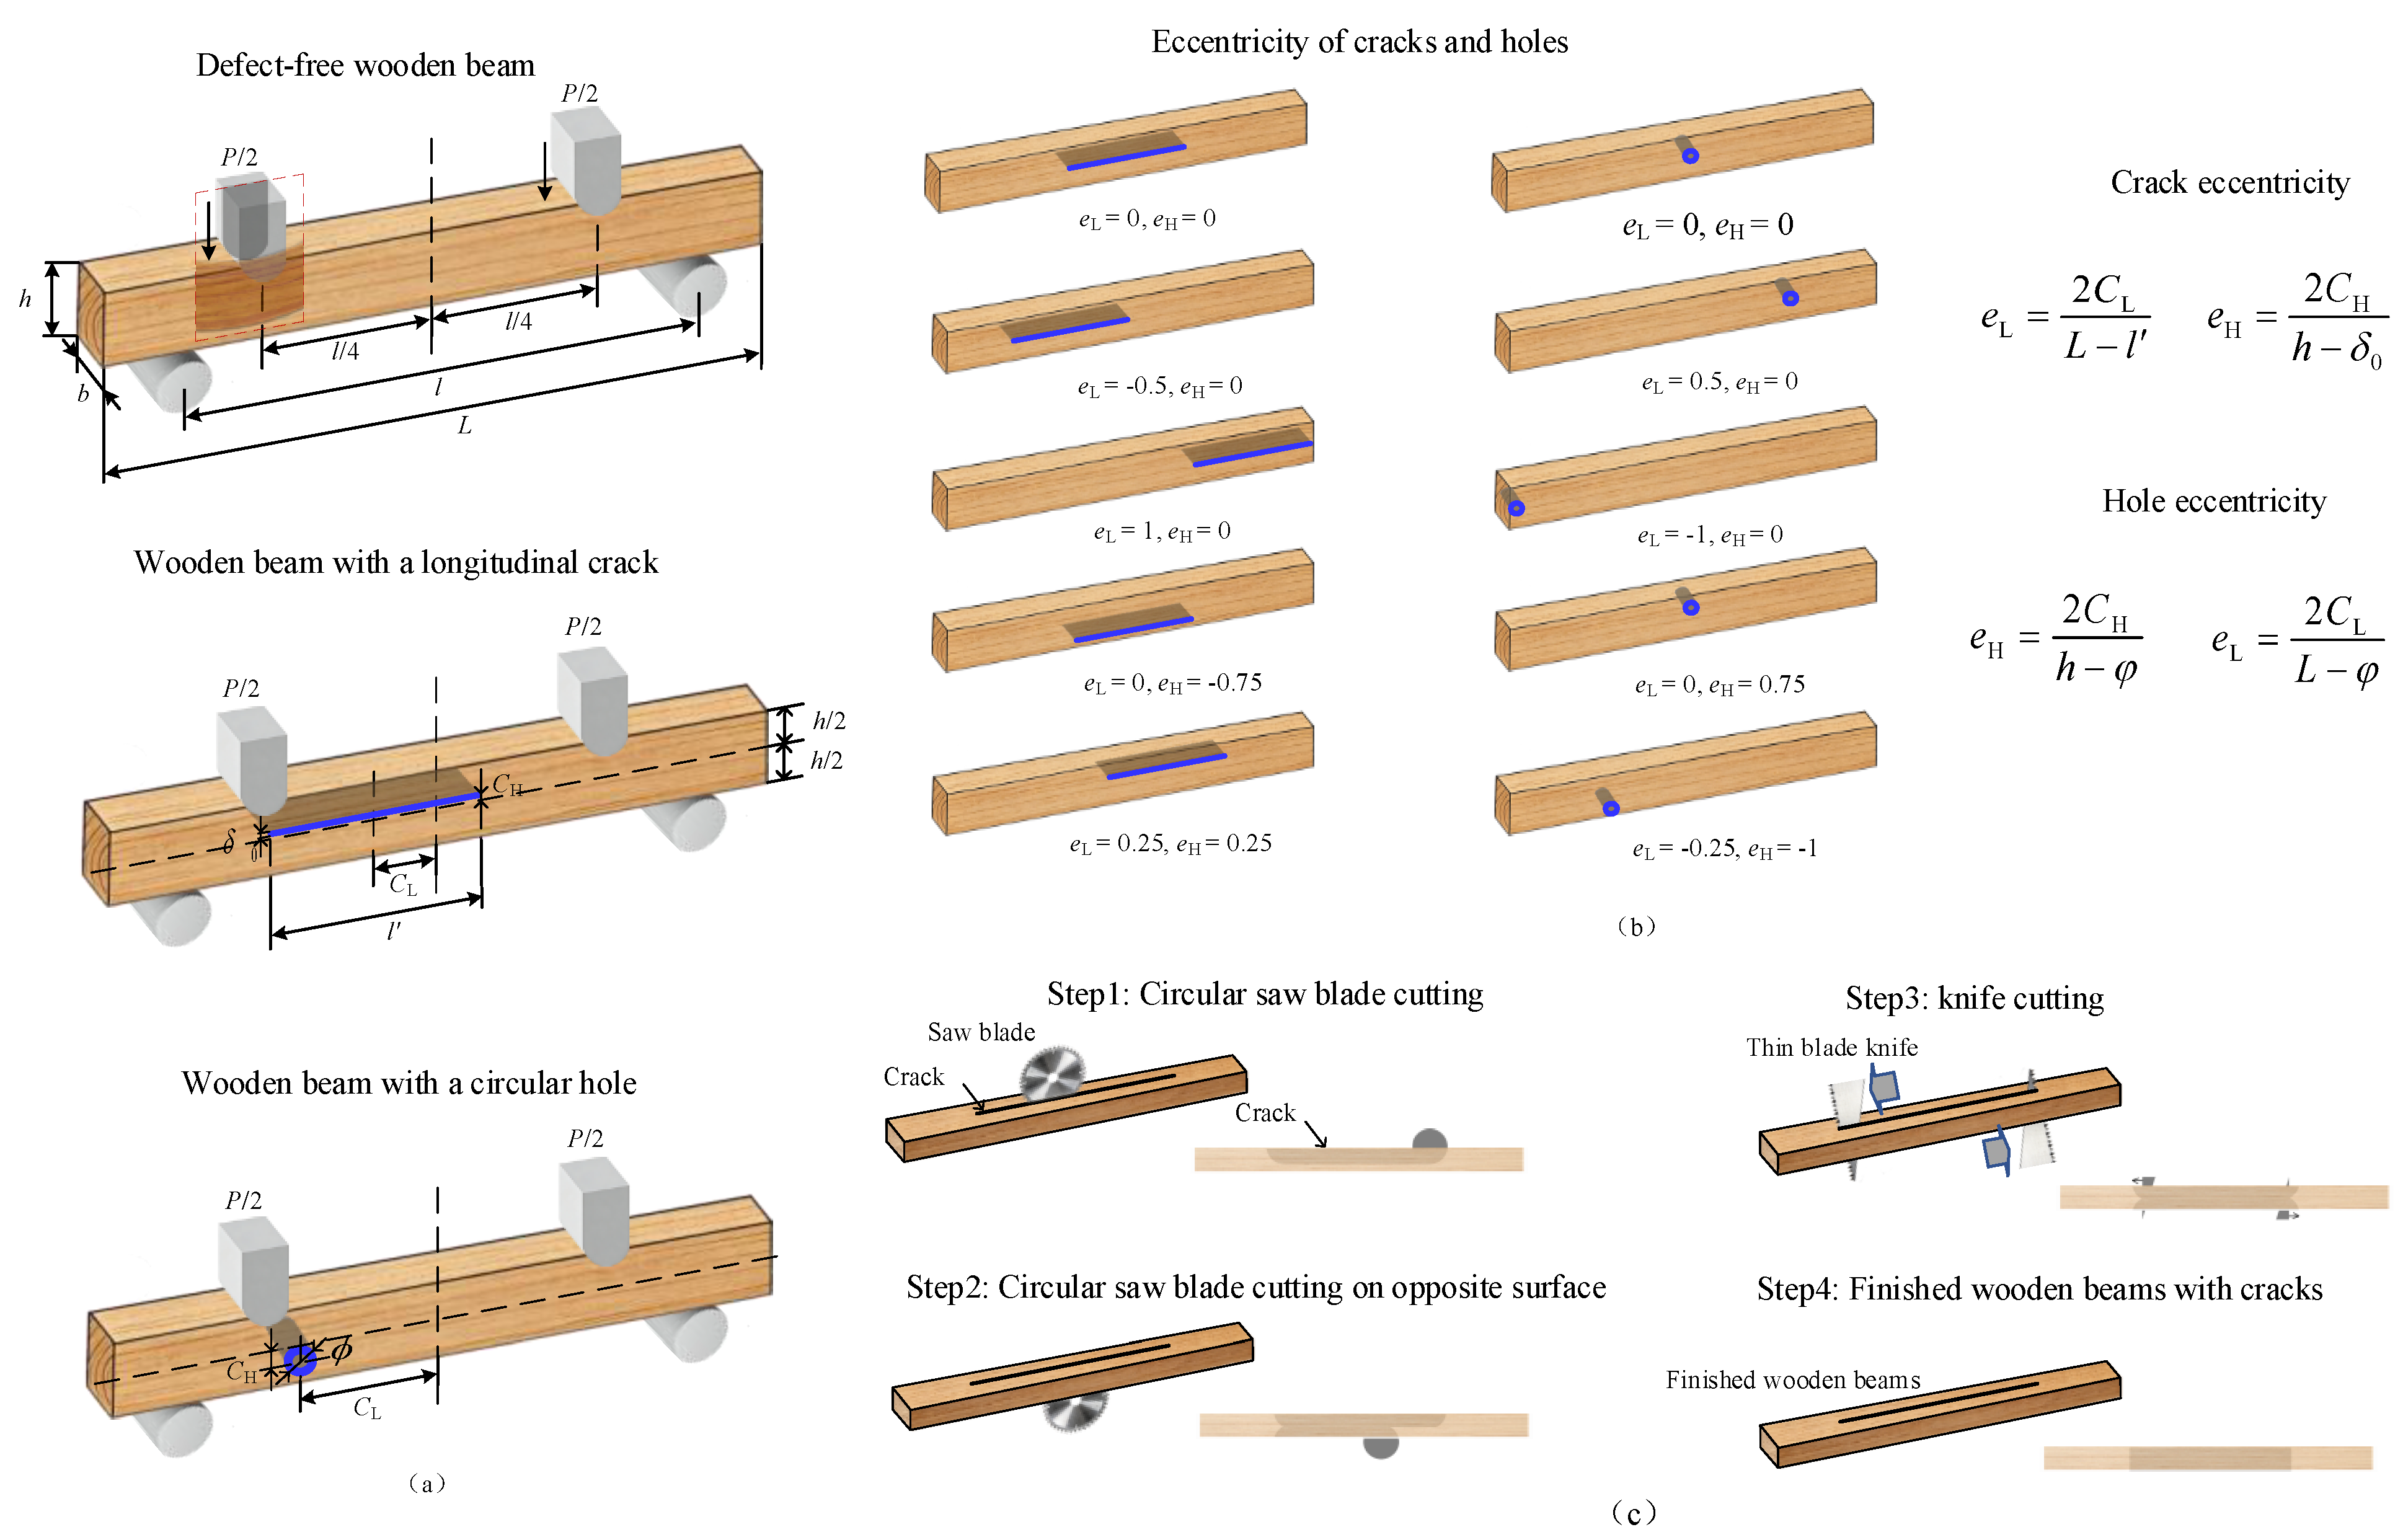
Figure 2.
Comparison of load-bearing capacity coefficient curves of longitudinal-crack and circular-hole wooden beams (related to vertical position).
Figure 2.
Comparison of load-bearing capacity coefficient curves of longitudinal-crack and circular-hole wooden beams (related to vertical position).
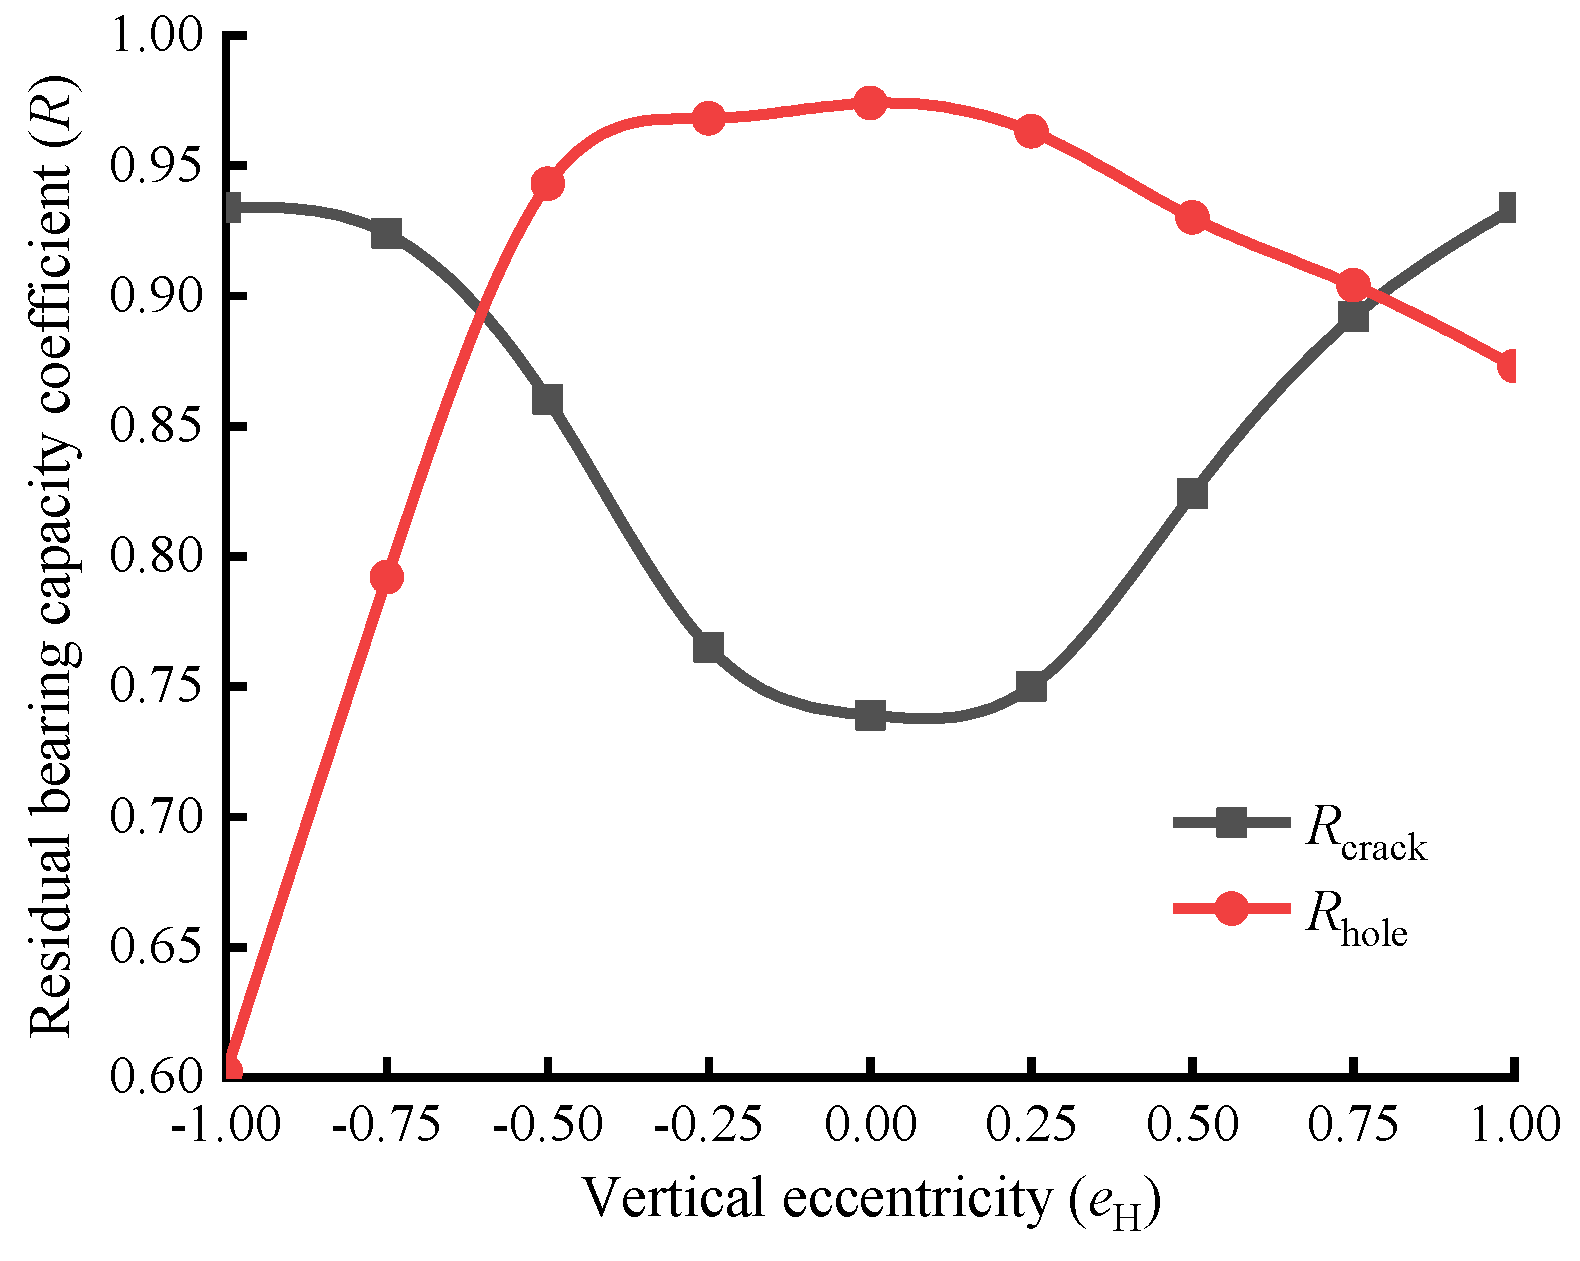
Figure 3.
Comparison of damage tolerance capacity coefficient curves of longitudinal-crack and circular-hole wooden beams (related to vertical position).
Figure 3.
Comparison of damage tolerance capacity coefficient curves of longitudinal-crack and circular-hole wooden beams (related to vertical position).
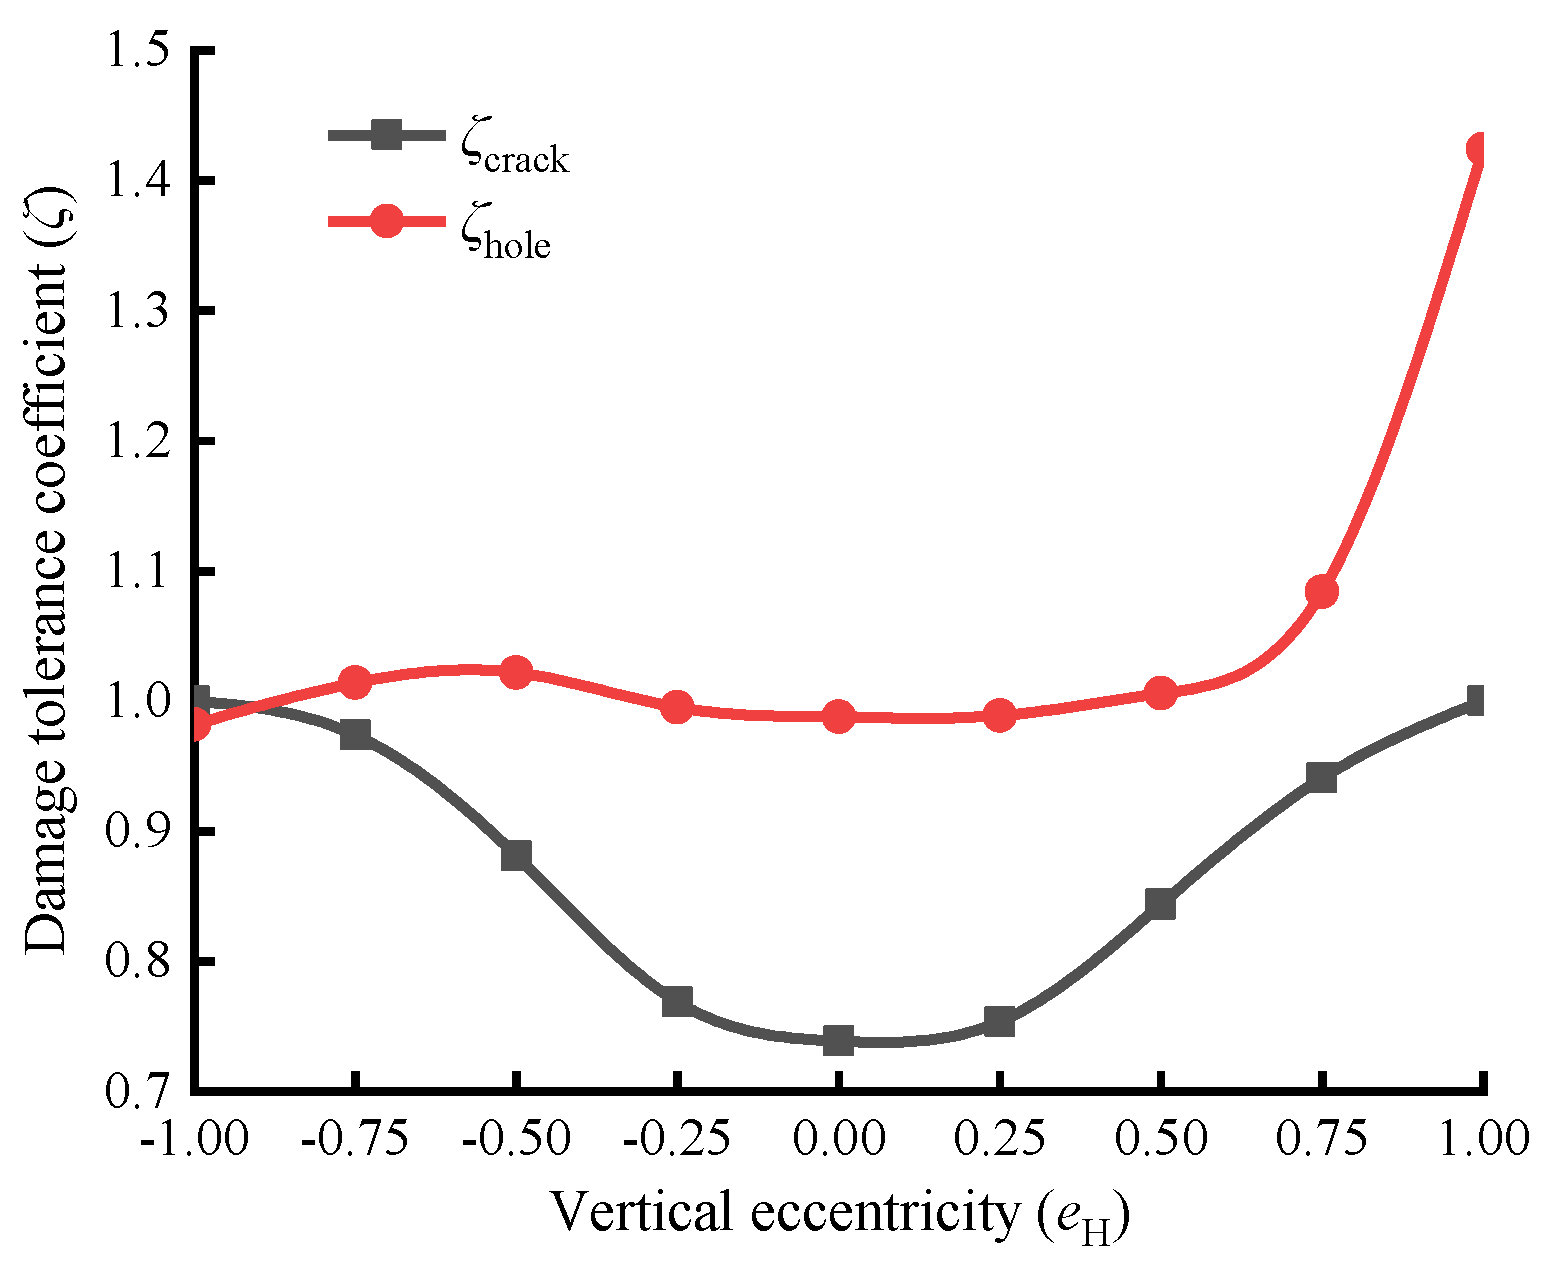
Figure 4.
Comparison of load-bearing capacity coefficient curves of longitudinal-crack and circular-hole wooden beams (related to horizontal position).
Figure 4.
Comparison of load-bearing capacity coefficient curves of longitudinal-crack and circular-hole wooden beams (related to horizontal position).
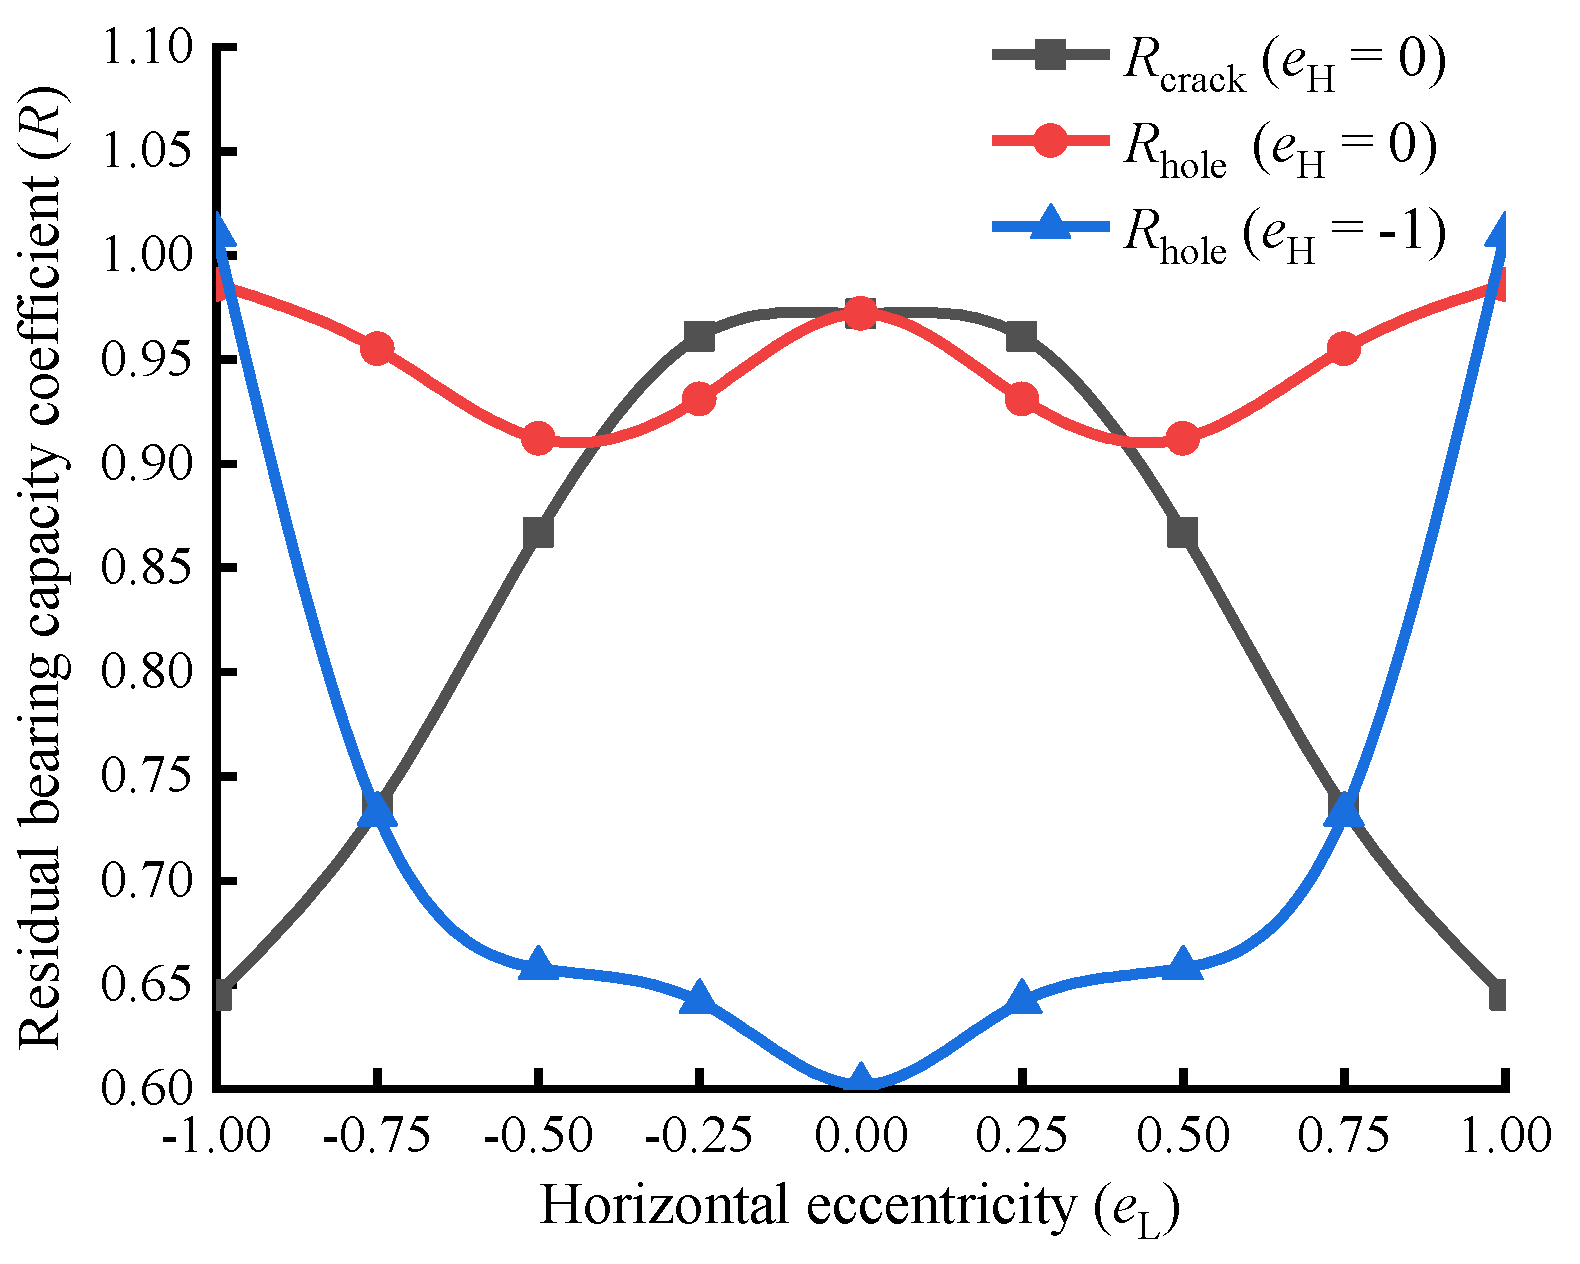
Figure 5.
Comparison of damage tolerance capacity coefficient curves of longitudinal-crack and circular-hole wooden beams (related to horizontal position).
Figure 5.
Comparison of damage tolerance capacity coefficient curves of longitudinal-crack and circular-hole wooden beams (related to horizontal position).
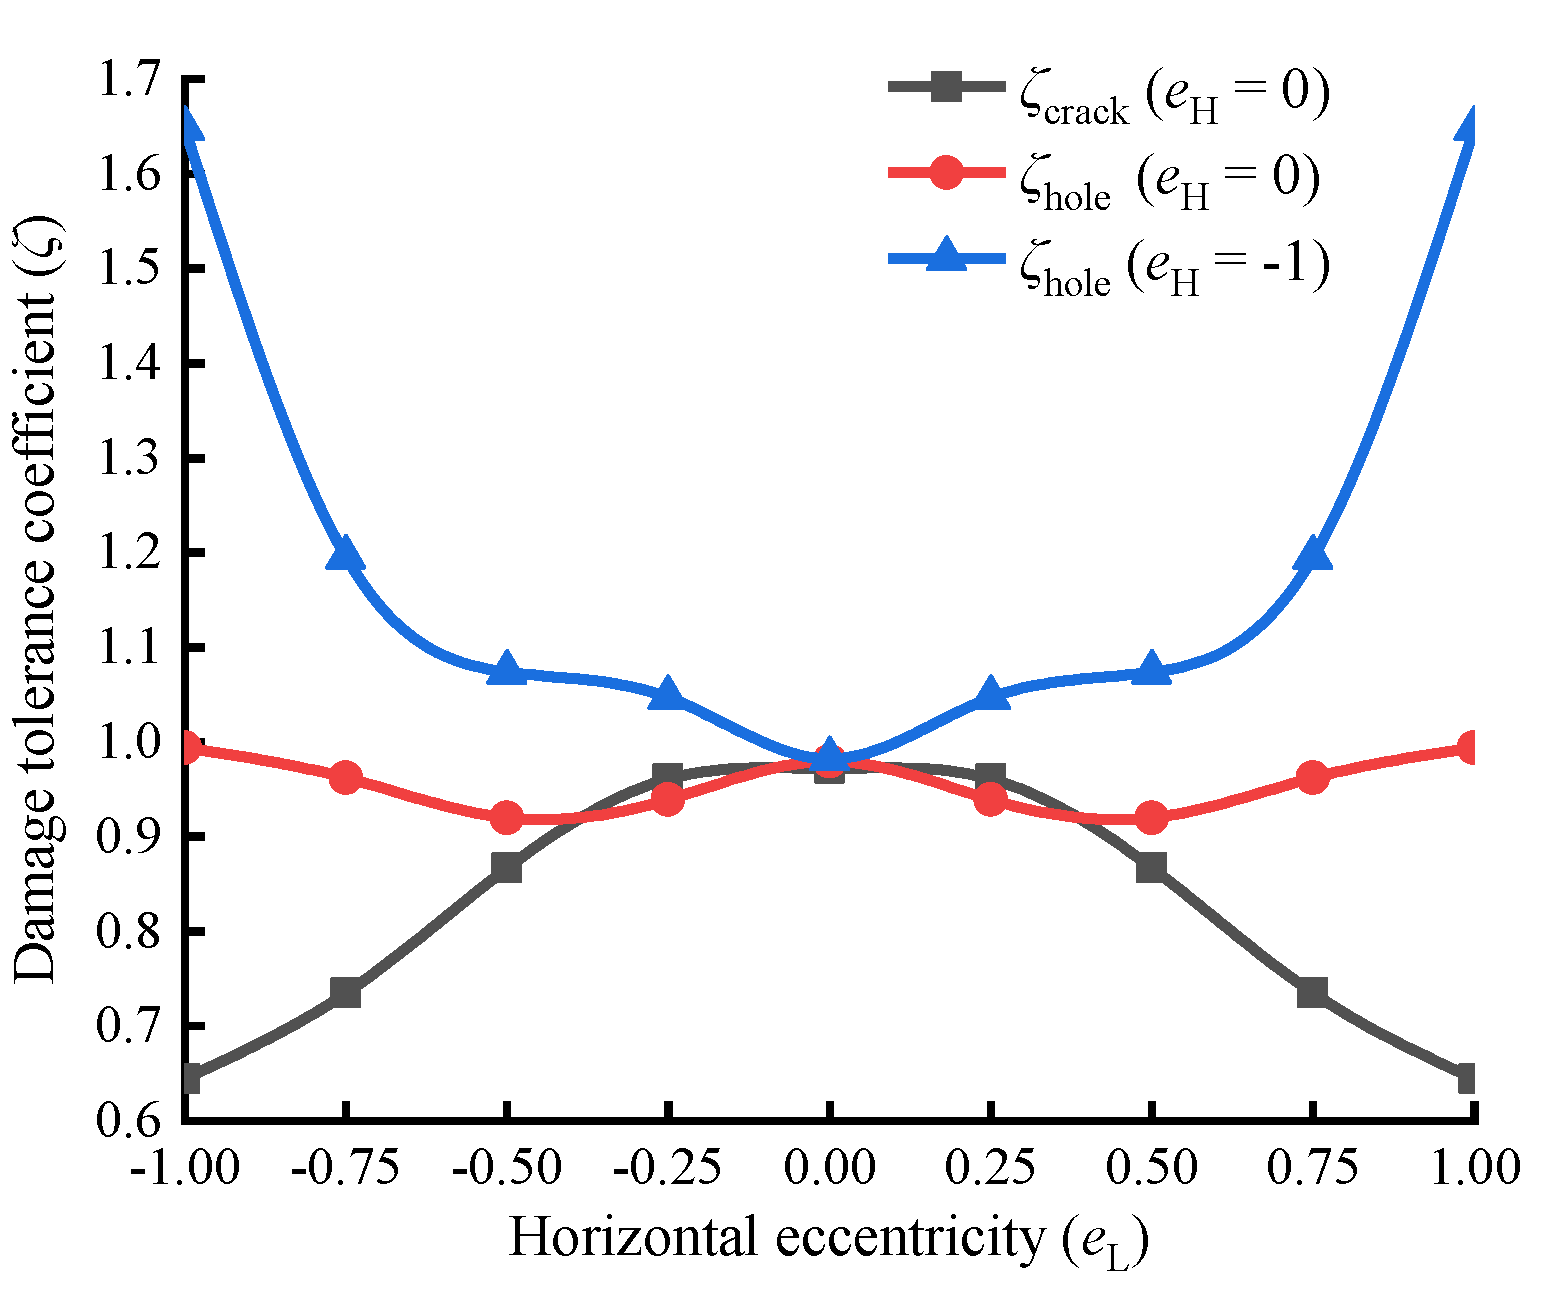
Figure 6.
Normal and shear stress distribution on a wooden beam and the resulting forms of failure.
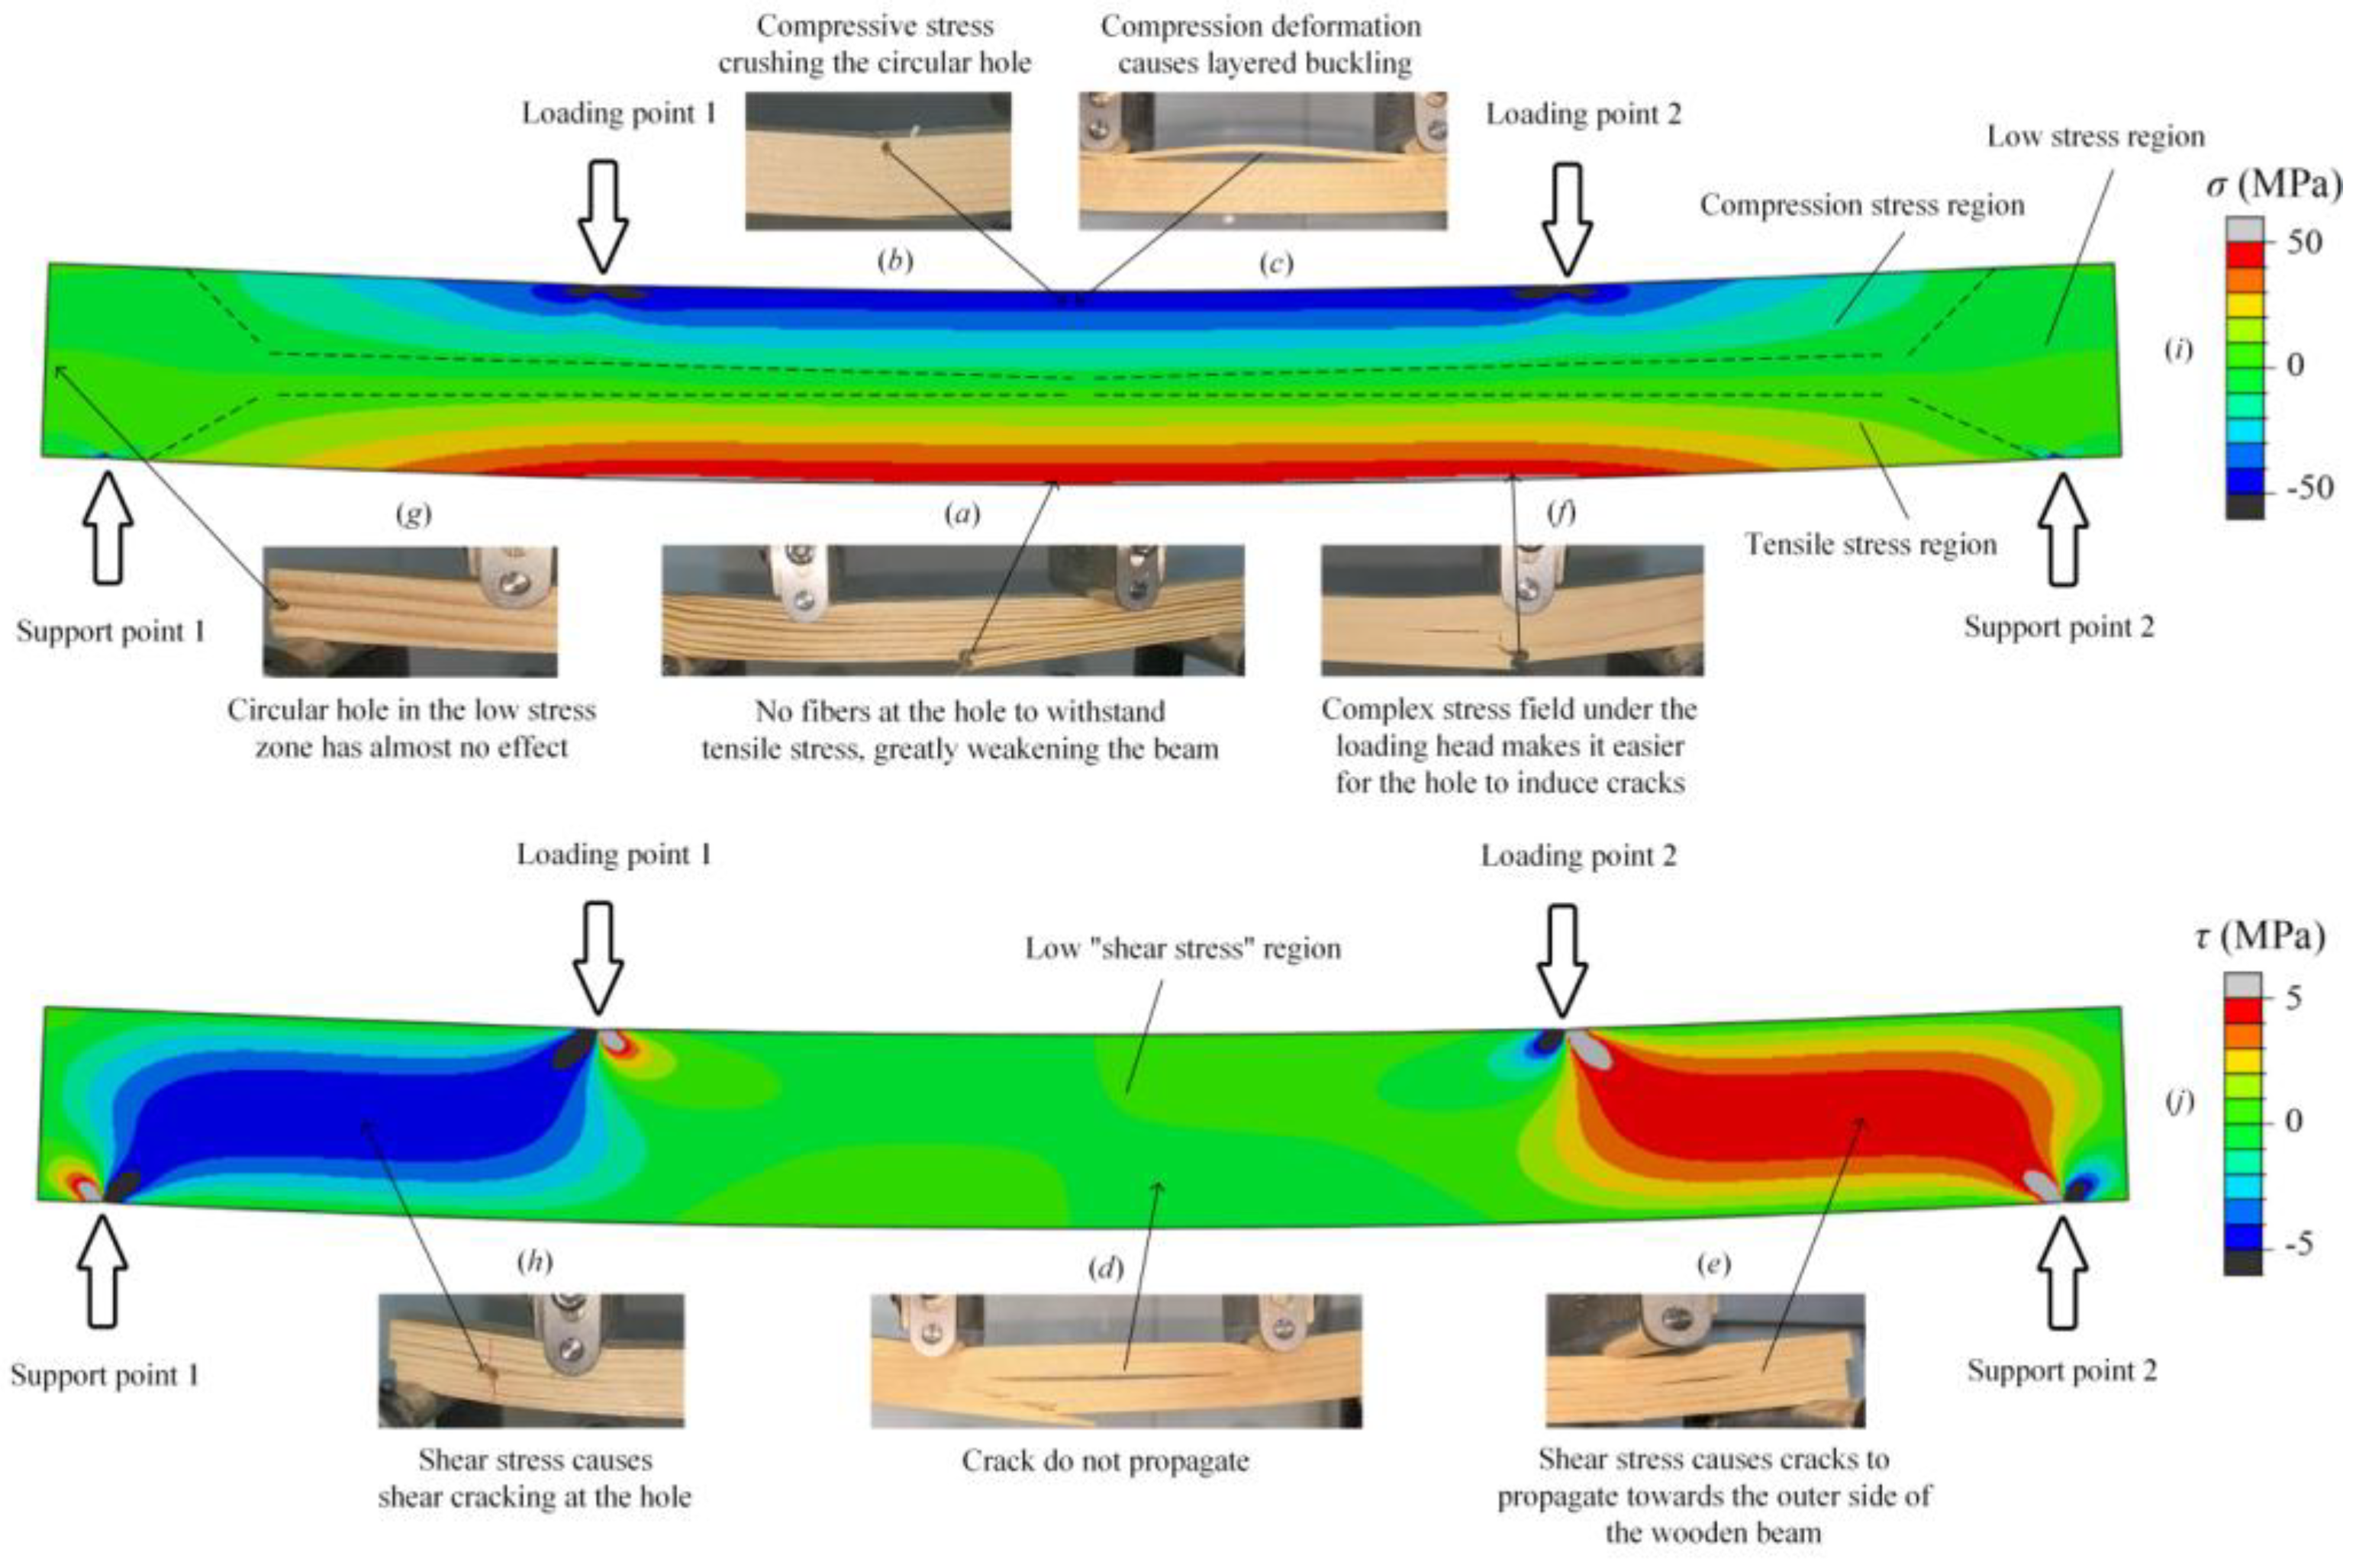

Table 1.
Examples of the fracture load adjustment under three cases.
| m/(g) | L/(mm) | b/(mm) | h/(mm) | l′ | φ | ρ/(kg·m-3) | Cρ | CW | P/(N) | Pe′/(N·m) | |
| Case 1 | 10.21 | 159.9 | 9.9 | 14.9 | / | / | 433 | 1.102 | 1.024 | 1206 | 1361 |
| Case 2 | 11.30 | 160.0 | 10.0 | 15.0 | L/2 | / | 479 | 0.996 | 1.000 | 1377 | 1371 |
| Case 3 | 12.32 | 160.1 | 10.1 | 15.2 | / | h/3 | 505 | 0.945 | 0.964 | 1502 | 1368 |
Table 2.
Comparison of experimental data of Pinus sylvestris var. mongolica wooden beams with a horizontal centered longitudinal-crack located at different vertical positions.
Table 2.
Comparison of experimental data of Pinus sylvestris var. mongolica wooden beams with a horizontal centered longitudinal-crack located at different vertical positions.
| Crack vertical eccentricity eH | Sample size | Average equivalent fracture load /(N) | R | λ | ζ | |||
| average/(N) | max/(N) | min/(N) | CV/% | |||||
| -1.00* | / | 1277* | / | / | / | 0.934* | 0.934* | 1.000* |
| -0.75 | 40 | 1263 | 1689 | 752 | 14.9 | 0.924 | 0.948 | 0.974 |
| -0.50 | 80 | 1176 | 1957 | 675 | 17.2 | 0.860 | 0.977 | 0.881 |
| -0.25 | 80 | 1045 | 1481 | 530 | 14.7 | 0.765 | 0.994 | 0.769 |
| 0.00 | 80 | 1010 | 1570 | 662 | 15.3 | 0.739 | 1.000 | 0.739 |
| 0.25 | 80 | 1026 | 1458 | 587 | 17.3 | 0.751 | 0.994 | 0.755 |
| 0.50 | 80 | 1127 | 1583 | 274 | 22.0 | 0.824 | 0.977 | 0.844 |
| 0.75 | 40 | 1220 | 1651 | 635 | 15.8 | 0.892 | 0.948 | 0.941 |
| 1.00* | / | 1277* | / | / | / | 0.934* | 0.934* | 1.000 |
*Note: eH=±1 indicates that the crack has reached the upper and lower surfaces of the wooden beam. As such cracks do not actually exist, the fracture load values listed in the table for eH=±1 are calculated using material mechanics theory, assuming that the crack is infinitely close to the upper and lower surfaces of the wooden beam. The fracture load values are marked with "*".
Table 3.
Comparison of experimental data of Pinus sylvestris var. mongolica wooden beams with a horizontal centered circular hole located at different vertical positions.
Table 3.
Comparison of experimental data of Pinus sylvestris var. mongolica wooden beams with a horizontal centered circular hole located at different vertical positions.
| Hole vertical eccentricity eH | Sample size | Average equivalent fracture load /(N) | R | λ | ζ | |||
| average/(N) | max/(N) | min/(N) | CV/% | |||||
| −1.00 | 40 | 823 | 1301 | 416 | 25.9 | 0.602 | 0.613 | 0.982 |
| −0.75 | 60 | 1083 | 1528 | 645 | 20.4 | 0.792 | 0.781 | 1.014 |
| −0.50 | 60 | 1289 | 1941 | 793 | 20.0 | 0.943 | 0.901 | 1.022 |
| −0.25 | 60 | 1324 | 2023 | 812 | 18.3 | 0.968 | 0.973 | 0.995 |
| 0.00 | 60 | 1332 | 1887 | 773 | 19.0 | 0.974 | 0.992 | 0.988 |
| 0.25 | 60 | 1316 | 1909 | 718 | 17.5 | 0.963 | 0.973 | 0.989 |
| 0.50 | 60 | 1272 | 2201 | 634 | 20.6 | 0.930 | 0.901 | 1.006 |
| 0.75 | 60 | 1236 | 1811 | 767 | 18.6 | 0.904 | 0.781 | 1.084 |
| 1.00 | 40 | 1193 | 1645 | 524 | 16.9 | 0.873 | 0.613 | 1.424 |
Table 4.
Comparison of experimental data of Pinus sylvestris var. mongolica wooden beams with a vertical centered longitudinal crack located at different horizontal positions.
Table 4.
Comparison of experimental data of Pinus sylvestris var. mongolica wooden beams with a vertical centered longitudinal crack located at different horizontal positions.
| Crack horizontal eccentricity eL | Sample size | Average equivalent fracture load /(N) | R | λ | ζ | |||
| average/(N) | max/(N) | min/(N) | CV/% | |||||
| 0 | 60 | 1328 | 1765 | 869 | 16.0 | 0.972 | 1.000 | 0.972 |
| ±0.25 | 40 | 1314 | 1931 | 1051 | 13.1 | 0.961 | 1.000 | 0.961 |
| ±0.50 | 40 | 1186 | 1685 | 795 | 14.4 | 0.867 | 1.000 | 0.867 |
| ±0.75 | 40 | 1005 | 1243 | 779 | 10.9 | 0.735 | 1.000 | 0.735 |
| ±1.00 | 40 | 882 | 1211 | 624 | 14.8 | 0.645 | 1.000 | 0.645 |
Table 5.
Comparison of experimental data of Pinus sylvestris var. mongolica wooden beams with a circular hole located at different horizontal positions.
Table 5.
Comparison of experimental data of Pinus sylvestris var. mongolica wooden beams with a circular hole located at different horizontal positions.
| Hole horizontal eccentricity eL | Sample size | Average equivalent fracture load /(N) | R | λ | ζ | |||
| average/(N) | max/(N) | min/(N) | CV/% | |||||
| 0 | ①60 ②40 |
①1332 ②823 |
①1887 ②1301 |
①773 ②416 |
①19.0 ②25.9 |
①0.974 ②0.602 |
①0.992 ②0.613 |
①0.988 ②0.982 |
| ±0.25 | ①40 ②40 |
①1273 ②877 |
①1949 ②1382 |
①892 ②508 |
①19.1 ②28.9 |
①0.931 ②0.642 |
①0.992 ②0.613 |
①0.939 ②1.047 |
| ±0.50 | ①40 ②40 |
①1247 ②900 |
①1924 ②1391 |
①804 ②519 |
①21.3 ②24.9 |
①0.912 ②0.658 |
①0.992 ②0.613 |
①0.920 ②1.074 |
| ±0.75 | ①40 ②40 |
①1305 ②1001 |
①1953 ②1566 |
①768 ②484 |
①18.3 ②26.2 |
①0.955 ②0.732 |
①0.992 ②0.613 |
①0.962 ②1.195 |
| ±1.00 | ①40 ②60 |
①1348 ②1381 |
①1759 ②1930 |
①882 ②787 |
①17.7 ②17.2 |
①0.986 ②1.010 |
①0.992 ②0.613 |
①0.994 ②1.648 |
*Note: The experimental data of the wooden beam with the vertical position of the hole at the axis position of the wooden beam (eH=0) are listed after number ① in the table; The experimental data of the wooden beam with the edge of the hole tangent to the lower surface of the wooden beam (eH=−1) are listed after number ② in the table.
Table 6.
Elastic constant data of Pinus sylvestris var. mongolica used in the FE model.
| EL/MPa | ER/MPa | ET/MPa | GLR/MPa | GLT/MPa | GRT/MPa | vLR | vLT | vRT |
| 10000 | 800 | 400 | 620 | 540 | 70 | 0.46 | 0.62 | 0.73 |
*Note: EL, ER, ET are the elastic modulus values in the axial, radial, and tangential directions, GLR, GLT, GRT are the shear elastic modulus values, and vLR, vLT, vRT are poisson's ratios.
Disclaimer/Publisher’s Note: The statements, opinions and data contained in all publications are solely those of the individual author(s) and contributor(s) and not of MDPI and/or the editor(s). MDPI and/or the editor(s) disclaim responsibility for any injury to people or property resulting from any ideas, methods, instructions or products referred to in the content. |
© 2026 by the authors. Licensee MDPI, Basel, Switzerland. This article is an open access article distributed under the terms and conditions of the Creative Commons Attribution (CC BY) license.
Copyright: This open access article is published under a Creative Commons CC BY 4.0 license, which permit the free download, distribution, and reuse, provided that the author and preprint are cited in any reuse.


