Introduction
Parathyroid disorders in the adult focus primarily on primary hyperparathyroidism (PHPT), characterized by persistent inappropriate syntheses and release of parathyroid hormone (PTH) causing hypercalcemia, and hypoparathyroidism (HypoPT) which is a rare entity caused by markedly decreased or absent levels of circulating PTH [
1,
2,
3,
4,
5]. Accumulating evidence point to an enhanced cardiovascular risk in both disorders, with a particularly relevant meaning of PHPT [
6,
7,
8,
9,
10,
11,
12]. Hyperparathyroidism and hypercalcemia are invariably linked to cardiovascular complications by direct and indirect effects on cardiomyocytes, endothelial cells, pancreatic β-cells and adipose tissue with induction of the atherothrombotic environment [
13,
14,
15,
16,
17].
A number of clinical and experimental studies have associated PHPT with higher rates of hypertension, arrhythmias, metabolic derangements and subclinical vascular injury, thus reinforcing the concept that these patients present an increased cardiovascular risk [
16,
17]. In this regard, we and others have previously shown that patients with parathyroid disorders—in particular those affected by PHPT—have features consistent with an increased atherothrombotic risk profile, hinting the possibility that excessive PTH might be involved in the pathogenesis of vascular impairment and atherosclerotic phenomena [
18,
19]. However, epidemiologic findings are partly conflicting, and study design, population composition and distribution in terms of gender structure, age at diagnosis or serum calcium values may account for variable cardiovascular phenotypes in PHPT different cohorts. Moreover, the association of PHPT with obesity is still controversial [
20]. It has been observed that patients with PHPT have increased body weight and body mass index (BMI), when compared to controls [
20]; it is possible that this occurs due to an action of PTH on lipolysis inhibition in adipose tissue. Nonetheless, high levels of PTH seem not to be always associated with weight gain and evidence shows a non-linear relationship between BMI/weight and the extent of hypersecretion of PTH that may involve downtime weight loss (probably related to hypercalcemia or malnutrition) or also upstay in thermogenesis [
21,
22]. On one hand, obesity may impact the clinical effects of PHPT in terms of its metabolic and renal consequences [
23].
The evaluation of cardiovascular (CV) risk is based on the detection of early structural and functional vascular changes. In this regard, carotid intima–media thickness (IMT) [
24,
25] and flow-mediated dilation (FMD) [
26] are well-established and highly reproducible modalities for predicting cardiovascular risk. IMT has been validated as a subclinical marker of atherosclerosis and predictors for future cardiovascular events, while FMD is a well-known non-invasive indicator of endothelial dysfunction. Notwithstanding their great accuracy, these approaches may not be applicable in routine clinical work or mass screening. Thus, anthropometric indices have been attracting interest as simple, cheap and non-invasive markers with a relationship to vascular risk factor. Of these, BMI, waist circumference (WC), waist height ratio (WHtR) and waist hip ratio (WHR) are more widely accepted to use in routine clinical practice and having a possible role as an early screening tool for cardiovascular risks [
27]. In recent years, new anthropometric indexes have been introduced to better assess body fat distribution and its association with cardiovascular risk. In particular, the conicity index (CI) uses weight, height, and abdominal circumference variables to estimate the degree of obesity and fat distribution [
28]. To the best of our knowledge, no study has yet directly investigated how these indices reflect cardiovascular risk in subjects with parathyroid disorders.
The present study aims to investigate whether novel and traditional anthropometric indices distinguish PHPT and are correlated with markers of atherothrombotic risk.
Materials and Methods
Study Design
This cross-sectional, single-center study took place at the bone outpatient clinic of the Metabolic Bone and Thyroid Disorders Unit of Fondazione Policlinico Universitario Campus Bio-Medico of Rome between March 2021 and July 2023.
Ethics Approval and Consent to Participate
Our protocol adhered to the Declaration of Helsinki and the International Conference on Harmonization Good Clinical Practice, receiving approval from Campus Bio-Medico University ethics committees (89/20 PAR ComEt CBM from 27th November 2020). All participants granted informed consent, allowing the use of their pseudoanonymized information for data analysis. The corresponding author had full access to all the data in the study and took responsibility for its integrity and data analysis.
Participants
Subjects with post-surgical HypoPT and PHPT were consecutively enrolled. HypoPT was defined as hypocalcemia in the presence of a low or inappropriately normal PTH level at least 12 months after surgery [
8]. PHPT was defined as elevated or unsuppressed PTH concentrations and persistently elevated (high) total, albumin-corrected, or ionized serum calcium levels (at least two different determinations)[
2]. All participants in the study had previously received oral cholecalciferol to ensure sufficient 25-hydroxy vitamin D (25(OH)D) levels. Post-surgical HypoPT participants were receiving thyroxine treatment and maintained normal TSH levels.
We excluded subjects with any other condition that can affect bone and calcium metabolism, such as familial hypocalciuric hypercalcemia, 25(OH)D<20 ng/mL (for controls), malabsorption diseases; other diseases known to affect bone metabolism (thyrotoxicosis, bowel diseases, chronic hepatic disease, depression, history of Cushing’s, alcoholism, smoking habit, diabetes, antihypertensive therapy, obesity, eating disorders, rheumatological or hematological diseases, chronic inflammatory disease and autoimmune diseases); administration of drugs affecting bone and calcium metabolism (thiazide diuretic, lithium, bisphosphonates, significant use of glucocorticoids within the past 2 years or any treatment that could affect calcium metabolism). We also excluded patients with a prior history of cardiovascular disorders, as well as those showing symptoms indicative of atherosclerotic cardiovascular disease and/or classified as having high or very high cardiovascular risk according to the SCORE2 system [
29]. Additionally, patients with active malignancies other than low-risk, well-differentiated thyroid cancer were not included in the study cohort.
Control subjects without any impairment of calcium, phosphate and PTH concentration were consecutively recruited based on the above-mentioned exclusion criteria from the outpatient clinic of endocrinology, where they were referred for unrelated diseases (thyroid nodules with euthyroidism). To ensure comparability, we performed age- and BMI-based nearest-neighbor matching using the Euclidean distance metric. For each individual in the pathological groups (HypoPT and PHPT), we identified the control subject with the smallest Euclidean distance in a two-dimensional space defined by age and BMI. Matching was performed without replacement to maintain a 1:1 ratio. After matching, the groups were verified for balance in age and BMI, confirming the effectiveness of the matching procedure.
Procedures
Clinical Evaluation
We evaluated the clinical profile of the whole study population by recording the medical history and reviewing the clinical, laboratory and imaging results already performed on patients. Physical examination was performed in all subjects. To minimise selection and measurement bias, all field investigators underwent standardised training before data collection. Weight was measured with a precision biomedical scale and the height was determined with a Harpenden stadiometer. All measures were carried out with participants wearing light clothing and no shoes. A non-elastic tape was used to assess the hip circumference (HC), neck circumference (NC), wrist circumference (CWrist), and waist circumference (WC). Novel and traditional anthropometric indices were calculated using the formulas reported below. BMI = weight (kg)/height
2(m), cut-off: ≥ 30 kg/m2 [
27]; WHR=WC (cm)/HC (cm), cut-off:>0.8 (women)[
30]; WHtR=WC (cm)/height (cm), cut-off:> 0.5 [
31]; Conicity Index=0.109−
1 WC (m) [Weight (kg)/Height (m)]−
1/2, cut-off: >1.28 [
32].
Biochemical Analysis
Fasting blood sampling was obtained in the morning (from 8:00 to 9:00 AM). Serum total calcium (normal, 8.4–10.2 mg/dL) and albumin were measured using automated methods, and calcium values were corrected for albumin concentration. Serum thyroid stimulating hormone (TSH), blood glucose levels, ionized serum calcium, serum phosphate, 25(OH)D and creatinine were also measured by automated techniques. Intact PTH was assessed by an immunochemiluminometric assay using the automatic analyzer Modular E170 (Roche Diagnostics, Indianapolis, Ind, USA). Normal serum iPTH levels ranged between 13 and 85 pg/mL.
Blood Sample Collection
After an 8-hour fasting, the peripheral venous blood samples were collected in sterile vacutainer tubes (Vacutainer Systems, Belliver Industrial Estate), which differed according to the analyses to be performed. Blood samples were drawn in tubes with or without anticoagulant (3.2% sodium citrate) to obtain serum and plasma, respectively. Then, they were centrifuged at 300 x g for 10 minutes at room temperature, with maximum deceleration (Beckman Coulter-Mod: AllegraX-12R). Serum and plasma samples were stored at -80 °C to analyze the different markers.
Statistical Analysis
Continuous variables were summarized as mean and standard deviation (SD). Cases with missing values in the grouping variable were excluded from group-based analyses using listwise deletion. Between-group differences in anthropometric indices were tested using one-way analysis of variance (ANOVA; Type III sums of squares). Homogeneity of variances was assessed with Levene’s test. When the ANOVA was significant, post-hoc pairwise comparisons were performed using Tukey’s correction; effect sizes were reported as η² for ANOVA tests and Cohen’s d for pairwise comparisons; confidence intervals for mean differences were Tukey-adjusted, whereas confidence intervals for Cohen’s d were Bonferroni-adjusted. Pearson’s correlation coefficient (r) was used to quantify associations between anthropometric indices and vascular outcomes (IMT and FMD×100). The strength of correlation was interpreted based on the absolute value of r using the following guidelines: 0.00–0.19 “very weak”; 0.20–0.39 “weak”; 0.40–0.59 “moderate”; 0.60–0.79 “strong”; 0.80–1.00 “very strong” [
34]. In addition, multivariable linear regression models were fitted to estimate independent associations with IMT and FMD×100, entering group as a categorical predictor (Ctrl as reference) and anthropometric indices as continuous predictors; multicollinearity was assessed using tolerance and variance inflation factors (VIFs). All tests were two-tailed, and statistical significance was set at α = 0.05. All analysis were performed using JASP Version 0.95.4 (JASP Team (2025).
Results
Clinical and Biochemical Features
The study population included 120 adults (40 subjects with HypoPT, 40 with PHPT and 40 controls) (mean age 54.011.0 years; 87% female). All demographic, clinical and laboratory data are reported in
Table 1. There are no differences between the three groups regarding age, sex, and BMI. The PHPT group showed higher central adiposity indices (WHtR and CI). FMD values (expressed as FMD×100) notably decreased in patients with PHPT, with a significant difference reported between PHPT and HypoPT groups and controls (p<0.001 between PHPT and controls and p=0.001 between HypoPT and controls) (
Table 1). Regarding IMT, both patients with PHPT and HypoPT showed higher values of IMT compared to control subjects (p<0.001 and p=0.001, respectively). Full descriptive statistics are provided in
Table 1.
Anthropometric Parameters and Derived Indices of Adiposity and Cardiometabolic Risk
One-way ANOVA showed no statistically significant between-group differences for WC (F(2,116)=2.786, p=0.066, η²=0.046), HC (F(2,116)=2.225, p=0.113, η²=0.037), NC (F(2,116)=1.195, p=0.306, η²=0.020), CWrist (F(2,116)=0.798, p=0.453, η²=0.014), or WHR (F(2,116)=1.369, p=0.258, η²=0.023).
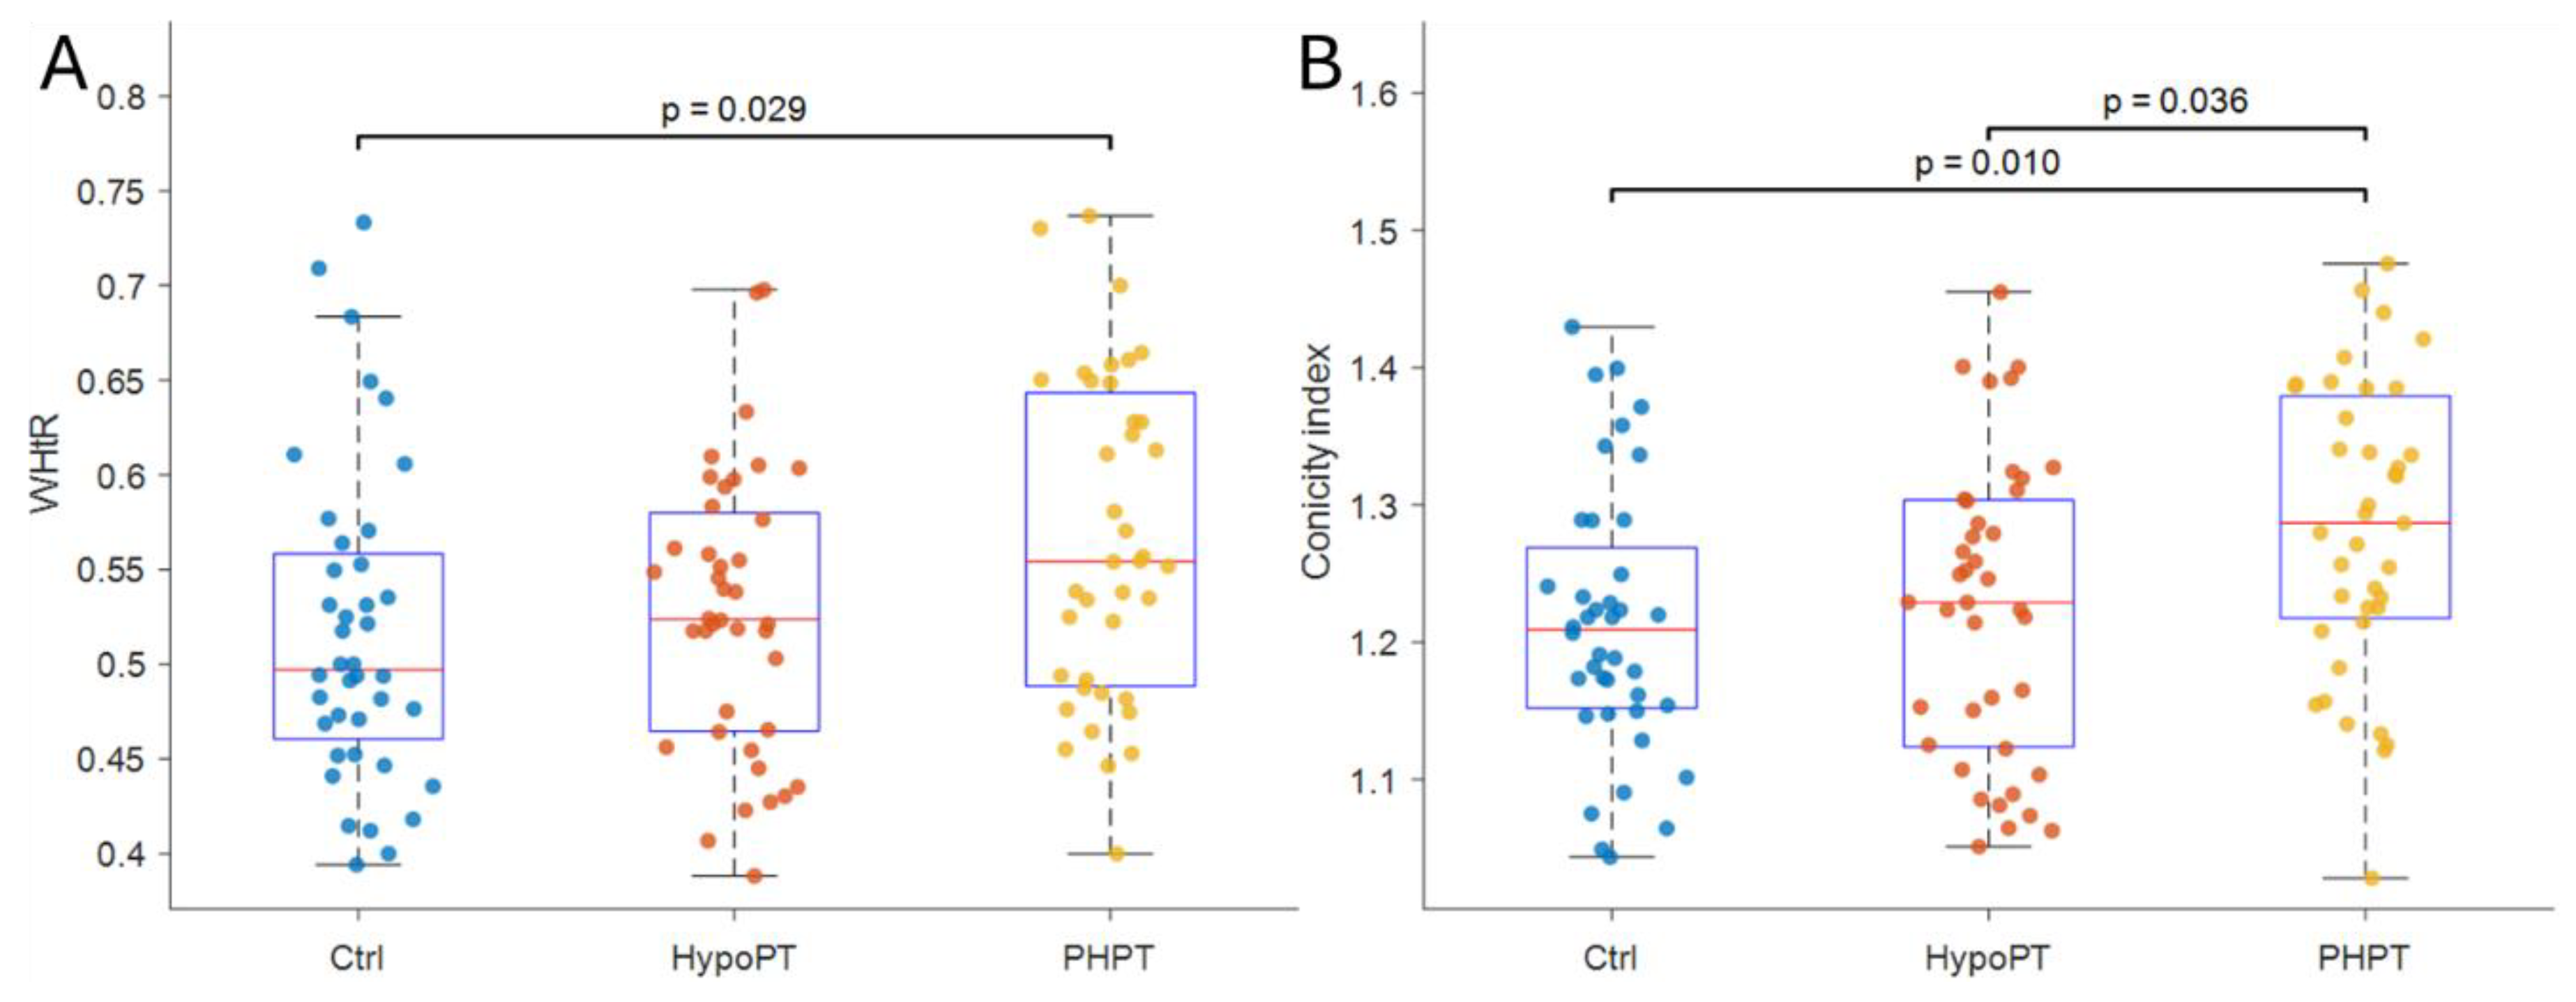
Homogeneity of variances was supported for these models (Levene’s tests p>0.05). Conversely, WHtR differed significantly across groups (F(2,116)=3.671, p=0.028, η²=0.060) and post-hoc comparisons indicated that PHPT exhibited higher WHtR than Ctrl (mean difference =0.047, 95%CI 0.004 to 0.091; p=0.029; d=0.58, Bonferroni-adjusted 95% CI 0.03 to 1.14)
Figure 1.A, whereas the remaining pairwise contrasts were not significant (all p>0.05). Similarly, the CI differed across groups (F(2,116)=5.072, p=0.008, η²=0.080). Post-hoc test showed that PHPT had higher CI values compared with Ctrl (mean difference =0.070, 95%CI 0.014 to 0.125; p=0.010; d=0.67, Bonferroni-adjusted 95%CI 0.11 to 1.22) and HypoPT (mean difference=0.059, 95%CI 0.003 to 0.115; p=0.036; d=0.56, Bonferroni-adjusted 95%CI 0.01 to 1.12)
Figure 1B, while Ctrl and HypoPT did not differ (p=0.890). All analysis are reported in
Table 2.
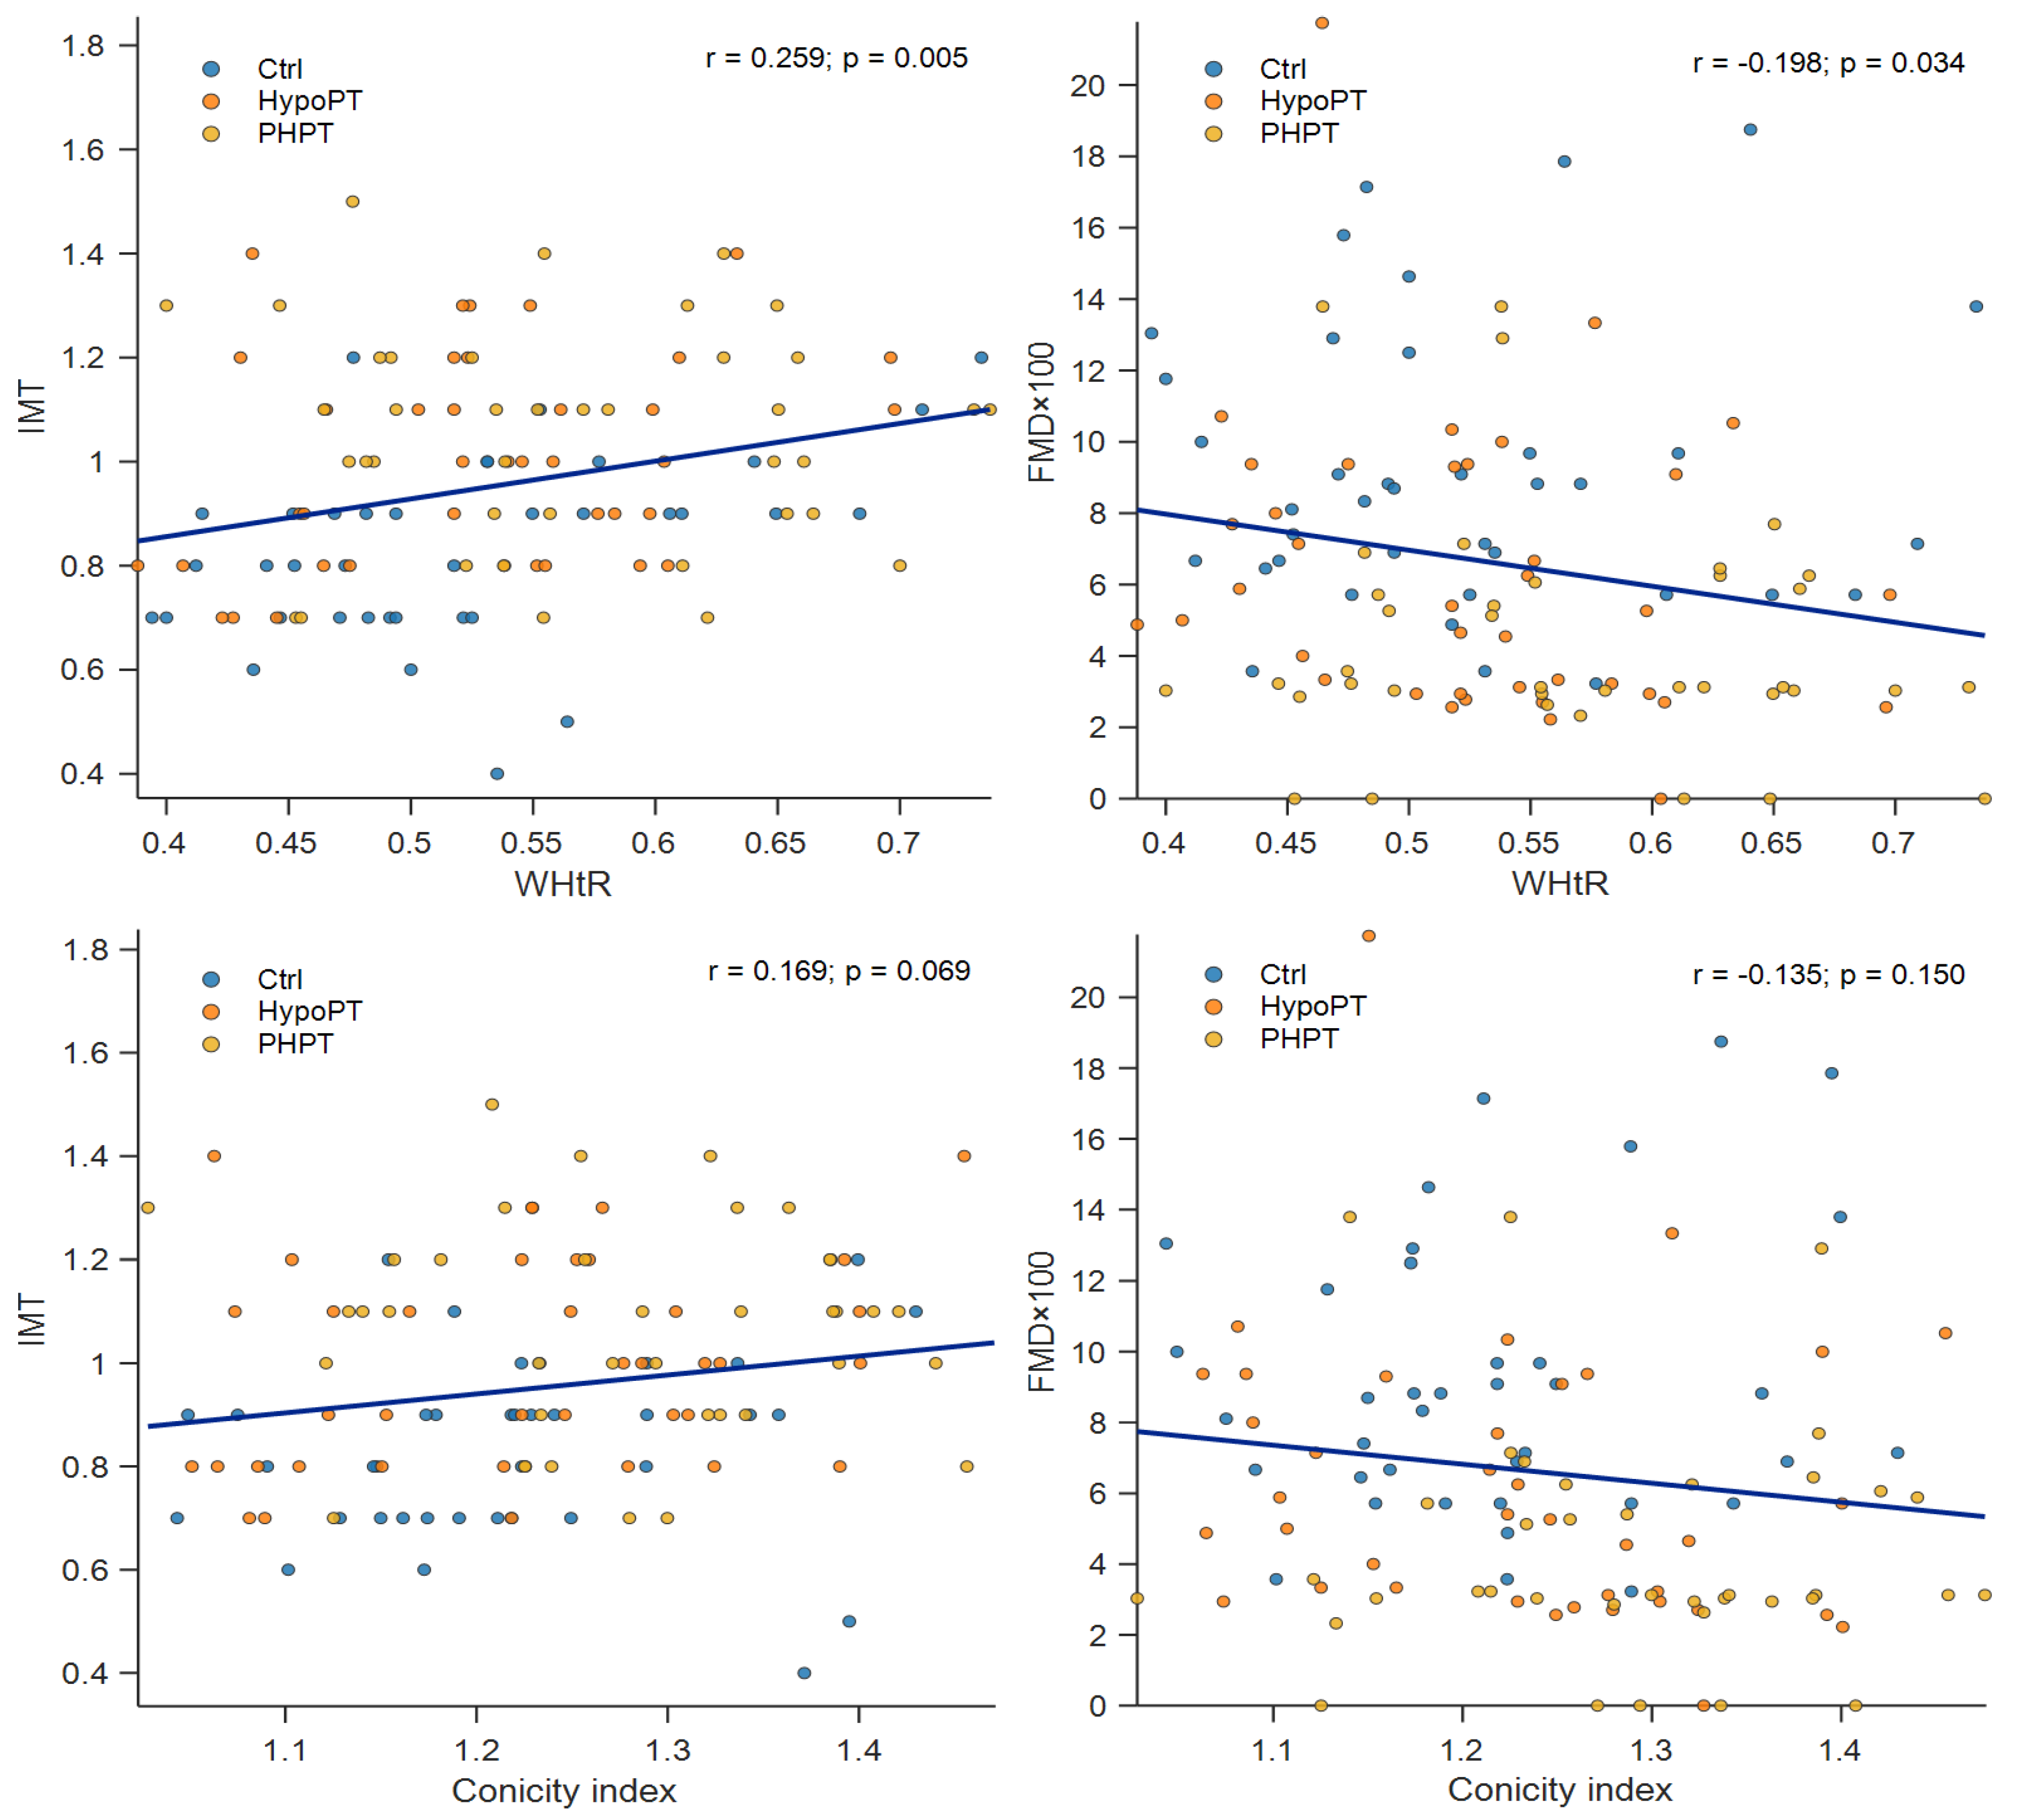
Anthropometric indices and their correlations with vascular outcomes were generally very weak to weak and differed by subgroup. In the Ctrl group, WHtR showed a weak-to-moderate positive association with IMT (r = 0.381, p = 0.018), while WC and HC displayed weak positive trends with IMT that did not reach statistical significance (WC: r = 0.300, p = 0.067; HC: r = 0.304, p = 0.063). No significant correlations with FMD×100 were observed in Ctrl. In HypoPT, WHR was moderately positively correlated with IMT (r = 0.372, p = 0.020), whereas WHtR showed a weak and non-significant association with IMT (r = 0.301, p = 0.062). Associations with FMD×100 were non-significant, although HC and WHtR showed weak inverse trends (HC: r = −0.274, p = 0.091; WHtR: r = −0.237, p = 0.146). In the PHPT group, no anthropometric index was significantly correlated with IMT or FMD×100 (all p > 0.05). The largest (non-significant) association was observed between CWrist and FMD×100 (r = −0.310, p = 0.058). Overall, subgroup-specific analyses suggest that the strength and direction of the associations between central adiposity measures and vascular outcomes may vary across groups; complete correlation coefficients are reported in
Table 3, while
Figure 2 illustrates scatterplots for WHtR and CI.
Two multivariable linear regression models were fitted to examine independent associations of anthropometric indices with IMT and FMD×100, adjusting for Group (Ctrl as reference) and other anthropometric covariates (WHtR, CI, NC, CWrist, WHR). Multicollinearity was low (all VIFs ≤ 2.29). For IMT as dependent variable the overall model was significant (F(7,108)=4.917, p<0.001) and explained 24.2% of the variance in IMT (R²=0.242; adjusted R²=0.193; RMSE=0.209; N=116). WHtR was independently associated with higher IMT (B=0.940, SE=0.423, β=0.335, p=0.028). Compared with Ctrl, both patient groups exhibited higher IMT after adjustment (HypoPT: B=0.184, SE=0.048, p<0.001; PHPT: B=0.224, SE=0.050, p<0.001). CI, NC, CWrist, and WHR were not significant predictors (all p>0.05). For FMD×100 as dependent variable, the overall model was significant (F(7,107)=4.806, p<0.001) and explained 23.9% of the variance in FMD×100 (R²=0.239; adjusted R²=0.189; RMSE=3.825; N=115). After adjustment, both groups showed lower FMD×100 than Ctrl (HypoPT: B=−2.924, SE=0.875, p=0.001; PHPT: B=−4.488, SE=0.917, p<0.001). WHtR showed a non-significant inverse association with FMD×100 (B=−13.706, SE=8.178, β=−0.269, p=0.097), while CI, NC, CWrist, and WHR were not significant (all p>0.05).
Table 4 report multivariable linear regression models.
Discussion
The current study was conducted to assess whether novel and traditional anthropometric indices distinguish PHPT and if they are correlated with markers of atherothrombotic risk. The main results could be summarized as follows: (i) indexes of central adiposity relating to body size such as WHtR and Conicity Index were significantly different between patients with PHPT and either controls or HypoPT subjects; (ii) classical anthropometric indexes, WHR, did not distinguish among groups; and (iii) WHtR and CI did not correlate with markers of vascular structure/function such as IMT/FMD.
Anthropometric indices have been widely used as surrogates for cardiometabolic risk because of the very strong association which exists between central adiposity and atherosclerosis in the general population [
35,
36]. In the control group of our study, this paradigm was evidenced by the significant positive association of WHtR with IMT that confirmed central adiposity indices as valid markers for subclinical atherosclerosis even in a healthy population. In HypoPT patients, WHR was also the only one anthropometric parameter that showed a significant correlation with IMT and hence indicating that relative fat distribution can be still related to vascular health in the absence of PTH excess. In comparison, the anthropometric profile we described in PHPT seems to associate with another pathophysiological mechanism. WHtR and CI were strikingly higher in this group, indicative that a preferential central fat accumulation existed compared to body size. These data show that PHPT is linked with a specific pattern of body fat distribution which may be the result of metabolic consequences of chronic PTH excess such as changes in insulin sensitivity, lipid metabolism and energy homeostasis [
23]. Nevertheless, the absence of association between these indices and IMT and/or FMD suggests that in this disorder central adiposity may not simply reflect the major determinant of vascular injury.
This discrepancy in the association between the anthropometric indicators and vascular measures among PHPT patients may be explained by the direct effect on vessels of PTH[
18]. It has been well established based on experimental and clinical evidence that PTH has pleiotropic effects on the vascular wall, involving endothelial dysfunction, enhanced oxidative stress, VSMC proliferation, and medial calcification [
37,
38]. These processes could in turn be involved in arterial remodeling and atherosclerotic burden, irrespective of the distribution of body fat [
37]. Thus, because vascular injury in PHPT may be primarily hormone-related rather than related to adiposity, aortic stiffness is less dependent on anthropometric measures at levels that predict cardiovascular risk in general populations.
In addition, IMT is a structural sequelae of cumulative vascular injury, whereas FMD constitutes dynamic endothelial function, which is affected by several factors including inflammation, mineral metabolism, calcium–phosphate homeostasis and nitric oxide bioavailability. In PHPT subjects, these mechanisms may take precedence over the contribution of adiposity-related systems, resulting in a lack of association between anthropometric parameters and vascular outcomes. The lack of correlation to FMD in any group and also the consistency of inverse trends within PHPT patients, thus reinforce the idea that endothelial dysfunction may result from non-anthropometric pathways in this condition.
Collectively, these results indicate that the cardiovascular relevance of anthropometric indicators is dependent on context- and disease-related factors. Although WHtR and CI are useful for early detection of modified fat distribution in PHPT patients, their efficacy might not be enough to determine the multifaceted atherothrombotic risk in this group. In contrast to the general population in which central adiposity is one of the main determinants of vascular damage, PHPT seems to be characterized by a dissociation between body fat distribution and vascular injury where PTH-related factors exhibit a precedence.
From a clinical point of view, these findings addressed the limitation to consider only anthropometric indices when assessing cardiovascular risk in diseases of endocrine organs with direct hormonal effects on the vessels. In PHPT, cardiovascular risk evaluation might be not complete without considering hormonal, inflammatory and mineral metabolism-related aspects besides classic anthropometric variables.
Several limitations should be acknowledged. Owing to the cross-sectional nature of the study, causal inferences cannot be made and sample size might hamper detection of weak associations, especially for FMD. Furthermore, analyses of visceral adiposity using direct imaging were not available. Despite this, the agreement of results across a range of anthropometric indices and vascular outcomes may lend robustness to our findings.
In conclusion, WHtR and Conicity Index may be sensitive measures of changed central adiposity in hyperparathyroid individuals but do not relate to markers of blood vessels structure and function in this disease. Dysrelation between cardiovascular risk and anthropometric indices indicates that, in PHPT, these may not be the best markers of cardiovascular risk factors as previously found in the general population; this highlights the importance to look for a disease-specific approach to assess cardiovascular risk. Further comprehensive and prospective studies with long-term follow-up are required to show the clinical reflection of the study and the correlation between biochemical and clinical parameters.
Author Contributions
Conceptualization, A.M.N., A.P. and G.T.; methodology, A.M.N., A.P. and G.T.; formal analysis, M.B.; investigation, A.M.N., E.S., A.N, F.G. L.B.M, N.N., A.P. and G.T.; data curation, E.S., M.B., A.N., L.B.M.; writing—original draft preparation, A.M.N., A.P. and G.T.; writing—review and editing, A.M.N., E.S., M.B., A.N, F.G. L.B.M, N.N., A.P. and G.T.; supervision, A.M.N and A.P.; funding acquisition, A.P. and G.T. All authors have read and agreed to the published version of the manuscript.
Funding
This research was funded by a grant from Società Italiana dell’Osteoporosi, del Metabolismo Minerale e delle Malattie dello Scheletro (SIOMMMS) – research grant for young investigators (2023-2024) to GT.
Institutional Review Board Statement
The study was conducted in accordance with the Declaration of Helsinki, and approved by the Ethics Committee of Campus Bio-Medico University (89/20 PAR ComEt CBM from 27th November 2020).
Informed Consent Statement
Informed consent was obtained from all subjects involved in the study.
Data Availability Statement
Some or all datasets generated during and/or analyzed during the current study are not publicly available but are available from the corresponding author on reasonable request.
References
- Khan AA, Guyatt G, Ali DS; et al. Management of Hypoparathyroidism. J Bone Miner Res. 2022;37(12):2663-2677. [CrossRef]
- Bilezikian JP, Khan AA, Silverberg SJ; et al. Evaluation and Management of Primary Hyperparathyroidism: Summary Statement and Guidelines from the Fifth International Workshop. J Bone Miner Res. 2022;37(11):2293-2314. [CrossRef]
- Saponaro F, Cetani F, Repaci A; et al. Clinical presentation and management of patients with primary hyperparathyroidism in Italy. J Endocrinol Invest. 2018;41(11):1339-1348. [CrossRef]
- Minisola, S., Arnold, A., Belaya, Z., Brandi, M.L., Clarke, B., Hannan, F.M., Hofbauer, L., Insogna, K., Lacroix, A., Liberman, U., Palermo, A., Pepe, J., Rizzoli, R., Wermers, R. and Thakker RV. Epidemiology, pathophysiology and genetics of primary hyperparathyroidism. J Bone Miner Res. Published online August 3, 2022. [CrossRef]
- Roumpou A, Palermo A, Tournis S; et al. Bone in Parathyroid Diseases Revisited: Evidence From Epidemiological, Surgical and New Drug Outcomes. Endocr Rev. 2025;46(4):576-620. [CrossRef]
- Cusano NE, Bilezikian JP. Update on hypoparathyroidism. Curr Opin Rheumatol.NLM (Medline). 2019;31(4):381-387. [CrossRef]
- Reid LJ, Muthukrishnan B, Patel D, Seckl JR, Gibb FW. Predictors of Nephrolithiasis, Osteoporosis, and Mortality in Primary Hyperparathyroidism. J Clin Endocrinol Metab. 2019;104(9):3692-3700. [CrossRef]
- Bollerslev J, Buch O, Cardoso LM; et al. Revised European Society of Endocrinology Clinical Practice Guideline: Treatment of Chronic Hypoparathyroidism in Adults. Eur J Endocrinol. 2025;193(5):G49-G78. [CrossRef]
- Tabacco G, Naciu AM, Maggi D; et al. Cardiovascular Autonomic Neuropathy as a New Complication of Postsurgical Chronic Hypoparathyroidism. J Bone Miner Res. 2019;34(3):475-481. [CrossRef]
- Vescini F, Attanasio R, Balestrieri A; et al. Italian association of clinical endocrinologists (AME) position statement: Drug therapy of osteoporosis. J Endocrinol Invest. 2016;39(7):807-834. [CrossRef]
- Vescini F, Borretta G, Chiodini I; et al. Italian Guidelines for the Management of Sporadic Primary Hyperparathyroidism. Endocrine, Metab Immune Disord-Drug Targets. 2023;24(8):991-1006. [CrossRef]
- Palermo A, Tabacco G, Makras P; et al. Primary hyperparathyroidism: From guidelines to outpatient clinic. Rev Endocr Metab Disord. 2024;25(5):875-896. [CrossRef]
- Pepe J, Colangelo L, Sonato C; et al. ECHOCARDIOGRAPHIC FINDINGS IN PATIENTS WITH NORMOCALCEMIC PRIMARY HYPERPARATHYROIDISM COMPARED WITH FINDINGS IN HYPERCALCEMIC PRIMARY HYPERPARATHYROID PATIENTS AND CONTROL SUBJECTS. Endocr Pract. 2020;27(1). [CrossRef]
- Pepe J, Cipriani C, Sonato C, Raimo O, Biamonte F, Minisola S. Cardiovascular manifestations of primary hyperparathyroidism: A narrative review. Eur J Endocrinol.BioScientifica Ltd. 2017;177(6):R297-R308. [CrossRef]
- Pepe J, Minisola S, Ettorre E, Desideri G, Cipriani C. Cardiovascular Involvement In Primary Hyperparathyroidism. J Clin Endocrinol Metab. Published online November 14, 2025. [CrossRef]
- Bollerslev J, Sjöstedt E, Rejnmark L. Cardiovascular consequences of parathyroid disorders in adults. Ann Endocrinol (Paris). 2021;82(3-4):151-157. [CrossRef]
- Modica R, Liccardi A, Minotta R, Benevento E, Cannavale G, Colao A. Parathyroid diseases and metabolic syndrome. J Endocrinol Invest. 2023;46(6):1065-1077. [CrossRef]
- Naciu AM, Nusca A, Palermo A; et al. Platelet Function and Markers of Atherothrombotic Risk in Individuals With Parathyroid Disorders. J Clin Endocrinol Metab. 2025;110(11):e3745-e3755. [CrossRef]
- D’Amico A, Tabacco G, Nocella C; et al. PTH-driven modulation of platelet activity via the NOX2 pathway in postsurgical hypoparathyroidism. Redox Biol. 2025;87. [CrossRef]
- Bolland MJ, Grey AB, Gamble GD, Reid IR. Association between primary hyperparathyroidism and increased body weight: A meta-analysis. J Clin Endocrinol Metab. 2005;90(3):1525-1530. [CrossRef]
- Tran H, Grange JS, Adams-Huet B; et al. The impact of obesity on the presentation of primary hyperparathyroidism. J Clin Endocrinol Metab. 2014;99(7):2359-2364. [CrossRef]
- Yuan TJ, Chen LP, Pan YL; et al. An inverted U-shaped relationship between parathyroid hormone and body weight, body mass index, body fat. Endocrine. 2021;72(3):844-851. [CrossRef]
- Zhang Y, Yang M, Wu Y, Wang Q. Characteristics of lipid metabolism and fat distribution in patients with primary hyperparathyroidism and their Mendelian randomization study. Endocrine. Published online 2024. [CrossRef]
- Bots ML, Hoes AW, Koudstaal PJ, Hofman A, Grobbee DE. Common carotid intima-media thickness and risk of stroke and myocardial infarction: The Rotterdam Study. Circulation. 1997;96(5):1432-1437. [CrossRef]
- O’Leary DH, Polak JF, Kronmal RA, Manolio TA, Burke GL, Wolfson SK. Carotid-Artery Intima and Media Thickness as a Risk Factor for Myocardial Infarction and Stroke in Older Adults. N Engl J Med. 1999;340(1):14-22. [CrossRef]
- Thijssen DHJ, Bruno RM, Van Mil ACCM; et al. Expert consensus and evidence-based recommendations for the assessment of flow-mediated dilation in humans. Eur Heart J. 2019;40(30):2534-2547. [CrossRef]
- MD J, DH R, CM A; et al. Reprint: 2013 AHA/ACC/TOS Guideline for the Management of Overweight and Obesity in Adults. J Am Pharm Assoc (2003). 2013;129(25 Suppl 2):e3. [CrossRef]
- Jayawardena R, Ranasinghe P, Ranathunga T, Mathangasinghe Y, Wasalathanththri S, Hills AP. Novel anthropometric parameters to define obesity and obesity-related disease in adults: A systematic review. Nutr Rev. 2020;78(6):498-513. [CrossRef]
- Visseren F, Mach F, Smulders YM; et al. 2021 ESC Guidelines on cardiovascular disease prevention in clinical practice. Eur Heart J. 2021;42(34):3227-3337. [CrossRef]
- Lear SA, James PT, Ko GT, Kumanyika S. Appropriateness of waist circumference and waist-to-hip ratio cutoffs for different ethnic groups. Eur J Clin Nutr. 2010;64(1):42-61. [CrossRef]
- Feng Q, Bešević J, Conroy M; et al. Waist-to-height ratio and body fat percentage as risk factors for ischemic cardiovascular disease: A prospective cohort study from UK Biobank. Am J Clin Nutr. 2024;119(6):1386. [CrossRef]
- Costo-Muriel C, Calderón-García JF, Rico-Martín S; et al. Relationship between the novel and traditional anthropometric indices and subclinical atherosclerosis evaluated by carotid intima-media thickness (c-IMT). Front Nutr. 2023;10:1170450. [CrossRef]
- Lumachi F, Ermani M, Frego M; et al. Intima-media Thickness Measurement of the Carotid Artery in Patients with Primary Hyperparathyroidism. A Prospective Case-control Study and Long-term Follow-up. In Vivo (Brooklyn). 2006;20(6B):887-890. Accessed January 21, 2024. https://iv.iiarjournals.org/content/20/6B/887.
- Papageorgiou SN. On correlation coefficients and their interpretation. J Orthod. 2022;49(3):359-361. [CrossRef]
- Mansoori A, Allahyari M, Mirvahabi MS; et al. Predictive properties of novel anthropometric and biochemical indexes for prediction of cardiovascular risk. Diabetol Metab Syndr. 2024;16(1). [CrossRef]
- Reyes JL, Decker JJ, Parikh R; et al. Greater Central Adiposity Is Associated With Poorer Left Atrial Function: The Atherosclerosis Risk in Communities (ARIC) Study. Mayo Clin Proc Innov Qual Outcomes. 2025;9(3). [CrossRef]
- Rashid G, Bernheim J, Green J, Benchetrit S. Parathyroid hormone stimulates endothelial expression of atherosclerotic parameters through protein kinase pathways. Am J Physiol Renal Physiol. 2007;292(4). [CrossRef]
- Meena D, Prakash M, Gupta Y, Bhadada S, Khandelwal N. Carotid, aorta and renal arteries intima-media thickness in patients with sporadic idiopathic hypoparathyroidism. Indian J Endocrinol Metab. 2015;19(2):262-266. [CrossRef]
|
Disclaimer/Publisher’s Note: The statements, opinions and data contained in all publications are solely those of the individual author(s) and contributor(s) and not of MDPI and/or the editor(s). MDPI and/or the editor(s) disclaim responsibility for any injury to people or property resulting from any ideas, methods, instructions or products referred to in the content. |
© 2026 by the authors. Licensee MDPI, Basel, Switzerland. This article is an open access article distributed under the terms and conditions of the Creative Commons Attribution (CC BY) license (http://creativecommons.org/licenses/by/4.0/).