
Submitted:
06 November 2023
Posted:
07 November 2023
You are already at the latest version
Abstract
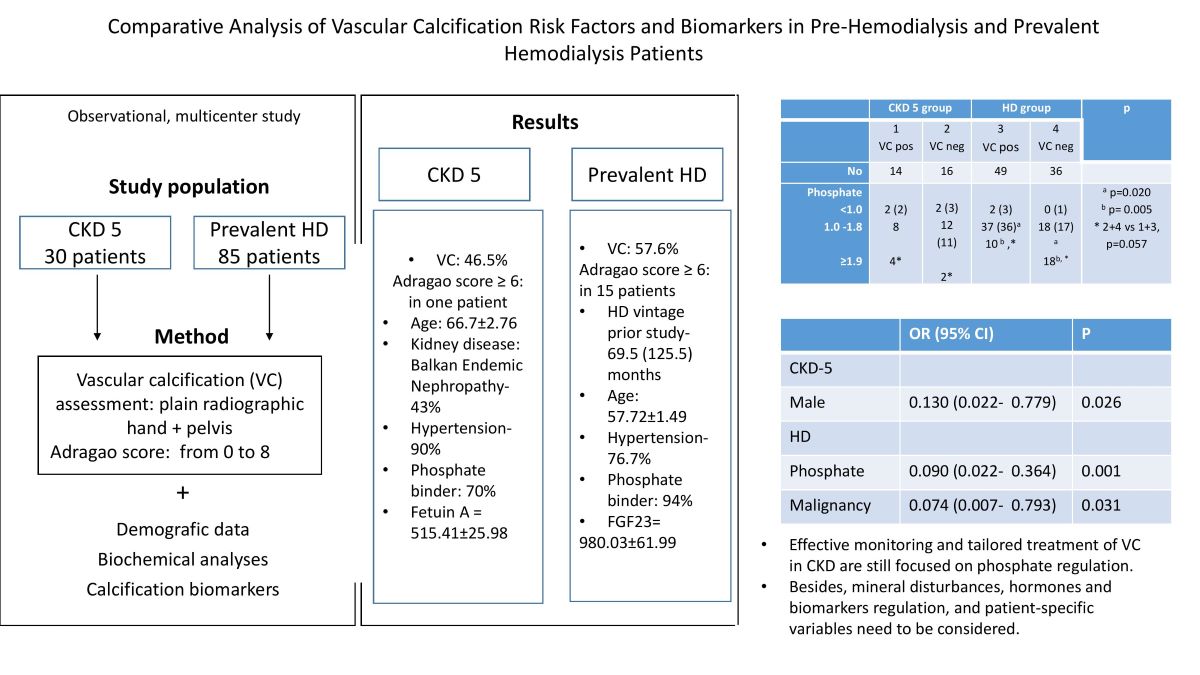
Introduction. This retrospective study aimed to compare the risk factors for vascular calcification (VC) between pre-hemodialysis (HD) and prevalent HD adult patients while investigating associations with calcification biomarkers.
Methods. Baseline data from 30 pre-HD and 85 HD patients were analyzed, including iPTH, vitamin D, FGF23, fetuinA, sclerostin, and VC scores (Adragao method). Multivariable linear regression identified VC predictors.
Results: The prevalence of VC was similar in both groups, but HD patients had more pronounced VC scores ≥6. Pre-HD patients were older, with higher prevalence of Balkan endemic nephropathy, hypertension, and less frequent use of calcium phosphate binders. Both groups exhibited similar patterns of hyperphosphatemia, low vitamin D, and iPTH levels. In HD group normal phosphate was significantly common in patients with VC, whereas hyperphosphatemia was significantly common in patients without VC. Fetuin-A levels were higher in pre-HD patients, while FGF23 was elevated in HD patients. In pre-HD patients, male gender was associated with reduced VC risk, while in HD patients, malignancies and serum phosphate levels were negative VC predictors.
Conclusion: Effective monitoring and tailored treatment of VC in CKD are still focused on phosphate regulation. Besides, mineral disturbances, hormones and biomarkers regulation, and patient-specific variables need to be considered.
Keywords:
chronic kidney disease patients 1
; vascular calcifications 2
; risk factors 3
1. Introduction
Vascular calcification (VC) stands as a hallmark complication of chronic kidney disease (CKD), with its prevalence increasing across CKD stages, culminating in its highest incidence in end-stage kidney disease (ESKD) patients [1]. Evidence suggests that CKD patients showing VC from stage 3 to the beginning of dialysis treatment have more rapid progression of calcification during dialysis [2,3].
There is growing evidence that patients with CKD are prone to VC due to disturbed homeostatic mechanisms. Existing literature highlights the interplay of various risk factors, encompassing traditional elements such as age, hypertension, and diabetes, along with emerging contributors like oxidative stress, mineral metabolism disturbances, and renal bone disease [4]. Additionally, imbalances in circulating biomarkers including parathyroid hormone (PTH), fibroblast growth factor 23 (FGF23), fetuin-A, and sclerostin that promotes or inhibits VC processes have emerged as potential markers of VC susceptibility of CKD patients [3,4,5].
Emerging insights highlight the active role of vascular smooth muscle cells (VSMCs) transitioning into osteoblast-like cells in VC pathogenesis [6]. However, the molecular underpinnings, especially the interplay of calcification promoters and inhibitors, remain inconsistent and remain an evolving area of research [4,7].
Several factors motivated the examination of VC in our clinical context. The rising number of CKD patients, coupled with the compromised outcomes they face, underscores the significance of identifying modifiable risk factors for VC in CKD stage 5 individuals not yet undergoing dialysis. Furthermore, it’s vital to note that VC treatment primarily relies on controlling various risk factors, emphasizing the ongoing need to discover new therapeutic targets to mitigate the adverse consequences of VC. This cross- sectional study was undertaken with the aim to compare clinical and biochemical profile between two groups of patients with VC: the pre-hemodialysis (pre-HD) and prevalent HD patients.
2. Materials and Methods
2.1. Patients
This cross-sectional, observational study involved 30 pre-hemodialysis adult patients (pre-HD group) and 85 adults on hemodialysis (HD group) selected from the pool of patients monitored in outpatient departments or treated by chronic HD in three nephrology departments presented in flow chart (Figure 1).
Patients were enrolled if they: 1) had eGFR<15 ml/min/1.73m2 and were regularly controlled by a nephrologist in the above-mentioned departments (pre-HD group) or had been on hemodialysis for at least 6 months (HD group); 2) agreed to participate in the study, which was approved by the institutional review board; 3) did not have acute cardiovascular complications during the 6 months preceding entry into the study; 4) had no hemodynamically significant lower extremity artery occlusive disease; 5) did not have uncontrolled blood pressure.
The participants were monitored from October 2015 until death or the end of the study in February 2020. The local Ethics Committee evaluated and approved the study protocol (decision No 1690/21, June 9, 2015) and all patients provided written informed consent.
Standard bicarbonate hemodialysis sessions lasted 12 hours weekly. Dialysate calcium (dCa) was individualized to meet the specific requirements of each patient by optimizing treatment in order to achieve the target values of serum calcium, phosphate, PTH and alkaline phosphatase levels recommended by the KDIGO guideline [8]. Calcium based phosphate binders, alphacalcidol or calcitriol were mostly used in studied patients. Variables of interest taken from the patients’ records were: demographic (age, gender), underlying kidney disease, dialysis duration, systolic and diastolic blood pressures, previous history of cerebrovascular and cardiovascular diseases (coronary artery disease, congestive heart failure, peripheral vascular disease), parathyroidectomy, medications (antihypertensives, intestinal phosphate binders, vitamin D, erythropoietin stimulating agents-ESA).
2.2. Biochemical analyses
The routine biochemical analyses and VC biomarkers were done using standard techniques in the same laboratory. Routine laboratory analyses were performed before middle week HD in the HD patients or at regular controls in the outpatient department in the pre-HD patients. Also, serum samples for biomarkers were frozen at -80 degrees until analysis which was done altogether at the same time. Laboratory analyses included measurement of serum urea, creatinine, uric acid, total protein, C-reactive protein (CRP), lipid profile, phosphate, calcium corrected for albumin, alkaline phosphatase, hematological parameters, iron status, and iPTH. Mean standard weekly Kt/V and urea reduction ratio (URR) were calculated for the HD group. We also measured serum levels of 25-vitamin D, FGF23, fetuin A and sclerostin. An immunoradiometric assay was used to measure iPTH (enzyme-linked immunosorbent assay -ELISA-PTH, CIS bio International) and normal values are 11-62 pg/mL. A commercial chemiluminescent immunoassay (DiaSorin S.p.A., Italy) was used to determine serum 25 OH vitamin D and measuring range is 7.6-147.8 ng/mL. Serum levels of sclerostin, FGF23 and fetuin A were determined in duplicate by using commercial available ELISA kits (Elabscience, and Cusabio, USA). The detection assay range for sclerostin, FGF 23 and Fetuin A were 62.4-4000 pg/mL, 3.12-200 pg/mL, and 9.375-600 ng/mL, respectively, with reported intra-assay precision of <10%.
2.3. Calcification assessment
Vascular calcification in the iliac, femoral, radial and digital arteries in plain radiographic films of the pelvis and hands were evaluated by one person. A simple VC score was calculated as described by Adragao et al. [9]. Although there are more sophisticated methods for VC assessment, and being aware that determining the Adragao score is a less sensitive measure, for practical reasons we decided to use that method. The presence of linear calcifications in each section is counted as 1 and its absence as 0. The final score is the sum of all the sections, ranging from 0 to 8.
2.4. Brachial blood pressure
Brachial blood pressure (BP) was measured in all patients in the non-fistula arm. Blood pressure was measured three times at 1-minute intervals according to the European Society of Hypertension / Cardiology guidelines [10]. BP was measured during hemodialysis every hour from the beginning of hemodialysis, and the value for statistical processing was expressed as the mean value of systolic and diastolic blood pressure. In the group of pre-HD patients, blood pressure was measured in the outpatients Department and expressed as the mean value of systolic and diastolic BP calculated from measured BP values during the last six months of control. Patients with BP≥140/90 are classified as having high blood pressure (counted as 1) and when the BP was below these values it was marked with 0.
2.5. Statistical analysis
Statistical analysis was performed with SPSS 21.0 (SPSS, Inc, Chicago, IL, USA). Continuous variables are presented as means with standard errors (SE) for normally distributed variables and as median (inter-quartile range, IQR) for non-normally distributed variables. Categorical variables are presented as frequencies. Chi-square tests and Kruskal–Wallis one-way analysis were used to examine differences in various baseline variables between the groups of patients. Multivariable logistic regression model including all significantly different characteristics in the univariate logistic regression models (at a significance level of 0.05) as well as those predictors that are known to affect the dependent variable mentioned in the section Method i.e. demografic data, standard laboratory analyses, FGF23, iPTH, vitamin D, fetuin A and sclerostin, and VC score, was used to determine the independent association with VC score as the dependent variable. Two-sided p-values <0.05 were considered significant.
3. Results
3.1. Study population
Baseline characteristics for both studied groups are shown in Table 1. Comparatively, pre-HD patients were older, with a higher prevalence of hypertension, while HD patients were more inclined to receive calcium-based phosphate-lowering treatment. The primary causes of ESKD were comparable between the groups, with the exception of Balkan endemic nephropathy (BEN), which was significantly more prevalent in the pre-HD group. These patients with BEN were also the oldest in the pre-HD group, although this specific data is not presented here. The median HD vintage prior to inclusion in this study was 69.5 (125.5) months. Subtotal parathyroidectomy had been performed in 11 HD patients before their enrollment.
Among the 115 subjects under study, VC was detected in 46.6% of pre-HD patients and 57.6% of HD patients. Specifically, an Adragao score ≥ 3 was recorded in 36.6% of pre-HD patients and 36.5% of HD patients. Further analysis revealed a marked VC score ≥ 6 in one patient within the pre-HD group and 15 HD patients, representing a statistically significant difference (p = 0.030). Additionally, the highest Adragao score of 8 was observed in six HD patients and was not observed within the pre-HD patient group (Table 1).
3.2. Laboratory analyses
Table 2 presents the basal laboratory analyses. In comparison to the pre-HD group, the HD group exhibited significantly higher serum concentrations of creatinine, potassium, and ferritin, while serum sodium was significantly lower.
Mean serum levels of calcium, phosphate, intact parathormone (iPTH), and vitamin D fell within the normal range for all patients. Individual value revealed that two HD patients had mild hypercalcemia at 2.7 mmol/L. Also, out of normal range phosphatemia (1.0-1.8 mmol/l) was observed in 33.3% of the pre-HD group and 35.3% of HD patients. Furthermore, 50% of pre-HD patients and 56.5% of those in the HD group had iPTH values below 100 pg/ml. Vitamin D concentration below the lower limit of the reference range was found in 64% of pre-HD patients and 53.6% of those in the HD group. In terms of circulating biomarkers, serum levels of FGF23 were notably lower (p < 0.001) in the pre-HD group, while fetuin A concentrations were significantly higher (p < 0.001) in comparison to HD group.
Table 3 presents a comprehensive comparison of clinical and biochemical characteristics within and between groups, with and without VC.
Among pre-HD patients, those with VC were notably older, and a higher proportion were males. In both HD patient subgroups, there was more frequent use of phosphate binders compared to pre-HD patients. HD patients without VC had the highest mean phosphate values. Moreover, patients without VC in both groups more often exhibited hyperphosphatemia (>1.9 mmol/l) than those without VC, with the difference approaching significance (p=0.057). Furthermore, within the HD group, a significant difference was observed in phosphate distribution; more patients with VC had normal phosphate levels (p=0.02), while more patients without VC had higher phosphate levels (p=0.005). Regardless of the presence or absence of VC, HD patients displayed higher FGF23 levels and lower fetuin-A concentrations compared to their pre-HD counterparts.
3.3. Predictors of vascular calcification in studied groups
Table 4 provides the predictors of VC across the patient groups. In the univariate linear regression analysis, leukocyte count, hemoglobin, iron saturation, serum phosphate, calcium, male gender, and a history of cardiovascular diseases and malignancy exhibited associations with VC.
The multivariate linear regression analysis highlighted serum phosphate as the primary predictor of VC for the entire patient group, with negative association. In the pre-HD patient group, patient gender, specifically male, emerged as a significant predictor. In the HD patient group, the presence of malignancies and serum phosphate were identified as significant predictors, both showing a negative association with VC.
4. Discussion
The prevalence of VC among patients with CKD has long been recognized as a complex and concerning phenomenon. The present study sought to shed light on the intricate relation of VC in both pre-HD and prevalent HD patients, uncovering potential risk factors and markers associated with its presence. The key findings are as follows: 1) VC is present in substantial of the examined patients in both groups; 2) while the prevalence of VC remained comparable, the severity of VC differed notably, with the HD group displaying a more prominent VC score ≥ 6; 3) the statistical analysis identified male gender, the presence of malignancy, and serum phosphate as predictive factors for VC; 4) circulating biomarkers: FGF23, sclerostin and fetuin-A did not recognized as predictors of VC.
Our findings are in agreement with previous research showing a significant prevalence of VC in the pre-HD and HD groups. While the prevalence of VC remained comparable between the groups i.e. 46.6% of pre-HD patients and 57.6% of HD patients, it noteworthy divergence emerged in the severity of VC. The HD group exhibited a more pronounced VC score of ≥ 6. Prior research has shown that rates of VC measured by the Adragao score, remain similar among advanced CKD patients, reaching up to 57% in CKD stages 4-5. However, the prevalence increases to as high as 75% among dialysis patients. [9,11,12]. Recent research has shown that dialysis not only contributes to the progression of VC but also triggers its onset [13].
Different factors associated with VC in our studied groups are revealed. In the pre-HD group higher prevalence of VC was found in men, which is consistent with some research in CKD patients [14]. According to previous published data, potential contributors to the observed gender-related differences involving hormonal, lifestyle, genetic, disease duration factors, pericardial/total fat, lipid profile, inflammatory status, variations in MGP, soluble Klotho, vitamin D, sclerostin, PTH, FGF-23, and osteoprotegerin levels [14]. Furthermore, while the underlying kidney disease appears to be similar between the groups, the prevalence of BEN is significantly higher in the pre-HD group. Although the exact mechanism is unknown, some literature suggests that BEN is associated with lower VC compared to other causes of ESRD due to better serum phosphorus levels [15], implying that there may be underlying factors or protective mechanisms associated with this specific condition that affects phosphate metabolism. Considering circulating biomarkers, Fetuin A as a calcification inhibitor was higher and FGF 23 involved in phosphate homeostasis was lower compared to the HD group of patients, and both may have protective effects against VC development. On the other hand, 70% of patients from that group received calcium-containing phosphate binders, sometimes in combination with vitamin D preparations. This practice, while intended to manage phosphate levels, seemed to override the protective effects of the aforementioned factors.
Serum phosphate level was independently associated with VC in the whole group and in HD patients and was the only variable that could be affected. Our analysis showed that when serum phosphate decreases by one unit, the risk for VC in HD group increases by 2.4 times, after taking into account the effects of other variables included in the analysis. Contrary to these results, majority of published studies have highlighted the positive relationship between elevated even normal serum phosphates and VC in advanced CKD and dialysis patients [16,17,18,19,20]. Our finding raises several potential explanations and likely involves a combination of factors, including effective phosphate control, along with other factors that may alter phosphate control in CKD patients such as iPTH levels, changes in bone turnover, medications management, and circulating calcification inhibitors which.
To comply with the KDIGO recommendation to control phosphate within a target range to minimize complications such as VC and bone disease [8], we prescribed regular hemodialysis (HD) to our studied patients, a restrictive phosphate diet, and 94.2% of HD patients took calcium-based phosphate binders, either alone or in combination with vitamin D. Thus, most of the patients studied had normal phosphate levels [21], four had levels below the lower limit, and 28 had hyperphosphatemia. At least two scenarios could contribute to the unexpected inverse relationship between phosphate levels and VC. Our cross-sectional study design was based on one-month measurements of serum phosphate concentration that could provide a misleading representation of phosphate control. Consequently, normal phosphate levels were significantly more common in patients with VC, whereas hyperphosphatemia was significantly more common in HD patients without VC.
For controlling phosphate in CKD and dialysis patients managing calcium, vitamin D, PTH levels are also important. Among the examined patients, iPTH above 500 pg/ml had 6.6% from the pre-HD and 15% from the HD group, while iPTH below 100 ml had 36.6% from pre-HD and 42% from HD group. It could be assumed that the latter group had low turnover bone disease often characterized by adynamic bone properties [22]. Association between adynamic bone disease and VC development in CKD, and dialysis patients are well documented [23]. The high prevalence of adynamic bone disease in both groups could be the consequence of parathyroidectomy and/ or frequent use of vitamin D and calcium-based phosphate binders, which are mostly used in our country in patients before dialysis initiation. Furthermore, one third of our patients had been treated with calcitriol, so the influence of this on iPTH and VC cannot be neglected.
The protective effect of malignancy against VC observed in the HD patient group is an intriguing finding that requires further exploration, as it may involve complex interactions between malignancy-related inflammatory responses, vascular remodeling, and treatment effects [24].
While our study did not establish an independent relationship between circulating FGF23, sclerostin, and fetuin-A levels and VC in the studied patients, notable differences in their concentrations between the groups were observed. FGF-23 is a hormone primarily produced by osteocytes in bone and exerts inhibitive effects on 1,25(OH) 2 D and PTH production, and plays a crucial role in regulating phosphate by suppressing intestinal phosphate absorption, and suppressing phosphate reabsorption in the proximal tubules. In CKD, FGF23 levels increase as a compensatory response to the impaired kidney’s reduced ability to excrete phosphate. However, persistently high levels of FGF23 can lead to mineral imbalances and bone abnormalities, contributing to mineral bone disease [25]. Inconsistent results on the association of elevated FGF23 and VC in CKD were published, either positive [26,27,28] or no association [29].
One potent VC inhibitor is fetuin-A, recognized for its ability to curtail ectopic calcification in CKD and end-stage kidney disease (ESKD) patients. By preventing calcium-phosphate precipitation, fetuin-A safeguards human vascular smooth muscle cells from damage [31]. The progressive decrease of serum fetuin- A from CKD Stage 2 to Stage 5 reaching their nadir in dialysis patients was reported in the literature [32]. While many studies demonstrate a link between perpetually low serum fetuin-A levels and augmented arterial and valvular calcification scores in CKD and ESRD patients [32], discrepancies also exist within the literature [33]). Our findings, which indicate significantly lower fetuin-A concentrations in the HD group compared to the pre-HD group, align with previous studies. However, the association of fetuin-A with already formed VC remains a subject of debate.
No significant difference for serum sclerostin concentration between the HD and pre-HD groups was detected in our study. The values obtained were within laboratory limits for the ELISA used in the present study. Sclerostin, a glycoprotein synthesized by osteocytes, works mainly by inhibiting the canonical Wnt-ß catenin pathway with potential to attenuate bone formation and mineralization. There is increasing evidence supporting extraskeletal functions of sclerostin, pointing to its role in various vascular disorders. However, the mechanism by which sclerostin can influence the calcification process is controversial. Namely, some authors found positive [34] but other negative associations between sclerostin and VC [35]. In addition, recent analysis has shown that increased circulating sclerostin levels seem to reflect slower bone turnover with lower iPTH, while low plasma levels of sclerostin are associated with vitamin D deficiency and adequate phosphate control in HD patients [36].
Our study shed light on the intricate mechanism of VC among pre-HD and HD patients involving not only the control of serum phosphate but also disorders that are potentially involved in the formation of VC, affecting phosphate. However, the specific role of each player is difficult to assess. It is important to acknowledge several limitations that warrant consideration when interpreting presented results. Our study was constrained by its retrospective nature, with limitations in data collection and potential biases. The cross-sectional design of the study restricted our ability to establish temporal relationships between variables and to better elucidate the dynamic interactions between risk factors, biomarkers, and the development of VC over time. The relatively modest sample size of our study limits the generalizability of our findings. While the present study identified associations and predictors of VC, it does not establish causation.
5. Conclusions
Our study emphasizes the central role of phosphate regulation in VC monitoring for individuals with CKD. However, mineral imbalances, hormonal regulation, and patient-specific factors should be taken into account. Implementing tailored approaches, with a particular emphasis on phosphate control, promise better outcomes and fewer VC-related complications. The complex interplay of multiple factors may contribute to VC, and further studies are needed to elucidate the underlying pathways.
Author Contributions
Conceptualization, VL, MP, VB, MB.; Methodology, VL, SS, NL; Validation, DS.; Formal Analysis, DS.; Investigation, VL, MP, VB, MB.; Resources, SS, MP, VB, MB, IM, NP.; Writing – Original Draft Preparation, VL.; Writing – Review & Editing, VL, MB.; Visualization, VL.; Supervision, VL.; All authors have read and approved the final article.
Funding
The Society of Nephrology of the Republic of Serbia provided financial support for the laboratory analyses.
Informed Consent Statement
Written informed consent has been obtained from the patient(s) to publish this paper.
Data Availability Statement
All data generated or analyzed during this study are included in this article. Further inquiries can be directed to the corresponding author.
Acknowledgments
This work was conducted as a part of project No 175089 funded by the Ministry of Science, Education and Technological Development, Belgrade, Republic of Serbia.
Conflicts of Interest
The authors report there are no competing interests to declare.
References
- Budoff MJ, Rader DJ, Reilly MP, et al; CRIC Study Investigators. Relationship of estimated GFR and coronary artery calcification in the CRIC (Chronic Renal Insufficiency Cohort) Study. Am J Kidney Dis. 2011;58(4):519-26. PMID: 21783289; PMCID: PMC3183168. [CrossRef]
- Kestenbaum BR, Adeney KL, de Boer IH, Ix JH, Shlipak MG, Siscovick DS. Incidence and progression of coronary calcification in chronic kidney disease: The Multi-Ethnic Study of Atherosclerosis. Kidney Int 2009;76(9): 991-8. Epub 2009 Aug 19. PMID: 19692998; PMCID: PMC3039603. [CrossRef]
- Schlieper G, Schurgers L, Brandenburg V, Reutlings - Perger C, Floege J. Vascular calcification in chronic kidney disease: an update. Nephrol Dial Transplant 2016; 31: 31–9. Epub 2015 Apr 26. PMID: 25916871. [CrossRef]
- Gungor O, Kocyigit I, Yilmaz MI, Sezer S. Role of vascular calcification inhibitors in preventing vascular dysfunction and mortality in hemodialysis patients. Semin Dial. 2018;31(1):72-81. Epub 2017 Jun 13. PMID: 28608927. [CrossRef]
- Wolf M. Update on fibroblast growth factor 23 in chronic kidney disease. Kidney Int 2012; 82: 737–47, Epub 2012 May 23. PMID: 22622492; PMCID: PMC3434320. [CrossRef]
- London GM, Marchais SJ, Guérin AP, Métivier F. Arteriosclerosis, vascular calcifications and cardiovascular disease in uremia. Curr Opin Nephrol Hypertens. 2005; 14(6):525-31. PMID: 16205470. [CrossRef]
- Kakani E, Elyamny M, Ayach T, El-Husseini A. Pathogenesis and management of vascular calcification in CKD and dialysis patients. Semin Dial. 2019;32(6):553-561. Epub 2019 Aug 29. PMID: 31464003. [CrossRef]
- Ketteler M, Block GA, Evenepoel P, et al. Executive summary of the 2017 KDIGO chronic kidney disease-mineral and bone disorder (CKD-MBD) guideline update: what’s changed and why it matters. Kidney Int. 2017;92:26–36. [CrossRef]
- Adragao T, Pires A, Lucas C, et al. A simple vascularcalcification score predicts cardiovascular risk in haemodialysis patients. Nephrol Dial Transpl 2004;19:1480–1488. Epub 2004 Mar 19. PMID: 15034154. [CrossRef]
- Mancia G, Fagard R, Narkiewicz K, et al. 2013 ESH/ESC Guidelines for the management of arterial hypertension: The Task Force for the management of arterial hypertension of the European Society of Hypertension (ESH) and of the European Society of Cardiology (ESC). Eur Heart J 2013;34(28):2159-2219. Epub 2013 Jun 14. PMID: 23771844. [CrossRef]
- Gorriz JL, Molina P, Cerveron MJ, et al. Vascular calcification in patients with nondialysis CKD over 3 years. Clin J Am SocNephrol 2015;10: 654-666. [CrossRef]
- Damjanovic T, Djuric Z, Markovic N, Dimkovic S, Radojicic Z, Dimkovic N. Screening of vascular calcifications in patients with end-stage renal diseases. Gen. Physiol. Biophys 2009;28: 277–283.
- Zhang H, Li G, Yu X, et al; China Dialysis Calcification Study Group. Progression of Vascular Calcification and Clinical Outcomes in Patients Receiving Maintenance Dialysis. JAMA Netw Open. 2023;6(5):e2310909. PMID: 37126347; PMCID: PMC10152309. [CrossRef]
- Wu PY, Lee SY, Chang KV, Chao CT, Huang JW. Gender-Related Differences in Chronic Kidney Disease-Associated Vascular Calcification Risk and Potential Risk Mediators: A Scoping Review. Healthcare (Basel) 2021; 9(8):979. PMID: 34442116; PMCID: PMC8394860. [CrossRef]
- Petkovic N, Ristic S, Marinkovic J, Maric R, Kovacevic M, DjukanovicLj. Differences in risk factors and prevalence of vascular calcification between pre-dialysis and hemodialysis Balkan nephropathy patients. Medicina 2018;54: 4;. [CrossRef]
- Goodman WG, Goldin J, Kuizon BD, et al. Coronary artery calcification in young adults with end-stage renal disease who are undergoing dialysis. N Engl J Med 2000; 342: 1478–83. PMID: 10816185. [CrossRef]
- Lezaic V, Tirmenstajn-Jankovic B, Bukvic D, et al. Efficacy of hyperphosphatemia control in the progression of chronic renal failure and the prevalence of cardiovascular calcification. Clin Nephrol. 2009;71(1):21-9. PMID: 19203546. [CrossRef]
- Kendrick J, Kestenbaum B, Chonchol M. Phosphate and cardiovascular disease. Adv Chronic Kidney Dis. 2011;18(2):113–9. [CrossRef]
- Neven E, D’Haese PC. Vascular calcification in chronic renal failure. Circulation Res. 2011;108:249–64. [CrossRef]
- Xiong L, Chen QQ, Cheng Y, et al. The relationship between coronary artery calcification and bone metabolic markers in maintenance hemodialysis patients. BMC Nephrol. 2023;24(1):238. PMID: 37582785; PMCID: PMC10428586. [CrossRef]
- NKF-KDOQI Guidelines. Available from: http://www.kidney. org/professionals/KDOQI/guideline up HD PD VA/index.htm [accessed 21.05.2023].
- Cannata-Andia JB, Rodriguez GM, Gomez AC. Osteoporosis and adynamic bone in chronic kidney disease. J Nephrol 2013;26:73-80. PMID: 23023723. [CrossRef]
- Adragao T, Ferreira A, Frazao JM, et al. Higher mineralized bone volume is associated with a lower plain X-Ray vascular calcification score in hemodialysis patients. PLoS One 2017;12:e0179868. PMID: 28686736; PMCID: PMC5501435. [CrossRef]
- Liu X, Chen D, Chen Z, et al. Relationship between vascular calcification and bone mineral density in the elderly: a systematic review and meta-analysis.” Aging Clin Exp Res. 2020;32(10):1931-1940.
- Isakova T, Xie H, Yang W, et al. Fibroblast growth factor 23 and risks of mortality and end-stage renal disease in patients with chronic kidney disease. JAMA. 2011;305(23):2432-2439. [CrossRef]
- Nasrallah MM, El-Shehaby AR, Salem MM, et al. Fibroblast growth factor-23 (FGF-23) is indepenently correlated to aortic calcification in haemodialysis patients. Nephrol. Dial. Transplant 2010; 25: 2679–2685. Epub 2010 Feb 22. PMID: 20176609. [CrossRef]
- Desjardins L, Liabeuf S, Renard C, et al; European Uremic Toxin (EUTox) Work Group. FGF23 is independently associated with vascular calcification but not bone mineral density in patients at various CKD stages. Osteoporos Int 2012;23: 2017–25. Epub 2011 Nov 23. PMID: 22109743s. 2020;32(10):1931-1940. [CrossRef]
- Baralić M, Brković V, Stojanov V, et al. Dual Roles of the Mineral Metabolism Disorders Biomarkers in Prevalent Hemodilysis Patients: In Renal Bone Disease and in Vascular Calcification. J Med Biochem 2019;38(2):134-144. PMID: 30867641; PMCID: PMC6411002. [CrossRef]
- Scialla JJ, Lau WL, Reilly MP, et al; Chronic Renal Insufficiency Cohort Study Investigators. Fibroblast growth factor 23 is not associated with and does not induce arterial calcification. Kidney Int 2013;83: 1159–68. Epub 2013 Feb 6. PMID: 23389416; PMCID: PMC3672330. [CrossRef]
- Akbari M, Nayeri H, Nasri H. Association of fetuin-A with kidney disease; a review on current concepts and new data. J Nephropharmacol 2019; 8(2): e14. [CrossRef]
- Ketteler M, Bongartz P, Westenfeld R, et al. Association of low fetuin-A (AHSG) concentrations in serum with cardiovascular mortality in patients on dialysis: a cross-sectional study. Lancet 2003;361:827–33. [CrossRef]
- Ulutas O, Taskapan MC, Dogan A, Baysal T, Taskapan H. Vascular calcification is not related to serum fetuin-A and osteopontin levels in hemodialysis patients. Int Urol Nephrol 2018;50(1):137-142. Epub 2017 Nov 13. PMID: 29134617. [CrossRef]
- Qureshi AR, Olauson H, Witasp A, et al. Increased circulating sclerostin levels in end-stage renal disease predict biopsy-verified vascular medial calcification and coronary artery calcification. Kidney Int 2015;88(6):1356-1364. Epub 2015 Sep 2. PMID: 26331407. [CrossRef]
- Claes KJ, Viaene L, Heye S, Meijers B, d’Haese P, Evenepoel P. Sclerostin: Another vascular calcification inhibitor? J Clin Endocrinol Metab 2013; 98(8):3221-8. Epub 2013 Jun 20. PMID: 23788689. [CrossRef]
- Pietrzyk B, Wyskida K, Ficek J, et al. Relationship between plasma levels of sclerostin, calcium-phosphate disturbances, established markers of bone turnover, and inflammation in haemodialysis patients. Int Urol Nephrol 2019;51(3):519-526. Epub 2018 Dec 24. PMID: 30584645; PMCID: PMC6424932. [CrossRef]
Figure 1.
Study population flow diagram.
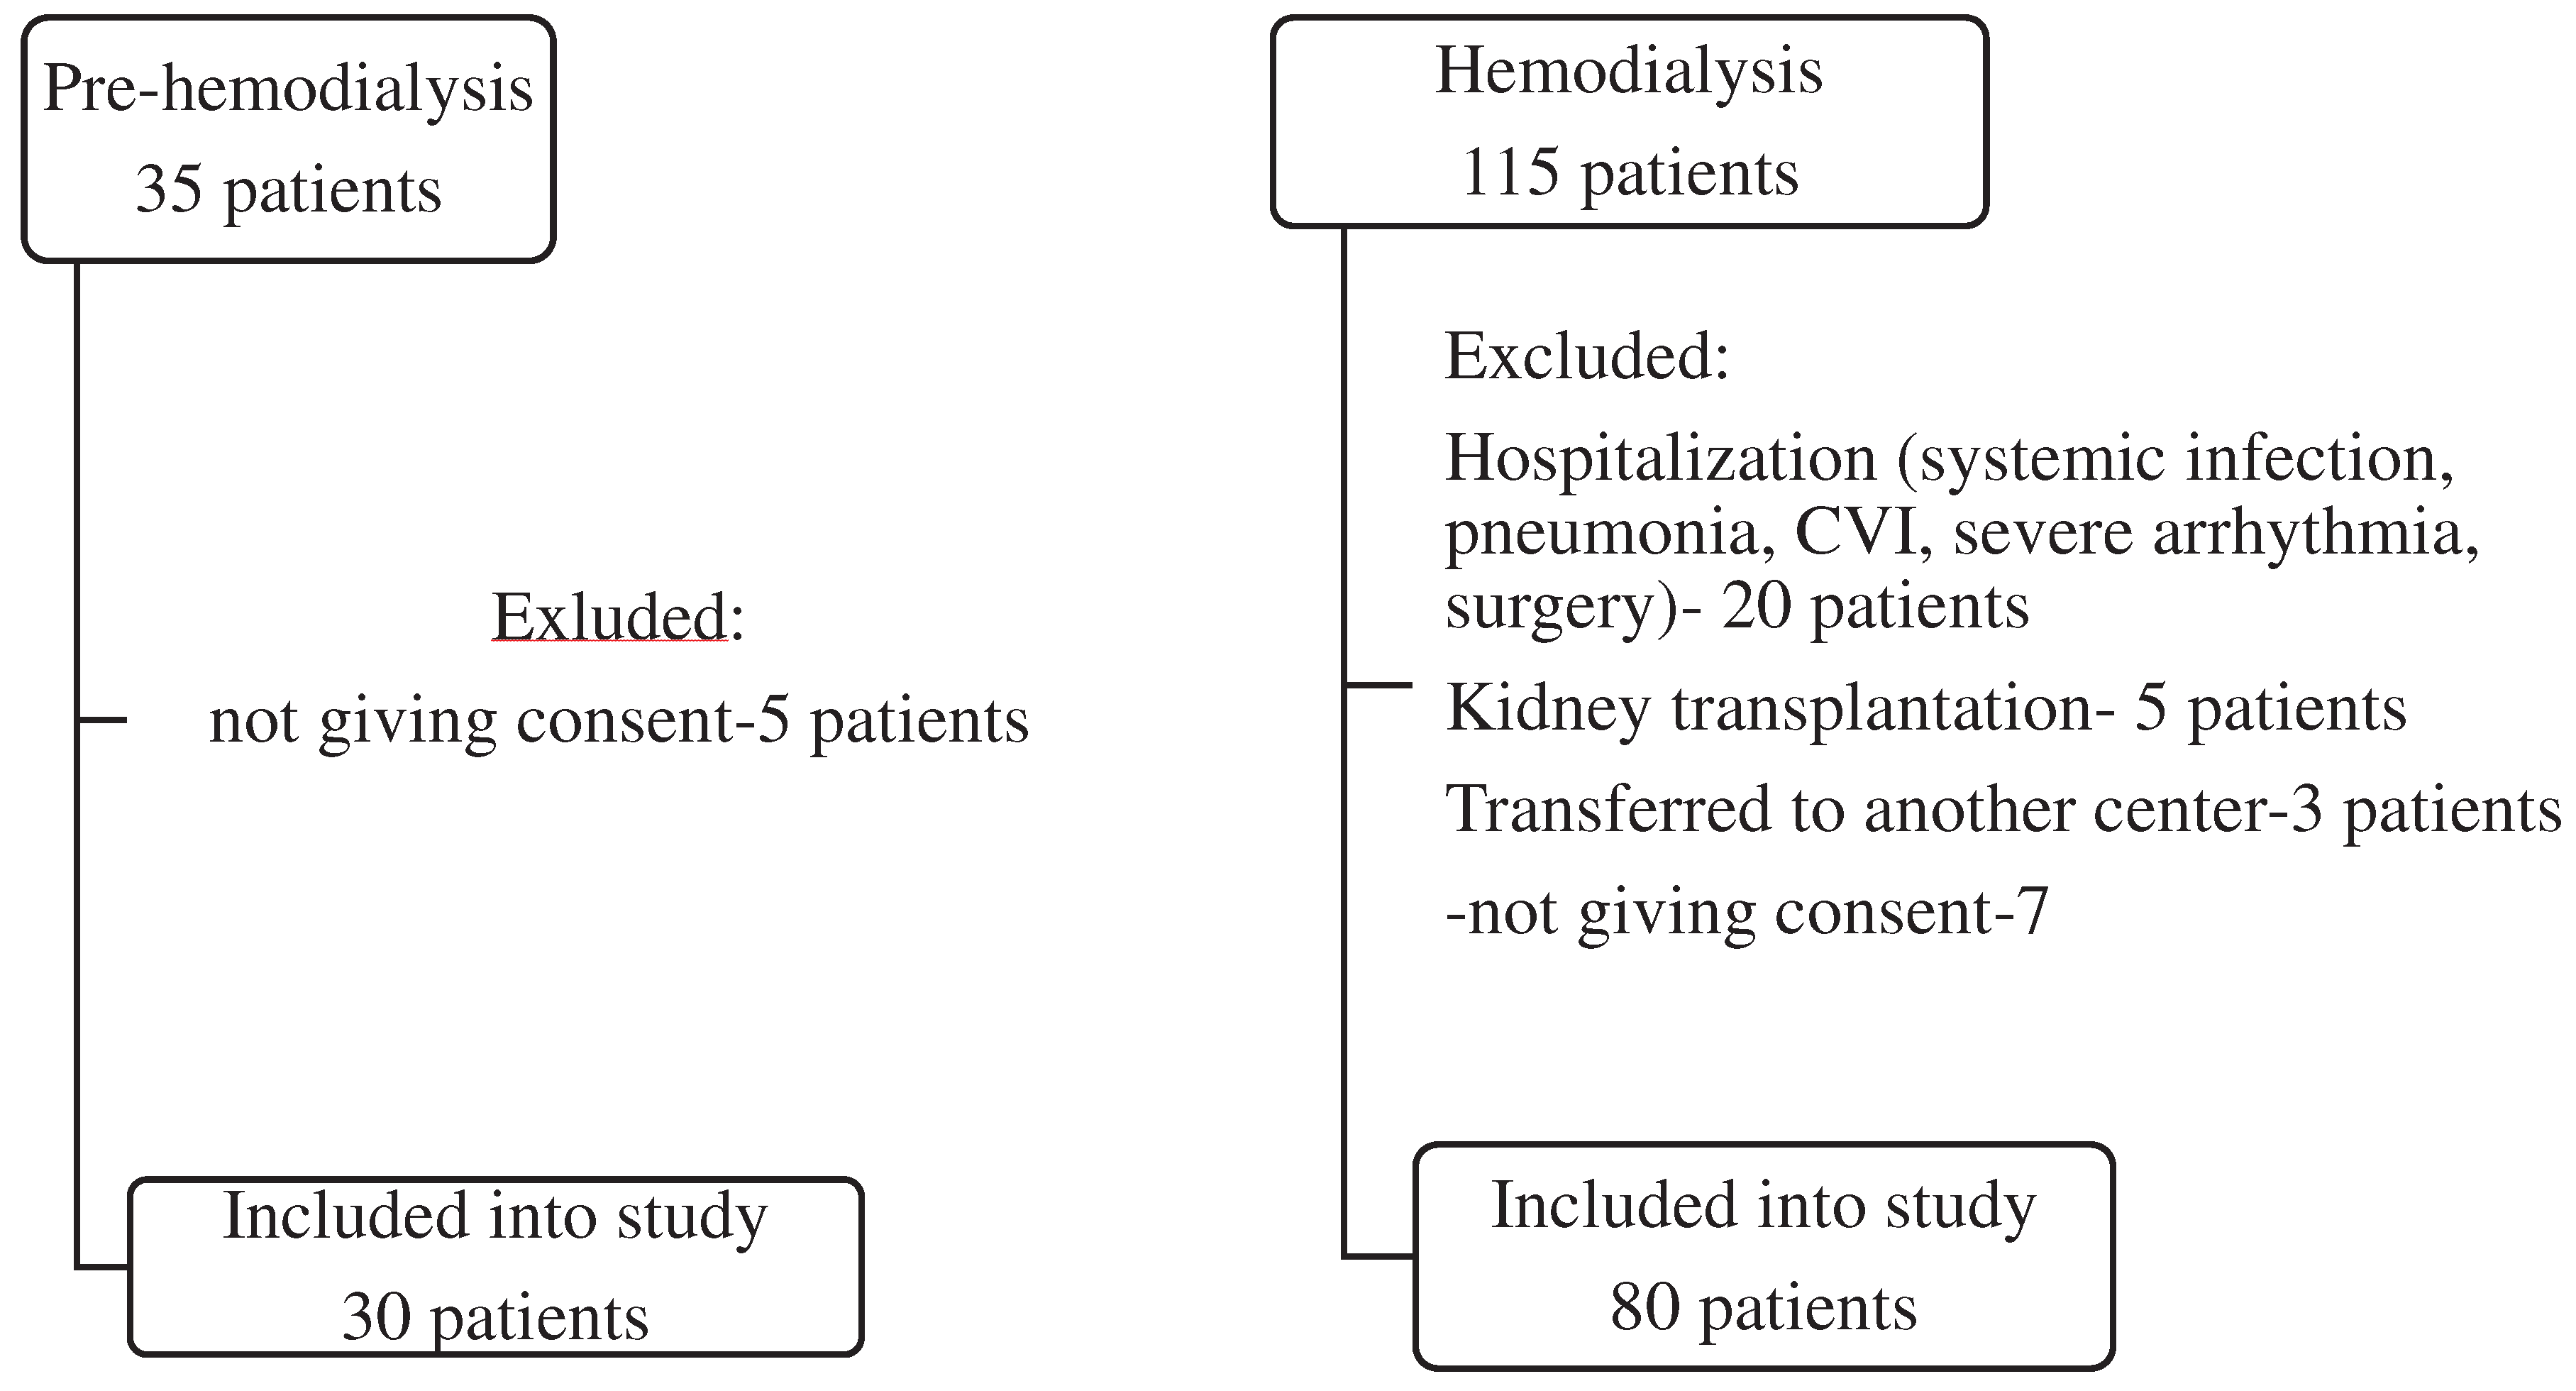

Table 1.
Basal clinical characteristics, presence of co-morbidities, and treatment of the patients in pre- HD and HD groups.
Table 1.
Basal clinical characteristics, presence of co-morbidities, and treatment of the patients in pre- HD and HD groups.
| All | Pre-HD (No=30) |
HD (No=85) |
p | |
|---|---|---|---|---|
| Demographics Age, years Sex, m/f |
60.10±1.36 59/ 59 |
66.7±2.76 40/45 |
57.72±1.49 19/11 |
0.003 0.141 |
| Underlying kidney disease: (%) GN Nephroangiosclerosis APCD DM2 BEN Nephrolithiasis Others |
18 20 10 13 27 13 14 |
3 (10) 6 (20) 2 (6.7) 5 (9.4) 13 (43.3) 1 (3.3) |
15 (17.6) 14 (16.5) 8 (9.4) 8 (9.4) 14 (16.5) 12 (14.1) 14 (16.5) |
0.394 0.779 1.000 0.442 0.005 0.178 |
| Co-morbidities, yes (%) DM2 Hypertension CVD CVI tumor |
16 (15.5) 83 (80.6) 43 (41.7) 11 (10.7) 8 (7.8) |
4 (13.3) 27 (90) 14 (46.7) 2 (6.7) 1 (3.3) |
14 (16.4) 65 (76.7) 34 (34.1) 10 (10.6) 8 (8.2) |
0.778 0.029 0.527 0.728 0.442 |
| Treatment, no (%) | ||||
| ESA Phosphate binder Alpha D3 Antihypertensive |
43 (50) 101 (87.8) 34 (29.6) 78 (67.8) |
7 (23.3) 21 (70) 9 (30) 16 (53.3) |
36 (64.3) 80 (94.1) 25 (29.4) 62 (72.9) |
0.080 0.001 1.000 0.068 |
| VC score, no (%) 0 1-2 ≥ 3 ≥ 6 (8) |
52 (45.2) 22 (19.1) 41 (35.6) 16 (6) |
16 (53.3) 4 (13.3) 10 (33.3) 1 (0) |
36 (42.35) 18 (21.2) 31 (37.47) 15 (6) |
0.393 0.384 0.756 0.030 |
Continuous normally distributed variables are presented as mean ± SE; continuous skewed variables are presented as median (IQR); M= male, f= female, GN= glomerular disease, APCD= adult polycystic kidney disease, DM2= diabetes mellitus type 2, BEN = Balkan endemic nephropathy, ESA- erythropoietin stimulating agents, CVD- cardiovascular diseases (pre-study period: heart failure, previous myocardial infarction, aorto-coronary by-pass surgery, peripheral vascular disease), CVI- cerebrovascular insult.
Table 2.
Basal laboratory data.
| All | Pre-dialysis (No=30) |
HD (No=85) |
p | |
|---|---|---|---|---|
| Cholesterol, mmol/L Triglyceride, mmol/L Hemoglobin, g/L S-Glycaemia, mmol/L S creatinine, µmol/L Urea, mmol/L S-Urate, µmol/L S-Sodium, mmol/L Potassium, mmol/L Calcium, mmol/L Phosphate, mmol/L Feritin, µg/L |
4.59±0.16 4.50 (3.85-5.4) 2.01±0.16 1.65 (1.2-2.8) 108.35±2.19 108 (99-116) 16.26±9.8 5.1 (4.2-5.8) 749±23.89 776 (617-891) 22.57±0.76 22.0 (17.8-27.0) 353.4±9.89 345 (308.75-412) 138.38±0.31 138 (136-140) 5.23 ±0.11 5.2 (4.6-5.9) 2.18±0.02 2.19 (2.10-2.29) 1.64±0.04 1.61 (1.3-2.0) 344.6±38.0 296 (95.45-431) |
4.83±0.15 1.4 (0.8) 105.63±2.93 106 (96.7-114.5) 5.28±0.35 5.2 (4.7-5.55) 537.31±51.9 552.5 (318-731.2) 24.88±2.1 23.4 (14.2-32.95) 386.70±24.2 365 (318.6-449.5) 139.87±0.7 141 (138.2-142.2) 4.85±0.1 4.8 (4.2-5.4) 2.16±0.04 2.16 (2.05-2.28) 1.54±0.1 1.53 (1.1-1.8) 150.96±35.4 84.3(50.75-231.87) |
4.59±1.16 4.5 (3.82-5.4) 2.01±1.6 1.65 (1.2-2.8) 108.04±1.34 108 (101.5-116.5) 20.01±13.14 4.9 (4.2-6.05) 824.0 ±21.5 808 (705.5-915) 21.75±0.7 21.0 (17.9-26.0) 342.1±10.2 342.0 (297-409) 137.86±0.33 138.0 (136-140) 5.29±0.08 5.3 (4.7-5.9) 2.19±0.03 2.19 (2.1-2.31) 1.68±0.05 1.65 (1.3-2.03) 390.2±44.9 355 (131.7-490.1) |
0.891 0.804 0.384 0.663 0.000 0.327 0.100 0.001 0.011 0.541 0.247 0.000 |
| Alkaline phosphatase, IU/L iPTH, pg/ml <100* 25(OH)D, ng/ml <29 *(deficiency± insufficiency) |
88.68±3.9 82 (61-108) 228.4±24.9 120 (55.5-314.5) 47 (41.6%) 32.84 ±1.84 26.85 (18.95-47.95) 64 (55.6%) |
80.63±8.8 73.5 (61.5-99.2) 200.9±34.6 200.9 (34.57) 11 (36.6%) 33.02±5.3 24.7 (46.22) 19 (64.28) |
91.52±4.4 87 (60-109 237.5±31.2 118 (49.5-238.5) 36 (42.3%) 32.8±1.9 27.5 (19.2-48.05) 45 (53.6%) |
0.304 0.710 0.879 |
| Fetuin, ng/ml | 416.56±18.78 390 (305-520) |
515.41±25.98 520 (383-600) |
360.96±21.8 339.5 (244.5-432.6) |
0.000 |
| Sclerostin, pg/ml | 3101.43±231.35 2750 (1060-4960) |
3450.5±243.47 3190 (2550-4520) |
2905.1 ±333.1 2105 (811-5105) |
0.103 |
| FGF23, pg/ml | 813.9±58.67 685 (224-1500) |
187.11±33.0 154.5 (71.2-233.6) |
980.03±61.99 1108 (382-1500) |
0.000 |
All variables are presented as mean ± SD, and median (IQR). * number of patients with percentage in parethesis.
Table 3.
Differences between patients with and without vascular calcification within each group.
| Pre HD group | HD group | p | |||
|
1 VC + |
2 VC neg |
3 VC + |
4 VC neg |
||
| Number | 14 | 16 | 49 | 36 | |
| Age, years | 71.7±2.05 | 62.5±4.68 | 58.66±1,98 | 56.43±2.28 | 1 vs 3, 4 p< 0.001 |
| Sex, m/f | 12/2 | 7/9 | 23/26 | 17/19 | 1 vs 2, 3,4 p < 0.02 |
| ESA, yes /no | 2/12 | 5/11 | 20/29 | 16/20 | 1 vs 4 p= 0.05 |
| Phosphate binder, yes/ no | 9/5 | 12/4 | 47/2 | 33/3 | 1 vs 3,4 p<0.03 2 vs 3 p=0.028 |
| Phosphate, mmol/l | 1.57±0.16 | 1.51±0.11 | 1.54±0.06 | 1.87±0.08 | 4 vs 2, 3 p< 0.018 |
| Phosphate range, mmol/l <1.0 1.0 -1.8 ≥1.9 |
2 8 4* |
2 12 2* |
2 37a 10 b ,* |
0 18a 18b, * |
a p=0.020 b p= 0.005 * 2+4 vs 1+3, p=0.057 |
| FGF 23, pg/ml | 140.75 (205) | 156 (165.7) | 1006 (1175) | 1500 (830) | 2 vs 3, 4 p< 0.0001 1 vs 3, 4 p< 0.004 |
| Fetuin A, ng/ml | 552.5(295) | 498 (162) | 326 (204) | 377 (193) | 1 vs 3, 4 p =0.001 2 vs 3, 4 p< 0.003 |
Continuous normally distributed variables are presented as mean ± SE; continuous skewed variables are presented as median (IQR). ESA- erythropoietin stimulating agents, FGF 23- fibroblast growth factor 23
Table 4.
Predictors of vascular calcification in studied groups, selected with multivariate linear regression analysis.
Table 4.
Predictors of vascular calcification in studied groups, selected with multivariate linear regression analysis.
| B | OR | 95% CI for OR | p | ||
| All patients | |||||
| Phosphate | -0.896 | 0.408 | 0.180 0.926 | .032 | |
| (Constant) | 1.692 | 5.431 | |||
| Pre-HD group | |||||
| Sex | - 2.043 | 0.130 | 0.022 0.779 | 0.026 | |
| (Constant) | 0.539 | 1.714 | |||
| HD Group | |||||
| Phosphate | -2.408 | 0.090 | 0.022 0.364 | 0.001 | |
| Tumor | - 2.599 | 0.074 | 0.007 0.793 | 0.031 | |
| (Constant) | 4.492 | 89.295 |
Disclaimer/Publisher’s Note: The statements, opinions and data contained in all publications are solely those of the individual author(s) and contributor(s) and not of MDPI and/or the editor(s). MDPI and/or the editor(s) disclaim responsibility for any injury to people or property resulting from any ideas, methods, instructions or products referred to in the content. |
© 2023 by the authors. Licensee MDPI, Basel, Switzerland. This article is an open access article distributed under the terms and conditions of the Creative Commons Attribution (CC BY) license (http://creativecommons.org/licenses/by/4.0/).
Copyright: This open access article is published under a Creative Commons CC BY 4.0 license, which permit the free download, distribution, and reuse, provided that the author and preprint are cited in any reuse.


