Submitted:
05 January 2026
Posted:
06 January 2026
You are already at the latest version
Abstract
Background
Hospitalizations for hepatocellular carcinoma (HCC) increasingly involve a complex interaction of chronic liver disease, cardiometabolic comorbidities, and systemic complications, which now exert greater influence than tumor-specific factors alone. However, contemporary data on how the evolving comorbidity burden affects inpatient resource utilization and procedural care are limited. This study evaluates national trends in inpatient characteristics, procedural utilization, and outcomes among patients hospitalized with HCC from 2018 to 2022.
Methods
A retrospective, cross-sectional analysis of adult hospitalizations was performed using the National Inpatient Sample (NIS) from 2018 to 2022. Hospitalizations involving HCC were identified through ICD-10 diagnosis codes, encompassing both principal and secondary diagnoses. Survey-weighted analyses were used to estimate national prevalence, in-hospital mortality, length of stay (LOS), and total hospital charges. Temporal trends were evaluated using survey-weighted logistic or linear regression, with calendar year as a continuous variable. Multivariable survey-weighted logistic regression models were constructed to identify adjusted predictors of inpatient mortality and procedural utilization, including liver transplantation, hepatic resection, and transjugular intrahepatic portosystemic shunt (TIPS) placement.
Results
During the study period, an estimated 275,000 HCC-related hospitalizations occurred nationwide. The prevalence of cardiometabolic comorbidities increased significantly over time (all p< 0.001), including MASLD (6.6% to 8.7%), obesity (10.6% to 13.7%), diabetes (36.0% to 38.9%), and dyslipidemia (26.4% to 34.4%). In-hospital mortality rose from 8.82% (95% CI, 8.40-9.24%) in 2018 to 9.23% (95% CI, 8.81-9.65%) in 2022, with the highest rate in 2020 (9.42%). In parallel, inpatient resource utilization rose, as reflected by longer lengths of stay and higher hospitalization charges. Utilization of diagnostic endoscopic procedures, such as esophagogastroduodenoscopy and endoscopic retrograde cholangiopancreatography, increased, whereas rates of definitive inpatient oncologic and portal hypertension–directed interventions—including liver transplantation, hepatic resection, and TIPS—remained low and stable. In-hospital mortality was independently associated with markers of hepatic decompensation and systemic illness, including hepatic encephalopathy, acute kidney injury, sepsis, and hepatorenal syndrome. These associations were stronger than those observed for tumor-directed procedures, as reflected by inpatient procedural utilization patterns.
Conclusions
Between 2018 and 2022, inpatient resource utilization among patients hospitalized with hepatocellular carcinoma increased in parallel with rising cardiometabolic comorbidity and was driven primarily by the management of hepatic decompensation and systemic illness rather than oncologic intervention. These findings characterize the evolving complexity of HCC hospitalizations in the contemporary inpatient setting.
Keywords:
hepatocellular carcinoma
; inpatient outcomes
; national inpatient sample
; metabolic dysfunction–associated steatotic liver disease
; healthcare utilization
1. Introduction
Hepatocellular carcinoma (HCC) is the most common primary liver malignancy and remains a leading cause of cancer-related mortality worldwide. Global Cancer Statistics 2020 indicate that HCC is the sixth most frequently diagnosed cancer and the third leading cause of cancer-related death globally, underscoring its aggressive clinical course and significant public health impact [1]. In the United States, HCC imposes a growing burden on healthcare systems, driven by the increasing prevalence of chronic liver disease, greater comorbidity complexity, and high rates of hospitalization-related morbidity and mortality [1].
The epidemiology of HCC has shifted substantially. Direct-acting antiviral therapy has reduced HCV-related HCC incidence at the population level, though hospitalized cohorts may reflect delayed effects of prior disease burden [2,3]. Simultaneously, metabolic dysfunction-associated steatotic liver disease (MASLD) and alcohol-associated liver disease have emerged as leading HCC causes [4,5], paralleling broader increases in obesity, diabetes, and cardiometabolic disease with implications for inpatient outcomes and resource utilization [6].
Most HCC develops in the context of cirrhosis, and inpatient outcomes reflect hepatic dysfunction severity rather than tumor factors alone [7]. HCC hospitalizations frequently involve hepatic encephalopathy, ascites, hepatorenal syndrome, acute kidney injury, gastrointestinal bleeding, and sepsis [8,9]—complications associated with longer stays, higher costs, and increased mortality [10]. Thus, hospitalization patterns offer insights into advanced liver disease beyond cancer progression.
Previous NIS analyses described HCC hospitalization trends, mortality, length of stay, and costs, primarily pre-DAA era [11,12]. These studies documented increasing inpatient burden but did not address the recent metabolic liver disease transition or COVID-19 disruptions. Contemporary data examining how evolving comorbidity profiles, organ dysfunction, and hospital-level factors influence in-hospital mortality among HCC patients are lacking.
Using data from the National Inpatient Sample from 2018 to 2022, this study provides a contemporary, nationally representative assessment of HCC hospitalizations in the United States during a critical transitional period characterized by declining viral hepatitis, rising metabolic liver disease, and COVID-19 healthcare disruptions. The objectives were to (1) evaluate national trends in HCC-related hospitalizations and patient characteristics during the post-DAA era, (2) assess inpatient disease burden, procedural utilization, and healthcare resource consumption, and (3) identify independent predictors of in-hospital mortality among hospitalized HCC patients in the contemporary metabolic disease era.
2. Materials and Methods
2.1. Study Design and Data Source
We conducted a retrospective, cross-sectional analysis using the National Inpatient Sample (NIS) from 2018-2022. The NIS, developed by the Healthcare Cost and Utilization Project (HCUP) and sponsored by AHRQ, is the largest publicly available all-payer inpatient database in the United States, representing a 20% stratified sample of community hospital discharges nationwide [13]. Each dataset includes demographics, hospital characteristics, diagnoses, procedures, outcomes, and resource utilization. Survey weights, strata, and cluster variables were applied per HCUP guidance [14]. This study utilized de-identified, publicly available data from the Healthcare Cost and Utilization Project National Inpatient Sample (NIS) and was exempt from institutional review board approval in accordance with applicable U.S. regulations.
2.2. Study Population
All adult (≥18 years) hospitalizations in the National Inpatient Sample (NIS) from 2018 to 2022 were evaluated. The study population comprised admissions with a diagnosis of hepatocellular carcinoma (HCC), identified using a manually defined binary variable (HCC) derived from the ICD-10 diagnosis fields. Hospitalizations were identified using ICD-10-CM code C22.0 [2].
We included both principal and secondary diagnoses to capture all encounters with HCC, whether as the main reason for hospitalization or as a comorbid condition. This approach captured a spectrum of encounters, including complications of malignancy rather than only cancer-directed care. We excluded hospitalizations with missing age, sex, discharge weight, or hospital stratum. Pediatric and obstetric admissions were also omitted to maintain an adult cohort.
After applying inclusion and exclusion criteria, the analytic cohort represented a nationally weighted estimate of adult HCC hospitalizations across U.S. hospitals from 2018 to 2022.
2.3. Demographics and Hospital Characteristics
Demographic variables included age, sex, race/ethnicity (White, African American, Hispanic, Asian/Pacific Islander, Native American, and Other), primary payer (Medicare, Medicaid, private insurance, self-pay, or other), and median household income quartile by ZIP code. Hospital-level variables included location (rural, urban non-teaching, urban teaching), bed size (small, medium, large), and U.S. Census region (Northeast, Midwest, South, West).
2.4. Clinical Covariates
Comorbidities were identified using HCUP comorbidity and diagnosis flags, supplemented by ICD-10-based CCSR codes. The following conditions were extracted: cirrhosis, viral hepatitis (HBV/HCV), metabolic dysfunction–associated steatotic liver disease (MASLD), diabetes mellitus, hypertension, chronic kidney disease (CKD), congestive heart failure (CHF), coronary artery disease (CAD), dyslipidemia, obesity, and alcohol use disorder. Hospitalizations were also stratified by major admission categories, including liver-related, cardiovascular, renal, infectious, and gastrointestinal bleeding causes.
Hospitalizations were classified as metabolic dysfunction–associated steatotic liver disease–related hepatocellular carcinoma (MASLD-HCC) if ICD-10-CM codes for hepatic steatosis or steatohepatitis were present along with at least one metabolic risk factor.
2.5. Outcomes
The primary outcome was in-hospital mortality. Secondary outcomes included length of stay (LOS), total hospital charges (TOTCHG), and utilization of inpatient procedures, including endoscopy, hepatic resection, liver transplantation, and TIPS placement.
2.6. Procedural Identification
Endoscopic and hepatobiliary procedures were identified using Clinical Classifications Software Refined (CCSR) procedure groupings, including diagnostic and interventional esophagogastroduodenoscopy (EGD), colonoscopy, and endoscopic retrograde cholangiopancreatography (ERCP), as well as transjugular intrahepatic portosystemic shunt (TIPS), hepatic resection, and liver transplantation. Diagnostic and therapeutic endoscopic procedures were evaluated separately to characterize procedural intensity. Liver transplantation was identified using ICD-10-PCS procedure codes for liver transplantation during the index hospitalization, as well as ICD-10-CM diagnosis codes indicating liver transplant status or aftercare. Because the NIS does not distinguish transplant eligibility or oncologic intent, liver transplantation in this study reflects inpatient transplant-related utilization rather than definitive curative therapy for HCC.
2.7. Statistical Analysis
All analyses accounted for the NIS’s complex survey design using the provided discharge weights (DISCWT), hospital strata (NIS_STRATUM), and cluster variables (HOSP_NIS) to produce national estimates. Descriptive statistics were used to summarize demographic and clinical characteristics across study years.
λ-Categorical variables were compared using the Rao–Scott adjusted χ2 test and presented as weighted percentages.
λ-Continuous variables (e.g., LOS and hospital charges) were compared using survey-weighted linear regression and reported as means with standard errors.
λ-Temporal trends were evaluated using survey-weighted logistic or linear regression with calendar year as a continuous predictor.
To identify independent predictors of in-hospital mortality, multivariable survey-weighted logistic regression models were constructed. Covariates included demographics, payer type, income quartile, hospital region, major comorbidities (cirrhosis, viral hepatitis, MASLD, diabetes, CKD, CAD, CHF, obesity), and common inpatient complications (liver failure, hepatic encephalopathy, sepsis, renal failure, gastrointestinal bleeding, and cardiovascular events). Model selection was guided by clinical relevance and existing literature [15,16]. Odds ratios (aORs) with 95% confidence intervals (CIs) were reported, and two-tailed p-values <0.05 were considered statistically significant.
Analyses were performed using Stata/MP version 17.0.
3. Results
3.1. Inpatient Prevalence of Hepatocellular Carcinoma
After applying inclusion and exclusion criteria, the analytic sample represented approximately 33.1 million adult hospitalizations nationwide during the study period. Among these, HCC accounted for an estimated 0.25%-0.28% of all discharges, corresponding to ~55,000–58,000 hospitalizations annually.
3.2. In-Hospital Mortality
In-hospital mortality showed a significant upward trend from 8.82% (95% CI, 8.40-9.24%) in 2018 to 9.23% (95% CI, 8.81-9.65%) in 2022 (p<0.001). The highest rate occurred in 2020 (9.42%), coinciding with the COVID-19 pandemic, followed by modest decline in 2021 (9.14%) and subsequent rise in 2022. Survey-weighted annual mortality trends are summarized in Table 1.
3.3. Comorbidities Among Patients Hospitalized with HCC
Over the study period, cardiometabolic comorbidities—including MASLD, obesity, diabetes, dyslipidemia, chronic kidney disease, and congestive heart failure—increased, while viral hepatitis and alcohol use disorder declined (Table 2 and Figure 1). Cirrhosis prevalence remained relatively stable.
The graph illustrates the diverging trends between declining viral hepatitis (HCV, HBV) and rising metabolic comorbidities (MASLD, diabetes, obesity, dyslipidemia, chronic kidney disease, congestive heart failure). Cirrhosis and alcohol use disorder remained relatively stable. All temporal trends were statistically significant (p<0.001). HCV: hepatitis C virus; MASLD: metabolic dysfunction-associated steatotic liver disease; CKD: chronic kidney disease; CHF: congestive heart failure; CAD: coronary artery disease.
3.4. Burden of Primary Hospital Admissions
Liver-related complications remained the most common drivers of hospitalization, followed by infectious and cardiovascular causes, with modest increases in infectious and cardiovascular admissions over time (Table 3 and Figure 2). Because admission categories were not mutually exclusive, percentages reflect co-occurring drivers of hospitalization rather than mutually exclusive primary diagnoses. Most temporal changes in comorbidity prevalence were statistically significant (p<0.001).
Liver-related complications remained the predominant admission driver (approximately 55%), while infectious and cardiovascular admissions showed modest increases over time. Renal complications and gastrointestinal bleeding remained relatively stable. Categories are not mutually exclusive as patients may have multiple concurrent admission drivers. GI: gastrointestinal.
3.5. Predictors of In-Hospital Mortality
Between 2018 and 2022, multivariable logistic regression identified advanced age, liver-related complications, and sepsis as the strongest independent predictors of in-hospital mortality among patients with hepatocellular carcinoma (Table 4).
3.6. Length of Stay and Total Hospital Charges
Between 2018 and 2022, mean hospital length of stay and total hospital charges varied significantly by primary admission category (Table 5). Infectious, liver-related, and gastrointestinal bleeding admissions had the longest hospitalizations, while cardiovascular, renal, and other causes showed shorter and relatively stable stays over time.
Total hospital charges increased across all primary admission categories over the study period, with the highest charges consistently observed for infectious and gastrointestinal bleeding–related admissions. Liver-related hospitalizations also demonstrated a steady rise in charges over time, paralleling increasing length of stay. Cardiovascular and renal admissions were associated with comparatively lower but progressively increasing charges (Table 5).
3.7. Demographics
Overall, hospitalized patients with hepatocellular carcinoma were predominantly older, male, and Medicare-insured, with stable racial, regional, and hospital-level distributions over time. Detailed demographic and socioeconomic characteristics across study years are presented in Table 6.
3.8. Temporal Trends in Endoscopic Procedures
Diagnostic endoscopic utilization, including EGD and ERCP, increased modestly over time, whereas interventional endoscopy, hepatic resection, liver transplantation, and TIPS utilization remained low and stable (Table 7).
3.9. Adjusted Predictors of Liver Transplantation, Hepatic Resection, and TIPS Placement
Across all three procedures, distinct patterns emerged in the adjusted predictors of inpatient liver transplantation, hepatic resection, and TIPS placement. Liver transplantation was associated with younger age, private insurance, urban teaching hospitals, and liver disease etiologies such as MASLD, hepatitis C, and alcohol-associated liver disease. Cirrhosis increased the likelihood of transplantation but was also the strongest predictor for TIPS placement, which remained a rare, highly selective event throughout the study years. Hepatic resection was more frequent among patients with MASLD, obesity, dyslipidemia, and those at urban teaching hospitals, but was less likely in individuals with cirrhosis, chronic kidney disease, or alcohol associated liver disease. Notably, substance use disorder, Medicaid, and self-pay status lowered the odds of transplantation. These patterns underscore how patient characteristics and hospital factors shape the likelihood of each procedure in hospitalized HCC patients, as detailed in Table 8.
4. Discussion
In this nationally representative analysis of U.S. hospitalizations from 2018–2022, we found that hepatocellular carcinoma (HCC) accounted for approximately 0.25–0.28% of all adult inpatient discharges, translating to roughly 55,000–58,000 HCC-associated hospitalizations annually. Over this five-year period, we observed a modest but statistically significant rise in inpatient HCC prevalence and a concurrent increase in in-hospital mortality, with the highest mortality in 2020. We further demonstrate a shifting inpatient comorbidity landscape characterized by declining viral hepatitis and increasing metabolic comorbidity, alongside a rising burden of infectious and cardiovascular admission drivers. Finally, we identify that in-hospital mortality is strongly determined by acute severity features, including hepatic encephalopathy, liver failure, hepatorenal syndrome, acute kidney injury, and sepsis, highlighting the central role of multi-organ complications in driving short-term outcomes among hospitalized HCC patients.
Earlier NIS studies documented rising HCC hospitalization volume and charges. Jinjuvadia et al. (2002-2011) emphasized growing inpatient burden [15], Mishra et al. (2005-2009) reported increasing charges and hospital outcome associations [16], and Wakil et al. (2011-2017) provided pre-COVID mortality, LOS, and charge baselines. Our study extends this epidemiology into 2018-2022, capturing the post-DAA and COVID-19 periods.
The primary contribution of our study is that it extends national inpatient HCC epidemiology into the contemporary period (2018–2022), spanning the post-direct-acting antiviral (DAA) era and the COVID-19 healthcare disruption period. Prior inpatient trend papers largely end before 2018 and therefore do not capture (1) the ongoing etiologic transition toward metabolic liver disease–associated HCC, and (2) the acute pandemic-era inflection that appears in our mortality curve.
Importantly, in-hospital mortality in NIS reflects hospitalized-case fatality rather than population-level survival. Several mechanisms may plausibly explain the upward trend and pandemic-era peak. First, multiple studies documented delays and disruptions in HCC surveillance, diagnosis, and treatment during early COVID-19 waves, which would be expected to shift presentations toward more advanced disease and higher acuity among those who ultimately require hospitalization [17]. Second, hospital resource constraints and altered care pathways during 2020 likely influenced admission thresholds, potentially selecting for more severely ill patients. While our dataset cannot directly measure stage or outpatient therapy deferrals, the temporal association with the early pandemic period is consistent with reported COVID-era delays in oncologic care and HCC management [8].
A key finding is the substantial reduction in viral hepatitis and hepatitis C prevalence among hospitalized HCC patients over time, alongside increasing MASLD prevalence and increasing cardiometabolic comorbidity (e.g., obesity, dyslipidemia, diabetes). This mirrors the broader epidemiologic literature, which describes declining HCV-related HCC risk following DAA implementation and a rising share of NAFLD/MASLD-related HCC in the United States [18]. The “changing epidemiology” framework for HCC has been well described, with metabolic liver disease increasingly driving incident HCC as viral hepatitis becomes more treatable at scale [9].
Notably, metabolic dysfunction–associated steatotic liver disease (MASLD) was associated with lower odds of in-hospital mortality in multivariable analyses. This association should be interpreted cautiously, as administrative data cannot fully account for disease severity, admission indication, or competing risks. This finding does not imply an intrinsic protective effect of MASLD. Rather, it likely reflects differences in baseline hepatic reserve, portal hypertension severity, and admission acuity compared with viral- or alcohol-related cirrhosis phenotypes. In hospitalized patients with hepatocellular carcinoma, short-term outcomes are often driven more by decompensated cirrhosis and systemic complications than by tumor biology alone, and observed comorbidity associations may therefore reflect residual confounding by disease severity not fully captured in administrative datasets [5].
Although MASLD is now recognized as one of the fastest-growing etiologic drivers of hepatocellular carcinoma, prior observational studies have similarly reported a paradoxical association between MASLD-related HCC and lower short-term or in-hospital mortality compared with other etiologies. One potential explanation is that patients with MASLD-associated HCC are more frequently hospitalized for nonhepatic indications, such as cardiovascular or infectious events, rather than acute hepatic decompensation, which may contribute to lower observed inpatient fatality rates [10]. In addition, this pattern parallels the well-described “obesity paradox,” wherein overweight and obese patients demonstrate improved short-term survival in hospitalized and chronic disease cohorts despite increased long-term risk, a phenomenon reported across cardiovascular disease, cirrhosis, and other medically complex populations [11].
Liver-related complications remained the most common admission category (≈55%), but we observed a notable increase in cardiovascular and infectious admission drivers over time, while renal and GI bleeding burdens remained relatively stable. These patterns reinforce that the inpatient HCC population increasingly represents a medically complex cohort with competing comorbidities and multi-system complications. The rising cardiovascular burden aligns with the increasing prevalence of metabolic comorbidity observed in our cohort and reflects well-recognized overlap between MASLD and cardiometabolic disease [9].
The infectious burden—particularly sepsis-related admissions—may also reflect cirrhosis-associated immune dysfunction and high vulnerability to systemic infection in advanced liver disease [19]. The modest rise in infectious admissions during and after 2020 plausibly reflects both baseline vulnerability and pandemic-related shifts in healthcare utilization and infection epidemiology [8].
Across years, hepatic encephalopathy, liver failure, hepatorenal syndrome, acute kidney injury, and sepsis were the strongest predictors of in-hospital mortality in our models. This is consistent with the clinical reality that hospitalized HCC patients frequently die from complications of end-stage liver disease or systemic illness rather than from oncologic progression alone. Prior inpatient analyses have similarly linked mortality risk to severity markers and hospital factors [5].
We also observed associations between mortality and payer status and race/ethnicity, suggesting persistent disparities in inpatient outcomes (Figure 3). Although this analysis is descriptive, the disproportionate concentration of hospitalizations in the Southern United States is consistent with prior reports of higher chronic liver disease prevalence, metabolic risk burden, and hepatocellular carcinoma incidence in this region [20]. Although hospitalizations were disproportionately concentrated in the Southern United States, lower adjusted in-hospital mortality in this region may reflect case-mix differences, referral patterns to high-volume centers, or residual confounding related to admission thresholds and disease severity. While administrative datasets cannot fully disentangle mechanisms, these findings are directionally consistent with a broader disparities literature in HCC care (screening, stage at diagnosis, and access to specialized treatment), which continues to motivate health-systems interventions aimed at equitable prevention and early detection [9].
We found increasing total hospital charges across admission categories, with infectious and GI bleeding admissions consistently among the highest-cost and longest-stay hospitalizations. Prior NIS-based studies have similarly described the substantial financial burden of inpatient HCC care and its upward trajectory over time [5]. Our study adds contemporary estimates through 2022, which is important given ongoing inflation, increasing procedural intensity, and rising comorbidity complexity—factors that likely amplify inpatient costs in the modern era.
Increased inpatient procedural burden was driven by diagnostic endoscopy and decompensation management rather than oncologic interventions. While diagnostic EGD and ERCP increased modestly, liver transplantation, hepatic resection, and TIPS remained low and stable. This aligns with prior studies showing HCC hospitalizations are precipitated by cirrhosis complications—bleeding, infection, renal dysfunction—rather than tumor-directed therapy [7]. Increased diagnostic endoscopy likely reflects heightened vigilance in an increasingly comorbid population. Liver transplantation remained concentrated at urban teaching hospitals and among privately insured patients [21,22], with persistent socioeconomic and institutional disparities despite stable overall rates.
The contrasting predictors of hepatic resection versus transplantation underscore biologically plausible selection patterns. Resection was favored in patients with metabolic-associated disease and preserved hepatic function, whereas transplantation was driven by advanced cirrhosis and decompensation. The strong inverse association between cirrhosis and resection is consistent with surgical guidelines emphasizing hepatic reserve in operative candidacy. Finally, the rarity and stability of TIPS utilization reinforce that portal hypertension interventions remain tightly indication-based, even as inpatient complexity rises.
5. Conclusions
Between 2018 and 2022, inpatient resource utilization among patients hospitalized with hepatocellular carcinoma increased substantially, driven by rising cardiometabolic comorbidity burden and management of hepatic decompensation rather than oncologic intervention. In-hospital mortality was determined primarily by acute severity markers—hepatic encephalopathy, organ failure, and sepsis—rather than tumor-directed procedures, which remained uncommon. The declining viral hepatitis prevalence and corresponding rise in MASLD reflect a fundamental epidemiologic transition with important implications for surveillance strategies and resource allocation. Contemporary HCC hospitalizations predominantly represent management of advanced, decompensated liver disease in medically complex patients, highlighting the critical need for enhanced outpatient surveillance targeting metabolic liver disease populations, early detection strategies, and coordinated multidisciplinary care to prevent disease progression requiring hospitalization.
Limitations
This study has several important limitations. First, ICD-10 coding may introduce misclassification, though validated HCUP flags mitigate this concern. Second, the NIS lacks clinical granularity including tumor stage (BCLC staging, Milan criteria), liver function scores (MELD, Child-Pugh class), and laboratory values, limiting severity stratification and potentially causing residual confounding in mortality models. Third, we cannot distinguish whether HCC was the primary admission reason versus comorbidity, though admission category analysis provides insight into hospitalization drivers. Fourth, the NIS cannot track individual patients across admissions or assess post-discharge outcomes, preventing evaluation of readmission patterns or long-term survival. Fifth, outpatient cancer-directed therapies (systemic therapy, ablation, radioembolization) cannot be identified. Sixth, functional status, frailty, and patient preferences—which influence treatment decisions and outcomes—are not captured. Finally, the study period spans coding transitions and the COVID-19 pandemic, which may have affected documentation practices and case mix. Despite these limitations, the NIS provides valuable population-level insights complementing clinic-based studies.
Author Contributions
Conceptualization, M.H.L.; Methodology, M.H.L.; Formal analysis, M.H.L.; Data curation, M.H.L.; Writing—original draft preparation, M.H.L.,A.K.,E.M.; Writing—review and editing, A.K., E.M., K.A.M., J.R., H.E.H., K.Q.; Visualization, M.H.L.; Supervision, K.A.M., K.Q. All authors have read and agreed to the published version of the manuscript.
Funding
This research received no external funding. The Article Processing Charge (APC) was not externally funded.
Institutional Review Board Statement
This study utilized de-identified, publicly available data from the Healthcare Cost and Utilization Project (HCUP) National Inpatient Sample (NIS). Ethical review and approval were waived for this study because it did not involve identifiable human subjects.
Informed Consent Statement
Not applicable.
Data Availability Statement
The data analyzed in this study are publicly available from the Healthcare Cost and Utilization Project National Inpatient Sample (NIS).
Acknowledgments
During the preparation of this manuscript, the authors used artificial intelligence–based tools solely for language editing and formatting assistance. The authors reviewed and edited the output and take full responsibility for the content of this publication.
Conflicts of Interest
The authors declare no conflicts of interest.
Abbreviations
The following abbreviations are used in this manuscript:
| aOR | adjusted odds ratio |
| AKI | acute kidney injury |
| AUD | alcohol use disorder |
| CHF | congestive heart failure |
| CI | confidence interval |
| COVID-19 | coronavirus disease 2019 |
| DAA | direct-acting antiviral |
| EGD | esophagogastroduodenoscopy |
| ERCP | endoscopic retrograde cholangiopancreatography |
| GI | gastrointestinal |
| HCC | hepatocellular carcinoma |
| HCUP | Healthcare Cost and Utilization Project |
| HCV | hepatitis C virus |
| HRS | hepatorenal syndrome |
| ICD-10-CM | International Classification of Diseases, Tenth Revision, Clinical Modification |
| LOS | length of stay |
| MASLD | metabolic dysfunction–associated steatotic liver disease |
| NIS | National Inpatient Sample |
| OR | odds ratio |
| SE | standard error |
| TIPS | transjugular intrahepatic portosystemic shunt |
| USD | United States dollars |
References
- McGlynn, KA; Petrick, JL; El-Serag, HB. Epidemiology of hepatocellular carcinoma. Hepatology 2021, 73, 4–13. [Google Scholar] [CrossRef] [PubMed]
- Kanwal, F; Kramer, J; Asch, SM; Chayanupatkul, M; Cao, Y; El-Serag, HB. Risk of hepatocellular cancer in HCV patients treated with direct-acting antiviral agents. Gastroenterology 2017, 153, 996–1005.e1. [Google Scholar] [CrossRef] [PubMed]
- Ioannou, GN; Beste, LA; Green, PK; et al. Increased risk for hepatocellular carcinoma persists up to 10 years after HCV eradication in patients with baseline cirrhosis or high FIB-4 scores. Gastroenterology 2019, 157, 1264–1278.e4. [Google Scholar] [CrossRef] [PubMed]
- Huang, DQ; El-Serag, HB; Loomba, R. Global epidemiology of NAFLD-related hepatocellular carcinoma: trends, predictions, risk factors, and prevention. Nat Rev Gastroenterol Hepatol. 2021, 18, 223–238. [Google Scholar] [CrossRef] [PubMed]
- Huang, DQ; Mathurin, P; Cortez-Pinto, H; Loomba, R. Global epidemiology of alcohol-associated cirrhosis and hepatocellular carcinoma: trends, projections, and risk factors. Nat Rev Gastroenterol Hepatol. 2023, 20, 37–49. [Google Scholar] [CrossRef] [PubMed]
- Simon, TG; King, LY; Chong, DQ; et al. Diabetes, metabolic comorbidities, and risk of hepatocellular carcinoma: results from two prospective cohort studies. Hepatology 2018, 67, 1797–1806. [Google Scholar] [CrossRef] [PubMed]
- Forner, A; Reig, M; Bruix, J. Hepatocellular carcinoma. Lancet 2018, 391, 1301–1314. [Google Scholar] [CrossRef] [PubMed]
- Ginès, P; Krag, A; Abraldes, JG; Solà, E; Fabrellas, N; Kamath, PS. Liver cirrhosis. Lancet 2021, 398, 1359–1376. [Google Scholar] [CrossRef] [PubMed]
- Piano, S; Singh, V; Caraceni, P; et al. Epidemiology and effects of bacterial infections in patients with cirrhosis worldwide. Gastroenterology 2019, 156, 1368–1380.e10. [Google Scholar] [CrossRef] [PubMed]
- Tapper, EB; Aberasturi, D; Zhao, Z; Hsu, CY; Parikh, ND. Outcomes after hepatic encephalopathy in population-based cohorts of patients with cirrhosis. Aliment Pharmacol Ther. 2020, 51, 1397–1405. [Google Scholar] [CrossRef] [PubMed]
- Wakil, A; Wu, YC; Mazzaferro, N; Greenberg, P; Pyrsopoulos, NT. Trends of hepatocellular carcinoma inpatient mortality and financial burden from 2011 to 2017: a nationwide analysis. J Clin Gastroenterol. 2024, 58, 85–90. [Google Scholar] [CrossRef] [PubMed]
- Peery, AF; Crockett, SD; Murphy, CC; et al. Burden and cost of gastrointestinal, liver, and pancreatic diseases in the United States: update 2021. Gastroenterology. 2022, 162, 621–644. [Google Scholar] [CrossRef] [PubMed]
- Healthcare Cost and Utilization Project (HCUP). National Inpatient Sample (NIS). Agency for Healthcare Research and Quality. Available online: https://www.hcup-us.ahrq.gov.
- Healthcare Cost and Utilization Project (HCUP). HCUP methods series. Agency for Healthcare Research and Quality. Available online: https://www.hcup-us.ahrq.gov/reports/methods.jsp.
- Jinjuvadia, R; Salami, A; Lenhart, A; et al. Hepatocellular carcinoma: a decade of hospitalizations and financial burden in the United States. Am J Med Sci. 2017, 354, 362–369. [Google Scholar] [CrossRef] [PubMed]
- Mishra, A; Otgonsuren, M; Venkatesan, C; Afendy, M; Erario, M; Younossi, ZM. The inpatient economic and mortality impact of hepatocellular carcinoma from 2005 to 2009: analysis of the US Nationwide Inpatient Sample. Liver Int. 2013, 33, 1281–1286. [Google Scholar] [CrossRef] [PubMed]
- Amaddeo, G; Brustia, R; Allaire, M; et al. Impact of COVID-19 on the management of hepatocellular carcinoma in a high-prevalence area. JHEP Rep. 2021, 3, 100199. [Google Scholar] [CrossRef] [PubMed]
- Rich, NE. Changing epidemiology of hepatocellular carcinoma within the United States and worldwide. Surg Oncol Clin N Am. 2024, 33, 1–12. [Google Scholar] [CrossRef] [PubMed]
- Lee, DU; Adonizio, EA; Hastie, DJ; et al. Trends in health care utilization and costs associated with primary liver cancer in United States hospitals between 2016 and 2019. J Clin Gastroenterol. 2024, 58, 726–736. [Google Scholar] [CrossRef] [PubMed]
- Younossi, ZM; Koenig, AB; Abdelatif, D; Fazel, Y; Henry, L; Wymer, M. Global epidemiology of nonalcoholic fatty liver disease: meta-analytic assessment of prevalence, incidence, and outcomes. Hepatology 2016, 64, 73–84. [Google Scholar] [CrossRef] [PubMed]
- Mathur, AK; Schaubel, DE; Gong, Q; Guidinger, MK; Merion, RM. Racial and ethnic disparities in access to liver transplantation. Liver Transpl. 2010, 16, 1033–1040. [Google Scholar] [CrossRef] [PubMed]
- Puigvehí, M; Hashim, D; Haber, PK; et al. Liver transplantation for hepatocellular carcinoma in the United States: evolving trends over the last three decades. Am J Transplant. 2020, 20, 220–230. [Google Scholar] [CrossRef]
Figure 1.
Survey-weighted temporal trends in comorbidities among hospitalized patients with hepatocellular carcinoma, 2018–2022.
Figure 1.
Survey-weighted temporal trends in comorbidities among hospitalized patients with hepatocellular carcinoma, 2018–2022.
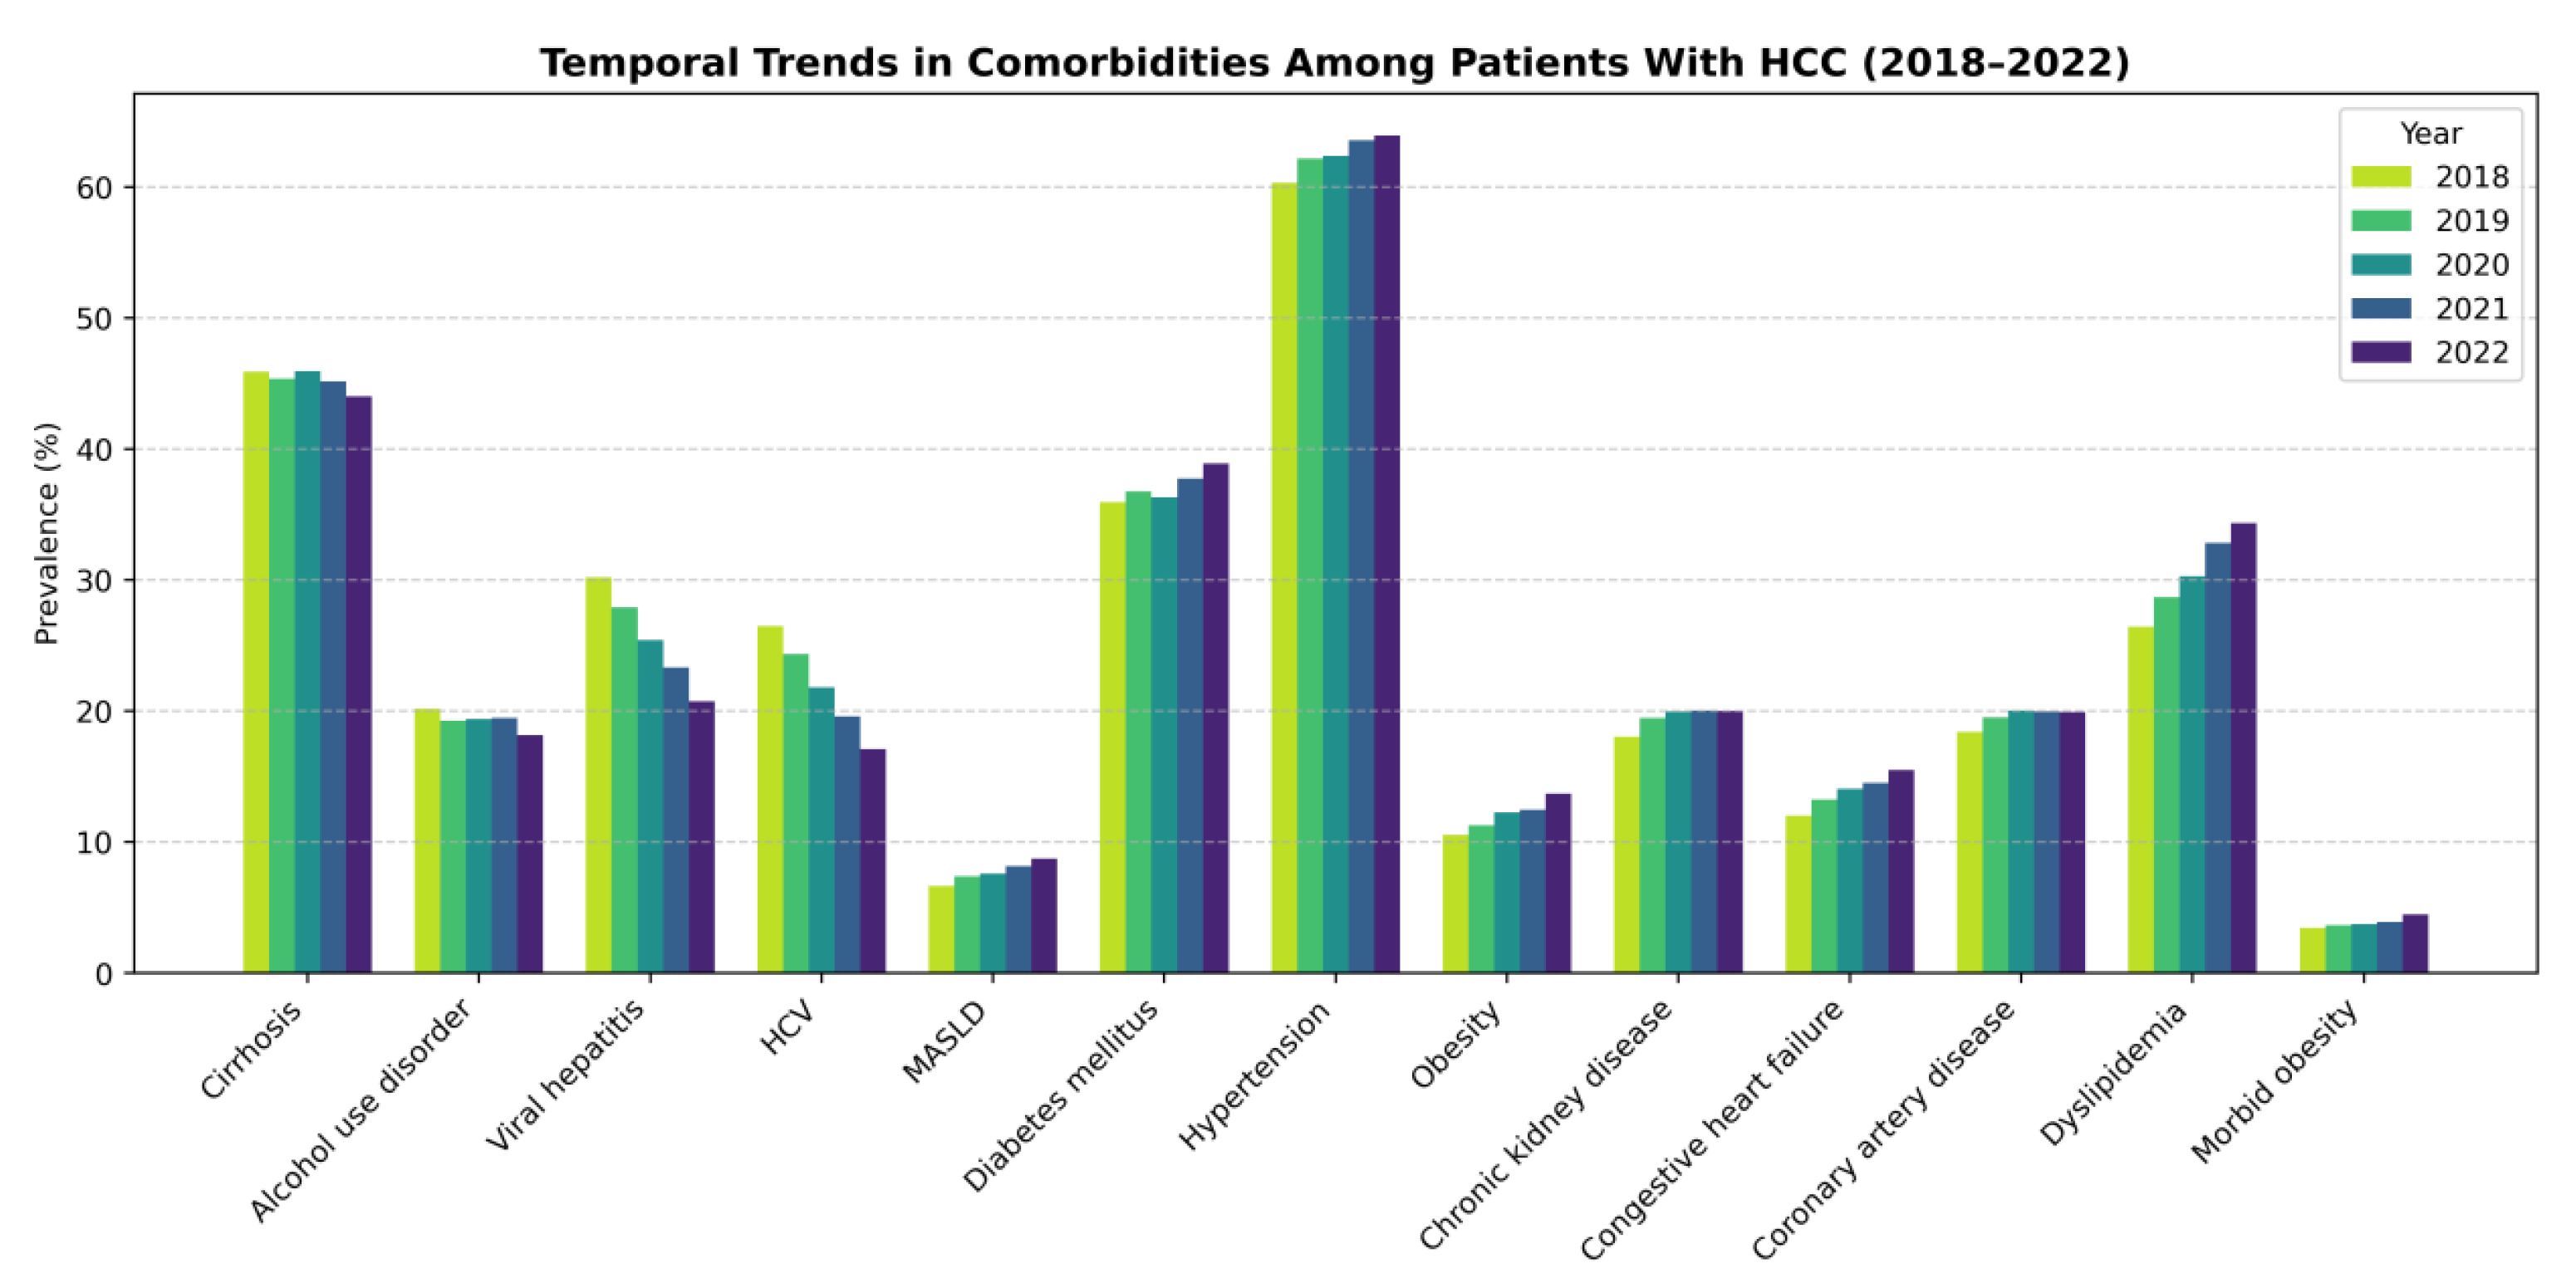
Figure 2.
Survey-weighted temporal trends in major primary admission categories among patients hospitalized with hepatocellular carcinoma in the United States, 2018–2022.
Figure 2.
Survey-weighted temporal trends in major primary admission categories among patients hospitalized with hepatocellular carcinoma in the United States, 2018–2022.
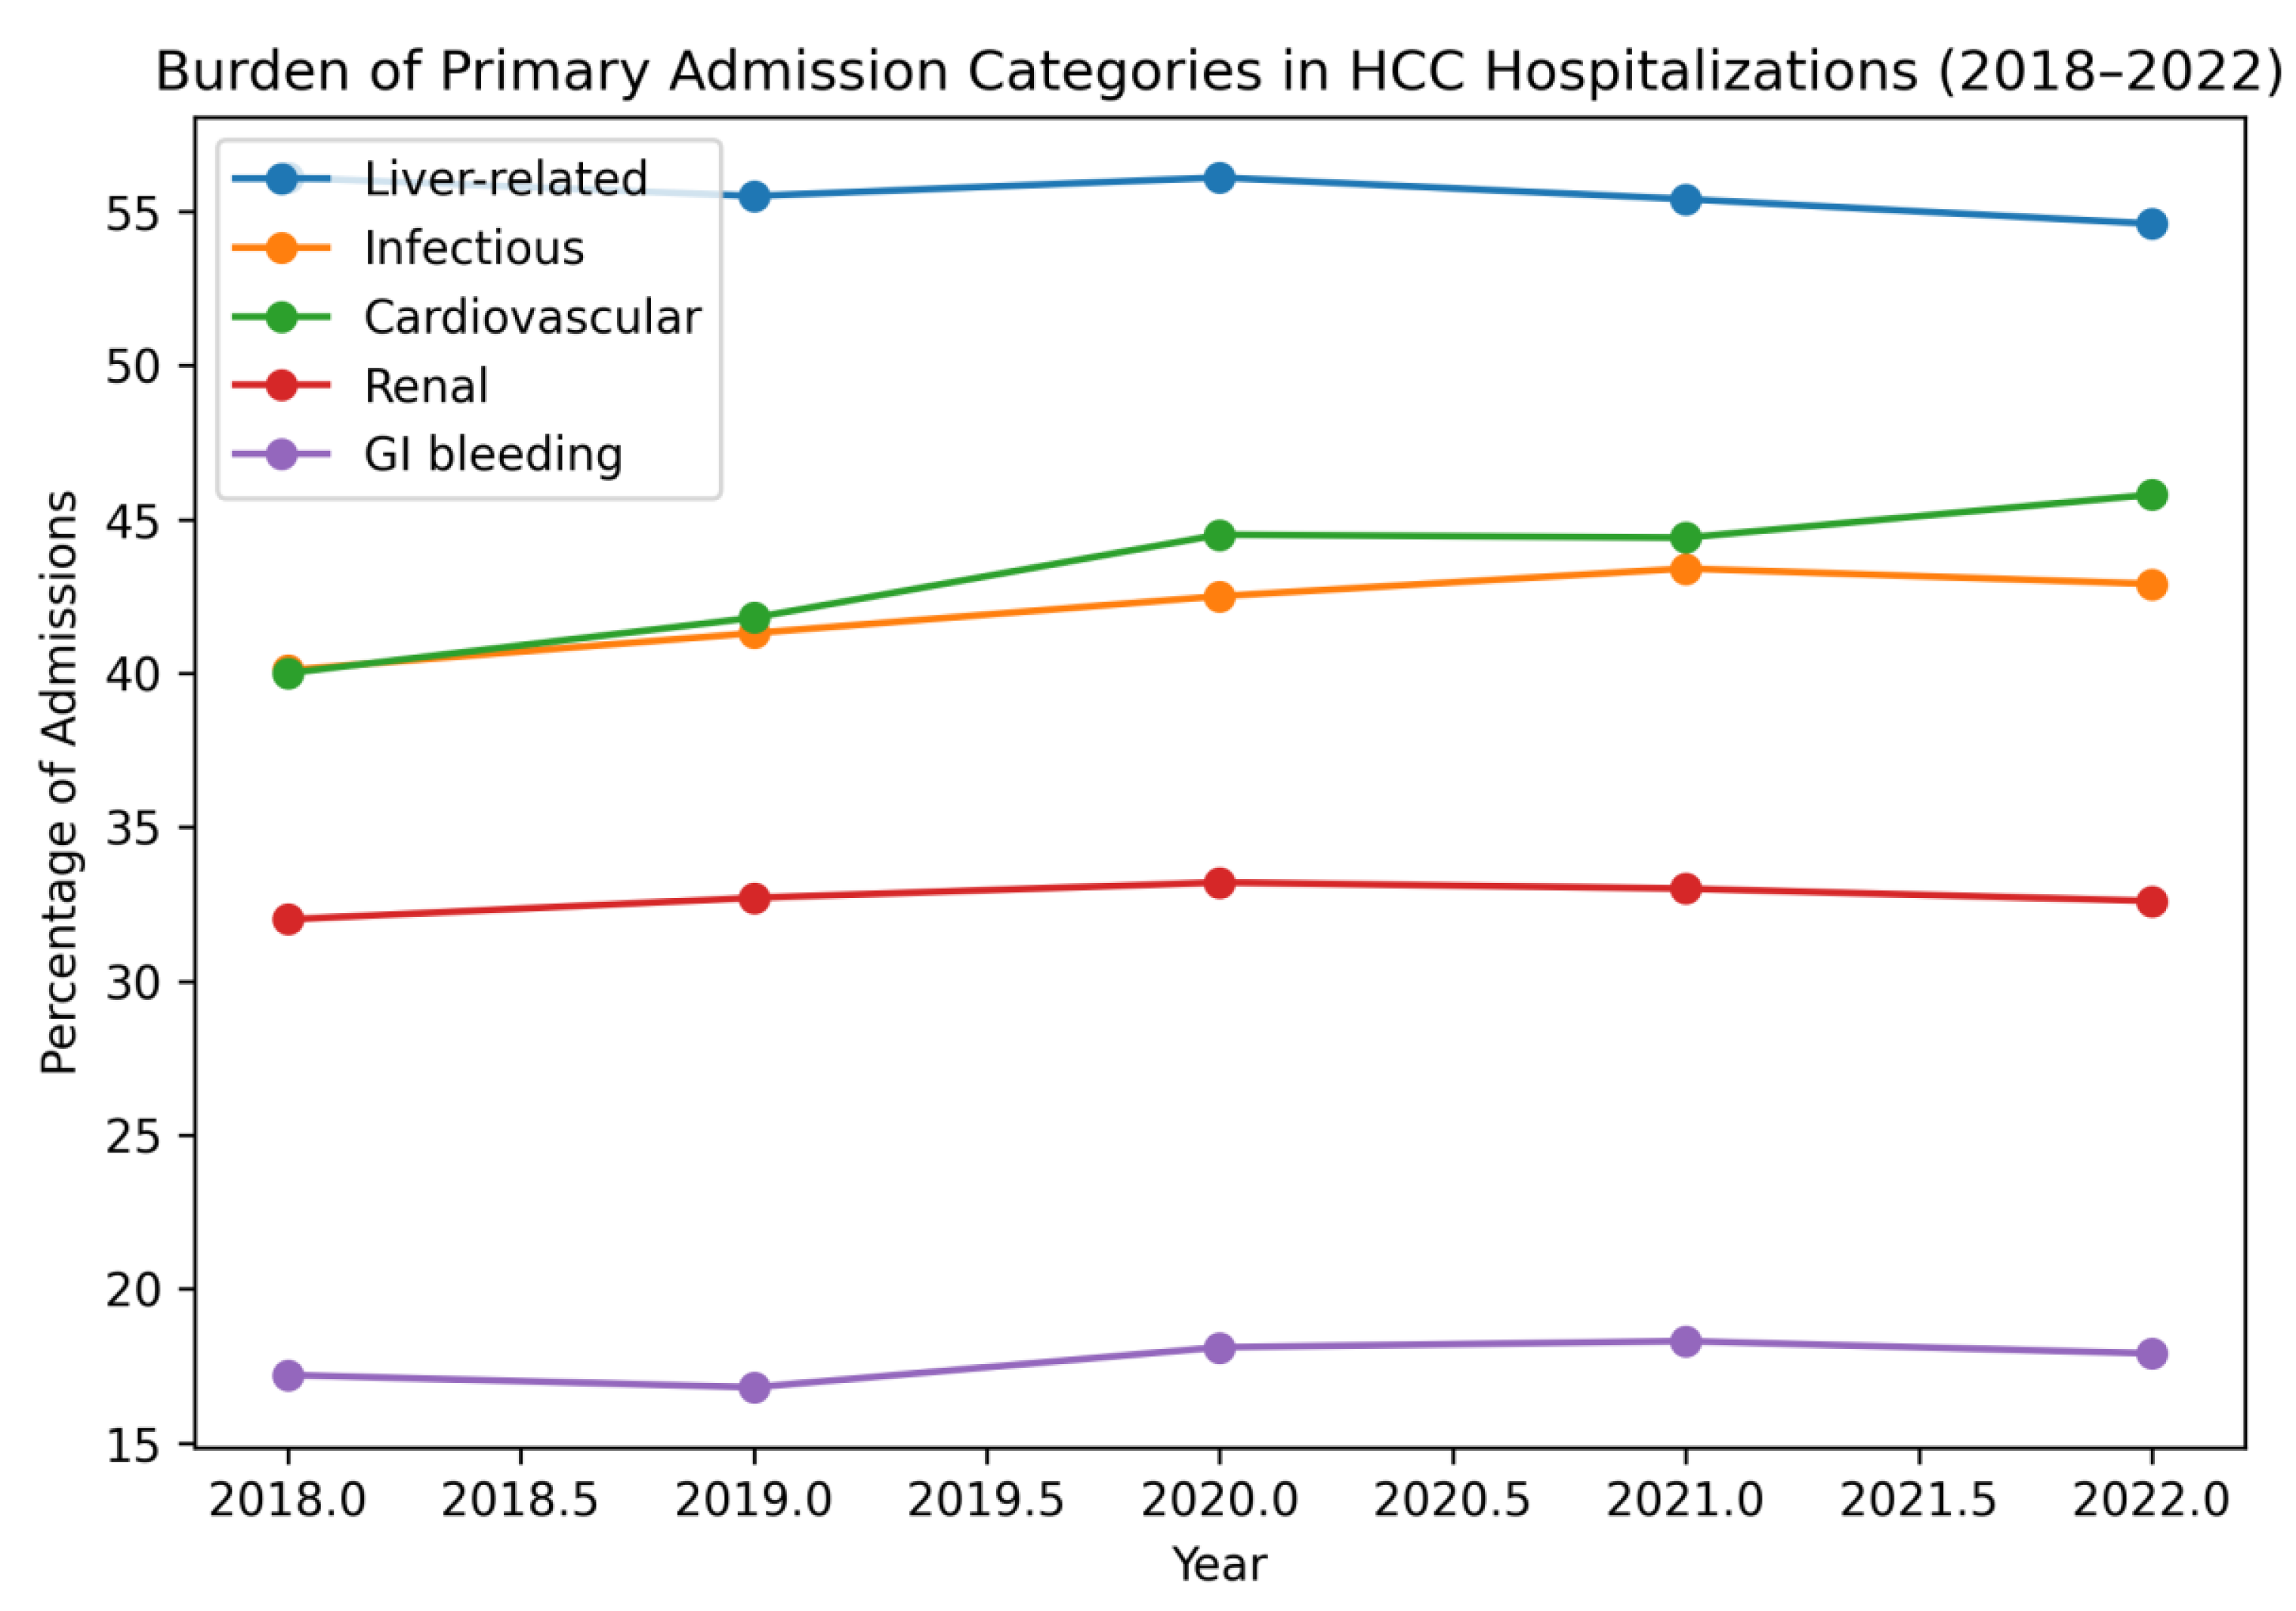
Figure 3.
U.S. Heat Map of Census Region–Averaged Hospitalization Prevalence for Hepatocellular Carcinoma, 2018–2022.
Figure 3.
U.S. Heat Map of Census Region–Averaged Hospitalization Prevalence for Hepatocellular Carcinoma, 2018–2022.
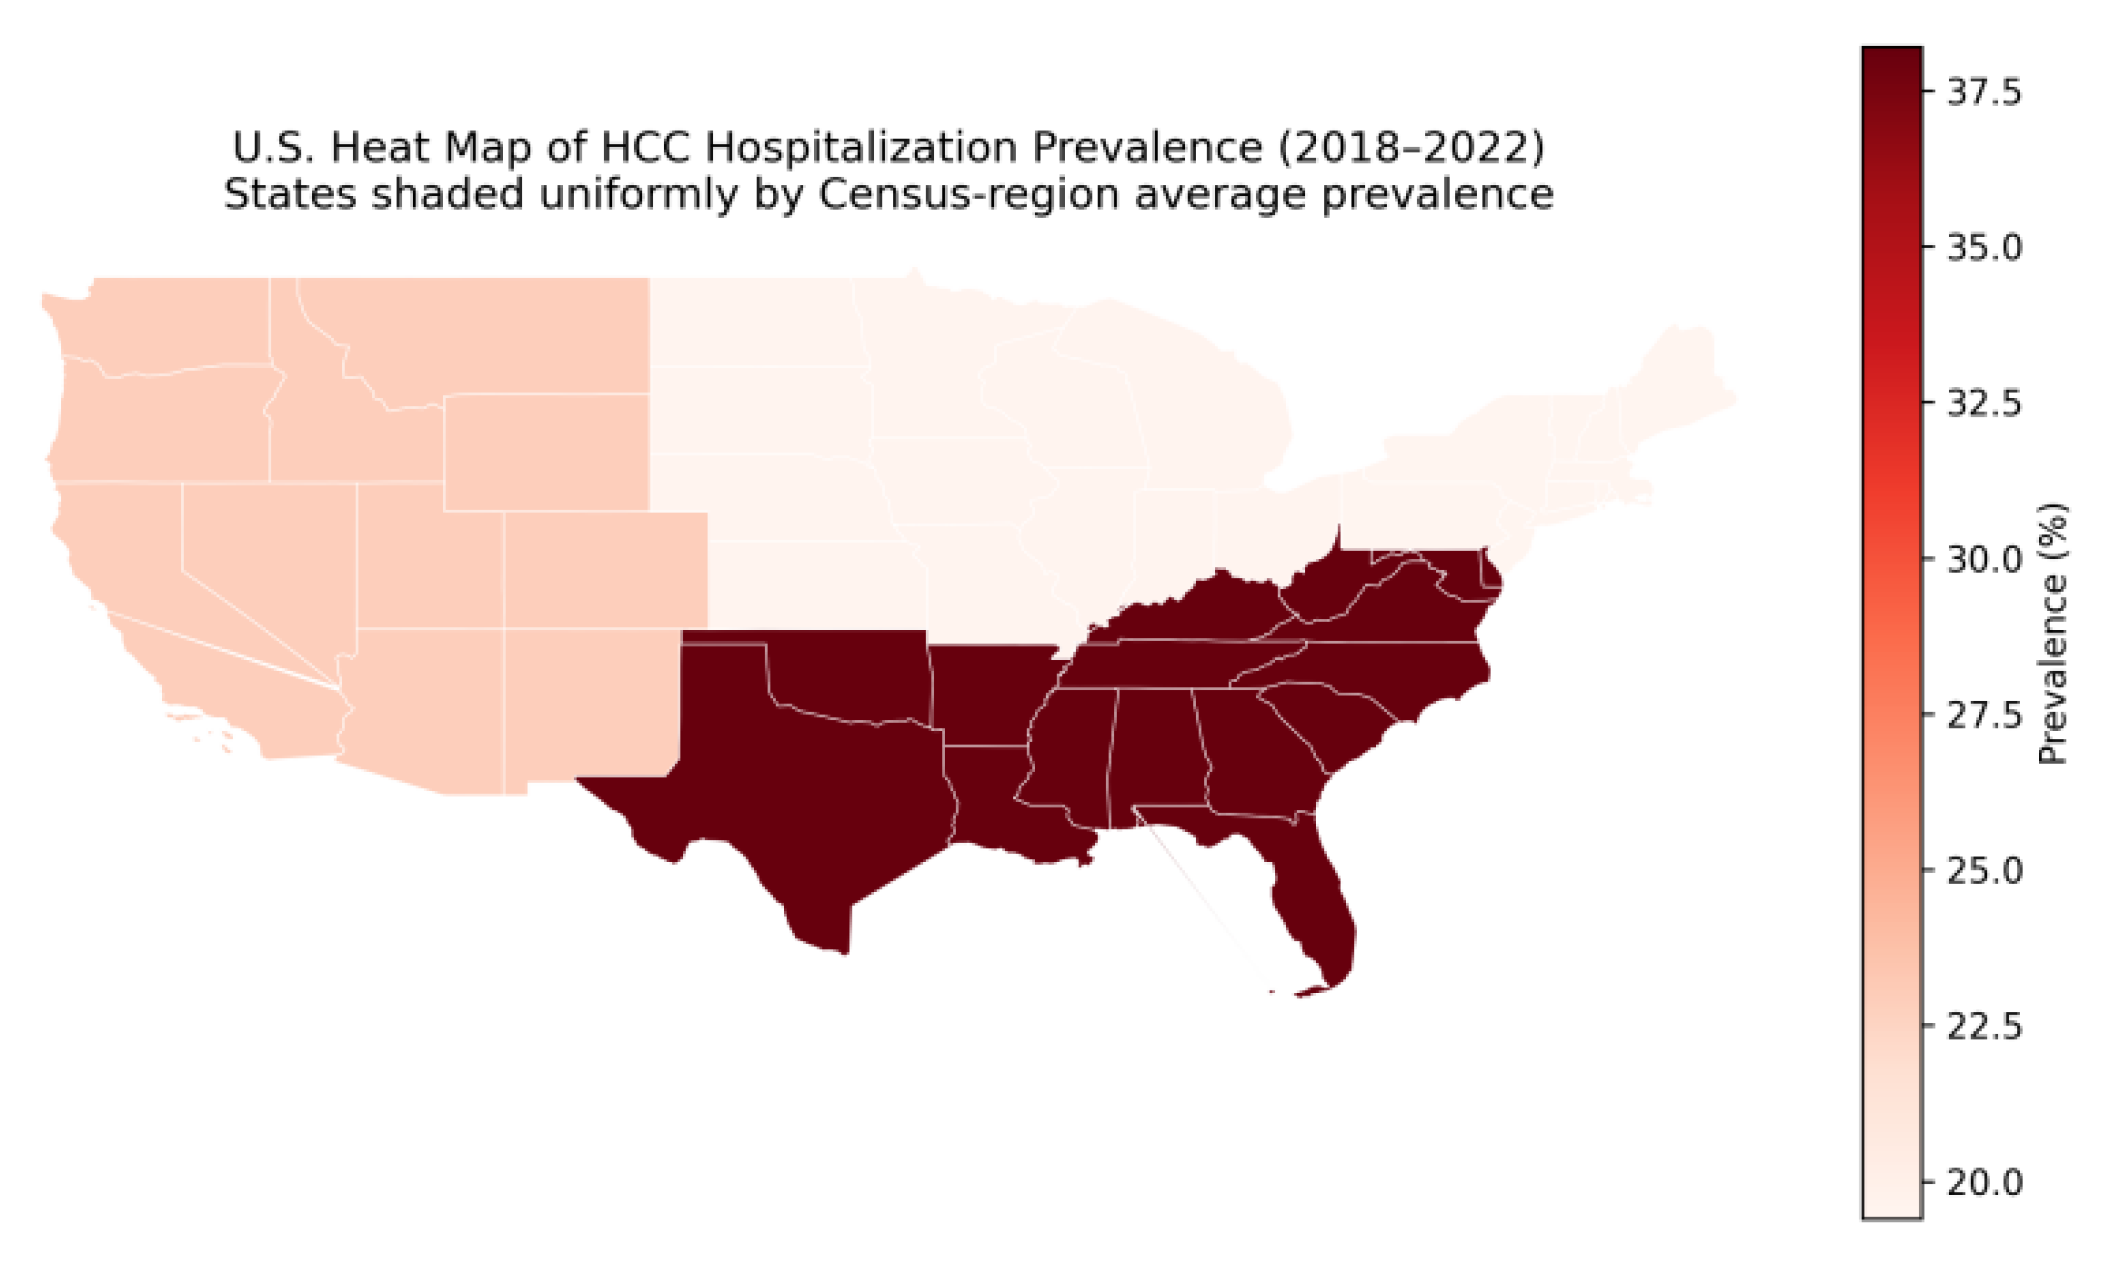

Table 1.
Survey-weighted trends in mortality among patients hospitalized with hepatocellular carcinoma, 2018–2022.
Table 1.
Survey-weighted trends in mortality among patients hospitalized with hepatocellular carcinoma, 2018–2022.
| Year | Mortality (%) | Standard Error | 95% Confidence Interval | p-value |
|---|---|---|---|---|
| 2018 | 8.82% | 0.002144 | 0.08399 – 0.09240 | <0.001 |
| 2019 | 8.98% | 0.002089 | 0.08566 – 0.09385 | <0.001 |
| 2020 | 9.42% | 0.002223 | 0.08981 – 0.09852 | <0.001 |
| 2021 | 9.14% | 0.002135 | 0.08718 – 0.09555 | <0.001 |
| 2022 | 9.23% | 0.002136 | 0.08812 – 0.09650 | <0.001 |
Table 2.
Survey-weighted temporal trends in comorbidities (percentages) among hospitalized patients with hepatocellular carcinoma, 2018–2022.
Table 2.
Survey-weighted temporal trends in comorbidities (percentages) among hospitalized patients with hepatocellular carcinoma, 2018–2022.
| Comorbidity Burden | 2018 | 2019 | 2020 | 2021 | 2022 |
|---|---|---|---|---|---|
| Cirrhosis | 45.90% | 45.36% | 45.94% | 45.15% | 44.02% |
| Alcohol use disorder | 20.18% | 19.26% | 19.38% | 19.47% | 18.15% |
| Viral hepatitis (HBV/HAV/HAE) | 30.20% | 27.89% | 25.43% | 23.32% | 20.73% |
| HCV | 26.47% | 24.34% | 21.79% | 19.58% | 17.09% |
| MASLD | 6.640% | 7.370% | 7.610% | 8.150% | 8.740% |
| Diabetes mellitus | 35.95% | 36.74% | 36.29% | 37.72% | 38.89% |
| Hypertension | 60.31% | 62.15% | 62.35% | 63.55% | 63.90% |
| Obesity | 10.56% | 11.30% | 12.25% | 12.48% | 13.69% |
| Chronic kidney disease (CKD) | 18.05% | 19.46% | 19.96% | 20.06% | 20.01% |
| Congestive heart failure (CHF) | 12.01% | 13.25% | 14.07% | 14.53% | 15.49% |
| Coronary artery disease (CAD) | 18.40% | 19.50% | 20.03% | 19.96% | 19.91% |
| Dyslipidemia | 26.42% | 28.68% | 30.30% | 32.81% | 34.36% |
| Morbid obesity | 3.44% | 3.66% | 3.76% | 3.89% | 4.48% |
Values are presented as survey-weighted percentages (%).
Table 3.
Survey-weighted prevalence (percentages) of major admission drivers among hospitalizations involving hepatocellular carcinoma, 2018–2022.
Table 3.
Survey-weighted prevalence (percentages) of major admission drivers among hospitalizations involving hepatocellular carcinoma, 2018–2022.
| Year | Liver-Related (%) | Infectious (%) | Cardiovascular (%) | Renal (%) | GI Bleeding (%) |
|---|---|---|---|---|---|
| 2018 | 56.10% | 40.10% | 40.00% | 32.00% | 17.20% |
| 2019 | 55.50% | 41.30% | 41.80% | 32.70% | 16.80% |
| 2020 | 56.10% | 42.50% | 44.50% | 33.20% | 18.10% |
| 2021 | 55.40% | 43.40% | 44.40% | 33.00% | 18.30% |
| 2022 | 54.60% | 42.90% | 45.80% | 32.60% | 17.90% |
Values represent survey-weighted percentages (%). Admission categories are not mutually exclusive.
Table 4.
Adjusted predictors of mortality among patients hospitalized with hepatocellular carcinoma in the United States, 2018–2022.
Table 4.
Adjusted predictors of mortality among patients hospitalized with hepatocellular carcinoma in the United States, 2018–2022.
| Predictors of In-Hospital Mortality, Adjusted Odds Ratios (aOR) |
2018 (aOR) |
2019 (aOR) |
2020 (aOR) |
2021 (aOR) |
2022 (aOR) |
|---|---|---|---|---|---|
| Demographics | |||||
| Age (per year) | 1.018 | 1.021 | 1.025 | 1.017 | 1.022 |
| Female Sex | 0.838 | 0.978 | 0.749 | 0.957 | 0.823 |
| Race/Ethnicity | |||||
| African American | 1.300 | 1.462 | 1.393 | 1.117 | 1.473 |
| Hispanic | 0.941 | 0.870 | 0.880 | 1.040 | 0.849 |
| Asian / Pacific Islander | 1.232 | 1.065 | 0.814 | 1.295 | 0.993 |
| Native American | 1.062 | 1.803 | 1.178 | 1.247 | 1.310 |
| Other Race | 1.256 | 1.332 | 1.327 | 1.162 | 0.968 |
| Insurance/ Socioeconomics | |||||
| Medicaid | 1.202 | 1.589 | 1.39 | 1.204 | 1.096 |
| Private Insurance | 1.377 | 1.497 | 1.306 | 1.267 | 1.228 |
| Self-pay | 1.637 | 2.242 | 2.134 | 1.488 | 1.397 |
| Other Payer | 1.033 | 2.205 | 0.733 | 0.378 | 1.758 |
| Liver Disease | |||||
| Liver Failure | 2.747 | 2.677 | 2.513 | 2.641 | 2.519 |
| Hepatic Encephalopathy | 6.852 | 8.542 | 11.126 | 7.397 | 8.871 |
| SBP | 1.364 | 1.05 | 1.118 | 1.187 | 0.963 |
| Ascites | 1.214 | 1.12 | 1.216 | 1.170 | 1.137 |
| Hepatorenal Syndrome | 2.668 | 3.366 | 2.173 | 2.284 | 2.784 |
| Renal and Infection | |||||
| Acute Kidney Injury | 1.448 | 1.373 | 1.480 | 1.311 | 1.309 |
| Sepsis | 3.584 | 3.861 | 4.215 | 4.278 | 3.873 |
| Gastrointestinal bleed Predictor | |||||
| Non-variceal UGI Bleed | 1.755 | 2.120 | 1.743 | 1.831 | 2.103 |
| Variceal UGI Bleed | 1.619 | 1.501 | 1.315 | 1.603 | 1.572 |
| Lower GI Bleed | 1.161 | 1.046 | 1.150 | 1.126 | 0.993 |
| Cardiovascular and Thrombotic | |||||
| Congestive Heart Failure | 1.423 | 1.277 | 1.2 | 1.325 | 1.191 |
| Coronary Artery Disease | 0.995 | 1.155 | 1.207 | 1.034 | 1.149 |
| Stroke | 2.108 | 1.482 | 1.389 | 1.330 | 1.593 |
| Atrial Fibrillation | 1.391 | 1.259 | 1.216 | 1.116 | 1.234 |
| Pulmonary Embolism | 2.367 | 2.206 | 2.424 | 1.666 | 1.675 |
| Acute DVT | 1.267 | 1.038 | 0.937 | 1.109 | 1.313 |
| Portal Vein Thrombosis | 1.451 | 1.12 | 0.963 | 1.006 | 1.215 |
| Metabolic | |||||
| MASLD | 0.700 | 0.734 | 0.666 | 0.689 | 0.800 |
| Obese | 1.830 | 1.565 | 1.061 | 0.691 | 0.810 |
| Morbidly Obese | 1.353 | 1.298 | 1.398 | 1.515 | 1.234 |
| Hospital Characteristics | |||||
| Bed Size – Medium | 0.959 | 0.937 | 0.840 | 0.953 | 1.087 |
| Bed Size – Large | 0.821 | 0.751 | 0.816 | 0.800 | 0.957 |
| Urban Non -Teaching | 0.527 | 0.532 | 0.889 | 0.728 | 0.724 |
| Urban Teaching | 0.471 | 0.513 | 0.732 | 0.566 | 0.694 |
| Midwest | 0.917 | 0.926 | 0.698 | 0.831 | 0.716 |
| South | 0.800 | 0.790 | 0.741 | 0.666 | 0.731 |
| West | 0.981 | 0.923 | 0.805 | 0.668 | 0.809 |
Values represent adjusted odds ratios (aORs) from survey-weighted multivariable logistic regression.
Table 5.
Survey-weighted length of stay and total hospital charges across primary admission categories among HCC hospitalizations, 2018–2022.
Table 5.
Survey-weighted length of stay and total hospital charges across primary admission categories among HCC hospitalizations, 2018–2022.
| Length of Stay (days) |
2018 | 2019 | 2020 | 2021 | 2022 |
|---|---|---|---|---|---|
| Liver-related | 6.4 | 6.37 | 6.72 | 6.78 | 7.22 |
| Infectious | 8.6 | 8.36 | 9.49 | 10.25 | 9.55 |
| Cardiovascular | 5.07 | 5.12 | 5.51 | 5.8 | 5.79 |
| Renal | 5.65 | 5.64 | 5.88 | 6.08 | 6.14 |
| GI bleed/Ulcer | 7.32 | 7.46 | 7.86 | 8.28 | 8.32 |
| Other | 3.81 | 3.83 | 3.91 | 4.04 | 4.03 |
| Total Hospital Charges (USD) |
|||||
| Liver-related | $72,333 | $74,943 | $84,814 | $87,957 | $96,701 |
| Infectious | $111,892 | $115,280 | $137,974 | $156,176 | $142,495 |
| Cardiovascular | $65,454 | $69,792 | $77,996 | $84,484 | $87,152 |
| Renal | $63,007 | $66,148 | $72,155 | $76,742 | $79,719 |
| GI bleed/Ulcer | $112,562 | $120,991 | $132,947 | $143,316 | $147,014 |
| Other | $37,334 | $39,721 | $41,914 | $44,849 | $46,815 |
Table 6.
Survey-weighted temporal trends in demographics and socioeconomic characteristics among hospitalized patients with HCC, 2018–2022.
Table 6.
Survey-weighted temporal trends in demographics and socioeconomic characteristics among hospitalized patients with HCC, 2018–2022.
| 2018 | 2019 | 2020 | 2021 | 2022 | |
|---|---|---|---|---|---|
| Demographics | |||||
| Mean age (years) | 64.4 | 65.0 | 65.2 | 65.6 | 65.8 |
| Male | 67.10% | 67.10% | 66.80% | 65.40% | 65.90% |
| Female | 32.90% | 32.90% | 33.20% | 34.60% | 34.10% |
| Race | |||||
| White | 59.40% | 60.00% | 60.80% | 59.90% | 59.90% |
| African American | 13.50% | 13.60% | 13.10% | 13.30% | 12.40% |
| Hispanic | 16.10% | 15.80% | 15.80% | 16.30% | 17.10% |
| Asian / Pacific Islander | 6.30% | 6.50% | 5.90% | 6.50% | 6.40% |
| Native American | 0.90% | 0.80% | 0.80% | 0.90% | 0.90% |
| Other | 3.80% | 3.30% | 3.50% | 3.20% | 3.30% |
| Payer | |||||
| Medicare | 54.00% | 55.60% | 55.90% | 56.40% | 58.00% |
| Medicaid | 17.00% | 15.80% | 15.90% | 15.50% | 14.00% |
| Private | 22.80% | 22.10% | 21.80% | 21.70% | 21.90% |
| Self-pay | 2.70% | 2.80% | 2.60% | 2.70% | 2.30% |
| Other | 0.20% | 0.20% | 0.30% | 0.20% | 0.20% |
| Region | |||||
| Northeast | 19.20% | 19.40% | 19.60% | 19.80% | 19.10% |
| Midwest | 19.70% | 19.60% | 19.50% | 19.30% | 19.30% |
| South | 37.70% | 37.80% | 38.30% | 38.50% | 38.50% |
| West | 23.40% | 23.20% | 22.60% | 22.40% | 23.20% |
| Hospital Characteristics | |||||
| Rural | 4.20% | 4.40% | 4.70% | 4.70% | 4.80% |
| Urban, non-teaching | 14.90% | 13.30% | 13.20% | 13.40% | 12.50% |
| Urban, teaching | 80.90% | 82.30% | 82.10% | 82.00% | 82.70% |
| Bed Size | |||||
| Small | 15.30% | 16.20% | 17.10% | 17.80% | 16.90% |
| Medium | 26.30% | 25.20% | 25.30% | 24.70% | 25.90% |
| Large | 58.40% | 58.60% | 57.60% | 57.50% | 57.20% |
| Income Quartile | |||||
| 1 (lowest) | 29.90% | 30.10% | 29.30% | 29.90% | 28.60% |
| 2 | 25.90% | 24.40% | 26.50% | 24.60% | 24.30% |
| 3 | 23.10% | 24.20% | 23.10% | 23.90% | 24.70% |
| 4 (highest) | 21.20% | 21.30% | 21.00% | 21.60% | 22.40% |
| Admission Day | |||||
| Weekday | 78.40% | 78.70% | 79.10% | 79.50% | 78.20% |
| Weekend | 21.60% | 21.30% | 20.90% | 20.50% | 21.80% |
Values are presented as survey-weighted means or percentages (%), as appropriate.
Table 7.
Survey-weighted percentage of hospitalized patients with hepatocellular carcinoma who underwent endoscopic and hepatobiliary procedures during hospitalization, 2018–2022.
Table 7.
Survey-weighted percentage of hospitalized patients with hepatocellular carcinoma who underwent endoscopic and hepatobiliary procedures during hospitalization, 2018–2022.
| Procedure Type | 2018 | 2019 | 2020 | 2021 | 2022 | p-value |
|---|---|---|---|---|---|---|
| Endoscopic procedures | ||||||
| Diagnostic EGD | 7.3% | 7.23% | 7.33% | 7.8% | 8.14% | <0.01 |
| Interventional EGD | 3.7% | 3.9% | 4.06% | 3.94% | 3.97% | 0.41 |
| Total EGD | 10.2% | 10.37% | 10.59% | 10.92% | 11.23% | <0.01 |
| Total Colonoscopy | 2.58% | 2.52% | 2.54% | 2.63% | 2.91% | 0.08 |
| Total ERCP | 5.59% | 6.04% | 6.34% | 6.36% | 6.47% | <0.01 |
| Hepatobiliary / oncologic procedures | ||||||
| TIPS | 0.25% | 0.26% | 0.24% | 0.17% | 0.20% | 0.48 |
| Liver transplantation | 3.06% | 2.71% | 2.82% | 2.54% | 2.66% | 0.09 |
| Hepatic resection | 8.58% | 8.14% | 8.34% | 8.55% | 8.32% | 0.77 |
Values represent the survey-weighted percentage (%) of hospitalizations in which each procedure was performed.
Table 8.
Adjusted odds ratio predictors of inpatient liver transplantation, hepatic resection, and TIPS among hospitalized patients with hepatocellular carcinoma, 2018–2022.
Table 8.
Adjusted odds ratio predictors of inpatient liver transplantation, hepatic resection, and TIPS among hospitalized patients with hepatocellular carcinoma, 2018–2022.
| Predictor of inpatient liver transplantation | 2018 (aOR) |
2019 (aOR) |
2020 (aOR) |
2021 (aOR) |
2022 (aOR) |
P value |
|---|---|---|---|---|---|---|
| Age (per year) | 0.97 | 0.97 | 0.97 | 0.97 | 0.97 | <0.001 |
| Female sex | 0.92 | 0.95 | 0.88 | 0.93 | 0.90 | 0.18 |
| Race/Ethnicity | ||||||
| African American | 0.42 | 0.38 | 0.41 | 0.60 | 0.58 | <0.001 |
| Hispanic | 1.12 | 1.18 | 1.22 | 1.30 | 1.26 | 0.11 |
| Asian / Pacific Islander | 1.05 | 1.1 | 1.08 | 0.98 | 1.02 | 0.74 |
| Other race | 0.80 | 0.76 | 0.83 | 0.90 | 0.88 | 0.21 |
| Insurance type | ||||||
| Medicaid | 0.55 | 0.48 | 0.52 | 0.56 | 0.71 | <0.001 |
| Private insurance | 1.52 | 1.48 | 1.45 | 1.48 | 1.60 | <0.001 |
| Self-pay | 0.28 | 0.22 | 0.25 | 0.34 | 0.07 | <0.001 |
| Comorbidity | ||||||
| MASLD | 3.87 | 3.2 | 3.45 | 2.26 | 2.86 | <0.001 |
| Chronic hepatitis C | 2.33 | 2.01 | 1.92 | 1.45 | 1.35 | <0.001 |
| Alcohol-associated liver disease | 1.84 | 1.73 | 1.68 | 1.52 | 1.41 | <0.001 |
| Cirrhosis | 3.1 | 3.4 | 3.25 | 2.82 | 3.18 | <0.001 |
| Substance use disorder | 0.28 | 0.31 | 0.29 | 0.25 | 0.4 | <0.001 |
| Hospital Type | ||||||
| Urban teaching hospital | 20.4 | 9.8 | 7.3 | 6.9 | 2.5 | <0.001 |
| Predictor of inpatient Hepatic Resection | ||||||
| Age (per year) | 0.98 | 0.98 | 0.99 | 0.99 | 0.98 | <0.001 |
| MASLD | 1.35 | 1.28 | 1.3 | 1.22 | 1.4 | <0.001 |
| Obesity | 1.48 | 1.44 | 1.31 | 1.5 | 1.35 | <0.001 |
| Dyslipidemia | 1.22 | 1.2 | 1.18 | 1.19 | 1.18 | 0.006 |
| Cirrhosis | 0.6 | 0.58 | 0.62 | 0.62 | 0.55 | <0.001 |
| Chronic kidney disease | 0.72 | 0.75 | 0.78 | 0.74 | 0.65 | <0.001 |
| Urban teaching hospital | 2.35 | 2.28 | 2.15 | 2.21 | 2.29 | <0.001 |
| Predictor of TIPS | ||||||
| Cirrhosis | 18.7 | 16.2 | 14.8 | 16.1 | 16.4 | <0.001 |
Values represent adjusted odds ratios (aORs) for inpatient liver transplantation, hepatic resection, and TIPS placement.
Disclaimer/Publisher’s Note: The statements, opinions and data contained in all publications are solely those of the individual author(s) and contributor(s) and not of MDPI and/or the editor(s). MDPI and/or the editor(s) disclaim responsibility for any injury to people or property resulting from any ideas, methods, instructions or products referred to in the content. |
© 2026 by the authors. Licensee MDPI, Basel, Switzerland. This article is an open access article distributed under the terms and conditions of the Creative Commons Attribution (CC BY) license (http://creativecommons.org/licenses/by/4.0/).
Copyright: This open access article is published under a Creative Commons CC BY 4.0 license, which permit the free download, distribution, and reuse, provided that the author and preprint are cited in any reuse.


