1. Introduction
Chronic kidney disease (CKD) is a severe and highly debilitating condition, characterized by the progressive reduction of renal function, persisting for a minimum of 3 months, by the development of albuminuria and by the presence of kidney structural damage, leading to the necessity of life-sustaining renal replacement therapy (RRT) [
1,
2]. According to the most recent epidemiological surveys, the total number of adult patients with CKD in 2023 was approximately 788 million worldwide, representing about 9.5% of the global population. Moreover, CKD was the 9th leading cause of death around the world, being considered a major global health issue [
3].
Among many essential functions, the kidneys are responsible for the hydroelectrolytic and the acid-base balance of the organism, thus exerting a core function to the maintenance of homeostasis. Human kidneys are composed by approximately 2 million of interdependent filtration units called nephrons. Together, the whole set of nephrons filters blood plasma through their glomeruli and processes the filtered metabolites in the renal tubules, thus promoting the excretion of toxic elements and the controlled reabsorption of ions, electrolytes and water. Renal function is usually evaluated through the glomerular filtration rate (GFR), which results from the multiplication of each single nephron GFR by the total number of nephrons in both kidneys. Therefore, the loss of nephrons, which can be caused by a myriad of different factors, such as: persistent hypertension, imbalanced diabetes, genetic conditions, autoimmune diseases, among others, directly impacts the whole organ performance.
The maladaptive repair of the kidney after an initial renal insult, which promotes the first loss of filtrating units, can be considered the core factor for the development of CKD. Nephron number reduction leads to the insidious overload of remaining units, which develop compensatory hyperfiltration and hypertrophy in order to deal with the entire cardiac output. These changes, along with the hyperactivity of both systemic and intra-renal renin–angiotensin–aldosterone system (RAAS), lead to the development of local inflammation, which progresses to tissue fibrosis and to the loss of even more nephrons, which results in the failure of renal function [
4,
5,
6].
In the last 10 years, some great advances in the treatment of CKD have been seen. Associated with lifestyle changes recommendations, the employment of pharmacological therapies with angiotensin-converting enzyme inhibitors (ACEi), angiotensin receptor blockers (ARB), and, most recently, SGLT2 inhibitors, has shown great efficacy in slowing down CKD progression. However, such strategies are still not able to completely prevent or reverse renal function loss. Most CKD patients may still require supportive RRT later in life [
1].
The lack of a specific treatment to stunt CKD and restore renal function motivates physicians and the scientific community to keep on studying the mechanisms involved with CKD progression, in order to develop new experimental and preclinical strategies for CKD detaining. This highlights the importance of animal-based experimental studies, which serve as the basis for verifying the safety and efficacy of new treatments [
7].
The rat (
Rattus norvegicus) represents one of the most commonly employed species in the development of pre-clinical studies in search for innovative CKD treatments, once its kidney physiology closely resembles human features. Rats for research purpose can be classified as outbreed; obtained through a breeding system with no mating of close relatives, or inbreed; produced from at least 20 consecutive generations of brother-sister mating. The main difference between these two breeding systems is the genetic variance of the produced population. An outbred rat stock is characterized by remarkable diversity among individuals, due to the highly variable genetic background, while an inbreed rat strain is composed of genetically uniform animals. Wistar and Sprague-Dawley strains are among the most popular outbreed rats used experimentally for renal pathophysiology research worldwide, while Lewis and Fischer inbreed stocks are frankly used in experimental renal transplantation studies [
8,
9,
10,
11,
12].
Human CKD can be mimicked in rats through different experimental methodologies, among which, the sub-total nephrectomy model, achieved through the 5/6 renal ablation, stands out. There are at least two different ways to perform this model, but it concisely consists in the surgical removal of the right kidney, combined with the reduction of left kidney mass in 2/3, thus promoting a sudden reduction in the functioning nephron number, leading to the development of rapidly progressive CKD. The 5/6 renal ablation model, so-called remnant model or simply “Nx”, is widely known to closely resemble the clinical settings observed in human nephropathy, as the development of systemic hypertension, albuminuria, uremia and renal structural changes, such as glomerulosclerosis, renal interstitial fibrosis and inflammation [
13,
14,
15,
16,
17].
Although compared to other rodents, rats are the species of choice when applying the Nx CKD model, until the present moment, there is no consensus about the most appropriate rat strain for this purpose. Based on the exposed, the aim of the present study was to compare the severity and the rhythm of nephropathy progression in 3 different rat strains: Wistar, Lewis and Fischer, submitted to the 5/6 renal ablation model of CKD.
2. Material and Methods
2.1. Animals and CKD Model
A total number of 81 adult male rats of the species Rattus norvegicus: 22 Wistar outbreed animals, 29 Lewis and 30 Fischer 344 inbred rats were purchased from established colonies of the Central Animal Facility of the University of São Paulo. These animals were housed in appropriate cages and kept in the local animal facility of the Renal Division of the University of São Paulo School of Medicine, under controlled conditions of temperature, relative air humidity and light/dark 12h/12h cycle. Rats had free access to drinking water and conventional rodent food (Nuvital, Brazil), throughout the study period, and were included in the experimental groups when the mean body weight of 220~280g were achieved. All experiments described in this study were analyzed and approved by the ethics committee for the use of experimental animals of Faculty of Medicine of the University of São Paulo (CEUA FMUSP protocols 1018/2018 and 2003-2023).
CKD was induced in 12 Wistar, 14 Lewis and 17 Fischer animals, through the 5/6 renal ablation model (Nx), in a single step. For this purpose, rats were anesthetized by inhalation with isoflurane (BioChimico, Brazil) and placed on heated surgical tables, where a physiological temperature of 37ºC was maintained during the whole procedure. After anesthetizing the rats, sensitivity tests were performed and the animals were submitted to ventral trichotomy and median laparotomy under aseptic conditions. The left kidney was carefully exposed and hydrated with sterile saline solution. Under a final 16x magnification, using an appropriate microsurgery microscope, we performed the ligation of 2 of the 3 branches of the renal artery of the left kidney, with silk 6.0 needled suture, thus promoting the infarction of 2/3 of the organ, immediately detectable by the purplish color assumed by the whole posterior side of the kidney and by the lower half of the anterior side of it. The left kidney was replaced into the abdominal cavity, and the right kidney was exposed. Using a curved Kelly artery forceps, we isolated the right kidney artery and vein and permanently ligated the vascular branch using cotton 3.0 sterile suture, to avoid intraoperative bleeding. The left kidney was then removed and discarded, resulting in the total reduction of 5/6 of the rat renal mass. The remaining 10, 15 and 13 animals of each rat strain, respectively, were used as controls. These animals were also anesthetized and subjected to a median laparotomy, however, with no ablation nor removal of renal mass (Wistar Sham, Lewis Sham and Fischer Sham). Immediately after surgery, all rats received intramuscular (IM) injections of prophylactic antibiotic (5 mg/kg Baytril, Bayer) and subcutaneous (SC) injections of analgesic (10 mg/kg Tramadol), and were kept in heated cages until they fully recovered from anesthesia. SC analgesic administration was repeated every 12 hours for 2 more days.
2.2. Experimental Protocol and Sample Collection
Animals had their body weight (BW, g) monitored weekly, and their systolic blood pressure (SBP, mmHg) verified in 3 different moments of the protocol: In the beginning of the study, before CKD induction (0 days),15 and 30 days after CKD induction. SBP was assessed through the caudal blood pressure method, using the automated optoelectronic device BP-2000 (Visitech Systems, Apex, NC). At the same time-points (before CKD induction, 15 and 30 days after CKD induction), rats were housed for 24h in individual metabolic cages for urine samples collection. The urinary protein excretion rate (UPE, mg/24h) was analyzed through a colorimetric method, employing a commercially available kit (SENSIPROT Kit #36, Labtest Brasil), while the urinary albumin excretion rate (UAE, mg/24h) was assessed by radial immunodiffusion using a specific anti-rat albumin antibody (anti-rat albumin MP-BIOMEDICALS #55711).
Rats were followed for a total period of 30 days after CKD induction, when they were euthanized for blood and renal tissue samples collection. For this purpose, the animals were once more anesthetized with isoflurane, underwent midline laparotomy, and an abdominal aortic puncture for total blood collection, resulting in euthanasia by exsanguination. The blood obtained during euthanasia was centrifuged for 15 minutes at 2000 RPM at room temperature to obtain serum samples, from which we measured urea (SUr, mg/dL) and creatinine concentrations (SCr mg/dL), through a colorimetric technique, using commercial kits (UREA CE Labtest Kit #27 / CREATININE Labtest Kit #35). In order to calculate the creatinine clearance of animals, we employed the same colorimetric kit used for serum dosages and measured the creatinine concentration in the urine samples of animals after 30 days of CKD induction. Collected values were applied to the following formula: [(UCr x Urinary Volume) / SCr] / 1440, thus obtaining the rate in mg/min. These values were than divided by the body surface area of each respective animal, obtained by multiplying the individual BW by the Meeh constant (k) of the rat (9.83), and final creatinine clearance (CrCl) was presented as mg/min/m
2 [
18].
After confirming the euthanasia of experimental animals, the left kidneys were collected, weighed and transversely sectioned into two equal portions. The first half was subjected to Duboscq-Brazil prefixation for 30 minutes, followed by permanent fixation in buffered formaldehyde (pH 7.4) for 48 hours. The other half of the left kidney was fractionated into small portions, stored in cryogenic tubes, and quickly frozen in liquid nitrogen. These samples were stored at -80 °C and used for gene expression analyses. The right kidneys of Sham animals were collected, weighed, sectioned in sagittal direction and formalin-fixed, for further use in the total counting of nephron number in each rat strain.
2.3. Histological and Immunohistochemical Analyses
Formaldehyde-fixed left kidney samples were processed for dehydration, clearing, and paraffin impregnation. Samples were then included in paraffin blocks which were used to produce slides with 5 µm histological sections, employed for histological and immunohistochemical analysis.
The periodic acid-Schiff (PAS) histological staining was used to evaluate the percentage of glomerulosclerosis in the renal slides of experimental animals, evidenced in magenta. At least 50 different glomeruli for each experimental animal were analyzed by an experienced pathologist, under a final 400x magnification. Based on the assessment of each glomerulus, as sclerotic or non-sclerotic, we calculated the percentage of affected glomeruli.
To analyze the renal interstitial fibrosis, we used Masson’s Trichrome staining, which stains collagen deposits in blue. To quantify the percentage of affected area, we analyzed 25 microscopic fields of each experimental animal, at a final 200x magnification, using a grid of equidistant points. Additionally, in order to complement the analysis of interstitial fibrosis, immunohistochemistry for α-smooth muscle actin (α-SMA) was performed in the renal samples of experimental animals, using a specific monoclonal anti-α-SMA antibody (Sigma #A2547). We assessed the percentage of tubulointerstitial area occupied by this protein as an indirect parameter for the presence of myofibroblasts, through the same point-counting methodology used to assess interstitial fibrosis by Masson’s staining.
Renal inflammation was assessed by both the interstitial macrophage infiltration and the increase in the interstitial cell proliferating rate, employing immunohistochemistry, with the specific antibodies anti-CD68 (Serotec, #MCA341R) and anti-PCNA (Proliferating Cell Nuclear Antigen, Dako, #M0879), respectively. Positive cells were counted in 25 microscopic fields of each experimental animal, at a final 400x magnification and results were expressed as cells/mm2 of renal tissue.
2.4. Total Nephron Number and Glomerular Measurements
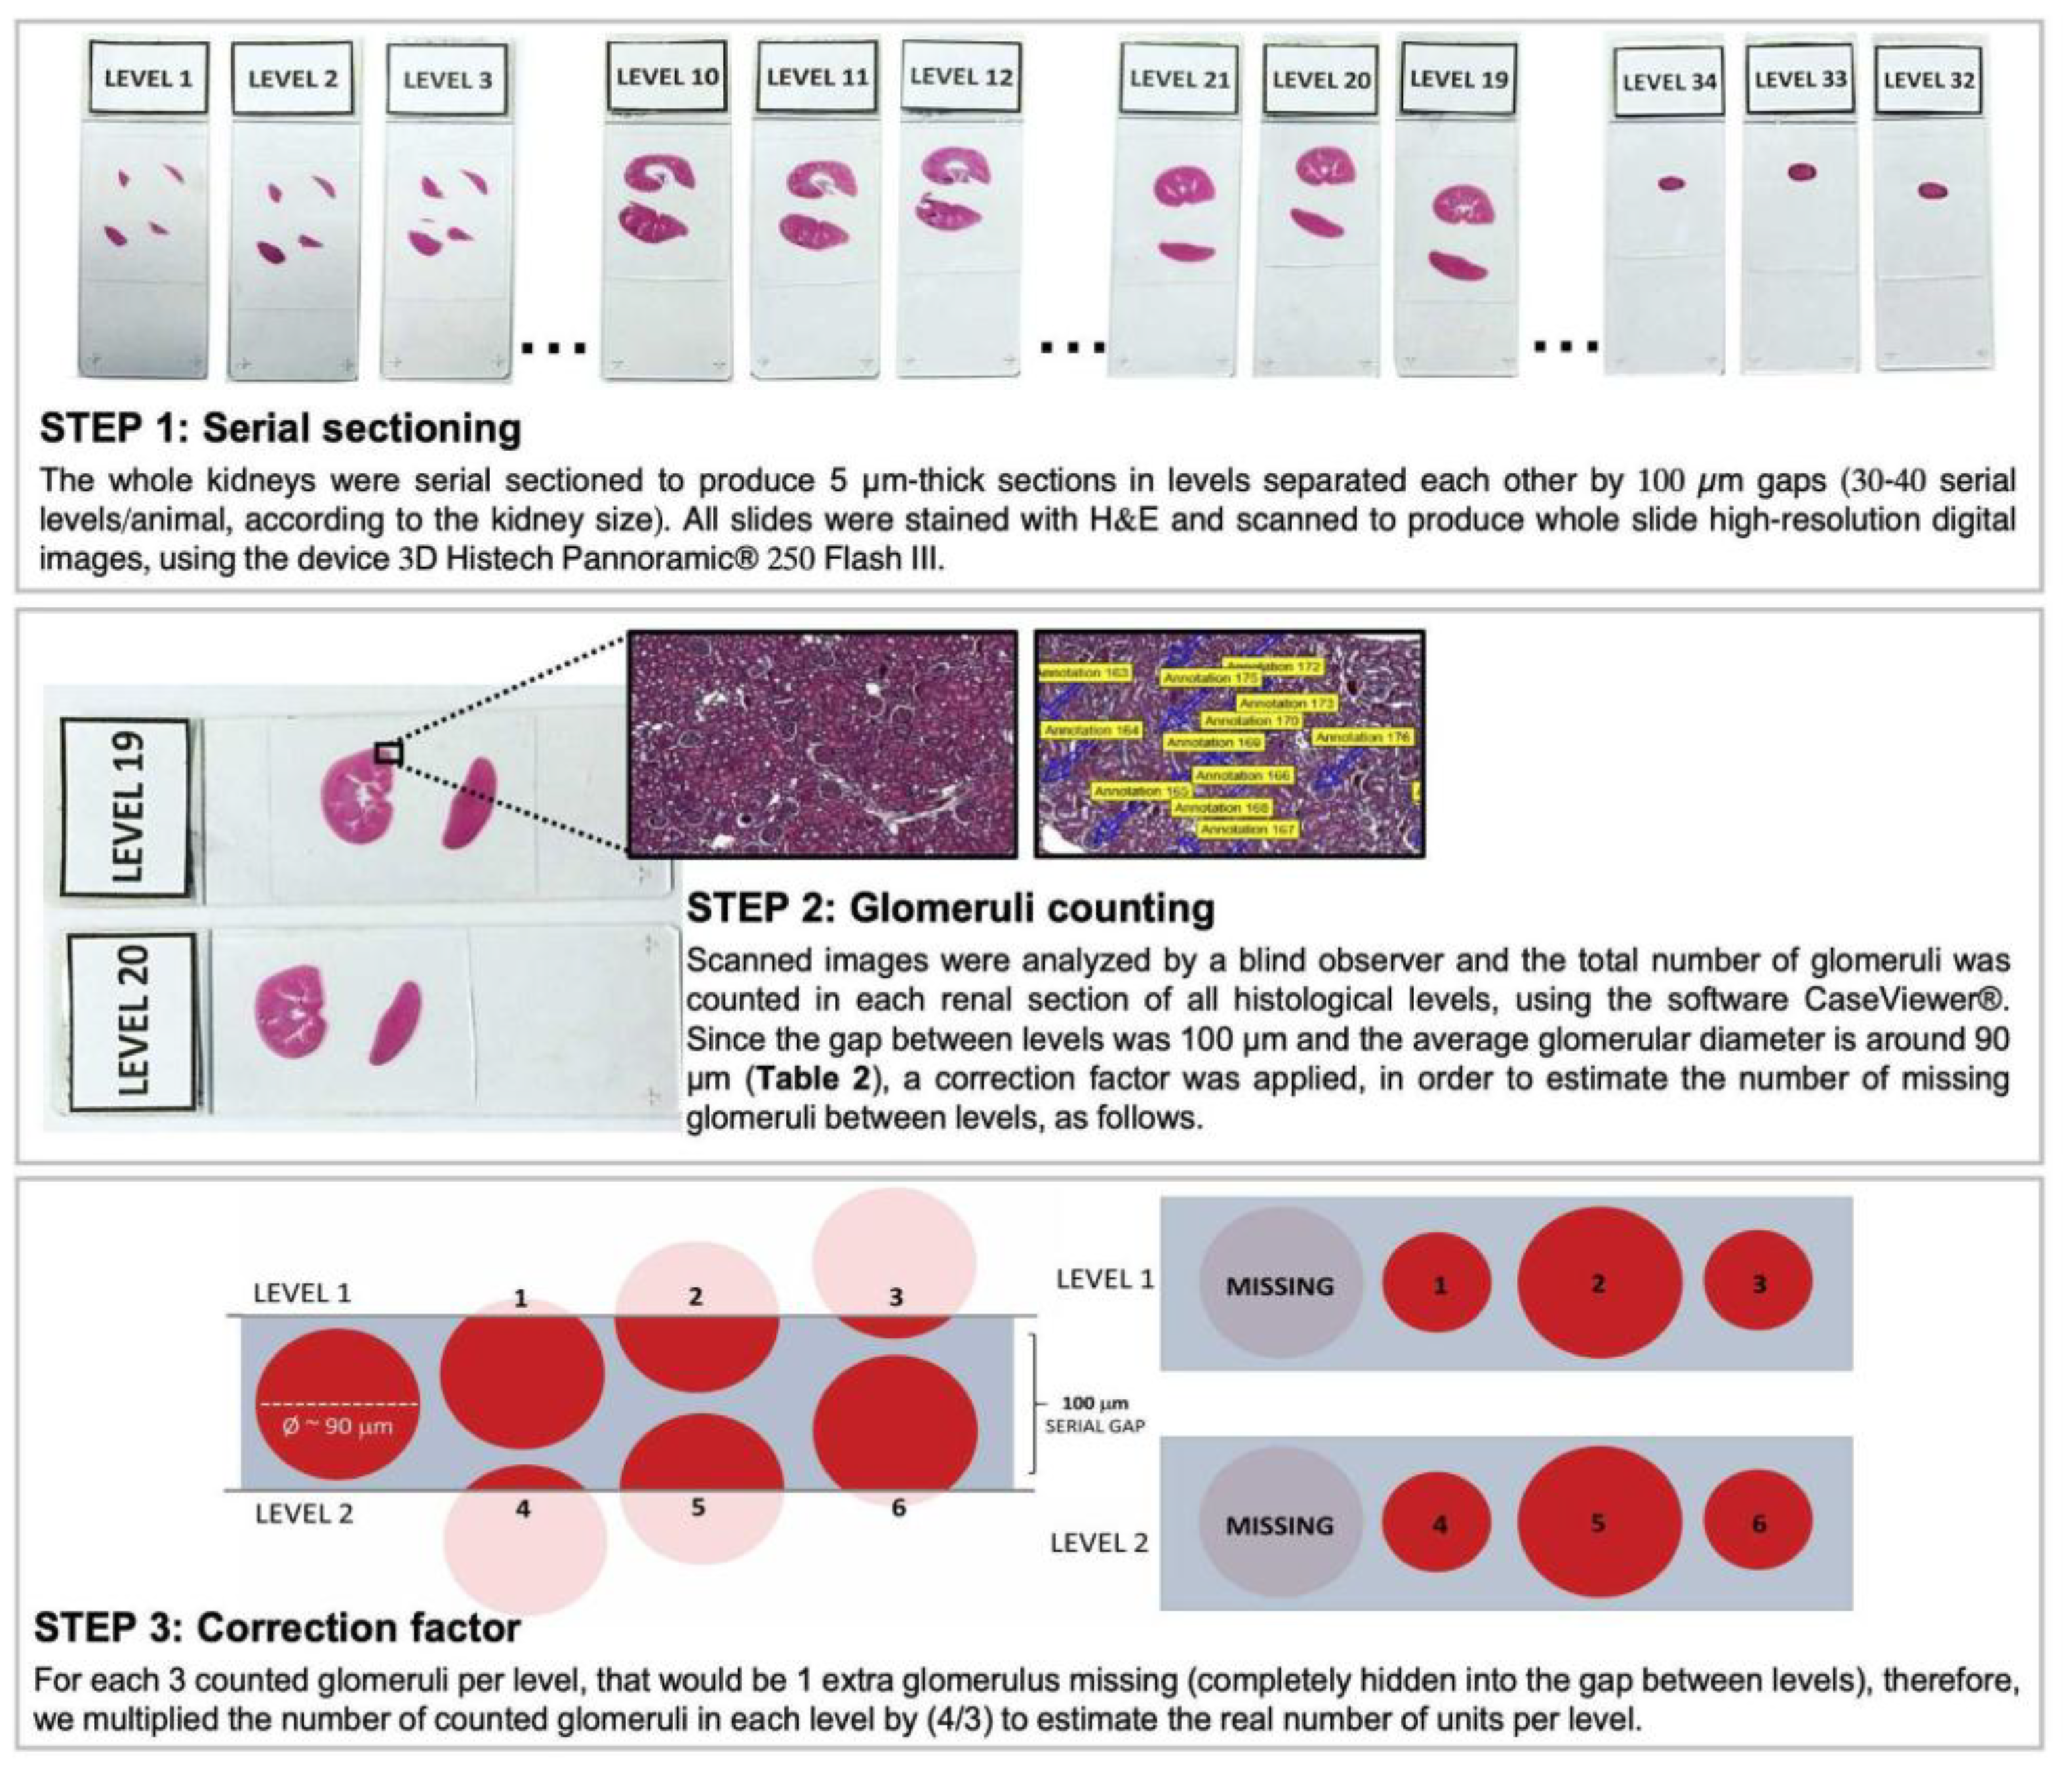
The right kidneys of Sham animals from the different rat strains were included in histological paraffin blocks with the sectioned portion facing down and were submitted to serial sectioning to produce slides with 5 µm sections of renal tissue, every 100 µm of distance, until the tissue was completely consumed. Approximately 30-40 “levels” of histological sections were obtained from each experimental animal. Renal slides were stained with hematoxylin and eosin (H&E) and scanned with the 3D Histech Pannoramic® 250 Flash III equipment. All the obtained images were evaluated and the total number of glomeruli was counted, to achieve the total Nephron number (Nn) of each rat strain, as illustrated in
Figure 1. Moreover, for more precise comparisons between the different strains, we divided the Nn by the adult rat body weight (ARW), in grams, which is the mean body weight of each rat strain at 10 weeks of age.
Additionally, renal slides from the right kidneys of Sham animals were also subjected to PAS staining, photographed, and used to evaluate the glomerular size of each studied rat strain. Using the free software ImageJ, we measured both the glomerular radius (r) and the glomerular area of 25 glomeruli from each studied animal, under a final 400x magnification. Using the radius information, we obtained the glomerular volume (V) in µm³, applying the following formula V = (4/3) x π x r³. Using the measurements obtained from the glomerular area analysis, and assuming the total number of nephrons in each kidney is equal, we calculated the total filtration area for each lineage, then calculated the proportion by the adult animal’s weight in µm²/g.
2.5. Statistical Analysis
The results of this study were presented as mean (M) ± standard error (SE) and N. Data were analyzed by comparing groups using Student’s t-test. P-values under 0.05 were considered significant. We used one-way ANOVA to compare the nephron number and the glomerular parameters between Sham animals from the 3 different rat strains. Calculations were performed using GraphPad Prism® software, version 8.0.
3. Results
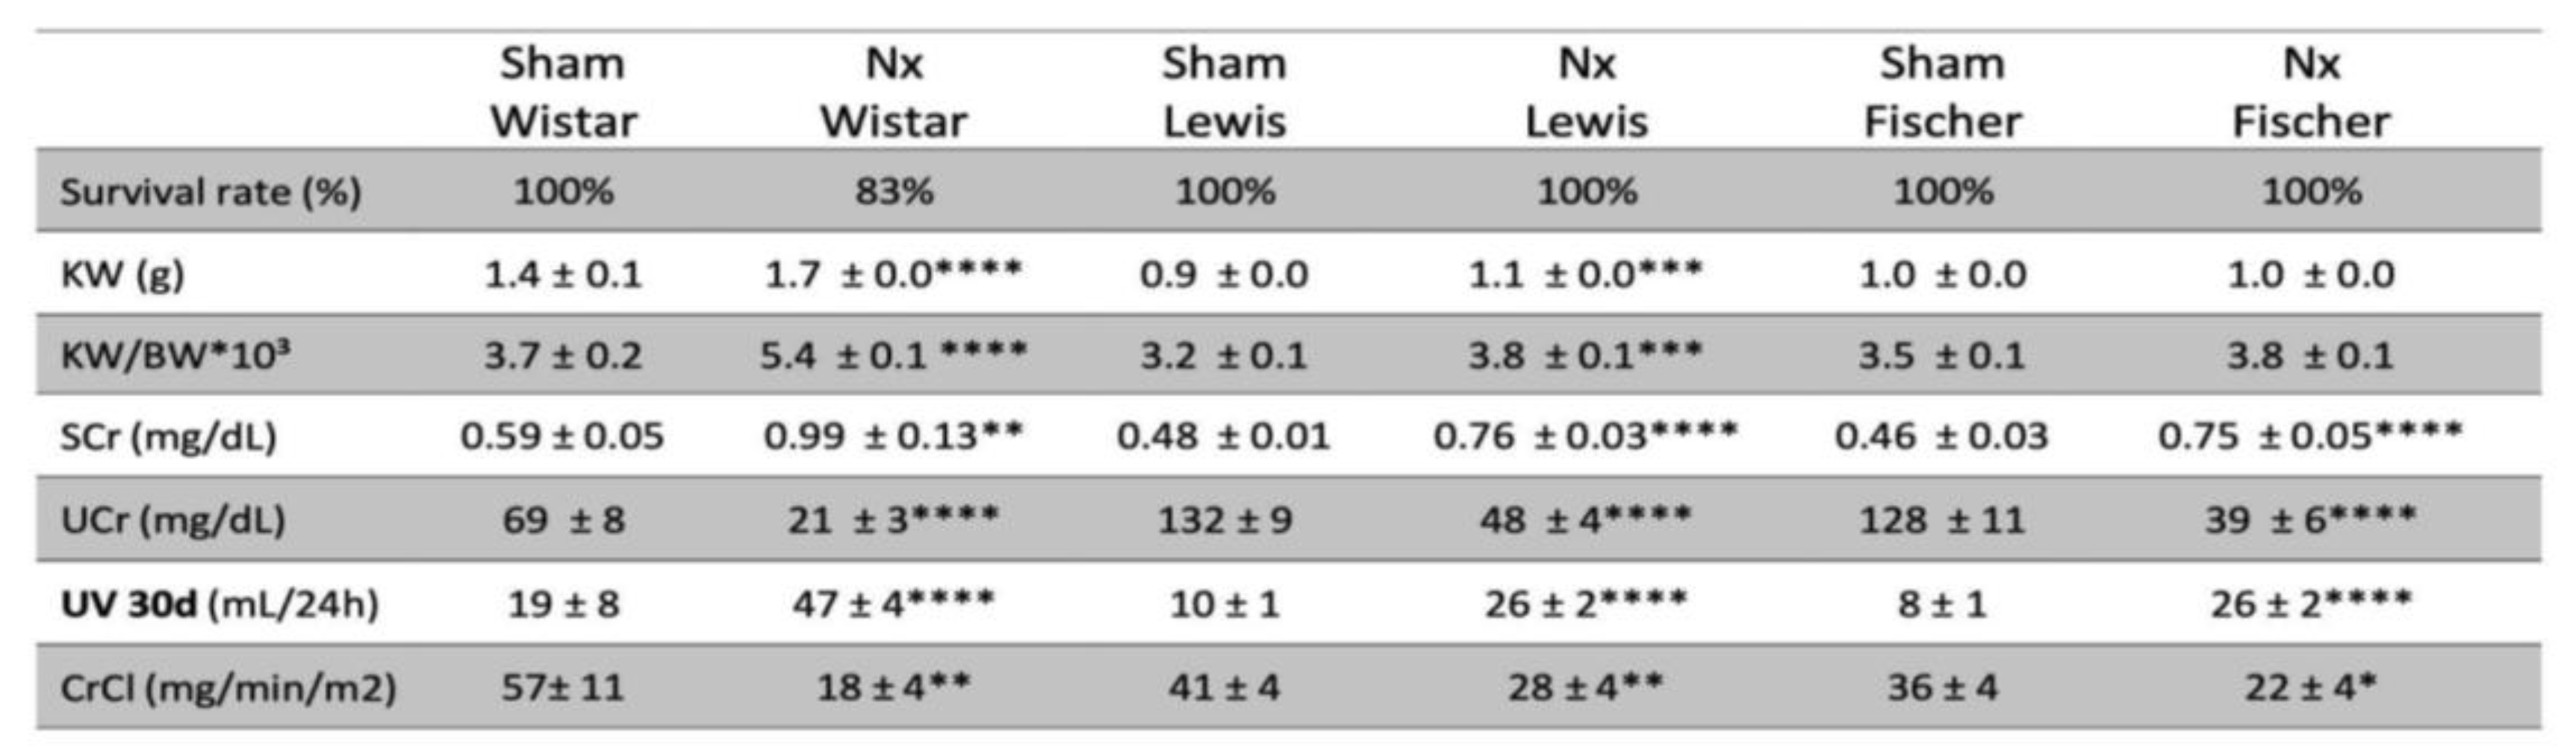
CKD was induced in rats through the surgical 5/6 renal ablation model, which is commonly associated to a mortality rate of around 20% of the Nx animals, in the first 30 days of follow-up. Corroborating the literature, our survival results presented in Table 1 show that Wistar rats submitted to the Nx model presented 17% of mortality during the study time. However, surprisingly, there were no deaths of both Lewis or Fischer Nx rats during the entire follow-up period.
Table 1. Survival rate during the experimental period (%), Kidney weight (KW; g), Kidney weight ratio: kidney weight divided by the individual body weight and multiplied by 103 (KW/BW*103), Serum creatinine concentration (SCr; mg/dL), Urinary creatinine concentration (Ucr; mg/dL), Urinary volume (UV; mL/24h) and Creatinine clearance (CrCl; mg/min/m2). *:p<0.05, **:p<0.01, ***:p<0.001, and ****:p<0.0001 vs. respective Sham.
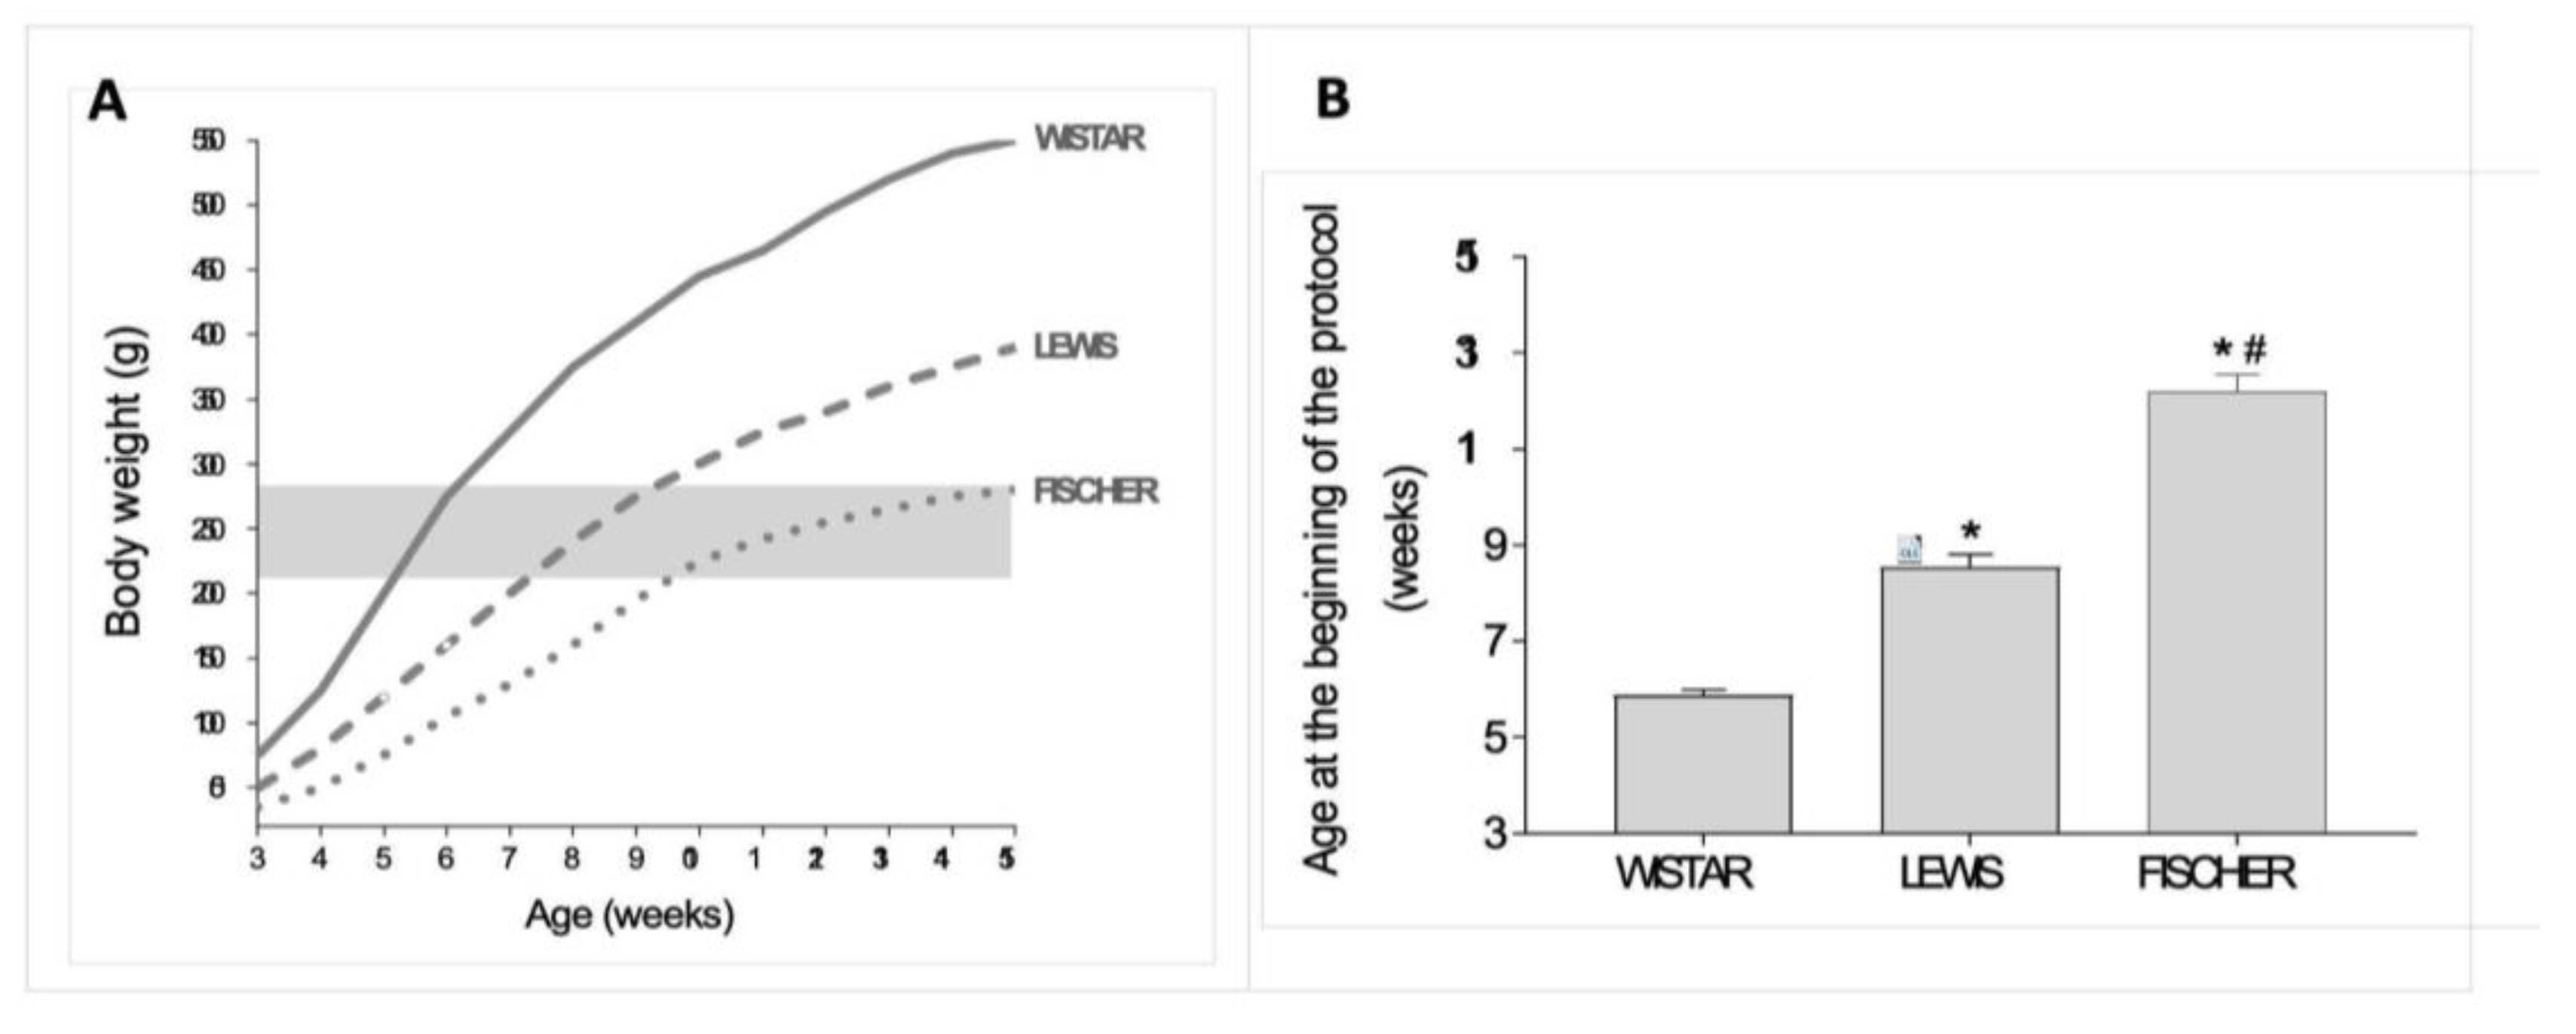
In this study, 5/6 renal ablation was induced in rats weighing between 220 and 280 g, regardless of their age. Since the 3 rat strains employed in the present study are known to present different growth rhythms, we used data from our Sham groups to build up an illustrative graph of the relation between body weight (BW) and age, in weeks, in each one of them. This data is presented in
Figure 2A. As we can see, Wistar rats are eligible for 5/6 renal ablation surgery, when they are between 5 and 6 weeks old. Lewis rats, in turn, achieve the required body weight for CKD induction when they are from 7 to 9 weeks old. Finally, Fischer rats can only be subjected to surgical 5/6 renal ablation when they are between 10 and 15 weeks old. As shown in
Figure 2B, the Wistar rats subjected to renal ablation model in the present study were 5.9 ± 0.1 weeks old, while the Lewis animals were 8.5 ± 0.3 weeks old and the Fischer rats were 12.2 ± 0.3 weeks old, when submitted to the same procedure. Of note, such age differences among the rat strains in the beginning of the protocol were statistically significant.
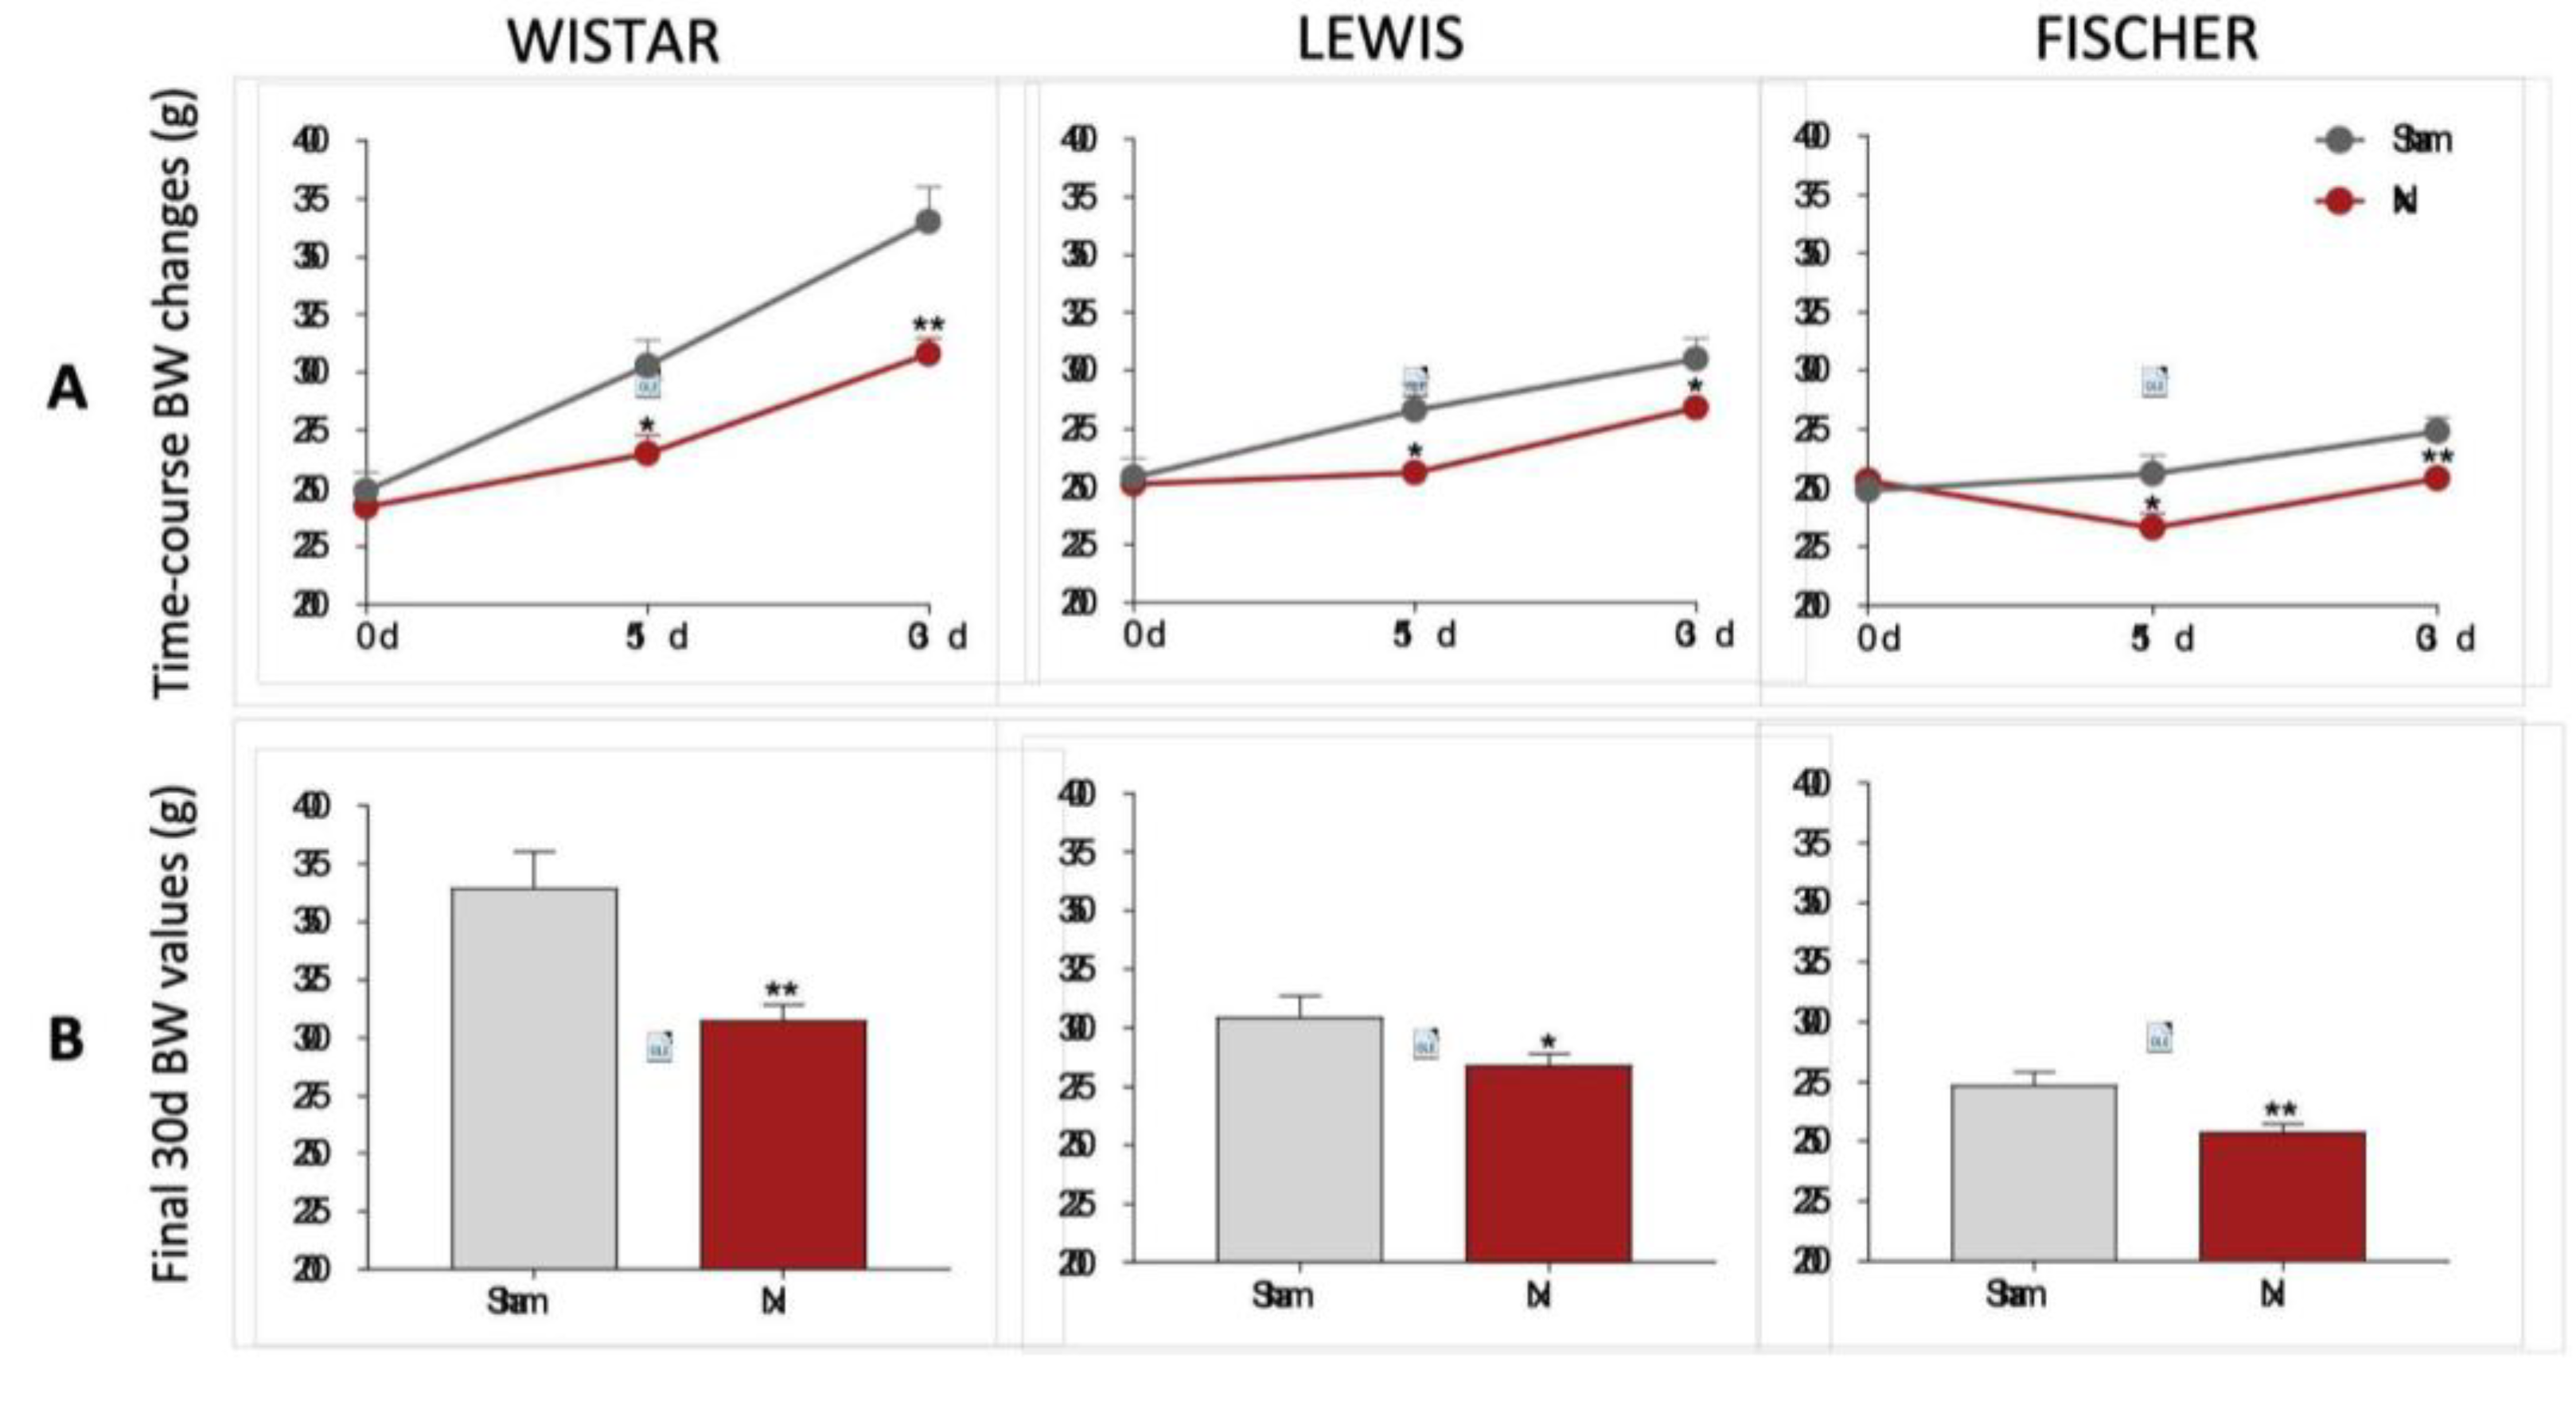
BW of rats included in our protocol were monitored during all the study period, as shown in
Figure 3. On the first set of results, presented in 3A, we showed the line graphs with the means of BW of animals from each experimental group, before CKD induction (preoperative moment), 15, and 30 days after CKD induction. In 3B bar graphs of the final BW of each experimental group can be seen. As expected, Wistar, Lewis and Fischer rats submitted to the 5/6 renal ablation model exhibited significantly lower weight gain compared to strain-matched Sham animals.
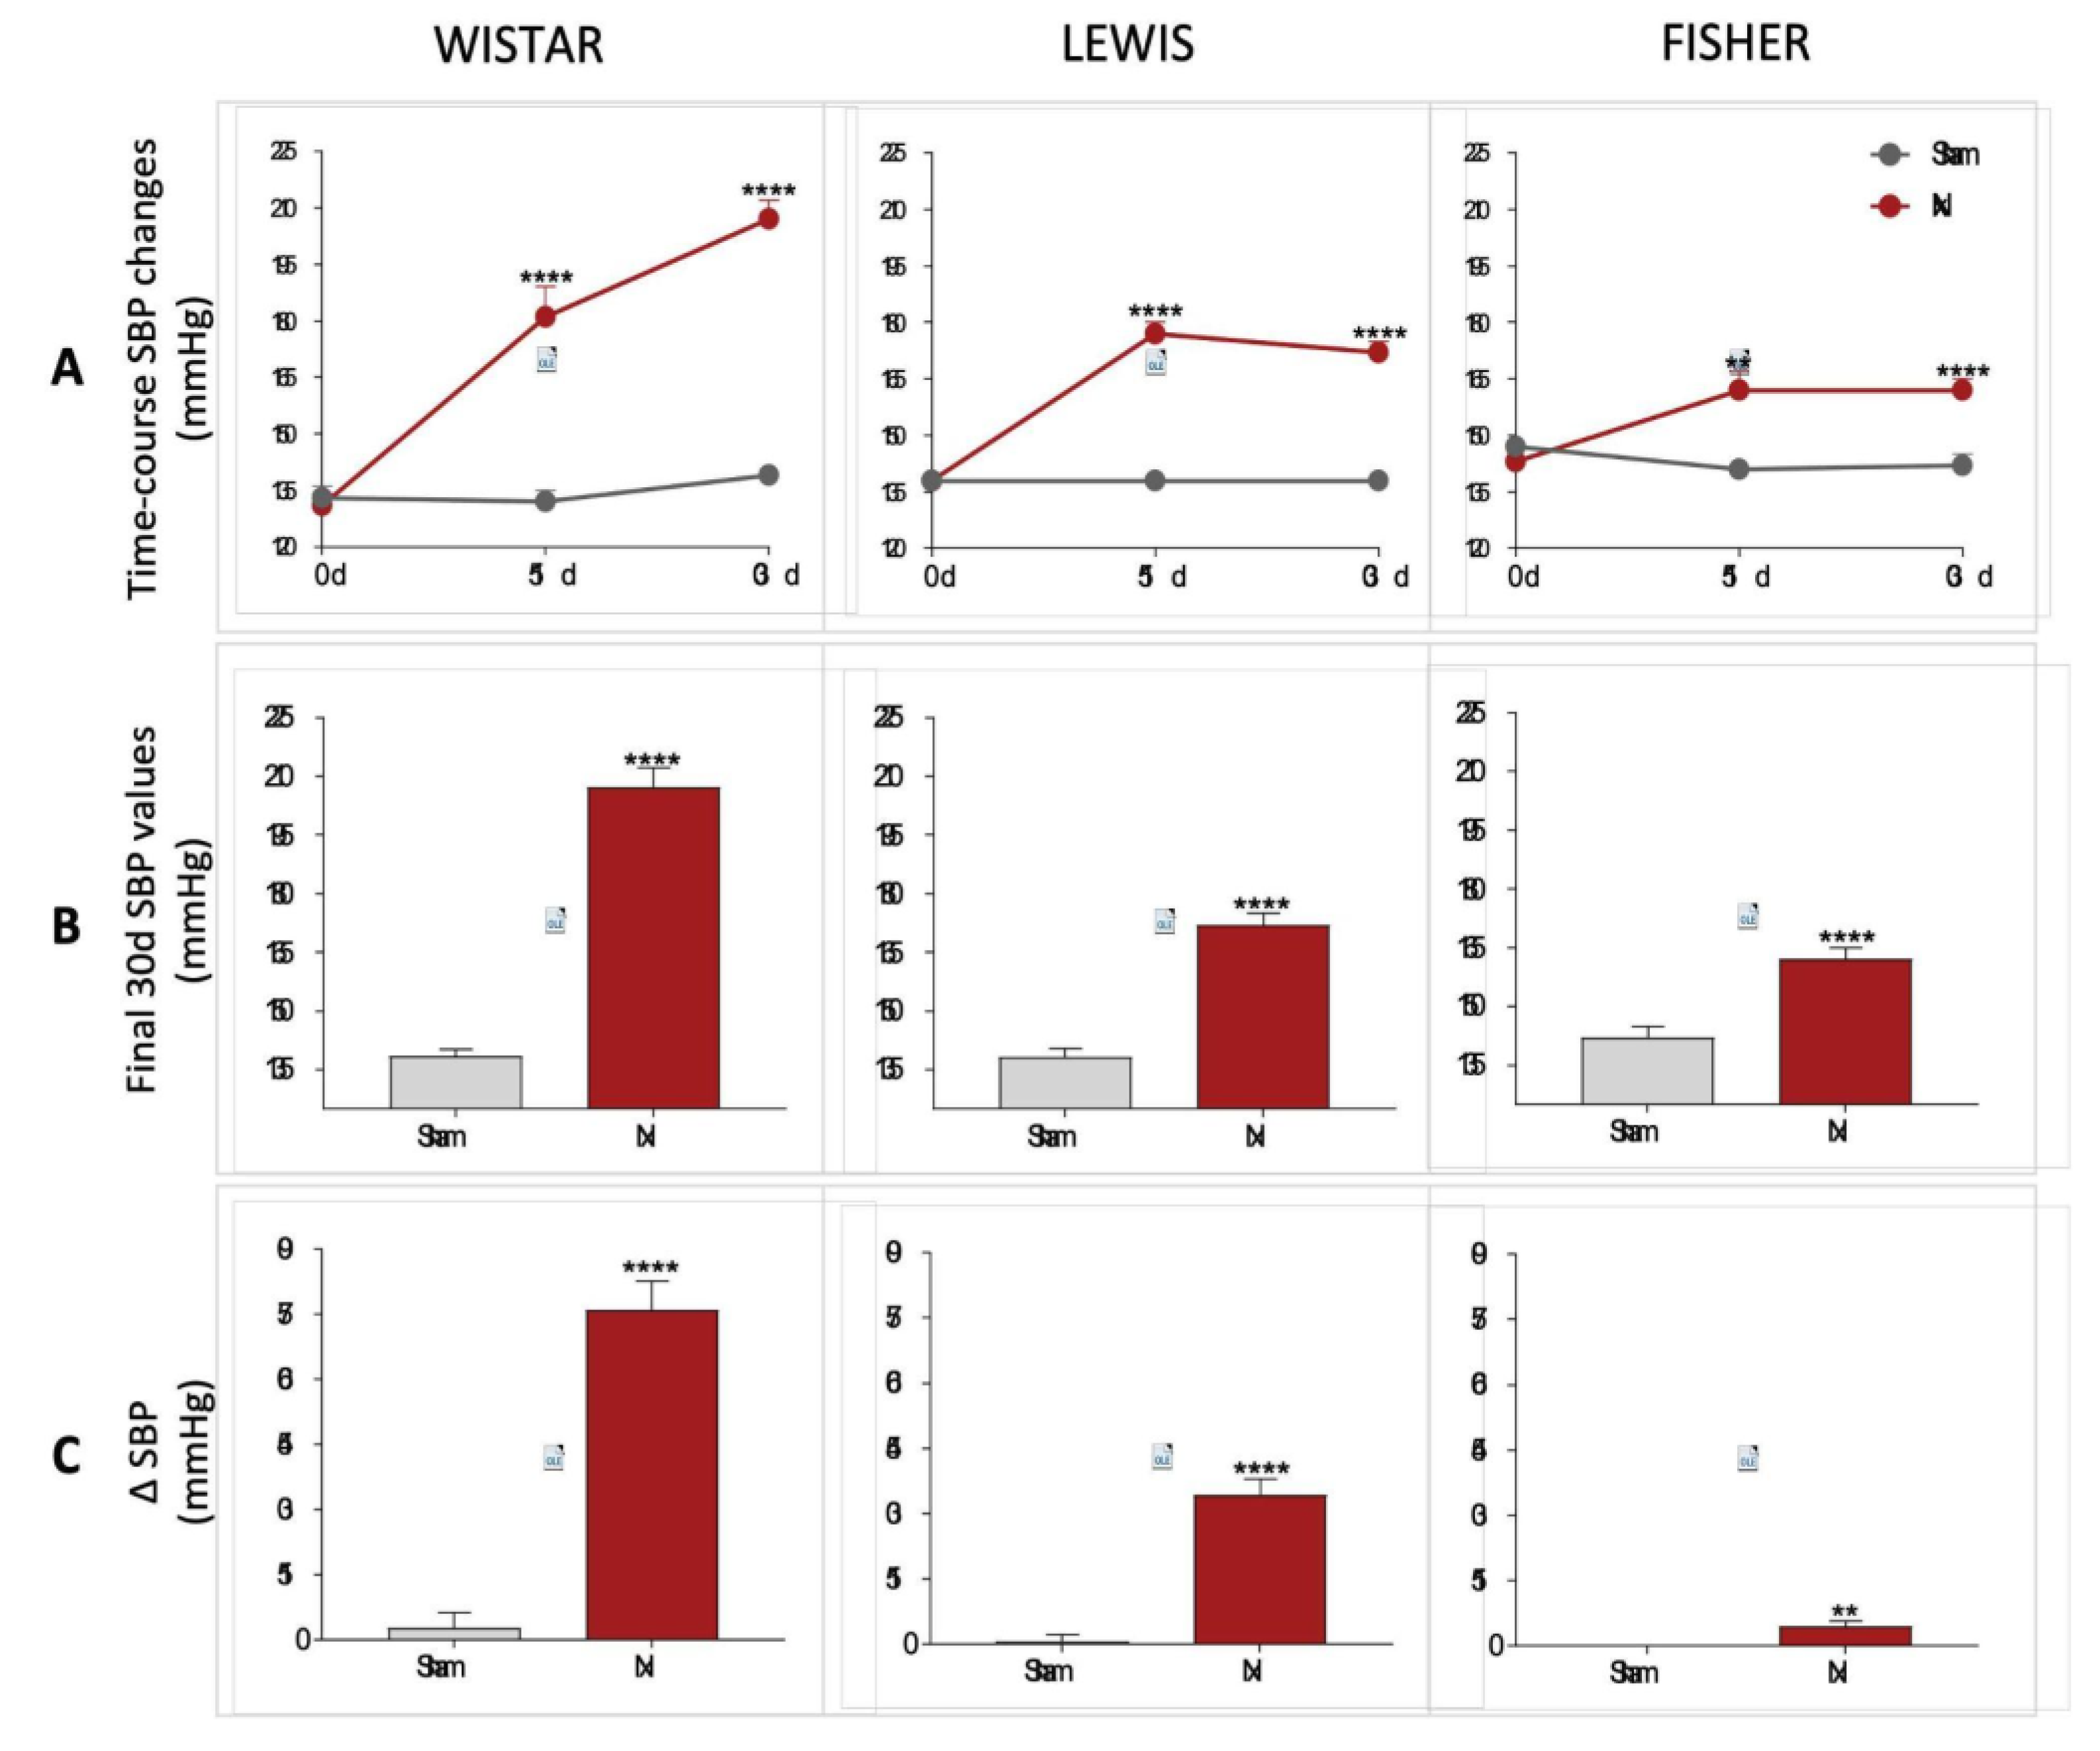
The systolic blood pressure of all animals included in the study was evaluated in the three main stages of the experimental protocol (0d, 15d, and 30d). The results are illustrated as time-course line graphs in
Figure 4A, bar graphs of the final results, in
Figure 4B and delta graphs of the means obtained by the subtraction of the initial SBP values from the final SBP values of each individual animal, in
Figure 4C. All rats subjected to 5/6 renal ablation rapidly evolved with significant hypertension after only 15 days of CKD induction. In this study point, Wistar Nx rats presented 181±8 mmHg vs.132±3 mmHg observed in Wistar Sham, Lewis Nx exhibited 177±3 mmHg vs.138±2 mmHg seen in Lewis Sham and Fischer Nx presented 162±5 mmHg vs.141±2 mmHg observed in Fischer Sham. Curiously, the rhythm of progression of hypertension associated to the Nx model, between 15 and 30 days of CKD induction was extremely variable, according to the employed rat strain. While Wistar Nx rats presented a constant increase in SBP during the 30 days of the study, achieving a final value of 207±5 mmHg, vs.138±2 mmHg in Wistar Sham; both Lewis and Fischer Nx animals maintained constant values of SBP between 15 and 30 days after CKD induction, achieving, respectively, 172±3 mmHg in Lewis Nx, vs. 138±2 mmHg in Lewis Sham, and 162±3 mmHg in Fischer Nx, vs. 142±3 mmHg in Fischer Sham.
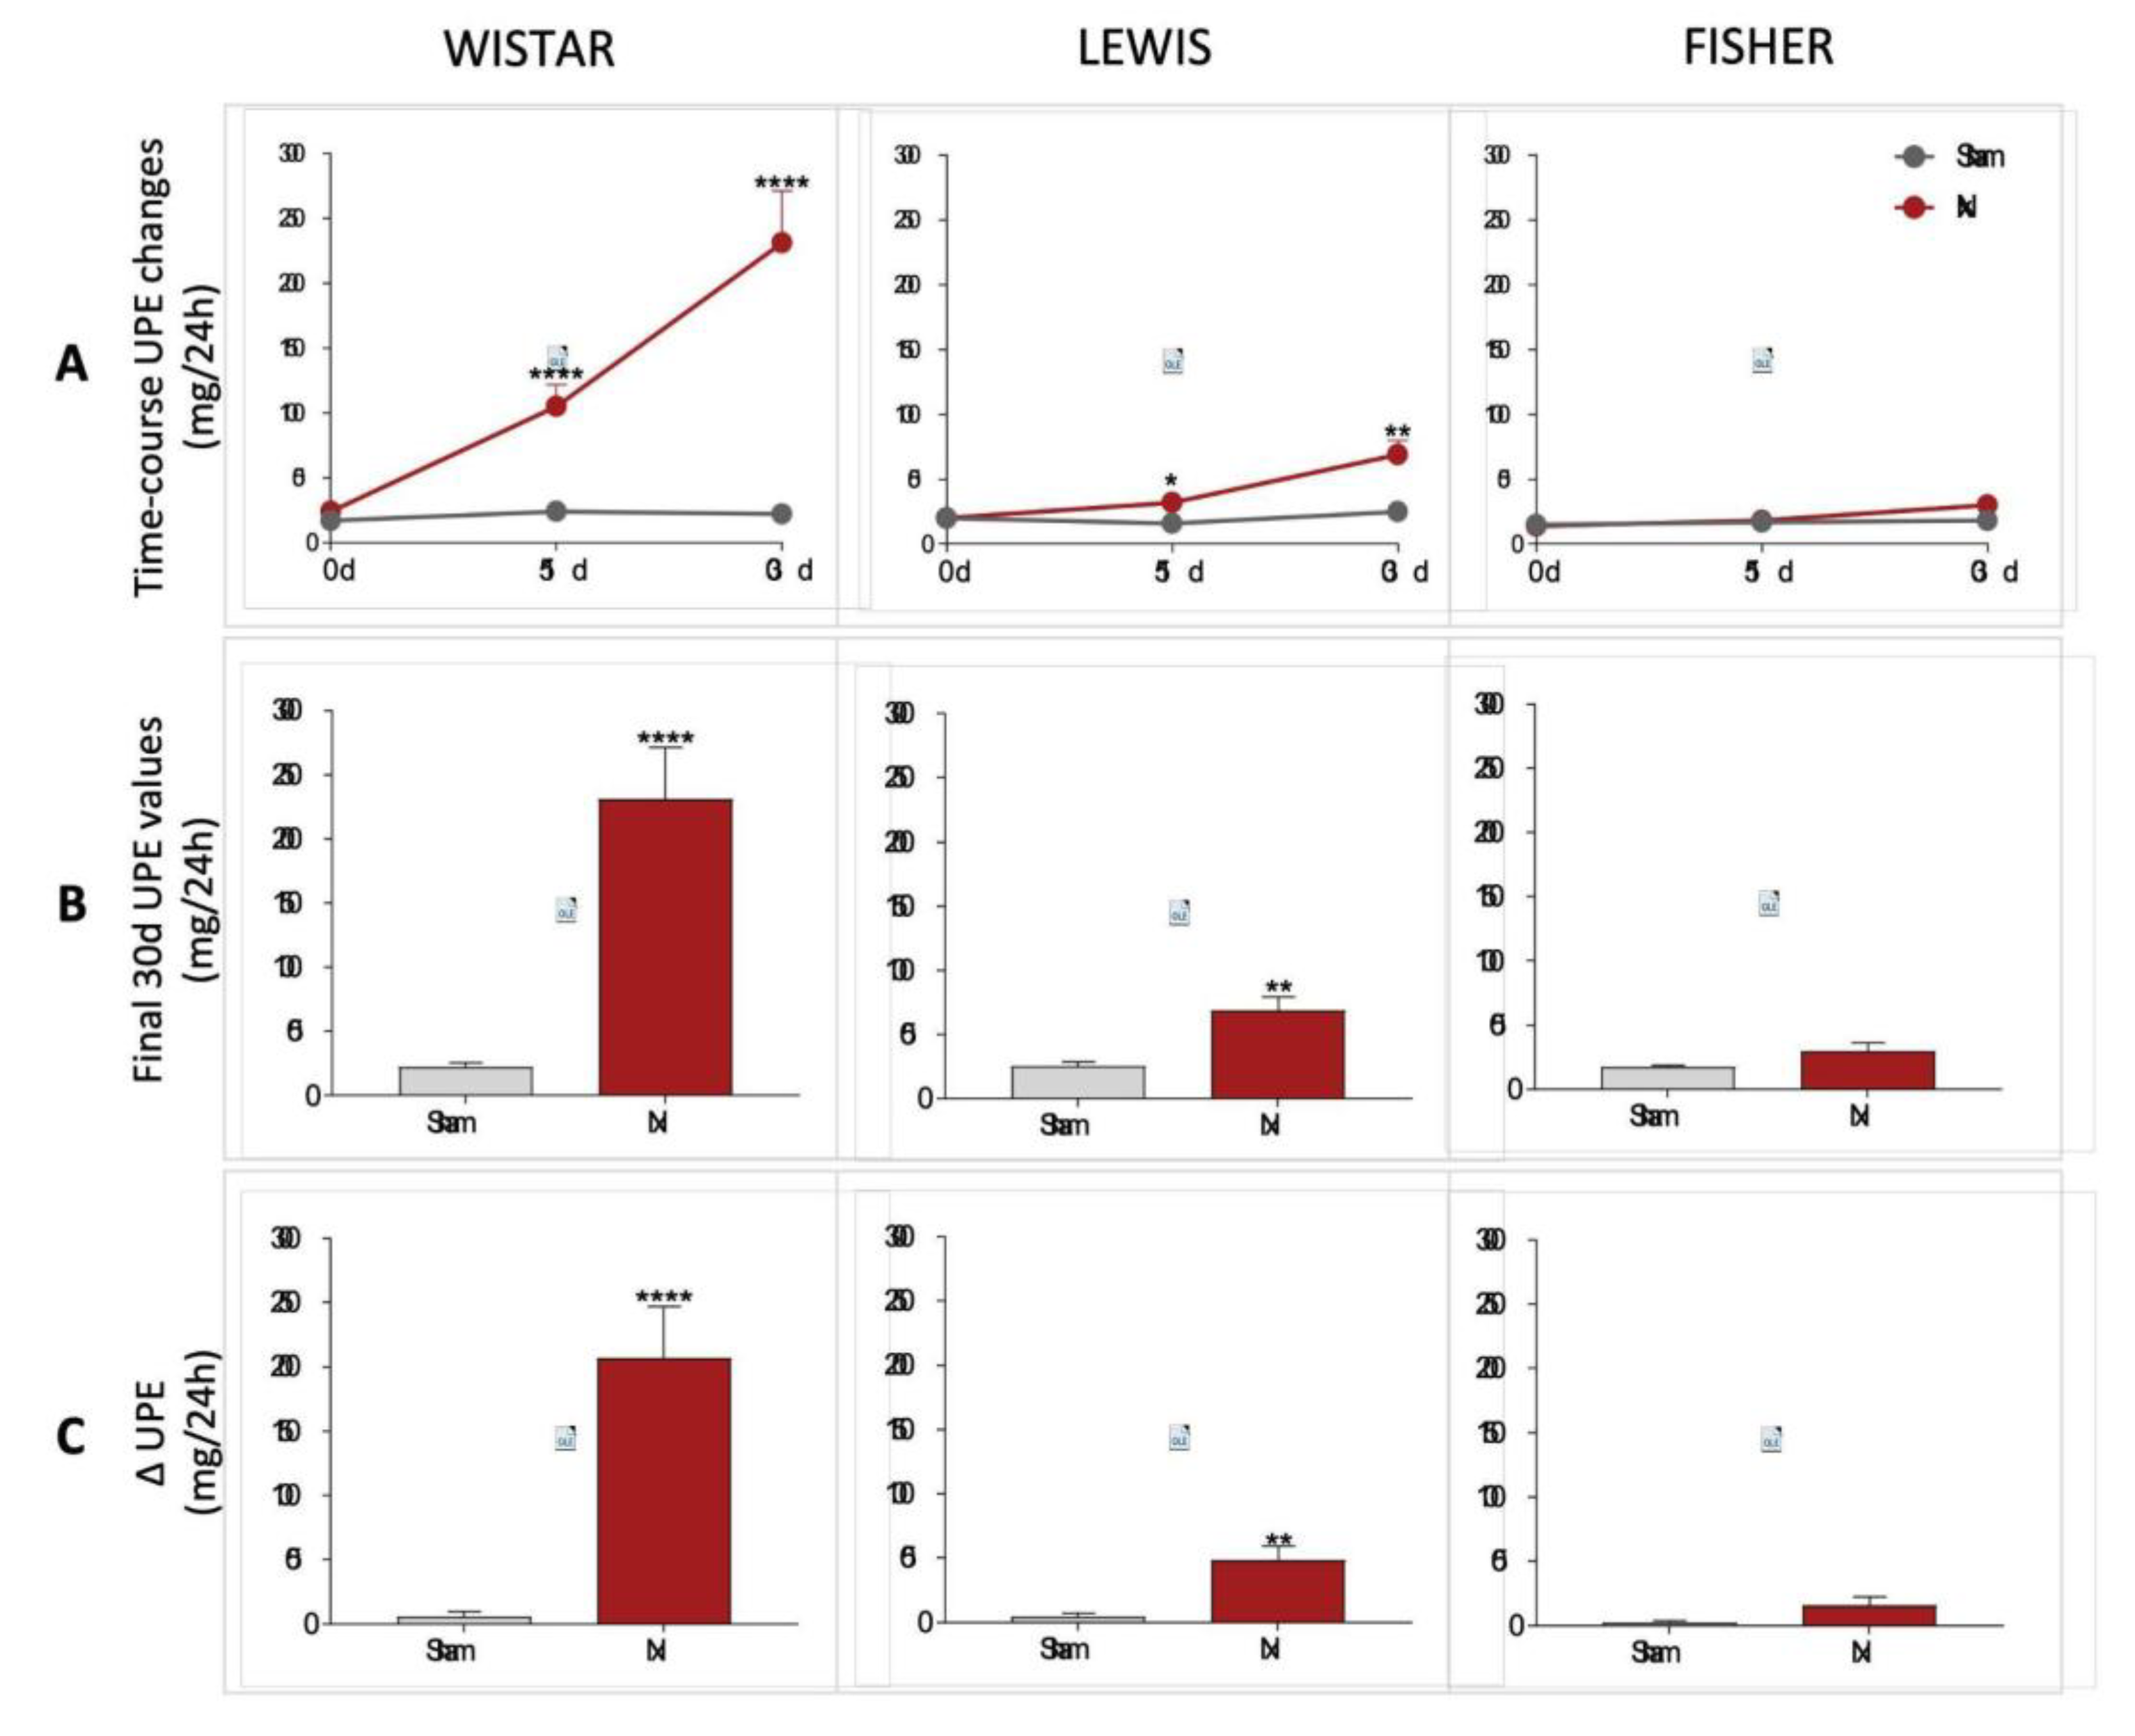
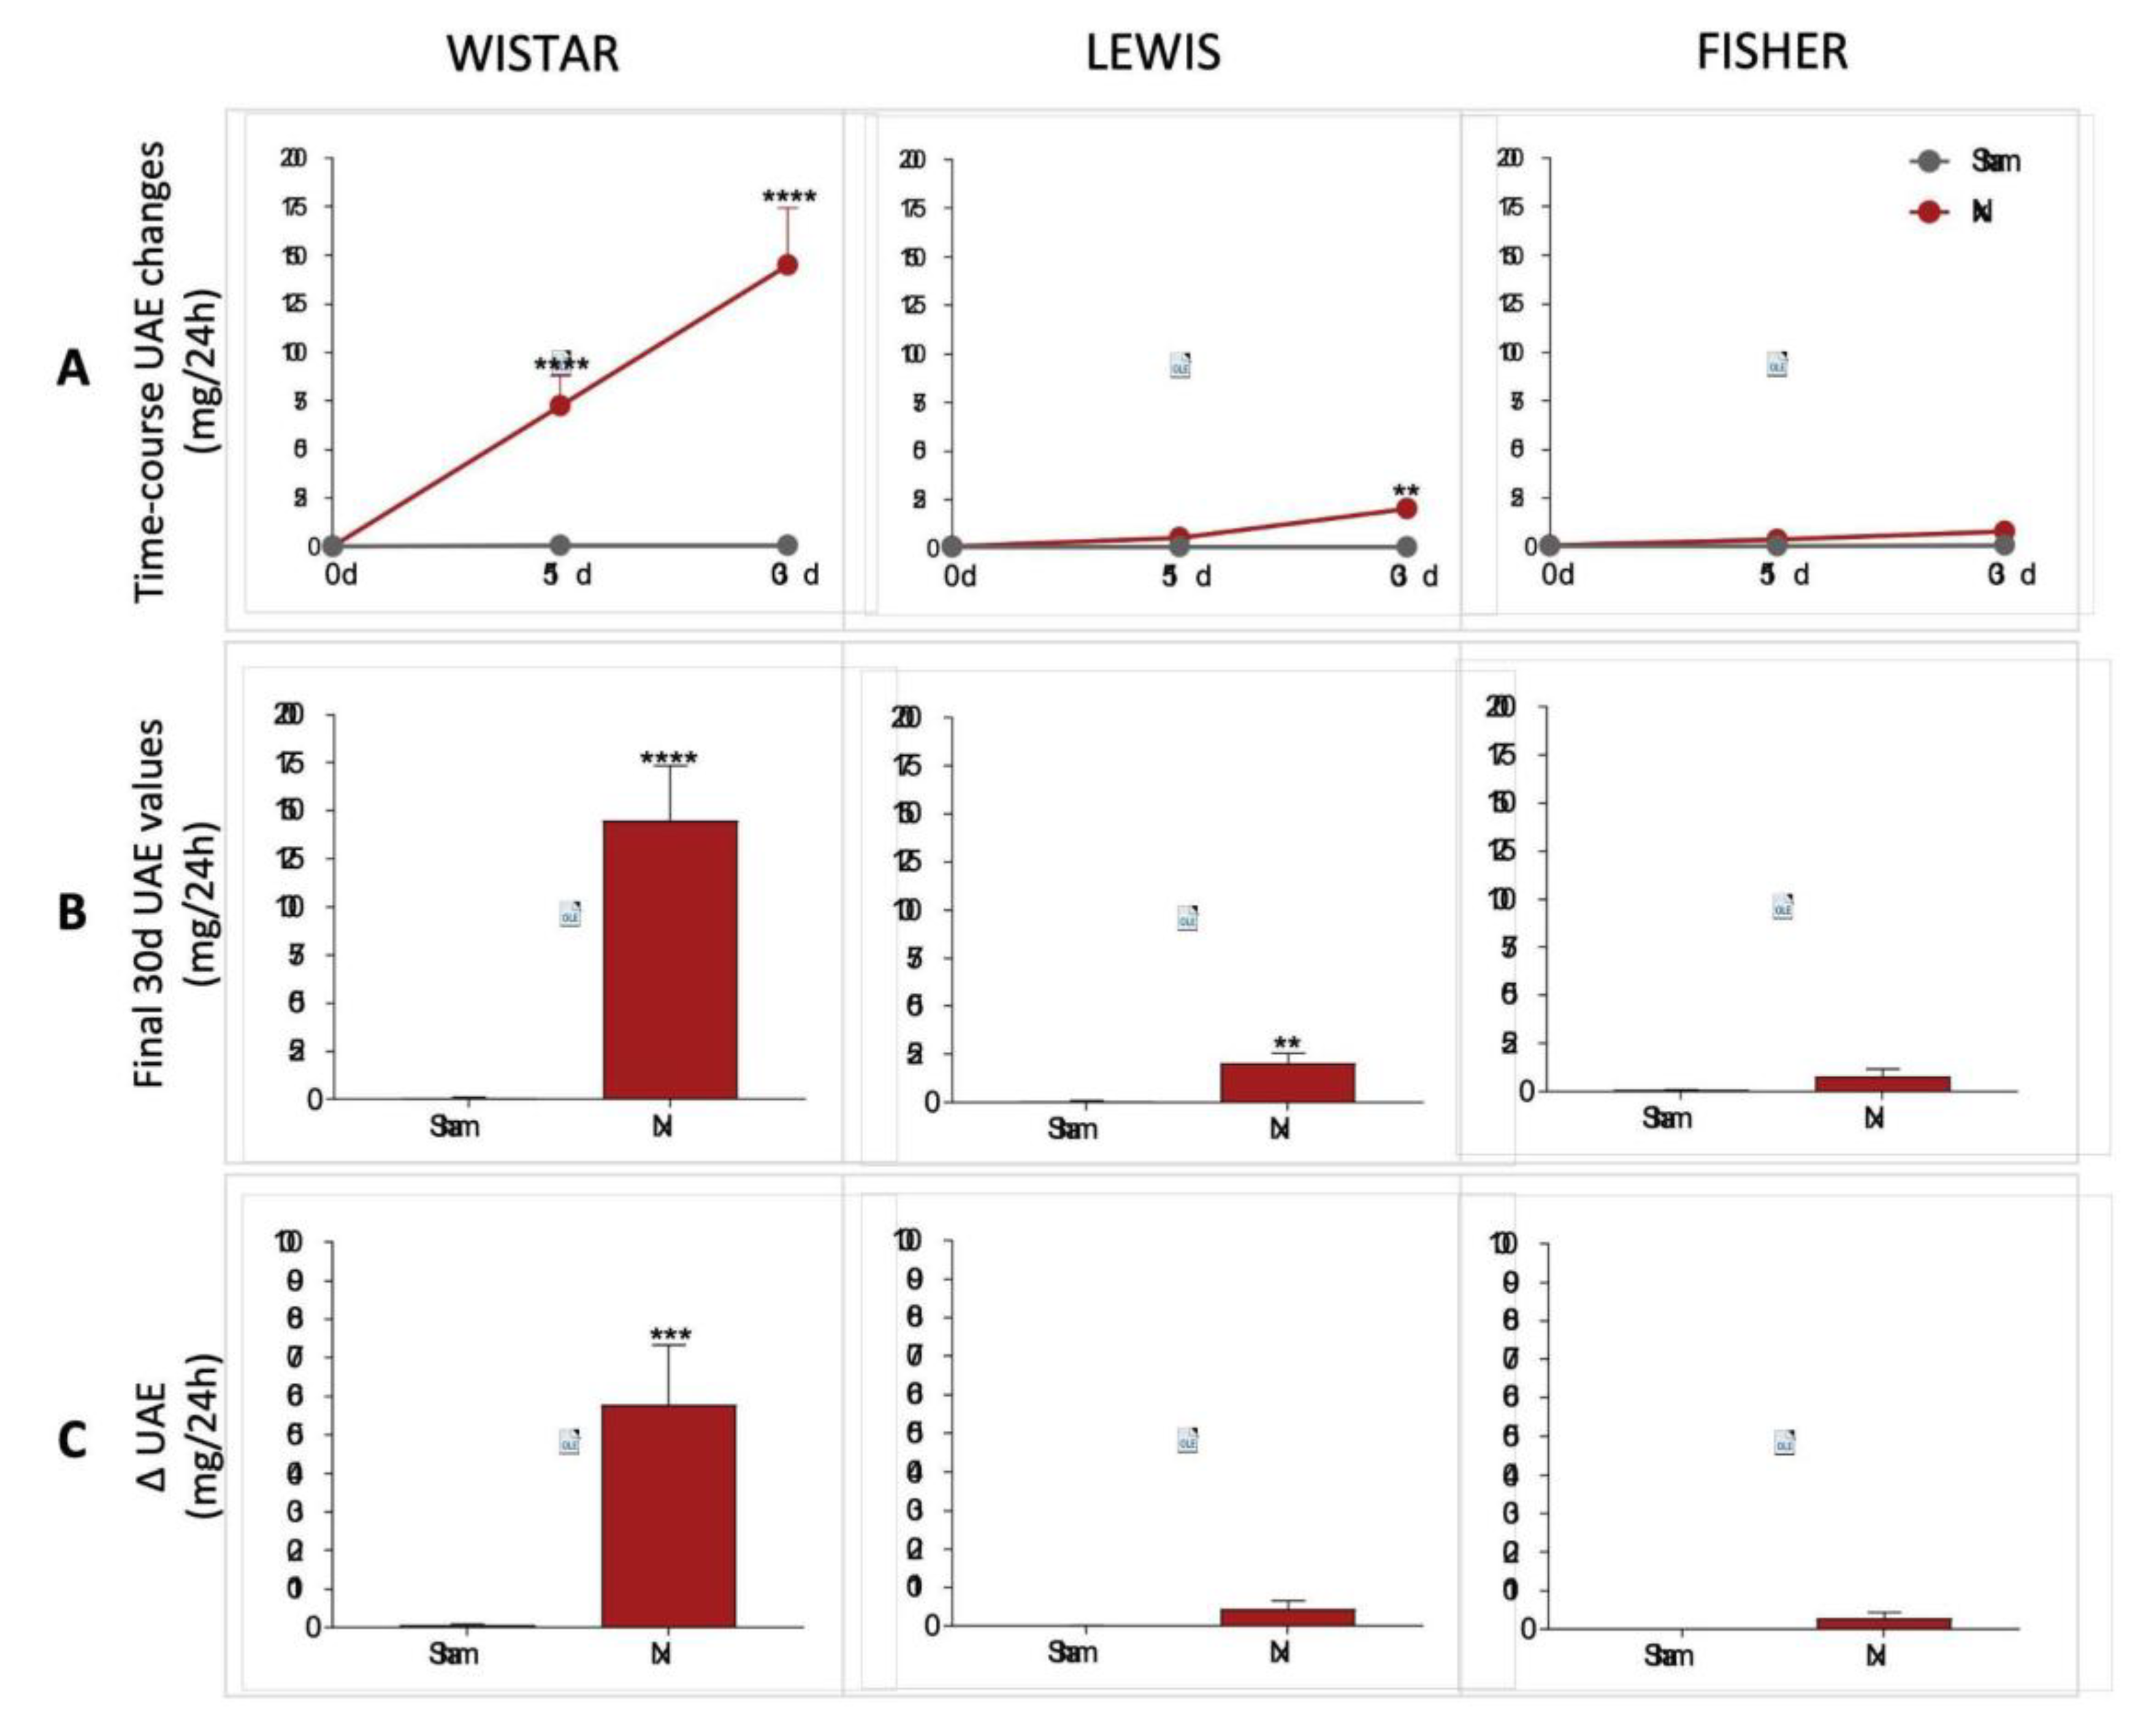
Urinary protein and albumin excretion of animals included in the study were assessed before CKD induction (time 0), as well as 15 and 30 days after 5/6 renal ablation. UPE and UAE dosages performed over the course of the follow-up period were shown in line graphs on
Figure 5A and 6A, respectively, while the final values achieved by the end of the protocol are shown in bar graphs in
Figure 5B and 6B. Finally, delta graphs of the same parameters are presented in
Figure 5C and 6C. Wistar Nx rats exhibited severe and significant proteinuria and albuminuria after only 15 days of CKD induction: 105±17 and 73±15 mg/24h, vs. 24±4 and 1±1, in Wistar Sham. Between 15 and 30 days after renal ablation, both UPE and UAE frankly worsened in Nx Wistar rats, reaching, by the end of the study period, more than the double of the values observed at 15 days. After 30 days of Nx, Wistar rats exhibited 231±40 mg/24h of UPE and 145±29 mg/24h of UAE, compared to 23±3 mg/24h of UPE and 1±1 mg/24h of UAE, seen in Wistar Sham animals. Conversely, Lewis animals submitted to the Nx model presented only mild UPE and UAE after 15 days of CKD induction, compared to time-matched Lewis Sham: 32±5 mg/24h of UPE and 4±1 mg/24h of UAE, vs. 16±3 mg/24h of UPE and 1±1 mg/24h of UAE. Moreover, although progressing along time, UPE and UAE values exhibited by Lewis Nx after 30 days of CKD induction were much lower than the observed in time-matched Wistar Nx rats: At 30 days of follow up, Lewis Nx showed 69±11 mg/24h of UPE and 17±3 mg/24h of UAE, compared to 25±3 mg/24h of UPE and 1±1 mg/24h of UAE, in time-matched Lewis Sham. Finally, although submitted to the same surgical CKD induction, Fischer Nx animals did not develop significant levels of UPE or UAE along the whole study period: In the 15th day after 5/6 renal ablation, Fischer Nx animals exhibited 16±1 mg/24h of UPE and 2±1 mg/24h of UAE vs. 17±1 mg/24h of UPE and 1±1 mg/24h of UAE observed in Fischer Sham, while after 30 days of CKD induction, Nx Fischer group shown 23±1 mg/24h of UPE and 4±1 mg/24h of UAE vs. 18±1 mg/24h of UPE and 1±1 mg/24h of UAE seen in Fischer Sham.
Figure 5.
(A) Time-course UPE changes (mg/24h) of all experimental groups, along the study period. (B) UPE (mg/24h) of all experimental groups, at the end of the protocol. (C) Delta graphs of UPE (mg/24h), obtained by subtracting the values observed at 30 days from those observed in the beginning of the study. *:p<0.05, **:p<0.01, ***:p<0.001, and ****:p<0.0001 vs. respective Sham.
Figure 6.
(A) Line graphs of the time-course UAE (mg/24h) of all experimental groups, along the study period. (B) UAE (mg/24h) of all experimental groups, at the end of the protocol. (C) Delta graphs of UAE (mg/24h), obtained by subtracting the values observed at 30 days from those observed in the beginning of the study. *:p<0.05, **:p<0.01, ***:p<0.001, and ****:p<0.0001 vs. respective Sham.
Renal function analyses were performed after 30 days of CKD induction in all animals included in our study. Raw data of both serum and urinary creatinine concentration, 24h urinary volume, as well as the CrCl in mg/min/m
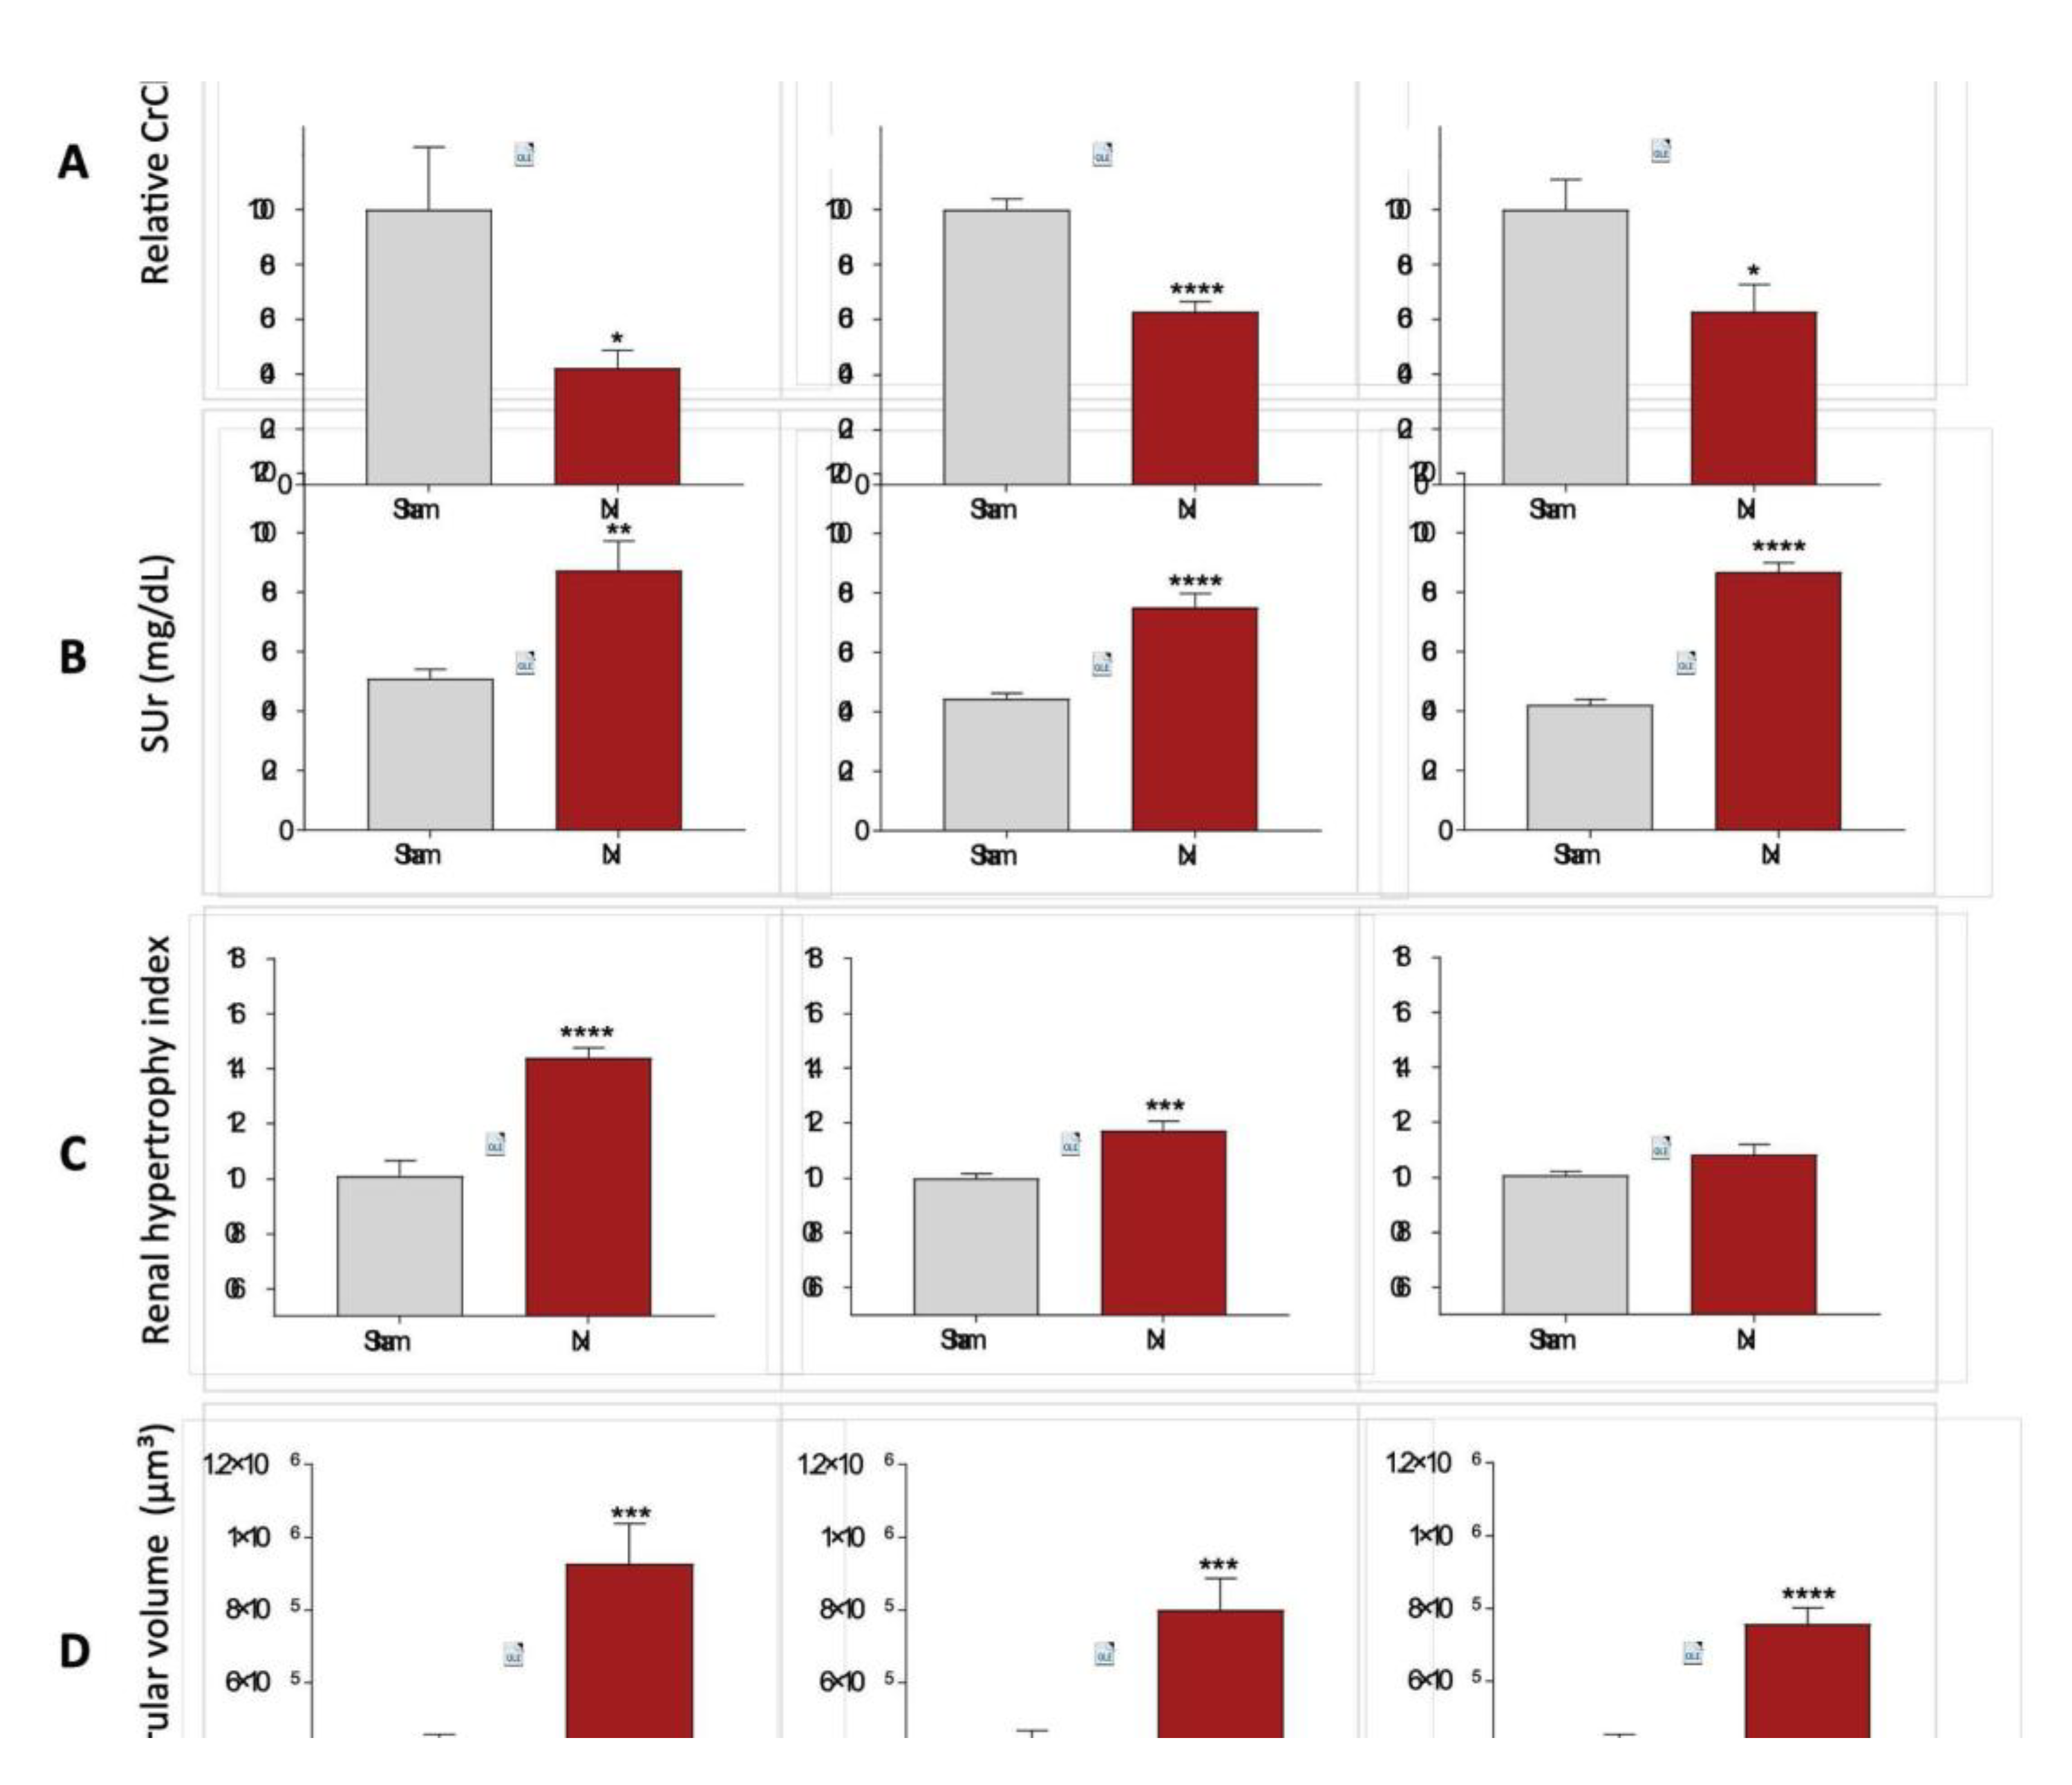
2, can be seen in Table 1. In order to compare the reduction in CrCl after 30 days of CKD induction in the different rat strains, we performed a relative normalization, by considering the Sham CrCl of each animal strain as 100%. Consequently, the results of Nx rats are presented as the percentage change in relation to their respective Sham group. Bar graphs with these results are shown in
Figure 7A. After 30 days of Nx, Wistar rats showed a severe decline in renal function, reaching only 42±6% of the CrCl observed in strain-matched Sham animals, at the same time point. Conversely, both Lewis and Fischer animals underwent CKD induction exhibited a less prominent, but still significant decrease in the CrCl rate, compared to their strain-matched Sham rats: 63±4% and 63±10%, respectively. On the other hand, serum urea analyses, presented in
Figure 7B showed no differences among the 3 studied rat strains after 30 days of CKD induction; Wistar, Lewis and Fischer Nx rats exhibited significant serum urea retention, compared to their respective Sham groups: 87±10 vs. 51±3, 75±5 vs. 44±2 and 87±3 vs. 42±2.
In order to evaluate the adaptive hypertrophy of remnant renal mass in the different rat strains underwent 5/6 renal ablation, the left kidney weight (KW) of all animals was verified after 30 days of CKD induction, and the obtained values were divided by the BW of each respective animal. These quotients were multiplied by 10
3, and the results for each experimental group are shown in Table 1. Since the studied rat strains present different basal kidney sizes, we thus calculated a kidney hypertrophy index, by dividing the values obtained with the equation BW/KW*10³ of Nx animals by those obtained with the same equation of each respective Sham group. These results are presented in
Figure 7C. Both Wistar and Lewis rats submitted to the 5/6 renal ablation model exhibited significant renal hypertrophy, compared to strain-matched Sham animals (p<0.0001 and p<0.001, respectively). Fischer Nx rats, in turn, did not develop compensatory renal hypertrophy compared to the Fischer Sham rats.
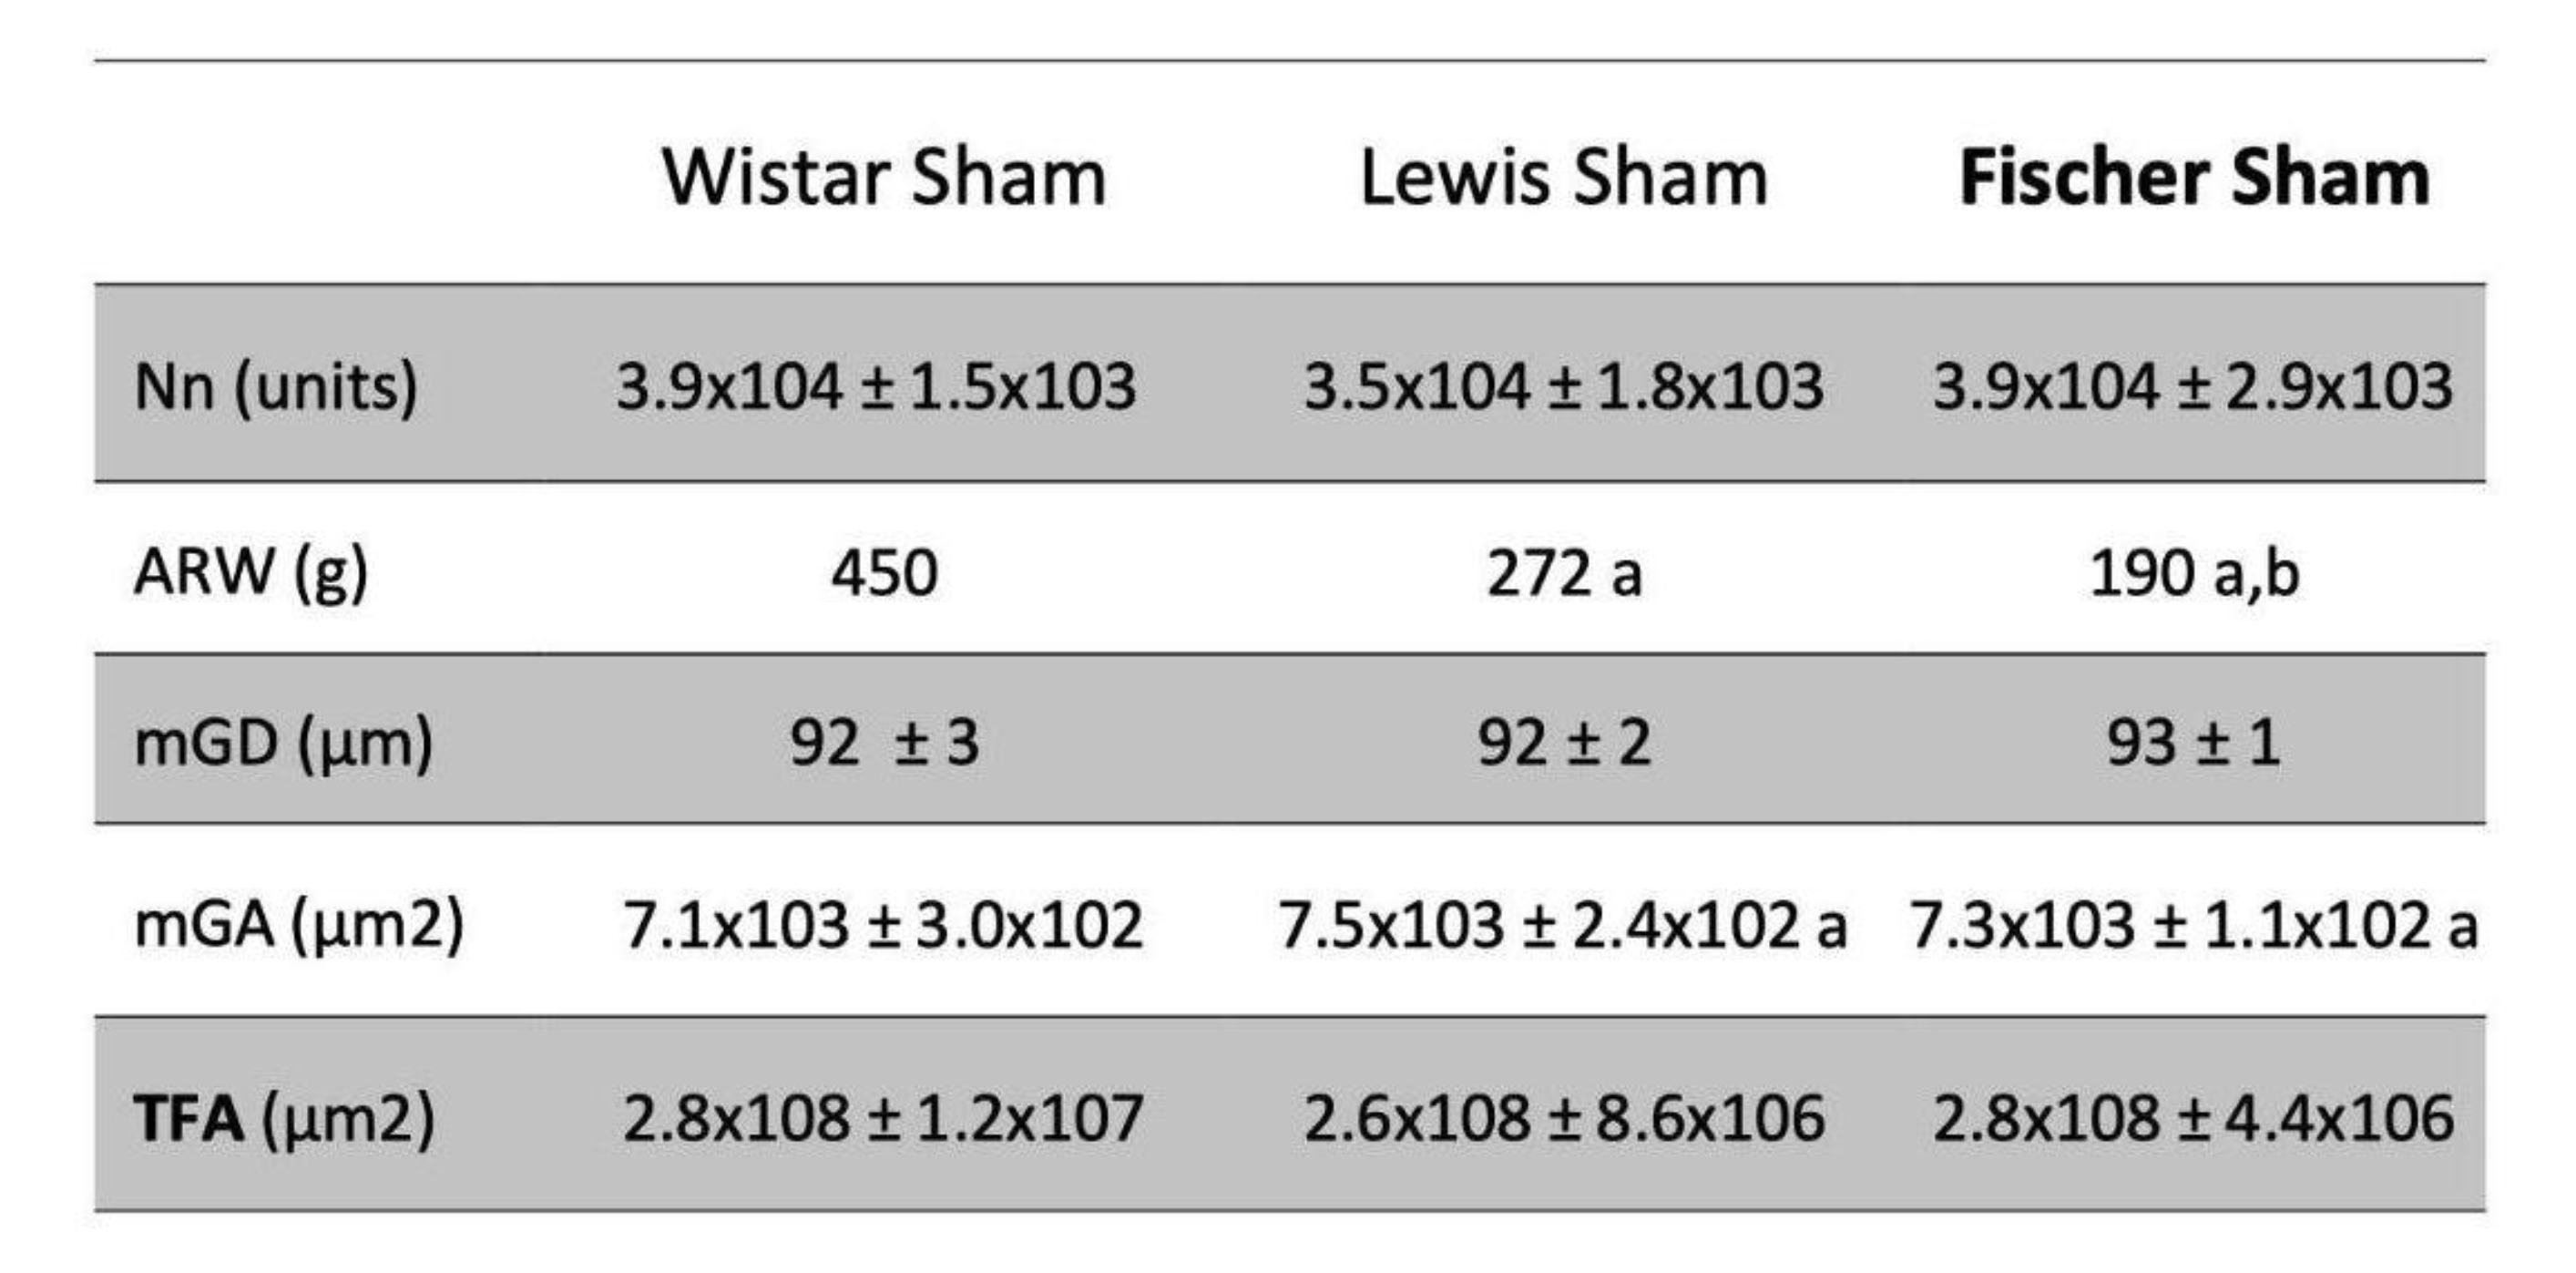
Glomerular hypertrophy was evaluated in Nx animals through the analysis of the mean glomerular diameter (Mgd), measured in 25 glomeruli of each experimental animal. The obtained values of mGD of Wistar, Lewis and Fischer Sham rats were very similar: 92±3, 92±2 and 93±1, respectively (Table 2). After 30 days of 5/6 renal ablation, all rat strains presented increased values of mGD, as follows: 116±5 in Wistar Nx, 112±4 in Lewis Nx and 110±2 in Fischer Nx (data not shown). Based on these values, we thus calculated the estimated glomerular volume in each rat strain. According to the bar graphs presented in
Figure 7D, glomerular volume of Sham animals did not vary among the studied rat strains. However, regardless of the strain, all animals submitted to 5/6 renal ablation presented a significant increase in the glomerular volume, compared to their strain-matched Sham rats: 9.3±1.1 x 10⁵ vs 4.3±0.3 x 10⁵ m3 in Wistar, 8.0±0.9 x 10⁵ vs 4.4±0.3 x 10⁵ in Lewis and 7.6±0.5 x 10⁵ vs 4.4±0.1 x 10⁵ in Fischer rats.
Table 2. Total Nephron number (Nn; units) achieved according to the steps illustrated in
Figure 1. Adult rat body weight (ARW, g): mean body weight of each rat strain at 10 weeks of age. Mean glomerular diameter, (mGD, µm), Mean glomerular area (mGA, µm2) and Total filtration area (TFA; µm2). a:p<0,05 vs. Wistar, b:p<0,05 vs. Lewis.
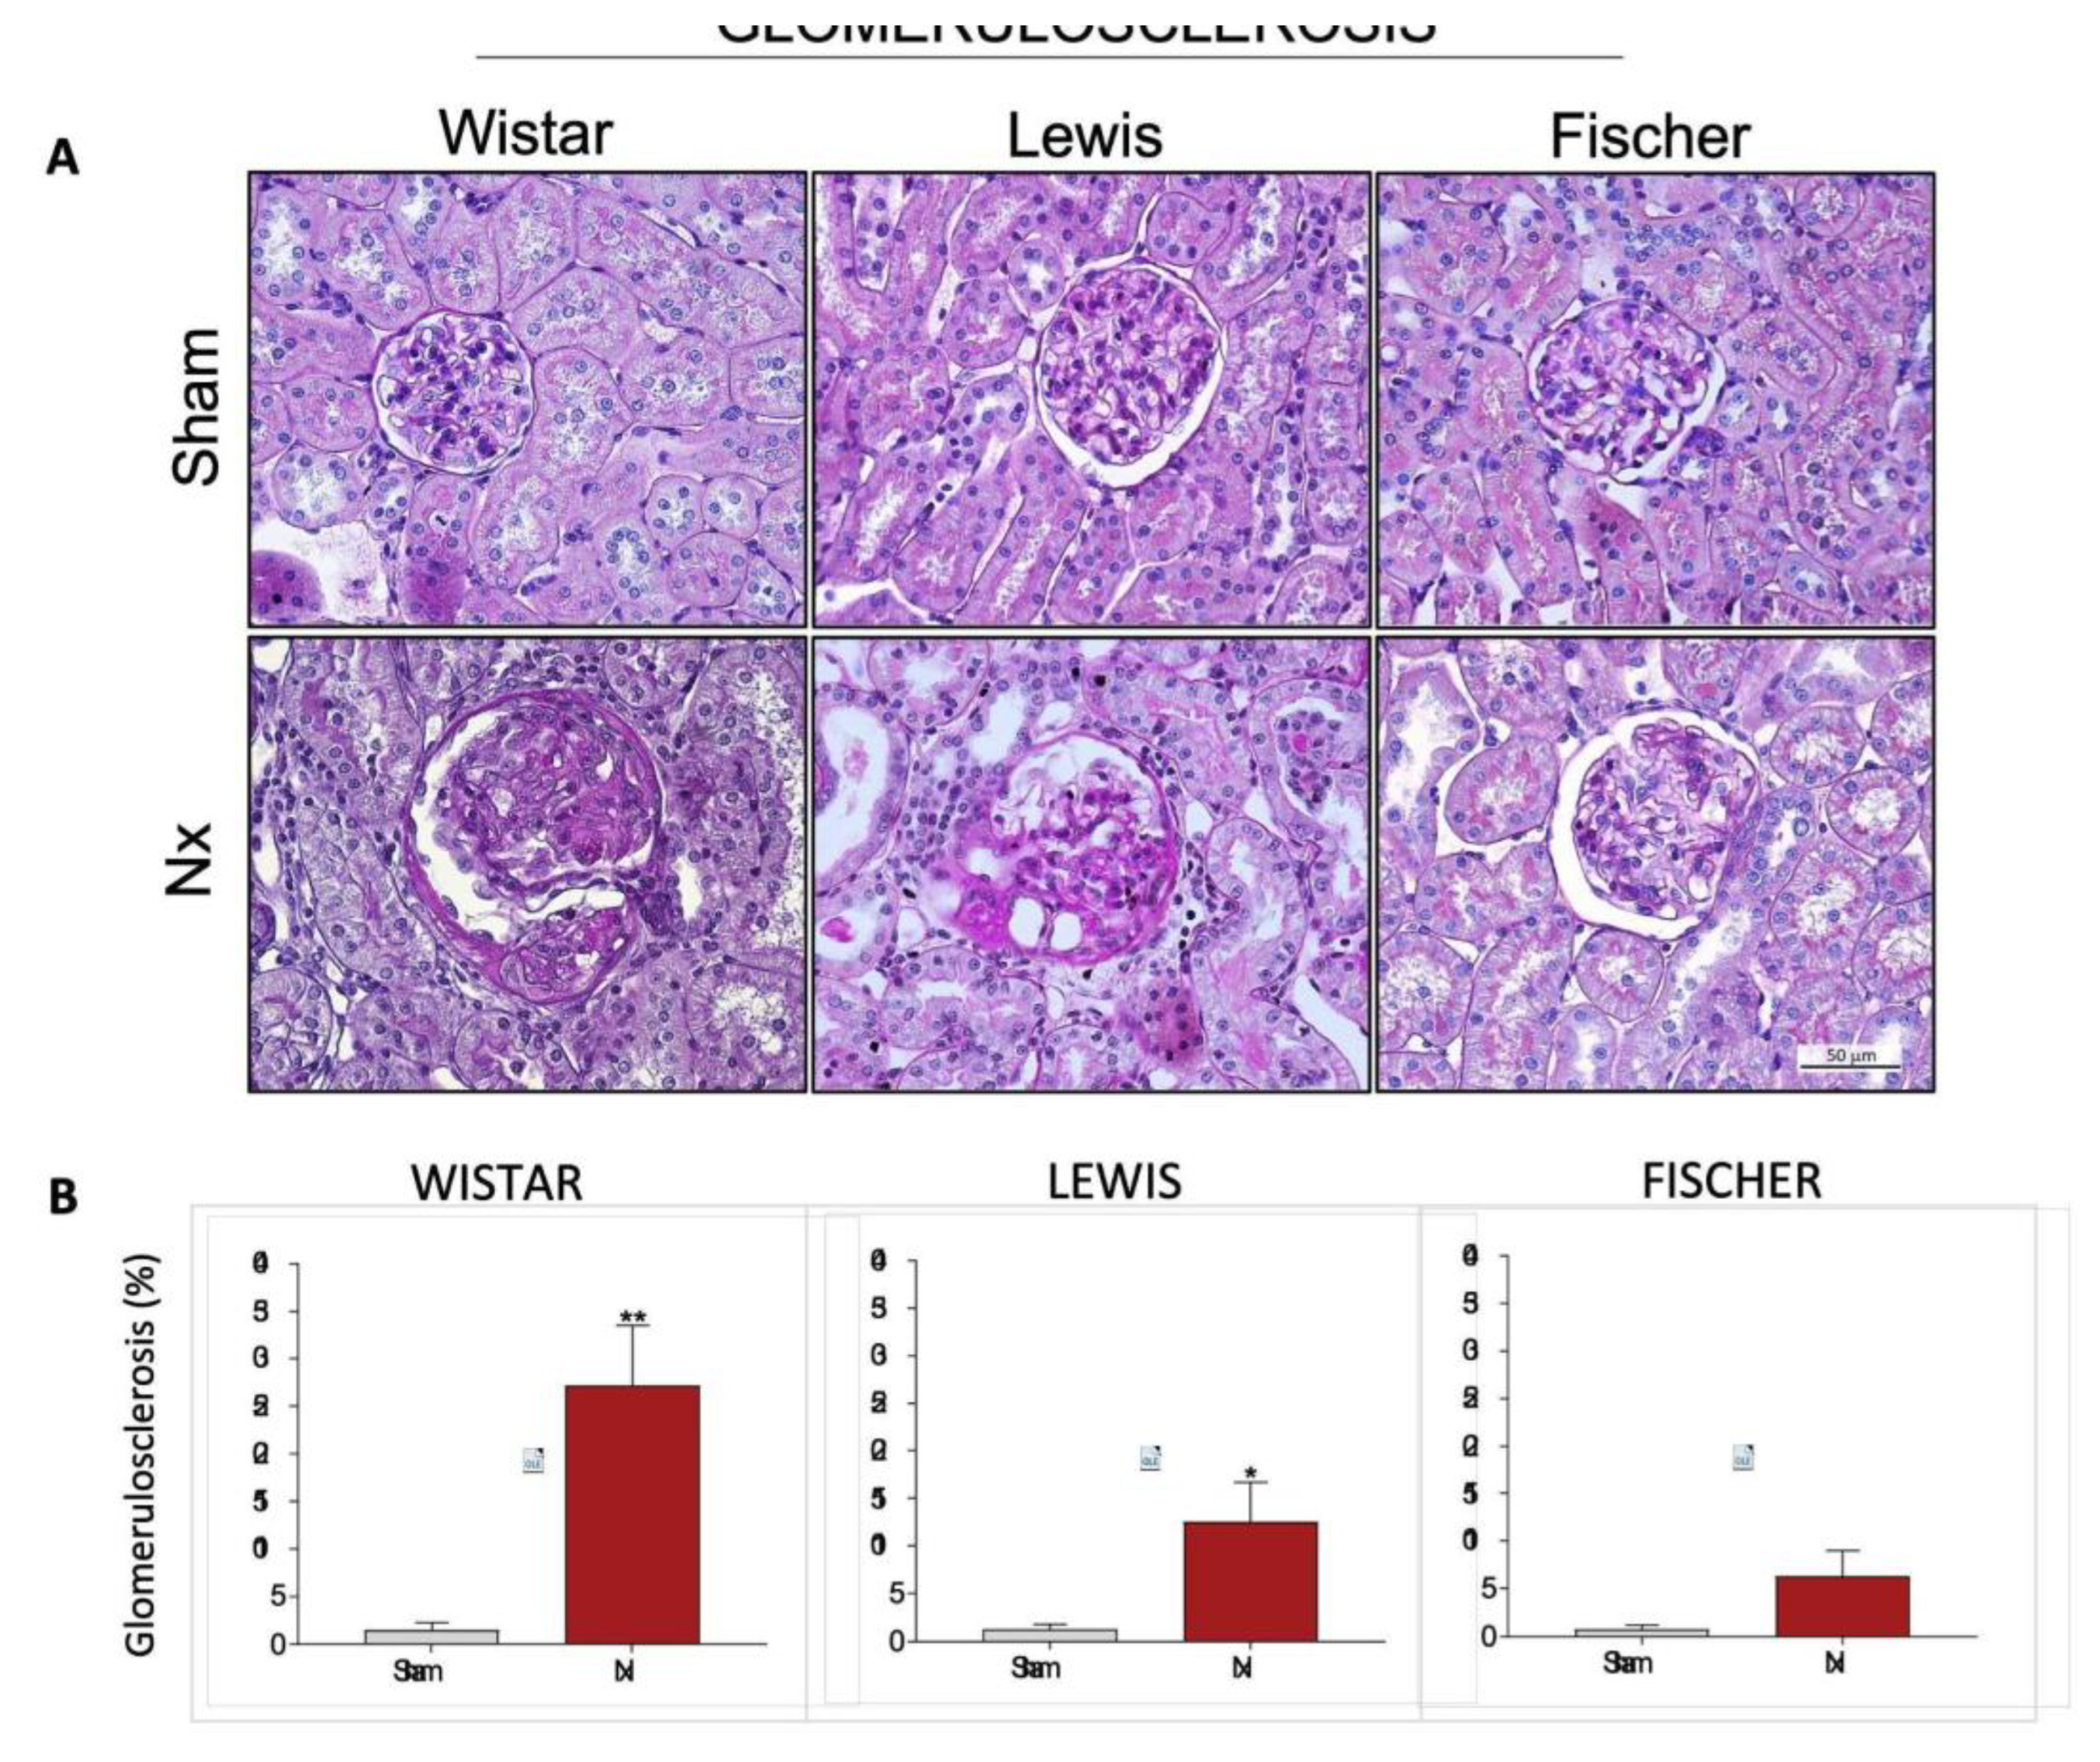
Structural glomerular damage was assessed in renal samples of all animals included in our study by staining the histological slides through the PAS method. The
Figure 8A shows a representative microphotograph panel of specimens of each experimental group. Based on the analysis of PAS slides, the percentage of glomerulosclerosis of each animal was calculated, and the results were presented as bar graphs in
Figure 8B. As expected, no significant signs of glomerular damage were seen in Sham animals of any of the studied rat strains. Wistar Nx animals, exhibited severe glomerulosclerosis after 30 days of CKD induction, with 27±6% of affected glomeruli. Lewis Nx rats, in turn, presented less severe, but still significant glomerular lesion, exhibiting 13±4% of affected glomeruli, after 30 days of renal ablation. Finally, Fischer Nx animals presented only 6±1% of sclerotic glomeruli, after the same period of CKD follow-up.
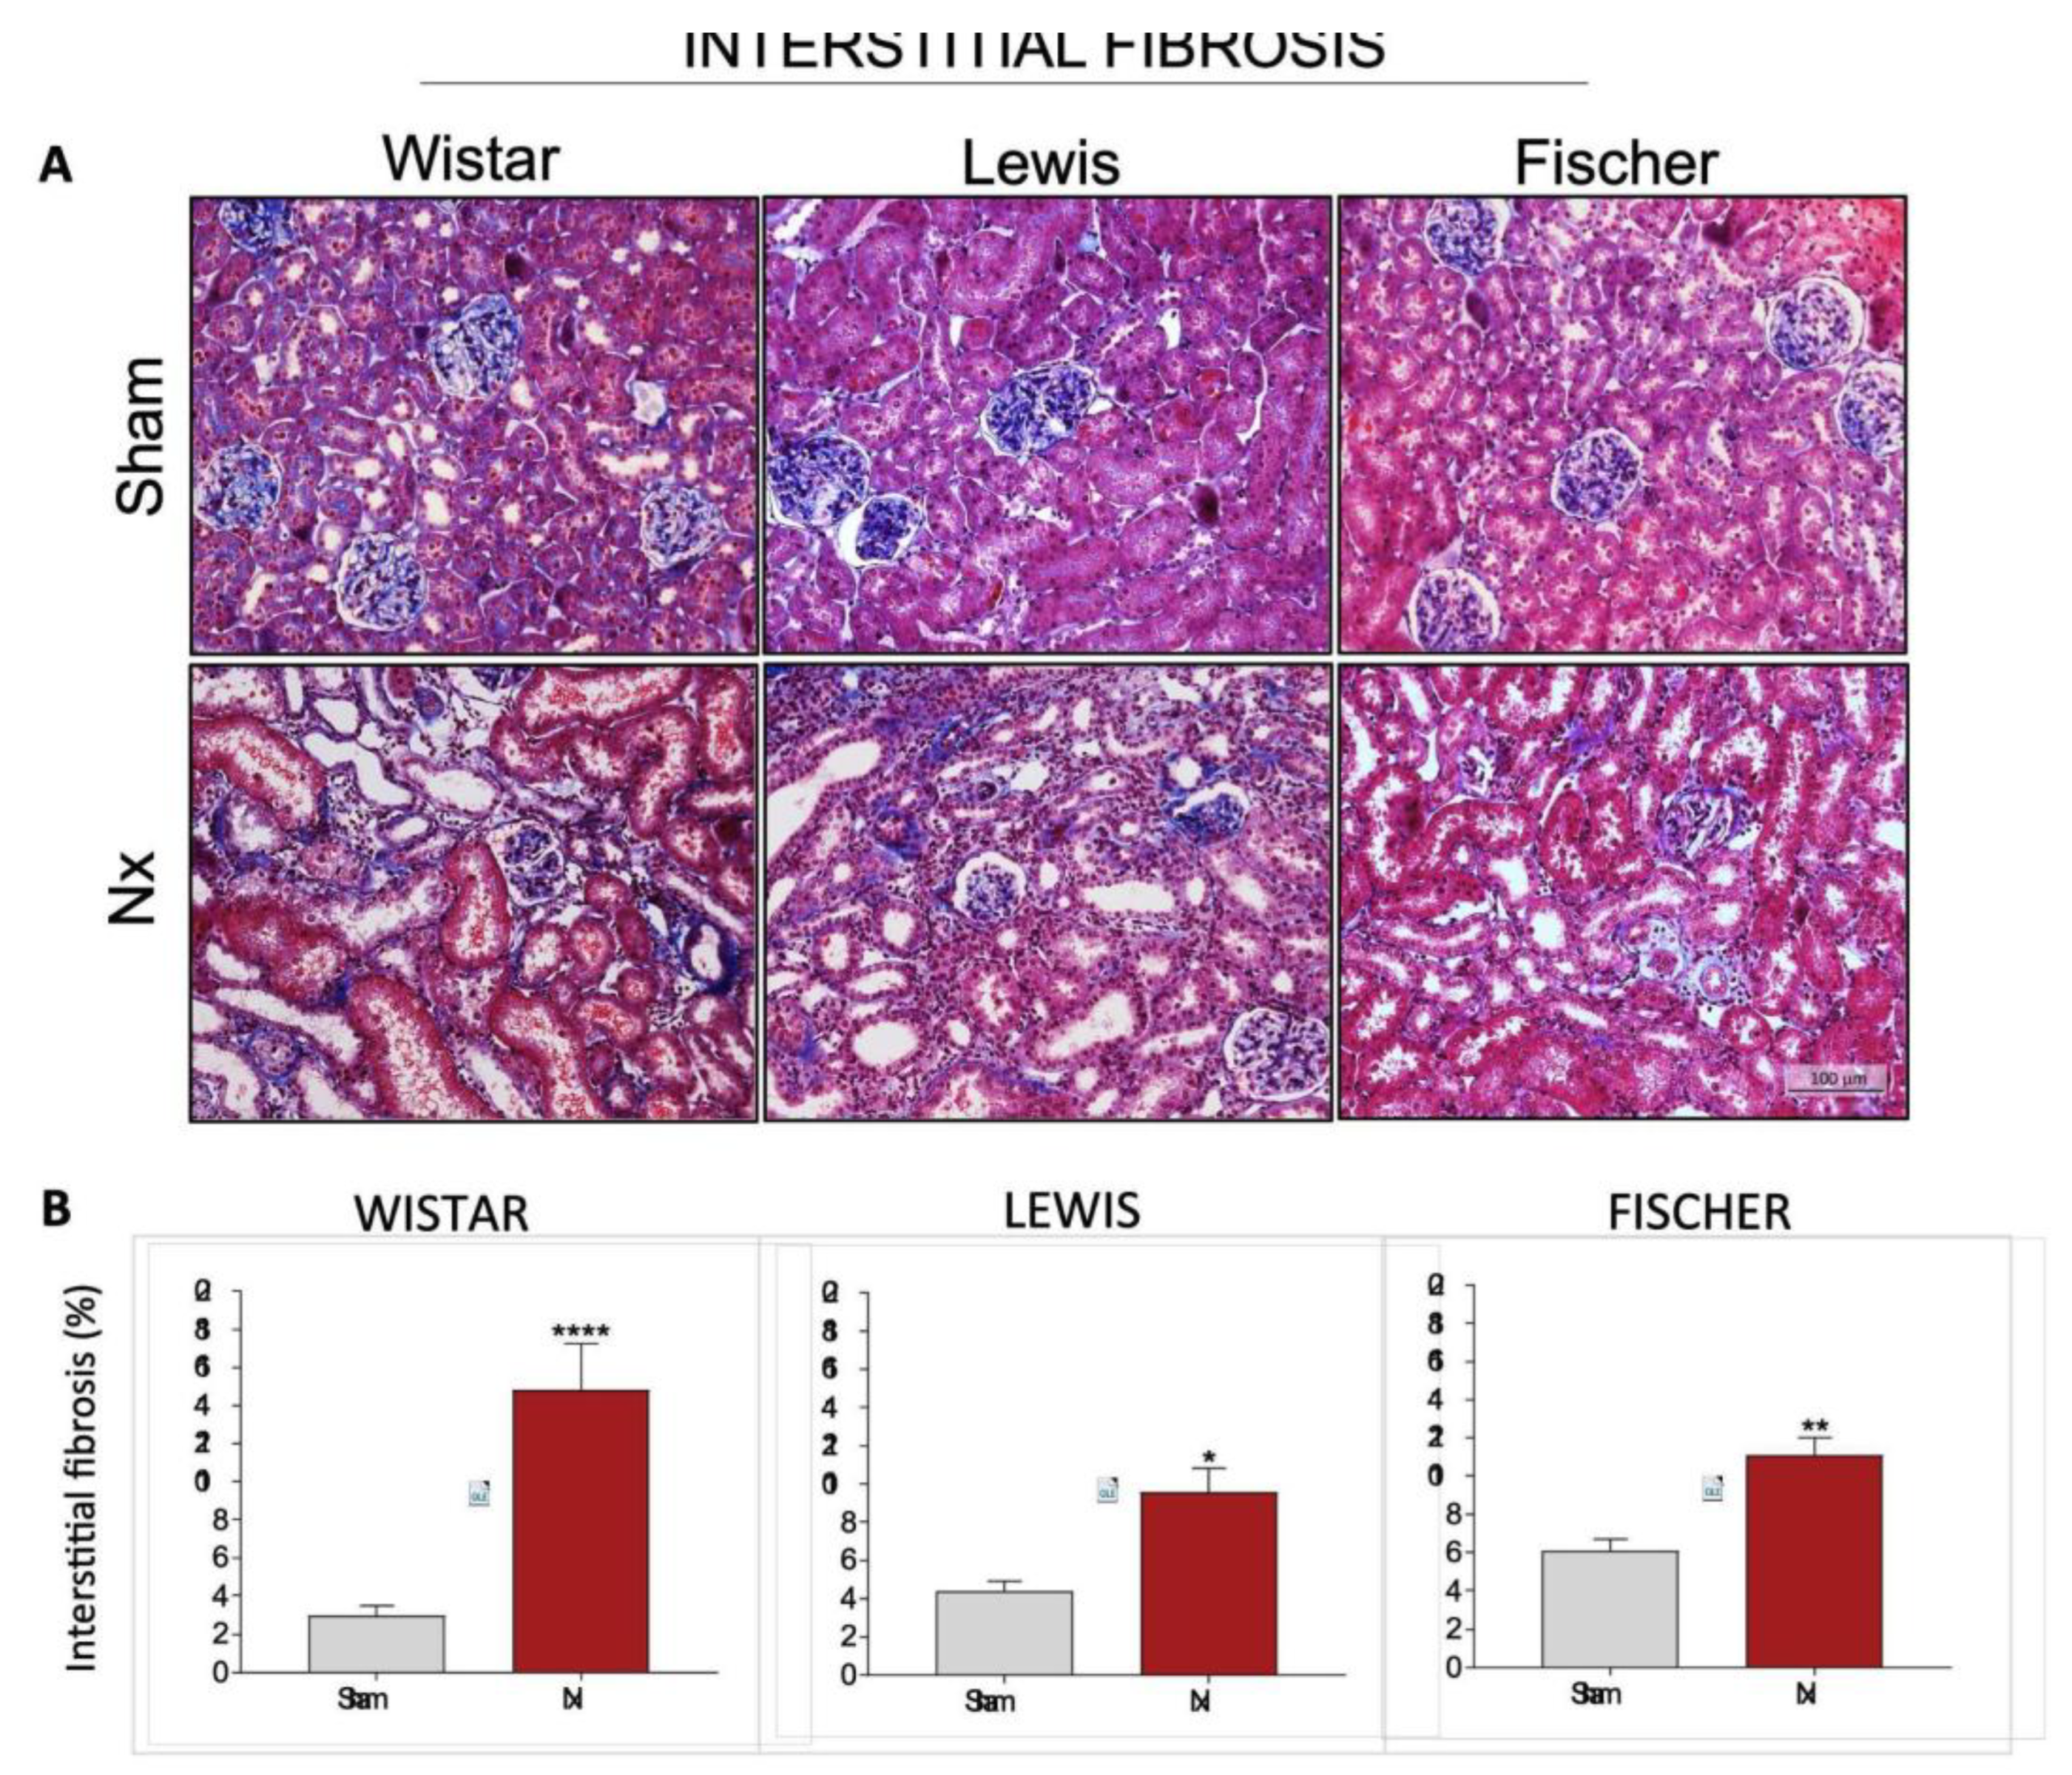
Interstitial expansion and fibrosis were evaluated in renal slides submitted to the Masson Trichrome staining technique. Illustrative microphotographs of each experimental group can be seen in
Figure 9A, while the quantitation of interstitial fibrosis, presented as the percentage of affected interstitial area, can be found in
Figure 9B. Wistar Nx rats presented remarkable interstitial fibrosis after 30 days of CKD induction. Collagen deposition in this group was 5-fold greater than the observed in strain-matched Sham animals. On the other hand, both Lewis and Fischer Nx animals also exhibited significant renal fibrosis compared to their respective Sham groups, however, in these rat strains, interstitial collagen deposition were only around 2-fold greater than the observed in control animals.
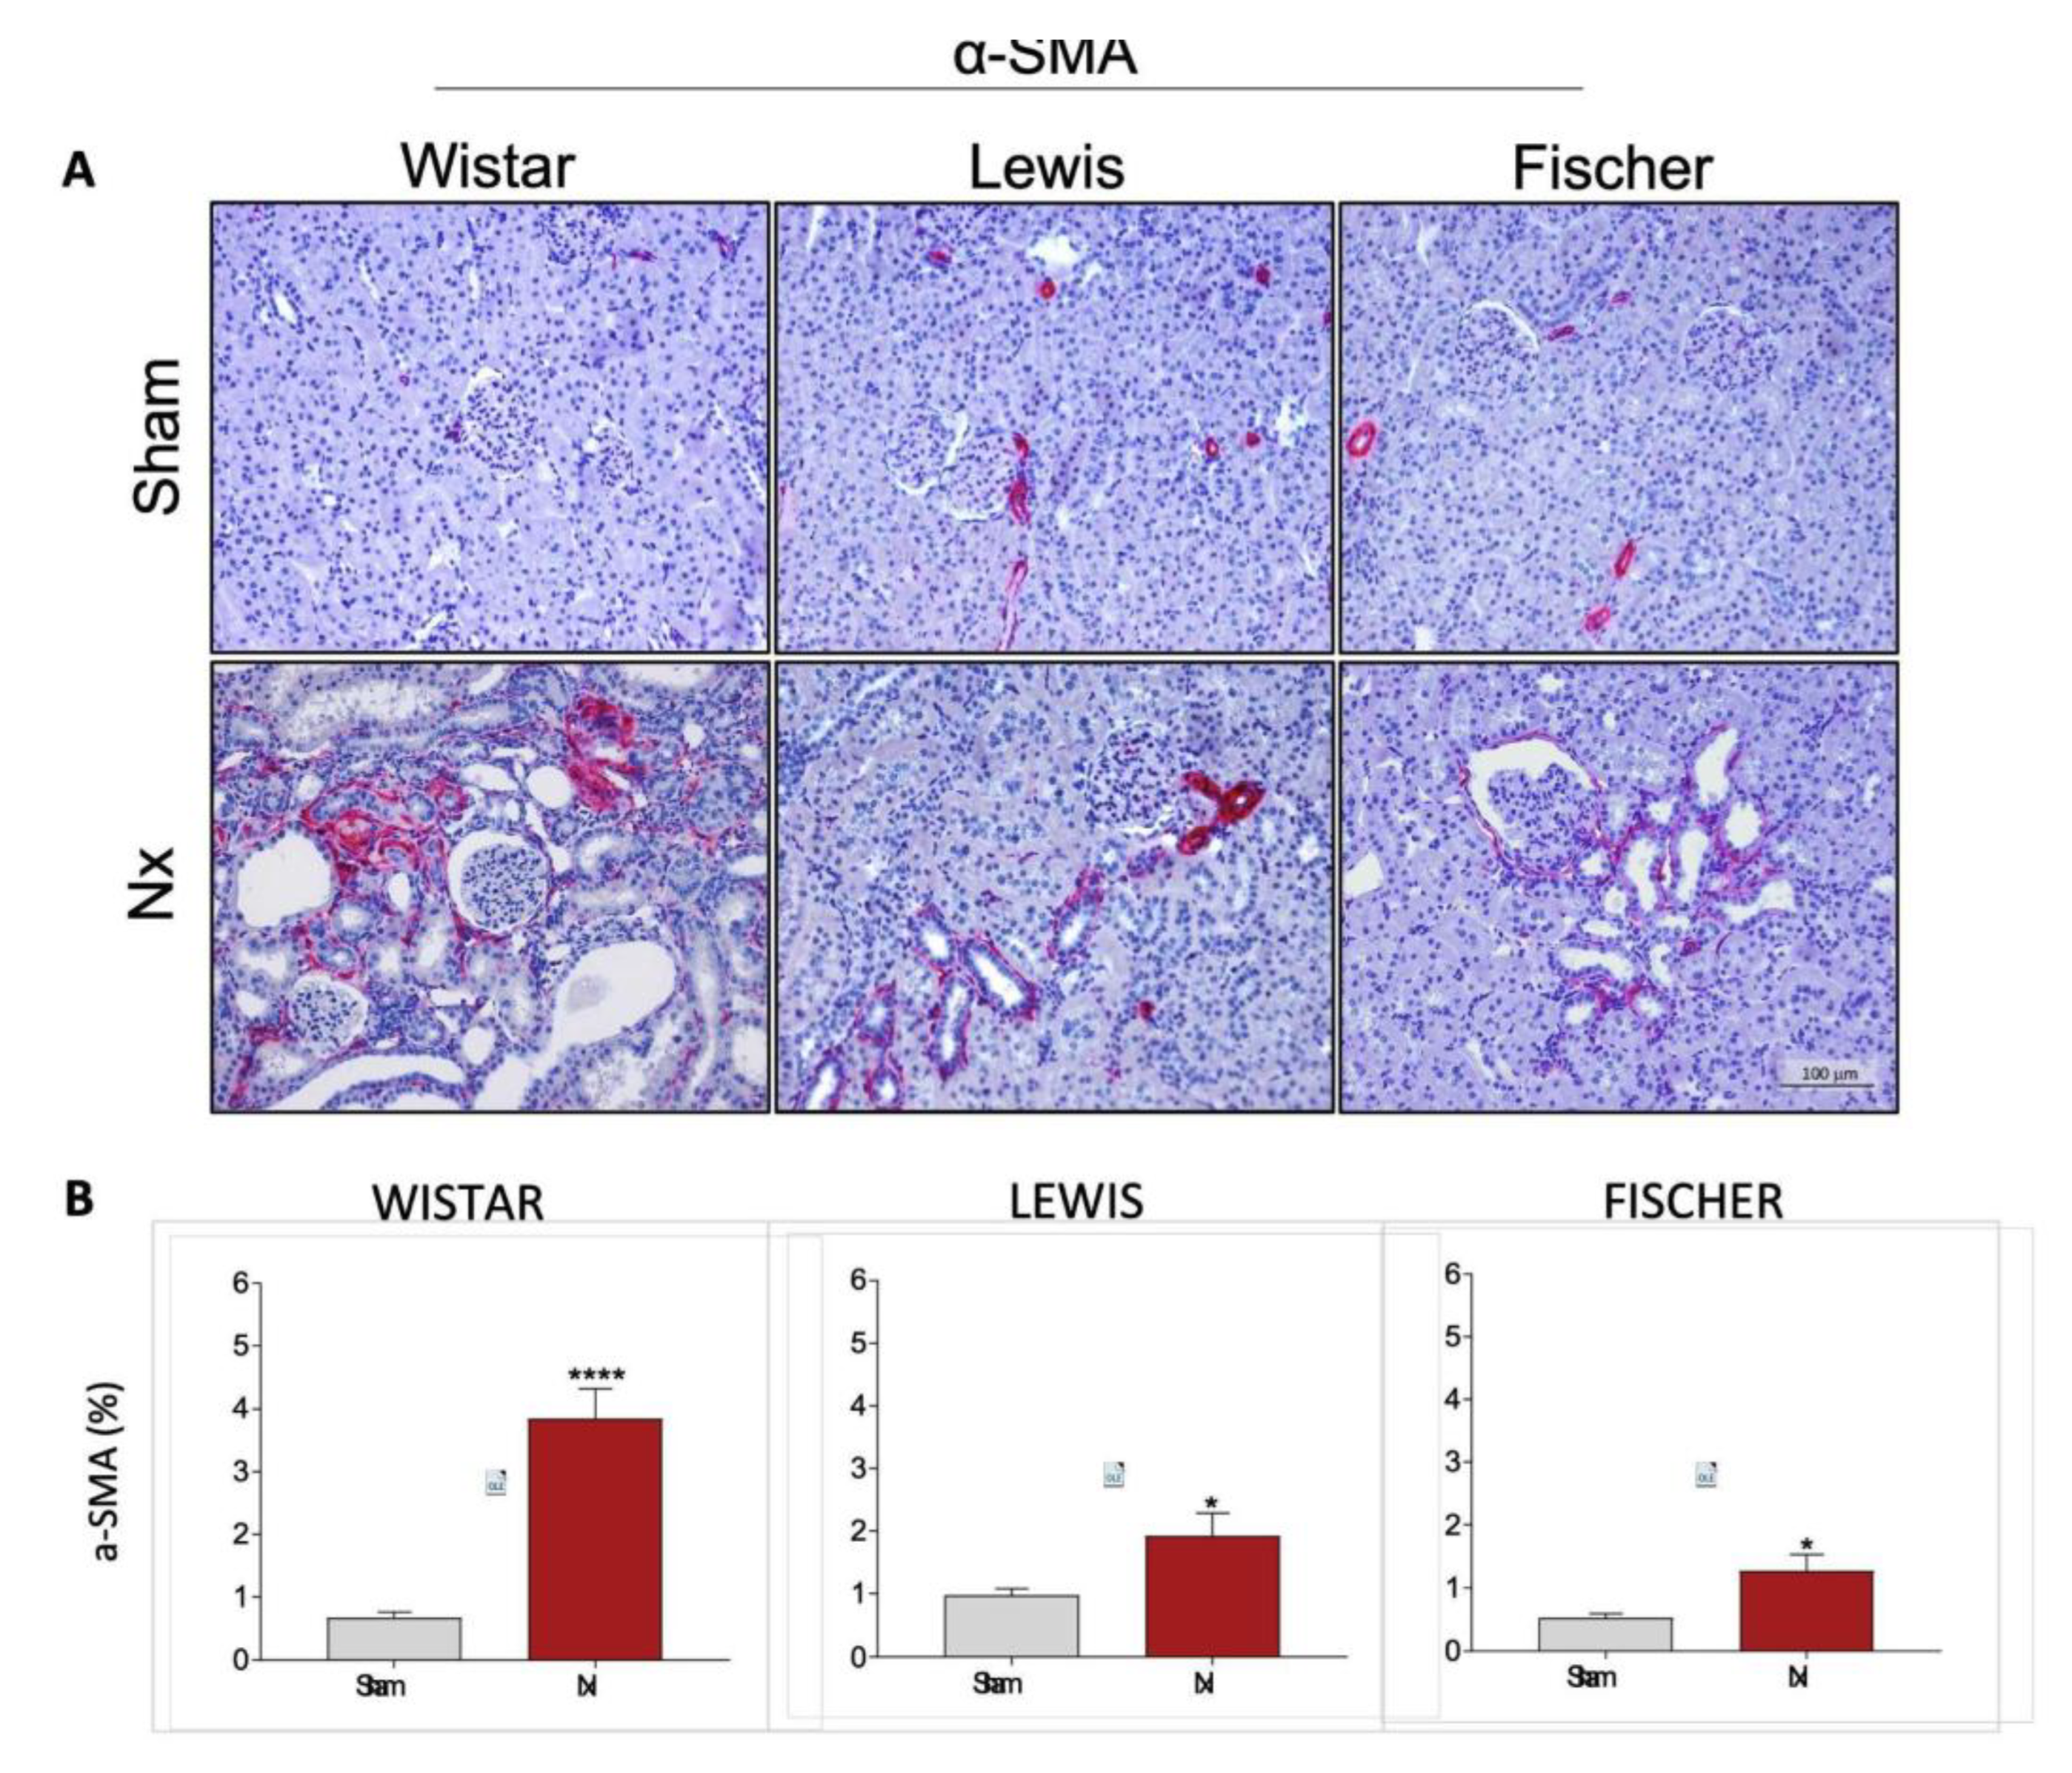
Very similar results were observed when the presence of interstitial myofibroblasts was assessed by immunohistochemistry in the renal slides of animals from each experimental group. Myofibroblasts were identified through the deposition of interstitial smooth muscle α-actin (a-SMA), stained in red. Representative microphotographs of the experimental groups can be seen in
Figure 10A, while the quantitation of the percentage of renal cortical area occupied by -SMA was presented as bar graphs in
Figure 10B. After 30 days of CKD, Wistar animals presented 5-fold more interstitial -SMA accumulation than the observed in strain-matched Sham rats. Conversely, both Lewis and Fischer Nx rats exhibited less prominent, but still significant interstitial -SMA accumulation. Nx rats of these strains presented only around 2-fold more myofibroblasts than those observed in the respective Sham groups.
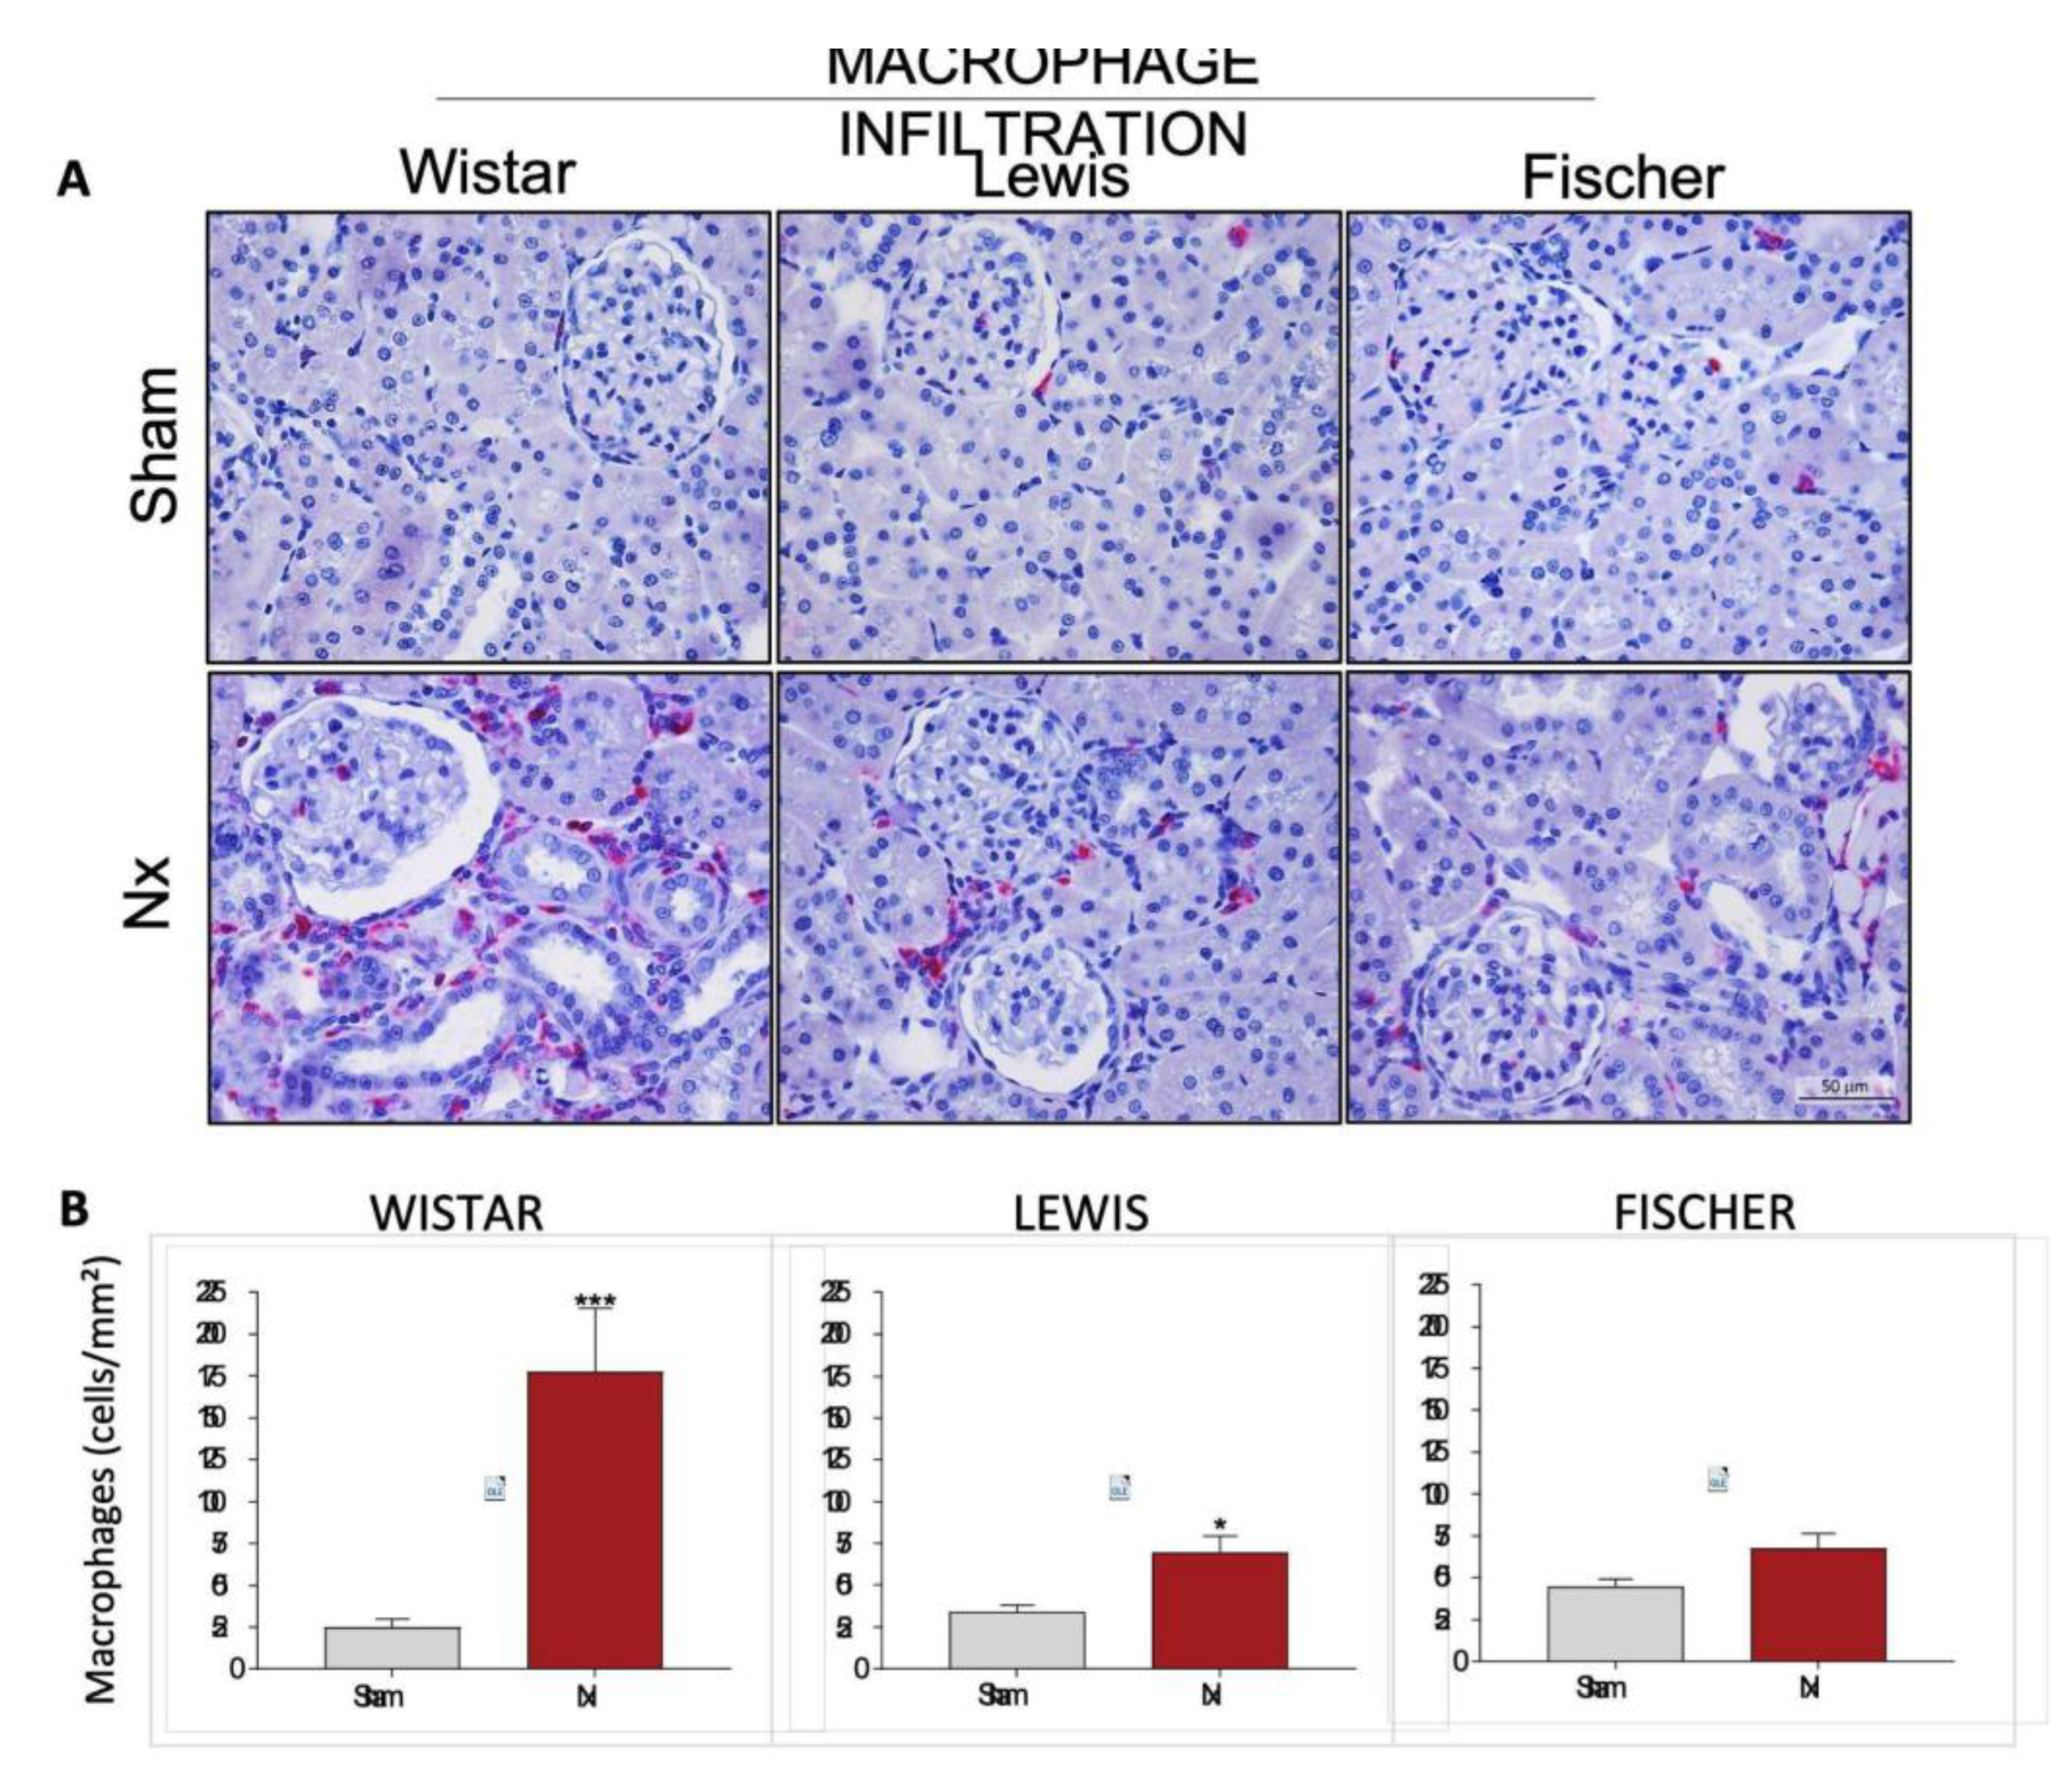
Renal cortical interstitial inflammation was evaluated in the Nx rats through the presence of renal infiltrating macrophages (CD68+ cells), stained in red by immunohistochemistry. Illustrative microphotographs of renal slides from the different experimental groups can be seen in
Figure 11A. The number of infiltrating CD68+ cells per mm
2 were achieved, and the means of each group were presented in a bar graph in
Figure 11B. Macrophage infiltration in Wistar Nx rats is significantly increased compared to strain-matched Sham: 178±38 cells/mm² vs. 25±5 cells/mm². This increase is considerably less expressive in Lewis rats submitted to 5/6 renal ablation, which presented means of 71±10 cells/mm² vs. 34±4 cells/mm² of the respective Sham group. Finally, Fischer Nx rats showed an even less severe increase: 68±9 cells/mm² vs. 45±5 cells/mm² in the Sham group.
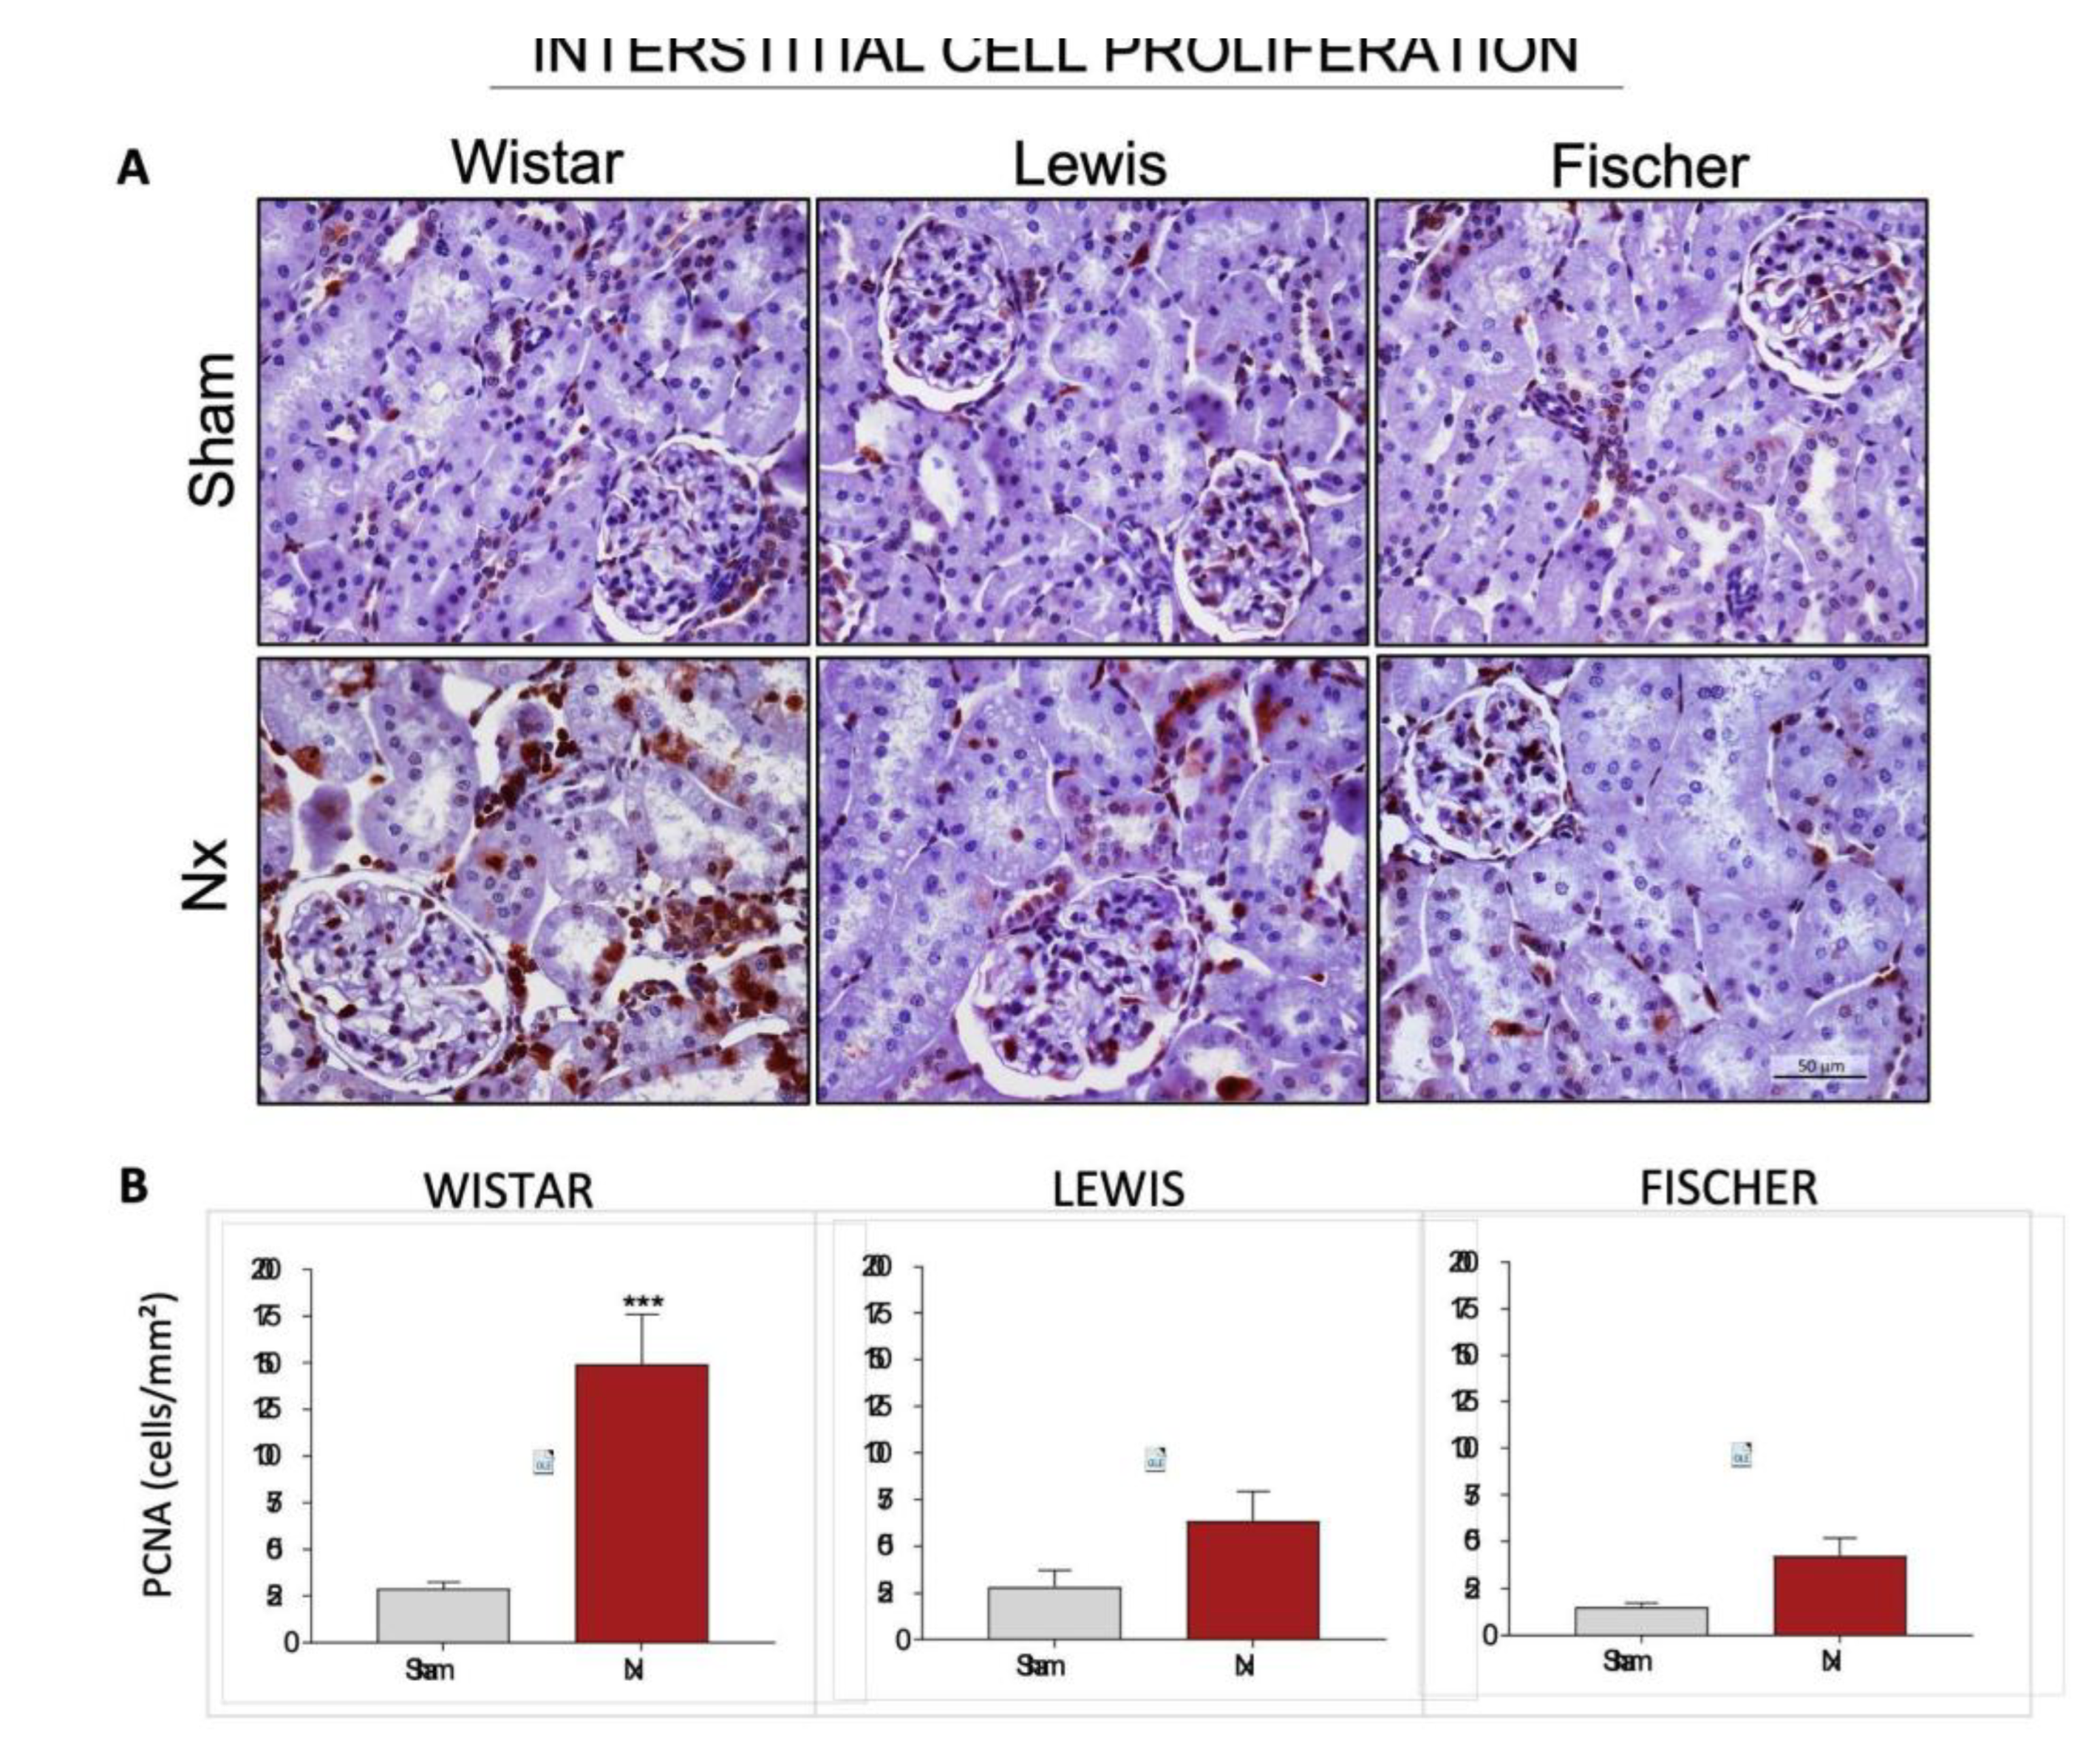
For further evaluation of renal inflammation, we analyzed the presence of Proliferating Cell Nuclear Antigen (PCNA) in the interstitial space of the renal cortex in the different strains of rats.
Figure 12A shows representative microphotographs of immunohistochemistry for PCNA in each group, and
Figure 12B presents the graphs with the corresponding quantifications. Wistar Nx rats exhibited a significant increase in the interstitial cell proliferation rate, with 149±27 cells/mm² vs. 29±4 cells/mm² seen in Wistar Sham group. Both Lewis and Fischer rats underwent 5/6 renal ablation showed milder interstitial cell proliferation, compared to Wistar strain. Lewis Nx animals presented 64±16 interstitial PCNA+ cells/mm² and Fischer Nx, in turn, exhibited only 42±10 interstitial PCNA+ cells/mm², compared to their respective Sham groups (28±9 and 15±2).
The estimated total Nn exhibited by the Sham animals of each rat strain was achieved according to the steps illustrated in
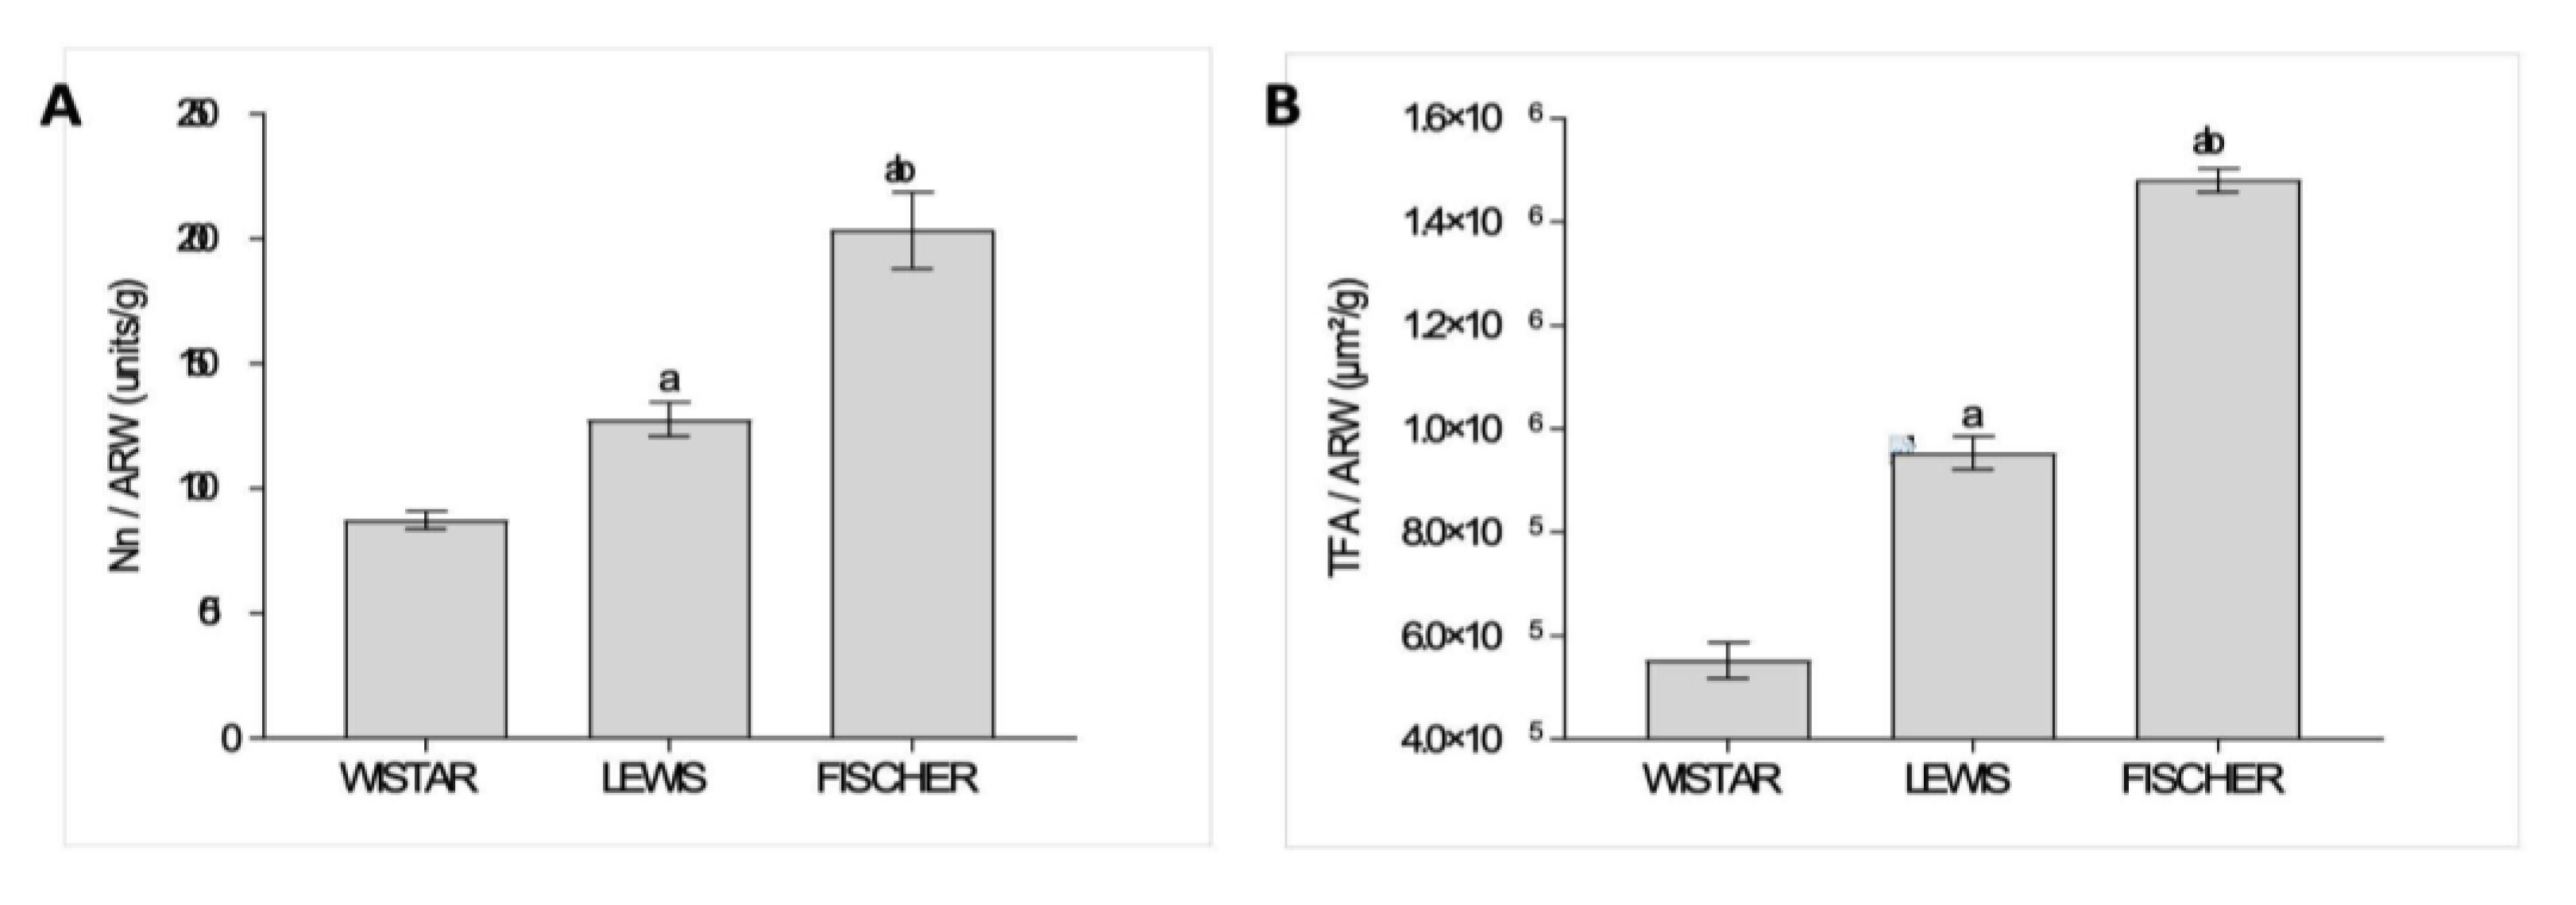
Figure 1, and the obtained raw values were presented in Table 2. In order to compare the significance of the obtained values of total Nn among the different strains of rats, which exhibit different final body weights and, consequently, different absolute cardiac outputs to meet their different total body oxygen demands, we thus divided the Nn by the adult rat body weight (Nn / ARW, unids/g). These results were presented as bar graphs in
Figure 13A. As shown, Wistar rats presented the lowest number of nephrons per gram of body weight among the 3 studied rat strains; only 87±3 units/g. Lewis animals, in turn, presented a slightly higher number of nephrons per gram of body weight:128±7 units/g, which was significantly higher than the observed in Wistar rats. Finally, Fischer animals exhibited the highest number of nephrons per gram of body weight: 203±15 units/g, which was statistically significant, when compared to both Wistar and Lewis strains.
Furthermore, in order to estimate the total glomerular filtration area in each studied rat strain (TFA), we performed the measurement of the glomerular area (mGA) of each experimental Sham group, and thus multiplied this value by the obtained Nn of the respective rat strain. These results are shown in Table 2. Once more, we divided the obtained TFA by the adult rat body weight (TFA / ARW, m
2/g), to compare the impact of the variances in the filtration area in face of the different size of the adult animals and the consequent total body demands of each rat strain. These quotients were presented as bar graphs in
Figure 13B. As shown, Wistar rats presented the smallest TFA/ARW among the 3 studied strains: 6.2x10
5±2.6x10
4 µm
2/g. Lewis rats, in turn, exhibited a significantly bigger quotient of TFA/ARW (9.5x10
5±3.1x10
4 µm
2/g), when compared to the Wistar animals. Finally, Fischer rats presented the biggest quotient of TFA/ARW, among the 3 studied rat lineages (1.5x10
6±2.3x10
4 µm
2/g), exhibiting statistical significance when compared to both Wistar and Lewis animals.
4. Discussion
The 5/6 nephrectomy in rats is a widely employed CKD model, used both to clarify unravel aspects of kidney pathophysiology and to the development and testing of new therapeutic strategies and drugs, designed to detain human CKD. According to the literature, the Nx model is one of the best ways to mimic human nephropathy features in rodents, since the animals underwent renal ablation commonly progresses with severe hypertension, increased cardiovascular risk, high mortality, pronounced proteinuria and albuminuria, caused by the structural disruption of the glomerular filtration barrier, and renal histological changes, such as glomerulosclerosis and tubulointerstitial inflammation and fibrosis. In spite of it, there are currently few references regarding the best rat strain to be employed for 5/6 renal ablation [
13,
15,
19].
It is well-known that the gravity and the rate of CKD progression amply varies according to the genetic background of patients, as well as to their lifestyle habits and even to environmental influences, among many other still unknown factors. Different patients affected by the same type of nephropathy, caused by the same etiology, may present completely distinct progression patterns of CKD. Thus, the characterization of CKD models, which evolve with different rhythms of renal function loss, may be of special interest to better resemble slow and rapidly progressive human nephropathy and to perform both quick and long-term drug tests [
20,
21].
In the present study, we show that male albino rats from 3 different strains (Wistar, Lewis, and Fischer) of the same species (Rattus norvegicus) and with equivalent body weight, exhibited completely distinct biological responses and patterns of nephropathy progression when subjected to a highly standardized 5/6 renal ablation model. Corroborating the literature, Nx Wistar rats developed severe and rapidly progressive hypertension, associated to a mortality rate of 17%, mainly caused by cardiovascular events. Although also presenting an initial increase in SBP, both Nx Lewis and Fischer animals exhibited no progression of this parameter between 15 and 30 days of follow-up, and no associated mortality. Interestingly, control Fischer rats are known to present higher baseline blood pressure, due to a hyper-reactive cardiovascular response to stress and a more anxious temperament, compared to both Wistar and Lewis animals, which make our findings with Fischer Nx even more significative. [
22,
23,
24,
25].
Along with the development of malignant hypertension, corroborating previous studies, Wistar rats shown massive proteinuria and albuminuria, as soon as 15 days after renal ablation, which doubled after 30 days of Nx, reaching nephrotic levels by the end of the study period. Moreover, Wistar Nx animals exhibited exuberant compensatory remnant kidney hypertrophy and severe glomerulosclerosis after 30 days of CKD induction. Compensatory hyperfiltration in the remaining nephrons of an injured kidney usually occurs at the cost of developing glomerular hypertension. In conditions of renal mass loss (for example, after removal of a kidney or due to progressive kidney disease), the remaining nephrons attempt to compensate for the lost function. This process involves the vasodilation of afferent arterioles and the vasoconstriction of the efferent arterioles, resulting in an increase in intraglomerular blood pressure in the remaining nephrons [
5]. This increase in pressure raises the individual glomerular filtration rate (GFR), a mechanism known as hyperfiltration, which helps to keep the total GFR of the kidney as close to normal as possible. Although this mechanism is beneficial in the short term for maintaining renal function, sustained glomerular hypertension and hyperfiltration are considered key factors that contribute to the progression of renal injury and sclerosis in the long term. Glomerular hypertension exerts mechanical stress on the glomerular endothelial walls, leading to endothelial lesion and to the establishment of local inflammation, with leukocyte migration, mesangial cell proliferation, extracellular matrix overproduction and podocyte damage. Once injured, the glomerular filtration barrier loses its selectivity, leading to the glomerular excretion of macromolecules, such as albumin, to the tubular lumen. Abnormal protein concentration into the tubules can, itself, be a pro-inflammatory stimulus for the tubulointerstitial compartment, promoting the infiltration of inflammatory cells in the renal parenchyma, as well as increasing local fibroblasts proliferation and differentiation into myofibroblasts, which in turn, lead to exacerbated extracellular matrix deposition and to the development of tubulointerstitial fibrosis. Accordingly, Wistar rats subjected to the Nx model exhibited significant tubulointerstitial macrophage infiltration, increased interstitial cell proliferation, myofibroblasts accumulation and significant interstitial fibrosis deposition. [
4,
5,
26,
27,
28,
29].
Surprisingly, Lewis Nx rats presented only mild proteinuria and albuminuria, and Fischer Nx animals not even developed any alteration in the UPE and UAE levels, compared to the controls. Similar findings were observed regarding renal hypertrophy and glomerulosclerosis. Consequently, even under the same injury inflicted on Wistar rats by the 5/6 renal mass reduction, Lewis, and specially, Fischer rats developed less or no renal interstitial inflammation and fibrosis.
Such discrepancy in the biological response of the different studied rat strains to the Nx model observed in our study, can be related to the difference in the age of the animals when subjected to CKD induction. Since Wistar, Lewis and Fisher rat lineages exhibit different growth curves, rats from these strains were submitted to 5/6 renal ablation at different ages. Wistar rats became eligible for the experimental model at about 42 days (5 weeks) of life, when, although sexually mature, these animals can still be considered as preadolescents at the beginning of their growth spurt. On the other hand, Lewis rats achieve the required body weight for Nx surgery after 63 days (9 weeks) of birth, and Fischer animals only reach the same body weight when they are 105 days (12 weeks) old. Which means that both isogenic lineages underwent renal ablation only after the complete body development, when they can be already considered young adults. According to comparisons between classical studies employing the 5/6 renal ablation model, the age in which CKD is induced in the animals may change the development rhythm of the nephropathy. Tain and collaborators suggested that very young Sprague-Dawley animals (1-2 weeks of age) submitted to renal ablation rapidly developed more severe hypertension, creatinine and urea retention, compared to adult animals [
30,
31,
32,
33].
Another very reasonable explanation for the renoprotection exhibited by Lewis and specially by Fischer rats, compared to Wistar animals could be a higher basal number of nephrons. It is widely known that the number of nephrons at birth is strongly related to a higher or lower predisposition to develop CKD in adulthood. People with kidneys considered small relative to their body mass have a higher incidence of hypertension and albuminuria, suggesting that these individuals have a smaller number of nephrons and, consequently, deal with renal overload, even in the absence of an initial renal injury [
34,
35].
Here we demonstrated that Lewis and Fischer rats have, respectively 1.4x and 2.3x more nephrons per gram of body weight in adulthood, compared to Wistar rats. Additionally, control Fischer rats also exhibits a slightly larger glomerular area mean, compared to both Lewis and Wistar animals. Put together, these specific strain features, confers to Fischer rats a larger filtration area relative to the body weight in adulthood, which may have significantly contributed to the resistance of these rats in developing and progressing CKD. It is possible that the reduction of 5/6 in renal mass of Fischer rats had a smaller effect on the overall renal function of these animals, due to their greater basal number of nephrons and total filtration area [
36,
37,
38,
39,
40].
Moreover, another potential factor that may have contributed for the different inflammatory response observed across the 3 studied rat strains is their distinct baseline hematological profiles. According to data provided by Charles River Laboratories, there are considerable differences in circulating white blood cells amount Wistar, Lewis and Fischer rats. Of note, Wistar animals exhibit higher baseline number of circulating neutrophils and lymphocytes compared to the Lewis strain. Conversely, Fischer rats present the lowest total leukocyte counts among the three lineages. Inherent differences in the immune cell repertoire likely influence the magnitude of the systemic inflammatory response in experimental models. In the specific case of Fischer rats, this milder immune response may be further reinforced by their hyper-responsive hypothalamic-pituitary-adrenal (HPA) axis; the resulting higher basal corticosterone levels are known to exert an immunosuppressive effect, limiting leukocyte proliferation and recruitment. Although the singular hematological profile for each strain is a promising explanation for their response, we cannot discard the possibility that the higher nephron numbers are a crucial factor for the presented results. [
41,
42,
43,
44,
45,
46].
Figure 1.
Illustrative scheme of the method employed to estimate the total nephron number in the studied rat strains. After counting the number of glomeruli in all renal sections of the right kidney of each animal, and multiplying this number by the correction factor (4/3), as illustrated, the obtained value was further multiplied by 2, in order to estimate the total Nephron number (Nn) per rat, in both kidneys.
Figure 2.
(A) Growth chart of the three studied rat strains. The highlighted rectangle represents the range of body weight in which the animals underwent 5/6 renal ablation for CKD induction. (B) Bargraph of the mean age, in weeks, in which the different strains of rats became eligible for 5/6 renal ablation, according to their body weight. *:p<0,05 vs. Wistar, #:p<0,05 vs. Lewis.
Figure 3.
(A) Time-course BW changes (g) of all experimental groups, along the study period. (B) Body weight (g) of all experimental groups at end of the protocol. *:p<0.05, **:p<0.01, ***:p<0.001, and ****:p<0.0001 vs. respective Sham.
Figure 3.
(A) Time-course BW changes (g) of all experimental groups, along the study period. (B) Body weight (g) of all experimental groups at end of the protocol. *:p<0.05, **:p<0.01, ***:p<0.001, and ****:p<0.0001 vs. respective Sham.
Figure 4.
(A) Time-course SBP changes (mmHg) of all experimental groups, along the study period. (B) SBP (mmHg) of all experimental groups, at the end of the protocol. C) Delta graphs of SBP (mmHg), obtained by subtracting the values observed at 30 days from those observed in the beginning of the study. *:p<0.05, **:p<0.01, ***:p<0.001, and ****:p<0.0001 vs. respective Sham.
Figure 7.
(A) Relative creatinine clearance (CrCl,%), (B) Serum urea (SUr, mg/dL), (C) Renal hypertrophy index and (D) Glomerular volume (μm3), after 30 days of CKD induction. *:p<0.05, **:p<0.01, ***:p<0.001, and ****:p<0.0001 vs. respective Sham.
Figure 7.
(A) Relative creatinine clearance (CrCl,%), (B) Serum urea (SUr, mg/dL), (C) Renal hypertrophy index and (D) Glomerular volume (μm3), after 30 days of CKD induction. *:p<0.05, **:p<0.01, ***:p<0.001, and ****:p<0.0001 vs. respective Sham.
Figure 8.
(A) Representative microphotograph panel of PAS-stained renal slides, of each experimental group, under 400x magnification. (B) Bar graphs of glomerulosclerosis quantification (%). *:p<0.05, **:p<0.01, ***:p<0.001, and ****:p<0.0001 vs. respective Sham.
Figure 8.
(A) Representative microphotograph panel of PAS-stained renal slides, of each experimental group, under 400x magnification. (B) Bar graphs of glomerulosclerosis quantification (%). *:p<0.05, **:p<0.01, ***:p<0.001, and ****:p<0.0001 vs. respective Sham.
Figure 9.
(A) Representative microphotograph panel of renal slides from each experimental group, submitted to the Masson trichrome staining technique, under 200x magnification. (B) Bar graphs of interstitial fibrosis quantification (%). *:p<0.05, **:p<0.01, ***:p<0.001, and ****:p<0.0001 vs. respective Sham.
Figure 10.
(A) Representative microphotograph panel of renal slides from each experimental group, submitted to imunohistochemistry for α-SMA, under 200x magnification, for myofibroblasts detection. (B) Bar graphs of the interstitial deposition of α-SMA (%). *:p<0.05, **:p<0.01, ***:p<0.001, and ****:p<0.0001 vs. respective Sham.
Figure 11.
(A) Representative microphotograph panel of renal slides from each experimental group, submitted to imunohistochemistry for infiltrating macrophages (CD68+ cells), under 400x magnification. (B) Bar graphs of the quantification of tubulointerstitial infiltration by macrophages (CD68+ cells /mm²). *:p<0.05, **:p<0.01, ***:p<0.001, and ****:p<0.0001 vs. respective Sham.
Figure 12.
(A) Representative microphotograph panel of renal slides from each experimental group, submitted to imunohistochemestry for PCNA+ cells, under 400x magnification. (B) Bar graphs of the quantification of interstitial PCNA+ cells (cells/mm²). *:p<0.05, **:p<0.01, ***:p<0.001, and ****:p<0.0001 vs. respective Sham.
Figure 13.
Relative Number of nephrons and glomerular filtration area in the different rat strains. (A) Nephron number corrected by the adult rat body weight (Nn/ARW, unids/g), in each studied rat strain. (B) Total glomerular filtration area corrected by the adult rat body weight (TFA/ARW, , µm²/g). a:p<0,05 vs. Wistar, b:p<0,05 vs. Lewis.