
Submitted:
01 January 2026
Posted:
05 January 2026
You are already at the latest version
Abstract
Methane emissions from end-use installations in residential natural gas systems remain poorly quantified, despite their importance to both safety and climate policies worldwide. While distribution networks and appliances have received research attention, interior piping between the meter and appliances represents a critical knowledge gap. To address this gap, a systematic survey of 473 residential systems in Saarlouis, Germany was conducted using standardized pressure-decay tests (DVGW G 600). Measurements were performed during the installation of gas regulators necessitated by a grid pressure increase from 23 mbar to 55 mbar above ambient. This provided a unique opportunity to assess whole-system leakage under controlled conditions without installation modifications. Leak rates were standardized to reference pressure and converted to methane emissions using measured gas composition. A total of 411 (86.9%) installations showed no detectable leak rate (LDL: 0.2 l h-1). However, seven systems (1.5%) exceeded 1 l h-1, and one surpassed the unacceptable threshold of 5 l h-1. Mean emissions across all systems were 0.067 [0.041, 0.098] g h-1, with smaller installations showing higher volume-normalized rates. Critically, fewer than 1.48% of systems contributed more than 46% of total emissions, demonstrating a strongly skewed, heavy-tailed distribution. Scaled nationally using Monte Carlo methods accounting for sampling uncertainty and skewed distributions, residential interior piping contributes 12.30 [8.11, 18.55] Gg yr-1 to Germany's methane emissions. These results emphasize the need to include residential leak rates in emission inventories and highlight the efficiency potential of targeted mitigation strategies focused on high-emitting installations under evolving EU methane regulations.
Keywords:
residential installations
; methane emissions
; methane emission quantification
; natural gas leakage
; national emissions
1. Introduction
Natural gas consists primarily of methane (CH4) and is widely used in residential buildings for heating, cooking, and hot water generation. Methane is typically extracted from underground geological formations such as shale, sandstone, or coal seams. After upgrading at gas processing facilities, gas delivered to customers has methane fractions of 90-97%, with liquified natural gas (LNG) supplies tending toward the high end of this range [1]. Downstream variations in gas composition across regions may influence leakage characteristics and indoor exposures [2]. While it is an important energy source, methane is a potent greenhouse gas with a global warming potential (GWP) of 28 over 100 years [3]. As a result, methane is responsible for approximately ¼ of global radiative forcing [3]. Methane also poses safety risks when mixed with air. In concentrations between and [4], it can form explosive atmospheres [5]. In residential buildings, gas explosions may occur due to undetected leakage from sources such as aging infrastructure or faulty appliances, resulting in property damage, injuries, and fatalities. Recent work has shown that stoves, ovens, and water heaters are possible contributors to unburned methane emissions in homes [6,7,8].
In Germany, residential gas installations are regulated by the Deutscher Verein des Gas- und Wasserfaches (German Technical and Scientific Association for Gas and Water) (DVGW). Installations are typically built entirely inside a residential building, such as in the basement, a garage, or a dedicated room, and include the main shut-off valve, regulators, and meters. In exceptional cases, they can also be located outside of a building but still require a protective cover such as a cabinet gas-distribution point. DVGW regulations require annual visual inspections and leakage testing every twelve years, with responsibility falling to the property owners [9,10]. Grid operators carry out leakage checks during routine service operations, such as meter or regulator replacements. These inspections are primarily compliance-driven and do not systematically quantify emissions. Despite regular reporting of methane emissions from public gas distribution networks, data on leakage from end-use residential systems remain limited. Existing studies mainly focus on measurements of specific equipment or applications, such as metering or regulators [11,12,13,14]. Only a few studies have quantified indoor leaks directly, using either targeted measurement methods [15] or meter installation campaigns [16].
Accurate emission rates are difficult to establish with leakages occurring at numerous points of a distribution system. This has resulted in persistent discrepancies between bottom-up and top-down inventories for urban methane emissions. Results from projects focussing on areal surveys, such as INFLUX, often show higher emission rates than can be explained by the existing source-level based inventory data [17,18,19]. Similar to (CO2), emission factors for methane in residential installations are essential for understanding urban greenhouse gas emissions and their budgets [20,21].
Most prior studies have focused on specific equipment and do not include interior piping or appliance leaks occurring upstream of the burner control. However, a few studies, such as Fischer et al. [22], have performed whole-house measurements that capture these sources. This study leverages a unique opportunity provided by a municipal grid upgrade campaign in a German city, where systematic whole-system leak measurements were conducted on 473 residential installations using standardized pressure-decay protocols during regulator installation. The study therefore fills a unique niche between external leakage sources, such as distribution pipelines and infrastructure, and end-use appliances, which have received more research attention but remain incompletely characterized, particularly in European contexts.
Given the evolving regulatory requirements, particularly driven by the European Union’s Methane Emissions Monitoring and Verification Regulation, this work supports the development of more accurate emission factors for the residential sector.
To the authors’ knowledge, this study represents the first systematic, bottom-up assessment of methane leak rates from residential interior gas piping in a European context, filling a gap between prior work on distribution network infrastructure, individual appliance emissions [6,7], top-down atmospheric surveys [23], and small-scale targeted measurements [15].
This study addresses three key research questions. First, what is the distribution of methane leak rates in residential interior gas installations in a representative German urban area? Second, how do these leak rates scale to estimate national-level emissions from this sector? Third, what fraction of total emissions is attributable to high-emitting installations in this heavy-tailed distribution, and what are the implications for targeted mitigation strategies?
To address these questions, whole-system leak measurements were conducted during a grid upgrade campaign in Saarlouis, Germany. The study combines 473 standardized pressure-decay tests in accordance with DVGW G 600 using probabilistic upscaling via Monte Carlo methods, substantially exceeding typical residential study sample sizes (N<100) and enabling robust characterization of the heavy-tailed emission distribution. Measurements necessitated by an operational grid upgrade provided realistic leak quantification without installation modifications, capturing interior piping leaks while isolating from appliance operational emissions. These emission factors inform national greenhouse gas inventories under EU Methane Regulation, targeted leak detection and repair (LDAR) strategies, and infrastructure readiness for hydrogen transition.
2. Materials and Methods
The whole-system leak measurements conducted during a grid upgrade campaign in Saarlouis, Germany, are described including the measurement protocol, data analysis approach, and probabilistic methods for scaling results to the national level.
2.1. Study Area
The gas grid in Saarlouis is operated by Stadtwerke Saarlouis GmbH, a grid operator that is also responsible for water, electricity, telecommunications, and district heating in the city of Saarlouis [24]. The grid evolved from a coal gas grid, which was converted to a natural gas grid in the 1970s. Initially supplying only the historic center and its former industries, it eventually grew to supply modern suburban districts as well. The analysis covers installations constructed in the 1950s through to modern installations built in the 2020s. The interior piping systems include appliances between 25 kW and 400 kW with single or multi-metering installations. They cover systems with single or mixed materials, such as unalloyed steel, copper pipes, malleable cast iron, multilayer composite pipes, or stainless steel corrugated pipes. An unknown number of residential installations have been in operation for over 50 years, while others have been updated several times since they first went into operation. These residential installations are used in single- and multi-family homes, commercial establishments, kindergartens, schools, retirement homes, and social buildings.
The measurements presented in this study were conducted during a grid pressure upgrade campaign initiated by the utility operator. The grid operating pressure was to be increased from 23 mbar to 55 mbar above atmospheric pressure, which necessitated the installation of gas pressure regulators at individual residential connections to maintain the downstream operating pressure at 23 mbar above ambient. To ensure the safety of grid operation after this pressure increase, whole-system leak rate measurements were performed for each installation before regulator installation and before overall grid pressure increase. This operational context provided a unique opportunity to conduct systematic leak quantification across a large sample of installations without requiring modifications to existing systems. Homeowners were informed about the measurement campaign and the results, and were asked to take action to reduce leak rates if necessary. No installation was modified before conducting the leak measurements. Appliances were turned off during testing, isolating interior piping leaks from operational appliance emissions. The protocol targeted pipes and connections between the meter and appliances.
The 473 leakage tests were carried out in 2024 in a residential area representative of average middle-class living areas in Germany. This represents 8.3% of all 5,712 installations in Saarlouis [25].
The sample size of 473 installations (8.3% of Saarlouis total, 0.0025% of German total) was determined by the grid operator’s infrastructure requirements rather than a priori sample size calculations. Post-hoc analysis indicates this sample size provides >90% probability of detecting the observed high-emitter prevalence (1.5% exceeding 1 ) with 95% confidence, assuming binomial sampling. For estimating the mean emission rate, the observed 95% confidence interval spans ±46% of the mean (0.067 [0.041, 0.098] ). Standard sample size formulas for estimating a mean with coefficient of variation CV≈0.5 (based on the observed skewed distribution) indicate that N≈400 installations are required to achieve ±20% precision at 95% confidence, confirming the adequacy of the sample for central tendency estimation. However, for the rarest events (installations exceeding 5 , with only 1 case observed), the sample provides limited precision, reflected in wide confidence intervals for the highest-emission bins in the national upscaling.
The area and the installations were chosen based on the requirements of the grid operator for increasing the grid pressure. These include human capacity constraints, overall budget, and the possibility of hydraulically separating part of the grid from the mesh grid using an existing gas governor station for the gas supply. Another variable was the high demand in winter combined with height differences in the grid regularly resulting in increased emergency services due to pressure deviations. By increasing the grid pressure to a higher level and installing gas regulators for each installation, it is possible to minimize these emergency service calls. A first part of the grid pressure was increased in 2010, a second part in 2023, and a third part in 2024, with more to follow.
Especially during the recent energy crisis in Europe, it became apparent that low-pressure producer gas systems are not suitable for emergency situations. They lack technology that protects houses from unexpectedly high or low pressures, such as gas failsafe devices. High pressures can lead to dangerous incidents, such as one in Massachusetts [26], where several houses were damaged by explosions and fires due to missing over-pressure protection. A similar incident happened in Germany in 1988, when the over-pressure protection in a main line was blocked due to technical failures resulting in explosions and fires in residential buildings as well as fatalities [27]. The installation of gas regulators helps the grid operator mitigate risks resulting from too high or too low grid pressures.
2.2. Measurement Method
The tests were carried out during installation of gas pressure regulators, which had not been part of any existing installation. This offered a controlled and consistent testing opportunity where the gas meter was temporarily removed and the measurement device was connected at the same location. No modifications to the installation systems were necessary, which ensured a realistic leakage behavior of the entire interior gas installation, including all piping and gas appliance inlets.
The procedure always covered the entire interior gas installation, including all accessible pipes, joints, and appliance connection points. As shown in Figure 1, the data collection includes all piping of the residential system as marked in yellow. The procedure allowed a consistent testing of the entire system, preserving realistic leaking conditions. The measurement device was attached at the location of the meter (2) and allowed measuring the installation between the main shut-off valve (1) and the gas appliances (3) and (4). For the measurement, the meter had to be temporarily removed; the appliances were deactivated but still connected to the installation.
The measurement protocol followed several steps from informing the customer all the way to notifying homeowners when possible leakages were discovered. The initial homes chosen were those where installations were expected to be easiest and where gas service lines had been renewed recently. Afterwards, houses were chosen by street, starting from those closest to the gas governor station and moving to the furthest, allowing the pressure drop in the grid to have the lowest impact on the regulator installation. Also, critical houses, such as retirement homes or bakeries, were left to the end, allowing the current system to function without changes for as long as possible. All homeowners were personally informed about the necessary appointments between one and three weeks in advance with a time slot of 3 hours during which the measurement and installation of the gas regulator were planned. Installations were measured in an order determined by grid infrastructure logistics, starting with homes closest to the gas governor station and proceeding outward, while prioritizing critical facilities (retirement homes, bakeries) last to minimize service disruptions. The final dataset of 473 installations represents 8.3% of the city total and spans construction periods from the 1950s through 2020s with diverse materials and configurations. They were asked to provide access to all meters and installation components during the appointment. The measurements were conducted with the GasTest delta 3 from German manufacturer Esders GmbH, a certified handheld device for pressure-based leakage testing according to DVGW G 600 and G 459-2 [10,28]. The device includes an integrated pump which can measure flow rates up to 45 , a high-precision digital pressure sensor and can be used for installations with an operating pressure of up to 1 bar with a resolution of 1 mbar and a maximum error of 0.5% [29].
Measurement uncertainty from the GasTest delta 3 device (±2.0% accuracy for leak rates 0-10 , ±0.01 resolution) was propagated through emission calculations using standard Gaussian error propagation methods. These uncertainties were incorporated into the Monte Carlo simulations as additional variance terms.
All tests were conducted by trained technicians, and the fittings used were checked for leakages using handheld gas detection devices PM 580 by Sewerin GmbH, which measure leakages in the parts-per-million (ppm) range [30]. Upon arriving at the different installations, the technical team first explained the procedure to the homeowners and then turned off all appliances. This step was followed by safely removing the meter and installing the GasTest delta 3.
The device follows pre-programmed steps automatically and advises the technicians on which steps to perform. After installing and starting the device, it automatically fills an internal gas bladder with natural gas from the installation. Once the gas bladder was filled, it was essential to shut off the gas supply to the installation by closing the shut-off valve that separates the installation from the gas grid. The GasTest delta 3 then filled the installation with natural gas to the preset test pressure of typically 27 mbar above ambient. In 98.3% of all tests, the set testing pressure was 27 mbar above ambient, the minimum test pressure required by DVGW regulation G 600. This test pressure of 27 mbar above ambient is slightly higher than the normal downstream operating pressure of 23 mbar above ambient to account for variability and to ensure a conservative testing condition [10]. Note that this 27 mbar above ambient test pressure is unrelated to the 55 mbar above ambient grid pressure increase; most testing was conducted at the standardized test pressure of 27 mbar above ambient regardless prior to the systematic grid pressure increase/upgrade. In eight cases, the technicians used slightly higher testing pressures as a precaution for installations where local installation conditions, operating pressures and shut-off pressures were unclear. Based upon manufacturer specifications, these variations do not affect the accuracy of the results, since leakage is determined by the pressure drop over time, not the testing pressure itself. The device then waits maximum five minutes for the system pressure to stabilize at the preset pressure during the adjustment phase. During that time, the device automatically measures the installation volume based on the flow and time for pressure increase and saves it to the data file. If the pressure does not stabilize, the device automatically stops and highlights possible causes, such as malfunctioning shut-off valves. Otherwise the device automatically continues in the measuring phase. All tests were conducted following DVGW G 600, which specifies an observation time of seven minutes to assess pressure decay and determine the leakage rate [10]. Results and original data are logged at 1 Hz for later analysis. The device shows the main results on the display, such as pressure drops or leak rates. Based on the results, the technicians decided whether a test run should be repeated or finalized. If a test run was finalized, the device was safely detached from the installation and the gas regulators were installed, as well as the previously detached meter. No test had to be repeated, showing that all results were within the expected range and no main shut-off valve was malfunctioning. The main shut-off valve was then opened and the appliances were returned to operation. One final round of leak detection was performed at the gas regulator and the meter using the handheld gas detection devices PM 580. After each test was finalized, the technicians completed the corresponding documentation in accordance with grid operator requirements and informed the homeowners about the results. The documentation is then automatically uploaded to a cloud which only the operator has access to. All results can be downloaded from the cloud as .json files or pdf documents.
2.3. Data Analysis
All data were consolidated into a single database and subjected to quality control. The raw .json files were checked for completeness, consistency of metadata (for example testing pressure, leak rates, results), and anomalies in the recorded time series. To avoid duplicated data, all files were imported into a database and analyzed for duplicates, and technician notes were cross-checked against measurement files. No duplicated test results were found, and all notes were consistent with the recorded notes and results.
During data processing, 165 measurements showed a negative measured leak rate. These are erroneous measurements according to the manufacturer and investigation showed that this occurs when the internal gas bladder of the device, which is used for setting the higher pressure, was not fully emptied before testing. Given the specifications of the GasTest delta 3, these values fall within the uncertainty band around zero. The device has a resolution of 0.01 and an accuracy of % within a range of 0 to 10 to the full scale. This leads to a Lower Detection Limit (LDL) of −1. The measured apparent negative leak rates ranged between -0.09 and -0.0001 , and all positive numbers that ranged between 0 and 0.2 were identified as systematic errors due to statistical noise rather than physical leakage, but were included in further analysis as non-detected leak rates of 0 . This aligns with the practical LDL of the GasTest delta 3. No other systematic errors were found in the measurements.
Leakage rates in residential systems in Germany are grouped into three sections based on DVGW G 600. Group 1 represents leakages with no risks, Group 2 with acceptable risks, where mitigating action is required within four weeks, and Group 3 with unacceptable and dangerous risks which require immediate mitigating actions. The technical rule points out leak rates which help grouping leakages. Group 1 is defined by leak rates lower than 1 −1, Group 2 with leak rates between 1 and 5 −1, and Group 3 with leak rates greater than 5 −1. Leakages in Group 3 are considered dangerous due to the high leak rate and the effect these methane emissions can have resulting in explosions.
2.4. Creation of Emission Factors and National Emissions Estimate
After reviewing and cleaning the data, the analysis of the final dataset provided insight into leakage behavior and support more accurate methane emission factors for the residential sector. Due to missing information about age and detailed material used in the installation, the calculated emission factors do not include such details.
Emission factors were calculated in two ways. First normalized only by the number of installations, second normalized by the estimated interior piping volume, assuming that larger systems have a greater probability of leakage. Methane Emissions depend on the density and the methane content of the applied natural gas. The density based on the meter temperature was measured as 0.7499 at 288.15 K temperature and 1,013.25 mbar absolute pressure and methane content in the natural gas was determined to 95.802 mol-% using Process Gas Chromatographs.
The GasTest delta 3 reports leak rates as volumetric flows in at test pressure and ambient conditions. For emission calculations, these values were converted to standard liters per hour () using the ideal gas law at reference conditions and then to mass units () using the measured gas composition. Due to missing ambient temperature data, it is not possible to standardize the gas temperature. Therefore, the ambient temperature and the standard temperature were both set to 288.15 K and the standard leak rate is only based on the measured leak rate and the standardized pressure. Methane emissions are calculated based on the mean leak rate for each installation. The number of total residential natural gas connections in Germany are reported by the DVGW at 19 million households [31]. This number accounts for all natural gas connections and cannot be divided into specific numbers for amounts using the same natural gas composition. Therefore it is assumed that all Germany follows the same natural gas composition, knowing that some areas have different gas compositions with lower or higher methane contents. Ranges of uncertainty were propagated using Monte Carlo simulations, combining a variation in standard leak rates, total installation counts, and confidence intervals of mean emissions. The chosen confidence intervals were set to 95 %. This allows scaling the results from a measured sample to a city level or national levels with upper and lower bounds. While Saarlouis was selected to represent an average German middle-class residential area, several factors may limit national generalizability. The city’s gas infrastructure evolved from a coal gas grid converted in the 1970s, and the grid pressure increase necessitating regulator installation (which enabled this study) may not be typical of all German cities. Regional variations in building codes, climate, installation practices, and demographic factors could influence leak distributions. Despite these limitations, the 473-installation sample (0.0025% of national total) provides the most comprehensive systematic leak survey of residential interior piping in Germany to date.
For the national upscaling, the methane emission rates measured in the installations were first grouped into bins. The first bin () contains all non-detects (measurements at or below the LDL of 0.2 , assigned emission rate of 0 ). The remaining bins ( to ) are logarithmically spaced between −1 and 20 −1. The upper bound of 20 −1 was chosen to be consistent with already published ranges of leaks in residential appliances and installations. Upper leak rates between 10 −1 and 20 −1 are reported in malfunctioning units [6,22]; higher emissions were not reported. For each positive-emission bin, an emission rate was defined as the geometric mean (midpoint on log scale) of the upper and lower bin boundaries. This was used as the characteristic emission level for each bin in the national upscaling.
Uncertainty in the total number of German residential natural gas installations was accounted for by modelling the total number of connections N as a lognormal random variable. The parameters of this distribution were chosen such that the 95 % interval spans from 18 to 20 million connections, centred around the reported value of 19 million [31]. In each Monte Carlo iteration b, a value was drawn from this distribution and used as the total number of residential installations to be allocated across emission bins.
Two statistical approaches were used to upscale the observed distribution of emission bins from the 473 tested installations to the national level of Germany. In the first approach, the empirical bin assignment based on the 473 installations was resampled with replacement in each Monte Carlo iteration to obtain a bootstrap sample. Each sample was converted into bin probabilities , and a multinomial draw with parameters and provided national counts per bin. In the second approach, the empirical bin counts were combined with a weakly informative prior derived from a lognormal fit to the positive emission rates. This prior reflects the expectation of a right-skewed distribution. It shows a small fraction of higher-emitting installations, and produces posterior bin probabilities applying a Dirichlet distribution. These probabilities were then used in the same multinomial allocation step as for the bootstrapped approach. The empirical shape of the existing analyzed distribution was preserved by the bootstrap approach. The Dirichlet-multinomial formulation adds a modest amount of smoothing to better represent sparsely populated or empty bins in a way that the observed heavy-tailed behavior is followed. Additional linear-scale plots were added for the higher-emission bins to highlight the contribution of rare but potentially high-impact installations.
The reported confidence intervals (95% confidence interval (CI): 11.36 [6.95, 16.73] for bootstrap) reflect only: (1) sampling uncertainty from the 473-installation dataset, (2) uncertainty in total German connection count, and (3) measurement uncertainty from device specifications (±2.0%). These intervals do NOT capture additional uncertainty from: (4) geographic variability (Saarlouis vs. other German cities), (5) temporal variability (single snapshot vs. long-term average), or (6) potential systematic differences between the measured cohort (undergoing regulator installation) and the broader national building stock. Incorporating these additional sources would substantially widen the confidence intervals, though quantifying the magnitude requires multi-city, multi-season sampling campaigns. Future work should include multi-city sampling to better quantify geographic variability and enable more robust national extrapolation.
For each Monte Carlo iteration, national methane emissions were obtained by multiplying the national count in each bin with the corresponding representative emission rate. The results were summarized across all bins to obtain a total emission in . These were converted to annual emissions in . The procedure was repeated for 10,000 iterations to obtain stable distributions of national emissions for both applied statistical approaches. The final national estimates are reported as the Monte Carlo mean and median, together with the 2.5th and 97.5th percentiles as a 95 % confidence interval. This framework propagates measurement uncertainty, sampling variability in the dataset of the 473 installations It also includes uncertainty in the total number of German residential gas connections for a consistent national emissions estimate.
To visually assess how emissions are distributed across bins and how the upscaling treats sparsely populated or empty bins, the distributions of national bin counts from the Monte Carlo simulations were summarised using boxplots on a logarithmic scale.
3. Results
3.1. Overall Emission Outcomes and Distribution
A pressure decay was observed in nearly all analyzed installations, with the highest being −1. Applying the LDL for the measuring device, 411 of 473 measurements were within the detection rate and had a leak rate of 0 −1. This represents 86.89 % of all measurements. Even though the majority showed only small to no leakages, seven were found to have leakages in the range of 1 −1 or higher.
Figure 2 shows the probability distribution function (PDF) of methane emissions of the analyzed 473 installations. Most systems show no or very small emissions, with non-detects dominating the first bin. The logarithmic y-axis highlights the right-skewed emission pattern, where a small number of high-emitting installations account for a disproportionate share of total emissions.
The methane emissions were calculated between 0 −1 for the lowest installation and 4.43 for the highest. The mean methane emission for all 473 installations is −1. This includes non-detects within LDL treated as zeros.
Using a non-parametric bootstrap resampling with 10,000 iterations, the methane emissions are calculated to 0.067 [0.041, 0.098] per installation. Emissions vary across installations, with technical standards and installation volumes impacting methane emissions. In addition to whole-house emissions, they were calculated based on installation volume.
The volume of the installations ranged from 0.924 L to 52.607 L. An emission factor was calculated for each emission based on the corresponding installation volume in the installation between main shut-off valve and appliance. These factors range from 0 to 1.0013 .
Applying a confidence interval of 95 % the volume-normalised emission factor is 0.0085 [0.0041, 0.0143] .
Figure 3 shows a three-dimensional histogram plotting methane emissions as a function of installation volume between the main shut-off valve and the final gas appliance, and the frequency in the analyzed installations.
The data show that the majority of the analyzed installations have low installation volumes (typically less than 20 L) and emissions of up to 4.43 . Installations with higher volume show lower methane emissions (<0.5 ). The highest density of data points is concentrated in the area of low volume and low emission, suggesting that smaller pipe volumes are more common and generally associated with low emissions. Some cases of high emissions are observed in smaller systems. These systems are typical for single family homes or installations with small meters. Overall, this result indicates a correlation between installation volume and methane emissions, with emission variability not increasing at higher volumes. It indicates the potential role of installation design in influencing downstream methane leaks in residential natural gas systems. Due to the missing data about age or material, it is not possible to correlate emissions in further detail.
3.2. Emission Based Risks
The results of the grouping of leak rates based on G 600 are shown in Table 1. Of all 473 analyzed systems, one had emissions above the unacceptable limit of 5 . The remaining leakages were divided into 466 counts in Group 1 and 6 counts in Group 2.
The given number of all German residential systems has been simulated using a standard deviation to allow more realistic analysis. Applying a confidence of 95 % the mean residential systems amounts to 19,000,454 [17,041,985, 20,962,608]. Assuming that 0.21 % of all households connected to the gas grid have unacceptable leakages, this implies to a mean of 39,901 [35,788, 44,021] residential systems with unacceptable leak rates based on DVGW G 600 groups. Results show that less than 1.48 % of all analyzed residential systems (Group 2 and Group 3) are responsible for 46.88 % of all emissions.
3.3. Total Emissions in Residential Installation Systems
Based on the emissions for all 473 analyzed systems, overall emissions for the analyzed residential systems were calculated to 31.55 and 276.33 .
Applied to all German residential systems, national methane emissions from interior systems were estimated using two Monte Carlo upscaling approaches that explicitly account for both sampling uncertainty and the skewed emission distribution. The total emissions for these systems can be based on different values: lower CI, mean or higher CI both for residential systems and emissions.
For the non-parametric bootstrap approach, the distribution of emission bins derived from the 473 analyzed installations were resampled 10,000 times. For each iteration, bin counts were scaled nationally. This results in a mean national methane emission for installations of 11.36 [6.95, 16.73] . For the Dirichlet-multinomial formulation, a lognormal distribution was applied to the positive emission rates to construct smoother emission bins as shown in Figure 4.
Figure 5 presents the upscaling results in two complementary formats. The probability density functions (left panel) demonstrate that both the bootstrap and Dirichlet-multinomial approaches produce similarly-shaped emission distributions, validating that the two independent statistical methods converge on consistent national estimates. The close agreement between methods, despite their different statistical assumptions, provides confidence in the robustness of the national emission estimates. The cumulative distribution functions (right panel) facilitate reading the confidence intervals reported in the text and enable probability assessments for policy thresholds (e.g., the probability that total residential emissions exceed a specific target value). The probabilities were drawn from each of the 10,000 iteration steps and allowed consistent probability comparison to the bootstrapped approach. National bin counts were simulated via multinomial draw, and converted into total national methane emissions. This results in a mean national methane emission for installations of 12.30 [8.11, 18.55] as indicated by the central orange line on the right side of Figure 5.
Both Monte Carlo approaches (bootstrap: 11.36 ; Dirichlet-multinomial: 12.30 ) yield higher estimates than simple arithmetic scaling of the measured mean emission rate (0.067 × 19 million installations × 8,760 h/yr = 11.1 ). This difference arises because the bin-based Monte Carlo methods explicitly preserve the empirical distribution shape, including the heavy-tailed contribution from high-emitting installations, whereas simple arithmetic scaling assumes all installations emit at the mean rate. The simple arithmetic approach underestimates total emissions because it fails to account for the disproportionate contribution of the few high-emitting installations. In contrast, the Monte Carlo methods sample from the observed distribution, ensuring that the small fraction of high-emitting installations (1.48% of installations contributing 46% of emissions) is properly represented in the national upscaling. For national inventory purposes, the Dirichlet-multinomial estimate was adopted to 12.30 [8.11, 18.55] as the primary result, as it most accurately represents the skewed emission distribution including emissions in boxes that in the original data did not occur. Comparing these emissions to midstream emissions of German transportation and distribution systems, it is possible to contextualize emissions in residential buildings. The total emissions for transportation and distribution in 2023 are measured between first transportation, storage and distribution and exclude residential systems [32]. The total emissions are given at 19,950 [32].
In comparison to residential emissions, transportation, storage and distribution emissions in Germany are substantially higher than those calculated for residential systems. Additional testing and data collection will be necessary to better characterize emissions within residential systems. Nevertheless, the number of dangerous high-emitting installations requires actions for risk mitigation and emission reduction.
4. Discussion
This comprehensive survey of 473 residential natural gas installations in Saarlouis, Germany reveals three critical findings for methane emission inventories and mitigation strategies. First, the emission distribution is strongly skewed, with more than 46% of total emissions being contributed by fewer than 1.48% of installations, indicating that targeted interventions at high-emitting installations could yield disproportionate mitigation benefits. Second, when scaled nationally using probabilistic Monte Carlo methods, residential interior piping contributes an estimated 12.30 [8.11, 18.55] to Germany’s methane emissions—a magnitude comparable to other recognized sources in the natural gas supply chain and substantial enough to warrant inclusion in national inventories. Third, the mean emission rate of 0.067 [0.041, 0.098] per installation exceeds values reported in some previous residential studies, reflecting both methodological differences in leak detection sensitivity and the diverse age structure of European building stock. These findings underscore the need to expand leak detection and repair programs beyond distribution infrastructure to include building-level systems, particularly as European methane regulations evolve and hydrogen transition planning advances.
4.1. Interpretation of Leakage Distributions and High-Emitting Installations
The measurements in Saarlouis show a strongly skewed distribution of residential methane leak rates, with most installations within the LDL and a small number of high-emitting installations dominating the total emission budget. This pattern is consistent with prior natural gas sector studies reporting skewed distributions where a small fraction of sources contribute disproportionately to total emissions [23,33]. In the present dataset, fewer than 1.48% of installations account for nearly half of the total emissions, while one installation exceeded the threshold for unacceptable leakage based on the technical rule G 600.
The probability density function in Figure 2 and the volume-resolved histogram in Figure 3 illustrate that most residential systems combine relatively small installation volumes with low emission rates. Higher leak rates are still present even in small, single-family type installations. The long tail of higher emissions suggests that targeted interventions at a small number of residential installations could yield substantial mitigation benefits. Specifically, prioritizing LDAR for the <2% of systems exceeding 1 could reduce total residential emissions by nearly half.
This could be implemented through mandatory leak testing during property transfers, periodic inspection programs focused on older installations, or incentive schemes for homeowners to conduct voluntary leak assessments.
4.2. Comparison with Previous Studies
The mean methane emission rate per installation found in this study is higher than average values reported for residential buildings in some previous work, for example Karion et. al., who reported 0.01375 per household [23]. These differences are based on several factors. Table 2 provides a systematic comparison with a selected subset of prior residential methane emission studies, chosen to represent different methodological approaches (top-down atmospheric, whole-house measurements, appliance-level testing, and component-specific studies) and to include both European and North American contexts.
The higher mean emission rate (0.067 vs. Karion’s 0.014 ) reflects several methodological and contextual differences. Direct pressure-decay testing at elevated test pressure (27 mbar vs. 23 mbar normal operating above ambient) may detect smaller leaks than atmospheric top-down methods. Saarlouis’ infrastructure spans seven decades of construction (Section 2.1), potentially exhibiting higher leak rates than newer U.S. building stock. The interior piping was isolated by turning off appliances, while top-down studies aggregate all sources including appliances, distribution, and outdoor leaks. Finally, the lower detection limit (0.2 , ±0.007 ) enables detection of smaller chronic leaks compared to many atmospheric measurement techniques.
The present analysis is based on whole-house pressure decay tests conducted at elevated test pressure, rather than on appliance-level measurements or indirect top-down inferences. As noted in Section 2.1, the analyzed installations span diverse ages, materials, and maintenance histories, which combined with differences in measurement protocols and detection limits, may contribute to the observed emission rate differences. Normalizing emissions by installation volume provides an additional perspective on leakage behavior. The emission factors based on installation volume suggest that larger installation volumes do not necessarily correspond to higher specific leak rates; instead, a combination of installation age, materials, and appliance condition influences leakages. While these attributes were not systematically recorded in the available data—limiting the ability to attribute elevated leak rates to specific technical drivers—the whole-system measurement approach captures the aggregate effect of all leak sources within each installation, which is most relevant for emission inventory purposes. Future work would benefit from systematic collection of installation metadata to enable more detailed driver attribution and development of installation-specific emission factors.
4.3. Implications for Safety and Mitigation Policies
From a safety perspective, the small fraction of systems in Group 3 with dangerous leak rates is reassuring in the sense that catastrophic risks appear rare, at least under the regulatory and operational conditions in Germany. At the same time, when these systems are scaled to national level using the Monte Carlo sampling of residential connection counts, the absolute number of installations with unacceptable leakage becomes substantial. This underlines the importance of maintaining robust LDAR practices, especially in residential settings.
The upscaling results suggest that methane emissions from interior residential systems are lower than those from national transportation, storage and distribution systems. While the central estimates remain lower than the midstream emissions reported for Germany, they indicate that residential systems can no longer be treated as a negligible category in the context of national methane mitigation strategies. Given that current European Union methane regulations do not include explicit LDAR requirements for interior residential systems [34], there may be a need to reconsider the role of building-level inspections in achieving future methane reduction targets.
The findings are also relevant in the context of planned transitions from natural gas to hydrogen or hydrogen-enriched gases. Experimental and modelling work suggests that hydrogen may exhibit higher leak rates through some seals and components compared to methane due to its lower molecular weight and different material interactions [33]. If interior systems already have a small but influential subset of high-emitting installations under current conditions, these will become even more critical in future hydrogen networks, both for safety and for environmental reasons. Given hydrogen’s volumetric leak rate can be two to three times higher than methane through identical leak paths [33], the high-emitting installations identified in this study represent priority targets for infrastructure upgrades prior to any hydrogen blending or conversion. Proactively addressing leakage in the existing natural gas building stock could therefore serve as an important measure towards a safer and cleaner energy transition.
4.4. Limitations and Future Work
Several limitations of this study should be acknowledged. The analyzed installations are confined to a single German city and, although the selected district is considered representative of an average residential area, the results do not capture the full diversity of building types, socio-economic conditions, and installation practices across Germany. The lack of systematic information on installation age, renovation status, materials, and appliance types prevents a more detailed attribution of leakage drivers. The conversion from volumetric leak rates to mass emissions relies on one time measured gas composition and an assumed equivalence between ambient and standard temperature, which introduces additional uncertainty.
Additionally, all measurements were conducted during a specific operational campaign (regulator installation) in 2024. This single-timepoint approach does not capture potential temporal variability in leak rates due to: (1) seasonal temperature fluctuations affecting seal performance and gas viscosity, (2) pressure cycling over time causing fatigue failures, (3) aging effects not captured in cross-sectional data, and (4) variations in appliance usage patterns. Multi-year longitudinal studies would be needed to characterize temporal emission variability.
On the modelling side, the choice of a lognormal distribution to smooth the empirical emission histogram and to populate sparsely sampled or empty bins is physically plausible for leak processes, but not uniquely justified. Alternative parametric forms could be explored in future work, that explicitly model variation between different building classes or regions. Increasing the sample size and extending measurements to other cities and countries would allow the proposed upscaling framework to be tested and refined, and would support more robust comparisons with other segments of the gas supply chain.
Despite these limitations, this study provides detailed bottom-up assessments of methane emissions from interior residential gas systems in a European context, combining high-resolution pressure-based measurements with a probabilistic upscaling framework. The results highlight the importance of maintaining safety standards and of recognising residential systems as a relevant source in national methane inventories and mitigation strategies.
4.5. Recommendations for Future Research
To address the limitations identified above and maximize the benefit for nationwide emissions estimates, future work should extend leak measurements to three to five additional German cities representing different building stock characteristics (age distributions, climate zones, infrastructure vintages). A stratified sampling design targeting 300 to 500 installations per city would enable quantification of geographic variability and validation of the Saarlouis-based emission factors. Conducting repeated measurements at a subset of installations (∼100 sites) across seasons would characterize temporal emission variability, with two to three year campaigns capturing aging effects and maintenance cycles.
Systematic collection of installation metadata (age, materials, renovation history, appliance types, maintenance records) would enable development of installation-specific emission factors and allow national inventories to account for regional differences in building stock composition. Coupling whole-system pressure-decay measurements with component-level inspection using optical gas imaging at high-emitting installations would identify specific failure modes (joints, valves, pipe corrosion) and inform targeted retrofit strategies. Quantifying the costs and benefits of different LDAR implementation strategies (mandatory testing during property transfers, periodic inspections, voluntary programs with incentives) would support evidence-based policy development.
Given plans for hydrogen blending and eventual conversion, testing installations at elevated pressures representing future hydrogen service conditions would identify infrastructure upgrades needed to maintain safety and emission performance, accounting for hydrogen’s higher permeability compared to methane. Implementing these recommendations would transform the current single-city snapshot into a robust, nationally representative emission inventory while providing actionable guidance for infrastructure management and climate policy.
Supplementary Materials
The following supporting information can be downloaded at the website of this paper posted on Preprints.org.
References
- Faramawy, S.; Zaki, T.; Sakr, A.E. Natural gas origin, composition, and processing: A review. Journal of Natural Gas Science and Engineering 2016, 34, 34–54. [Google Scholar] [CrossRef]
- Rowland, S.T.; Lebel, E.D.; Goldman, J.S.W.; Domen, J.K.; Bilsback, K.R.; Ruiz, A.; Jaeger, J.M.; Hill, L.A.L.; Kashtan, Y.S.; Finnegan, C.; et al. Downstream natural gas composition across U.S. and Canada: implications for indoor methane leaks and hazardous air pollutant exposures. Environmental Research Letters 2024, 19, 064064. [Google Scholar] [CrossRef]
- Forster, P.; Storelvmo, T.; Armour, K.; Collins, W.; Dufresne, J.L.; Frame, D.; Lunt, D.J.; Mauritsen, T.; Palmer, M.D.; Watanabe, M.; et al. The Earth’s Energy Budget, Climate Feedbacks, and Climate Sensitivity. In Climate Change 2021: The Physical Science Basis. Contribution of Working Group I to the Sixth Assessment Report of the Intergovernmental Panel on Climate Change; Masson-Delmotte, V., Zhai, P., Pirani, A., Connors, S.L., Péan, C., Berger, S., Caud, N., Chen, Y., Goldfarb, L., Gomis, M.I., et al., Eds.; Cambridge University Press, 2021; Volume chapter 7, pp. 923–1054. [Google Scholar] [CrossRef]
- Kundu, S.; Zanganeh, J.; Moghtaderi, B. A review on understanding explosions from methane–air mixture. Journal of Loss Prevention in the Process Industries 2016, 40, 507–523. [Google Scholar] [CrossRef]
- Álvarez-Fernández, M.I.; Prendes-Gero, M.B.; Pola-Alonso, I.; Conde-Fernández, L.; Luengo-García, J.C. Determination of the explosion parameters of methane-air mixtures as function of the ignition source and the volume and shape of the explosion chambers. Journal of Loss Prevention in the Process Industries 2022, 80, 104862. [Google Scholar] [CrossRef]
- Lebel, E.D.; Finnegan, C.J.; Ouyang, Z.; Jackson, R.B. Methane and NOx Emissions from Natural Gas Stoves, Cooktops, and Ovens in Residential Homes. Environmental Science & Technology 2022, 56, 2529–2539. [Google Scholar] [CrossRef] [PubMed]
- Lebel, E.D.; Lu, H.S.; Speizer, S.A.; Finnegan, C.J.; Jackson, R.B. Quantifying Methane Emissions from Natural Gas Water Heaters. Environmental Science & Technology 2020, 54, 5737–5745. [Google Scholar] [CrossRef] [PubMed]
- Merrin, Z.; Francisco, P.W. Unburned Methane Emissions from Residential Natural Gas Appliances. Environmental Science & Technology 2019, 53, 5473–5482. [Google Scholar] [CrossRef]
- für Wirtschaft und Technologie, B. Verordnung über Allgemeine Bedingungen für den Netzanschluss und dessen Nutzung für die Gasversorgung in Niederdruck (Niederdruckanschlussverordnung - NDAV). 2006. Available online: https://www.gesetze-im-internet.de/ndav/.
- DVGW. DVGW-TRGI 2018: Technische Regel für Gasinstallationen – DVGW Arbeitsblatt G 600. In Technische regel; Deutscher Verein des Gas- und Wasserfaches e.V. (DVGW): Bonn, Germany, 2018. [Google Scholar]
- Vollrath, C.; Hugenholtz, C.H.; Barchyn, T.E.; Wearmouth, C. Methane emissions from residential natural gas meter set assemblies. Science of The Total Environment 2024, 931, 172857. [Google Scholar] [CrossRef] [PubMed]
- Vollrath, C.; Hugenholtz, C.H.; Barchyn, T.E.; Wearmouth, C. Corrigendum to “methane emissions from residential natural gas meter set assemblies” [Sci. Total environ. 931 (2024) 172857]. Science of The Total Environment 2025, 993, 180005. [Google Scholar] [CrossRef] [PubMed]
- Michael Adamo, K.W. Quantifying Methane Emissions from Natural Gas Residential Customer Meters in California. Technical report; Gas Technology Institute, 2020.
- Saint-Vincent, P.M.B.; Pekney, N.J. Beyond-the-Meter: Unaccounted Sources of Methane Emissions in the Natural Gas Distribution Sector. Environmental Science & Technology 2020, 54, 39–49. [Google Scholar] [CrossRef]
- Nicholas, D.; Ackley, R.; Phillips, N.G. A simple method to measure methane emissions from indoor gas leaks. PLOS ONE 2023, 18, 1–14. [Google Scholar] [CrossRef] [PubMed]
- Xu, X.; Zhong, X.; Dong, J.; Xie, D.; Lu, W. Measuring methane emissions during the installation of residential and commercial natural gas meters in China. Science of The Total Environment 2023, 904, 166629. [Google Scholar] [CrossRef] [PubMed]
- Balashov, N.V.; Davis, K.J.; Miles, N.L.; Lauvaux, T.; Richardson, S.J.; Barkley, Z.R.; Bonin, T.A. Background heterogeneity and other uncertainties in estimating urban methane flux: results from the Indianapolis Flux Experiment (INFLUX). Atmospheric Chemistry and Physics 2020, 20, 4545–4559. [Google Scholar] [CrossRef]
- Balashov, N.; Davis, K.; Miles, N.; Lauvaux, T.; Richardson, S.; Barkley, Z.; Bonin, T. Background Heterogeneity and Other Uncertainties in Estimating Urban Methane Flux: Results from the Indianapolis Flux (INFLUX) Experiment. Atmospheric Chemistry and Physics Discussions 2019, 1–39. [Google Scholar] [CrossRef]
- Davis, K.J.; Deng, A.; Lauvaux, T.; Miles, N.L.; Richardson, S.J.; Sarmiento, D.P.; Gurney, K.R.; Hardesty, R.M.; Bonin, T.A.; Brewer, W.A.; et al. The Indianapolis Flux Experiment (INFLUX): A test-bed for developing urban greenhouse gas emission measurements. Elementa: Science of the Anthropocene 2017, 5, 21. [Google Scholar] [CrossRef] [PubMed]
- Lauvaux, T.; Miles, N.L.; Deng, A.; Richardson, S.J.; Cambaliza, M.O.; Davis, K.J.; Gaudet, B.; Gurney, K.R.; Huang, J.; O’Keefe, D.; et al. High-resolution atmospheric inversion of urban CO2 emissions during the dormant season of the Indianapolis Flux Experiment (INFLUX). Journal of Geophysical Research: Atmospheres 2016, 121, 5213–5236. [Google Scholar] [CrossRef] [PubMed]
- McKain, K.; Down, A.; Raciti, S.; Budney, J.; Hutyra, L.; Floerchinger, C.; Herndon, S.; Nehrkorn, T.; Zahniser, M.; Jackson, R.; et al. Methane emissions from natural gas infrastructure and use in the urban region of Boston, Massachusetts. Proceedings of the National Academy of Sciences of the United States of America 2015, 112. [Google Scholar] [CrossRef] [PubMed]
- Fischer, M.; Jeong, S.; Chan, W.; Zhu, Z. Final Project Report CEC-500-2018-021; Natural Gas Methane Emissions from California Homes. California Energy Commission, Lawrence Berkeley National Laboratory, 2018.
- Karion, A.; Link, M.F.; Robertson, R.; Boyle, T.; Poppendieck, D. Methodology and uncertainty estimation for measurements of methane leakage in a manufactured house. Atmospheric Measurement Techniques 2024, 17, 7065–7075. [Google Scholar] [CrossRef]
- Stadtwerke Saarlouis GmbH. 2025. Available online: https://www.swsls.de/unternehmen.
- Netzwerke Saarlouis GmbH Datasheet. 2025. Available online: https://www.nwsls.de/erdgasnetz/netzstrukturdaten.html.
- of Public Utilities, D. Incident Report. Technical report, Pipeline Safety Division. 2022. Available online: https://www.mass.gov/doc/merrimack-valley-incident-report/download.
- Spiegel, D. Null Druck Nach der Explosionskatastrophe. 1988. Available online: https://www.spiegel.de/politik/null-druck-nach-der-explosionskatastrophe-im-a-ab1904db-0002-0001-0000-000013532070.
- DVGW. DVGW G 459-2:2020-12 – Gas-Hausanschlussleitungen – Teil 2: Planung, Errichtung, Prüfung, Inbetriebnahme und Betrieb. Technische regel. Deutscher Verein des Gas- und Wasserfaches e.V. (DVGW): Bonn, Germany, 2020. [Google Scholar]
- GmbH, E. GasTest delta3. 2025. Available online: https://www.esders.com/products/211200/gastest-delta3/.
- GmbH, H.S. EX-TEC PM 580/550/500. 2025. Available online: https://www.sewerin.com/en/products/gas/gas-leak-detection-indoors/ex-tec-pm-580-550-500.
- DVGW. Largly H2-ready now: grids, storages facilities, components. Technical report; Deutscher Verein des Gas- und Wasserfaches e.V. (DVGW), 2025. [Google Scholar]
- Große, C.; Lehmann, S.; Sammüller, J. Analyses of methane emissions in the natural gas sector. In Interim report; DBI Gas- und Umwelttechnik GmbH: Leipzig, Germany, 2025. [Google Scholar]
- Tsiklios, C.; Hermesmann, M.; Stumm, P.; Müller, T.E. Comparative analysis of hydrogen vs. methane pipeline transport systems with integrated methane pyrolysis for low-carbon hydrogen supply. Applied Energy 2025, 383, 125276. [Google Scholar] [CrossRef]
- Union, E. Regulation (EU) 2024/1787 of the European Parliament and of the Council of 13 June 2024 on reporting of environmental data from industrial installations, amending Regulations (EC) No 166/2006 and (EU) 2018/1999. 2024. Available online: https://eur-lex.europa.eu/legal-content/EN/TXT/PDF/?uri=CELEX:32024R1787.
Figure 1.
Overview of typically analyzed residential installations.
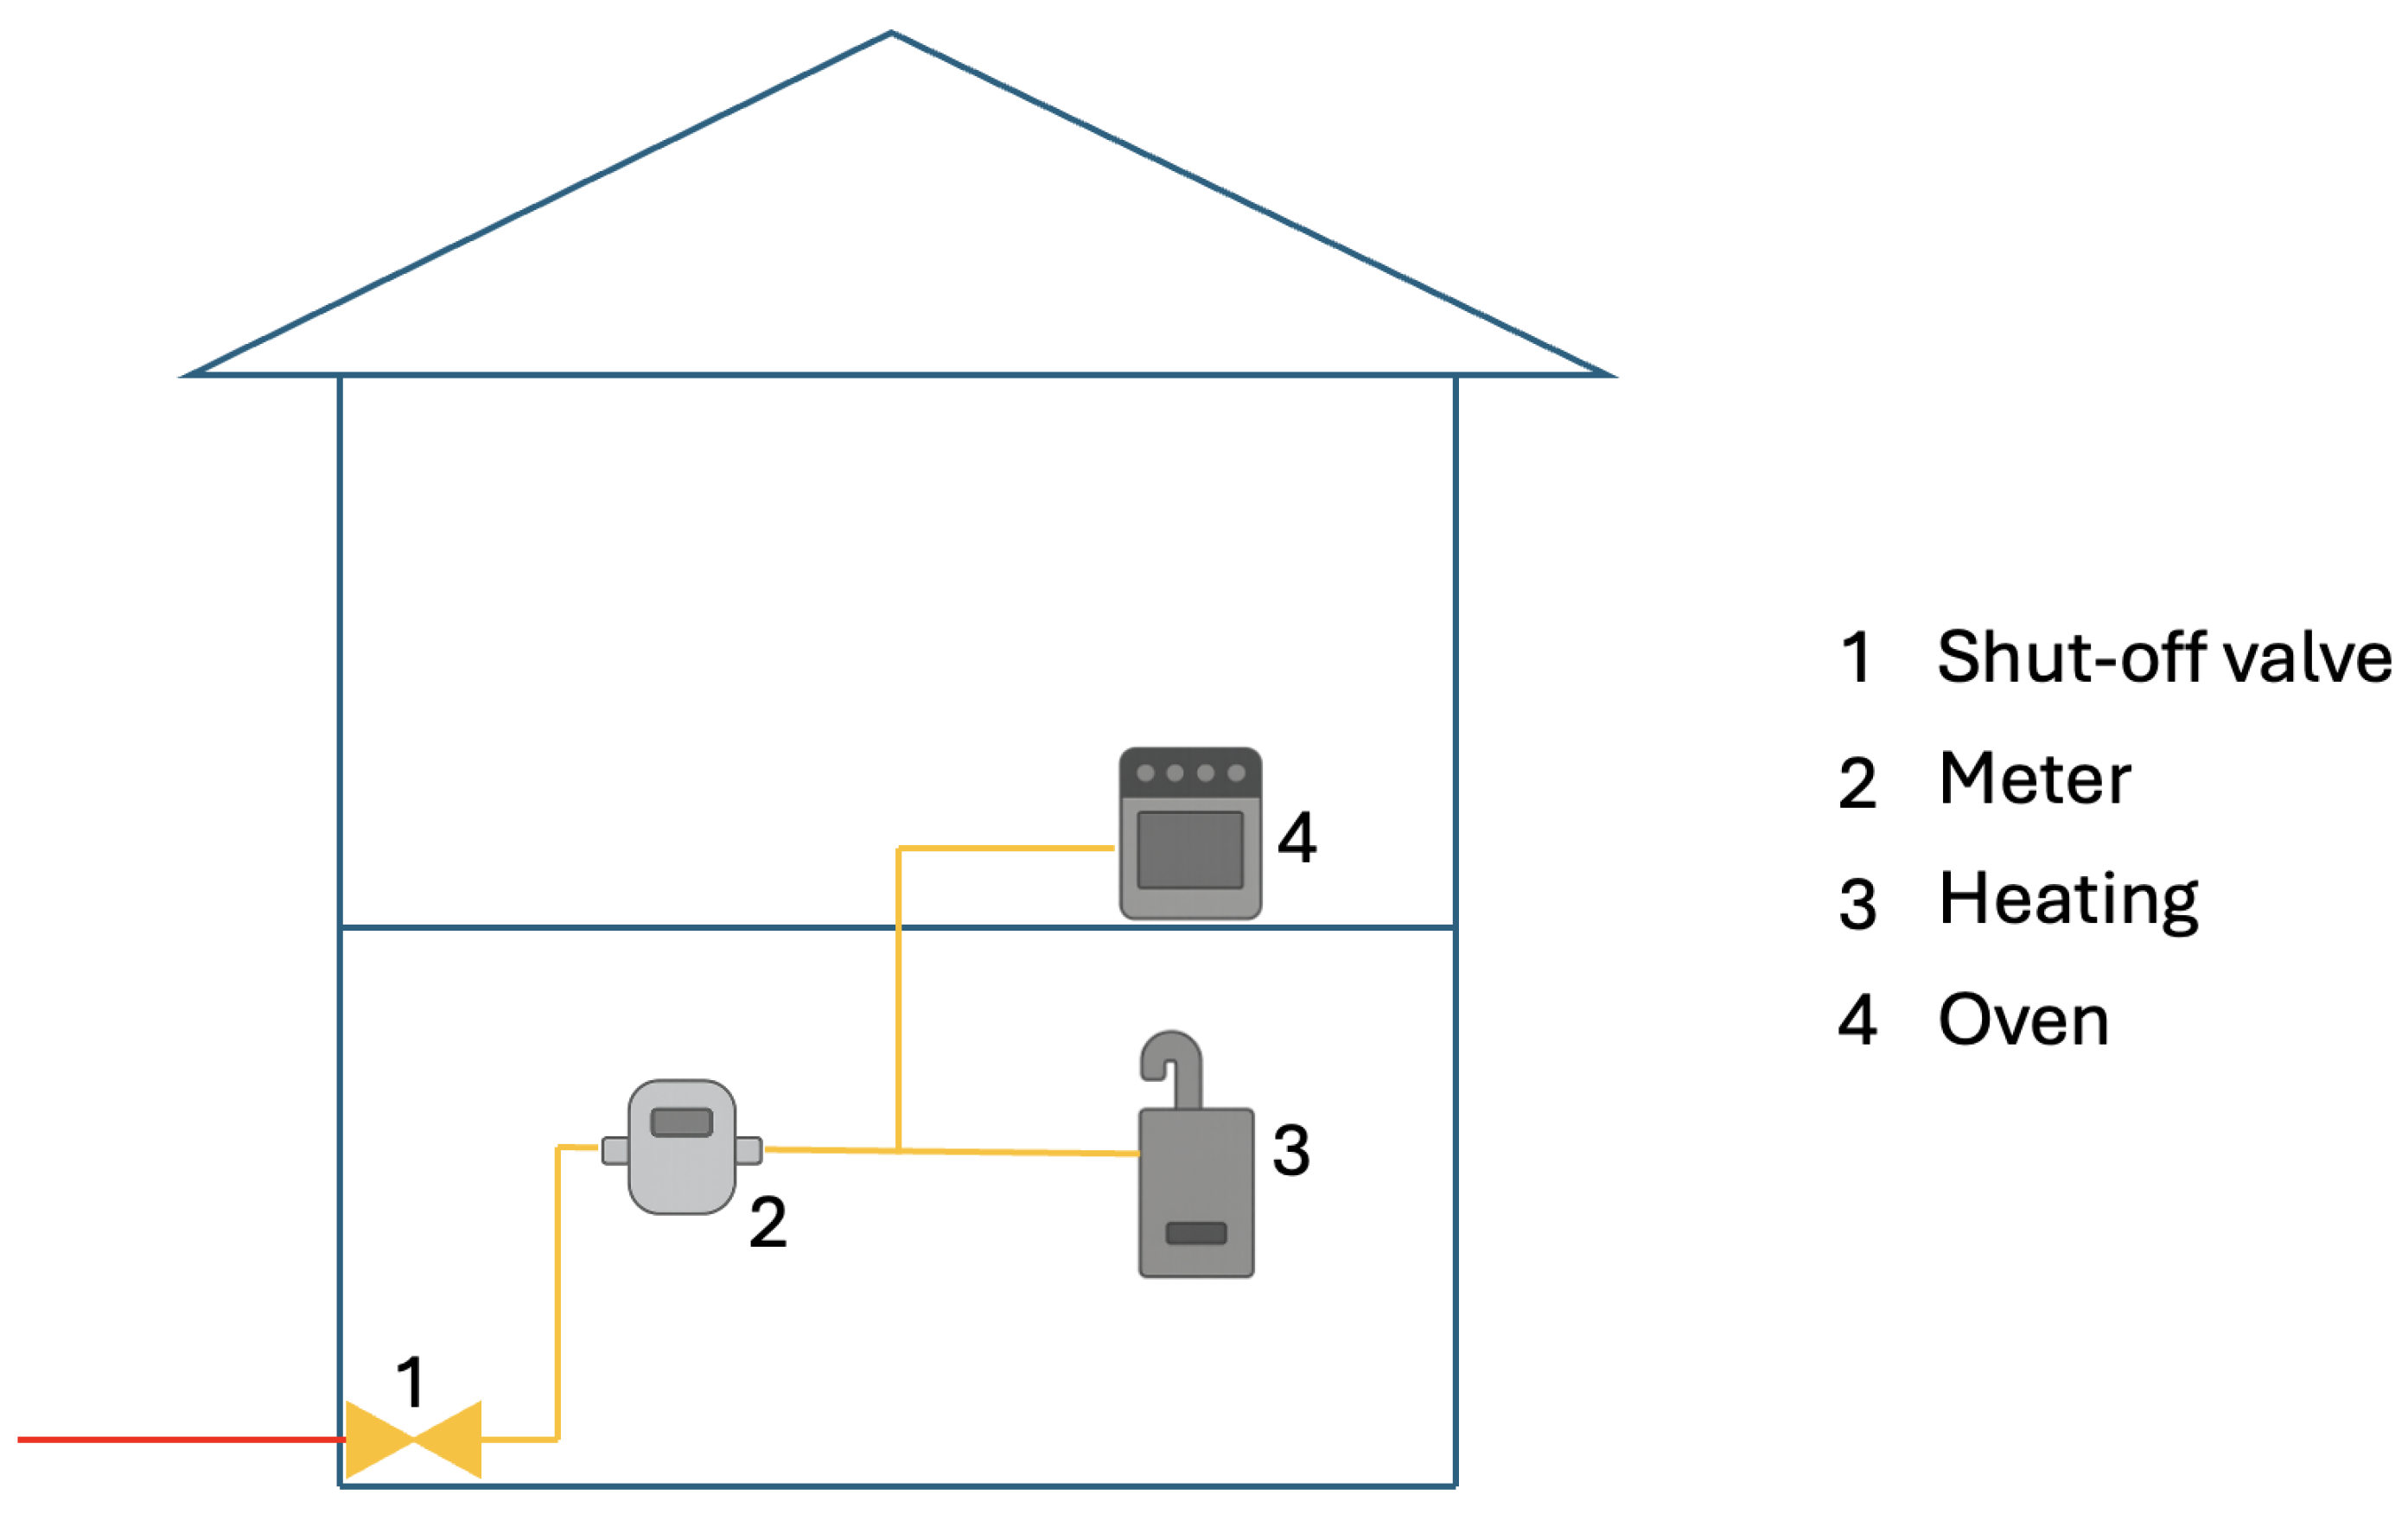
Figure 2.
Probability distribution (pdf) of methane emission rates across 473 residential installations. Values include all measurements, with non-detects contributing to the first bin. The y-axis is shown on a logarithmic scale to emphasize the distribution and the long tail of higher emitters.
Figure 2.
Probability distribution (pdf) of methane emission rates across 473 residential installations. Values include all measurements, with non-detects contributing to the first bin. The y-axis is shown on a logarithmic scale to emphasize the distribution and the long tail of higher emitters.
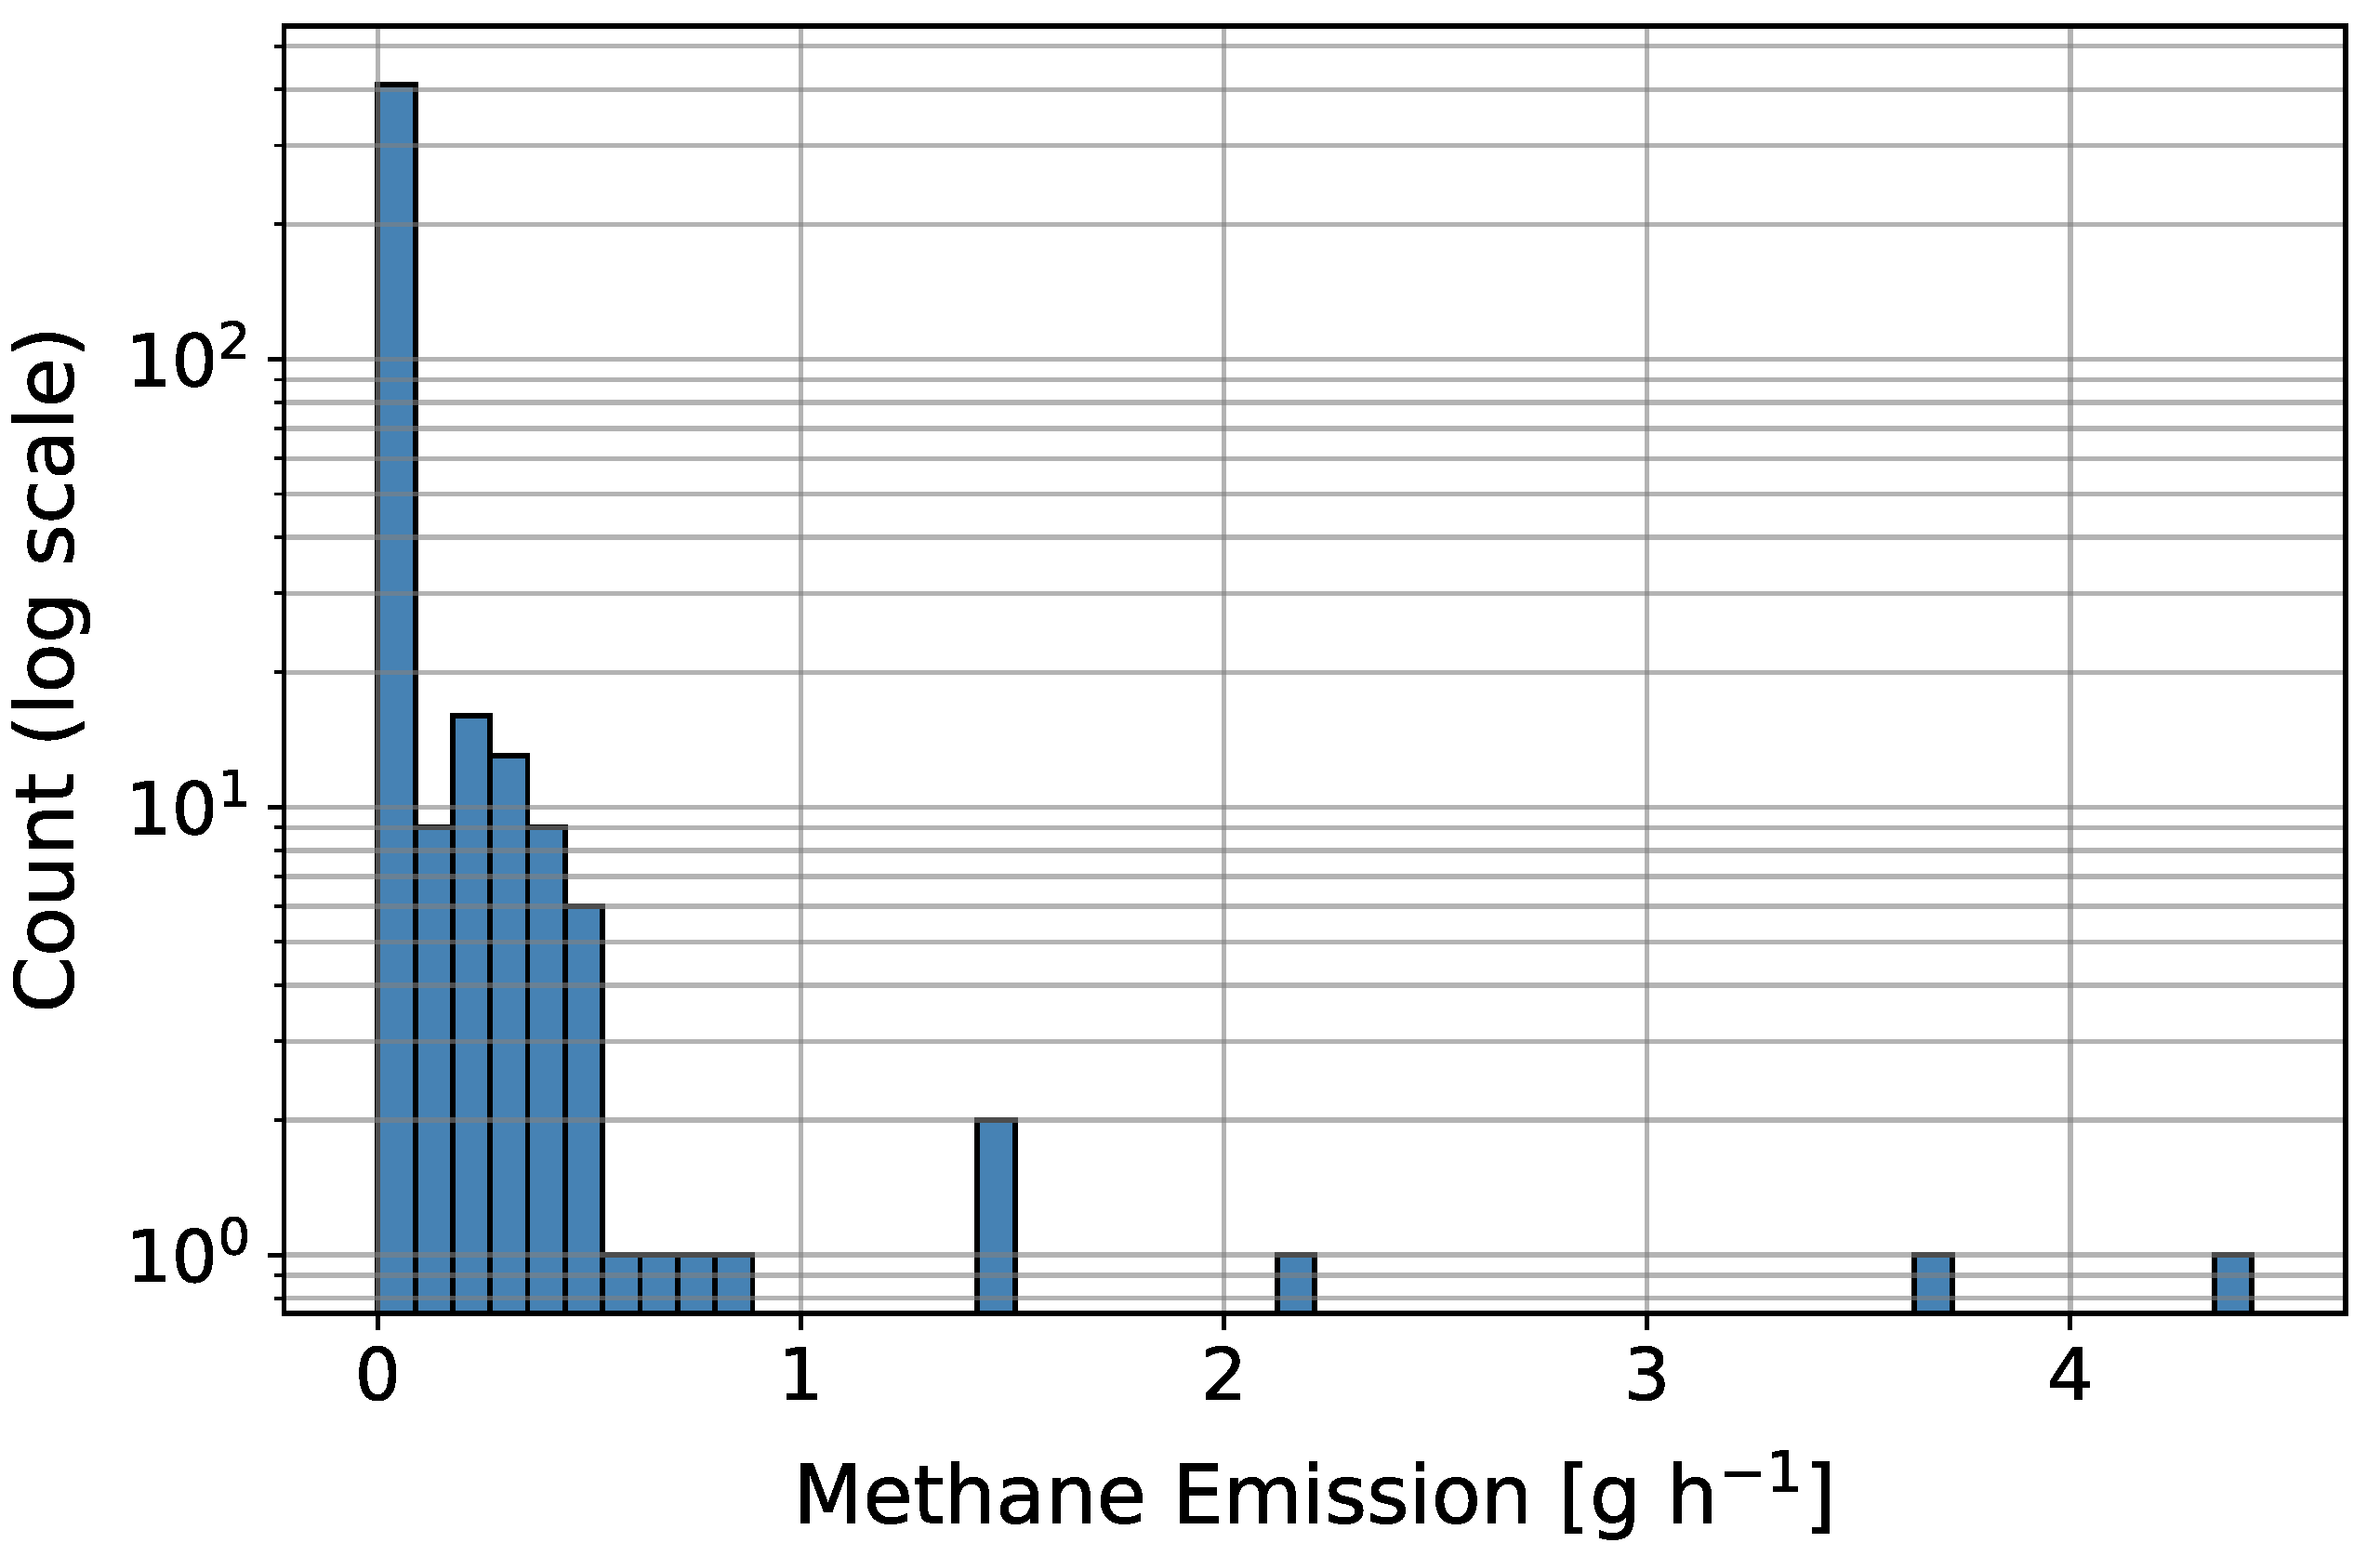
Figure 3.
Methane Emissions in residential buildings over installation volumes between main shut-off valve and final gas appliance. The x-axis represents the pipe volume, and the y-axis represents the methane emission rate. The colour gradient indicates the frequency of observations within each interval, with orange indicating lower values and dark purple indicating higher values.
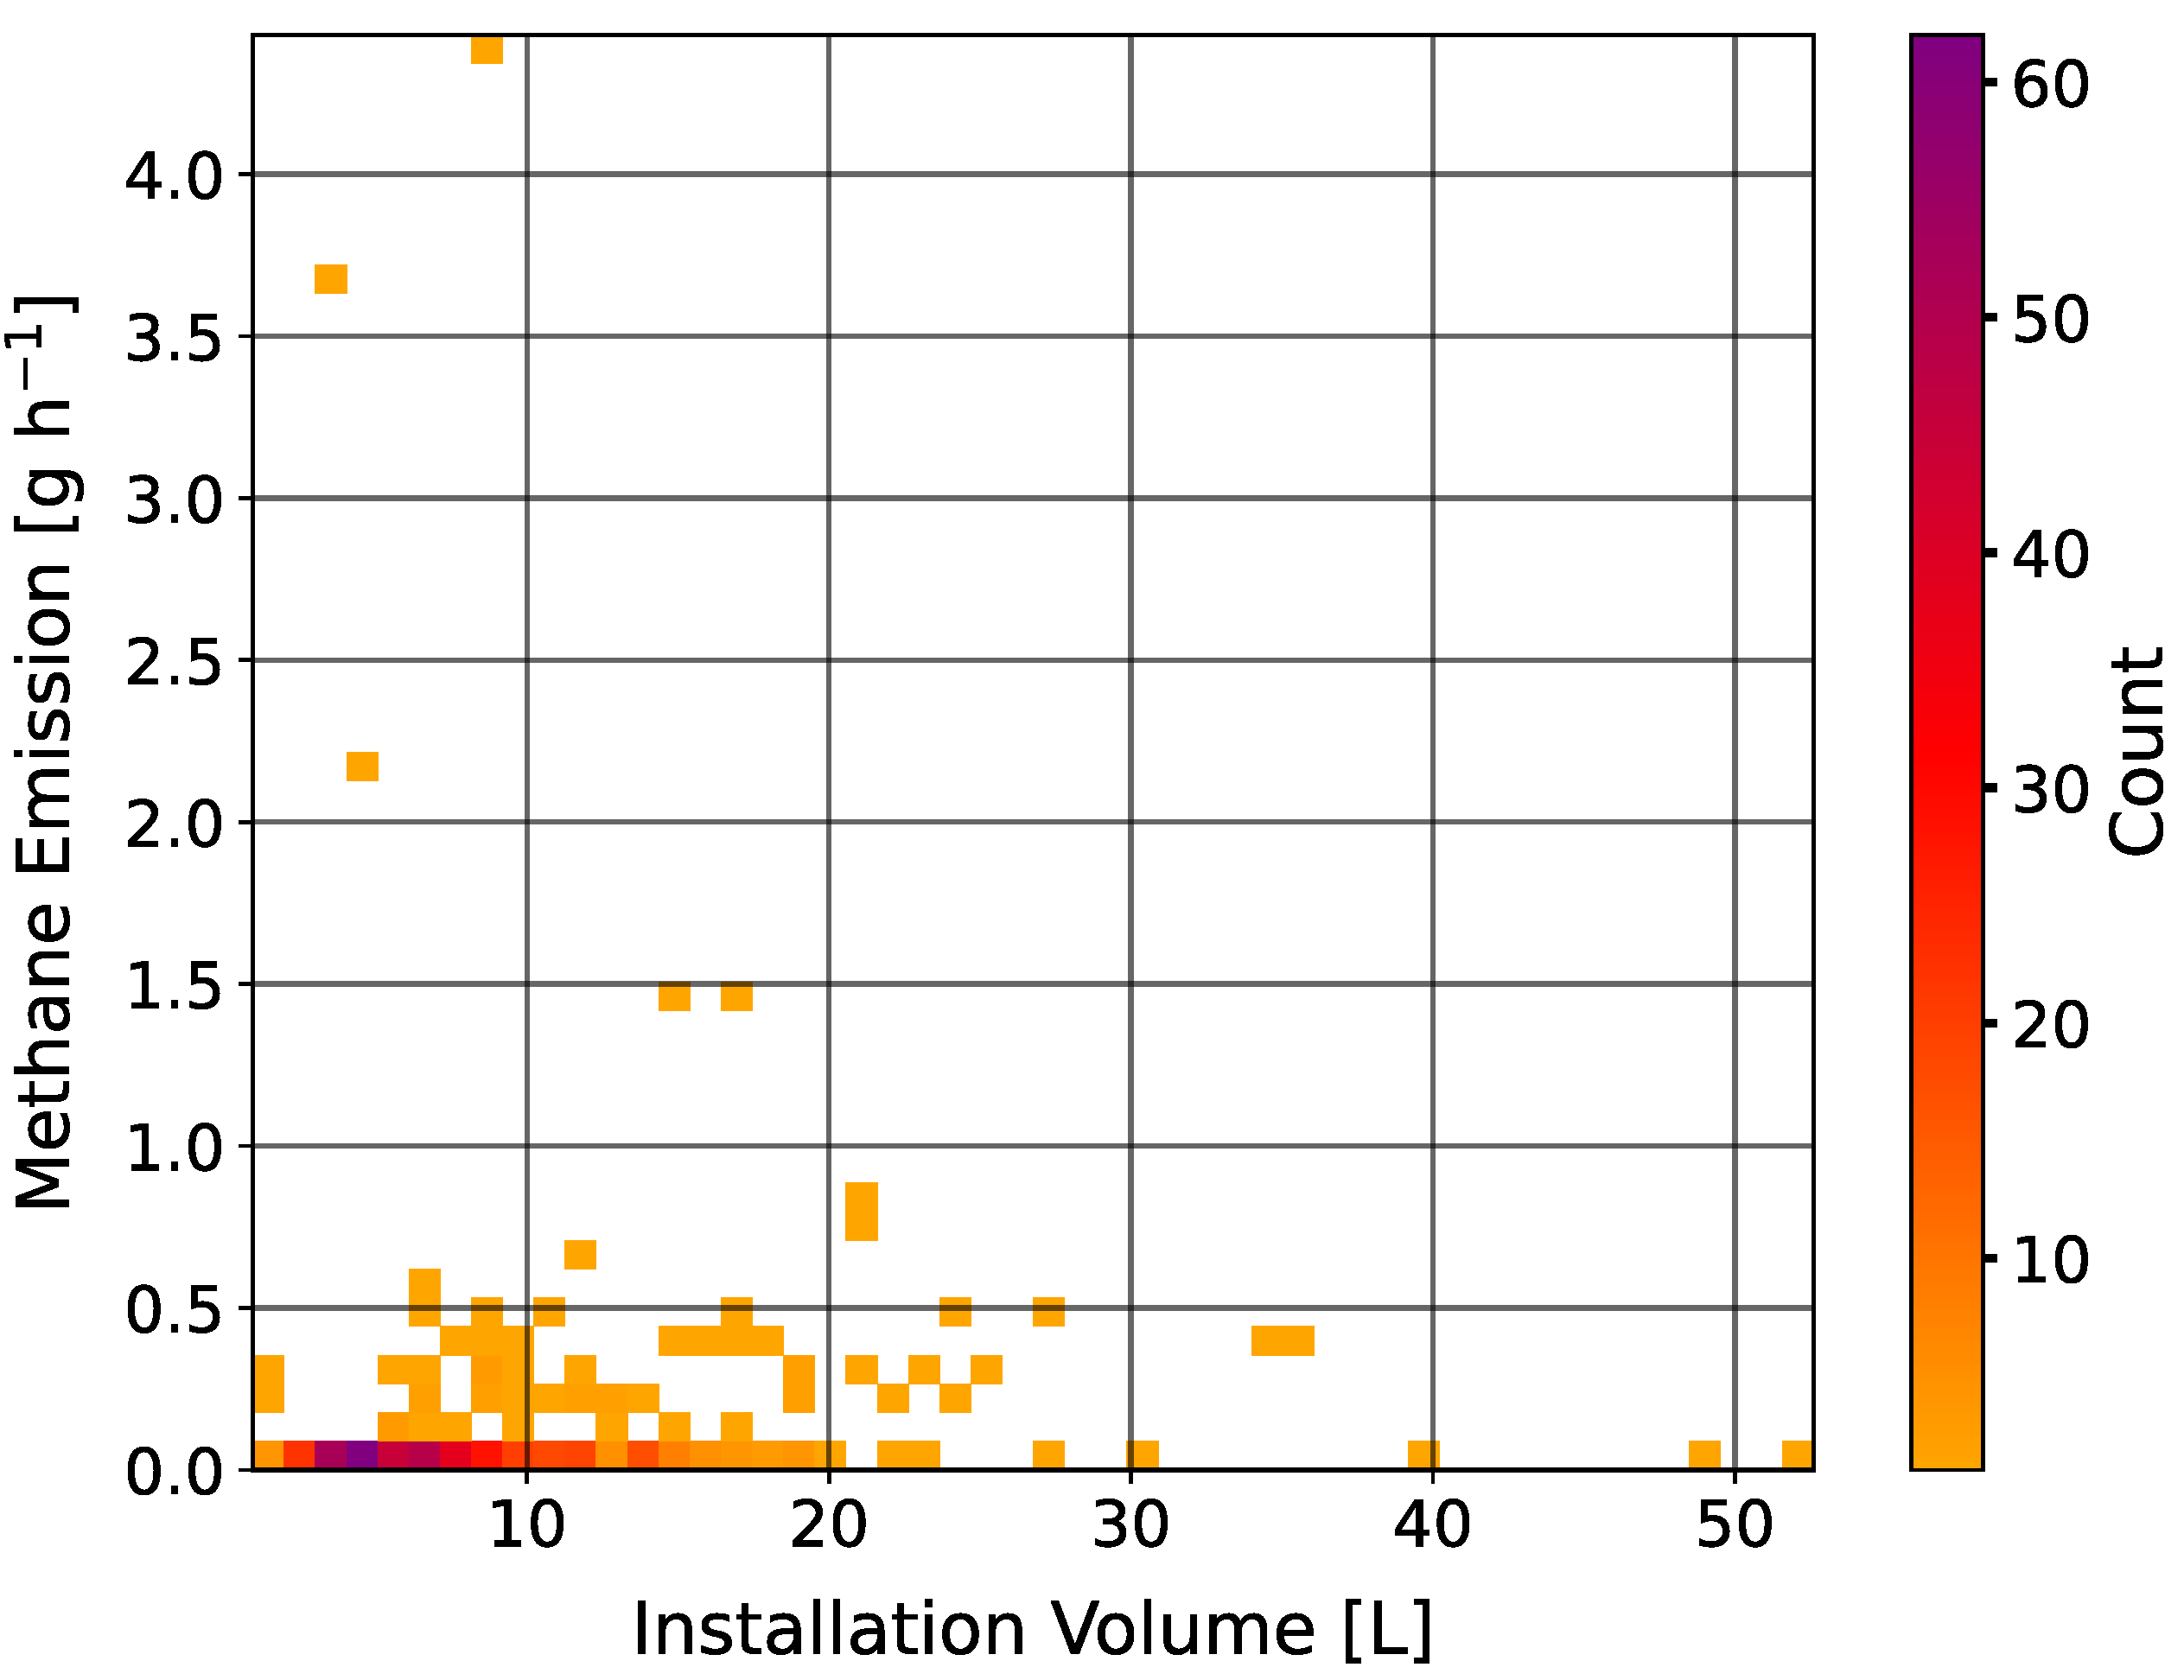
Figure 4.
Boxplot of emission bins for Dirichlet-multinomial formulation for national upscaled methane emissions in residential installations in Germany.
Figure 4.
Boxplot of emission bins for Dirichlet-multinomial formulation for national upscaled methane emissions in residential installations in Germany.
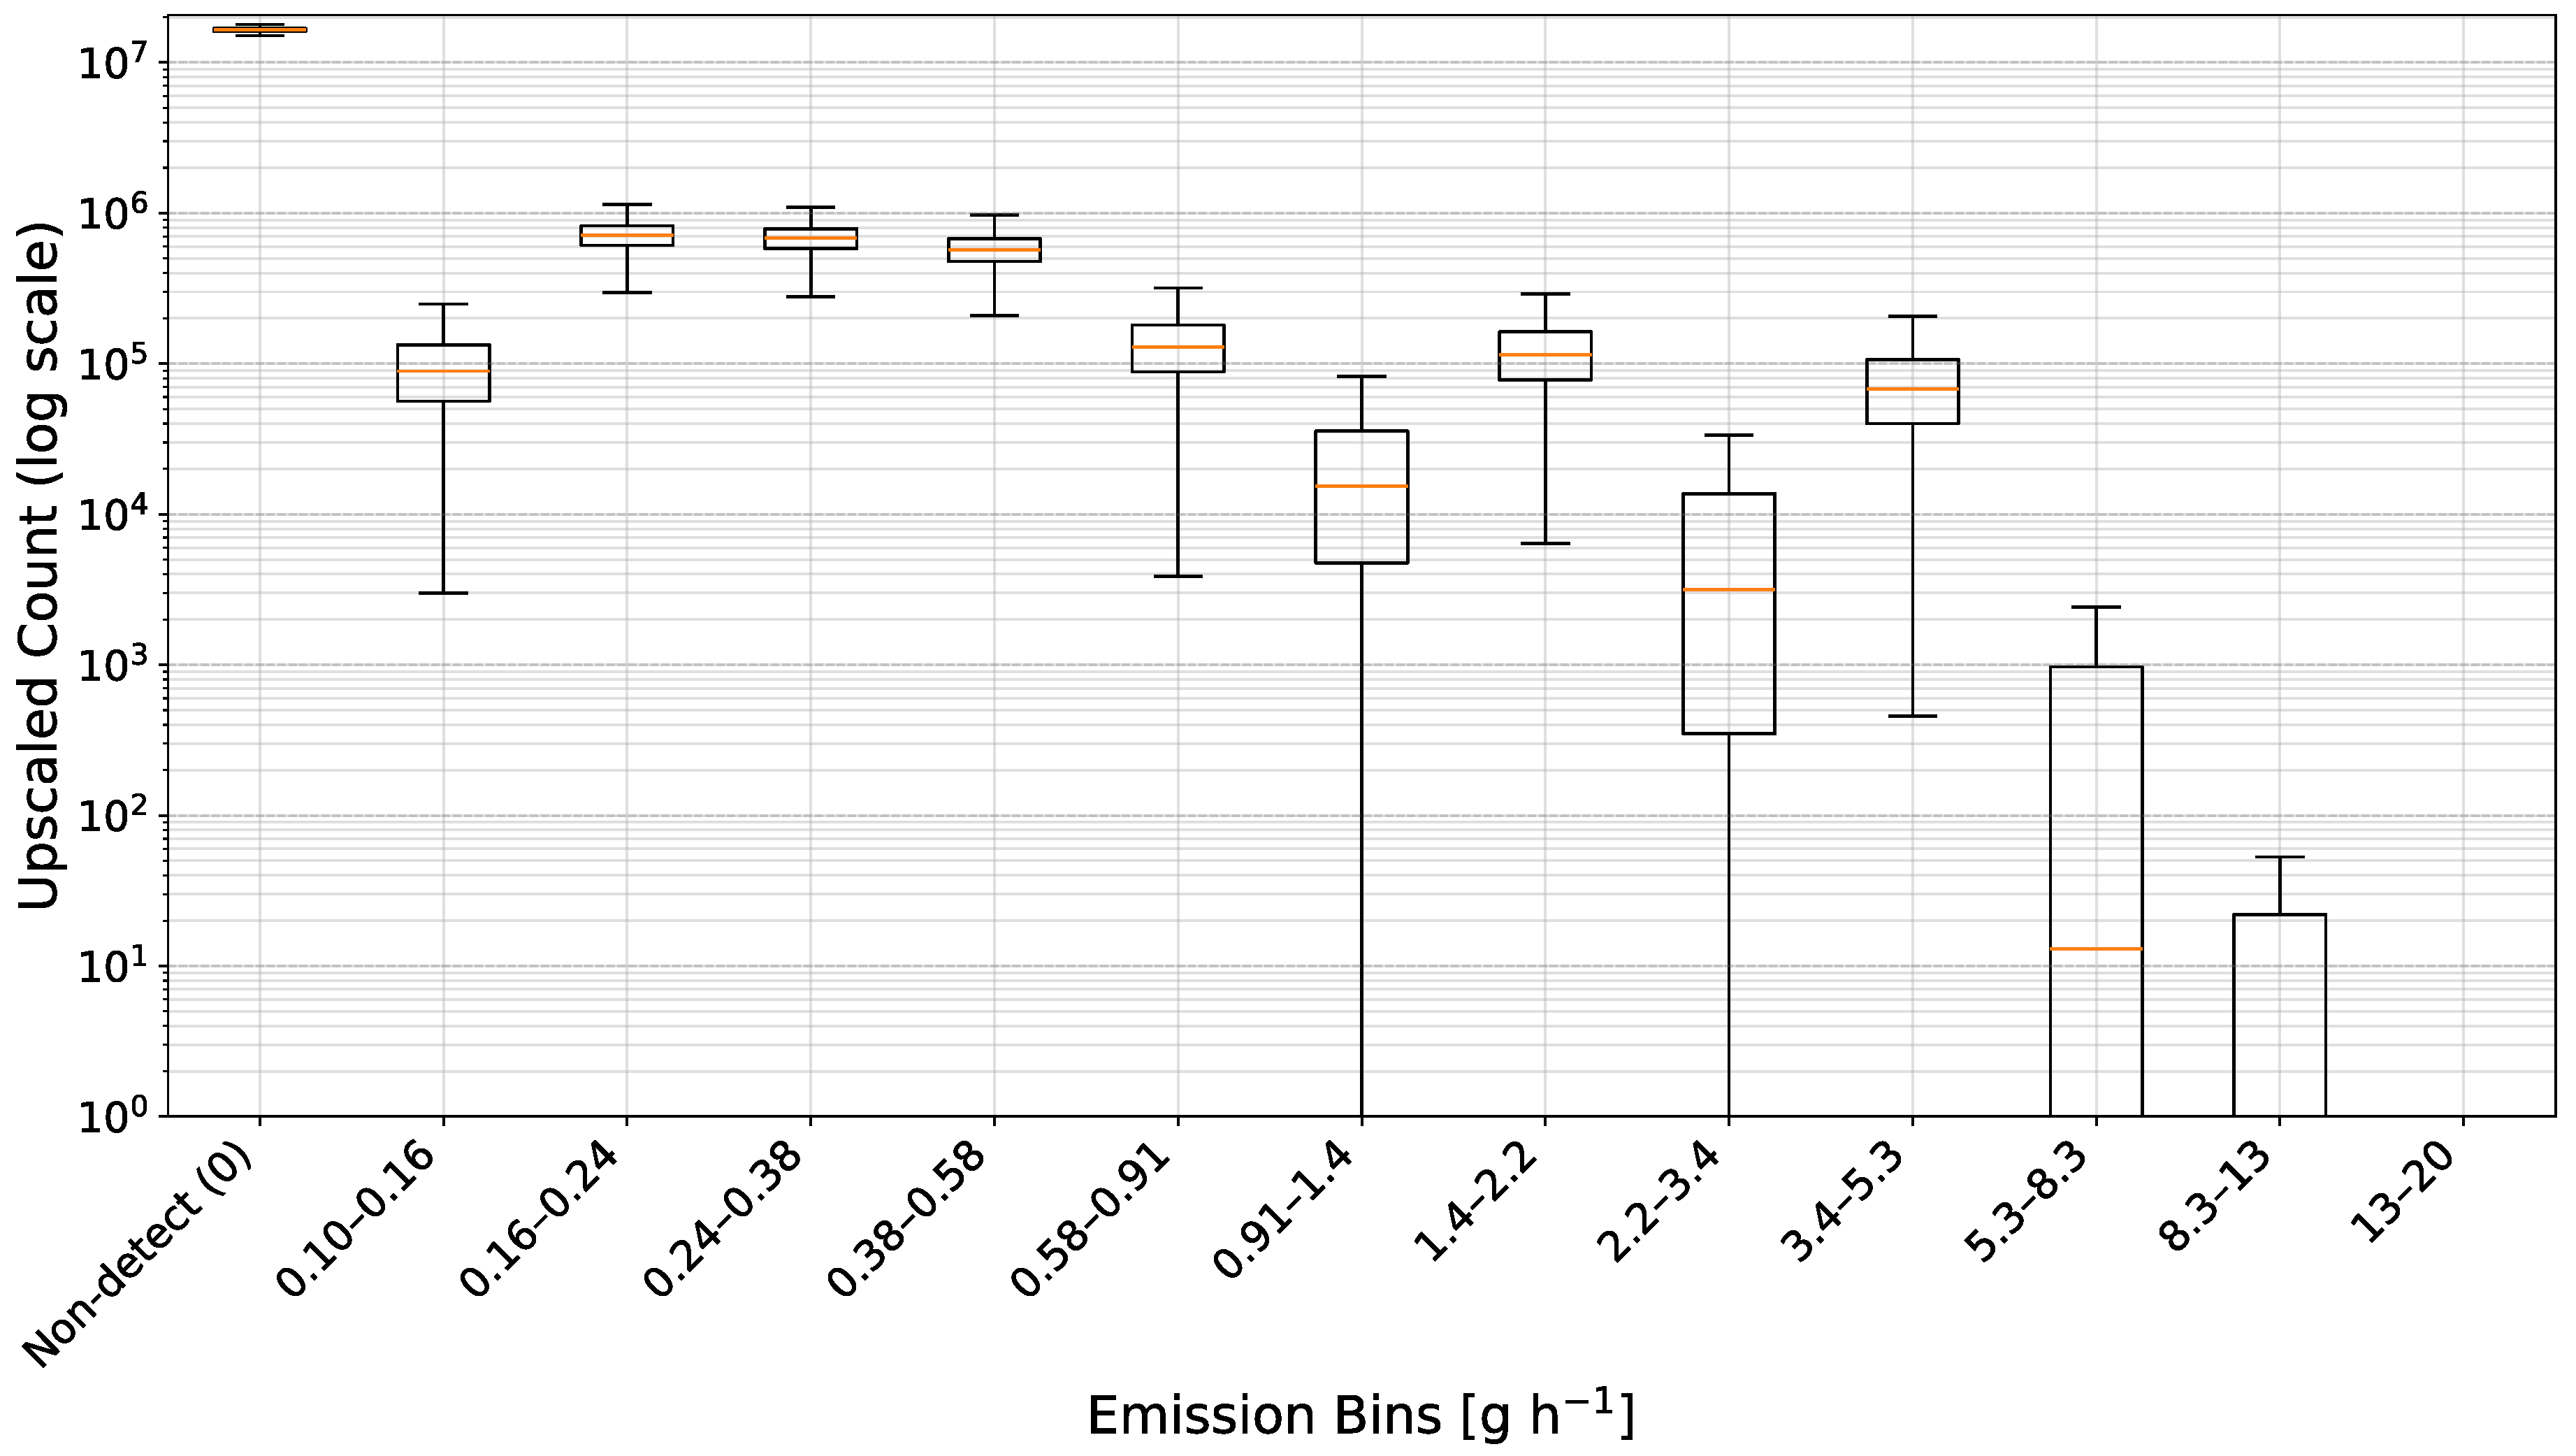
Figure 5.
Distribution functions of different emission boxes for bootstrap and Dirichlet-multinomial approaches. The left figure shows the Probability Distribution Function (PDF) of applying different probability boxes for calculated national emission rates for Germany. The right figure shows the two Cumulative Distribution Functions (CDF) for both Bootstrap and Dirichlet-multinomial functions.
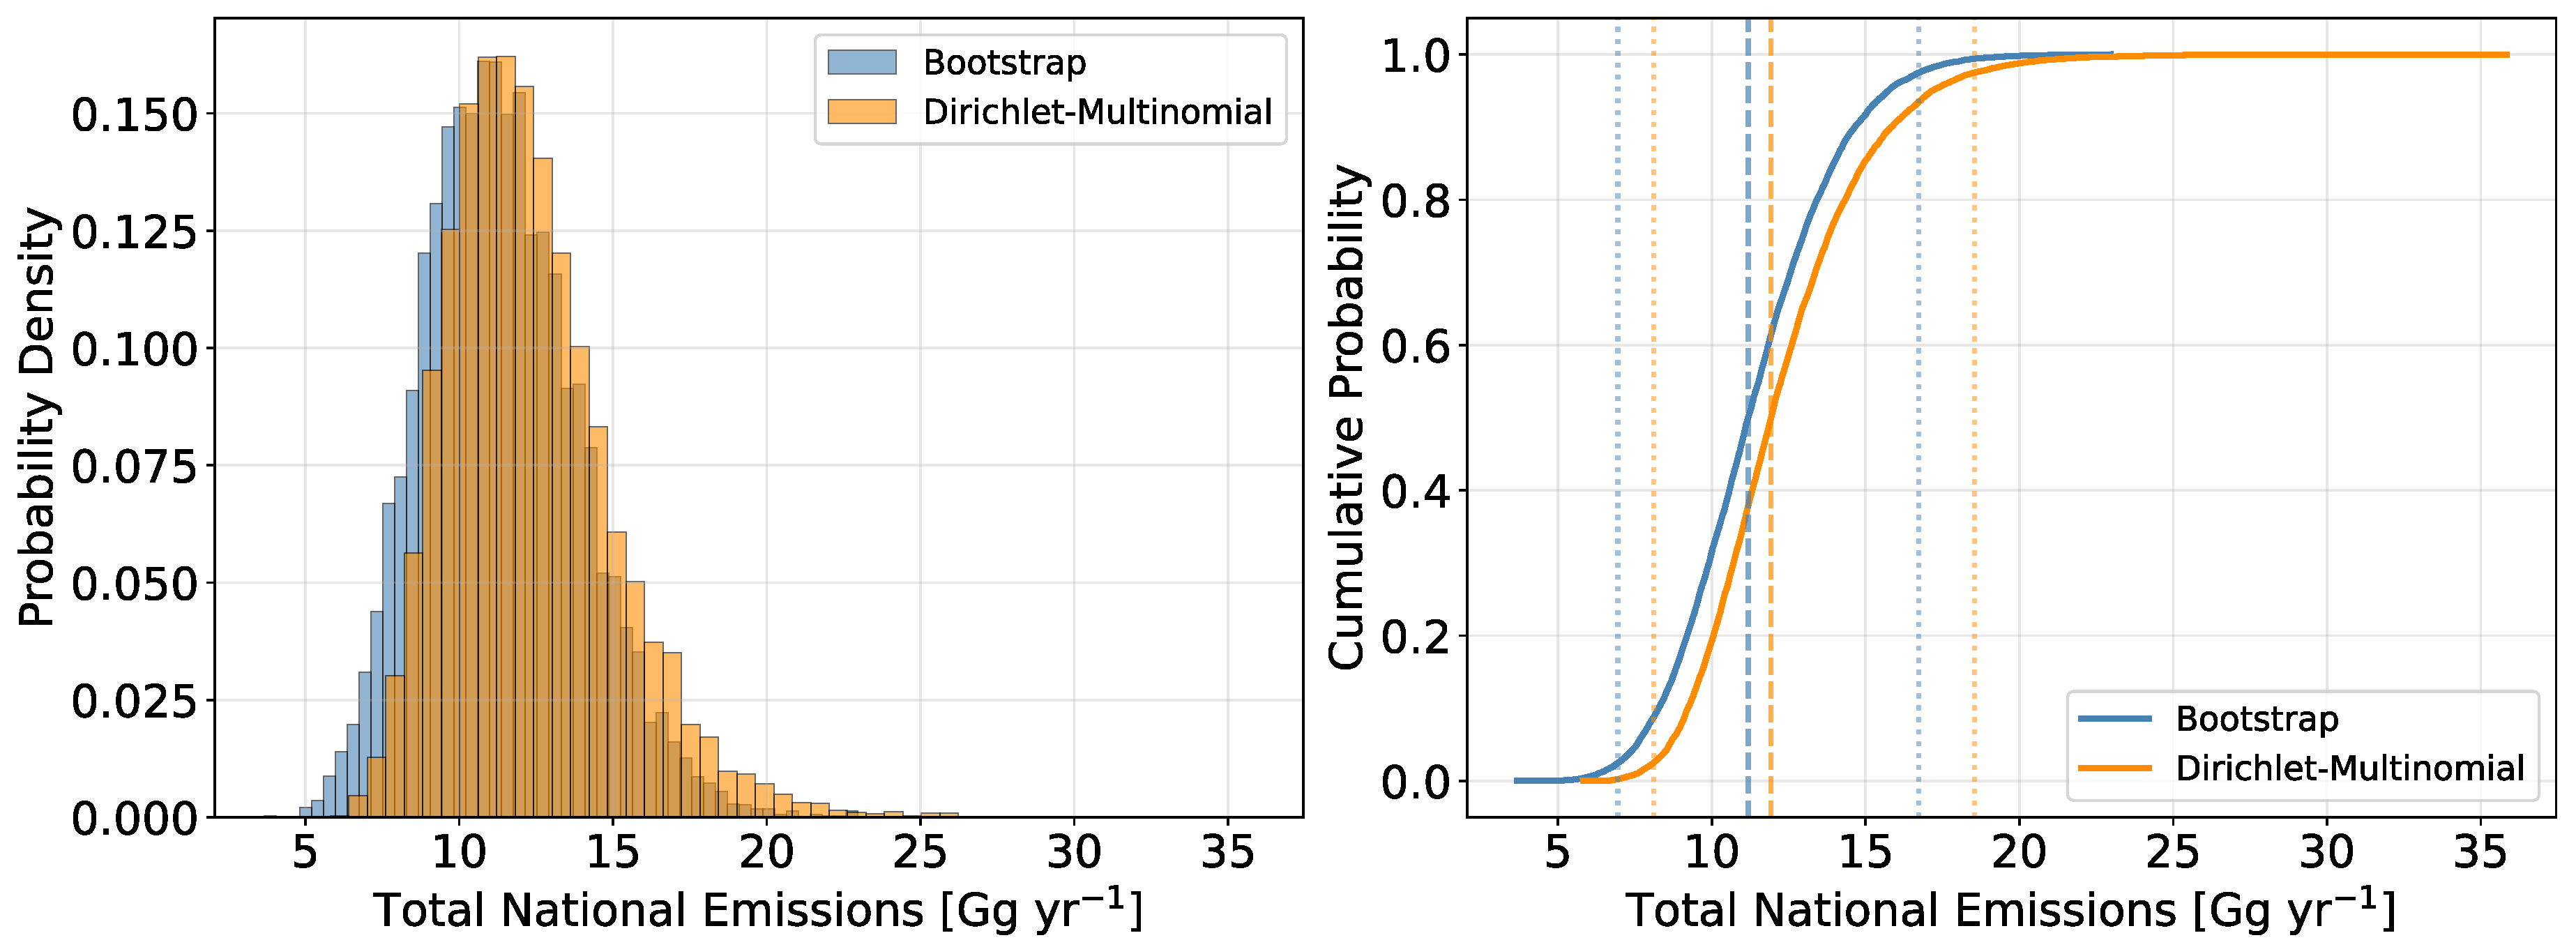

Table 1.
Categories and count of mean flow rates for the analyzed residential systems based on DVGW G 600 [10].
Table 1.
Categories and count of mean flow rates for the analyzed residential systems based on DVGW G 600 [10].
| Group | Leak Rate () | Status | Count | % | Total () |
|---|---|---|---|---|---|
| Group 1 | < 1 | Acceptable | 466 | 98.52 | 16.76 |
| Group 2 | 1–5 | Temp. acceptable | 6 | 1.27 | 10.36 |
| Group 3 | > 5 | Unacceptable | 1 | 0.21 | 4.43 |
Table 2.
Comparison of residential methane emission studies with different experimental focus and total numbers.
Table 2.
Comparison of residential methane emission studies with different experimental focus and total numbers.
| Study | Location | Method | N | Mean () | Scope |
|---|---|---|---|---|---|
| Fischer et al. (2017) [22] | California, USA | Whole-Building Depressurization | 75 | NR | Appliances + piping |
| Lebel et al. (2022) [6] | California, USA | Appliance-level direct | 53 | 0.074 | Stoves + water heaters |
| Karion et al. (2024) [23] | Gaithersburg, Maryland, USA | Top-down atmospheric | 1 | 0.014 | Whole-house measurements |
| Vollrath et al. (2024) [11] | Calgary, Alberta, Canada | Regulator-level direct | 37 | 1.2 | Regulators and Meter Set Assembly |
| This study | Saarlouis, Saarland, Germany | Whole-system pressure-decay | 473 | 0.067 [0.041, 0.098] | Interior piping only |
NR = Not reported, N = Total Number
Disclaimer/Publisher’s Note: The statements, opinions and data contained in all publications are solely those of the individual author(s) and contributor(s) and not of MDPI and/or the editor(s). MDPI and/or the editor(s) disclaim responsibility for any injury to people or property resulting from any ideas, methods, instructions or products referred to in the content. |
© 2026 by the authors. Licensee MDPI, Basel, Switzerland. This article is an open access article distributed under the terms and conditions of the Creative Commons Attribution (CC BY) license (http://creativecommons.org/licenses/by/4.0/).
Copyright: This open access article is published under a Creative Commons CC BY 4.0 license, which permit the free download, distribution, and reuse, provided that the author and preprint are cited in any reuse.


