Preprint
Article

This version is not peer-reviewed.

The Prevalence of Albuminuria in Hepatitis B Antigen-Positive Patients Based on the 5th and 6th Korea National Health and Nutrition Examination Survey (KNHANES) Data

Submitted:

04 January 2026

Posted:

06 January 2026

You are already at the latest version

Abstract

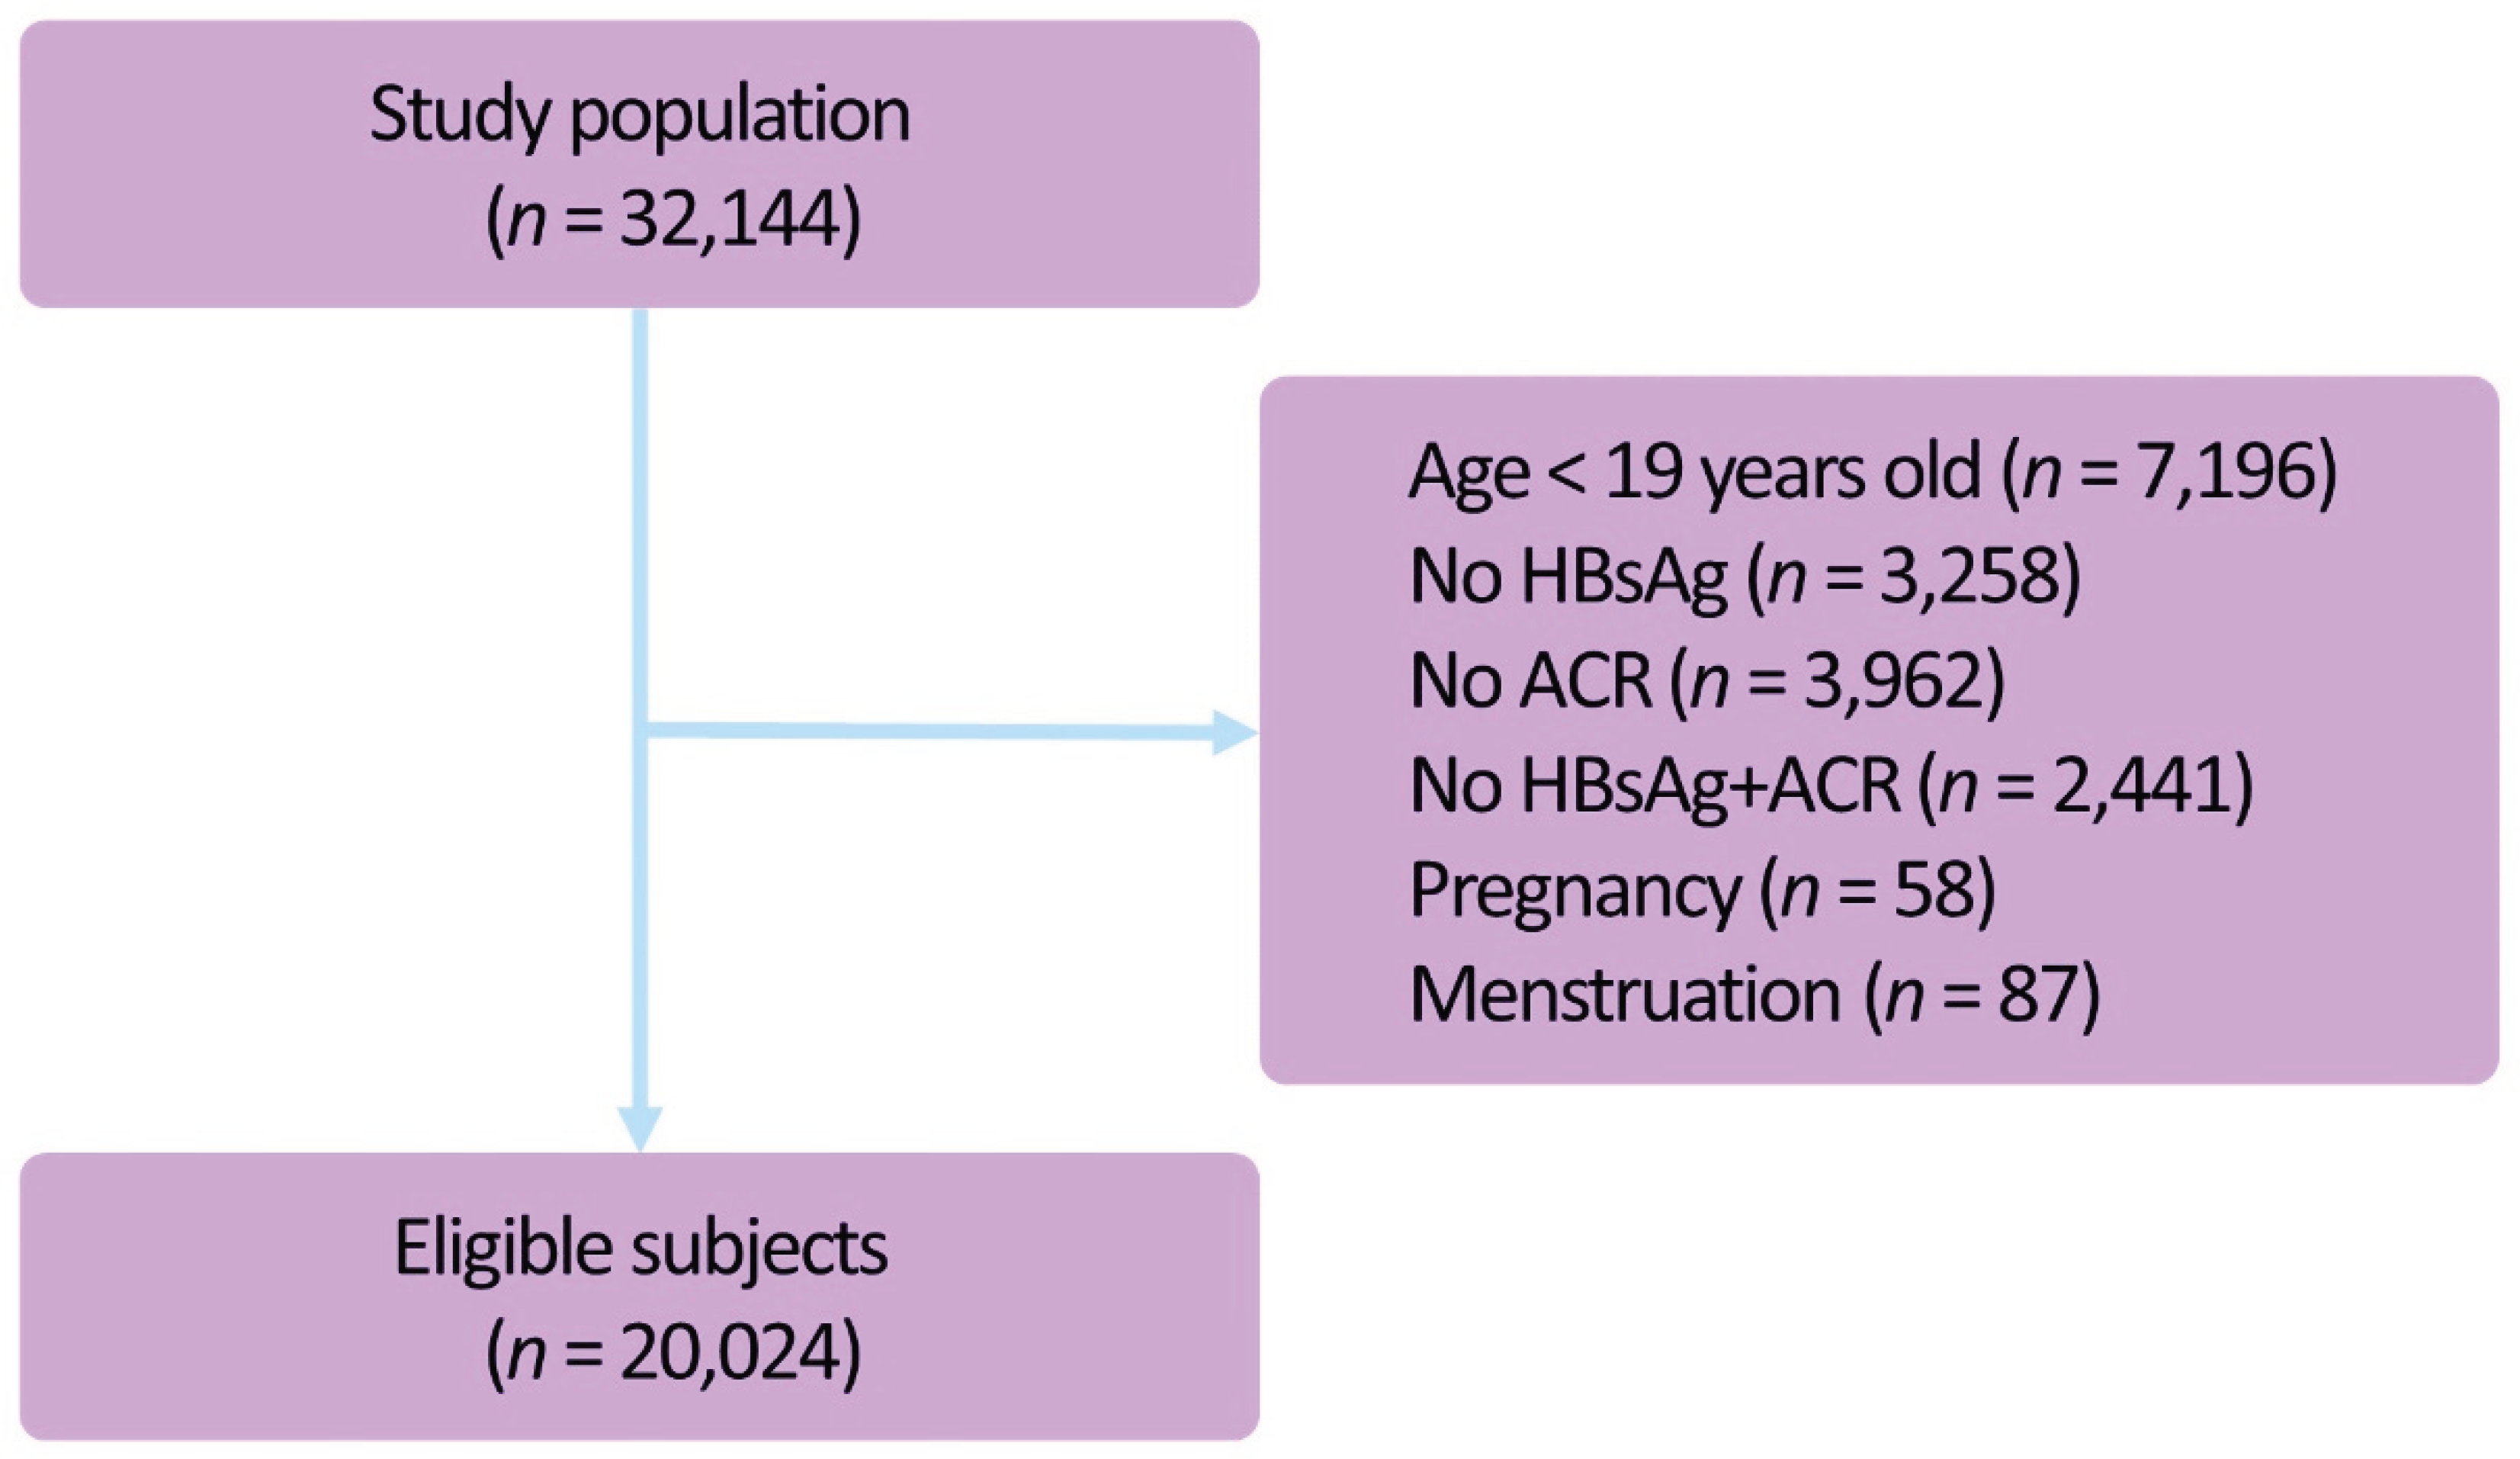
Background: The prevalence of chronic hepatitis B virus (HBV) infection is estimated at approximately 3% in Korea, and it is also accompanied by extra-hepatic manifestations as well as chronic hepatitis. Of these, HBV glomerulonephritis occurs due to the immune complex deposit; it is a serious condition that may cause renal failure. Methods: We analyzed the data obtained from adults aged 19 years or older who participated in the KNHANES V-2 and 3 (2011 and 2012) and VI-1 and 2 (2013 and 2014), for which we estimated the prevalence of HBV infection and compared albuminuria and spot urine ACR between the HBV infection group and the control group. Results: A total of 20,024 subjects were enrolled in the current study. The prevalence of HBV infection was 3.8%. There were no significant differences in the prevalence of albuminuria (5.6±1.0 % vs. 6.9±0.2 %, respectively) (P=0.233) and spot urine ACR (22.23±8.95 vs. 17.87±1.05 mcg/mg, respectively) (P=0.629) between the HBV infection group and the control group. In addition, according to a subgroup analysis, there was also no significant difference in the prevalence of albuminuria between the HBV infection group, accompanied by chronic diseases such as HTN, DM, metabolic syndrome and dyslipidemia, and the control group. Conclusions: Based on our results, it can be concluded that only a regular follow-up rather than a meticulous monitoring of microalbuminuria would be sufficient in the subjects with HBV infection.

Keywords: 
;  ;  ;  ;  ;  

1. Introduction

Chronic hepatitis B virus (HBV) infection is such a relatively well-known, serious health condition that affects an estimated number of approximately 240 million people worldwide [1]. By the early 80-90s in Korea, the rate of HBV infection has reached up to 8-10%. With the introduction of HBV vaccination, however, it was greatly decreased; it has been maintained as approximately 3% until recently [2]. Chronic HBV infection may lead to liver cirrhosis accompanied by several complications and chronic hepatitis progressing to hepatocellular carcinoma [3]. Moreover, patients with chronic hepatitis due to HBV infection are vulnerable to extra-hepatic manifestations because of immune complex deposit, which can be seen in such cases as polyarteritis nodosa and systemic necrotizing vasculitis mediated by immune complexes [4]. Of these, the most significant case is extra-hepatic manifestation; up to 0.1-25% of above patients are vulnerable to HBV glomerulonephritis characterized by the deposition of HBV antigen-antibody complexes due in the glomeruli of the kidney [5,6,7]. HBV glomerulonephritis can be presented as a variety of glomerulonephritis, such as membranous glomerulonephritis, membrano-proliferative glomerulonephritis, minimal change disease, focal segmental glomerulosclerosis and Ig A nephropathy. Moreover, it may also lead to chronic kidney disease (CKD) [8]. In patients with CKD, HBV-associated glomerulonephritis may be a key risk factor of developing cardiovascular morbidity and mortality [9]. Still, however, there is a paucity of data regarding the relationship between HBV infection and glomerulonephritis.
Albuminuria is a significant indicator of glomerular injury; it is also used to make a tentative diagnosis of glomerular injury in patients who concurrently had diabetes mellitus [10]. Its relationship with HBV infection remains uncertain.
Given the above background, we conducted this study to examine the characteristics of renal disease in Korean patients with HBV infection and to identify the relationship between HBV infection and the prevalence of albuminuria through an analysis of the data obtained from the Korea National Health and Nutrition Examination Survey (KNHANES). Then, we examined the prevalence and characteristics of glomerulonephritis in patients with HBV infection and albuminuria.

2. Materials and Methods

2.1. Study Cohort

The KNHANES is a cross-sectional nationwide health survey performed in a Korean population. We performed an analysis of the data obtained during a 4-year period (KNHANES V-2 and 3 [2011-2012] and VI-1 and 2 [2013-2014]) where urine levels of albumin and creatinine were measured. Of a total of 32,144 subjects (8,518 from 2011, 8,058 from 2012, 8,018 from 2013 and 7,550 from 2014), 24,948 were aged 19 years or older and then enrolled in the current study.

2.2. Definitions

HBV infection: A diagnosis of hepatitis B virus infection was made in patients with HBsAg (surface antigen of the hepatitis B virus) level>1.
Hypertension (HTN): Blood pressure was measured a total of 3 times. The second and third measurements were averaged. Then, a diagnosis of HTN was made in more than one of the following cases:
(1) systolic pressure ≥140 mmHg
(2) diastolic pressure ≥90 mmHg (Joint National Committee on Prevention, Detection, Evaluation, and Treatment of High Blood Pressure (JNC VII) guideline)
(3) the current use of anti-hypertensive drugs [11].
Diabetes mellitus (DM): A diagnosis of DM was made in more than one of the following cases:
(1) fasting plasma glucose ≥126 mg/dL
(2) a diagnosis of DM made by a physician
(3) the current use of insulin or other anti-glycemic agents [12].
Metabolic syndrome (MS): A diagnosis of MS was made in men with a waist circumference of ≥90 cm or women with a waist circumference of ≥80cm and two of the following four criteria:
(1) triglyceride (TG) level ≥150 mg/dL or the current use of anti-triglycemic drugs;
(2) high-density lipoprotein (HDL) cholesterol level <40 mg/mL in men and <50 mg/mL in women;
(3) systolic pressure ≥130 mmHg, diastolic pressure ≥85 mmHg or the current use of anti-hyperglycemic drugs;
(4) fasting plasma glucose ≥100mg/dL or the current use of anti-glycemic drugs (IDF [2006] guideline) [13].
Dyslipidemia: A diagnosis of dyslipidemia was made in the subjects with more than one of the following three criteria:
(1) total cholesterol level ≥240 mg/dL,
(2) TG level ≥200 mg/dL,
(3) the current use of anti-dyslipidemic drugs.
Chronic kidney disease (CKD): A diagnosis of CKD was made in the subjects with more one of the following criteria:
(1) estimated glomerular filtration rate (eGFR)<60 mL/min/1.73㎡(CKD-EPI equation),
(2) spot urine albumin/creatinine ratio (ACR) ≥30 mcg/mg [14].
Albuminuria: A diagnosis of albuminuria was made in the subjects with an ACR of ≥30 mcg/mg. In addition, it was classified into microalbuminuria (30-299 mg/g) and macroalbuminuira (≥300 mg/g) [14].

2.3. Laboratory Measurement

The KNHANES data was collected through an interview, a self-administered questionnaire, physical examination and clinical examinations. Blood sampling was done first for the non-dominant arm after the confirmation of fasting state. Pre-treatment for blood sampling was done at a mobile test laboratory immediately after it. For urine collection, spot urine samples were collected using a conical tube. If possible, it was recommended that the first morning urine be used. The midstream was collected at a volume of approximately 20-30 mL. Immediately after the collection of blood and urine samples, they were preserved in a refrigerator (2-8°C). Blood and urine sampling was done at a reference laboratory, Seegene Medical Foundation (Seoul, Korea).

2.4. Statistical Analysis

All data was analyzed using the IBM SPSS Statistics 21.0, for which complex sample files were generated by considering strata, cluster and weight statements. Continuous variables were expressed as mean±standard error (SE) and categorical one were done as proportion±SE (number). In addition, categorical variables were compared using the chi-square (χ2) test and continuous variables were compared using the t-test. A P-value of <0.05 was considered statistically significant. Albuminuria was determined using the multivariate logistic regression analysis, for which the OR (odds ratio) and 95% confidence interval (CI) were calculated.

3. Results

3.1. Baseline and Clinical Characteristics of the Study Population

Of the data obtained from the KNHANES V and VI, we used that obtained from the V-2 and 3 and VI-1 and 2 (2011-2014) where urine albumin and creatinine levels were measured. Of a total of 32,144 subjects, 7,196 aged 19 years or younger were excluded. Therefore, a total of 24,948 subjects were enrolled in the current study. Of 24,948 subjects, 3,258 without data about HBsAg and 3,962 where spot urine ACR could not be measured were excluded. In addition, 58 pregnant women and 87 in the menstrual cycle were also excluded. Thus, a total of 20,024 subjects were enrolled in the current study. Of these, HBV infection was seen in 3.8% of the subjects (n=717) (Figure 1).
With regard to the sex distribution, the proportion of male subjects was 58.9% in the HBV infection group and 52.6% in the control group. This difference reached statistical significance. Moreover, there were no significant differences in the age (46.33±0.59 vs. 45.84±0.20 yrs, respectively) (P=0.404), smoking (28.3±2.1 vs. 24.5±0.4%, respectively) (P=0.063), drinking (13.4±1.7 vs. 13.0±0.3%, respectively) (P=0.822) and body mass index (BMI) (23.98±0.15 vs. 23.80±0.04 kg/m2, respectively) (P=0.225) between the HBV infection group and the control group. With regards to laboratory measurements, aspartate aminotransferase (AST) (30.00±1.70 vs. 22.12±0.11 IU/L, respectively) (P<0.001), alanine aminotransferase (ALT) (34.06±3.12 vs. 22.15±0.19 IU/L, respectively) (P<0.001) and hemoglobin (14.53±0.07 vs. 14.31±0.02 g/dL, respectively) (P=0.002) were significantly higher in the HBV infection group as compared with the control group. In addition, cholesterol (184.15±1.40 vs. 188.58±0.36 mg/dL, respectively) (P=0.002) and TG (119.78±4.58 vs. 138.42±1.14 mg/dL, respectively) (P<0.001) levels were significantly lower in the HBV infection group as compared with the control group. There were no significant differences in creatinine (0.87±0.01 vs. 0.85±0.00 mg/dL, respectively) (P=0.080) and fasting glucose (98.14±0.92 vs. 98.07±0.20 mg/dL, respectively) (P=0.936) between the HBV infection group and the control group (Table 1).

3.2. Relationship Between the Prevalence of Albuminuria and HBV Infection

There was no significant difference in the prevalence of albuminuria between the two groups (5.6±1.0% vs. 6.9±0.2%, P=0.233). In addition, there were also no significant differences in the prevalence of microalbuminuria (4.7±0.9 vs. 6.1±0.2%, respectively) (P=0.200) and macroalbuminuira (0.9±0.3 vs. 0.9±0.1%, respectively) (P=0.951) between the two groups (Table 1).
There was no significant difference in the spot urine ACR (22.23±8.95 vs. 17.87±1.05 mcg/mg, respectively) (P=0.629) between the two groups. In the presence of albuminuria, there was no significant difference in spot urine ACR (316.89±149.21 vs. 188.74±14.08 mcg/mg, respectively) (P=0.393) between the two groups (Table 1).

3.3. Relationship Between the Prevalence of Albuminuria and HBV Infection in Each Subgroup

There were no significant differences in the prevalence of HTN (24.4±1.8 vs. 25.2±0.5%, respectively) (P=0.660), DM (7.7±1.2 vs. 9.2±0.3%, respectively) (P=0.255), MS (19.0±1.8 vs. 20.2±0.4%, respectively) (P=0.497) and CKD (6.6±1.0 vs. 8.4±0.3%, respectively) (P=0.120) between the two groups. But the prevalence of dyslipidemia (13.2±1.4 vs. 22.3±0.4%, respectively) (P<0.001) was significantly higher in the control group as compared with the HBV infection group (Table 2).
In the presence of HTN, there were no significant differences in spot urine ACR (74.21±36.29 vs. 42.94±3.70 mcg/mg, respectively) (P=0.392) and the prevalence of albuminuria (18.3±3.4 vs. 15.9±0.6%, respectively) (P=0.458) between the two groups. In the presence of normotension, spot urine ACR (5.44±0.62 vs. 9.41±0.60 mcg/mg, respectively) (P<0.001) was significantly more prevalent in the control group as compared with the HBV infection group. In addition, the prevalence of albuminuria was also significantly higher in the control group (1.5±0.6 vs. 3.9±0.2%, respectively) (P=0.010). In the presence of albuminuria, however, there was no significant difference in the spot urine ACR (90.63±31.02 vs. 130.93±13.66 mcg/mg, respectively) (P=0.231) between the two groups (Table 3).
In the presence of DM, there were no significant differences in spot urine ACR (179.71±111.35 vs. 69.81±7.40 mcg/mg, respectively) (P=0.325) and the prevalence of albuminuria (25.7±7.3 vs. 23.5±1.0%, respectively) (P=0.757) between the two groups. In the presence of non-DM, spot urine ACR (9.05±1.56 vs. 12.62±0.83 mcg/mg, respectively) (P=0.042) was significantly higher in the control group as compared with the HBV infection group. In the presence of albuminuria, however, there was no significant difference in the spot urine ACR (122.66±32.54 vs. 153.12±14.64 mcg/mg, respectively) (P=0.392) between the two groups. In addition, there was also no significant difference in the prevalence of albuminuria (3.9±0.8 vs. 5.3±0.2, respectively) (P=0.143) between the two groups (Table 4).
In the presence of dyslipidemia, there was no significant difference in the spot urine ACR (43.25±31.67 vs. 34.45±3.47 mcg/mg, respectively) (P=0.782) between the two groups. In the presence of albuminuria, however, there was also no significant difference in the spot urine ACR (337.35±263.73 vs. 241.97±27.30 mcg/mg, respectively) (P=0.717) between the two groups. In addition, there was also no significant difference in the prevalence of albuminuria (11.5±3.7 vs. 11.9±0.6, respectively) (P=0.913) between the two groups (Table 5).
In the presence of MS, spot urine ACR (21.19±4.05 vs. 35.20±3.01 mcg/mg, respectively) (P=0.007) was significantly higher in the control group as compared with the HBV infection group. In the presence of albuminuria, spot urine ACR (126.57±27.76 vs. 196.16±19.00 mcg/mg, respectively) (P=0.041) was also significantly higher in the control group. But there was no significant difference in the prevalence of albuminuria (11.9±2.6 vs. 14.9±0.7%, respectively) (P=0.309) between the two groups (Table 6).

4. Discussion

Chronic HBV is a relatively popular disease worldwide; it may also be accompanied by several extra-hepatic manifestations other than hepatic symptoms [3]. Of its clinical manifestations, although rare, HBV glomerulonephritis is a serious complication that may lead to CKD [5,6]. The relationship between HBV infection and renal involvement was first reported in 1971. Since then, it has been described in several published studies. Still, however, little is known about the natural history and pathogenesis of HBV infection and nephropathy [15]. It is presumed, however, that HBV glomerulonephritis occurs as a result of immune complex deposit due to HBV antigens and antibodies [16,17]. The spontaneous resolve of HBV glomerulonephritis rarely occurs in adults. It progresses to the renal failure in 30% of adults. In approximately 10% of adults, it has been reported that hemodialysis treatment is also needed [18]. According to a Chinese study, eGFR was lower in patients with HBV infection and higher serum ALT levels as compared with those with HBV infection and normal serum ALT levels and those without HBV infection[19]. Still, however, there is a paucity of data regarding indicators of the severity of HBV associated-renal disease.
According to the National Health and Nutrition Examination Survey (NHANES) III statistics, the prevalence of albuminuria was 9.2% in a general population and 34.2% in patients with DM. In Korea, it was 26.7-34% in patients with DM [20,21]. Microalbuminuria is closely associated with glomerular damage, thus being used as an indicator of the progression of renal disease. Its association with cardiovascular morbidity and mortality has also been described in patients with DM and MS [9,10]. It is known that the prevalence of DM and MS is relatively higher in patients with HCV infection. But there was no significant difference in it in patients with HBV infection [22]. According to Suthat et al. who analyzed the NHANES III data showing the relationship between HCV infection and microalbuminuria, there was an independent relationship between them [22]. But there was no nationwide survey about the relationship between HBV infection and albuminuria. Because we assume that HBV infection may cause HBV glomerulonephritis, we analyzed the KNHANES data to identify the relationship between HBV infection and albuminuria.
In a Korean general population, the prevalence of albuminuria was 6.9%. There were no significant differences in the prevalence of albuminuria and spot urine ACR between patients with HBV infection and the control group. This leads to the speculation that it would not be mandatory to perform a meticulous monitoring of albuminuria in patients with HBV infection. According to a subgroup analysis depending on the HTN, DM, dyslipidemia and MS, it can be inferred that only a regular follow-up rather than a meticulous monitoring would be sufficient for albuminuria in the subjects with HBV infection. Presumably, this might be because HBV infection may cause HBV glomerulonephritis but it did not significantly affect the prevalence of albuminuria as it is a rare disease entity. In addition, unlike HCV, HBV is not associated with DM and MS that may affect the renal disease. This leads to the speculation that the prevalence of albuminuria would not be of statistical significance. As another possibility, our data was extracted from the representative sample of a Korean population. As compared with the control group, however, the prevalence of HBV infection was at most 3.8% (n=717). Therefore, despite a weighted value analysis, there might have been effects on the analysis of the prevalence of albuminuria. In addition, a weighted value analysis was also performed for the spot urine ACR. Indeed, however, only 45 patients had albuminuria in the HBV infection group. Therefore, the number of patients with albuminuria was much smaller in the HBV infection group as compared with the control group (n=1,594). This indicates that the number of patients with albuminuria did not follow the normal distribution. Due to a great standard error, although spot urine ACR was prevalently seen in the HBV infection, statistical significance would not be found. In addition, a subgroup analysis would also show the results that are not statistically significant because the number of patients with HBV infection was much smaller than the control group.
Limitations of the current study are as follows:
(1) We analyzed the KNHANES data, thus solely elucidating the presence of HBV infection. We therefore failed to examine HBV viral titer or active or chronic status.
(2) Due to a paucity of data regarding complications such as liver disease, including liver cirrhosis due to HBV infection, we failed to perform additional analyses.
(3) We failed to rule out the factors that might increase the urinary albumin excretion, serving as the key indicator for the current analysis, such as urinary tract infection and febrile illness, We solely performed the test in a single session.
(4) No available data was present for HCV infection, which is because the relevant test was not performed in 2011. We therefore failed to rule out the HCV infection group. Moreover, there were significant differences in the male-to-female ratio and liver enzymes between the HBV infection group and the control group. It can therefore be inferred that a matching analysis would produce different results.
According to a Chinese study, there was a significant decrease but there were no changes in the ACR in eGFR in the HCV group where liver enzyme levels were elevated [19]. Henceforth, with reference to the above published studies and the Korean data, additional groups are needed to obtain significant results. In addition, sufficient evaluation of the corresponding patient group would be recommendable.
Advantages of the current study are that we analyzed the national data. To our knowledge, this is the first study to analyze the relationship between the HBV infection and the prevalence of albuminuria based on the KNHANES. Thus, we analyzed the data that is representative of a Korean population. Based on the results of the current study, it can be concluded that only a regular follow-up rather than a meticulous monitoring of microalbuminuria would be sufficient in the subjects with HBV infection. Our results will contribute to improving public health care through the primary and secondary prevention of glomerulonephritis and the establishment of monitoring system for it in patients with HBV infection.

Funding

The authors thank Laon Medi Solution Inc. (Seoul, Republic of Korea) and KDH Medical Inc. (Gwangmyeong, Gyeonggi, Republic of Korea) for additional support of this study (Funding number: KDH-2023).

References

  1. World Health Organization. Hepatitis B. Fact Sheet No. 204; World Health Organization: Geneva, Switzerland, 2016. Available online: http://who.int/mediacentre/factsheets/fs204/en/ (accessed on 10 February 2017).
  2. Park, N.H.; Chung, Y.H.; Lee, H.S. Impacts of vaccination on hepatitis B viral infections in Korea over a 25-year period. Intervirology 2010, 53, 20–28. [Google Scholar] [CrossRef]
  3. Chae, H.B.; Kim, J.-H.; Kim, J.K.; Yim, H.J. Current status of liver diseases in Korea: Hepatitis B. Korean J. Hepatol. 2009, 15, S13–S24. [Google Scholar] [CrossRef]
  4. Gocke, D.J. Extrahepatic manifestations of viral hepatitis. Am. J. Med. Sci. 1975, 270, 49–52. [Google Scholar] [CrossRef] [PubMed]
  5. Levy, M.; Kleinknecht, C. Membranous glomerulonephritis and hepatitis B virus infection. Nephron 1980, 26, 259–265. [Google Scholar] [CrossRef]
  6. Wiggelinkhuizen, J.; Sinclair-Smith, C.; Stannard, L.M.; Smuts, H. Hepatitis B virus-associated membranous glomerulonephritis. Arch. Dis. Child. 1983, 58, 488–496. [Google Scholar] [CrossRef]
  7. Southwest Pediatric Nephrology Study Group. Hepatitis B surface antigenemia in North American children with membranous glomerulonephropathy. J. Pediatr. 1985, 106, 571–578. [Google Scholar] [CrossRef] [PubMed]
  8. Brzosko, W.J.; Krawczynski, K.; Nazarewicz, T.; Morzycka, M.; Nowoslawski, A. Glomerulonephritis associated with hepatitis B surface antigen immune complexes in children. Lancet 1974, 2, 477–482. [Google Scholar] [CrossRef] [PubMed]
  9. Wright, J.; Hutchison, A. Cardiovascular disease in patients with chronic kidney disease. Vasc. Health Risk Manag. 2009, 5, 713–722. [Google Scholar] [PubMed]
  10. Huang, J.F.; Chuang, W.L. Viral hepatitis and proteinuria in an area endemic for hepatitis B and C infections: Another chain of link? J. Intern. Med. 2006, 260, 255–262. [Google Scholar] [CrossRef]
  11. Chobanian, A.V.; Bakris, G.L.; Black, H.R.; Cushman, W.C.; Green, L.A.; Izzo, J.L.; Jones, D.W.; Materson, B.J.; Oparil, S.; Wright, J.T.; et al. The Seventh Report of the Joint National Committee on Prevention, Detection, Evaluation, and Treatment of High Blood Pressure (JNC 7). JAMA 2003, 289, 2560–2572. [Google Scholar] [CrossRef]
  12. American Diabetes Association. Classification and diagnosis of diabetes. Diabetes Care 2015, 38, S8–S16. [Google Scholar] [CrossRef] [PubMed]
  13. IDF Epidemiology Task Force Consensus Group. The metabolic syndrome—A new worldwide definition. Lancet 2005, 366, 1059–1062. [Google Scholar] [CrossRef] [PubMed]
  14. Sacks, D.B.; Bruns, D.E.; Goldstein, D.E.; Maclaren, N.K.; McDonald, J.M.; Parrott, M. Guidelines and recommendations for laboratory analysis in the diagnosis and management of diabetes mellitus. Clin. Chem. 2002, 48, 436–472. [Google Scholar] [CrossRef]
  15. Combes, B.; Shorey, J.; Barrera, A.; Stastny, P.; Eigenbrodt, E.; Hull, A.R.; Carter, N.W. Glomerulonephritis with deposition of Australia antigen–antibody complexes in the glomerular basement membrane. Lancet 1971, 2, 234–237. [Google Scholar] [CrossRef] [PubMed]
  16. Takekoshi, Y.; Tanaka, M.; Miyakawa, Y.; Yoshizawa, H.; Takahashi, K.; Mayumi, M. Free “small” and IgG-associated “large” hepatitis B e antigen in the serum and glomerular capillary walls of two patients with membranous glomerulonephritis. N. Engl. J. Med. 1979, 300, 814–819. [Google Scholar] [CrossRef]
  17. Johnson, R.J.; Couser, W.G. Hepatitis B infection and renal disease: Clinical, immunopathogenetic and therapeutic considerations. Kidney Int. 1990, 37, 663–676. [Google Scholar] [CrossRef]
  18. Panomsak, S.; Lewsuwan, S.; Kanjanabuch, T. Hepatitis B virus-associated nephropathies in adults: A clinical study in Thailand. J. Med. Assoc. Thai. 2006, 89, S151–S156. [Google Scholar]
  19. Cai, J.; Fan, X.; Mou, L.; Yang, Y.; Ren, J.; Lin, S. Association of reduced renal function with hepatitis B virus infection and elevated alanine aminotransferase. Clin. J. Am. Soc. Nephrol. 2012, 7, 1561–1566. [Google Scholar] [CrossRef]
  20. Garg, A.X.; Kiberd, B.A.; Clark, W.F.; Haynes, R.B.; Clase, C.M. Albuminuria and renal insufficiency prevalence guides population screening: Results from the NHANES III. Kidney Int. 2002, 61, 2165–2175. [Google Scholar] [CrossRef]
  21. Ahn, J.H.; Yu, J.H.; Ko, S.H.; Kwon, H.S.; Kim, D.J.; Kim, J.H.; Kim, C.S.; Song, K.H.; Won, J.C.; Lim, S.; et al. Prevalence and determinants of diabetic nephropathy in Korea: Korea National Health and Nutrition Examination Survey. Diabetes Metab. J. 2014, 38, 109–119. [Google Scholar] [CrossRef]
  22. Liangpunsakul, S.; Chalasani, N. Relationship between hepatitis C and microalbuminuria: Results from the NHANES III. Kidney Int. 2005, 67, 285–290. [Google Scholar] [CrossRef] [PubMed]
Figure 1. Description of the study cohort and various sub-groups.
Preprints 192848 g001
Table 1. Baseline and clinical characteristics of the study population.
Total Hepatitis B Control
N=20,024 N=717 (3.8%) N=19,307 (96.2%) P-value
Age [years] 45.86±0.20 46.33±0.59 45.84±0.20 0.404
Gender (men) [%] 52.9±0.4 (n=9, 024) 58.9±2.2 (n=367) 52.6± 0.4 (n=8, 657) 0.006
Smoker [%] 24.6±0.4 (n=3, 915) 28.3±2.1 (n=169) 24.5±0.4 (n=3, 746) 0.063
Alcohol [%] 13.0±0.3 (n=2, 028) 13.4±1.7 (n=76) 13.0±0.3 (n=1, 952) 0.822
BMI kg/m2 23.80±0.04 23.98±0.15 23.80±0.04 0.225
AST IU/L 22.41±0.12 30.00±1.70 22.12±0.11 <0.001
ALT IU/L 22.60±0.21 34.06±3.12 22.15±0.19 <0.001
Hemoglobin g/dL 14.32±0.02 14.53±0.07 14.31±0.02 0.002
BUN mg/dL 14.15±0.04 14.23±0.19 14.14±0.04 0.657
Creatinine mg/dL 0.85±0.00 0.87±0.01 0.85±0.00 0.080
eGFR 96.44±0.18 95.41±0.67 96.48±0.18 0.112
Fasting glucose mg/dL 98.07±0.20 98.14±0.92 98.07±0.20 0.936
Cholesterol mg/dL 188.41±0.36 184.15±1.40 188.58±0.36 0.002
TG mg/dL 137.72±1.12 119.78±4.58 138.42±1.14 0.000
HDL mg/dL 52.17±0.12 51.60±0.58 52.19±0.12 0.303
albuminuria [%] 6.9±0.2 (n=1, 639) 5.6±1.0 6.9±0.2 0.233
microalbuminuria [%] 6.0±0.2 (n=1, 422) 4.7±0.9 (n=36) 6.1±0.2 (n=1, 386) 0.200
macroalbuminuria [%] 0.9±0.1 (n=217) 0.9±0.3 (n=9) 0.9±0.1 (n=208) 0.951
ACR mcg/mg 18.03±1.06 22.23±8.95 17.87±1.05 0.629
ACR mcg/mg * 192.69±14.43 316.89±149.21 188.74±14.08 0.393
*After excluding individuals with ACR <30 mcg/mg.
Table 2. The prevalence of chronic disease in the subjects with hepatitis B and normal controls.
Total Hepatitis B Control
N=20,024 N=717 (3.8%) N=19,307 (96.2%) P-value
Hypertension [%] 25.2±0.4 (n=6, 166) 24.4±1.8 (n=202) 25.2±0.5 (n=5, 964) 0.660
Diabetes mellitus [%] 9.1±0.2 (n=2, 246) 7.7±1.2 (n=62) 9.2±0.3 (n=2, 184) 0.255
Metabolic syndrome [%] 20.2±0.4 (n=4, 715) 19.0±1.8 (n=156) 20.2±0.4 (n=4, 559) 0.497
CKD [%] 8.3±0.3 (n=2, 114) 6.6±1.0 (n=55) 8.4±0.3 (n=2, 059) 0.120
CKD [%] * 2.4±0.1 (n=736) 1.9±0.5 (n=16) 2.4±0.1 (n=720) 0.376
Dyslipidemia [%] 21.9±0.4 (n=4, 889) 13.2±1.4 (n=99) 22.3±0.4 (n=4, 790) <0.001
* CKD based on the eGFR only.
Table 3. Association between hepatitis B and albuminuria in the normotension and hypertension groups.
Total Hepatitis B Control P-value OR
N=20,024 N=717 (3.8%) N=19,307 (96.2%)
Normotension N=13, 858 N=515 N=13, 343
ACR mcg/mg
ACR mcg/mg *
9.25±0.58
130.32±13.48
5.44±0.62
90.63±31.02
9.41±0.60
130.93±13.66
<0.001
0.231
Albuminuria 3.8±0.2 (n=611) 1.5±0.6 (n=10) 3.9±0.2 (n=601) 0.010 0.382
(0.184-0.795)
microalbuminuria [%] 3.5±0.2 (n=556) 1.4±0.6 (n=8) 3.6±0.2 (n=548) 0.015 0.376
(0.171-0.829)
macroalbuminuria [%] 0.3±0.0 (n=55) 0.1±0.1 (n=2) 0.3±0.1 (n=53) 0.284 0.457
(0.109-1.921)
Hypertension N=6, 166 N=202 N=5, 964
ACR mcg/mg
ACR mcg/mg *
44.08±3.79
237.13±22.26
74.21±36.29
375.75±187.01
42.94±3.70
231.06±21.76
0.392
0.443
Albuminuria 16.0±0.6 (n=1, 028) 18.3±3.4 (n=35) 15.9±0.6 (n=993) 0.458 1.186
(0.755-1.863)
microalbuminuria [%] 13.4±0.6 (n=866) 15.1±3.2 (n=28) 13.4±0.6 (n=838) 0.559 1.162
(0.702-1.921)
macroalbuminuria [%] 2.5±0.2 (n=162) 3.2±1.3 (n=7) 2.5±0.2 (n=155) 0.537 1.317
(0.549-3.159)
*After excluding individuals with ACR <30 mcg/mg.
Table 4. Association between hepatitis B and albuminuria in the non-diabetes and diabetes groups.
Total Hepatitis B Control
N=20,024 N=717 (3.8%) N=19,307 (96.2%) P-value OR
Non-DM N=17, 778 N=655 N=17, 123
ACR mcg/mg
ACR mcg/mg *
12.49±0.80
152.24±14.26
9.05±1.56
122.66±32.54
12.62±0.83
153.12±14.64
0.042
0.392
Albuminuria 5.2±0.2 (n=1, 076) 3.9±0.8 (n=32) 5.3±0.2 (n=1, 044) 0.143 0.739
(0.493-1.108)
microalbuminuria [%] 4.7±0.2 (n=968) 3.5±0.7 (n=27) 4.8±0.2 ( n=941) 0.149 0.727
(0.472-1.121)
macroalbuminuria [%] 0.5±0.1 (n=108) 0.4±0.2(n=5) 0.5±0.1 (n=103) 0.724 0.848
(0.339-2.123)
DM N=2, 246 N=62 N=2, 184
ACR mcg/mg
ACR mcg/mg *
73.32±8.00
281.79±32.51
179.71±111.35
672.55±404.69
69.81±7.40
267.66±30.13
0.325
0.319
Albuminuria 23.6±1.0 (n=563) 25.7±7.3 (n=13) 23.5±1.0 (n=550) 0.757 1.127
(0.529-2.401)
microalbuminuria [%] 19.2±1.0 (n=454) 19.4±6.9 (n=9) 19.2±1.0 (n=445) 0.928 1.041
(0.432-2.509)
macroalbuminuria [%] 4.4±0.5 (n=109) 6.3±3.6(n=4) 4.3±0.5 (n=105) 0.518 1.508
(0.434-5.241)
*After excluding individuals with ACR <30 mcg/mg.
Table 5. Association between hepatitis B and albuminuria in the non-dyslipidemia and dyslipidemia groups.
Total Hepatitis B Control
N=20,024 N=717 (3.8%) N=19,307 (96.2%) P-value OR
Normal N=15, 135 N=561 N=14, 748
ACR mcg/mg
ACR mcg/mg*
13.37±0.92
161.24±15.57
19.04±9.12
308.96±178.98
13.11±0.87
155.67±14.62
0.518
0.394
Albuminuria 5.5±0.2 (n=1, 017) 4.7±1.0 (n=32) 5.5±0.2 (n=985) 0.475 0.853
(0.550-1.321)
microalbuminuria [%] 4.9±0.2 (n=903) 4.0±0.9 (n=25) 5.0±0.2 (n=878) 0.334 0.791
(0.490-1.274)
macroalbuminuria [%] 0.5±0.1 (n=114) 0.8±0.3(n=7) 0.5±0.1 (n=107) 0.446 1.425
(0.572-3.548)
Dyslipidemia N=4, 889 N=99 N=4, 790
ACR mcg/mg
ACR mcg/mg*
34.65±3.47
244.08±27.29
43.25±31.67
337.35±263.73
34.45±3.47
241.97±27.30
0.782
0.717
Albuminuria 11.9±0.6 (n=622) 11.5±3.7 (n=13) 11.9±0.6 (n=609) 0.913 0.960
(0.459-2.006)
microalbuminuria [%] 10.0±0.5 (n=519) 9.9±3.6 (n=11) 10.0±0.6 (n=508) 0.968 0.984
(0.437-2.214)
macroalbuminuria [%] 2.0±0.2 (n=103) 1.7±1.2 (n=2) 2.0±0.2 (n=101) 0.813 0.838
(0.193-3.632)
*After excluding individuals with ACR <30 mcg/mg.
Table 6. Association between hepatitis B and albuminuria in the metabolic syndrome group.
Total Hepatitis B Control
N=20, 024 N=717 (3.8%) N=19, 307 (96.2%) P-value OR
Normal N=15,309 N=561 N=14,748
ACR mcg/mg
ACR mcg/mg*
13.82±1.07
191.56±20.81
22.47±10.98
445.00±246.32
13.48±1.03
183.02±19.78
0.415
0.289
Albuminuria 4.9±0.2 (n=896) 4.1±1.0 (n=21) 4.9±0.2 (n=875) 0498 0.838
(0.503-1.397)
microalbuminuria [%] 4.3±0.2 (n=778) 3.4±1.0 (n=17) 4.3±0.2 (n=761) 0.407 0.787
(0.446-1.388)
macroalbuminuria [%] 0.6±0.1 (n=118) 0.7±0.4 (n=4) 0.6±0.1(n=114) 0.705 1.234
(0.415-3.673)
Metabolic syn. N=4, 715 N=156 N=4, 559
ACR mcg/mg
ACR mcg/mg*
34.70±2.90
194.17±18.46
21.19±4.05
126.57±27.76
35.20±3.01
196.16±19.00
0.007
0.041
Albuminuria 14.8±0.7 (n=743) 11.9±2.6 (n=24) 14.9±0.7 (n=719) 0.309 0.772
(0.469-1.272)
microalbuminuria [%] 12.8±0.6 (n=644) 10.2±2.5 (n=19) 12.9±0.7 (n=625) 0.338 0.766
(0.443-1.324)
macroalbuminuria [%] 2.0±0.2 (n=99) 1.7±0.8 (n=5) 2.0±0.2 (n=94) 0.672 0.814
(0.313-2.114)
*After excluding individuals with ACR <30 mcg/mg.
Disclaimer/Publisher’s Note: The statements, opinions and data contained in all publications are solely those of the individual author(s) and contributor(s) and not of MDPI and/or the editor(s). MDPI and/or the editor(s) disclaim responsibility for any injury to people or property resulting from any ideas, methods, instructions or products referred to in the content.
Copyright: This open access article is published under a Creative Commons CC BY 4.0 license, which permit the free download, distribution, and reuse, provided that the author and preprint are cited in any reuse.
Prerpints.org logo

Preprints.org is a free preprint server supported by MDPI in Basel, Switzerland.

Subscribe

Disclaimer

Terms of Use

Privacy Policy

Privacy Settings

© 2026 MDPI (Basel, Switzerland) unless otherwise stated