1. Introduction
Oil free air compressors find applications in food/beverage and pharmaceutical processing and packaging, automotive painting, textile processing, chemical and petrochemical processing etc. Certainly, in such applications the air must be contamination free and hence oil free reciprocating air compressors are used. Such compressors consist of a Grey cast iron (GCI) cylinder and PTFE based piston rings which make sure sealing as well as lubrication at the contact [
1,
2]. PTFE is a self- lubricating material which demonstrates low coefficient of friction, however, signifies high wear rate. Many research investigations have focussed on improving the wear resistance of PTFE usually by reinforcement with micro and nano-fillers and significant improvements in the wear resistance have been achieved [
3,
4,
5,
6,
7,
8,
9,
10,
11,
12].Nonetheless, glass fibre and carbon filled PTFE micro-composites have been used over the years for self-lubricating piston rings application and are available commercially [
13,
14]. However, striving for improvement in performance is a continuous endeavour of scientists and researchers.
Laser surface texturing (LST) is one of the most methodology to improve surface properties, viz friction, wear and lubricating characteristics of all tribosystems ( bearings, shafts, piston rings etc) and the most common and earliest application is honing which is commonly seen in commercially available cylinder liners [
15,
16]. Various techniques have been developed and employed by researchers to obtain textured surfaces viz. vibrorolling, reactive ion etching, abrasive jet machining, lithography & anisotropic etching, laser surface texturing (LST) etc. to improve the tribological performance [
17,
18,
19,
20,
21,
22,
23,
24,
25,
26,
27,
28,
29]. However, LST at micro and nanoscale has proved efficient and promising method among the others because it allows tremendous control of shape and size of patterns, has shorter processing time and has no environmental concerns. Moreover, LST has wide range of applicability on different classes of materials (metals, ceramics and polymers) and hence is a promising conception [
29]. Therefore, LST has gained significant attention of tribologists in the recent years and numerous studies have been focussed on improving the friction and wear properties of materials using LST [
30,
31,
32,
33,
34,
35,
36,
37,
38]. Recently, tribological studies on bio inspired textures on metals and ceramic surfaces has showed tremendous potential [
39,
40]. Therefore, for improving the tribological properties of PTFE and its composite, LST has been applied.
This study intends on exploring the effect of LST of GCI on the tribo-properties of PTFE and glass fiber filled PTFE composite respecting the fact that PTFE/glass fibre filled PTFE and GCI form a tribo-pair in oil free reciprocating compressors. The idea is that the deposition of polymer transfer films on metallic counter surfaces may improve due to LST of GCI and hence may positively contribute to improvement in tribological properties of the polymer. To make the study more insightful, comparative investigations have been made with un-textured GCI and varying dimple density on textured GCI. The corresponding tribological mechanisms have been envisaged using worn surface analysis by surface examination tools.
2. Experimental
2.1. Materials
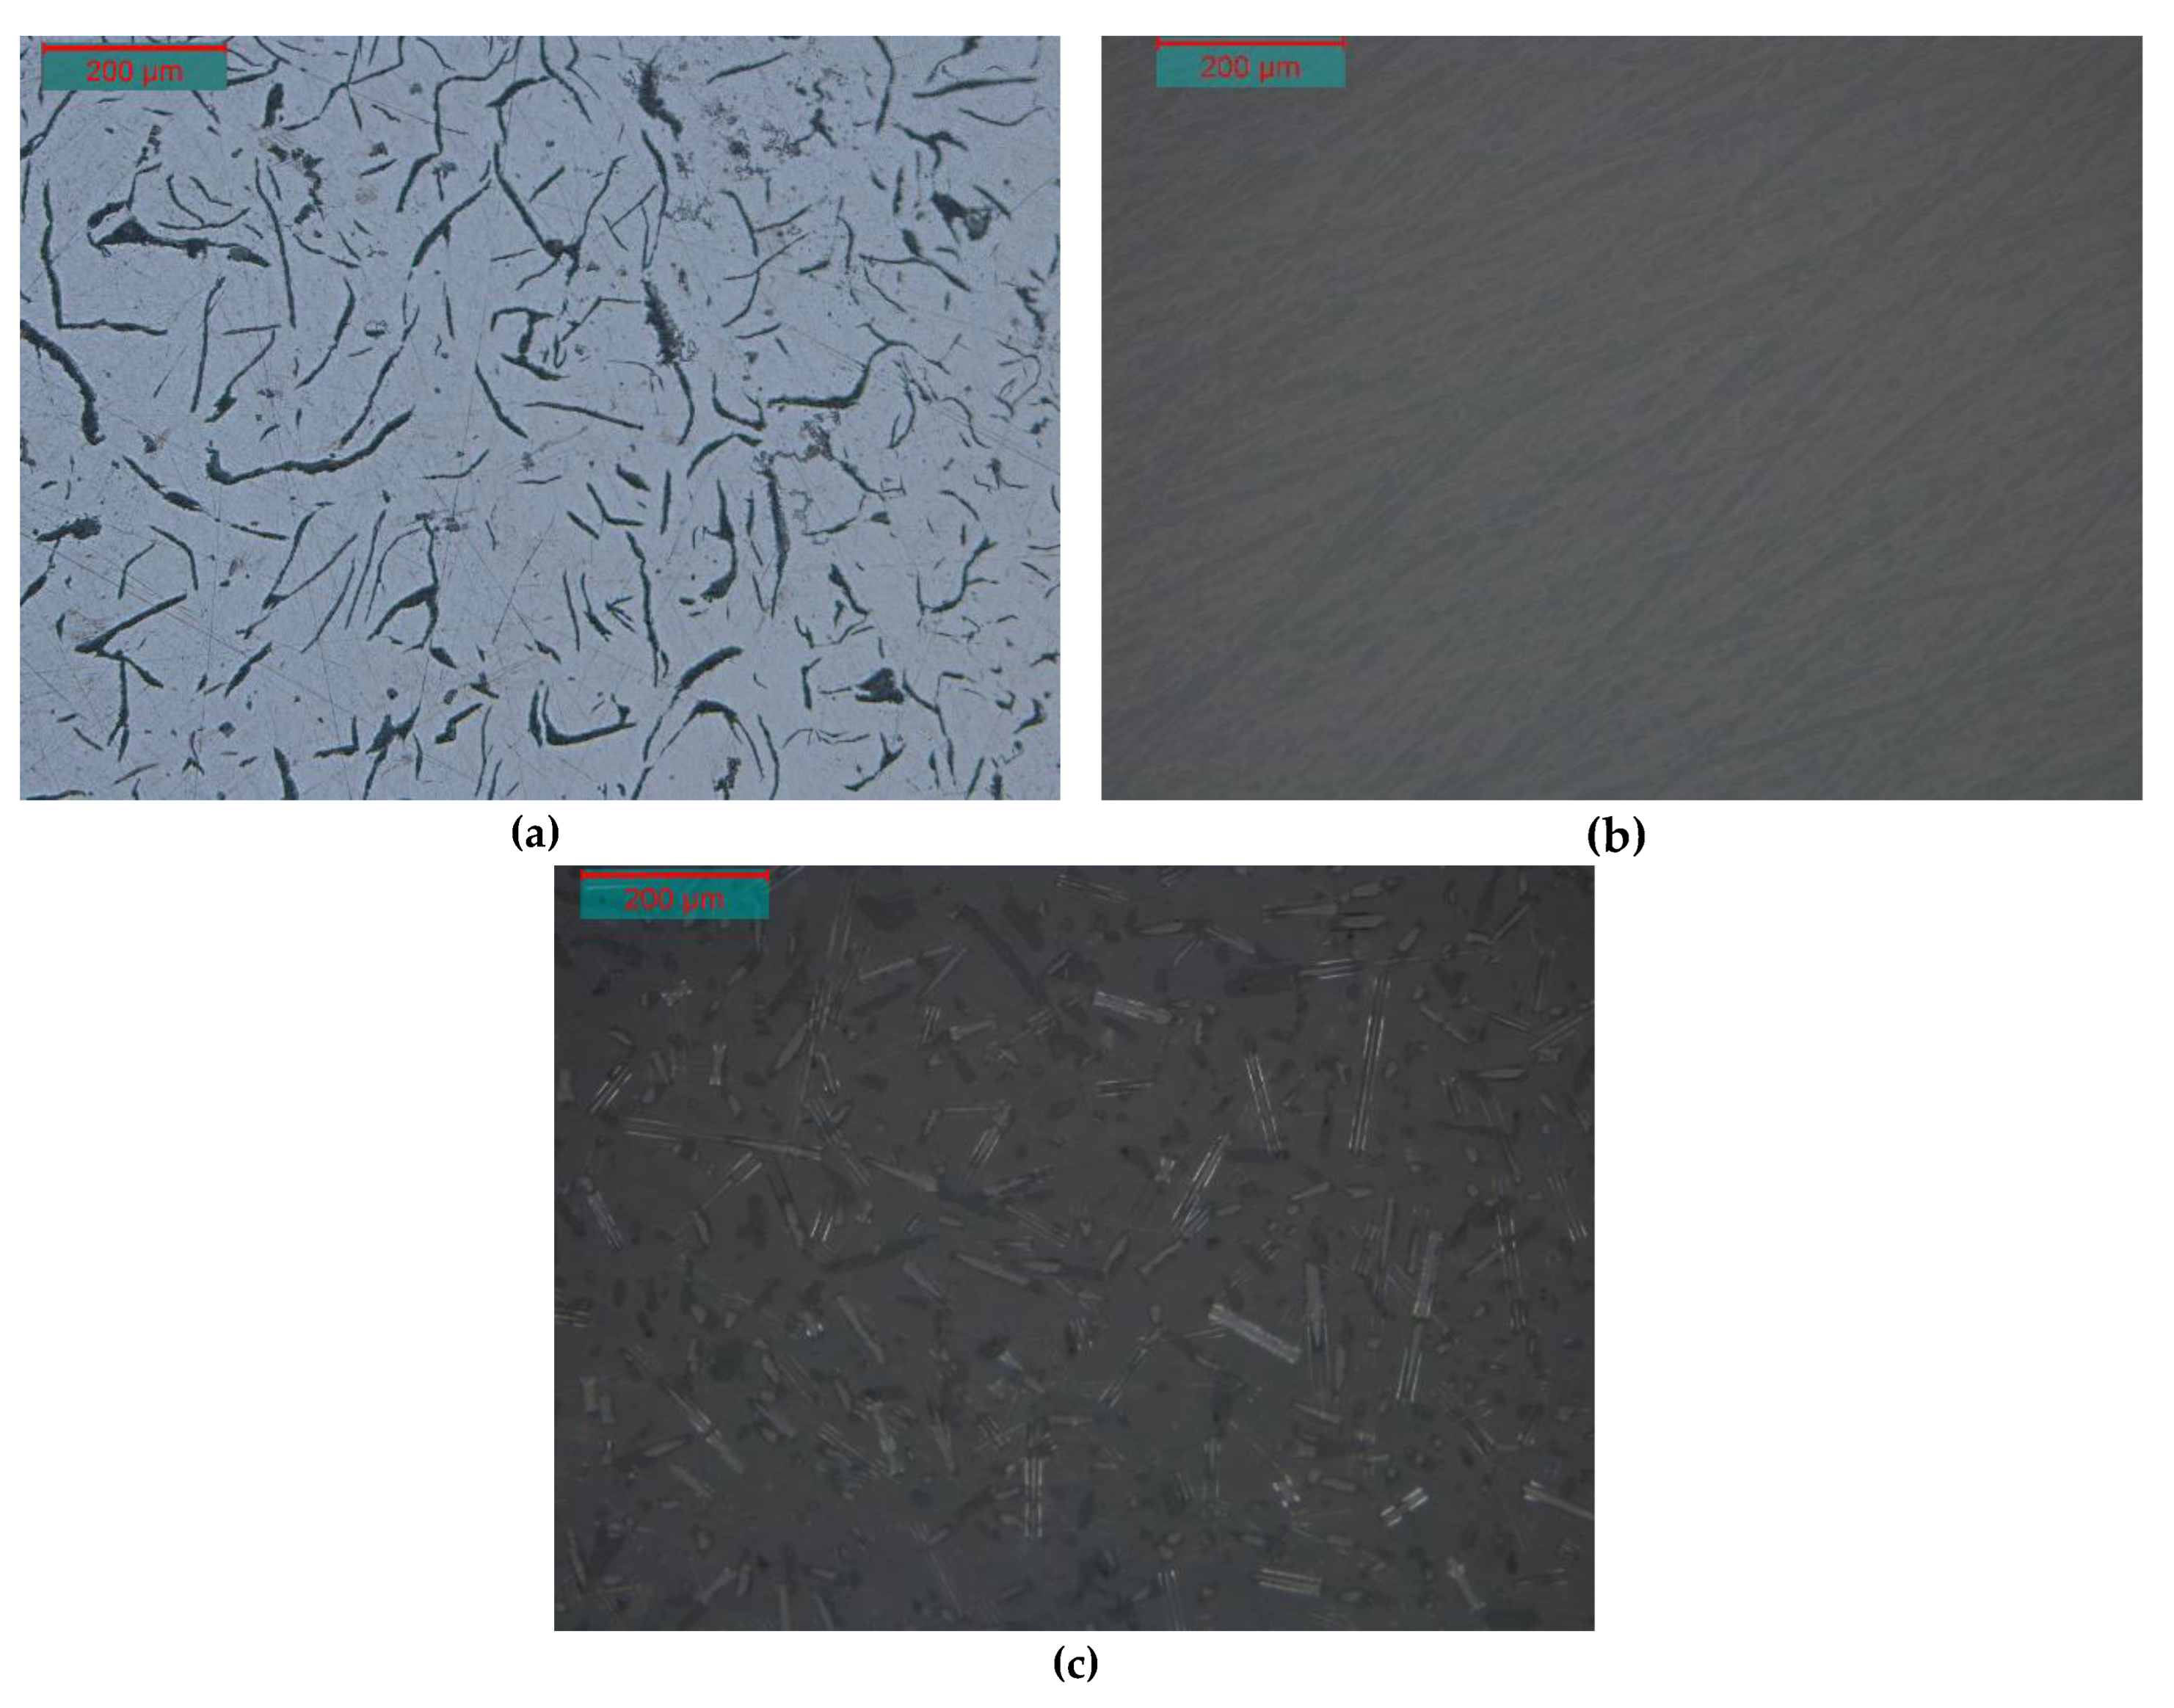
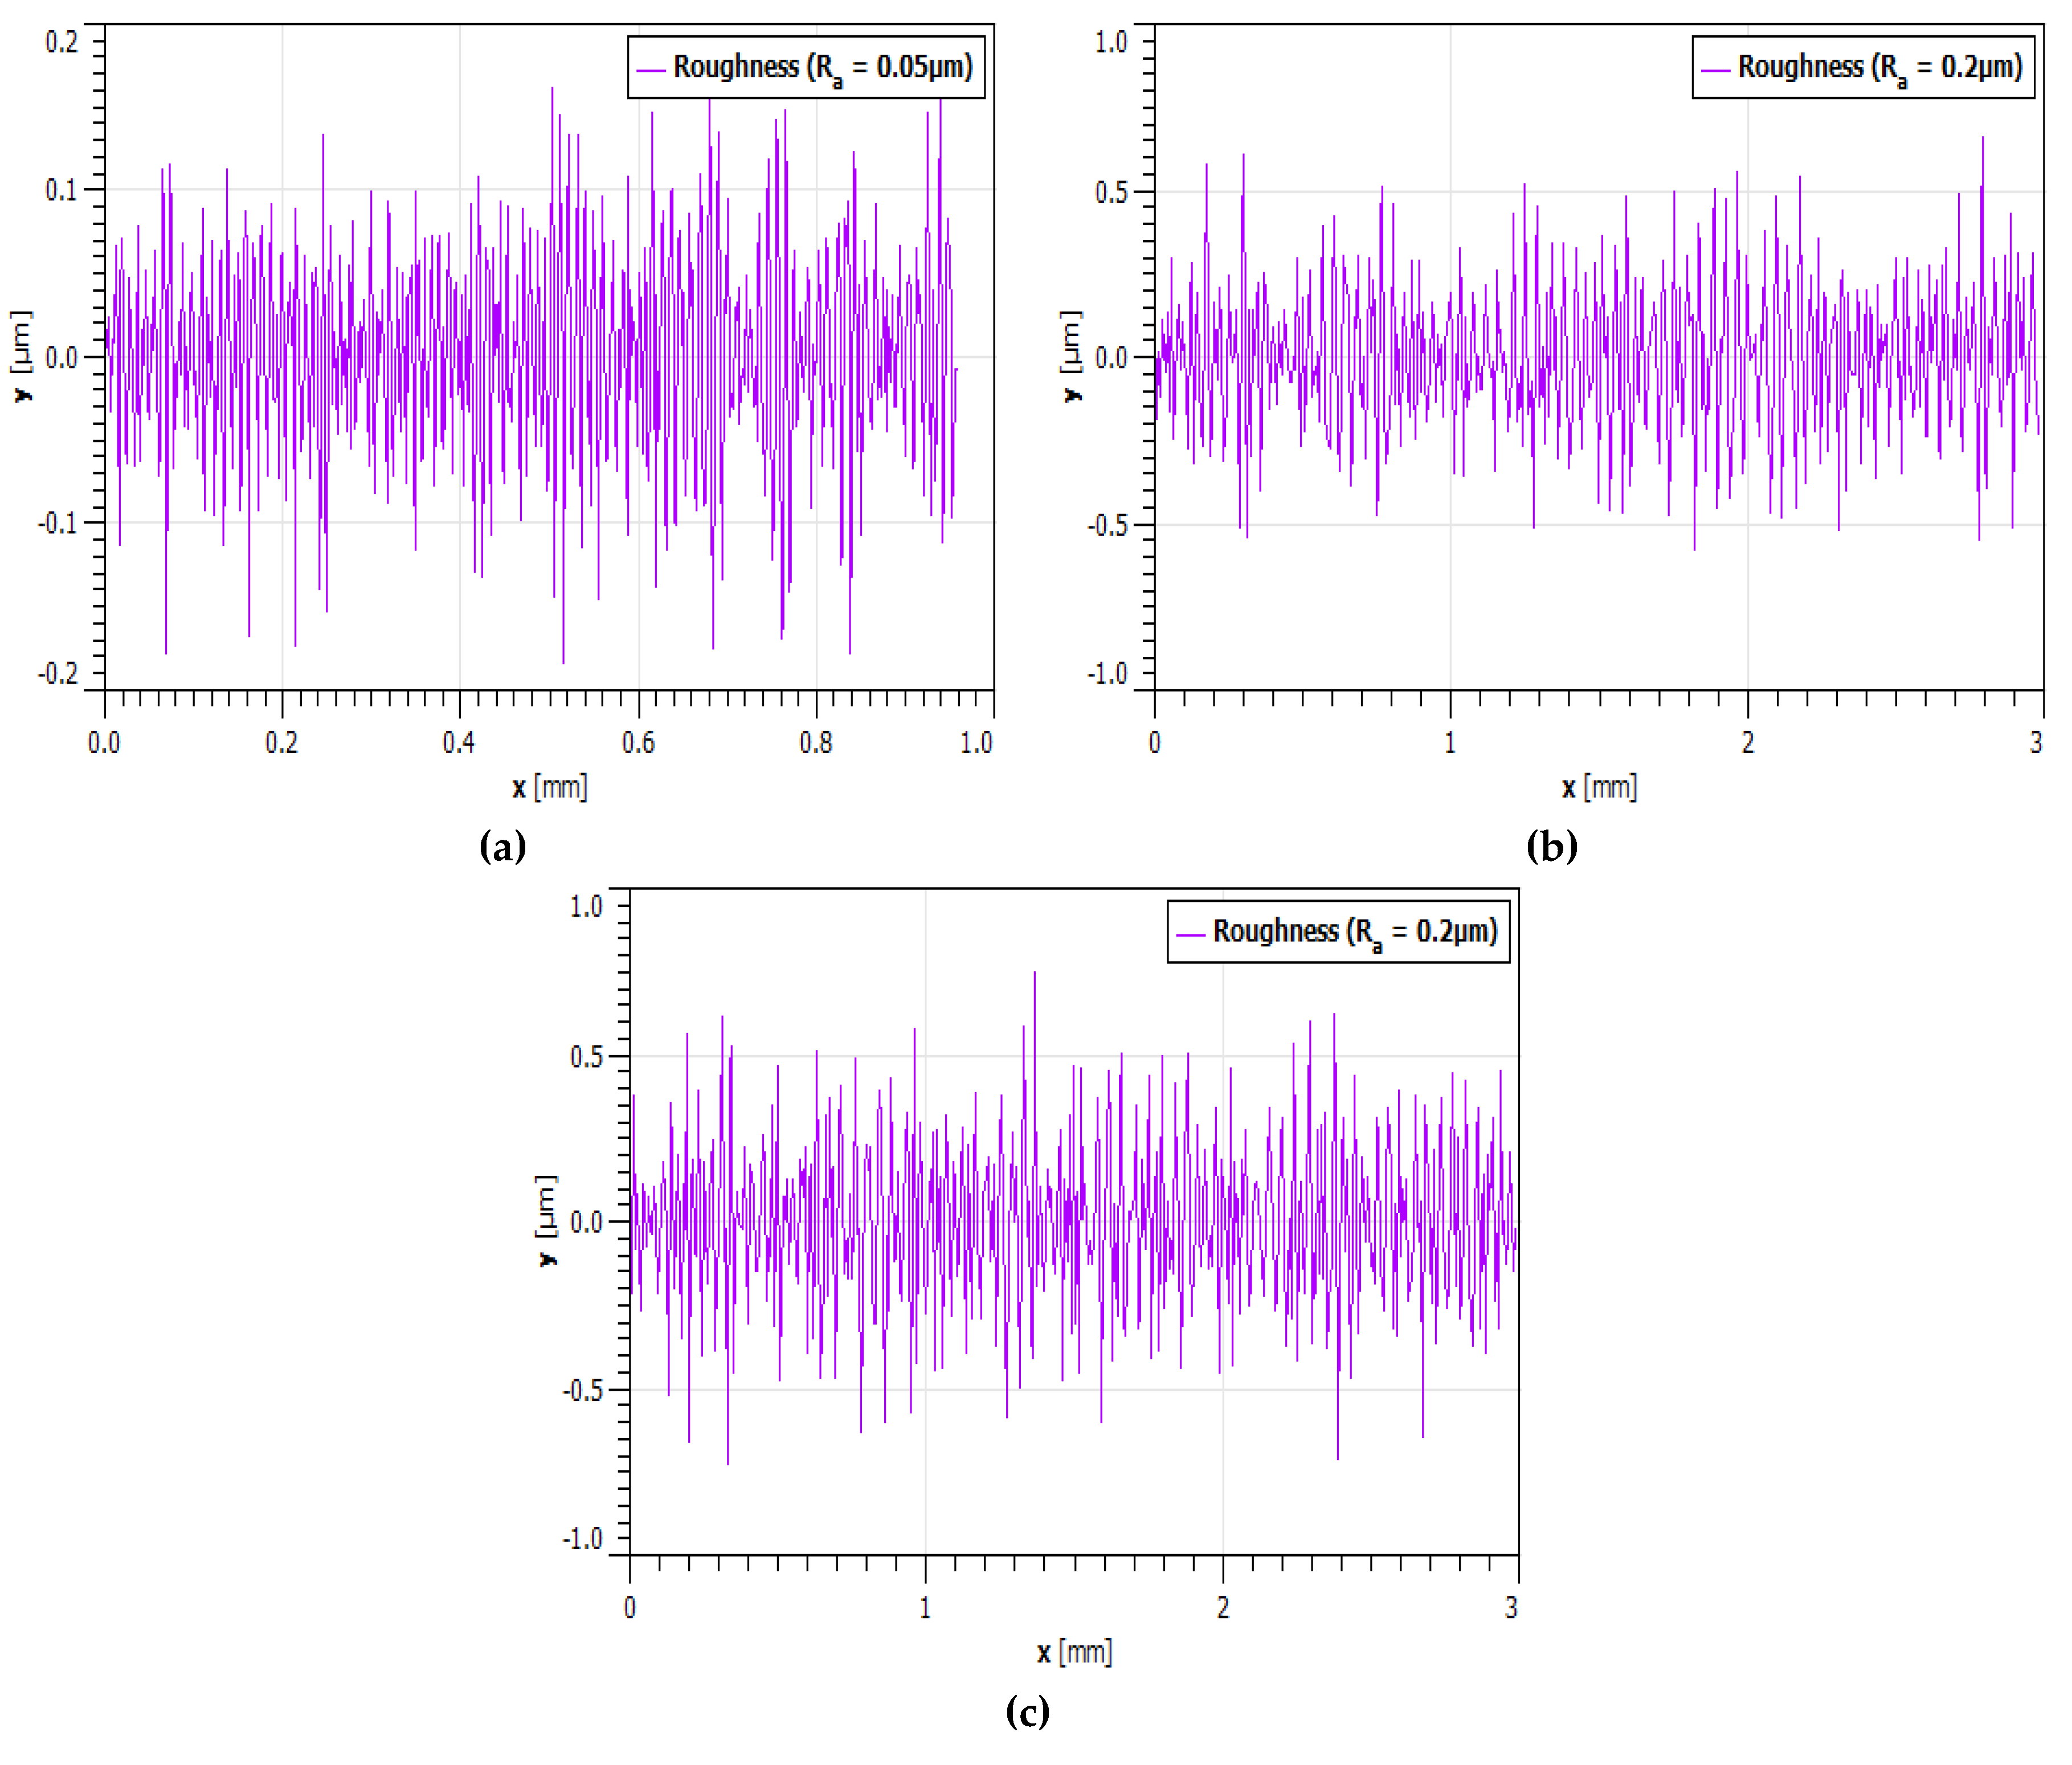
The materials were procured from reliable sources in India. The GCI was procured in the form of a cylindrical rod of 30 mm diameter and disc samples of 10mm height were cut from it. PTFE and its composites were procured in the form of cylindrical rods of 8 mm diameter which were further cut to pins of 10 mm height and were tapered to obtain a diameter of 3.5 mm at the testing end. The disc and pin samples were then polished using SiC papers and polishing cloths to obtain fine surface finish. The optical micrographs and surface roughness of the polished samples are shown in
Figure 1 and
Figure 2, respectively.
2.2. Laser Surface Texturing (LST)
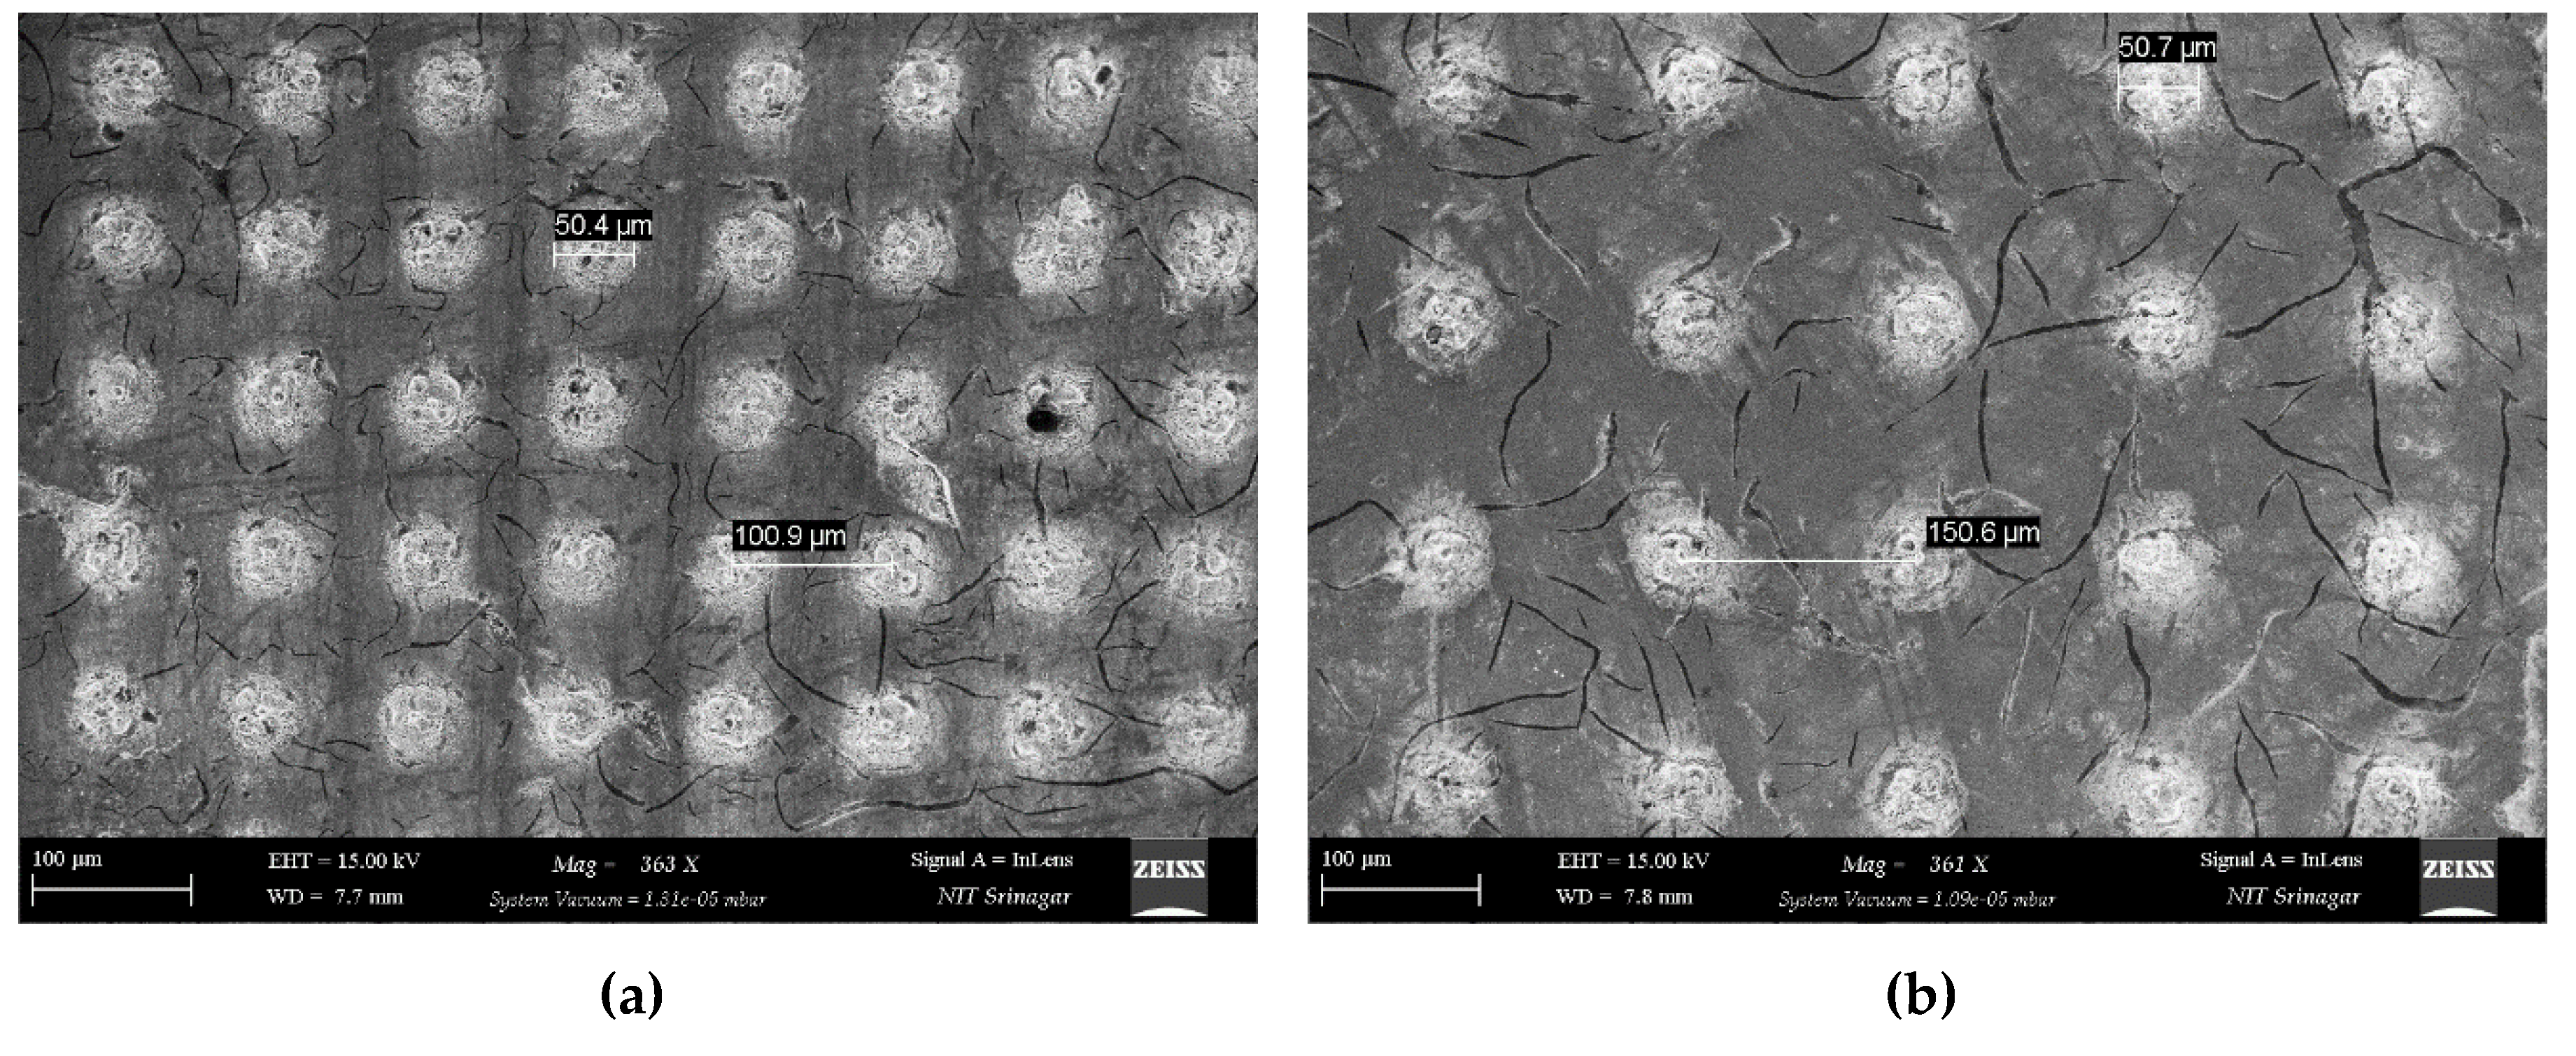
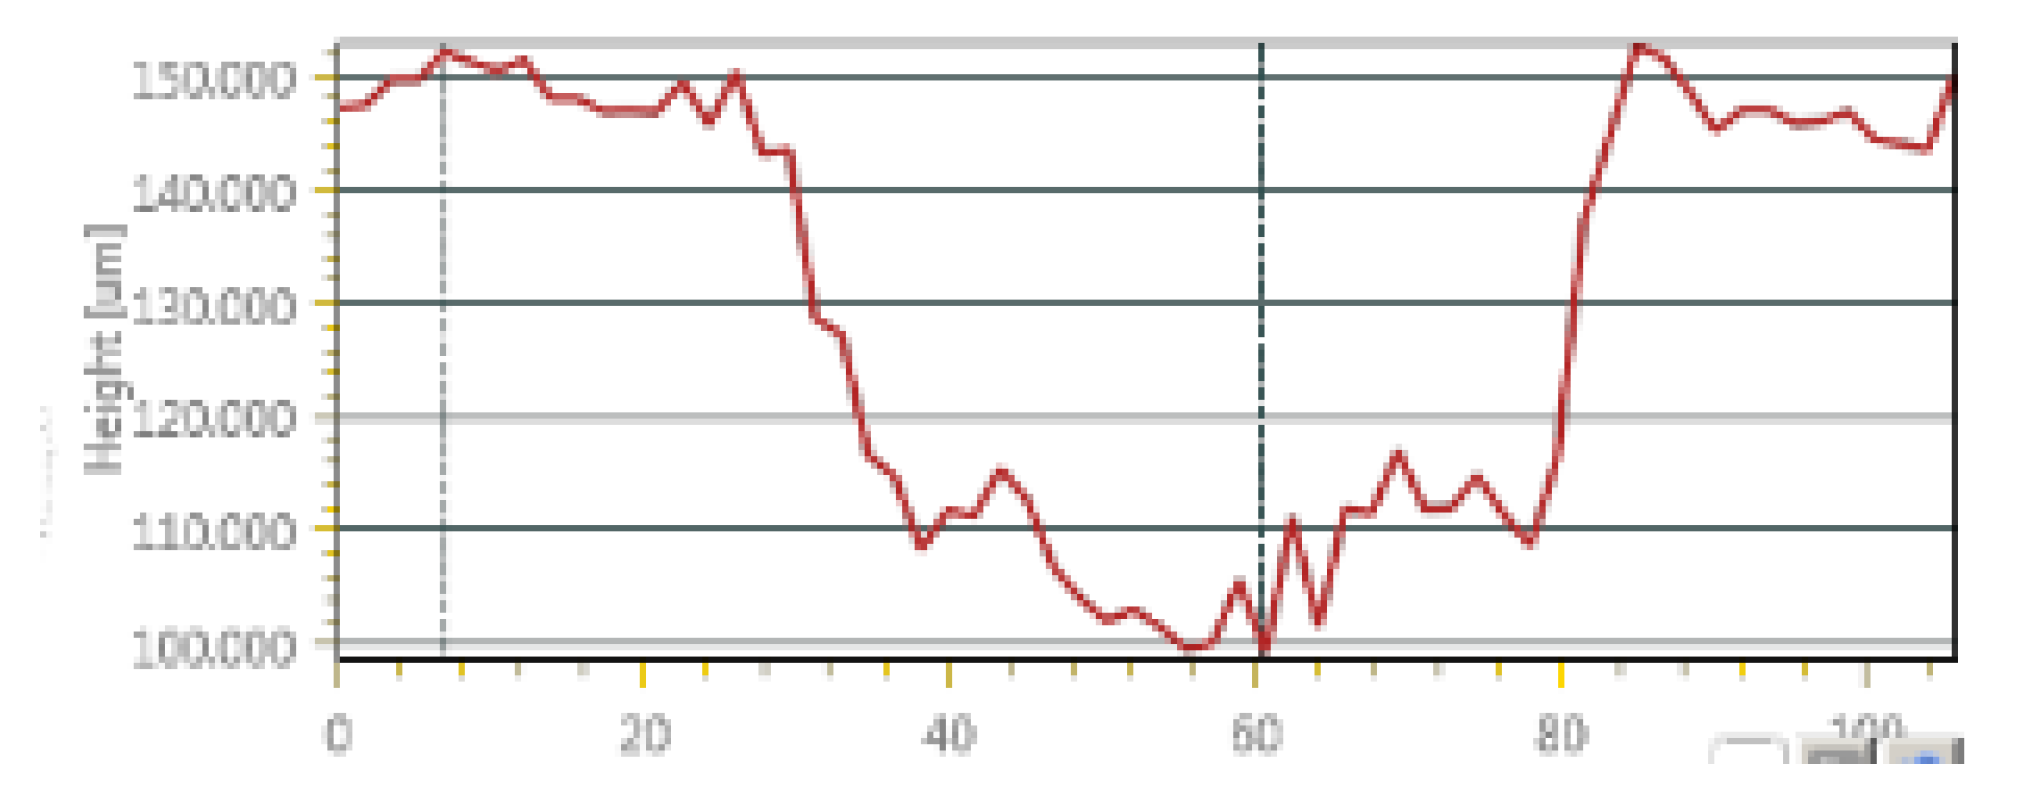
LST was achieved on the polished GCI samples by laser radiation of wavelength 532 nm using green laser. The laser radiation was run with a pulse width of 2.5 ns and a frequency of 10 kHz to yield hemispherical dimples. Dimples of diameter 50µmand depth of 50 µm(average) were produced with varying dimple pitch of 100µmand 150µm. The FESEM of the textured surfaces of GCI with dimple pitch of 100µm and 150µm are shown in
Figure 3a and
Figure 3b respectively. The dimple depth measured using an optical 3D profilometer is shown in
Figure 4. Before tribo-testing, the samples were ultrasonically cleaned using ethanol for 10 minutes.
2.3. Experimental Design and Tribological Testing
The tribological experiments were designed according to Taguchi’s L18 orthogonal array in order to obtain data in a controlled manner and were conducted on a pin on disc reciprocating sliding test rig under ambient conditions at room temperature (23±1ºCThe tests were conducted at a constant normal load of 10N while, the stroke, frequency and test duration were maintained at 5mm, 10 Hz and 30 min respectively corresponding to a sliding distance of 180m. The sliding distance was varied in steps of 180m upto 540m. The control factors with their corresponding levels are shown in
Table 1. The tribometer is shown in
Figure 4a and the schematics of the tribo-pair is presented in
Figure 4b. The friction coefficients were obtained using the DAQ system through a computer attached to the tribometer. The wear volume loss of PTFE pin samples was calculated using weight loss method using a digital weight balance with an accuracy of 0.1mg.Further, the wear rate was calculated using equation 1. The experimental results were analysed using S/N ratio analysis and ANOVA (analysis of variance) techniques. Furthermore, the wear surfaces were analysed using optical microscopy and FESEM.
3. Results and Discussion
3.1. Analysis of Friction
The results of friction and wear tests are presented in
Table 2 and
Figure 5,
Figure 6,
Figure 7 and
Figure 8.
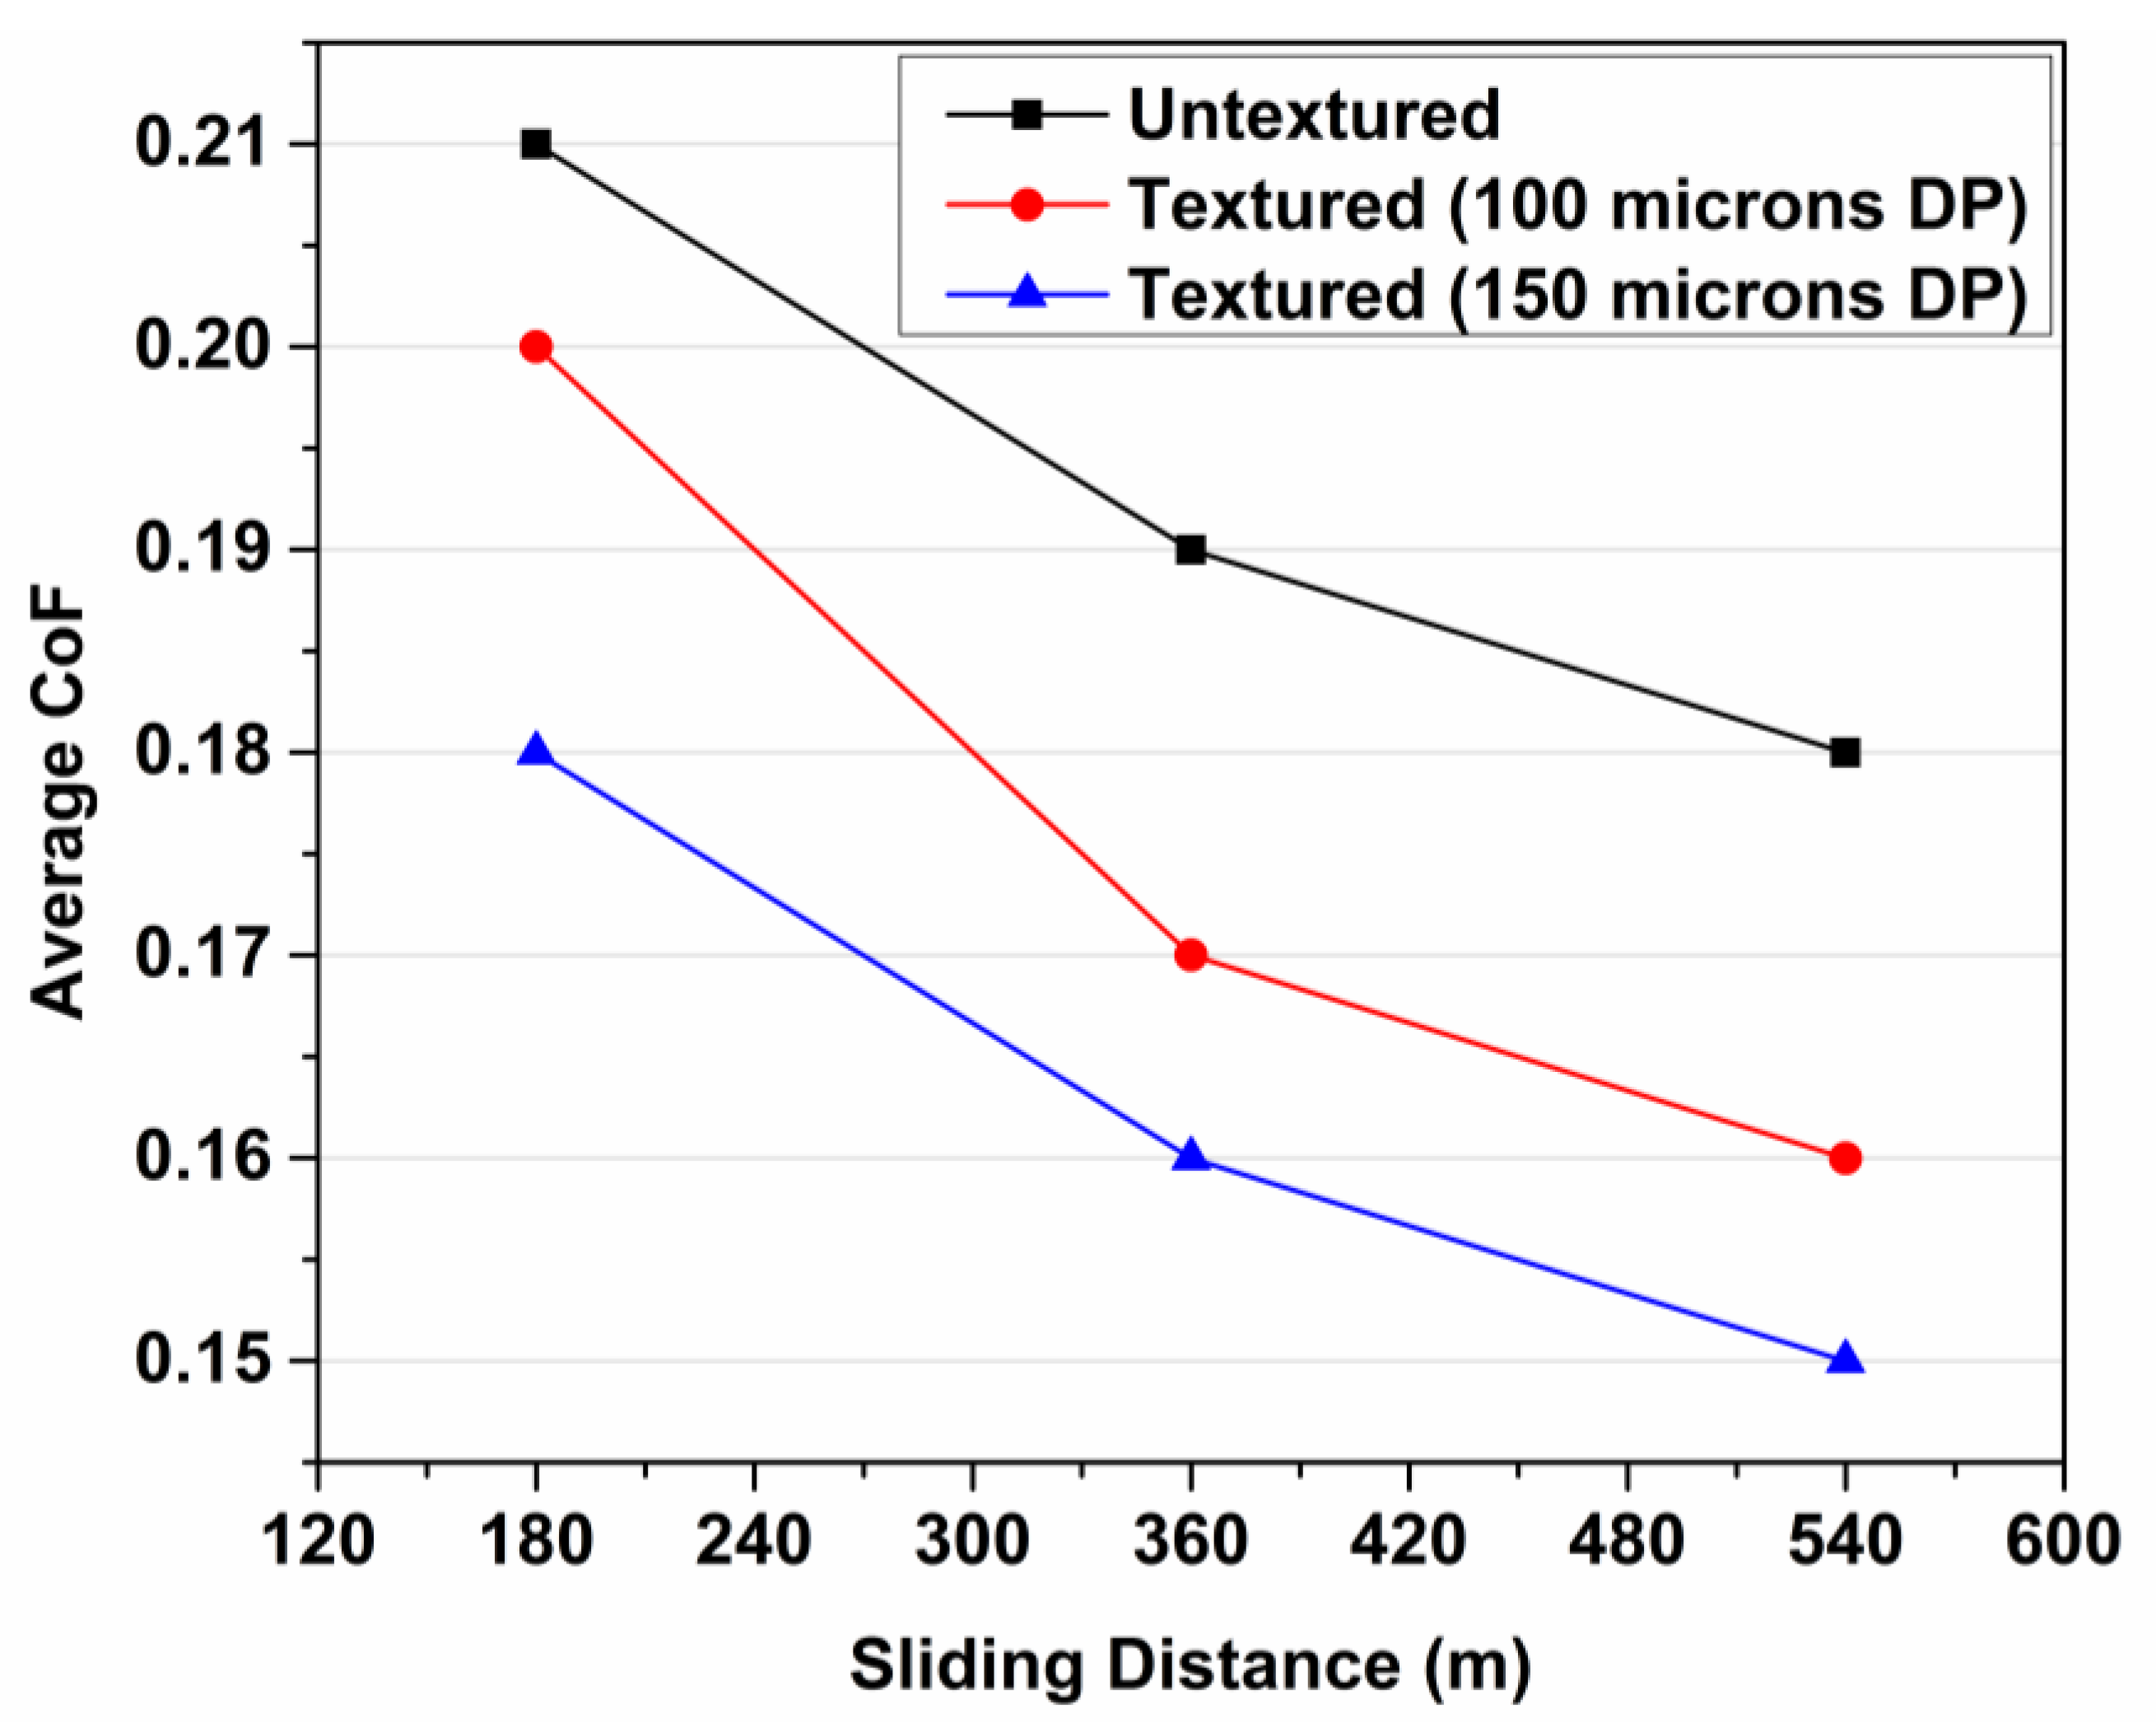
Figure 5 and
Figure 6 show the variation of average friction coefficient with sliding distance for virgin PTFE and 25 wt. % Glass fibre filled PTFE respectively, while sliding against un-textured and textured grey cast iron surfaces. From
Table 2 and
Figure 5 it is evident that the average friction coefficient decreases with increase in sliding distance for virgin PTFE irrespective of the surface morphology of the counter surface (GCI) whether, textured on un-textured. Moreover, it is observed that for virgin PTFE the average friction coefficient is lowest against textured GCI with 150µm dimple pitch irrespective of the sliding distance followed by sliding against textured GCI with 100µm dimple pitch and sliding against un-textured GCI. The friction coefficient of virgin PTFE decreased from 0.18 to 0.15 on sliding against textured GCI with 150µm dimple pitch compared to sliding against un-textured GCI at 540m sliding distance. However, the results are quite different for 25 wt. % Glass fibre filled PTFE sliding against un-textured and textured grey cast iron surfaces. From
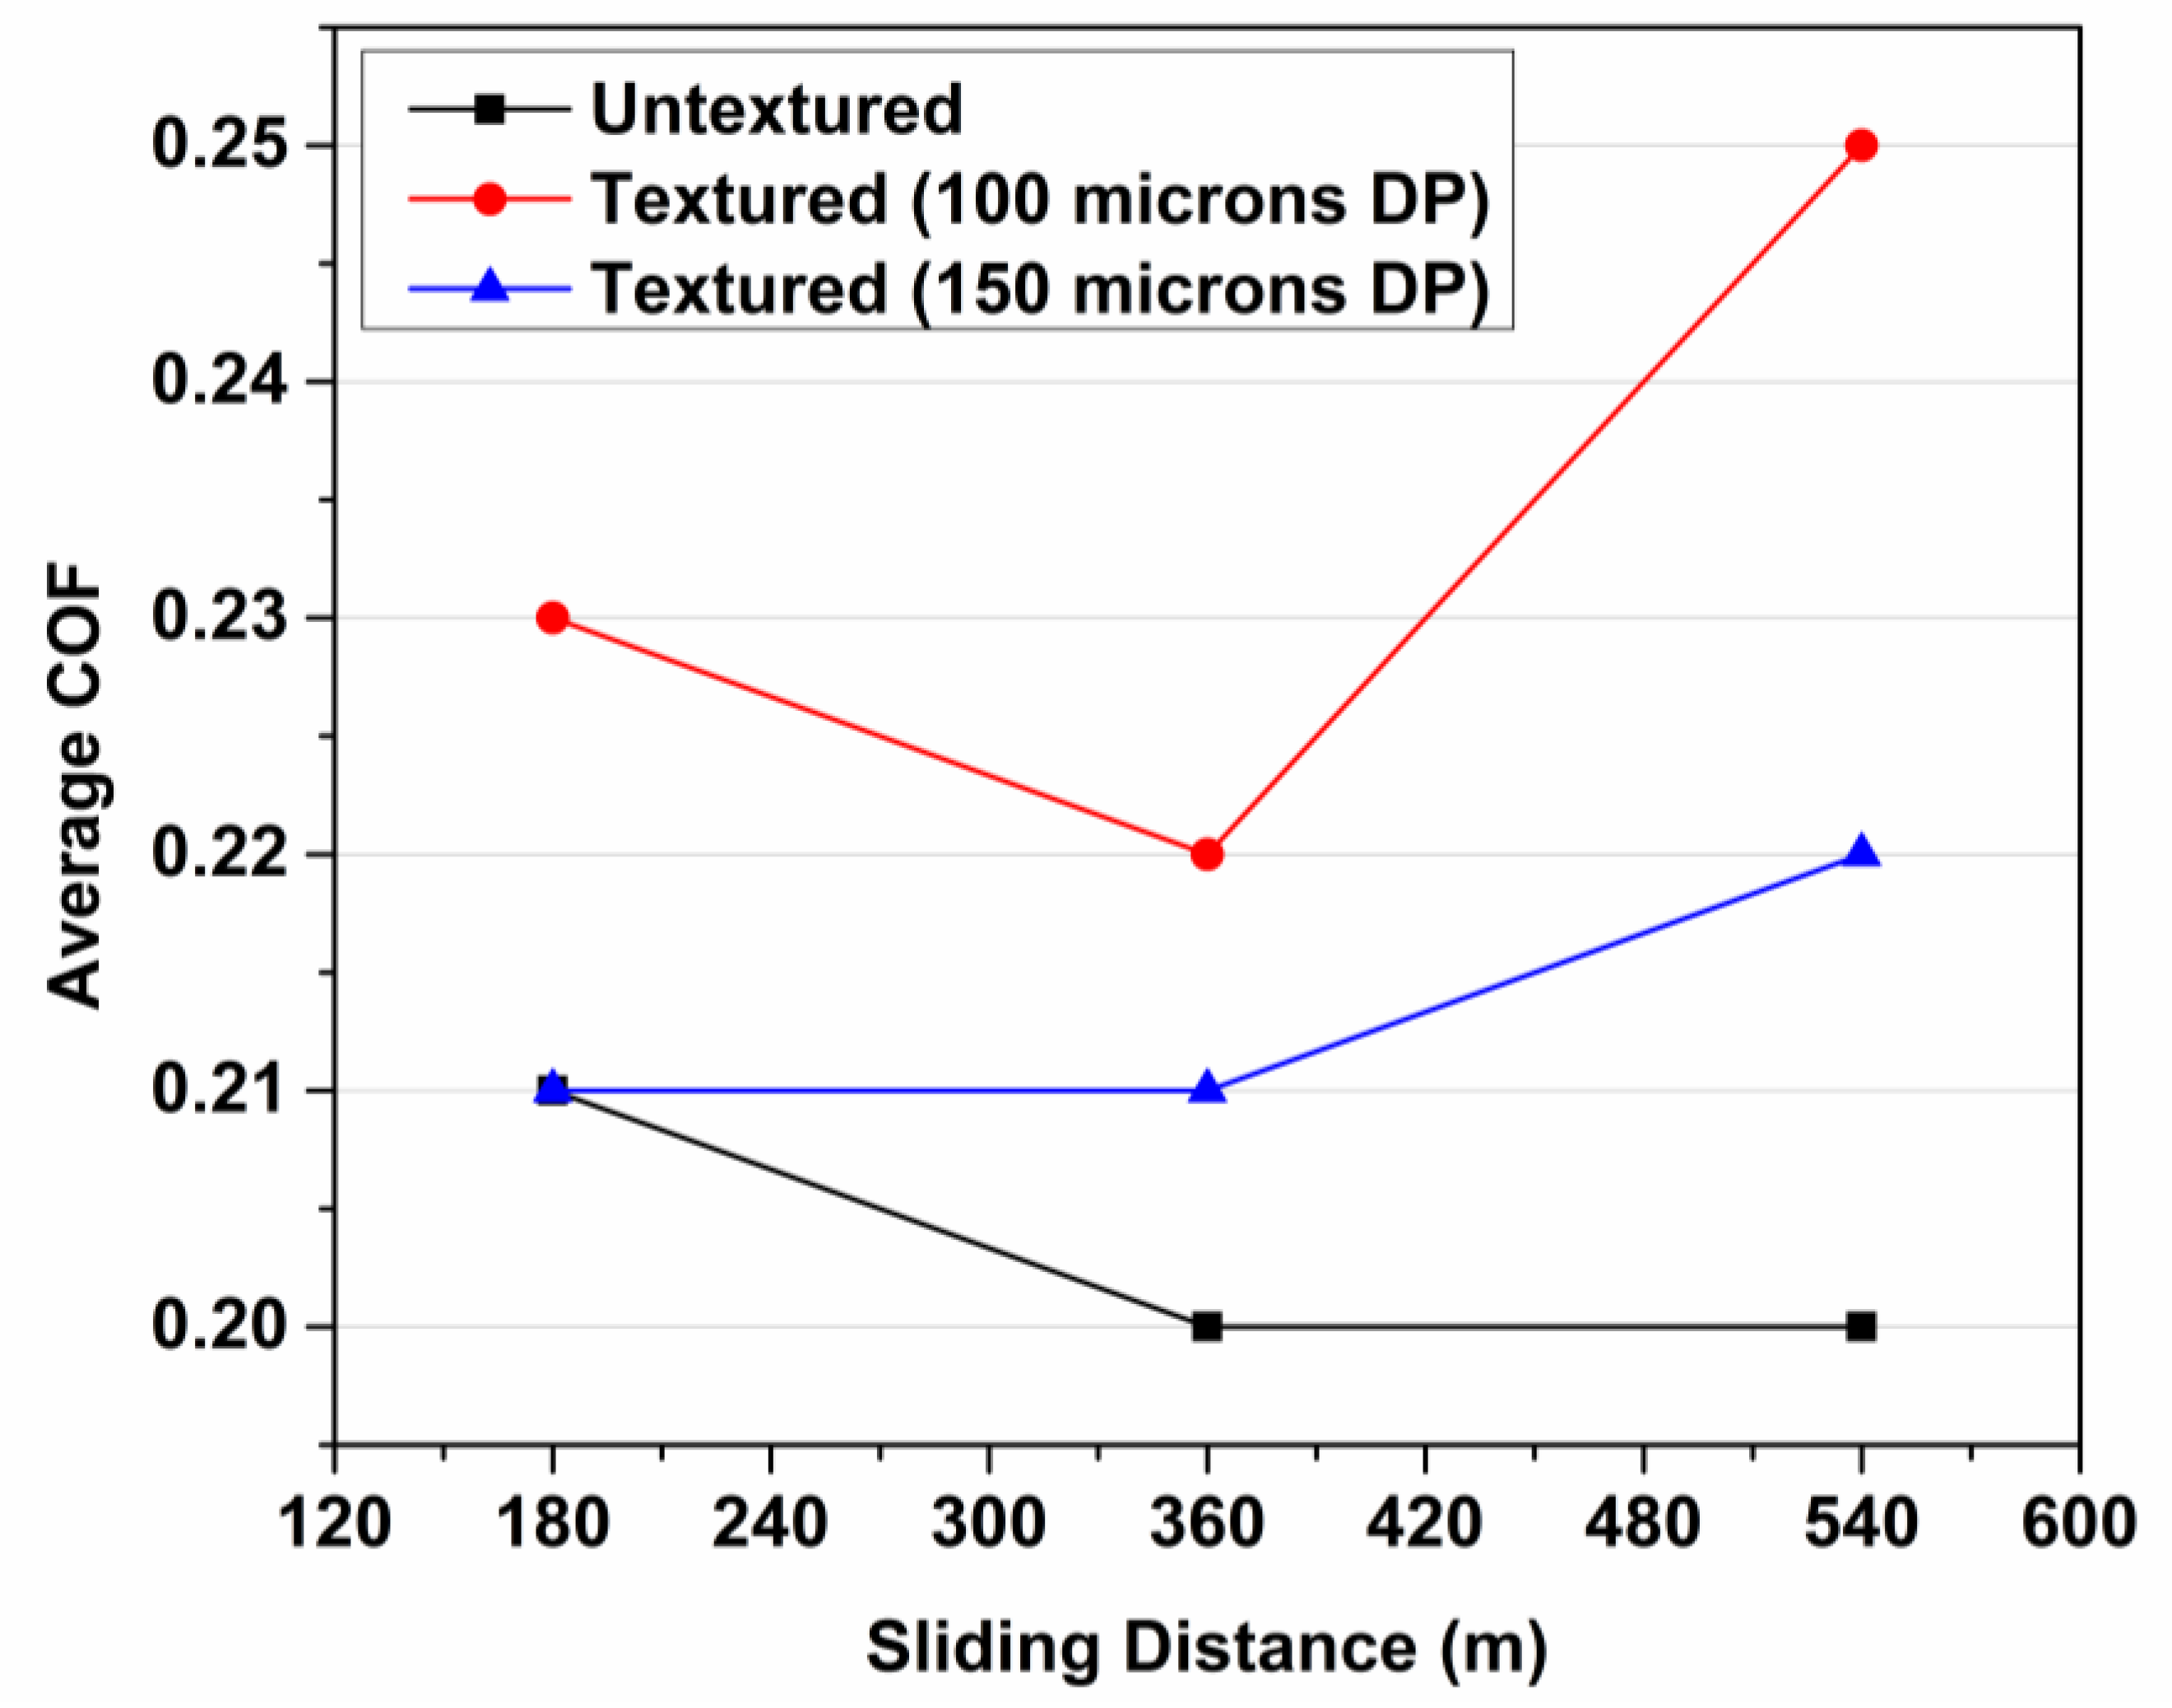
Table 2 and
Figure 6 it is observed that for25 wt. % Glass fibre filled PTFE the average friction coefficient is lowest against un-textured GCI followed by sliding against textured GCI with 150µm dimple pitch and sliding against textured GCI with 100µm dimple pitch.From
Table 2 and
Figure 6 it is observed that while sliding against un-textured GCI, the friction coefficient of 25 wt. % Glass fibre filled PTFE decreases from 0.21 to 0.2 with increase in sliding distance from 180m to 360m and then remains constant at 0.2 while increasing sliding distance to 540m. Moreover, while sliding against textured GCI (100µm dimple pitch) the friction coefficient of 25 wt. % Glass fibre filled PTFE decreased from 0.23 to 0.22 with increase in sliding distance from 180m to 360m and then increased to 0.25 while increasing sliding distance to 540m. Further, while sliding against textured GCI (150µm dimple pitch) the friction coefficient of 25 wt. % Glass fibre filled PTFE remained constant at 0.21 with increase in sliding distance from 180m to 360m and then increased to 0.22 while increasing sliding distance to 540m.
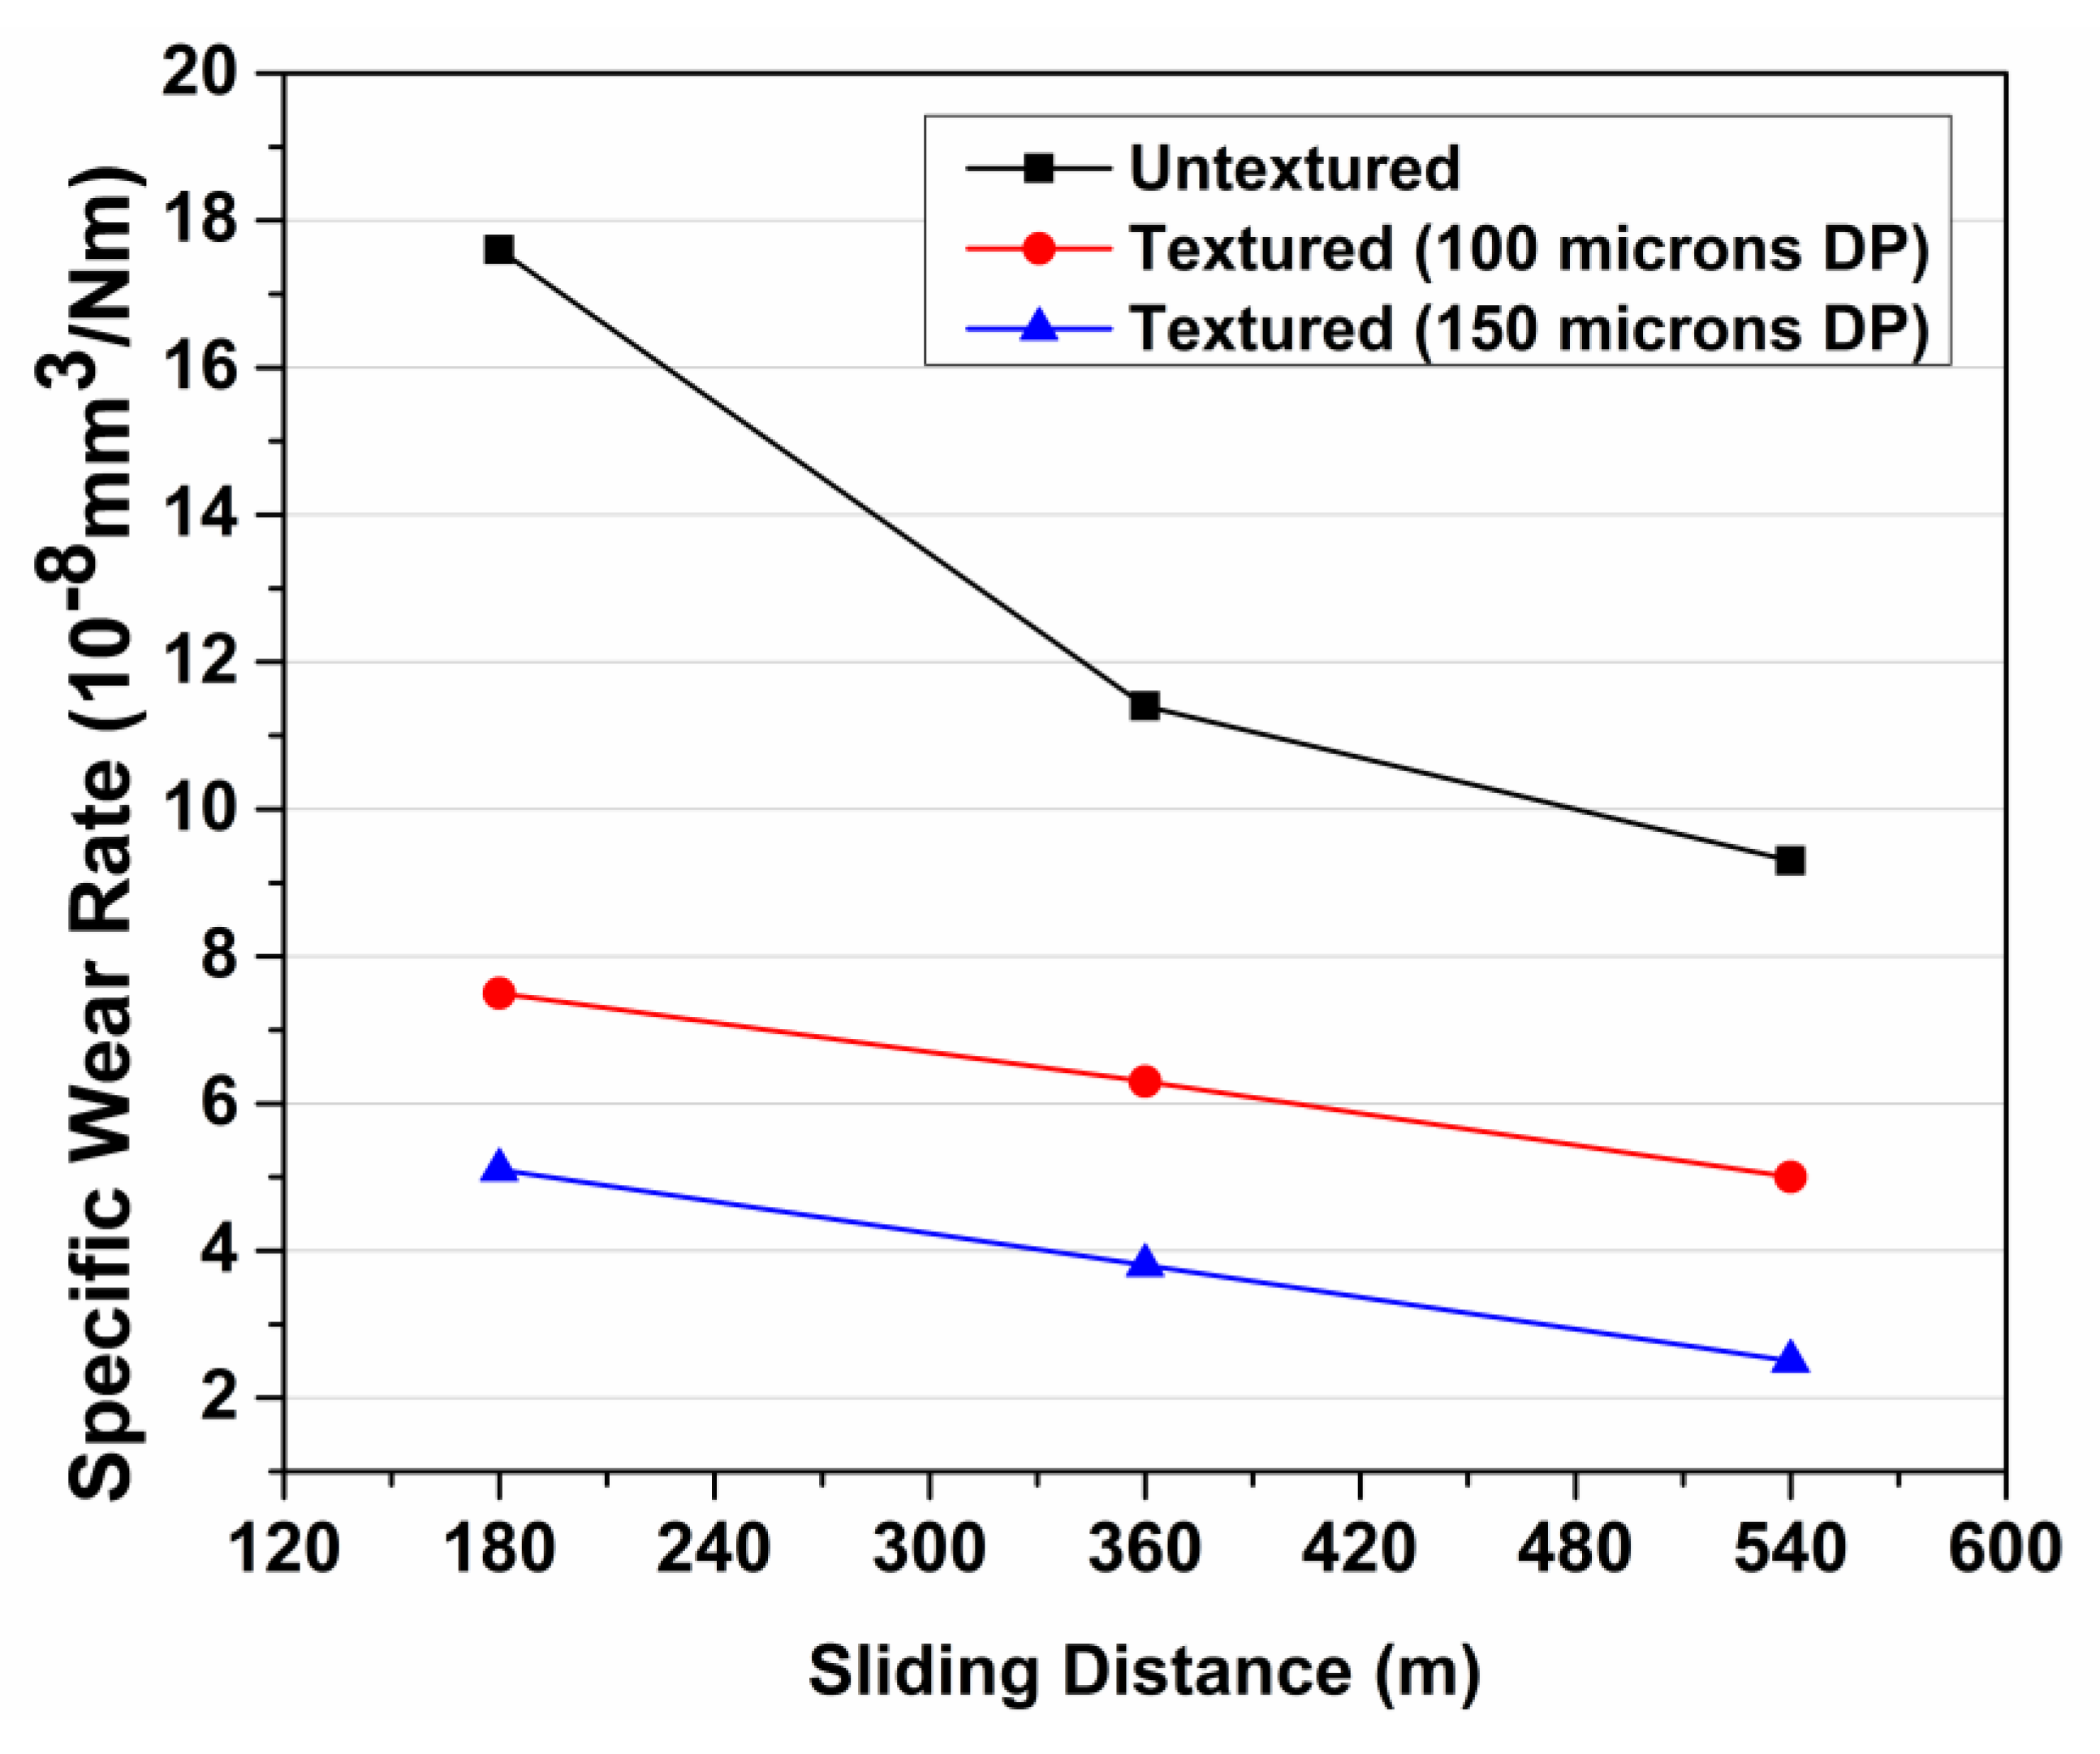
3.2. Analysis of Wear
The wear rates of the order of 10
-7-10
-8mm
3/Nm were obtained for virgin PTFE and 25 wt. % Glass fibre filled PTFE, whether sliding against textured on un-textured GCI counter surfaces, indicating that the wear rates remained in the mild wear regime.
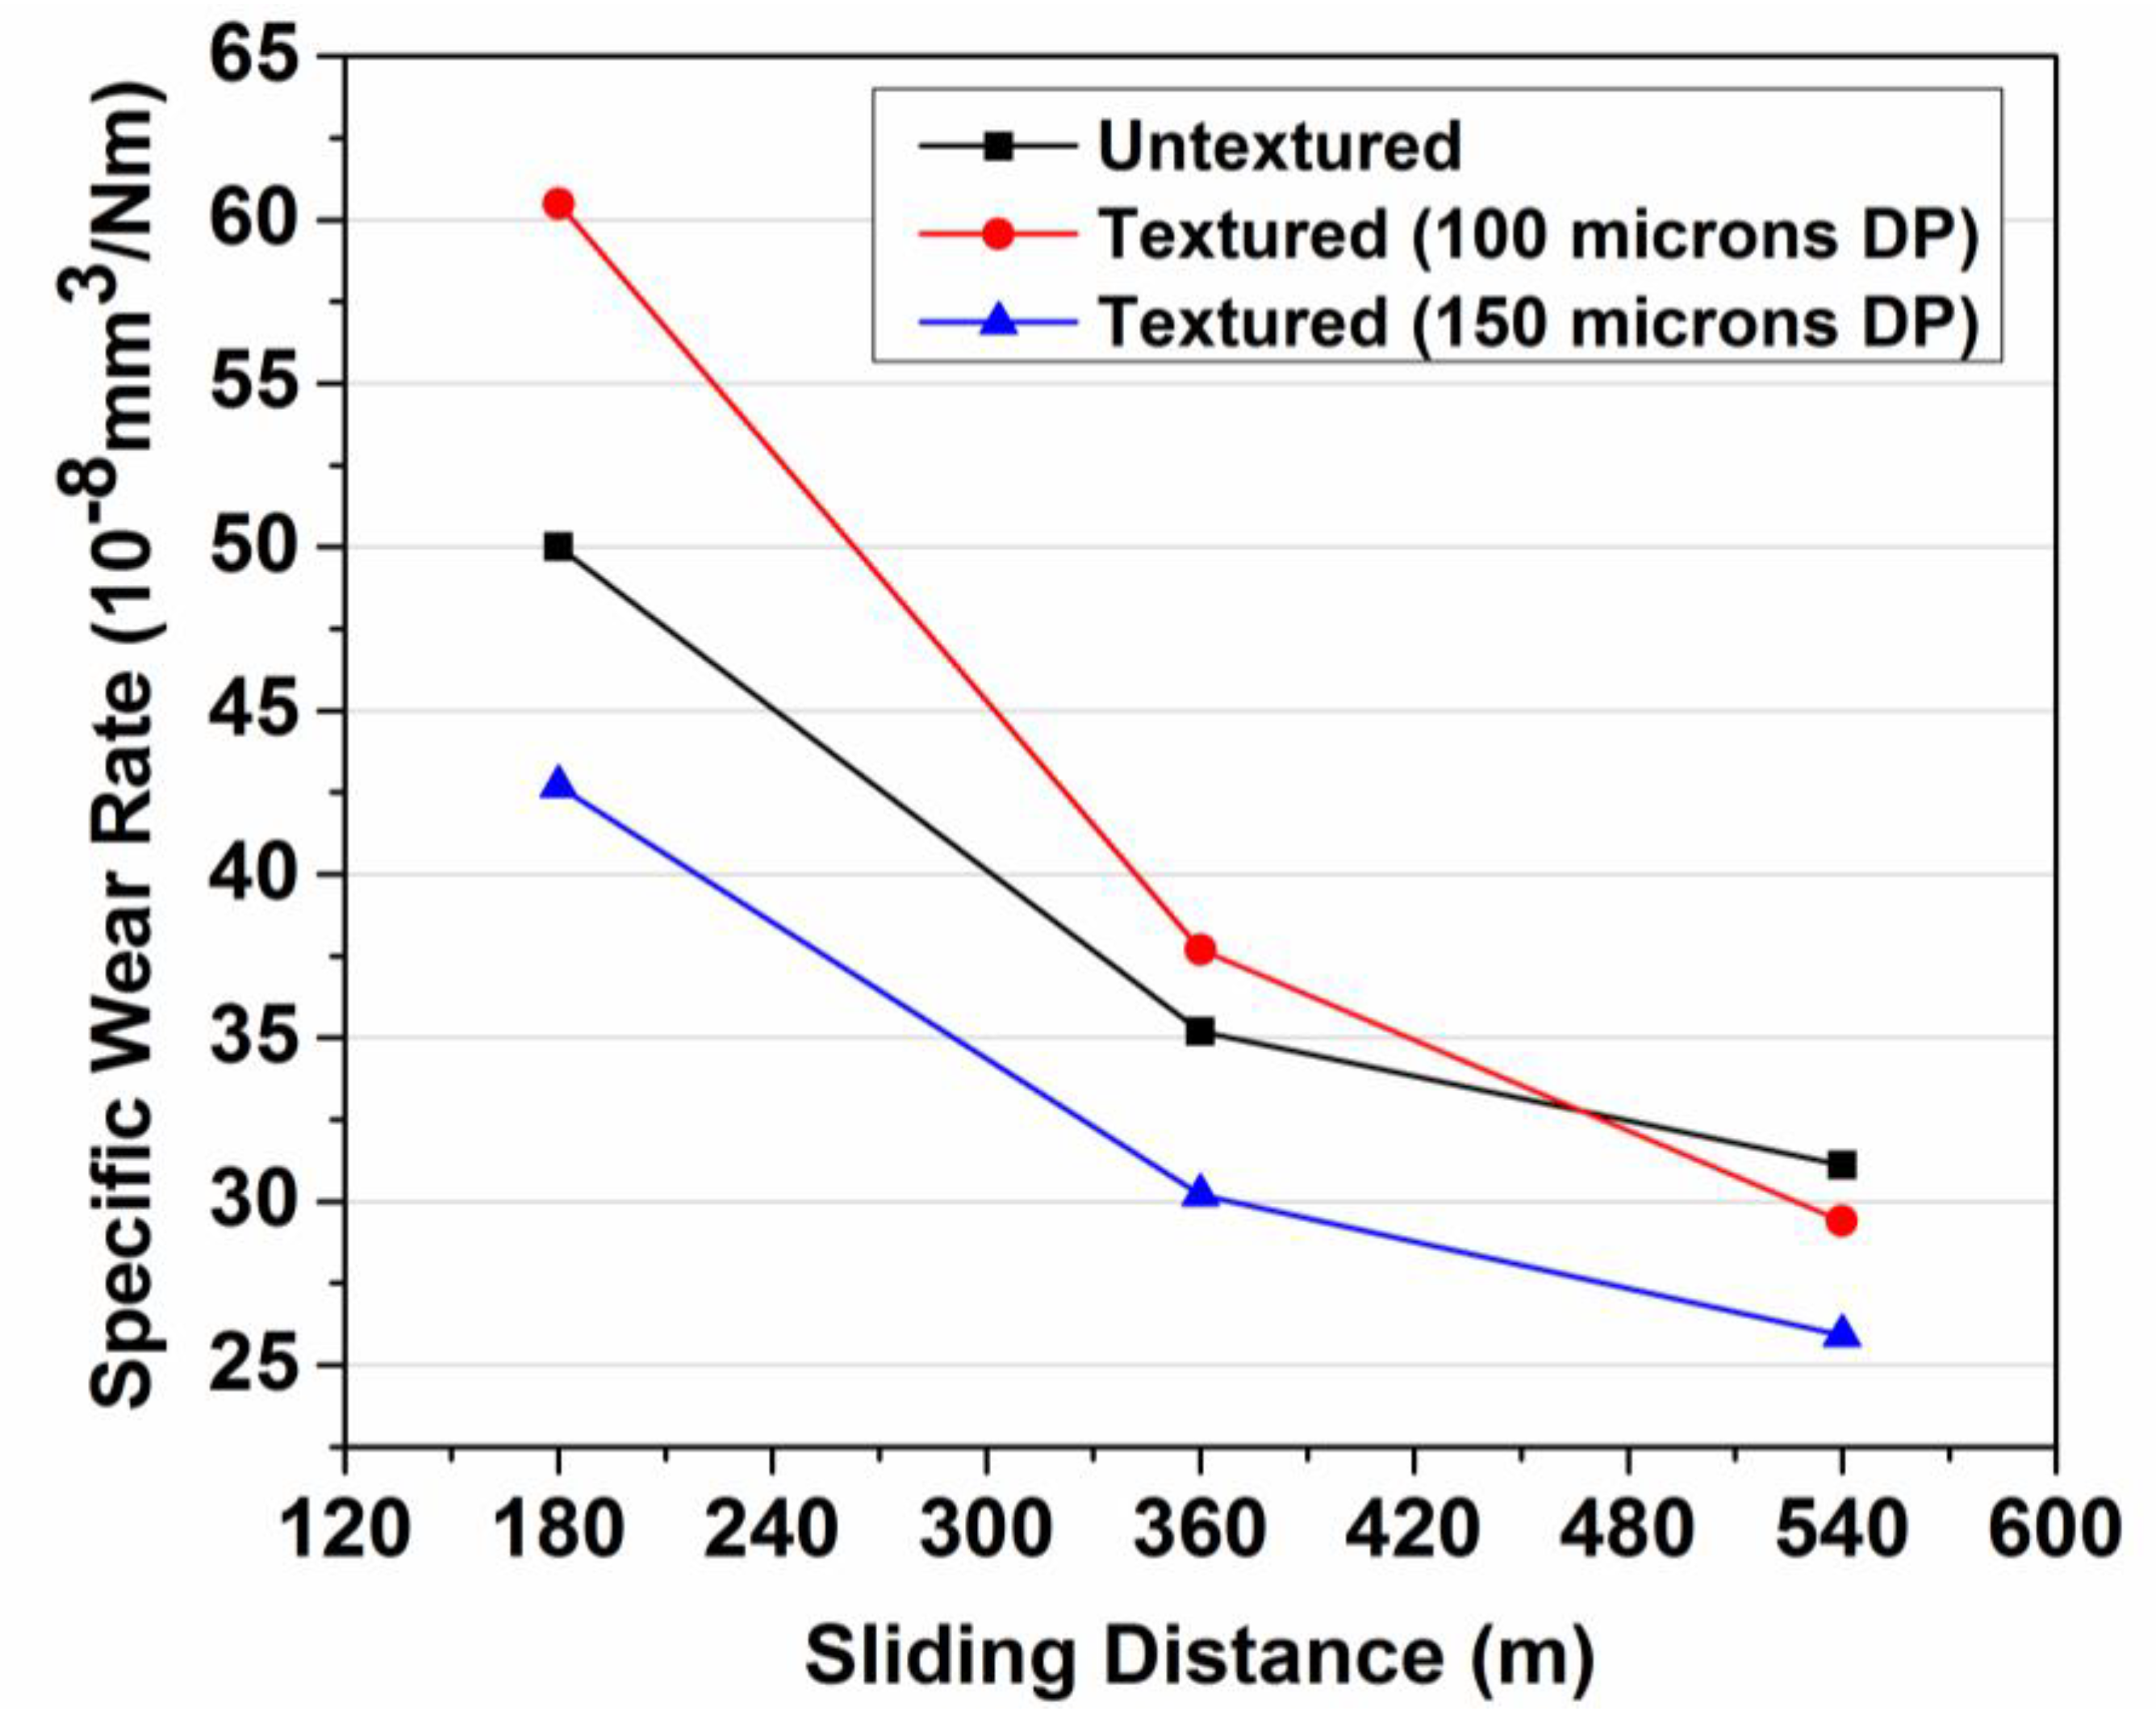
Figure 7 and
Figure 8 show the variation of specific wear rate with sliding distance for virgin PTFE and 25 wt. % Glass fibre filled PTFE respectively, while sliding against un-textured and textured grey cast iron surfaces. From
Table 2 and
Figure 7 it is apparent that the specific wear rate decreases with increase in sliding distance for virgin as well as 25 wt. % Glass fibre filled PTFE while sliding against different GCI counter surfaces. A similar trend was found to follow for average COF in case of virgin PTFE. It is also observed from
Figure 7that the specific wear rate for virgin PTFE is lowest against textured GCI counter surface with 150µm dimple pitch irrespective of the sliding distance. Moreover, PTFE showed lower wear rates on initial sliding upto 360m against un-textured GCI compared to sliding against textured GCI counter surface with 100µm dimple pitch. However, with increase in sliding distance to 540m textured GCI counter surface with 100µm dimple pitch showed lower wear rate for PTFE than sliding against un-textured GCI. Also, for 25 wt. % Glass fibre filled PTFE, the lowest wear rate was again observed against textured GCI counter surface with 150µm dimple pitch which was followed by sliding against textured GCI counter surface with 100µm dimple pitch and sliding against un-textured GCI (
Figure 8).
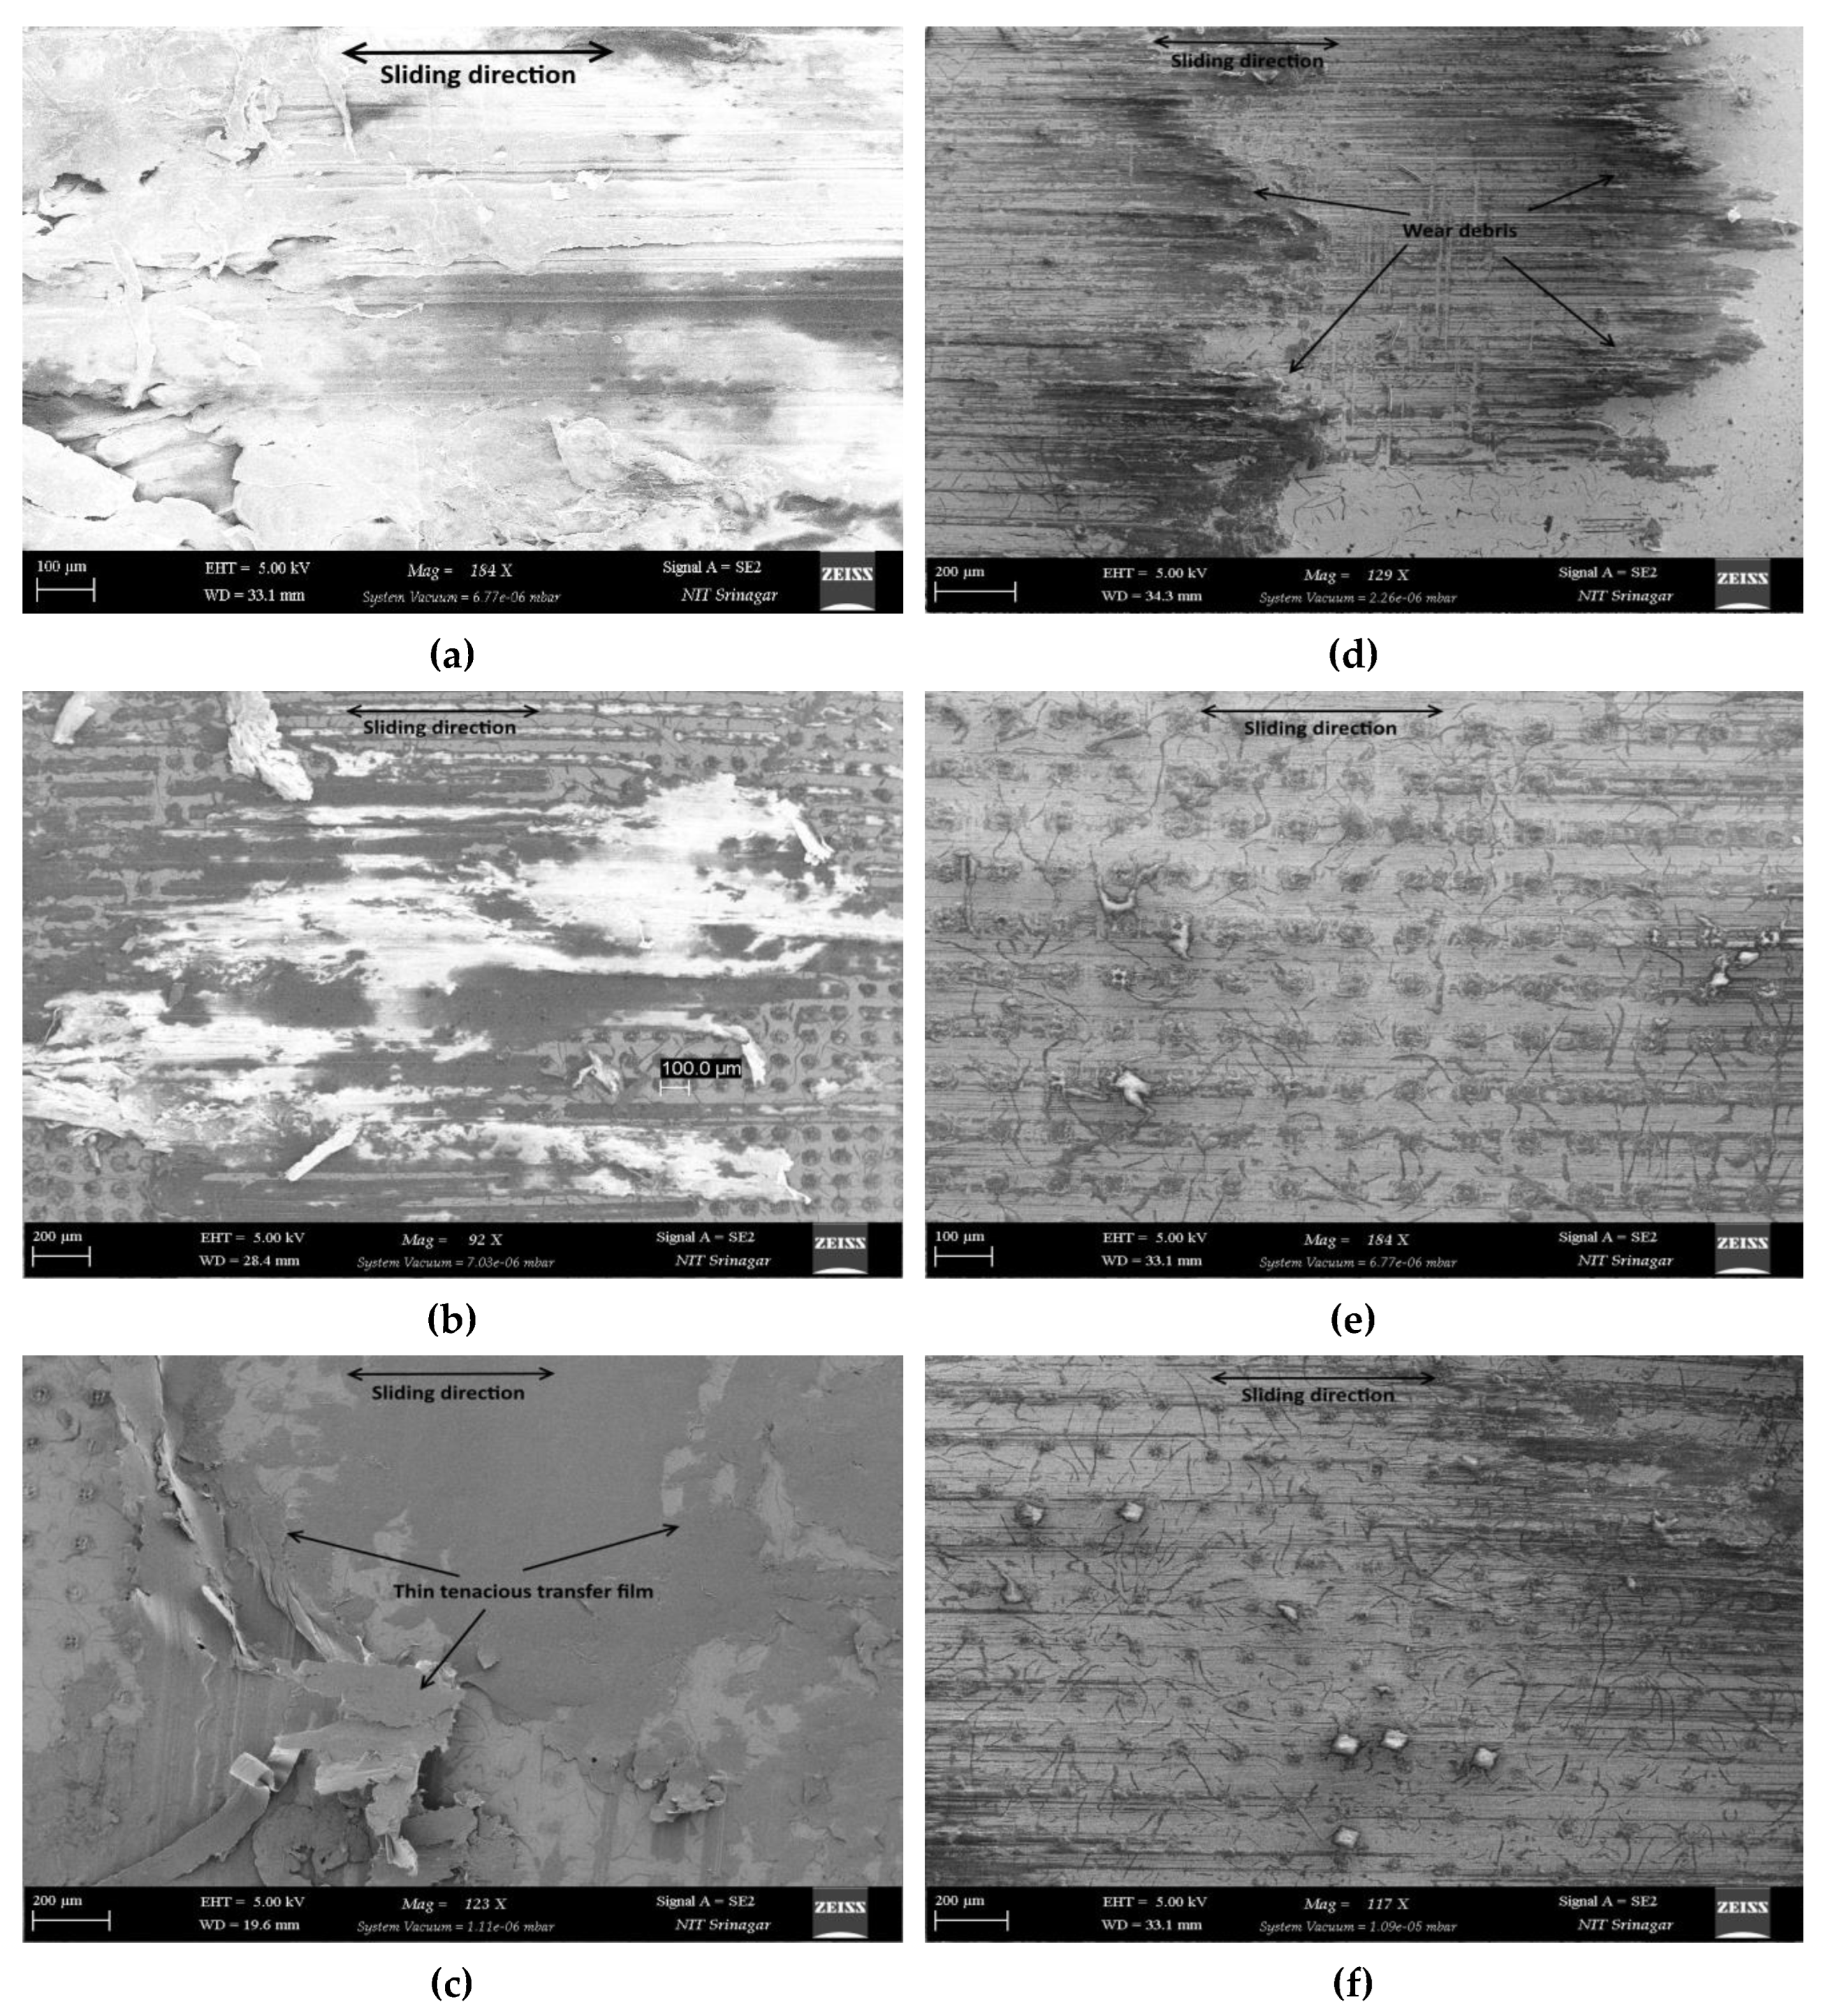
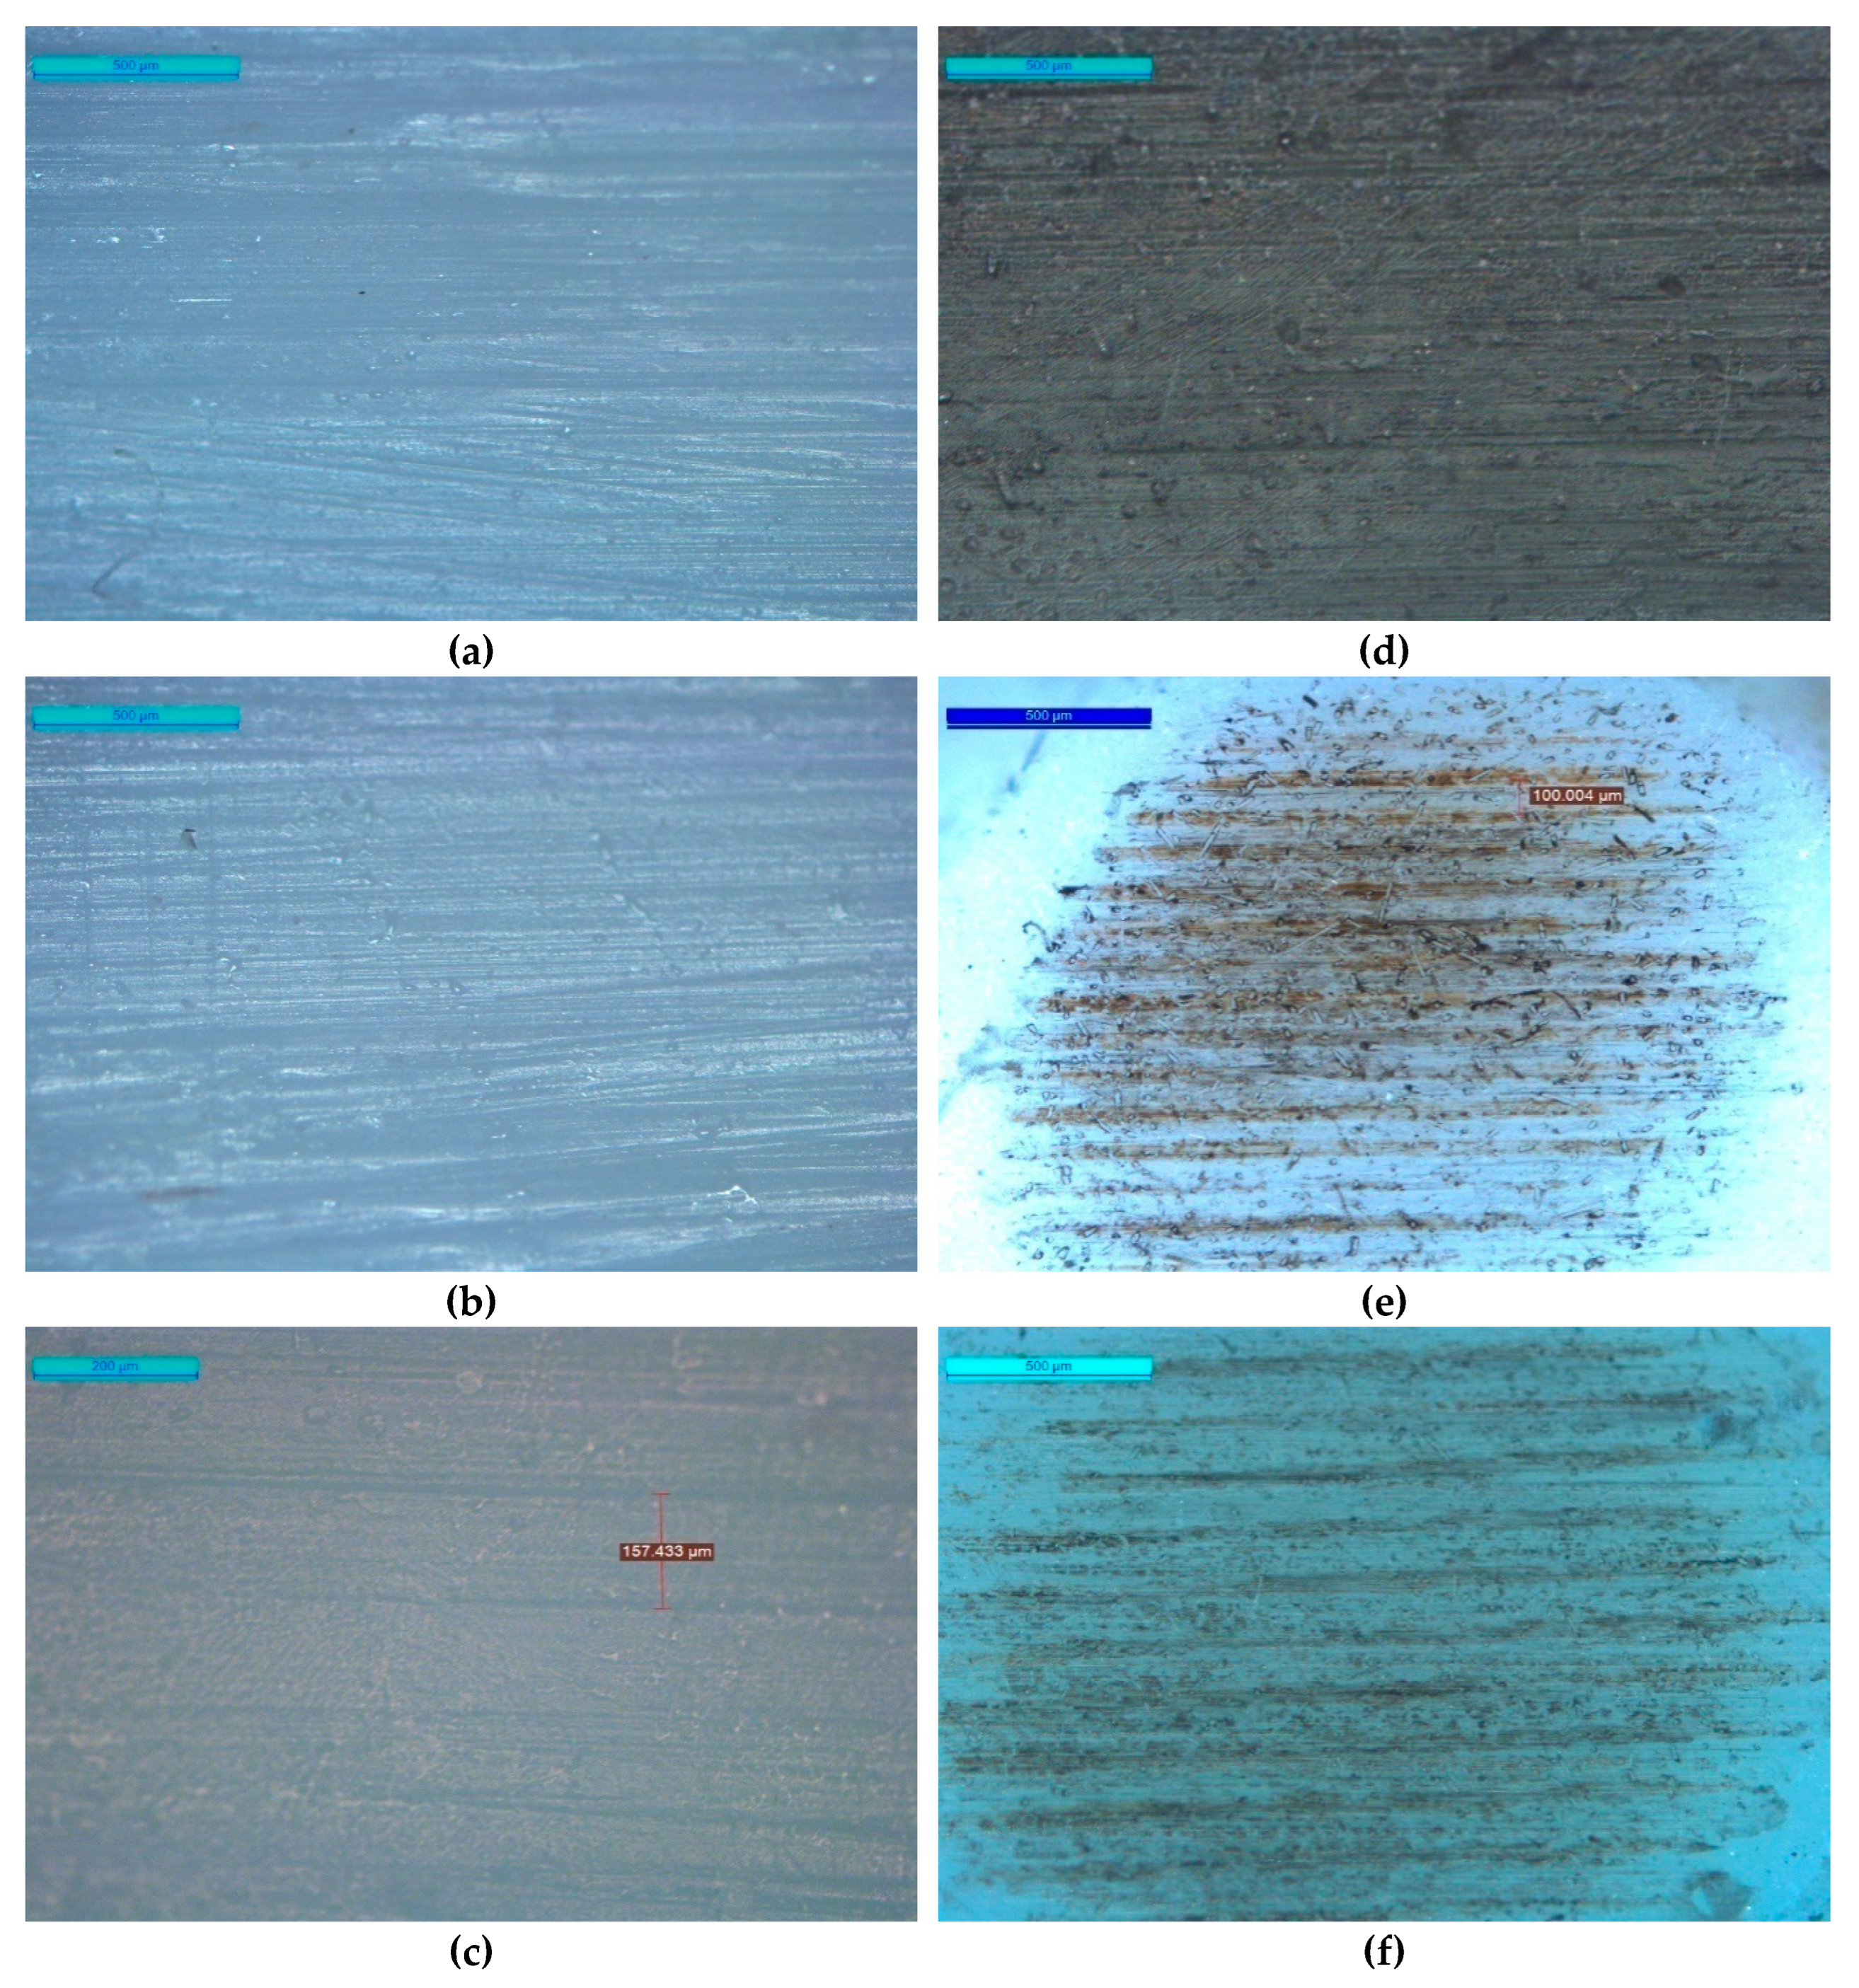
3.3. Analysis of Worn Surfaces
Figure 9a–c show the worn surfaces of un-textured GCI counter surface, textured GCI with 100µm dimple pitch and textured GCI with 150 µm dimple pitch after sliding for 540m against virgin PTFE surfaces. It is evident from these figures that transfer of PTFE has taken place on the GCI surfaces, whether textured or un-textured. However, it is also evident from these figures that a thin and tenacious transfer film has formed on the GCI counter surface textured with 150 µm dimple pitch. This resulted in decreased friction and wear of the virgin PTFE against counter surface textured with 150 µm dimple pitch. However, such a thin and tenacious film is not present on the un-textured GCI and textured GCI (100µm dimple pitch) counter surfaces; no doubt a high deposition of PTFE is present on the surfaces. This indicates that geometrical parameters of the texture deserve due consideration in LST as they affect the tribological performance. The worn surfaces of virgin PTFE after sliding against GCI counter surfaces also show supportive evidence to this as it is evident from
Figure 10a–c that slight abrasion is observed on the surface of virgin PTFE after sliding against GCI counter surface textured with 150 µm dimple pitch, however, high abrasion of the PTFE worn surface can be observed for virgin PTFE upon sliding against un-textured GCI and textured GCI (100µm dimple pitch) counter surfaces.
Figure 9d–f show the worn surfaces of un-textured GCI counter surface, textured GCI with 100µm dimple pitch and textured GCI with 150 µm dimple pitch after sliding for 540m against 25 wt. % GF filled PTFE surfaces. It is evident from
Figure 9d–f that transfer of material has occurred onto the un-textured GCI counter surface as a result of sliding, however, the textured GCI surfaces whether, 100µm dimple pitchor 150 µm dimple pitch do not show such transfer of material, no doubt deformation of the surface textures is observed. On observing
Figure 10d–f, it is apparent that abrasion accompanied with adhesive wear have occurred on the worn surface of 25 wt. % GF filled PTFE upon sliding against un-textured GCI, however, minor abrasion is observed on the surface 25 wt. % GF filled PTFE upon sliding against textured GCI, whether 100 µm dimple pitch 150 µm dimple pitch. Some adhesion of the GCI material has taken place on the worn surfaces of 25 wt. % GF filled PTFE upon sliding against textured GCI surfaces due to interaction of the textured surfaces with hard glass fibres, which has also lead to increased friction of 25 wt. % GF filled PTFE against textured GCI surfaces. However, the wear remained low due to these interactions.
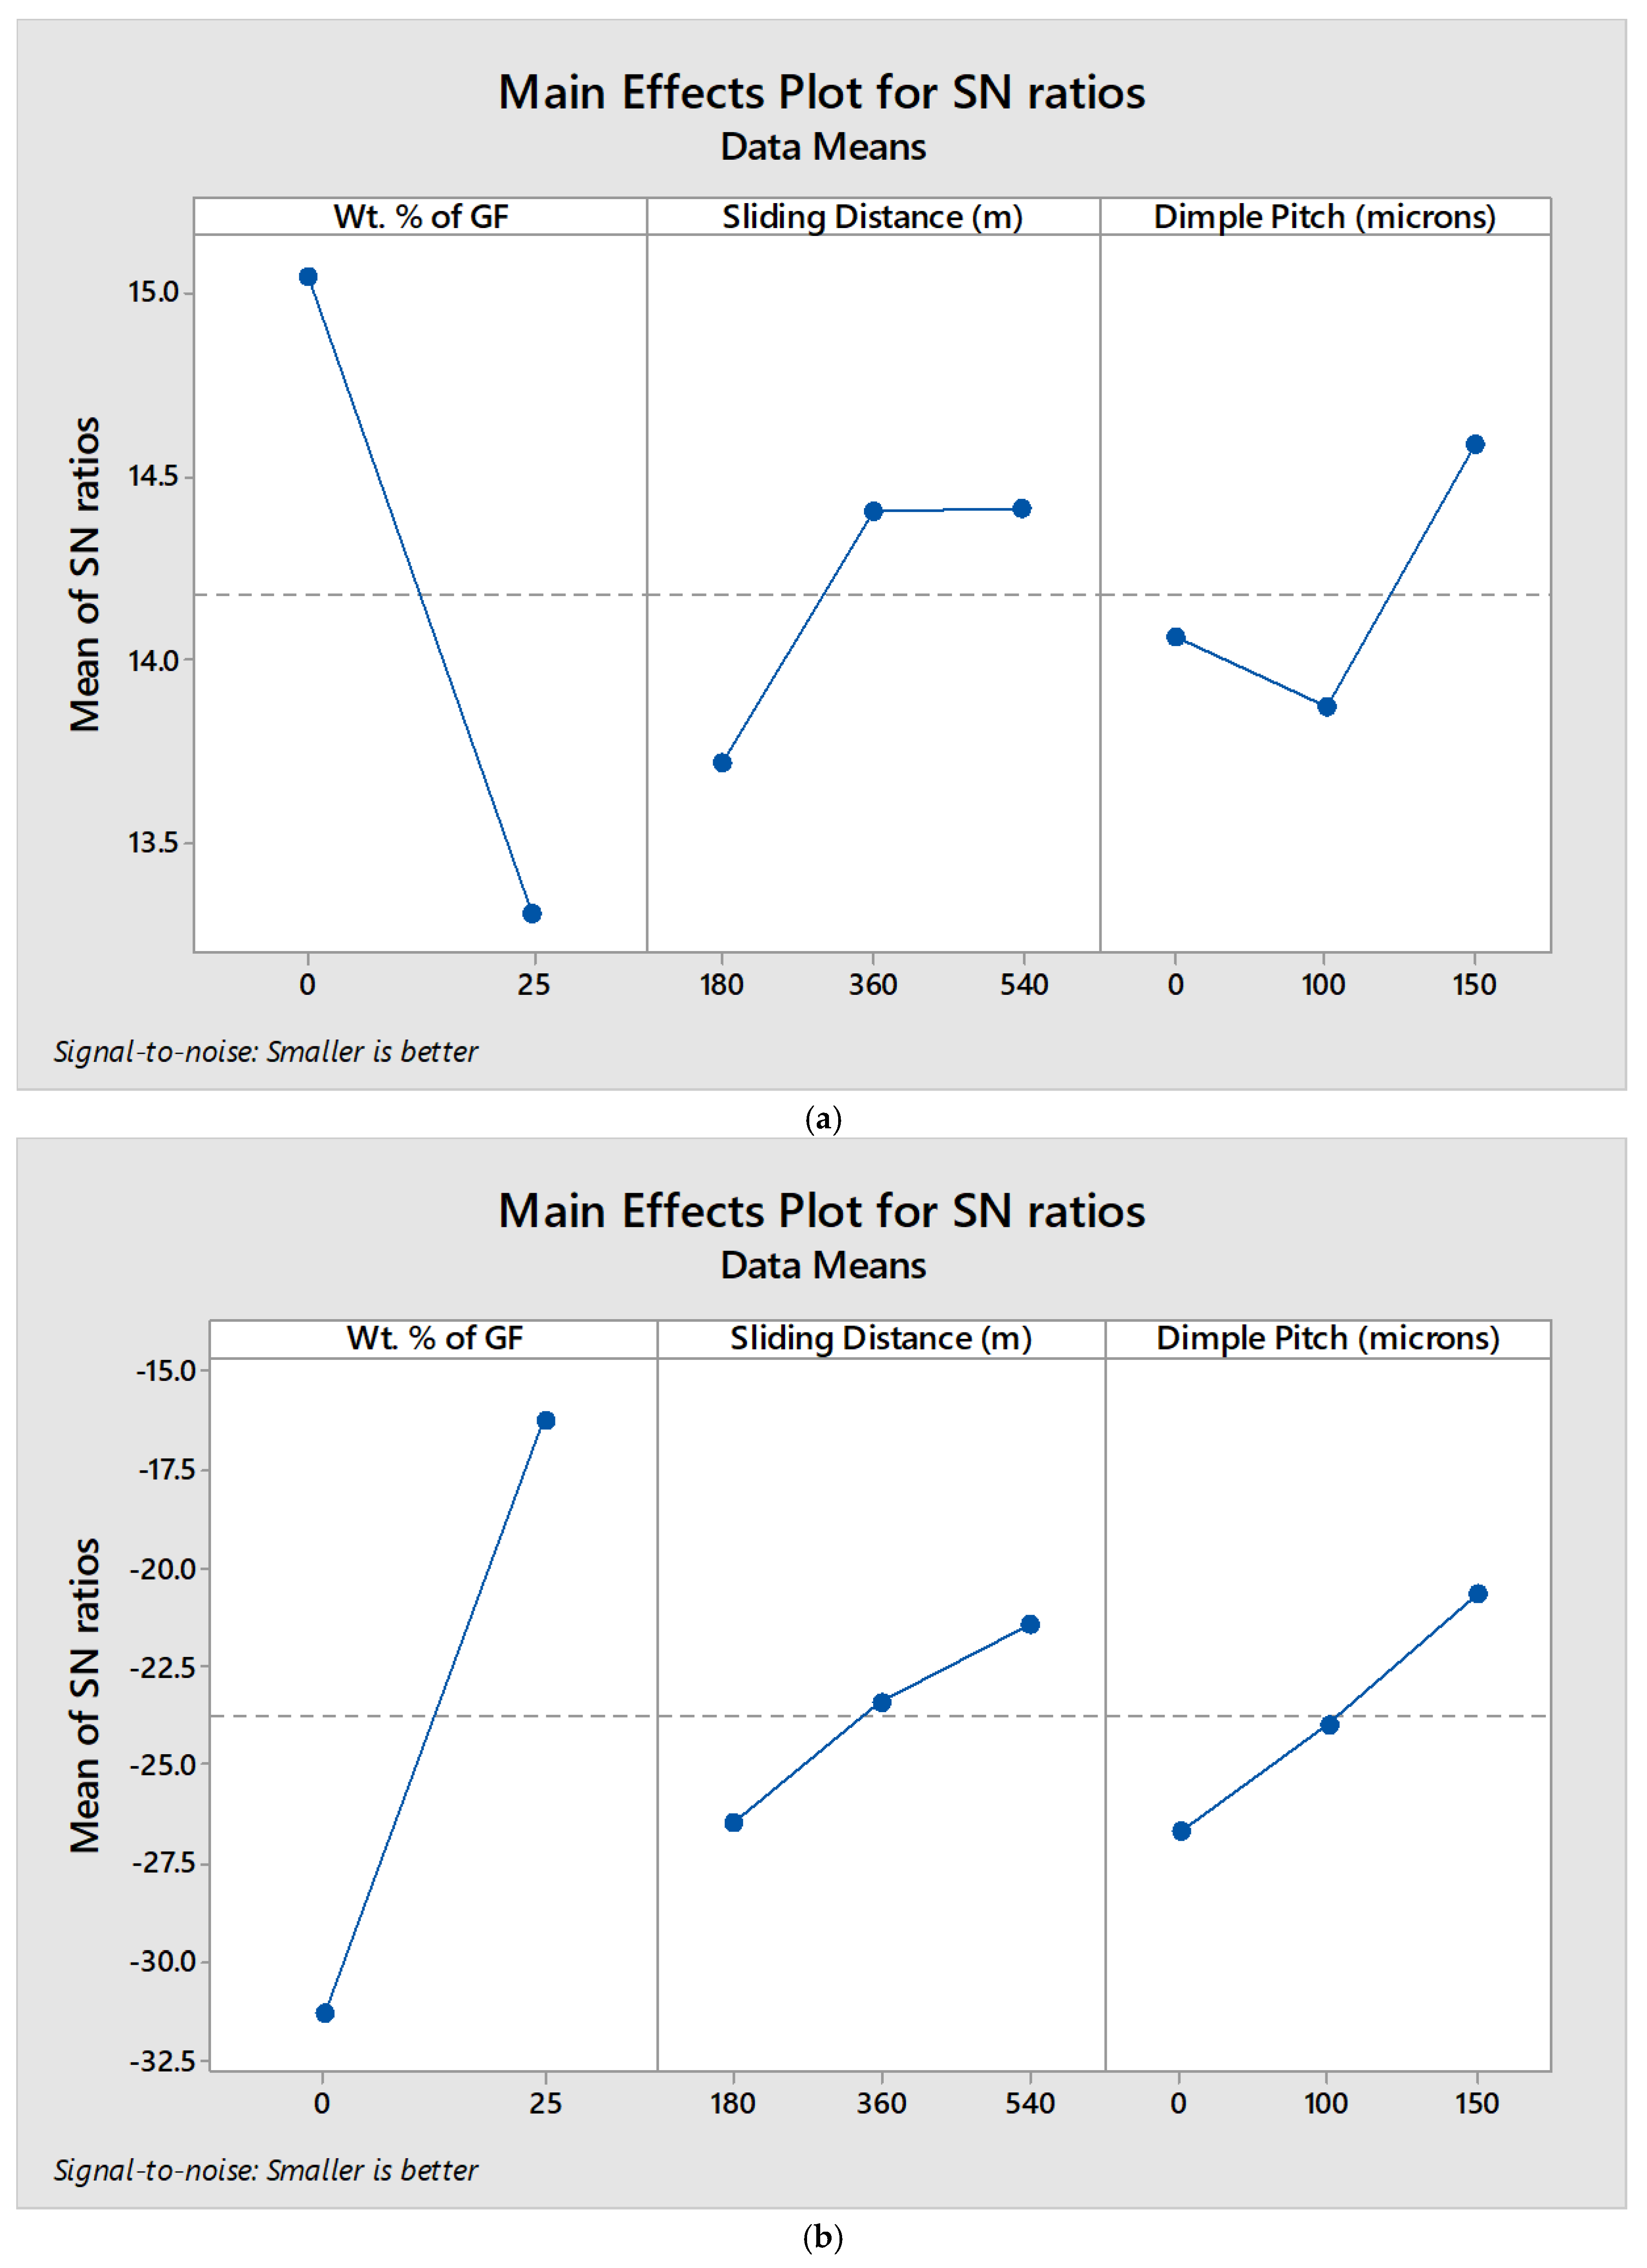
3.4. Analysis of S/N Ratio (Taguchi Approach)
The experimental results attained for friction and wear were analysed statistically using Minitab software. The S/N ratio analysis was carried out for obtaining the control factor settings for COF and Wear rate. The S/N ratios for the obtained experimental values of COF and Wear rate are shown in
Table 2 and the S/N ratio response is shown in
Table 3.
Figure 11a,b demonstrate the effect of control factors (viz., Wt. % age of GF, Sliding distance and Dimple pitch) on average S/N ratio for COF and Wear rate respectively. The highest values of S/N ratios (bold values in
Table 3) indicate the optimal factor settings for COF and Wear rate. These bold values in
Table 3 are indicated as the highest values of S/N ratios in
Figure 11a and
Figure 11b respectively for COF and Wear rate. From
Table 3 and
Figure 11a,b, it is evident that the optimal parameter settings for COF and Wear rate are; Wt. % age of GF: 0, Sliding distance: 540m and Dimple pitch: 150µm and Wt. % age of GF: 25, Sliding distance: 540m and Dimple pitch:150µm respectively. Further, it is also evident from
Table 3 that the Wt. % age of GF is the most significant parameter affecting COF and Wear rate followed by Dimple pitch and Sliding distance.
3.5. Analysis of Variance (ANOVA)
In order to reveal the significant control parameters, their interactions and their percentage contribution on COF and Wear rate, the experimental results of friction coefficient and wear rate were subjected to analysis of variance. ANOVA was achieved at 95% confidence level and 5% significance level using Minitab software and the results are shown in
Table 4 and
Table 5 for average COF and Wear rate respectively. It is evident from
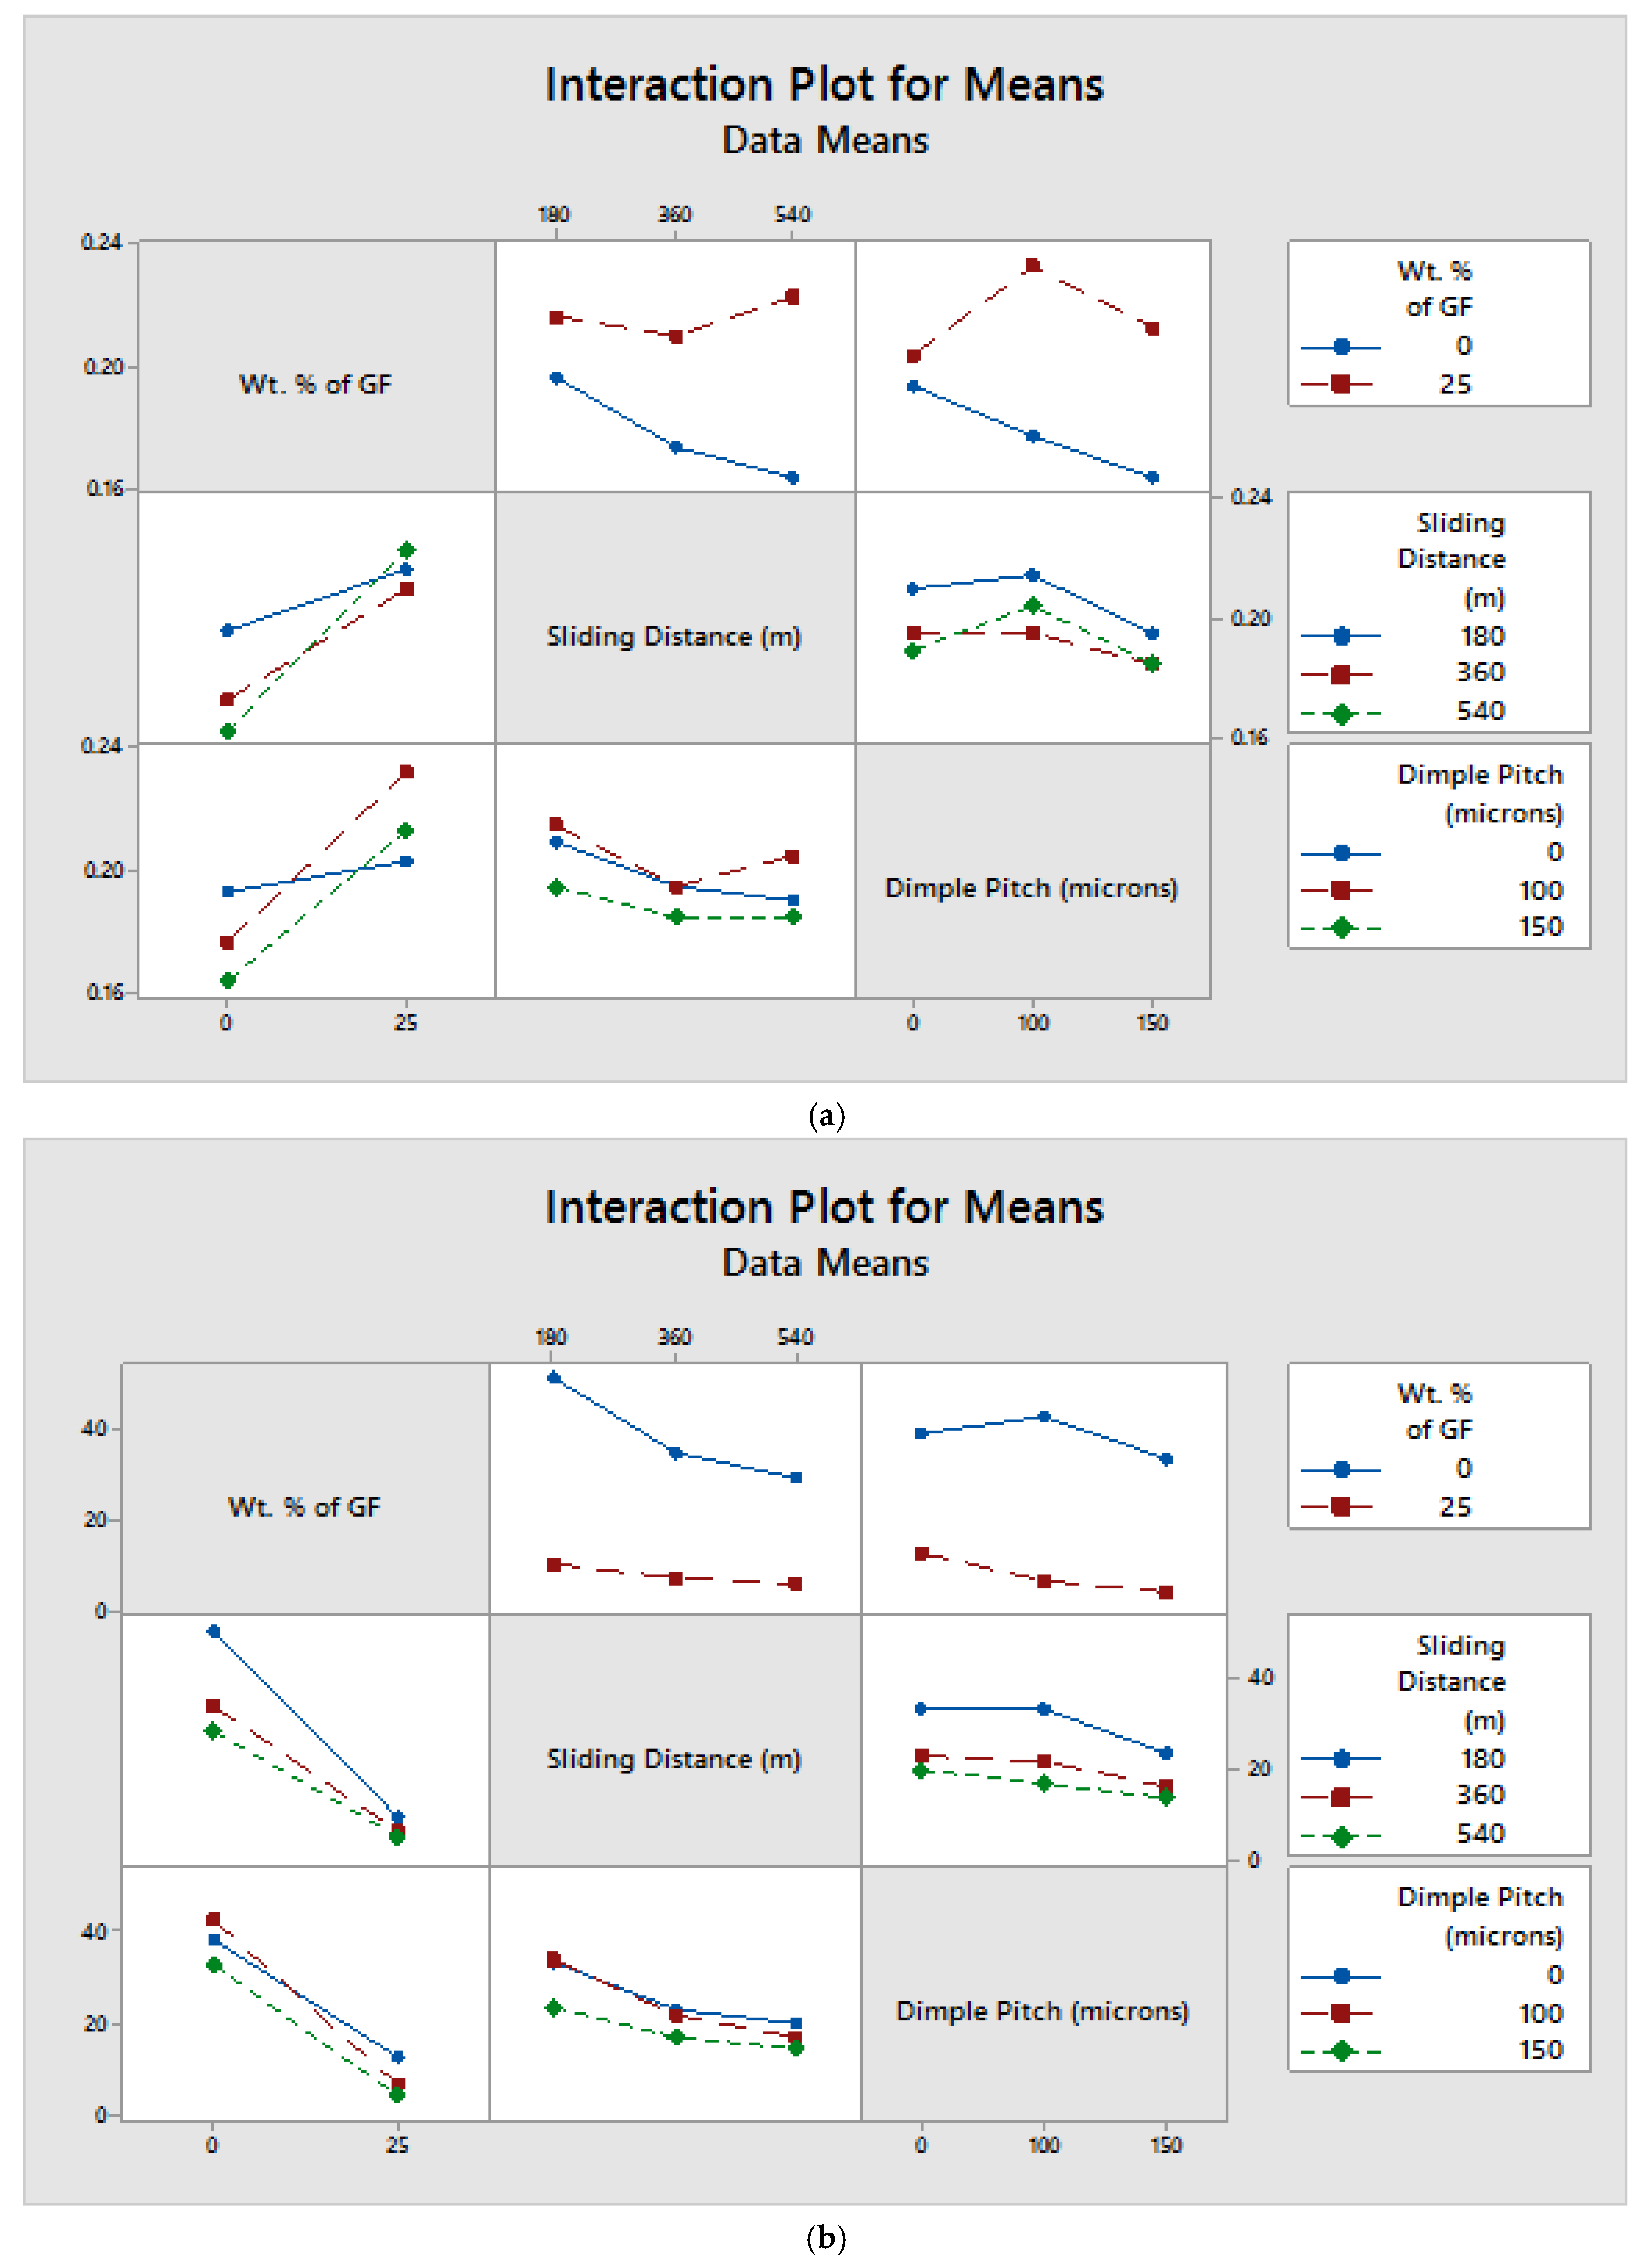
Table 4 that Wt. %age of GF is the most significant factor for COF with a percentage contribution of 56.43% followed by Dimple pitch (6.11%) and Sliding distance (5.84%). The interactions of Wt. %age of GF*Dimple pitch and Wt. %age of GF*Sliding distance are also significant with percentage contributions of 15.04% and 9.2% respectively. The significance of these interactions can also be observed from the interaction plot of COF (
Figure 12a). As suggested in [
39], if the lines of an interaction plot interact with each other then, a significant interaction exists between the control parameters. From
Table 5 it is evident that Wt. %age of GF is again the most significant parameter for Wear rate with a percentage contribution of 77.72% followed by Sliding distance (10.27%) and Dimple pitch (3.02%). Moreover, the interactions of Wt. %age of GF*Dimple pitch and Wt. %age of GF*Sliding distance contribute to Wear rate by 4.43% and 1.1% respectively. These nominal interactions are also confirmed by the interaction plot for wear rate (
Figure 12b).
4. Conclusions
This study demonstrated that Laser Surface Texturing is an efficient way to tailor the tribological characteristics of materials. This study showed that texturing the counter surface could improve the friction and wear characteristics of virgin PTFE. But at the same time showed that geometrical parameters of the texture should be given important consideration in LST, like dimple pitch of 150µm in the present case showed better results than 100µmdimple pitch. This study also proved texturing the metallic counter surface could improve the tribo-characteristics of the soft polymer via tenacious transfer film formation; however, the same could not be true for a polymer reinforced with hard fillers like glass fibre. The interaction of glass fibres with the micro-textured GCI surface upon sliding lead to increased friction. The following conclusions can be drawn from this study:
The study concludes that the lowest average coefficient of friction (COF) and specific wear rate for virgin PTFE were observed against a textured gray cast iron (GCI) counter surface with a 150 µm dimple pitch, regardless of sliding distance. This was followed by textured GCI with a 100 µm dimple pitch and untextured GCI in terms of average COF, whereas for specific wear rate, untextured GCI performed better than textured GCI with a 100 µm dimple pitch. FESEM micrographs of worn surfaces indicated the formation of transfer films on textured GCI surfaces during sliding with virgin PTFE. Notably, a thin and tenacious transfer film was formed on the textured GCI with a 150 µm dimple pitch, which contributed to reduced friction and wear. For 25 wt.% glass fiber-filled PTFE, the lowest specific wear rate was also observed against a textured GCI counter surface with a 150 µm dimple pitch, followed by textured GCI with a 100 µm dimple pitch and untextured GCI. However, the lowest average COF for this material was recorded against untextured GCI, followed by textured GCI with 150 µm and 100 µm dimple pitches. The signal-to-noise ratio (S/N) analysis identified the optimal factors for minimizing COF as virgin PTFE, a sliding distance of 540 m, and a dimple pitch of 150 µm, while the optimal settings for specific wear rate were 25 wt.% glass fiber/PTFE, a sliding distance of 540 m, and a dimple pitch of 150 µm. Analysis of variance (ANOVA) showed that the weight percentage of glass fiber was the most significant factor influencing both COF and specific wear rate, contributing 56.43% and 77.72%, respectively. The contributions of sliding distance were 5.84% for COF and 10.27% for specific wear rate, while dimple pitch contributed 6.11% and 3.02%, respectively. Additionally, the interaction of glass fiber content and dimple pitch significantly influenced COF and specific wear rate, with contributions of 15.04% and 4.43%, respectively. These findings highlight the crucial role of texturing, material composition, and operating conditions in optimizing the tribological performance of PTFE-based composites.
Funding
The authors declare that there was no external funding received for this research. All expenses associated with this study were personally funded.
References
- Kowandy, C.; Richard, C.; Chen, Y. M. Characterization of wear particles for comprehension of wear mechanisms: Case of PTFE against cast iron. Wear 2008, 265, 11-12 1714-1719. [Google Scholar] [CrossRef]
- Mazza, Luigi; Trivella, Andrea; Grassi, Roberto; GiulioMalucelli. A comparison of the relative friction and wear responses of PTFE and a PTFE-based composite when tested using three different types of sliding wear machines. Tribology International 2015, 90, 15–21. [Google Scholar] [CrossRef]
- Khedkar, Jaydeep; IoanNegulescu, Efstathios I.; Meletis. Sliding wear behavior of PTFE composites. Wear 2002, 252.5-6, 361–369. [Google Scholar] [CrossRef]
- Tanaka, K.; Friedrich, K. Effect of various fillers on the friction and wear of PTFE-based composites. Friction and Wear of Polymer composites 1986, 137–174. [Google Scholar]
- Jebran, M.; Wani, M. F.; Gupta, Rajat. Tribological performance evaluation of polytetrafluoroethylene composites under dry sliding and aqueous environments using Taguchi approach and grey relational analysis: effect of material, test environment and load. Polymer Composites 2019, 40.7, 2863–2875. [Google Scholar] [CrossRef]
- Goyal, R. K.; Yadav, M. Study on wear and friction behavior of graphite flake-filled PTFE composites. Journal of Applied Polymer Science 2013, 127.4, 3186–3191. [Google Scholar] [CrossRef]
- Wang, Yunxia; Yan, Fengyuan. Tribological properties of transfer films of PTFE-based composites. Wear 2006, 261.11-12, 1359–1366. [Google Scholar] [CrossRef]
- Shi, Y. J.; Feng, X.; Wang, H. Y.; Liu, C.; Lu, X. H. Effects of filler crystal structure and shape on the tribological properties of PTFE composites. Tribology International 2007, 40.7, 1195–1203. [Google Scholar] [CrossRef]
- Bahadur, Shyam; Tabor, David. The wear of filled polytetrafluoroethylene. Wear 1984, 98, 1–13. [Google Scholar] [CrossRef]
- Conte, M.; Igartua, A. Study of PTFE composites tribological behavior. Wear 2012, 296.1-2, 568–574. [Google Scholar] [CrossRef]
- Blanchet, T. A.; Kennedy, F. E. Sliding wear mechanism of polytetrafluoroethylene (PTFE) and PTFE composites. Wear 1992, 153.1, 229–243. [Google Scholar] [CrossRef]
- Cheng, Xianhua; Xue, Yujun; Xie, Chaoying. Tribological investigation of PTFE composite filled with lead and rare earths-modified glass fiber. Materials Letters 2003, 57, 16-17 2553-2557. [Google Scholar] [CrossRef]
- Peterson, M. B.; Winer, W. O. Wear Control Handbook; ASME:
Nova York
, 1980. [Google Scholar]
- Balasaheb, *!!! REPLACE !!!*; Kanchan, Wakchaure; Abhang, L. B. Experimental Investigation of Tribological Properties of Compressor Piston Ring with PEEK.
- Wang, Xiaojie; et al. Effect of crystallization behavior on wear properties of polytetrafluoroethylene composites modified by irradiation above melting point. Polymer Composites 2025, 46.1, 809–816. [Google Scholar] [CrossRef]
- Willis, Eric. Surface finish in relation to cylinder liners. Wear 1986, 109.1-4, 351–366. [Google Scholar] [CrossRef]
- Bulatov, V. P.; Krasny, V. A.; Schneider, Y. G. Basics of machining methods to yield wear-and fretting-resistive surfaces, having regular roughness patterns. Wear 1997, 208.1-2, 132–137. [Google Scholar] [CrossRef]
- Saka, Nannaji; Liou, Ming J.; Suh, Nam P. The role of tribology in electrical contact phenomena. Wear 1984, 100.1-3, 77–105. [Google Scholar] [CrossRef]
- Saka, Nannaji; Tian, Hong; Suh, Nam P. Boundary lubrication of undulated metal surfaces at elevated temperatures. Tribology Transactions 1989, 32.3, 389–395. [Google Scholar] [CrossRef]
- Tian, Hong; NannajiSaka; Suh, Nam P. Boundary lubrication studies on undulated titanium surfaces. Tribology Transactions 1989, 32.3, 289–296. [Google Scholar] [CrossRef]
- Suh, Nam P.; Mosleh, Mohsen; Howard, Phillip S. Control of friction. Wear 1994, 175.1-2, 151–158. [Google Scholar] [CrossRef]
- Mosleh, Mohsen; Laube, Samuel JP; Suh, Nam P. Friction of undulated surfaces coated with MoS2 by pulsed laser deposition. Tribology transactions 1999, 42.3, 495–502. [Google Scholar] [CrossRef]
- Wang, Xiaolei; Kato, Koji; Adachi, Koshi. The lubrication effect of micro-pits on parallel sliding faces of SiC in water. Tribology transactions 2002, 45.3, 294–301. [Google Scholar] [CrossRef]
- Fang, Shuntao; et al. Enhancement mechanism exploration of hexagonal boron nitride on the mechanical and tribological properties of polytetrafluoroethylene composites by experiments and molecular dynamics simulation. Polymer Composites 2025, 46.1, 692–702. [Google Scholar] [CrossRef]
- Wang, Xiaolei; Kato, Koji; Adachi, Koshi; KohjAizawa. Loads carrying capacity map for the surface texture design of SiC thrust bearing sliding in water. Tribology international 2003, 36.3, 189–197. [Google Scholar] [CrossRef]
- Wakuda, Manabu; Yamauchi, Yukihiko; Kanzaki, Shuzo; Yasuda, Yoshiteru. Effect of surface texturing on friction reduction between ceramic and steel materials under lubricated sliding contact. Wear 2003, 254.3-4, 356–363. [Google Scholar] [CrossRef]
- Stephens, L. S.; Siripuram, R.; Hayden, M.; McCartt, B. Deterministic micro asperities on bearings and seals using a modified LIGA process. J. Eng. Gas Turbines Power 2004, 126.1, 147–154. [Google Scholar] [CrossRef]
- Pettersson, Ulrika; Jacobson, Staffan. Influence of surface texture on boundary lubricated sliding contacts. Tribology international 2003, 36.11, 857–864. [Google Scholar] [CrossRef]
- Geiger, M.; Roth, S.; Becker, W. Influence of laser-produced microstructures on the tribological behaviour of ceramics. Surface and Coatings Technology 1998, 100, 17–22. [Google Scholar] [CrossRef]
- Borghi, Aa; Gualtieri, Enrico; Marchetto, Diego; Moretti, L.; Valeri, Sergio. Tribological effects of surface texturing on nitriding steel for high-performance engine applications. Wear 2008, 265.7-8, 1046–1051. [Google Scholar] [CrossRef]
- Amanov, Auezhan; Tsuboi, Ryo; Oe, Hironobu; Sasaki, Shinya. The influence of bulges produced by laser surface texturing on the sliding friction and wear behavior. Tribology International 2013, 60, 216–223. [Google Scholar] [CrossRef]
- Vilhena, L. M.; Sedlaček, Marko; JožeVižintin, BojanPodgornik; JanezMožina, AlešBabnik. Surface texturing by pulsed Nd: YAG laser. Tribology International 2009, 42.10, 1496–1504. [Google Scholar] [CrossRef]
- Baharin, Ahmad FirdausShamsul; MariyamJameelahGhazali; Wahab, Juyana A. Laser surface texturing and its contribution to friction and wear reduction: a brief review. In Industrial Lubrication and Tribology; 2016. [Google Scholar]
- Vlădescu, Sorin-Cristian; Olver, Andrew V.; Pegg, Ian G.; Reddyhoff, Tom. Combined friction and wear reduction in a reciprocating contact through laser surface texturing. Wear 2016, 358, 51–61. [Google Scholar] [CrossRef]
- Wan, Yi; Xiong, Dang-Sheng. The effect of laser surface texturing on frictional performance of face seal. Journal of materials processing technology 2008, 197.1-3, 96–100. [Google Scholar] [CrossRef]
- Voevodin, A. A.; Zabinski, J. S. Laser surface texturing for adaptive solid lubrication. Wear 2006, 261, 11-12 1285-1292. [Google Scholar] [CrossRef]
- Xing, Youqiang; Deng, Jianxin; Feng, Xiuting; Yu, Sheng. Effect of laser surface texturing on Si3N4/TiC ceramic sliding against steel under dry friction. Materials & Design (1980-2015) 2013, 52, 234–245. [Google Scholar]
- Kovalchenko, Andriy; OyelayoAjayi; Erdemir, Ali; Fenske, George; IzhakEtsion. The effect of laser surface texturing on transitions in lubrication regimes during unidirectional sliding contact. Tribology International 2005, 38.3, 219–225. [Google Scholar] [CrossRef]
- Banday, S; Wani, M. F. Adhesion Strength and Tribological Property of Self-lubricating Si/MoS2 Nanocoating by Pulsed Laser Deposition Method. In Ceramics International; 2021. [Google Scholar] [CrossRef]
- Singh, J; Wani, M.F. “Fretting wear of spark plasma sintered Ti3SiC2/GNP ceramic composite against Si3N4”. Ceramics International 2020, 47(4), 5648–5655. [Google Scholar] [CrossRef]
- Roy Ranjit, K. A primer on Taguchi method; VNR Publication: New York, 1990; pp. 7–10. [Google Scholar]
Figure 1.
Optical micrographs of samples: (a) GCI; (b) Virgin PTFE; (b) 25 wt. % glass fibre/PTFE.
Figure 1.
Optical micrographs of samples: (a) GCI; (b) Virgin PTFE; (b) 25 wt. % glass fibre/PTFE.
Figure 2.
Surface roughness profiles of polished samples: (a) GCI; (b) Virgin PTFE; (b) 25 wt. % glass fibre/PTFE.
Figure 2.
Surface roughness profiles of polished samples: (a) GCI; (b) Virgin PTFE; (b) 25 wt. % glass fibre/PTFE.
Figure 3.
Textured surfaces of GCI: (a) 100µm dimple pitch; (b) 150µm dimple pitch.
Figure 3.
Textured surfaces of GCI: (a) 100µm dimple pitch; (b) 150µm dimple pitch.
Figure 4.
Profilometric trace of the dimple showing dimple depth.
Figure 4.
Profilometric trace of the dimple showing dimple depth.
Figure 5.
Average COF vs. Sliding distance for virgin PTFE.
Figure 5.
Average COF vs. Sliding distance for virgin PTFE.
Figure 6.
Average COF vs. Sliding distance for 25 wt. % glass fibre filled PTFE.
Figure 6.
Average COF vs. Sliding distance for 25 wt. % glass fibre filled PTFE.
Figure 7.
Specific wear rate vs. Sliding distance for virgin PTFE.
Figure 7.
Specific wear rate vs. Sliding distance for virgin PTFE.
Figure 8.
Specific wear rate vs. Sliding distance for 25 wt. % glass fibre/PTFE.
Figure 8.
Specific wear rate vs. Sliding distance for 25 wt. % glass fibre/PTFE.
Figure 9.
FESEM Micrographs of the worn surfaces of GCI counter surface after sliding a distance of 540m: a) un-textured GCI against virgin PTFE; b) textured GCI with 100µm dimple pitchagainst virgin PTFE; c) textured GCI with 150 µm dimple pitch against virgin PTFE; d) un-textured GCI against 25 wt. % GF filled PTFE; e) textured GCI with 100µm dimple pitchagainst 25 wt. % GF filled PTFE; f) textured GCI with 150µm dimple pitchagainst 25 wt. % GF filled PTFE.
Figure 10.
Optical Micrographs of the worn surfaces of virgin PTFE and 25 wt. % GF filled PTFE after sliding a distance of 540m: a) virgin PTFE against un-textured GCI; b) virgin PTFE against textured GCI with 100µm dimple pitch; c) virgin PTFE against textured GCI with 150 µm dimple pitch; d) 25 wt. % GF filled PTFE against un-textured GCI; e) 25 wt. % GF filled PTFE against textured GCI with 100µm dimple pitch; f) 25 wt. % GF filled PTFE against textured GCI with 150µm dimple pitch.
Figure 11.
(a) Influence of control parameters on average S/N ratio for COF(b) Influence of control parameters on average S/N ratio for wear rate.
Figure 11.
(a) Influence of control parameters on average S/N ratio for COF(b) Influence of control parameters on average S/N ratio for wear rate.
Figure 12.
(a) Interaction of control parameters for average COF(b) Interaction of control parameters for wear rate.
Figure 12.
(a) Interaction of control parameters for average COF(b) Interaction of control parameters for wear rate.
Table 1.
Control parameters and their levels.
Table 1.
Control parameters and their levels.
| Control parameter |
Units |
Level |
|
|
| |
|
1 |
2 |
3 |
| Wt. %age of GF |
% |
0 |
25 |
-- |
| Sliding distance |
m |
180 |
360 |
540 |
| Dimple pitch |
µm |
0 |
100 |
150 |
Table 2.
Results of friction and wear tests.
Table 2.
Results of friction and wear tests.
| Exp. No. |
Wt. % of Glass Fibre |
Sliding Distance (m) |
Dimple Pitch (µm) |
COF
|
Wear Rate
(10-8mm3/Nm)
|
S/N Ratio
(COF) |
S/N Ratio
(Wear Rate) |
| 1 |
0 |
180 |
0 |
0.21 |
50.0 |
13.5556 |
-33.9794 |
| 2 |
0 |
180 |
100 |
0.20 |
60.5 |
13.9794 |
-35.6351 |
| 3 |
0 |
180 |
150 |
0.18 |
42.7 |
14.8945 |
-32.6086 |
| 4 |
0 |
360 |
0 |
0.19 |
35.2 |
14.4249 |
-30.9309 |
| 5 |
0 |
360 |
100 |
0.17 |
37.7 |
15.3910 |
-31.5268 |
| 6 |
0 |
360 |
150 |
0.16 |
30.2 |
15.9176 |
-29.6001 |
| 7 |
0 |
540 |
0 |
0.18 |
31.1 |
14.8945 |
-29.8552 |
| 8 |
0 |
540 |
100 |
0.16 |
29.4 |
15.9176 |
-29.3669 |
| 9 |
0 |
540 |
150 |
0.15 |
25.9 |
16.4782 |
-28.2660 |
| 10 |
25 |
180 |
0 |
0.21 |
17.6 |
13.5556 |
-24.9103 |
| 11 |
25 |
180 |
100 |
0.23 |
7.5 |
12.7654 |
-17.5012 |
| 12 |
25 |
180 |
150 |
0.21 |
5.1 |
13.5556 |
-14.1514 |
| 13 |
25 |
360 |
0 |
0.20 |
11.4 |
13.9794 |
-21.1381 |
| 14 |
25 |
360 |
100 |
0.22 |
6.3 |
13.1515 |
-15.9868 |
| 15 |
25 |
360 |
150 |
0.21 |
3.8 |
13.5556 |
-11.5957 |
| 16 |
25 |
540 |
0 |
0.20 |
9.3 |
13.9794 |
-19.3697 |
| 17 |
25 |
540 |
100 |
0.25 |
5.0 |
12.0412 |
-13.9794 |
| 18 |
25 |
540 |
150 |
0.22 |
2.5 |
13.1515 |
-7.9588 |
Table 3.
Response table for S/N ratios.
Table 3.
Response table for S/N ratios.
| COF |
| Level |
Wt. % age of GF |
Sliding Distance (m) |
Dimple Pitch (µm) |
| 1 |
15.05 |
13.72 |
14.06 |
| 2 |
13.30 |
14.40 |
13.87 |
| 3 |
|
14.41 |
14.59 |
| Delta |
1.75 |
0.69 |
0.72 |
| Rank |
1 |
3 |
2 |
| Wear rate |
| 1 |
-31.31 |
-26.46 |
-26.70 |
| 2 |
-16.29 |
-23.46 |
-24.00 |
| 3 |
|
-21.47 |
-20.70 |
| Delta |
15.02 |
5.00 |
6.00 |
| Rank |
1 |
3 |
2 |
Table 4.
ANOVA for average COF.
Table 4.
ANOVA for average COF.
| Source |
DF |
Adj SS |
Adj MS |
F |
P |
%age contribution |
| Wt. %age of GF |
1 |
0.006806 |
0.006806 |
122.50 |
0.000 |
56.43 |
| Sliding distance (m) |
2 |
0.000811 |
0.000406 |
7.30 |
0.046 |
5.84 |
| Dimple pitch (µm) |
2 |
0.000844 |
0.000422 |
7.60 |
0.043 |
6.11 |
| Wt. %age of GF*Sliding distance (m) |
2 |
0.001211 |
0.000606 |
10.90 |
0.024 |
9.2 |
| Wt. %age of GF*Dimple pitch (µm) |
2 |
0.001911 |
0.000956 |
17.20 |
0.011 |
15.04
|
| Sliding distance (m)*Dimple pitch (µm) |
4 |
0.000156 |
0.000039 |
0.70 |
0.631 |
Pooled |
| Error |
4 |
0.000222 |
0.000056 |
|
|
7.38 |
| Total |
17 |
0.011961 |
|
|
|
100 |
Table 5.
ANOVA for wear rate.
Table 5.
ANOVA for wear rate.
| Source |
DF |
Adj SS |
Adj MS |
F |
P |
%age contribution |
| Wt. % of GF |
1 |
4176.98 |
4176.98 |
345.59 |
0.000 |
77.72 |
| Sliding Distance (m) |
2 |
574.86 |
287.43 |
23.78 |
0.006 |
10.27 |
| Dimple Pitch (µm) |
2 |
186.06 |
93.03 |
7.70 |
0.043 |
3.02 |
| Wt. % of GF*Sliding Distance (m) |
2 |
261.64 |
130.82 |
10.82 |
0.024 |
4.43 |
| Wt. % of GF*Dimple Pitch (µm) |
2 |
83.05 |
41.53 |
3.44 |
0.135 |
1.1 |
| Sliding Distance (m)*Dimple Pitch (µm) |
4 |
27.57 |
6.89 |
0.57 |
0.700 |
Pooled |
| Error |
4 |
48.35 |
12.09 |
|
|
3.46 |
| Total |
17 |
5358.50 |
|
|
|
100 |
|
Disclaimer/Publisher’s Note: The statements, opinions and data contained in all publications are solely those of the individual author(s) and contributor(s) and not of MDPI and/or the editor(s). MDPI and/or the editor(s) disclaim responsibility for any injury to people or property resulting from any ideas, methods, instructions or products referred to in the content. |
© 2026 by the authors. Licensee MDPI, Basel, Switzerland. This article is an open access article distributed under the terms and conditions of the Creative Commons Attribution (CC BY) license (http://creativecommons.org/licenses/by/4.0/).