
Submitted:
04 January 2026
Posted:
06 January 2026
You are already at the latest version
Abstract
Diabetic retinopathy (DR) is a leading cause of vision impairment and permanent blindness worldwide, requiring an accurate and automated system to classify its multi-grade severity to ensure timely patient intervention. However, standard Convolutional Neural Networks (CNNs) often struggle to capture the fine, high-frequency microvascular patterns critical for diagnosis. This study proposes a Robust Intelligent CNN Model (RICNN) designed to improve multi-level DR classification by integrating Gabor-based feature extraction with deep learning. The model also incorporates SMOTE (Synthetic Minority Oversampling Technique) balancing and Adam optimization for efficient convergence. The proposed RICNN was evaluated on the Messidor dataset (1,200 images) across four severity levels: Mild, Moderate, Severe, and Proliferative DR. The results showed that RICNN achieved superior performance with 89% accuracy, 88.75% precision, 89% recall, and 89% F1-score. The model also demonstrated high robustness in identifying advanced stages, achieving AUCs of 97% for Severe DR and 99% for Proliferative DR. Comparative analysis confirms that texture-aware Gabor enhancement significantly outperforms Local Binary Pattern (LBP) and Color Histogram approaches. These findings indicate that the proposed RICNN provides a reliable and intelligent foundation for clinical decision support systems, potentially reducing diagnostic errors and preventing vision loss in high-risk populations.
Keywords:
deep learning
; diabetic retinopathy
; feature extraction
; Gabor filter
; medical image
; classification
; intelligent decision support
1. Introduction
According to data from the World Health Organization (WHO), Diabetic Retinopathy (DR) is a leading cause of vision impairment and blindness worldwide [1]. It is a chronic, progressive retinal disorder that evolves through four clinical stages: Mild, Moderate, Severe Nonproliferative Retinopathy, and Proliferative Diabetic Retinopathy [2,3,4]. Diabetic retinopathy can be diagnosed through fundus imaging, which is an image obtained using a fundus camera or a confocal, shortwave autofluorescence, and near-infrared scanning laser ophthalmoscope [5]. The increasing prevalence of diabetes, coupled with the limited number of retinal specialists, has created a bottleneck in diagnosis. Accurate multi-grade classification is clinically vital because the treatment window narrows significantly in advanced stages, yet manual screening remains labor-intensive and prone to inter-observer variability.
One of the critical stages in developing an image classification system is feature extraction, which converts raw images into compact numerical representations. Commonly used feature extraction methods include Color Histogram, Edge Detection, Histogram of Oriented Gradients (HOG), Gabor Filter, Gray Level Co-occurrence Matrix (GLCM), and Local Binary Pattern (LBP) [6,7,8,9]. Several studies have applied these techniques to fundus images; for instance, Gabor Filters combined with adaptive histogram equalization achieved 98.1% accuracy [10], while a single Gabor Filter approach yielded 78% accuracy [11]. Similarly, comparisons of LBP and GLCM using Support Vector Machines have shown accuracies between 73% and 74% [12].
In addition to manual methods, deep learning—specifically Convolutional Neural Networks (CNNs)—has become a dominant approach in medical image classification due to its ability to automatically extract features and utilize transfer learning to overcome data limitations [13,14,15]. CNNs have successfully automated DR detection [16], and lesion classification [17,18]. Furthermore, hybrid approaches, such as combining CNN with SAJOA for blood vessel segmentation, have also been proposed [19].
To enhance model robustness, combining manual feature extraction with CNNs has been explored in various domains. For example, CNNs integrated with Gabor Filters have been used for steganography detection [20], hand gesture recognition [21], general image classification [22], and urban map damage detection [23]. Similarly, the hybridization of CNNs with LBP has been widely studied for melanoma classification [24], oral cancer detection [25], and bearing failure detection [26]. Meanwhile, the integration of Color Histogram analysis with CNNs has been applied to skin lesion classification [27].
However, a critical research gap remains. Although various studies have utilized feature extraction and CNN methods, most DR research still relies on standard convolutional architecture without in-depth exploration of integrating domain-specific feature extraction techniques. Previous studies typically used single feature types separately and have not systematically compared the effect of feature combinations on CNN performance specifically for multi-grade classification. Furthermore, standard models often fail to address the issue of class imbalance, resulting in poor sensitivity in detecting critical, advanced stages. Therefore, a new approach is needed that synergizes adaptive feature extraction with robust learning strategies to ensure accurate and comprehensive DR detection.
Based on these gaps, this study proposes a Robust Intelligent CNN Model (RICNN) that integrates Gabor-based feature extraction with CNN. We explicitly evaluate this proposed model against Local Binary Pattern (LBP) and Color Histogram baselines on the Messidor dataset [39] to validate its superiority in identifying clinically critical DR stages.
This paper makes the following key contributions to the field of intelligence-based medicine:
- Development of the RICNN: A hybrid architecture that synergizes Gabor-based texture enhancement with CNNs to improve the detection of subtle microvascular lesions in multi-grade DR;
- Robust Methodology: The systematic application of SMOTE Balancing and Adam Optimization to resolve data disparity and ensure efficient convergence, guaranteeing reliable detection of rare but critical Proliferative DR cases;
- Comprehensive Validation: A rigorous evaluation demonstrating that the RICNN outperforms LBP and Color Histogram baselines, offering a reliable, intelligent foundation for automated clinical screening.
The following sections are presented: Section II covers related work on DR classification. Section III details the materials, the proposed RICNN architecture, and the robust methodology. Section IV discusses experimental results and clinical evaluation. Finally, Section V presents the conclusion and future research directions.
2. Related Works
This section reviews the evolution of Diabetic Retinopathy (DR) classification, shifting from pure deep learning architectures to hybrid feature extraction strategies, and identifies the specific research gaps addressed by this study.
2.1. Deep Learning in DR Detection and Its Limitations
Diabetic Retinopathy (DR) is a complication of diabetes and a leading cause of permanent blindness worldwide. Recently, deep learning has driven significant progress in automated DR detection, primarily through Convolutional Neural Networks (CNNs). Several studies [28,29,30,31,32] demonstrated that CNNs can extract visual features end-to-end without manual intervention, thereby improving detection accuracy compared to conventional methods. However, pure CNN-based models face inherent limitations: they often require massive datasets and high computational resources, and their performance can degrade significantly on images with low quality or varying lighting conditions due to their "black-box" nature.
2.2. Hybrid Approaches in Medical Computer Vision
To overcome the limitations of pure CNNs, recent research has proposed hybrid approaches that fuse automatic feature extraction with handcrafted domain knowledge.
- Color Histograms: Integrating CNNs with Color Histograms provides global color representation, which has proven useful in distinguishing lesion types in skin cancer classification based on spectral differences [27].
These studies collectively demonstrate that combining manual and automatic features enhances model generalization, particularly on datasets with limited samples or high visual variability.
2.3. Feature Extraction Specifically for Diabetic Retinopathy
Within the specific domain of DR, handcrafted features have shown promise in highlighting pathological biomarkers. Studies [10,11] utilized Gabor filters to highlight small blood vessel structures and lesions, effectively reducing noise and enhancing the CNN's ability to recognize vascular patterns. Meanwhile, studies [32,38,39] employed LBP to extract retinal micro-textures, proving effective in distinguishing normal tissue from lesions under varying lighting. However, regarding Color Histogram feature extraction, there is a notable scarcity of research specifically applying it to fundus images for DR detection, despite color being a critical indicator of hemorrhages and exudates.
2.4. Research Gap and Contribution
Despite these advancements, a critical gap remains. Most existing hybrid studies rely on standard convolutional architectures without identifying the optimal integration of retina-specific features. Previous works tend to focus on a single feature type (e.g., only Gabor or only LBP) separately and have not systematically compared the impact of different feature combinations—texture (Gabor), morphology/pattern (LBP), and color (Histogram)—on CNN performance specifically for multi-grade DR classification (four severity stages).
Furthermore, many existing hybrid approaches are simplified, lacking adaptive integration mechanisms within the CNN pipeline from the outset. This leaves a research opportunity to explore a robust framework. This study aims to fill this gap by systematically evaluating and integrating these domain-specific features within a Robust Intelligent CNN (RICNN) framework to enhance the accuracy and generalizability of early and comprehensive DR detection systems.
3. Materials and Methods
The proposed research framework, designed to develop a Robust Intelligent CNN Model (RICNN), is illustrated in Figure 1. The methodology is structured into seven systematic stages: Data Collection, Pre-processing, Feature Extraction (hybrid handcrafted feature extraction), SMOTE, Feature Normalization, and RICNN classification modeling with Adam Optimization, and evaluation.
3.1. Dataset and Data Preprocessing
The experimental validation was conducted using the Messidor dataset, a standard benchmark for diabetic retinopathy [40]. The dataset consists of 1,200 fundus images classified into four severity grades: Mild NPDR (n = 546), Moderate NPDR (n = 254), Severe NPDR (n = 247), and Proliferative DR (PDR) (n = 153). The sample of several fundus images is presented in Figure 2.
To ensure computational efficiency and compatibility with the CNN architecture, the fundus images were divided into training (80%) and testing (20%) sets, a ratio chosen based on empirical evidence for optimal generation in medical imaging tasks [41]. The data were then resized from their original resolution (800 x 800 pixels) to 224 x 224 pixel and converted to grayscale [42].
3.2. Feature Extraction Framework
Feature extraction is the core component of the proposed intelligent system, transforming raw pixels into meaningful clinical descriptors. This study implements and systematically compares three extraction strategies, with a specific focus on Gabor Filters as the primary enhancement for the proposed RICNN model.
3.2.1. Gabor Filter (Proposed Intelligent Enhancement)
The Gabor filter serves as the foundation of the RICNN, selected for its ability to mimic the texture discrimination properties of the human visual system. Unlike simple edge detectors, Gabor filters possess optimal localization properties in both spatial and frequency domains. The process begins by converting the fundus image to grayscale, which simplifies processing while retaining structural details. The filter then convolves a Gabor kernel with the input image, generating a feature map that highlights specific orientations and frequencies. This is clinically vital for detecting linear structures such as retinal blood vessels and subtle vascular changes indicative of DR [9,11,33,43,44,45]. Gabor Filter can be defined by the following equation:
3.2.2. Comparative Baselines: LBP and Color Histogram
To rigorously validate the Gabor-based approach, two established methods were implemented as baselines:
Local Binary Pattern (LBP): LBP is used to capture local micro-texture patterns. It works by comparing a central pixel with its neighboring pixels, generating a binary code that describes the local contrast. To extract LBP features, an operator is applied to each pixel in a segment. In the basic mode, the brightness value of each central pixel (g(c)) is compared with the brightness value of its neighboring pixels (g(p)) within a certain neighborhood (e.g., P neighboring pixels within a radius R). If the brightness intensity of a neighboring pixel is greater than or equal to that of the central pixel, then the pixel is assigned a value of 1; otherwise, it is assigned a value of 0. These binary values are placed side by side in sequence and form a binary number, which is considered the LBP code for the central pixel. In fundus images, LBP helps distinguish between smooth normal tissue and irregular pathological spots. Although robust to monotonic lighting changes, LBP lacks the directional sensitivity of Gabor filters [12,46,47,48,49,50]. LBP is expressed by the following equation:
Color Histogram: This method analyzes the chromatic distribution of the image. Unlike the texture-based methods (Gabor and LBP), the Color Histogram extracts feature vectors from the Red, Green, and Blue (RGB) channels. This is particularly relevant for DR as specific colors correlate with pathologies: red-green distributions depict vascularization and hemorrhages, while yellow-white peaks indicate hard exudates [27]. In general, histograms are often normalized by dividing each gray level value by the total number of pixels in the image, represented by the letter n.
Where rk is the normalized histogram value at intensity level k, nk is the number of pixels with intensity level k, and n is the total number of pixels in the image.
Workflow Integration: The specific architectural workflow for each of the three proposed models is detailed in Figure 3.
The pipeline begins with preprocessed fundus images serving as input. Depending on the model scheme, the images undergo distinct feature extraction processes: Gabor filtering for texture orientation, LBP for local pattern contrast, or Color Histogram for chromatic distribution. The extracted features are then flattened into vectors and normalized to ensure consistency in scale. Finally, these processed feature vectors are fed into the Convolutional Neural Network (CNN) classifier, which performs the final multi-grade classification into Mild, Moderate, Severe, or Proliferative DR classes.
3.3. Data Balancing
A critical challenge in this dataset is the significant class imbalance (Figure 4), where severe cases are underrepresented. To build a robust model that does not bias toward the majority class (Mild), we implemented the SMOTE (Synthetic Minority Oversampling Technique) [51]. SMOTE synthesizes new minority instances by interpolating between existing samples, ensuring a balanced distribution across all four classes.
3.4. Feature Normalization
To ensure model stability and efficient convergence, Feature Normalization was performed using the StandardScaler technique. As explicitly illustrated in the workflow (Figure 4), this process adheres to a strict "Fit on Training" strategy. This step transforms the feature vectors, whether derived from the proposed Gabor-based enhancement or the comparative baselines (LBP and Color Histogram), into a standard normal distribution with a mean of 0 and a standard deviation of 1. Crucially, the scaling parameters were computed solely from the training dataset and subsequently applied to the validation and test sets. This methodology prevents data leakage, ensuring that the model's evaluation remains unbiased, while simultaneously preventing variables with larger magnitudes from dominating the learning process and accelerating optimization [52].
3.5. Modeling Classifier and Optimizer (RICNN Architecture and Optimization).
The core of the proposed Robust Intelligent CNN Model (RICNN) is a deep learning architecture explicitly designed to process the texture-enhanced feature maps. The network leverages local receptive fields and weight sharing to ensure high sensitivity to local pathological patterns (such as microaneurysms) while maintaining translation invariance. The architecture comprises sequential convolutional layers for hierarchical feature extraction, Rectified Linear Unit (ReLU) activation functions to introduce non-linearity, and pooling layers to provide partial invariance to shifts and scale deviations [42].
To ensure efficient convergence and model stability, the RICNN is trained end-to-end using the Adam (Adaptive Moment Estimation) Optimizer. Adam was specifically selected for its ability to adapt learning rates for individual parameters based on first and second-moment estimates, which is critical for optimizing complex hybrid features where standard SGD might struggle [53,54,55]. Furthermore, to enhance generalization and prevent overfitting on the imbalanced medical dataset, the training pipeline rigorously incorporates Batch Normalization after convolution operations, Dropout within the fully connected layers, and a dynamic learning rate schedule based on validation performance [56].
3.6. Performance Evaluation
To rigorously assess the diagnostic capability of the proposed RICNN and comparative models, two primary evaluation protocols were established: the Confusion Matrix analysis and the Receiver Operating Characteristic (ROC) curve assessment.
3.6.1. Confusion Matrix and Clinical Metrics
The confusion matrix serves as the foundational tool for evaluating the classification model, mapping the predicted labels against the ground truth. From the values of True Positive (TP), True Negative (TN), False Positive (FP), and False Negative (FN), we derived four key clinical metrics to provide a comprehensive performance overview:
- Accuracy: Measures the overall correctness of the model across all grades;
- Precision: Indicates the reliability of positive predictions, crucial for minimizing false alarms;
- Recall (Sensitivity): Measures the model's ability to correctly identify positive cases. In the context of DR screening, Recall is prioritized to minimize False Negatives (missed diagnoses), which could lead to irreversible blindness if untreated;
- F1-Score: The harmonic mean of Precision and Recall, providing a balanced metric for cases with uneven class distributions.
3.6.2. Area Under the ROC Curve (AUC-ROC)
To evaluate the model's discriminative ability across different decision thresholds, we utilized the Area Under the Receiver Operating Characteristic (AUC-ROC) curve. The ROC represents the trade-off between the True Positive Rate (Sensitivity) and the False Positive Rate (1-specificity). The AUC value quantifies the degree of separability between classes; a higher AUC (approaching 1.0) indicates the model's superior capability to distinguish between patients with varying degrees of Diabetic Retinopathy severity (e.g., distinguishing Moderate from Severe cases), which is essential for accurate triaging.
4. Results and Discussion
4.1. Performance Evaluation of the Proposed RICNN (Gabor-Enhanced) (Model 1)
The primary objective of this experimental phase was to evaluate the diagnostic efficacy of the Robust Intelligent CNN Model (RICNN). The foundational component of this intelligent system is the integration of Gabor filters, chosen for their optimal localization properties in both spatial and frequency domains. Unlike standard preprocessing, the Gabor enhancement acts as a "texture-aware" filter, explicitly extracting fine retinal textures and suppressing residual noise to aid the CNN in detecting subtle pathologies [20]. The experimental flow of the Gabor filter integration is presented in Figure 5.
The effectiveness of this feature enhancement is visually demonstrated in Figure 6. The figure illustrates how applying Gabor filters with varying frequencies (f) and orientations (θ) successfully highlights the complex vascular architecture—ranging from major trunks to fine capillaries—which provides the neural network with critical prior knowledge for classification.
Figure 6 illustrates the efficacy of combining Gabor filters with varying frequencies and orientations to enable the comprehensive extraction of retinal blood vessel features. Relying on a single orientation would limit visibility to vessels aligned in only one specific direction; however, by employing multiple orientations, the model captures vascular structures across all trajectories. Complementing this, the variation in frequency (f) determines the size of the sine wave within the Gabor kernel, directly governing the granularity of the captured texture.
A high f-value facilitates the detection of fine details, such as small capillaries and micro-textures, whereas a small f-value is more sensitive to coarse structures like main vascular trunks. Simultaneously, the orientation parameter (θ, theta) set at 0°, 30°, 45°, 60°, 90° controls the directionality of feature highlighting. Specifically, θ = 0° enhances horizontal vessels with high contrast, θ = 90° emphasizes vertical structures, and intermediate angles (30°, 45°, 60°) effectively highlight oblique or diagonal vascular paths [11]. Collectively, this multi-scale and multi-orientation approach produces feature maps that vividly highlight the entire retinal vascular network, providing the CNN with robust prior knowledge.
Following the feature enhancement process, rigorous data preparation was executed. Consistent with the workflow in Figure 3, the feature vectors were normalized using the Standard Scaler, where the scaling parameters were fitted solely on the training data and then applied to the test set to maintain experimental validity. Subsequently, the RICNN classifier was trained using the Adam Optimizer to facilitate efficient weight convergence. The comprehensive classification performance is detailed in Table 1 and visualized in Figure 7 through the confusion matrix.
The quantitative evaluation demonstrates the robustness of the proposed model. As shown in Table 1, the RICNN achieved an overall Accuracy of 89%, indicating high reliability in distinguishing between the four severity grades of diabetic retinopathy. Beyond accuracy, the model exhibited a strong balance between sensitivity and specificity, recording an average Precision of 88.75%, a Recall of 89%, and an F1-score of 89%. Notably, both the macro average and weighted average for these metrics aligned at 89%, confirming that the SMOTE balancing technique successfully mitigated the bias typically found in imbalanced medical datasets. This consistency suggests that the RICNN (Gabor-Enhanced) does not favor the majority class but recognizes all categories—from Mild NPDR to Proliferative DR—with equal effectiveness.
Complementing the discrete classification metrics presented in Table 1, the model's discriminative ability was rigorously evaluated using the Receiver Operating Characteristic (ROC) curve analysis. This evaluation is critical in medical diagnostics as it illustrates the trade-off between the True Positive Rate (Sensitivity) and the False Positive Rate (1-specificity) across all possible decision thresholds. By analyzing the Area Under the Curve (AUC), we can quantify the model's robustness in distinguishing between adjacent severity grades (e.g., separating Moderate from Severe cases), which is essential for accurate patient triaging. The resulting ROC curves for the proposed RICNN, which visualize this diagnostic performance across the four severity classes, are depicted in Figure 8.
The ROC curves depicted in Figure 8 quantitatively validate the RICNN's superior discriminative capability across all severity grades. Unlike basic classifiers that often struggle with the subtle boundaries between progressive stages, the RICNN achieved near-perfect separability. Specifically, the model recorded AUC scores of 93% for Mild, 100% for Moderate, 97% for Severe, and 99% for Proliferative DR.
These results are clinically significant. The exceptionally high AUC values for the advanced stages (97% for Severe and 99% for PDR) indicate that the model is highly robust in distinguishing critical cases that require immediate medical attention from less severe ones. This confirms that the integration of Gabor-based texture features effectively expands the decision margins between classes, ensuring an accurate and reliable foundation for automated diagnostic systems in real-world clinical settings.
4.2. Comparative Analysis with Baselines
To rigorously validate the superiority of the proposed RICNN, this study conducted a detailed benchmarking against two established feature extraction methods: Local Binary Pattern (LBP) and Color Histogram. To ensure a fair and consistent comparison, both baseline models strictly adhered to the identical four-stage workflow illustrated in Figure 3. This includes the application of Standard Scaler normalization, fitted exclusively on the training data to prevent data leakage, followed by training the CNN classifier using the Adam Optimizer with hyperparameters identical to those of the primary RICNN framework.
4.2.1. Performance Evaluation of LBP-CNN (Model 2)
The second experimental phase evaluated the performance of the CNN model integrated with Local Binary Pattern (LBP). LBP was employed as a texture descriptor to encode local contrast by comparing the intensity value of a central pixel with its circular neighborhood. To optimize feature extraction, experiments were conducted using various radius parameters (ranging from 1 to 5) and different LBP method configurations, including default, rotation-invariant (ror), uniform patterns, and non-rotation-invariant uniform (nri_uniform). This process generates a binary representation that effectively describes the micro-texture of the retina. The visual output of these LBP transformations is presented in Figure 9.
The resulting LBP images are quantified into feature vectors representing the distribution of texture patterns, as visualized in the LBP Histogram (Figure 10). The histogram consists of representative bins indicating the frequency of detected patterns.
A detailed analysis of Figure 10 reveals that the most dominant feature value is 8. This peak indicates the high prevalence of texture patterns where neighbors are brighter than the center pixel, which typically corresponds to high-contrast areas such as blood vessel boundaries and bright lesions (exudates). Other values, such as 4, also appear frequently, representing moderate edges, while low values (0 to 2) are relatively rare. These statistical features confirm that the fundus images contain complex texture information that serves as the input for the CNN classifier.
Quantitative Performance of LBP-CNN Following the training phase, the LBP-CNN model was evaluated on the test set. The comprehensive performance metrics are detailed in Table 2, and the Confusion Matrix is presented in Figure 11.
The results indicate that the LBP-CNN achieved an overall Accuracy of 86%, with a Precision of 87.25%, a Recall of 86.50%, and an F1-score of 86.75%. While these scores demonstrate good classification capability, they are notably lower than the proposed RICNN (89%). The Confusion Matrix reveals a specific limitation: while the model performed reliably for the Moderate class (Recall 91%), it showed reduced sensitivity for the Proliferative DR class (Recall 80%), misclassifying several critical advanced cases as lower severity grades. This suggests that while LBP is robust for detecting localized lesions, it lacks the directional sensitivity required to fully trace the complex vascular proliferation characteristic of advanced DR.
Discriminative Ability (LBP-CNN) The discriminative power of Model 2 is further illustrated by the ROC curves in Figure 12.
The model maintained robust performance with AUC values ranging from 94% to 98% across the four classes. Specifically, the Moderate and Severe classes achieved an AUC of 98%, followed by Proliferative DR at 95% and Mild at 94%. Although these values indicate strong probabilistic classification capabilities, the discriminative power for the Proliferative stage (95%) was notably lower than that of the RICNN (99%), confirming that the lack of global directional filtering impacts the detection of advanced vascular anomalies.
4.2.2. Performance Evaluation Color Histogram-CNN (Model 3)
The third experimental phase assessed the efficacy of spectral features using the Color Histogram method. Unlike the texture-based approaches (Gabor and LBP), this method explicitly analyzes the chromatic distribution of the retina across the Red, Green, and Blue (RGB) channels. By quantizing pixel intensities into 8 bins per channel, the model generates a 24-dimensional feature vector intended to capture color-specific biomarkers, such as the deep red of hemorrhages or the yellowish-white hue of hard exudates.
The resulting spectral distributions are visualized in Figure 13. A detailed analysis of the histograms reveals distinct characteristics for each channel.
The Red channel exhibits a broad intensity distribution with dual peaks, reflecting the substantial variation in vascularization and hemorrhages that are essential for DR diagnosis. The Green channel shows a more concentrated intensity profile, often used to contrast vessels against the fundus background. Conversely, the Blue channel displays a sharp peak at low intensities, confirming that blue spectral information is less dominant in retinal imaging. These color signatures serve as the primary input for the CNN classifier.
Upon evaluating the model on the independent test dataset, the quantitative results presented in Table 3 and the Confusion Matrix in Figure 14 indicate competitive performance. The Color Histogram-CNN achieved an overall Accuracy of 87%, with a Precision of 87.25%, a Recall of 86.75%, and F1-score of 87%.
A closer inspection of the class-wise performance reveals specific strengths and limitations of spectral analysis. The model demonstrated exceptional sensitivity for the Moderate NPDR class, achieving a Recall of 96%. This suggests that color features are highly effective at detecting the distinct reddish hemorrhages and yellowish exudates typical of the moderate stage. However, for the Proliferative DR class, the Recall dropped to 88%, which is notably lower than the 91% achieved by the proposed RICNN. This decline indicates that while color histograms effectively flag discolored lesions, they lack the spatial and morphological context required to accurately trace the complex neovascularization (new abnormal blood vessel formation) that characterizes advanced proliferation.
The discriminative capability of Model 3 is further elucidated by the ROC curves in Figure 15.
Based on Figure 15, the model exhibited excellent separability, particularly for the Moderate class, achieving a perfect AUC of 100%. This reinforces the finding that spectral distinctiveness is maximized at the moderate stage, where color contrast is most vivid. The AUC values for other classes remained high—96% for Mild, 98% for Severe, and 97% for Proliferative DR. However, similar to the LBP model, the discriminative power for the most critical advanced stages did not surpass the performance of the RICNN (99%), confirming that relying solely on color distribution without texture orientation limits the diagnostic ceiling for complex cases.
4.3. Discussion
Comparative Analysis of Feature Extraction Strategies. This study aimed to determine the optimal feature extraction strategy for the automated classification of diabetic retinopathy severity. The summary of performance metrics across the three experimental models is presented in Table 4. A comparative analysis of these results establishes a clear performance hierarchy: the proposed RICNN (Robust Intelligent CNN) or Model 1 (Gabor+CNN) achieved the highest overall efficacy with 89% Accuracy and 89% F1-score, followed by the Color Histogram-CNN (Model 3) at 87%, and the LBP-CNN (Model 2) at 86%.
Biological Justification for Gabor Superiority The superiority of the RICNN (Model 1) can be directly attributed to the inherent biological characteristics of the retina. Diabetic retinopathy is fundamentally a vascular disease characterized by structural changes, including vessel dilation, tortuosity, and neovascularization. The Gabor filter, with its tunable orientation (θ) and frequency (f) parameters, acts as a "directional edge detector" mathematically analogous to the visual processing in the mammalian cortex. This allows the RICNN to explicitly capture the linear and directional nature of blood vessels. As evidenced in the ROC-AUC analysis (Table 5), Model 1 achieved exceptional discriminative power for the most critical advanced stages: Severe (97%) and Proliferative DR (99%). This confirms that texture-orientation features are crucial for identifying the chaotic vascular growth that defines advanced DR, a capability that standard texture or color features lack.
Authors should discuss the results and how they can be interpreted in light of previous studies and the working hypotheses. The findings and their implications should be discussed in the broadest context possible. Future research directions may also be highlighted.
Analysis of Baseline Limitations. In contrast, Model 3 (Color Histogram) demonstrated a unique strength in the Moderate NPDR class, achieving the highest AUC of 100% (Table 5). This is likely because the Moderate stage is clinically defined by the presence of distinct color-based lesions—red hemorrhages and yellow hard exudates—which are easily captured by spectral analysis. However, its discriminative power notably declined in the Severe and Proliferative stages (AUC 95-98%). This suggests that while spectral features effectively flag discolored lesions, they are insufficient for detecting structural anomalies (like new transparent vessels) that do not possess a strong color contrast against the background.
Similarly, Model 2 (LBP) provided consistent but lower performance (Accuracy 86%). While LBP is effective for analyzing localized micro-textures, its rotation-invariant nature lacks the global directional sensitivity required to trace long vascular paths. Consequently, it struggled to distinguish the subtle transitions in vessel complexity between Severe NPDR and Proliferative DR, resulting in the lowest sensitivity for advanced cases.
Clinical Implications The comparison highlights a critical clinical trade-off. While Model 3 excels at detecting moderate lesions based on color biomarkers, RICNN or Model 1 (Gabor+CNN) offers the most robust safety net for preventing blindness. Its capability to maintain near-perfect classification for Proliferative DR (99% AUC) makes it the most viable candidate for a clinical decision support system, where the priority is to ensure that advanced, sight-threatening cases are never missed.
5. Conclusions
This study rigorously evaluated the efficacy of three distinct feature extraction strategies integrated with Convolutional Neural Networks (CNNs) for the multi-grade classification of diabetic retinopathy. The experimental results conclusively demonstrate that the proposed RICNN or Model 1 (Gabor+CNN) achieves superior performance compared to the Local Binary Pattern (Model 2) and Color Histogram (Model 3) baselines. Specifically, the RICNN attained an overall Accuracy of 89%, F1-Score of 89%, and a remarkable AUC of 99% for Proliferative DR. These metrics confirm that Gabor-based feature extraction effectively captures the directional vascular biomarkers—such as neovascularization and vessel tortuosity—that are critical for identifying advanced pathology.
While the Color Histogram-CNN (Model 3) proved effective for detecting moderate-stage lesions (hemorrhages and exudates) with high sensitivity due to their distinct chromatic signatures, it faltered in recognizing the structural vascular complexities of the proliferative stage. Similarly, the LBP-CNN (Model 2) demonstrated consistent but limited performance due to a lack of global directional sensitivity required to trace extended vascular anomalies. These findings underscore that relying solely on color or micro-texture is insufficient for comprehensive DR grading; structural edge-orientation analysis is essential.
From a clinical perspective, the RICNN's high sensitivity to Severe and Proliferative DR positions it as a robust safety net for preventing irreversible blindness. The integration of SMOTE balancing and Adam optimization further ensures that the model remains unbiased and reliable across all severity grades. Future research should explore the hybridization of these feature sets—for instance, combining Gabor structure with Color spectral data—and validate the framework on multi-center datasets to further enhance its generalizability for real-world computer-aided diagnosis (CAD) systems.
Author Contributions
Conceptualization, A.M.; methodology, A.M.; software, A.M.; validation, A.M., M., P. and M.A.S; formal analysis, A.M., M., P. and M.A.S; investigation, A.M.; resources, A.M.; data curation, A.M.; writing—original draft preparation, A.M., M., P. and M.A.S; writing—review and editing, A.M., M., P. and M.A.S; visualization, A.M.; supervision, M., P. and M.A.S; project administration, A.M.; funding acquisition, A.M. All authors have read and agreed to the published version of the manuscript.
Funding
This research did not receive any specific grant from funding agencies in the public, commercial, or not-for-profit sectors.
Institutional Review Board Statement
Not applicable.
Informed Consent Statement
Not applicable.
Data Availability Statement
The data presented in this study are available from the corresponding author upon reasonable request.
Acknowledgments
The author(s) received no financial support for the research, authorship, and/or publication of this article.
Conflicts of Interest
The authors declare no conflict of interest.
References
- WHO Diabetic Retinopathy Screening : A Short Guide; 2021; ISBN 9789289055321.
- Shakibania, H.; Raoufi, S.; Pourafkham, B.; Khotanlou, H.; Mansoorizadeh, M. Dual Branch Deep Learning Network for Detection and Stage Grading of Diabetic Retinopathy. Biomed. Signal Process. Control 2024, 93, 106168. [CrossRef]
- Zhou, J.; Chen, B. Retinal Cell Damage in Diabetic Retinopathy. Cells 2023, 12, 1342. [CrossRef]
- Fang, L.; Qiao, H. Diabetic Retinopathy Classification Using a Novel DAG Network Based on Multi-Feature of Fundus Images. Biomed. Signal Process. Control 2022, 77, 103810. [CrossRef]
- Dumitrescu, O.-M.; Zemba, M.; Brănișteanu, D.C.; Pîrvulescu, R.A.; Radu, M.; Stanca, H.T. Fundus Autofluorescence in Diabetic Retinopathy. J. Pers. Med. 2024, 14, 793. [CrossRef]
- Shen, Z.; Shen, H.; He, F. A Hybrid Deep Learning-Based Model for Enhanced Feature Representation in Image Retrieval Systems. Egypt. Informatics J. 2025, 31, 100717. [CrossRef]
- Dip, S.R.; Meena, H.K. Enhanced Brain Tumor Identification Using Graph Fourier Transform. Comput. Electr. Eng. 2025, 127, 110575. [CrossRef]
- Yin, H.; Chen, Y.; Xiong, J.; Xia, R.; Xie, J.; Yang, K. An Improved Local Binary Pattern Method for Pollen Image Classification and Recognition. Comput. Electr. Eng. 2021, 90, 106983. [CrossRef]
- Zoubir, H.; Rguig, M.; El Aroussi, M.; Saadane, R.; Chehri, A. Pixel-Level Concrete Bridge Crack Detection Using Convolutional Neural Networks, Gabor Filters, and Attention Mechanisms. Eng. Struct. 2024, 314, 118343. [CrossRef]
- Aknan, M.; Chandra, S.; Gupta, S.; Cotrina Aliaga, J.C.; Mohapatra, S. A Diabetic Retinopathy Classification and Analysis Towards the Development of a Computer-Aided Medical Decision Support System. SN Comput. Sci. 2023, 4, 1–12. [CrossRef]
- Mulyani, A.; Muljono; Purwanto; Soeleman, M.A. Filter Gabor and SMOTE Method-Based Convolutional Neural Network for Diabetic Retinopathy Classification. 2024. [CrossRef]
- Makmur, N.M.; Kwan, F.; Rana, A.D.; Kurniadi, F.I. Comparing Local Binary Pattern and Gray Level Co-Occurrence Matrix for Feature Extraction in Diabetic Retinopathy Classification. Procedia Comput. Sci. 2023, 227, 355–363. [CrossRef]
- Hu, T.; Yang, B.; Guo, J.; Zhang, W.; Liu, H.; Wang, N.; Li, H. A Fundus Image Classification Framework for Learning with Noisy Labels. Comput. Med. Imaging Graph. 2023, 108, 102278. [CrossRef]
- Wulandari, S.A.Y.U.; Azies, H.A.L.; Naufal, M.; Prasetyanto, W.A.D.I. Breaking Boundaries in Diagnosis : Non-Invasive Anemia Detection Empowered by AI. IEEE Access 2024, 12, 9292–9307. [CrossRef]
- Mulyani, A.; Muljono; Purwanto; Soeleman, M.A. Fundus Image Classification for Detecting Diabetic Retinopathy Using Convolutional Neural Network with Adam Optimizer. 2024. [CrossRef]
- Das, S.; Saha, S.K. Diabetic Retinopathy Detection and Classification Using CNN Tuned by Genetic Algorithm. Multimed. Tools Appl. 2022, 81, 8007–8020. [CrossRef]
- Balasubramanian, K.; Ramya, K.; Gayathri Devi, K. Improved Swarm Optimization of Deep Features for Glaucoma Classification Using SEGSO and VGGNet. Biomed. Signal Process. Control 2022, 77, 103845. [CrossRef]
- Sunkari, S.; Sangam, A.; Venkata Sreeram, P.; Suchetha, M.; Raman, R.; Rajalakshmi, R.; Tamilselvi, S. A Refined ResNet18 Architecture with Swish Activation Function for Diabetic Retinopathy Classification. Biomed. Signal Process. Control 2024, 88, 105630. [CrossRef]
- Rawat, A.; Kumar, R. A Hybrid DL Architecture for Improved Generalizability with Self-Adaptive Jaya Optimizer for Diabetic Retinopathy. Procedia Comput. Sci. 2024, 235, 2090–2100. [CrossRef]
- Dwaik, A.; Belkhouche, Y. Journal of Information Security and Applications Enhancing the Performance of Convolutional Neural Network Image-Based Steganalysis in Spatial Domain Using Spatial Rich Model and 2D Gabor Filters. J. Inf. Secur. Appl. 2024, 85, 103864. [CrossRef]
- Moghbeli, M.; Mohanna, F.; Jafari, P. Static Hand Gesture Recognition in Sign Language Based on Convolutional Neural Network with Feature Extraction Method Using ORB Descriptor and Gabor Filter. Expert Syst. Appl. 2023, 211, 118559. [CrossRef]
- Yao, X.; Song, T. Rotation Invariant Gabor Convolutional Neural Network for Image Classification. Pattern Recognit. Lett. 2022, 162, 22–30. [CrossRef]
- Rastiveis, H.; Teymoor, S.; Chen, Z.; Li, J. International Journal of Applied Earth Observation and Geoinformation Seismic Urban Damage Map Generation Based on Satellite Images and Gabor Convolutional Neural Networks. Int. J. Appl. Earth Obs. Geoinf. 2023, 122, 103450. [CrossRef]
- Iqbal, S.; Qureshi, A.N.; Mustafa, G. Hybridization of CNN with LBP for Classification of Melanoma Images. 2022. [CrossRef]
- Kumar, J.; Pandey, V.; Tiwari, R.K. Optimizing Oral Cancer Detection: A Hybrid Feature Fusion Using Local Binary Pattern and CNN. Procedia Comput. Sci. 2025, 258, 476–486. [CrossRef]
- Kaya, Y.; Kuncan, M.; Akcan, E.; Kaplan, K. An Efficient Approach Based on a Novel 1D-LBP for the Detection of Bearing Failures with a Hybrid Deep Learning Method. Appl. Soft Comput. 2024, 155, 111438. [CrossRef]
- Rasel, M.A.; Kareem, S.A.; Obaidellah, U. Integrating Color Histogram Analysis and Convolutional Neural Networks for Skin Lesion Classification. Comput. Biol. Med. 2024, 183, 109250. [CrossRef]
- Deepak, G.D.; Bhat, S.K. Deep Learning-Based CNN for Multiclassification of Ocular Diseases Using Transfer Learning. Comput. Methods Biomech. Biomed. Eng. Imaging Vis. 2024, 12. [CrossRef]
- Krishna, M.V. Detection and Diagnosis of Diabetic Retinopathy Using Transfer Learning Approach. 2023, 16. [CrossRef]
- Ramya, J.; Rajakumar, M.P.; Maheswari, B.U. Deep CNN with Hybrid Binary Local Search and Particle Swarm Optimizer for Exudates Classification from Fundus Images. J. Digit. Imaging 2022, 35, 56–67. [CrossRef]
- Hemanth, D.J.; Deperlioglu, O.; Kose, U. An Enhanced Diabetic Retinopathy Detection and Classification Approach Using Deep Convolutional Neural Network. Neural Comput. Appl. 2020, 32, 707–721. [CrossRef]
- Ishtiaq, U.; Abdullah, E.R.M.F.; Ishtiaque, Z. A Hybrid Technique for Diabetic Retinopathy Detection Based on Ensemble-Optimized CNN and Texture Features. Diagnostics 2023, 13, 1816. [CrossRef]
- Wang, J.; Wang, Q.; Li, C.; Guo, S.; Xu, X.; Yang, S. Gabor CNN-Based Improvement of Tunnel Seismic Migration Imaging and Field Application with Domain Adaptation Assistance. Tunn. Undergr. Sp. Technol. Inc. Trenchless Technol. Res. 2025, 163, 106675. [CrossRef]
- Chen, M.; Yu, L.; Zhi, C.; Sun, R.; Zhu, S.; Gao, Z.; Ke, Z.; Zhu, M.; Zhang, Y. Improved Faster R-CNN for Fabric Defect Detection Based on Gabor Filter with Genetic Algorithm Optimization. Comput. Ind. 2022, 134, 103551. [CrossRef]
- Changbo, H.; Yuqian, L.; Xiang, C.; Jing, Z. Automatic Modulation Classification Using KELM with Joint Features of CNN and LBP. Phys. Commun. 2021, 45, 101259. [CrossRef]
- Anu, J.; Kumar, C.S.; Sureshkumar, S. Tuna Classification Using Super Learner Ensemble of Region-Based CNN-Grouped 2D-LBP Models. Inf. Process. Agric. 2022, 9, 68–79. [CrossRef]
- Khayyat, M.M.; Zamzami, N.; Zhang, L.; Nappi, M.; Umer, M. Journal of Information Security and Applications Fuzzy-CNN : Improving Personal Human Identification Based on IRIS Recognition Using LBP Features. J. Inf. Secur. Appl. 2024, 83, 103761. [CrossRef]
- Adriman, R.; Muchtar, K.; Maulina, N. Performance Evaluation of Binary Classification of Diabetic Retinopathy through Deep Learning Techniques Using Texture Feature. Procedia Comput. Sci. 2021, 179, 88–94. [CrossRef]
- Sagvekar, V.; Joshi, M.; Ramakrishnan, M.; Dudani, A. Hybrid Hunter-Prey Ladybug Beetle Optimization Enabled Deep Learning for Diabetic Retinopathy Classification. Biomed. Signal Process. Control 2024, 95, 106346. [CrossRef]
- Nithyeswari, C.; Karthikeyan, G. An Effective Heuristic Optimizer with Deep Learning-Assisted Diabetic Retinopathy Diagnosis on Retinal Fundus Images. Eng. Technol. Appl. Sci. Res. 2024, 14, 14308–14312. [CrossRef]
- Chinmayi, H.K.; Flynn, K.C.; Baath, G.S.; Gowda, P.; Northup, B.; Ashworth, A. Monitoring Legume Nutrition with Machine Learning : The Impact of Splits in Training and Testing Data. Appl. Soft Comput. 2025, 176, 113186. [CrossRef]
- Das, D.; Biswas, S.K.; Bandyopadhyay, S. Detection of Diabetic Retinopathy Using Convolutional Neural Networks for Feature Extraction and Classification (DRFEC). Multimed. Tools Appl. 2023, 82, 29943–30001. [CrossRef]
- Sindhusaranya, B.; Geetha, M.R. Retinal Blood Vessel Segmentation Using Root Guided Decision Tree Assisted Enhanced Fuzzy C-Mean Clustering for Disease Identification. Biomed. Signal Process. Control 2023, 82, 104525. [CrossRef]
- Zubair, M.; Umair, M.; Ali Naqvi, R.; Hussain, D.; Owais, M.; Werghi, N. A Comprehensive Computer-Aided System for an Early-Stage Diagnosis and Classification of Diabetic Macular Edema. J. King Saud Univ. - Comput. Inf. Sci. 2023, 35, 101719. [CrossRef]
- Yang, C.; Tang, Y.; Peng, H.; Luo, X. RAGE-Net: Enhanced Retinal Vessel Segmentation U-Shaped Network Using Gabor Convolution. Digit. Signal Process. 2024, 104643. [CrossRef]
- Hu, S.; Li, J.; Fan, H.; Lan, S.; Pan, Z. Scale and Pattern Adaptive Local Binary Pattern for Texture Classification. Expert Syst. Appl. 2024, 240, 122403. [CrossRef]
- Galshetwar, G.M.; Waghmare, L.M.; Gonde, A.B. ScienceDirect ScienceDirect Edgy Salient Local Binary Patterns in Inter-Plane Relationship for Image Retrieval in Diabetic Retinopathy. Procedia Comput. Sci. 2017, 115, 440–447. [CrossRef]
- Geetha Pavani, P.; Biswal, B.; Gandhi, T.K. Simultaneous Multiclass Retinal Lesion Segmentation Using Fully Automated RILBP-YNet in Diabetic Retinopathy. Biomed. Signal Process. Control 2023, 86, 105205. [CrossRef]
- Liao, J.; Lam, H.-K.; Jia, G.; Gulati, S.; Bernth, J.; Poliyivets, D.; Xu, Y.; Liu, H.; Hayee, B. A Case Study on Computer-Aided Diagnosis of Nonerosive Reflux Disease Using Deep Learning Techniques. Neurocomputing 2021, 445, 149–166. [CrossRef]
- Aytaç Korkmaz, S.; Binol, H. Classification of Molecular Structure Images by Using ANN, RF, LBP, HOG, and Size Reduction Methods for Early Stomach Cancer Detection. J. Mol. Struct. 2018, 1156, 255–263. [CrossRef]
- Badar, D.; Chengliang, W.; Ashraf, M.; Abdulaziz, D.; Alsubai, S.; Medaglia, C.; Innab, N.; Umer, M. Automated Dual CNN-Based Feature Extraction with SMOTE for Imbalanced Diabetic Retinopathy Classification. 2025, 159.
- Elkholy, M.; Boureima, A.; Kim, J.; Aziz, M. Data-Driven Modeling and Prediction of PEM Fuel Cell Voltage Response to Load Transients for Energy Applications. Energy 2025, 335, 138047. [CrossRef]
- Zhang, C.; Lei, T.; Chen, P. Diabetic Retinopathy Grading by a Source-Free Transfer Learning Approach. Biomed. Signal Process. Control 2022, 73, 103423. [CrossRef]
- Sivapriya, G.; Manjula Devi, R.; Keerthika, P.; Praveen, V. Automated Diagnostic Classification of Diabetic Retinopathy with Microvascular Structure of Fundus Images Using Deep Learning Method. Biomed. Signal Process. Control 2024, 88, 105616. [CrossRef]
- Kallel, F.; Echtioui, A. Retinal Fundus Image Classification for Diabetic Retinopathy Using Transfer Learning Technique. Signal, Image Video Process. 2023. [CrossRef]
- Azam, M.; Raiaan, K.; Fatema, K.; Khan, I.U.; Azam, S.; Rashid, R.U.; Mukta, S.H.; Jonkman, M.; Boer, F. De A Lightweight Robust Deep Learning Model Gained High Accuracy in Classifying a Wide Range of Diabetic Retinopathy Images. IEEE Access 2023, 11, 42361–42388. [CrossRef]
Figure 1.
Research workflow.
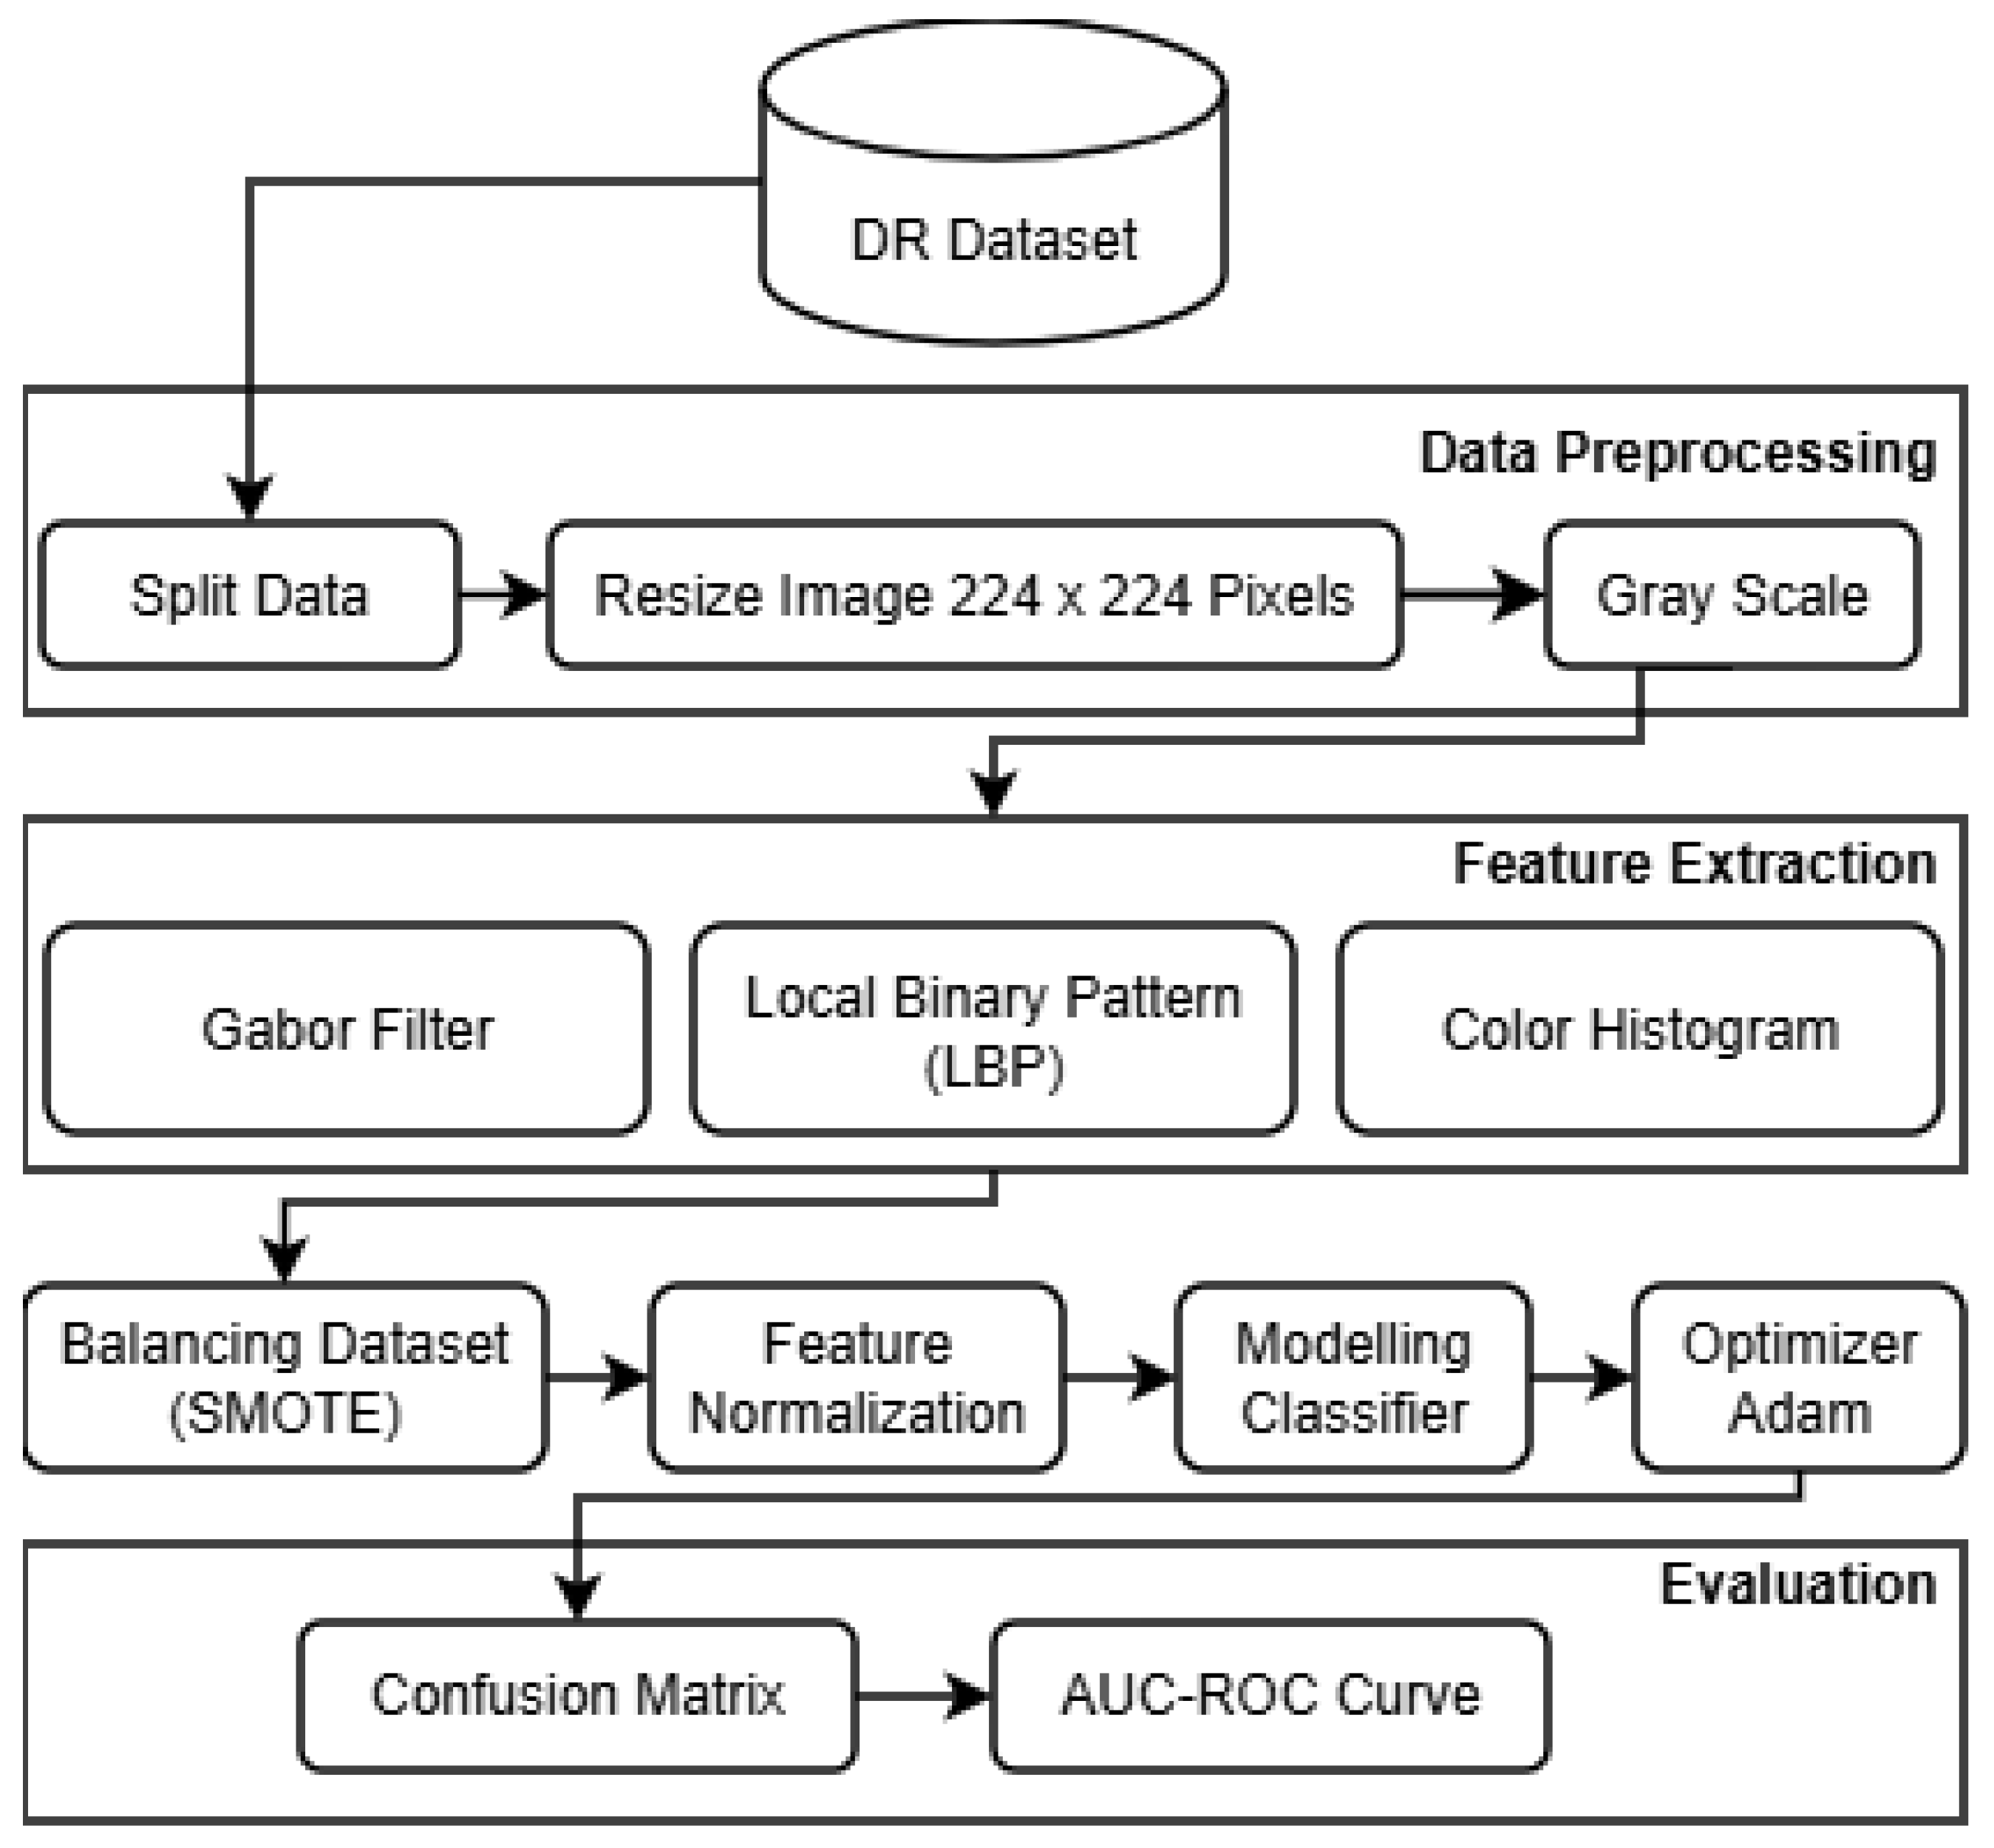
Figure 2.
Fundus image of diabetic retinopathy.
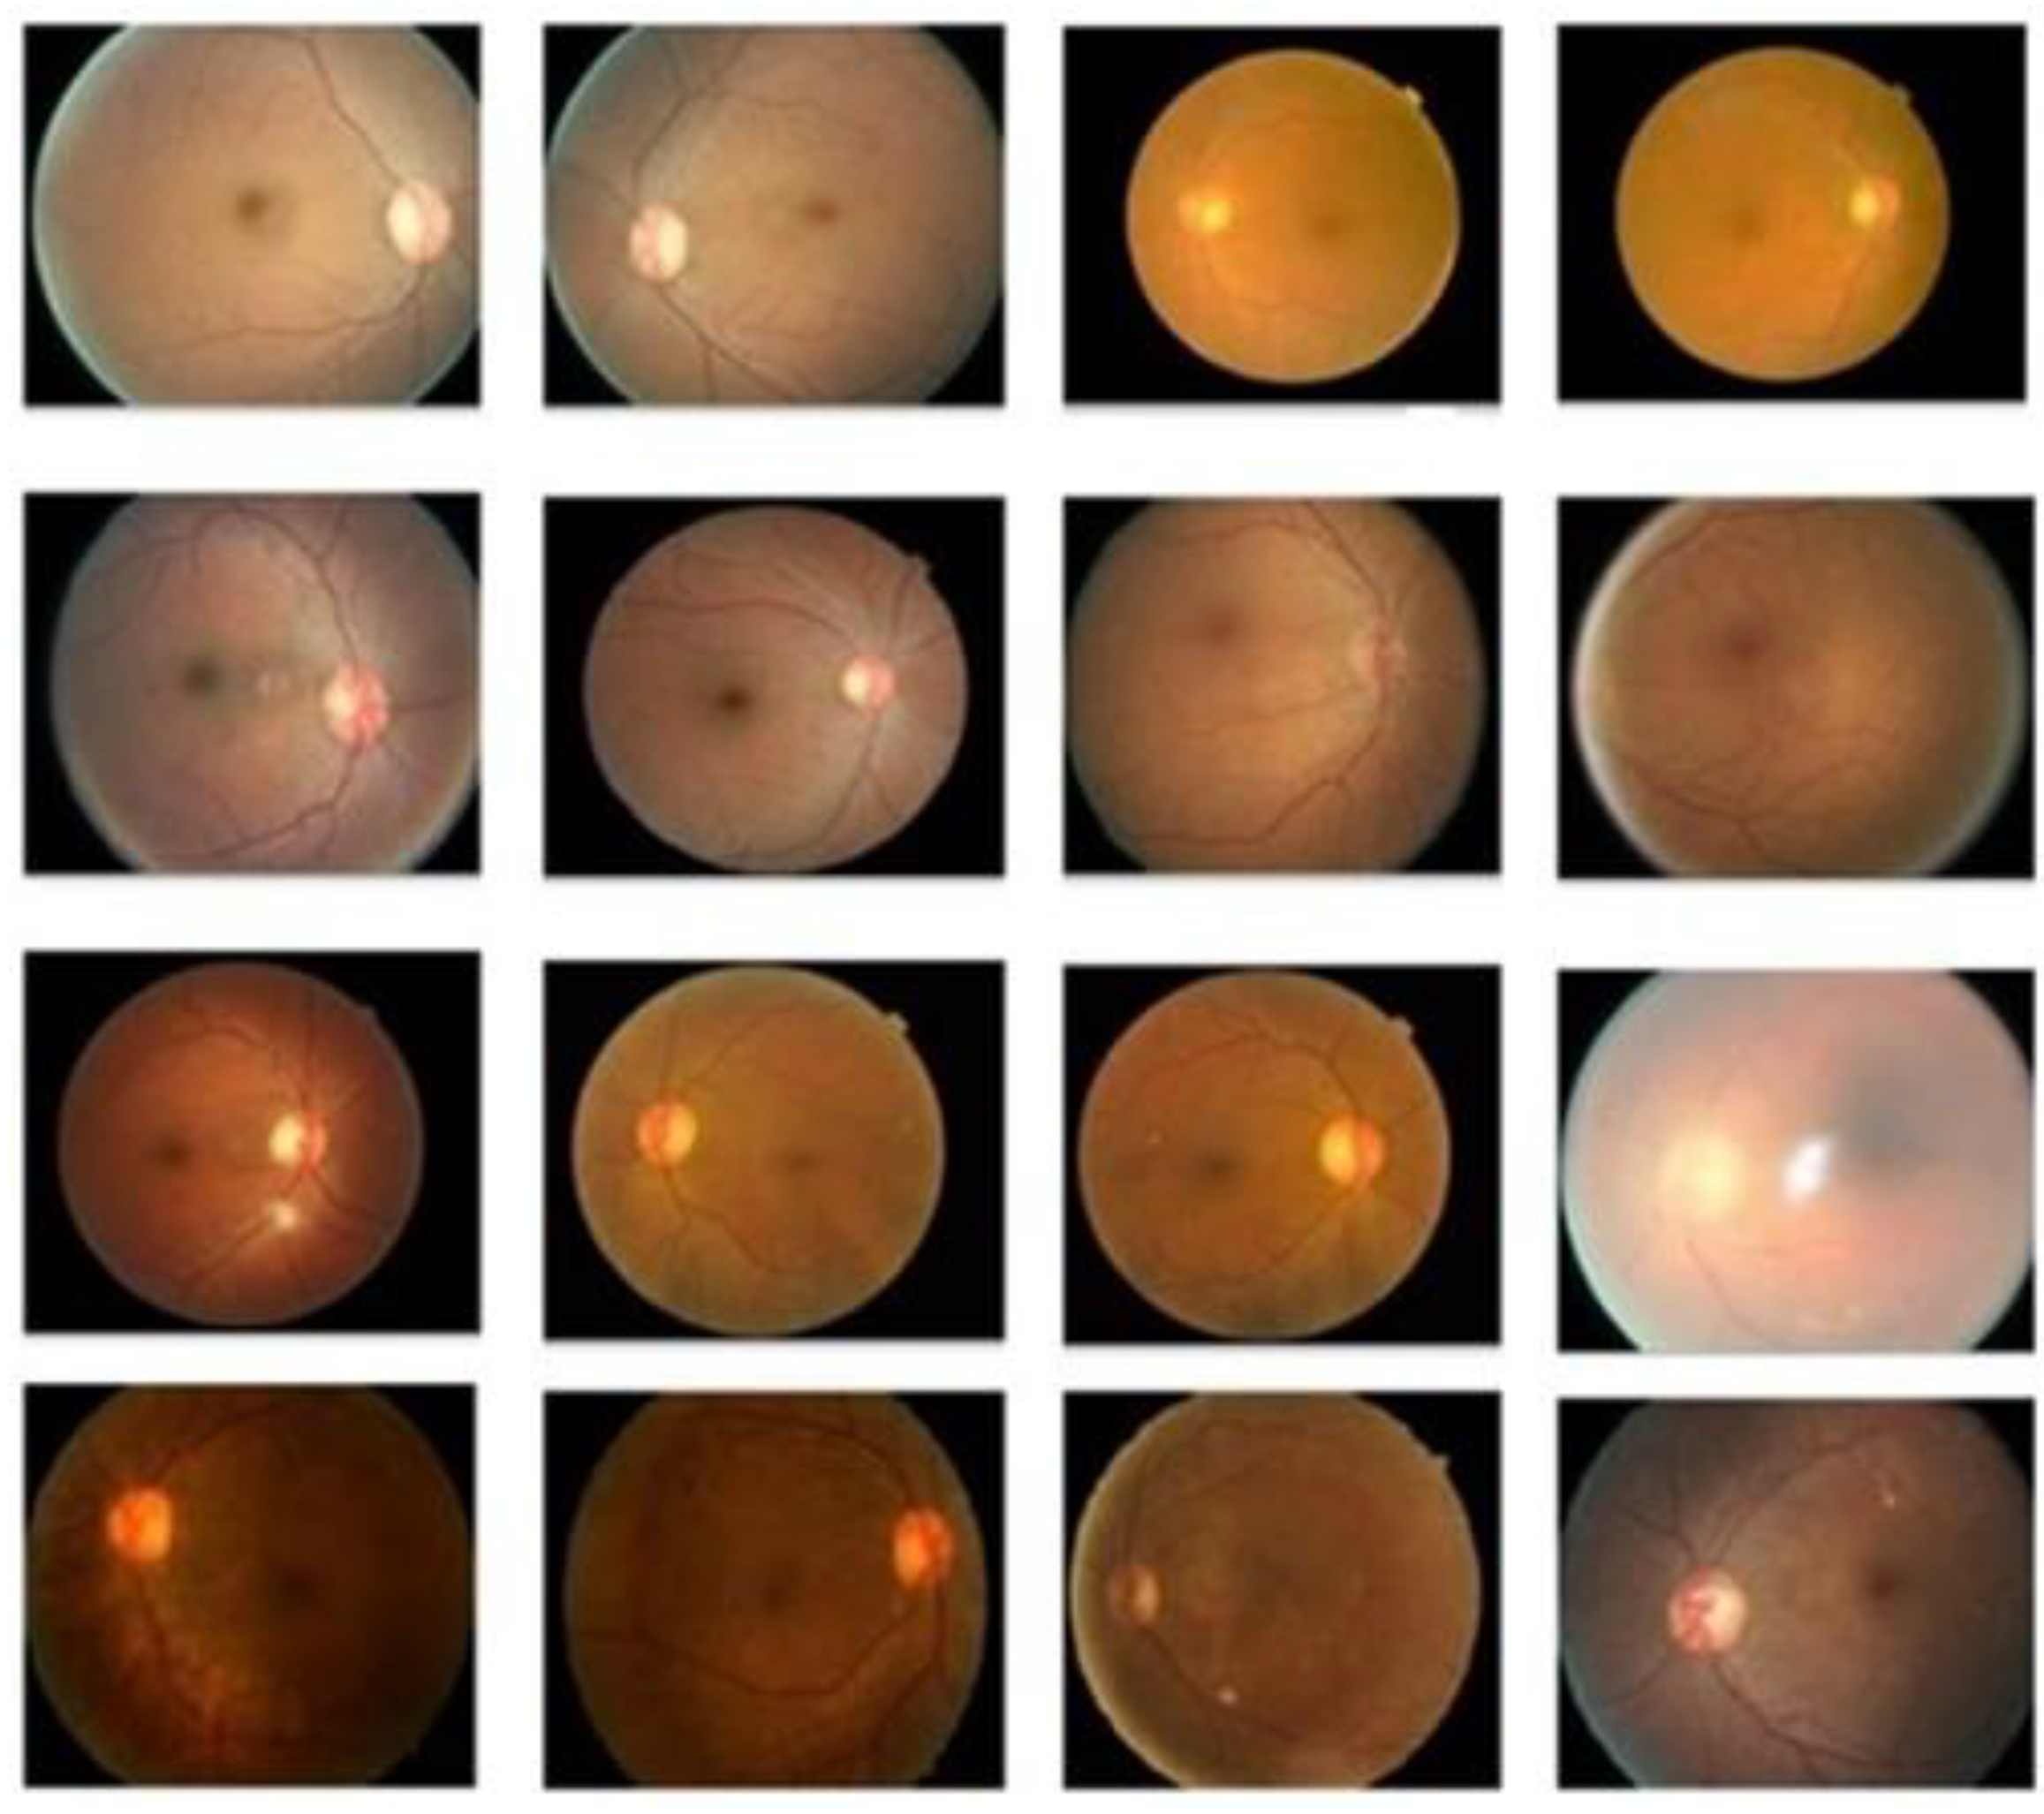
Figure 3.
Flowchart of each model.
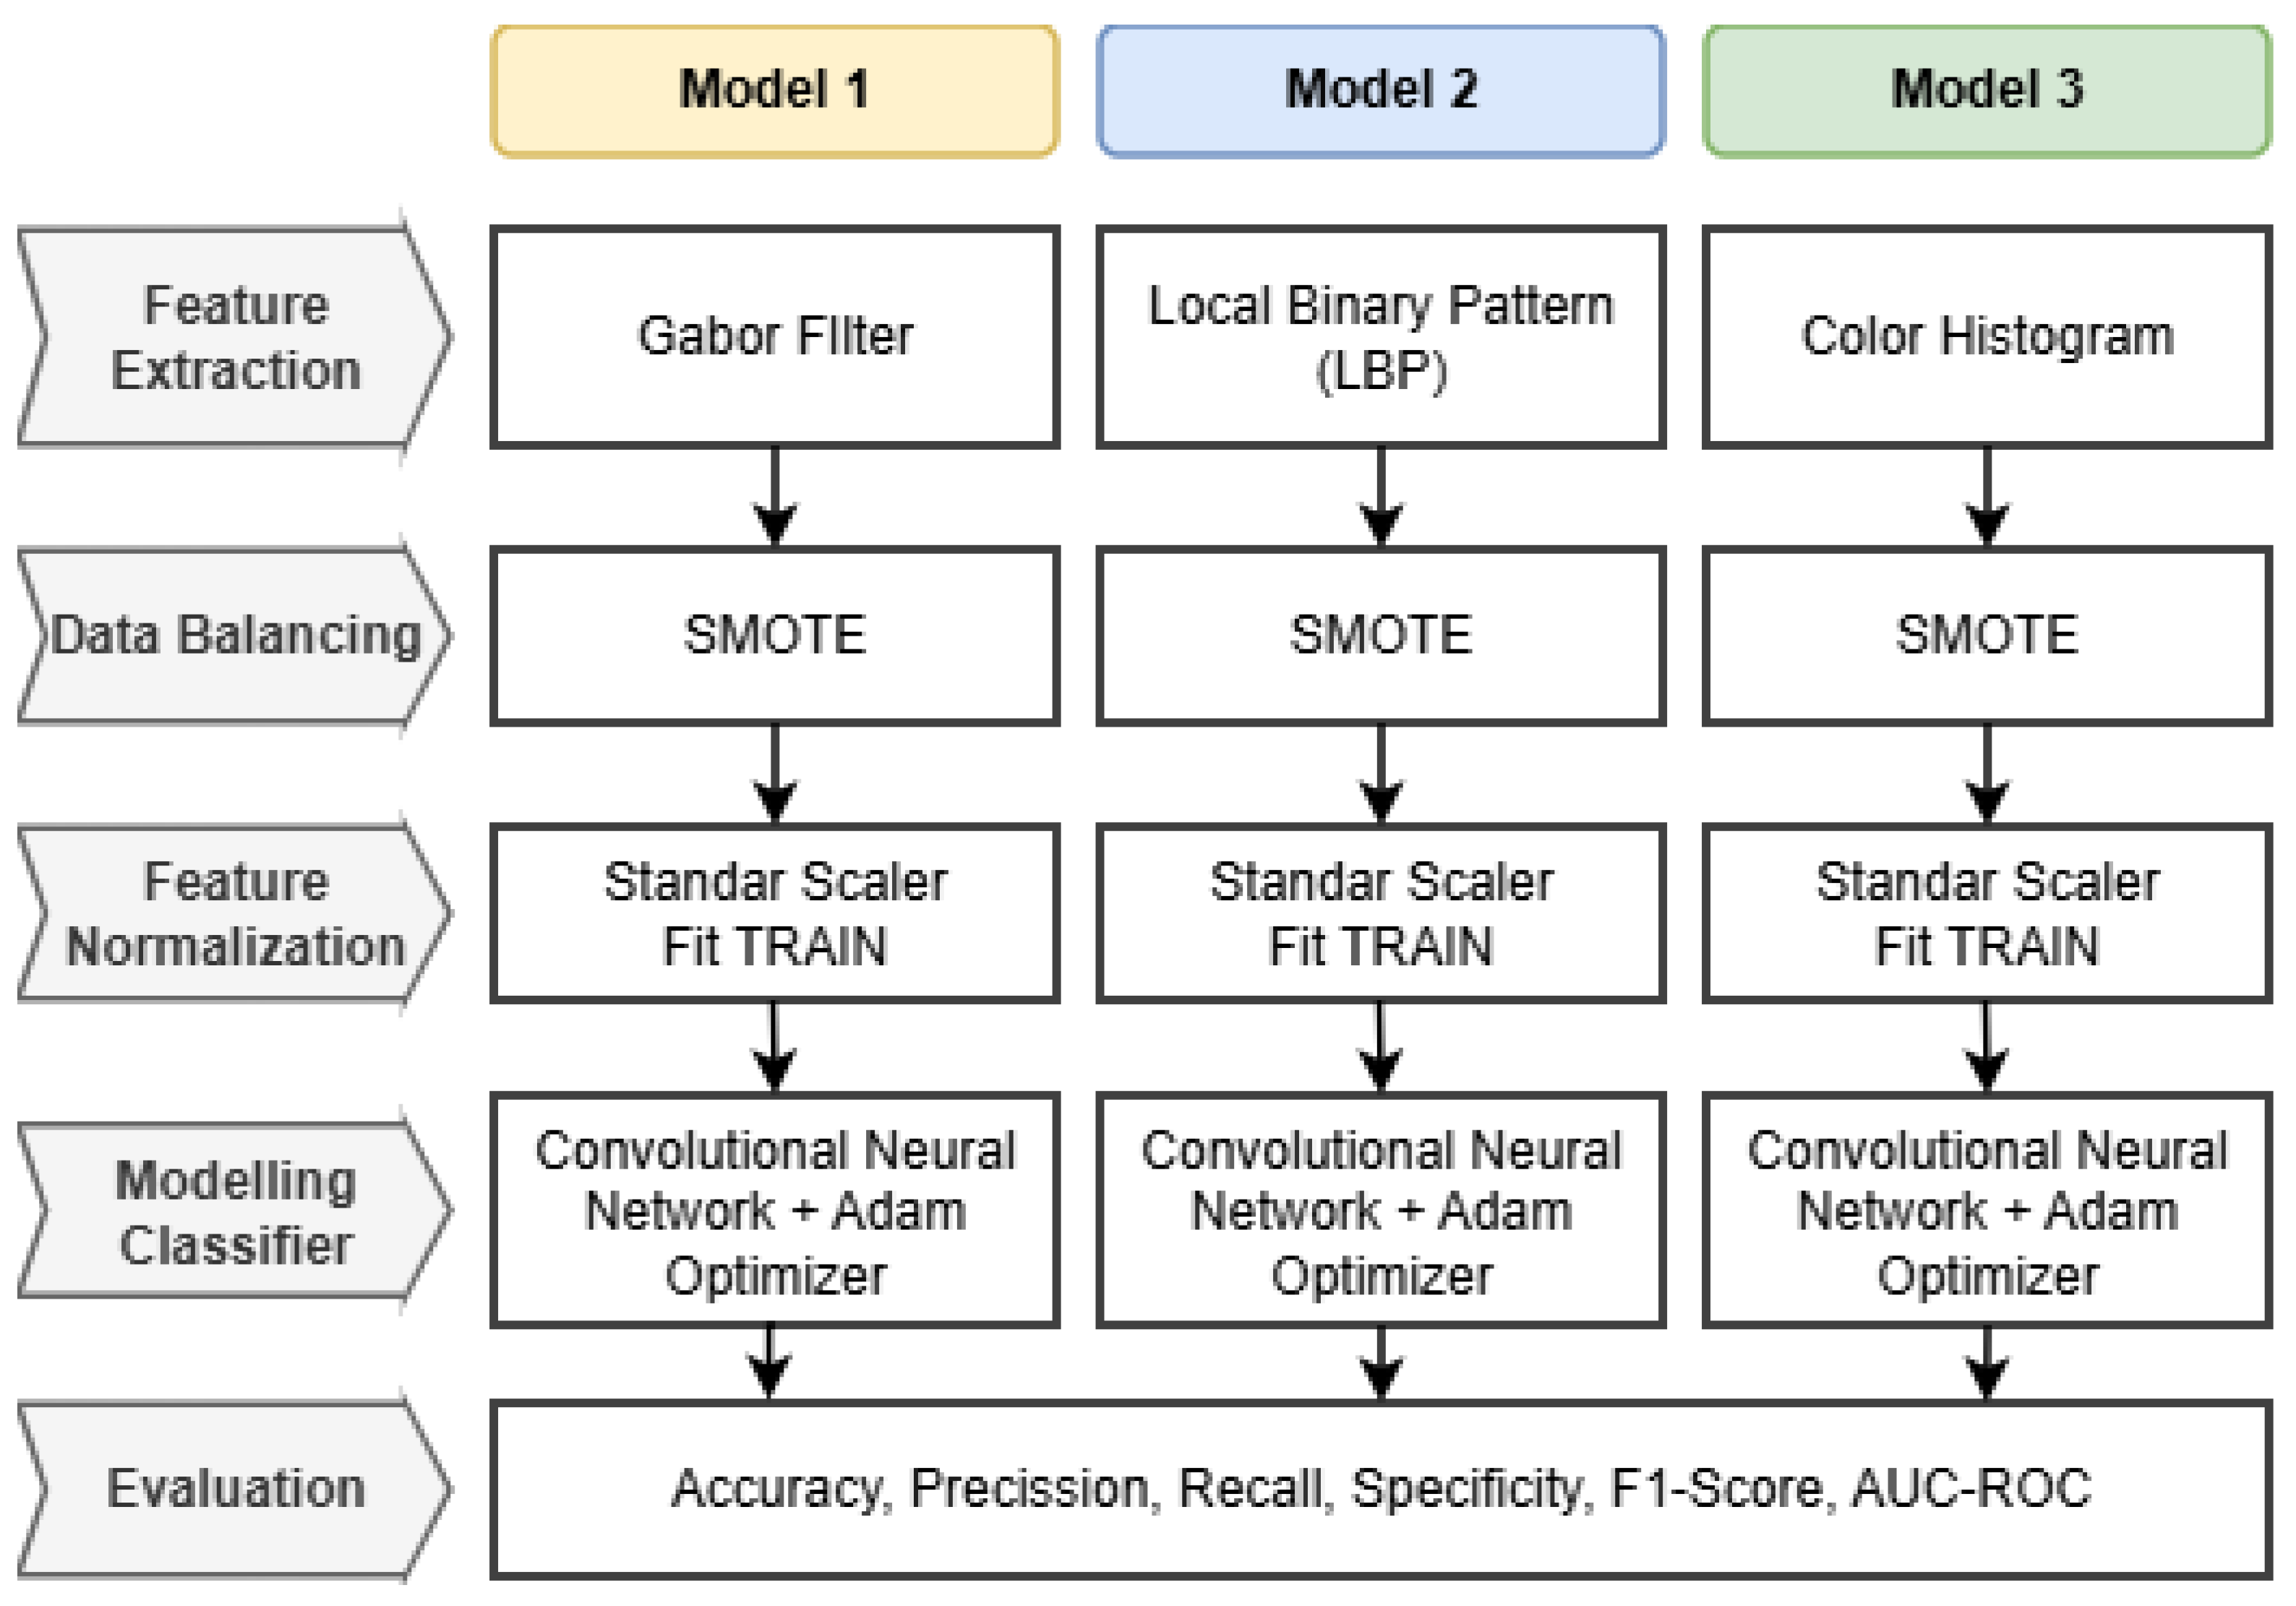
Figure 4.
SMOTE dataset distribution: (a) Distribution of the dataset before SMOTE; (b) Distribution of the dataset after SMOTE.
Figure 4.
SMOTE dataset distribution: (a) Distribution of the dataset before SMOTE; (b) Distribution of the dataset after SMOTE.
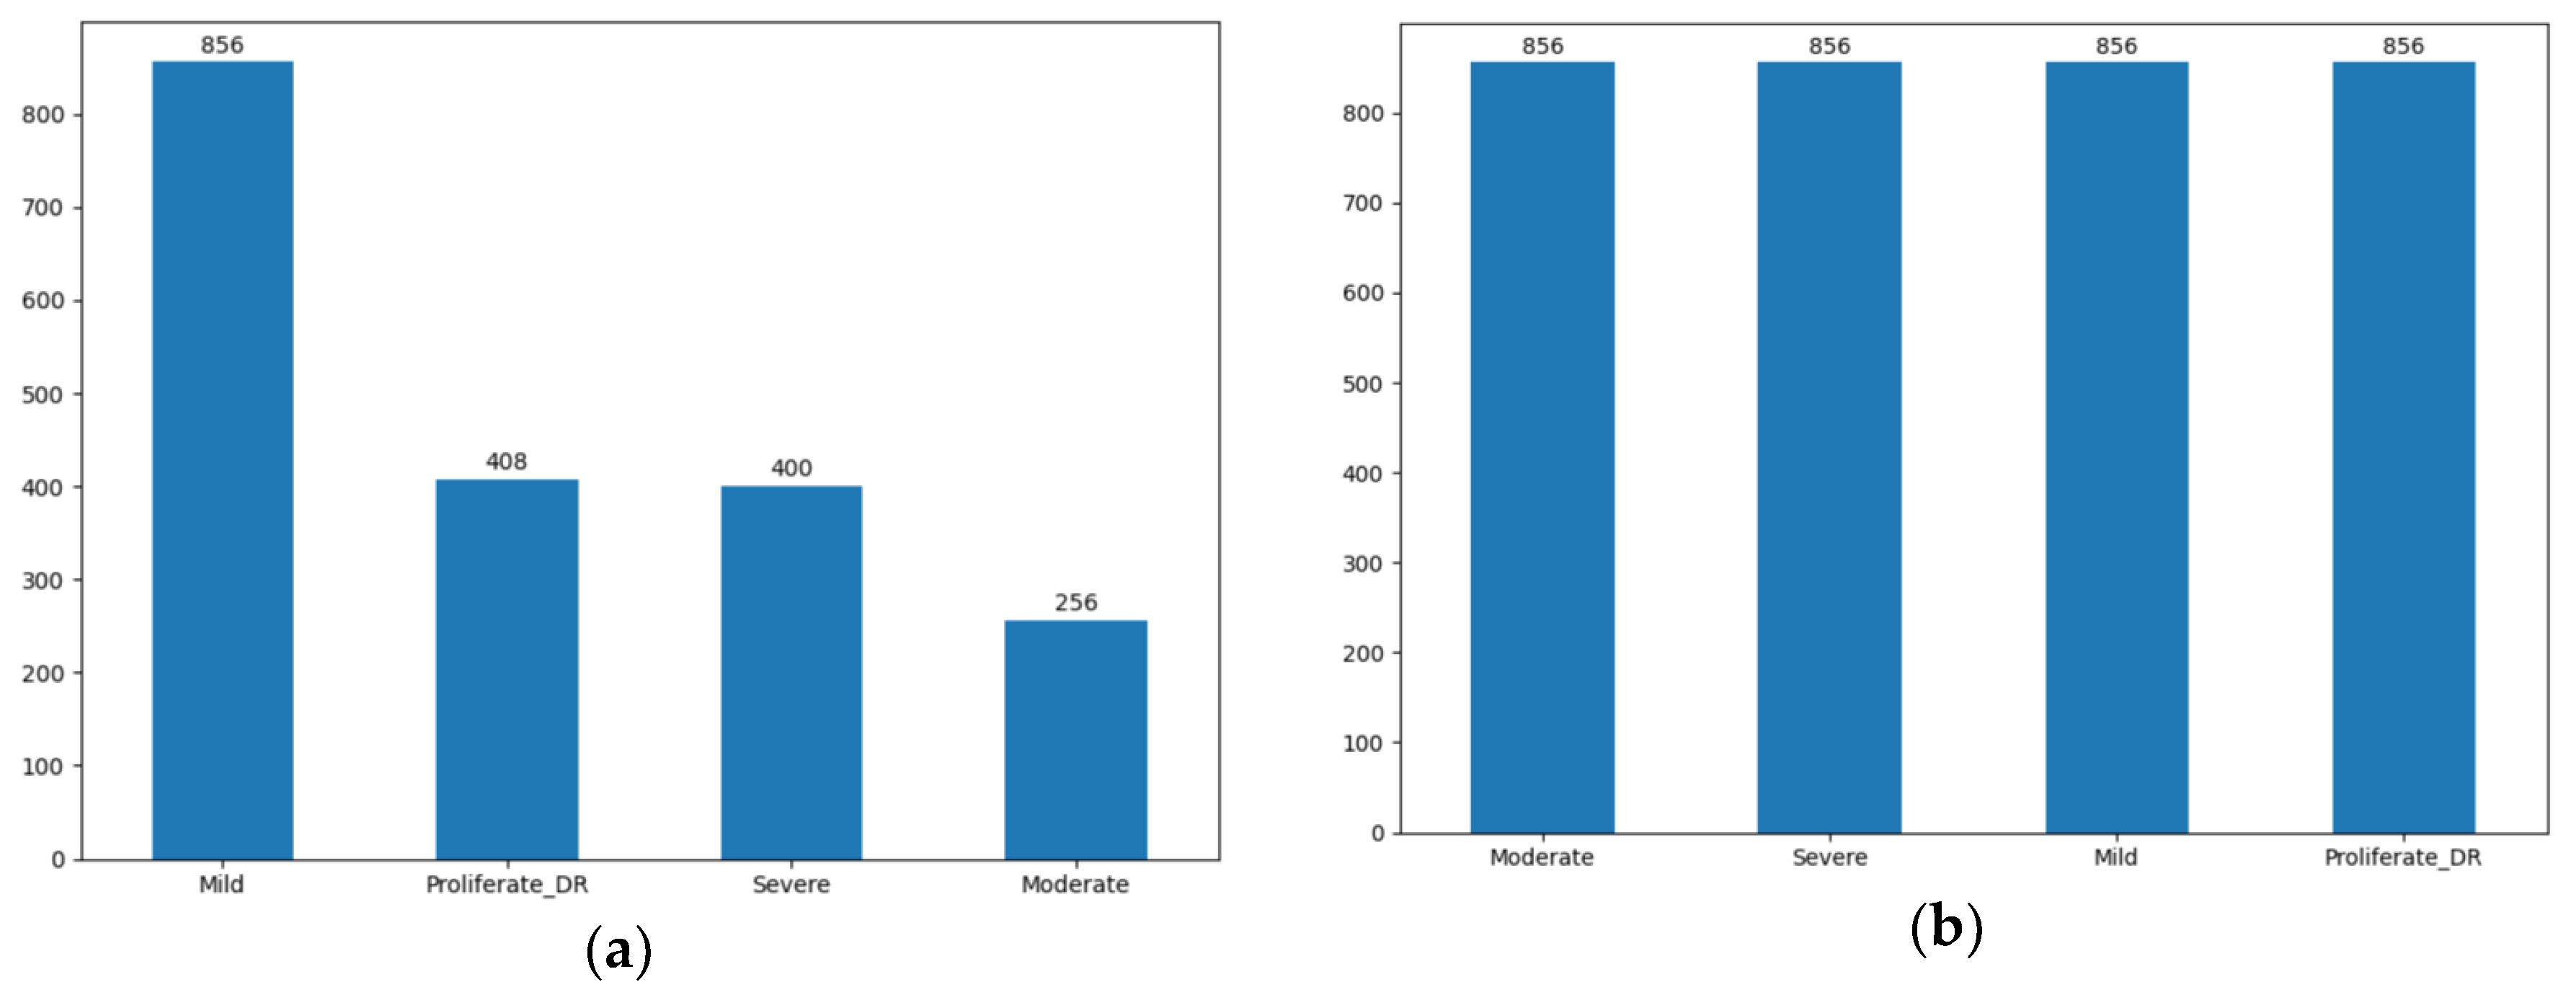
Figure 5.
The Gabor filter integration experiment flow.
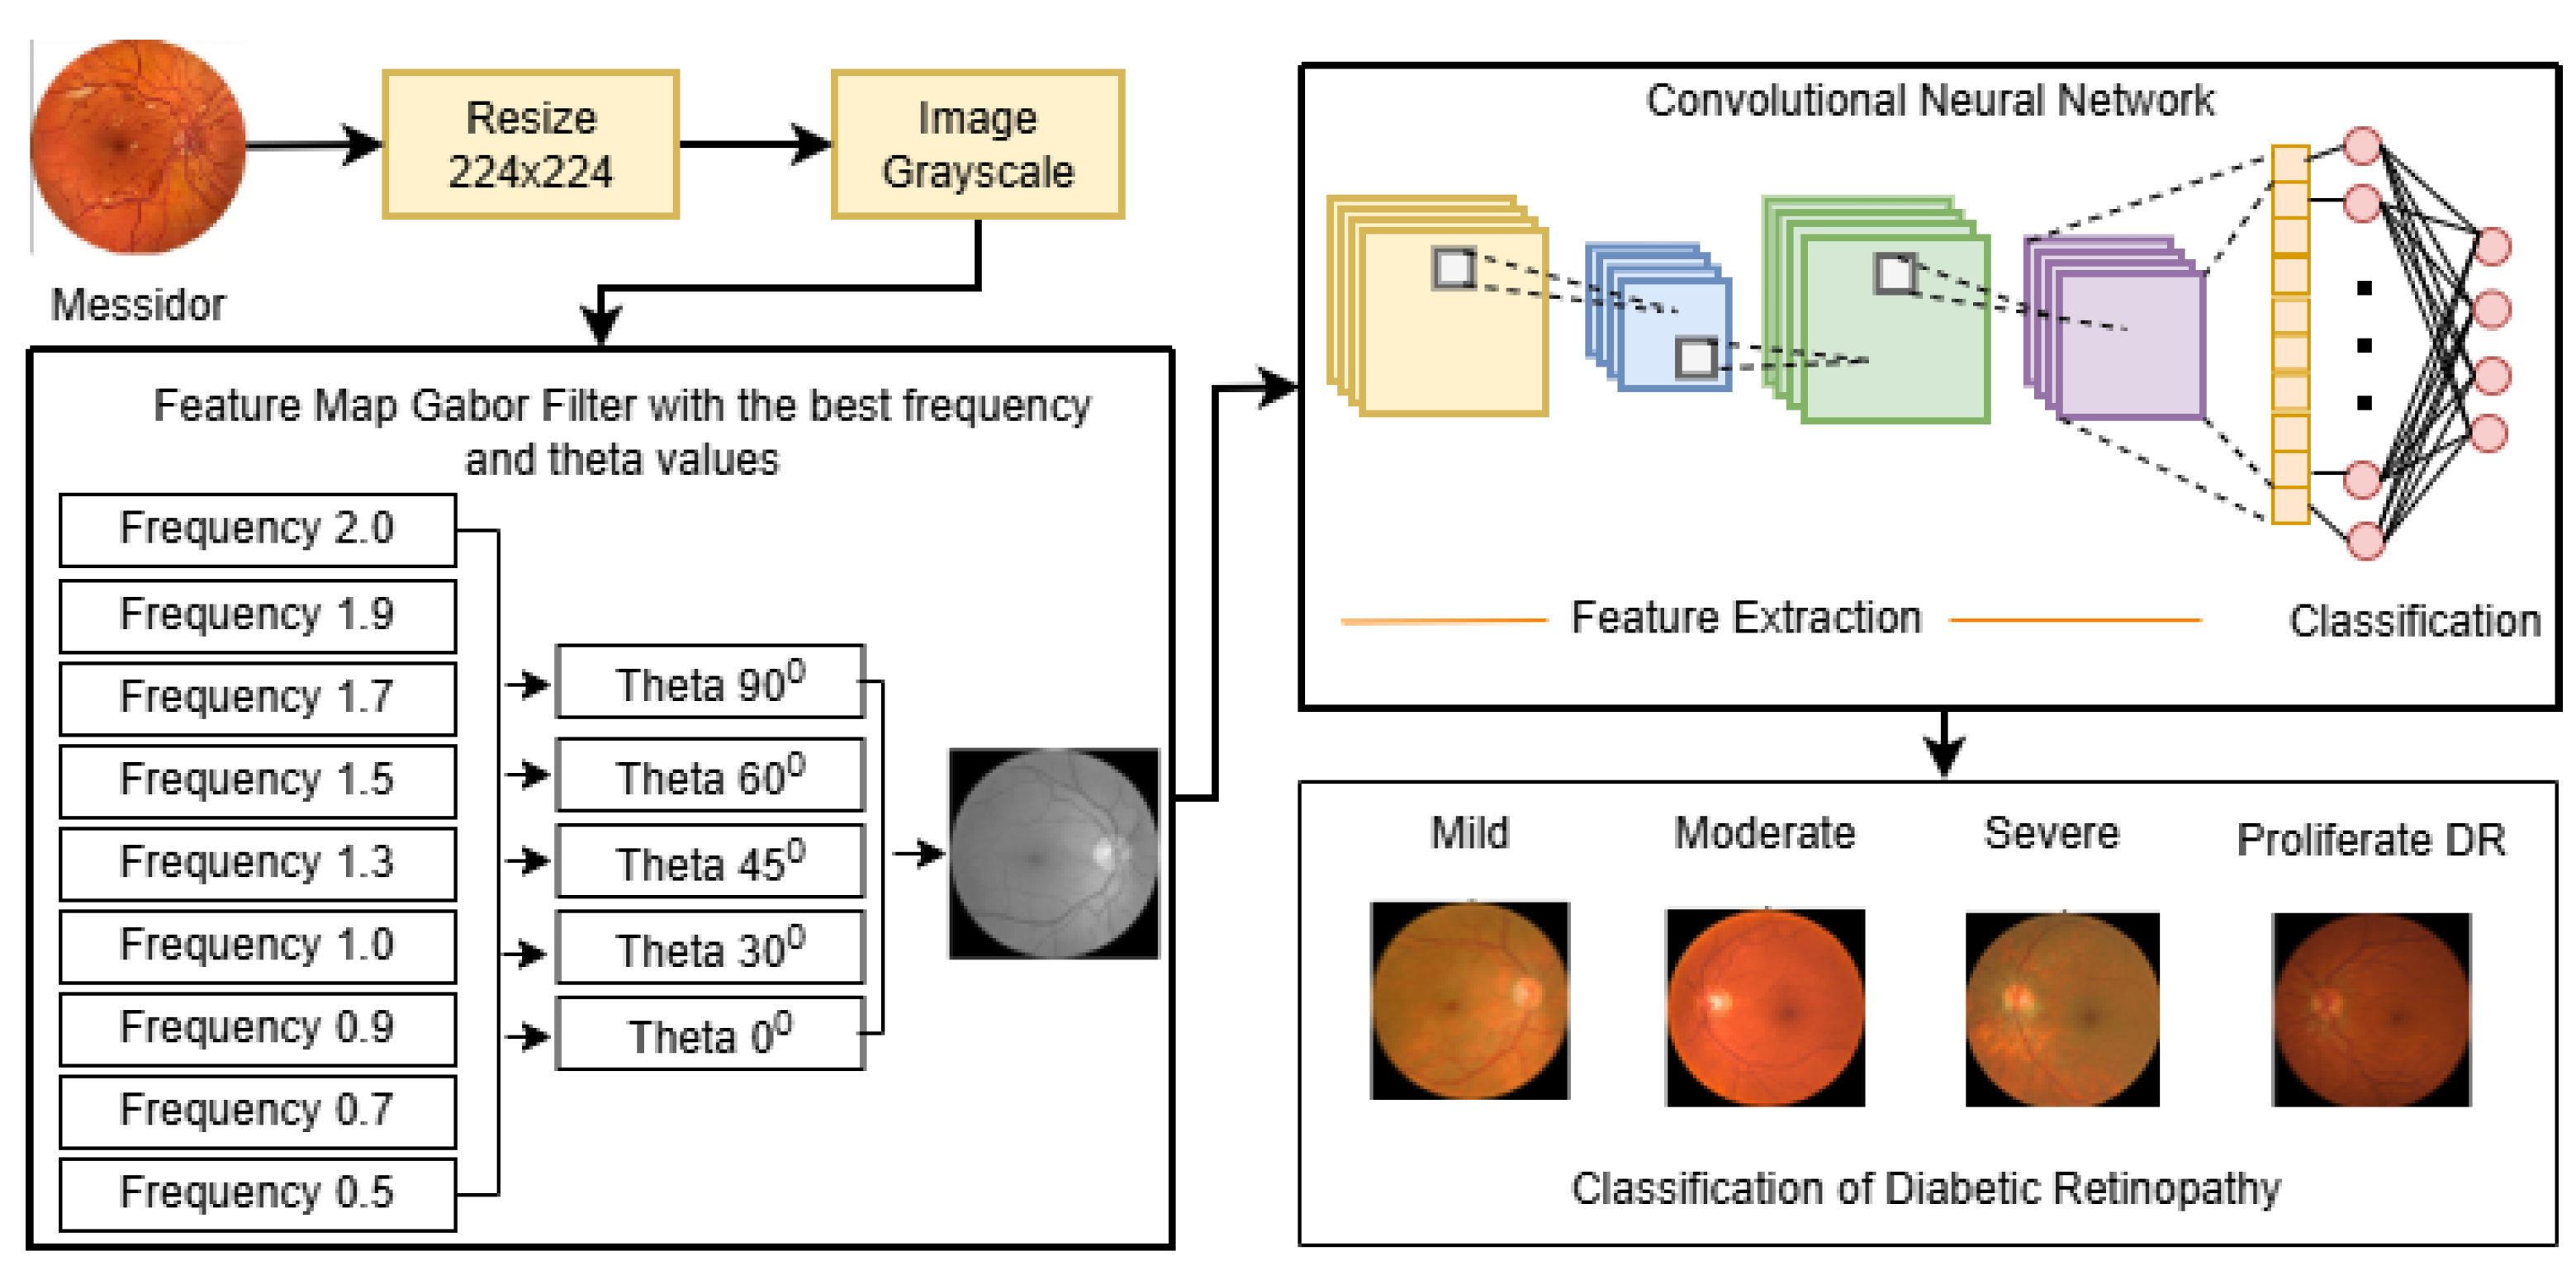
Figure 6.
Results of applying a Gabor filter to a fundus image of diabetic retinopathy.
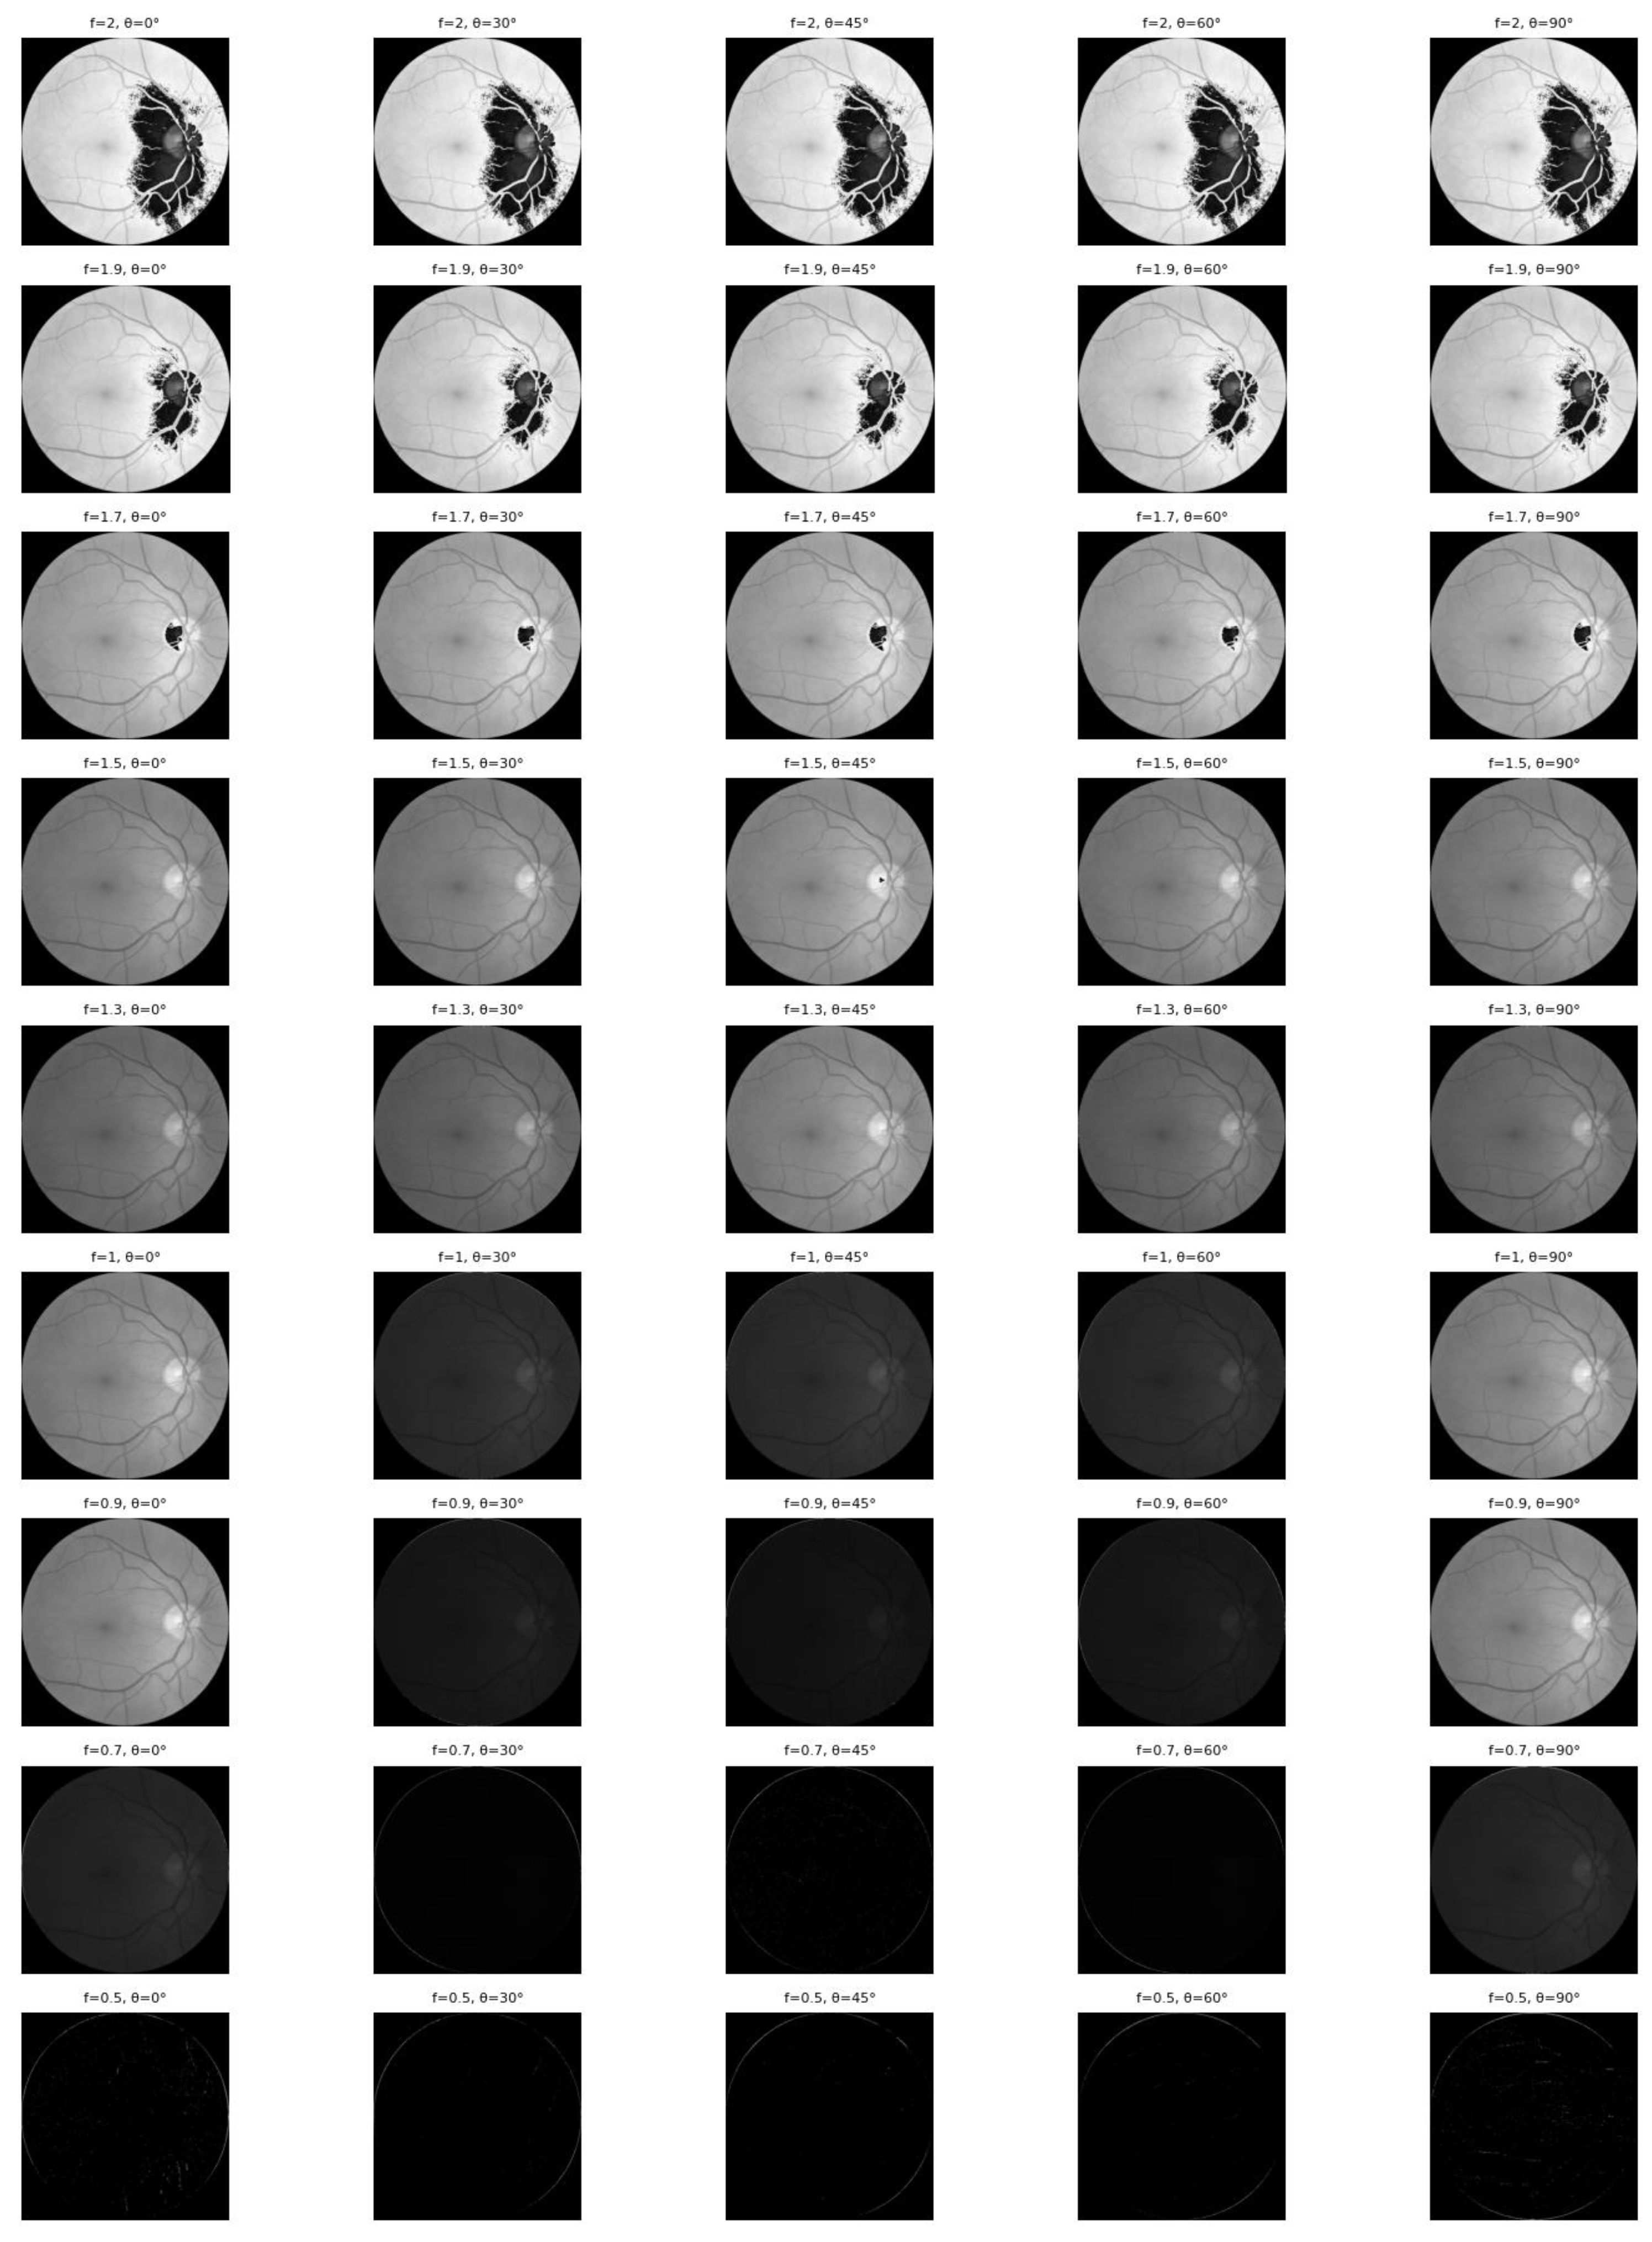
Figure 7.
Confusion matrix classification of diabetic retinopathy fundus images using the Gabor filter method and CNN.
Figure 7.
Confusion matrix classification of diabetic retinopathy fundus images using the Gabor filter method and CNN.
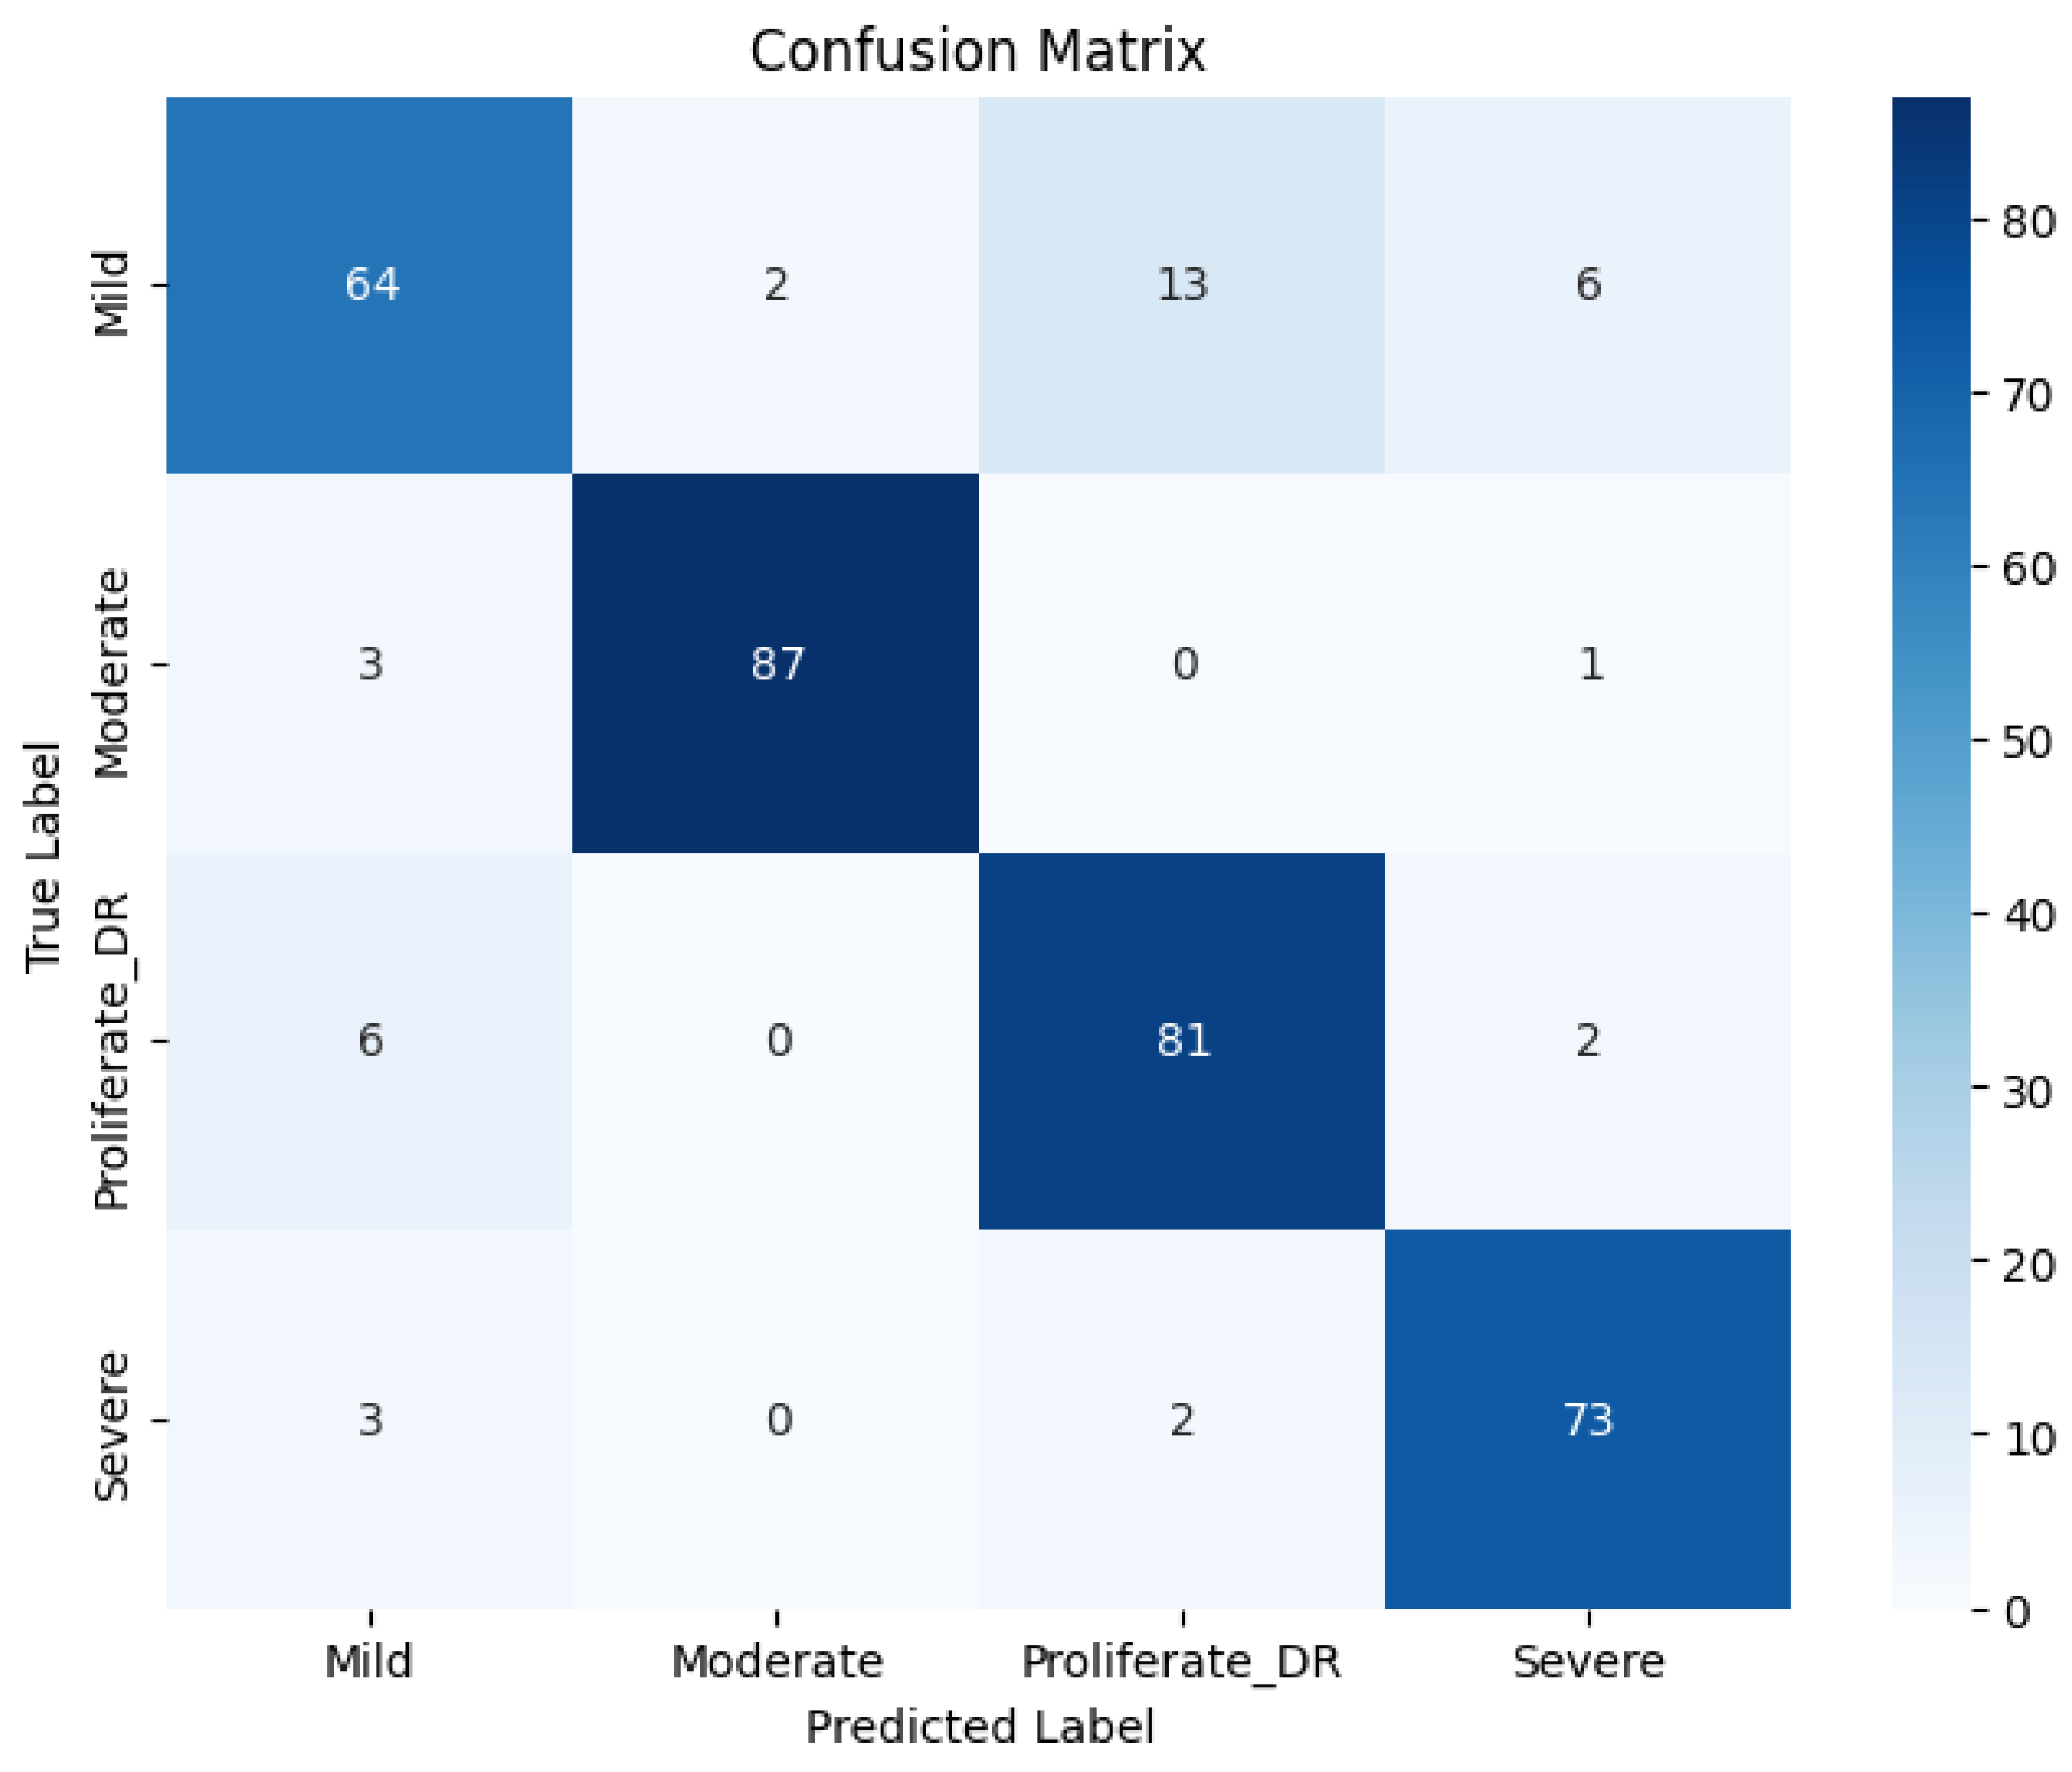
Figure 8.
ROC curve of diabetic retinopathy fundus image classification using the Gabor filter method and CNN.
Figure 8.
ROC curve of diabetic retinopathy fundus image classification using the Gabor filter method and CNN.
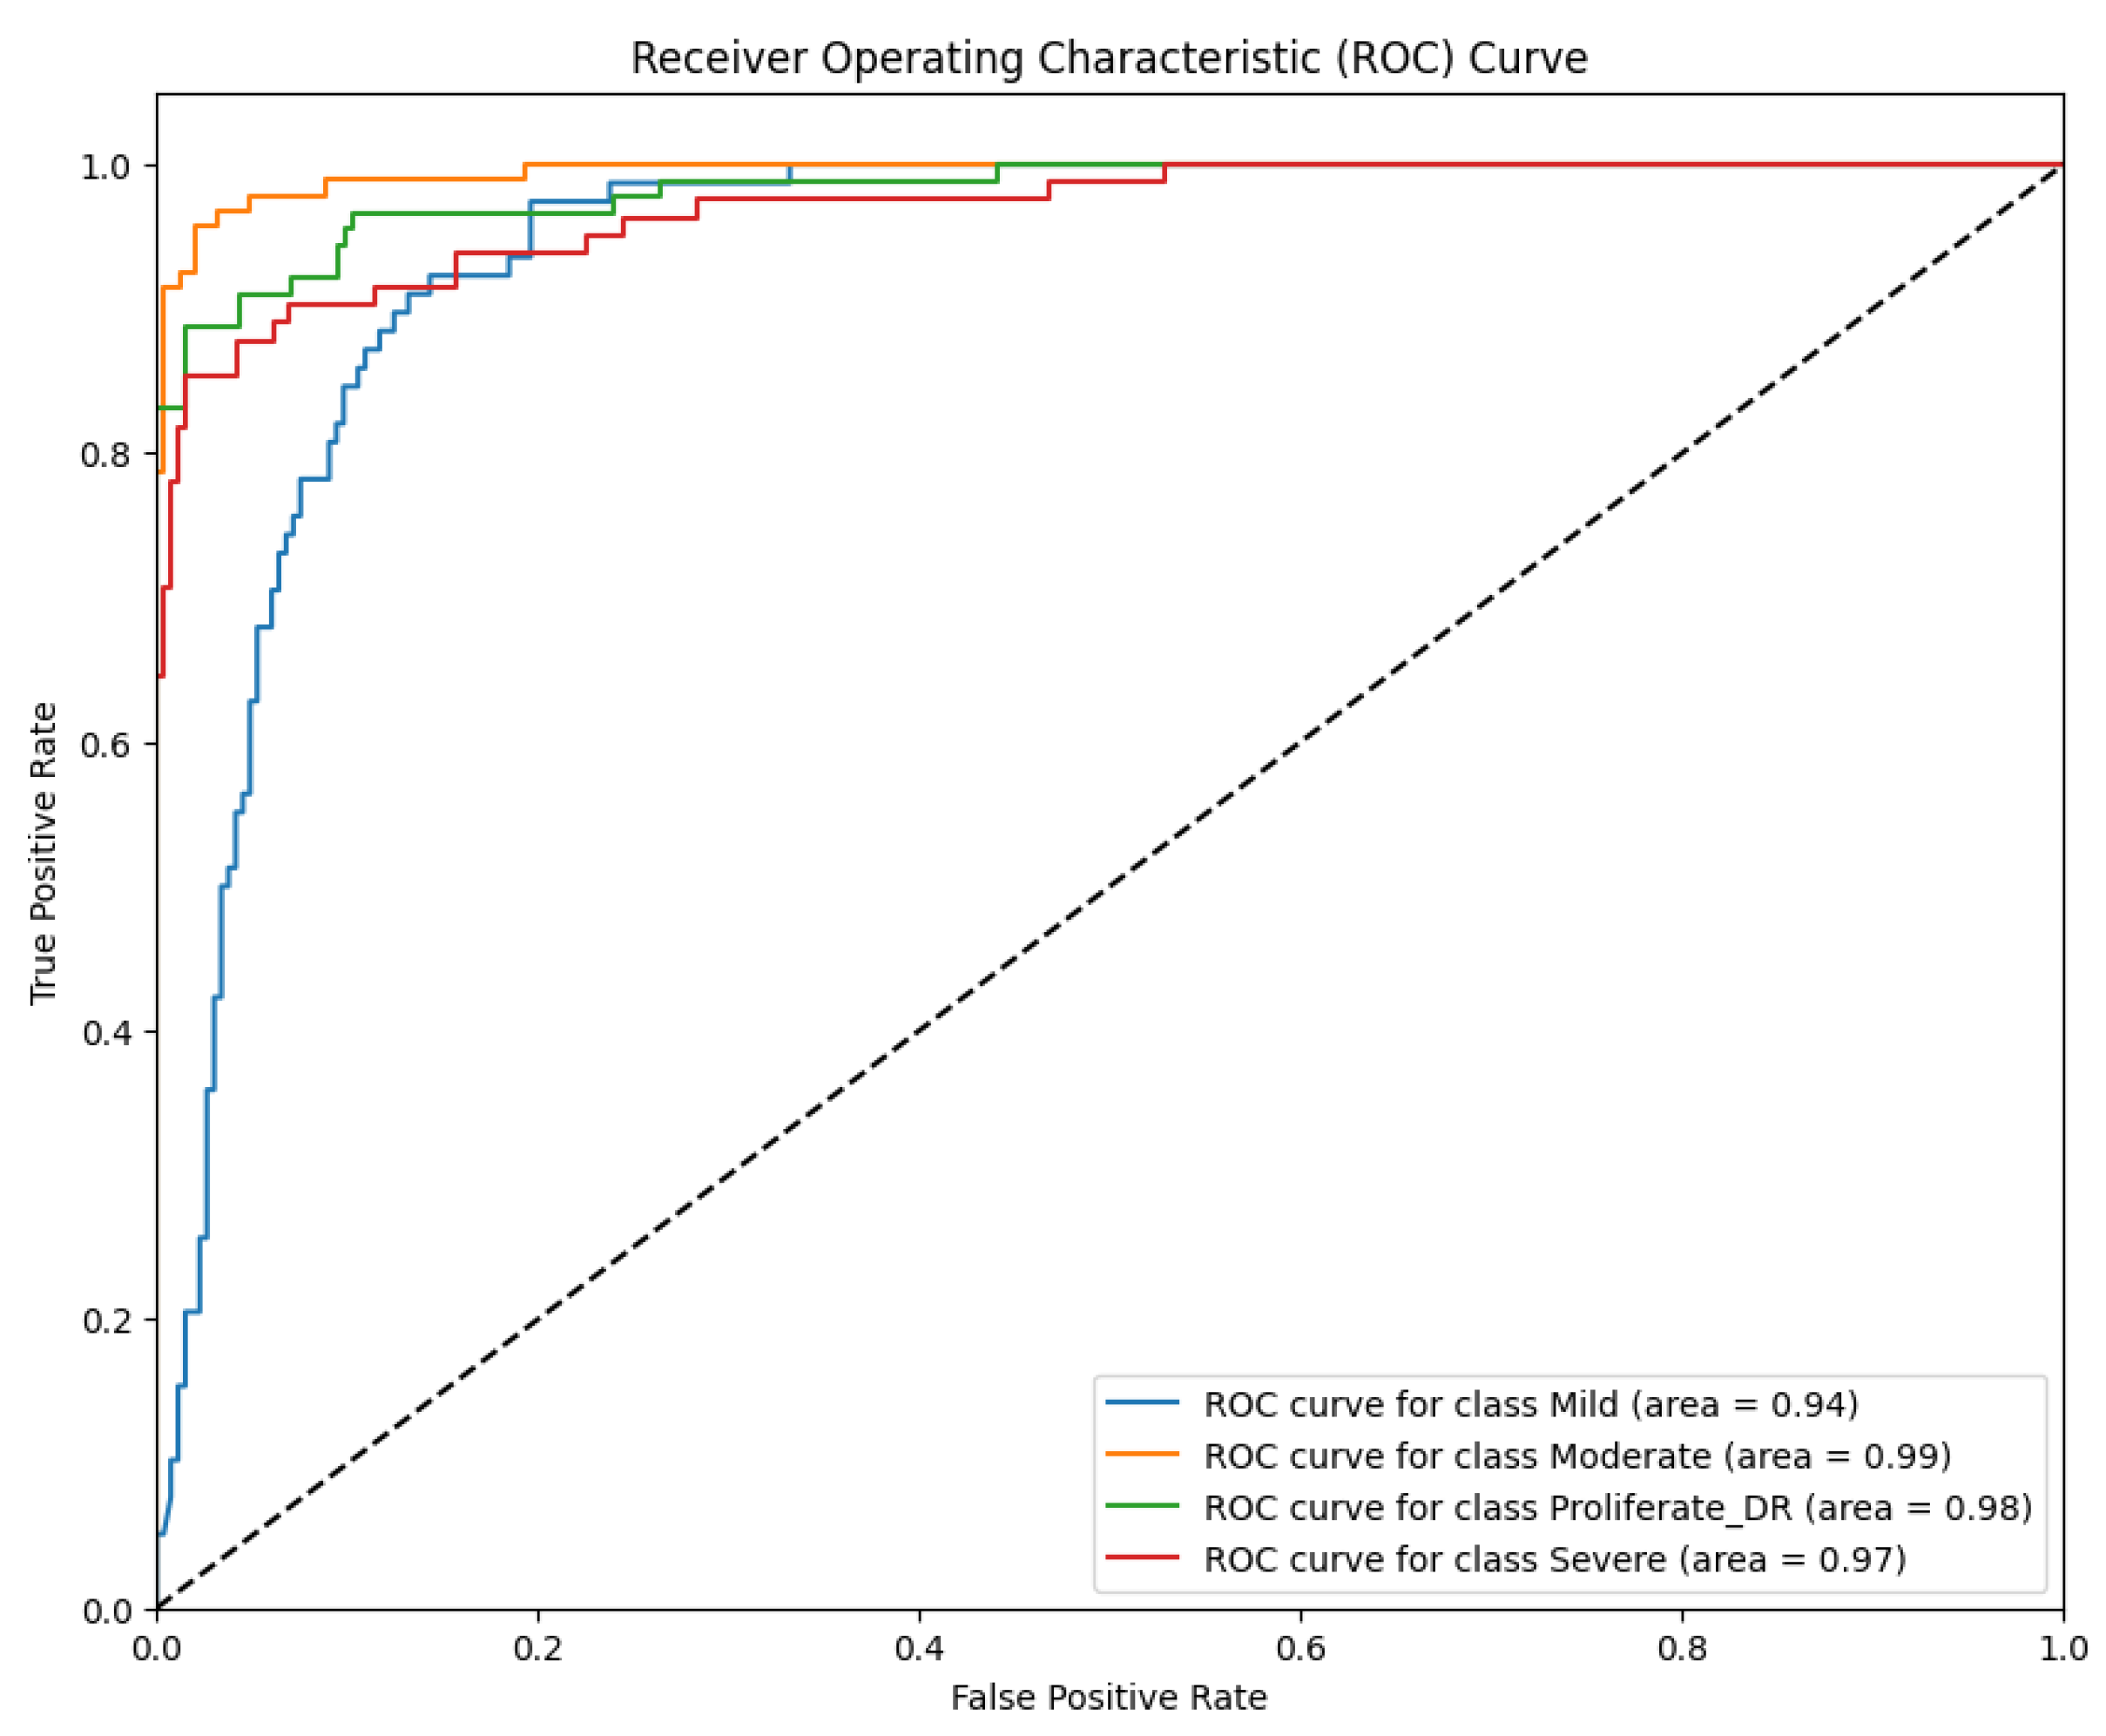
Figure 9.
Results of applying LBP to the fundus image of diabetic retinopathy.
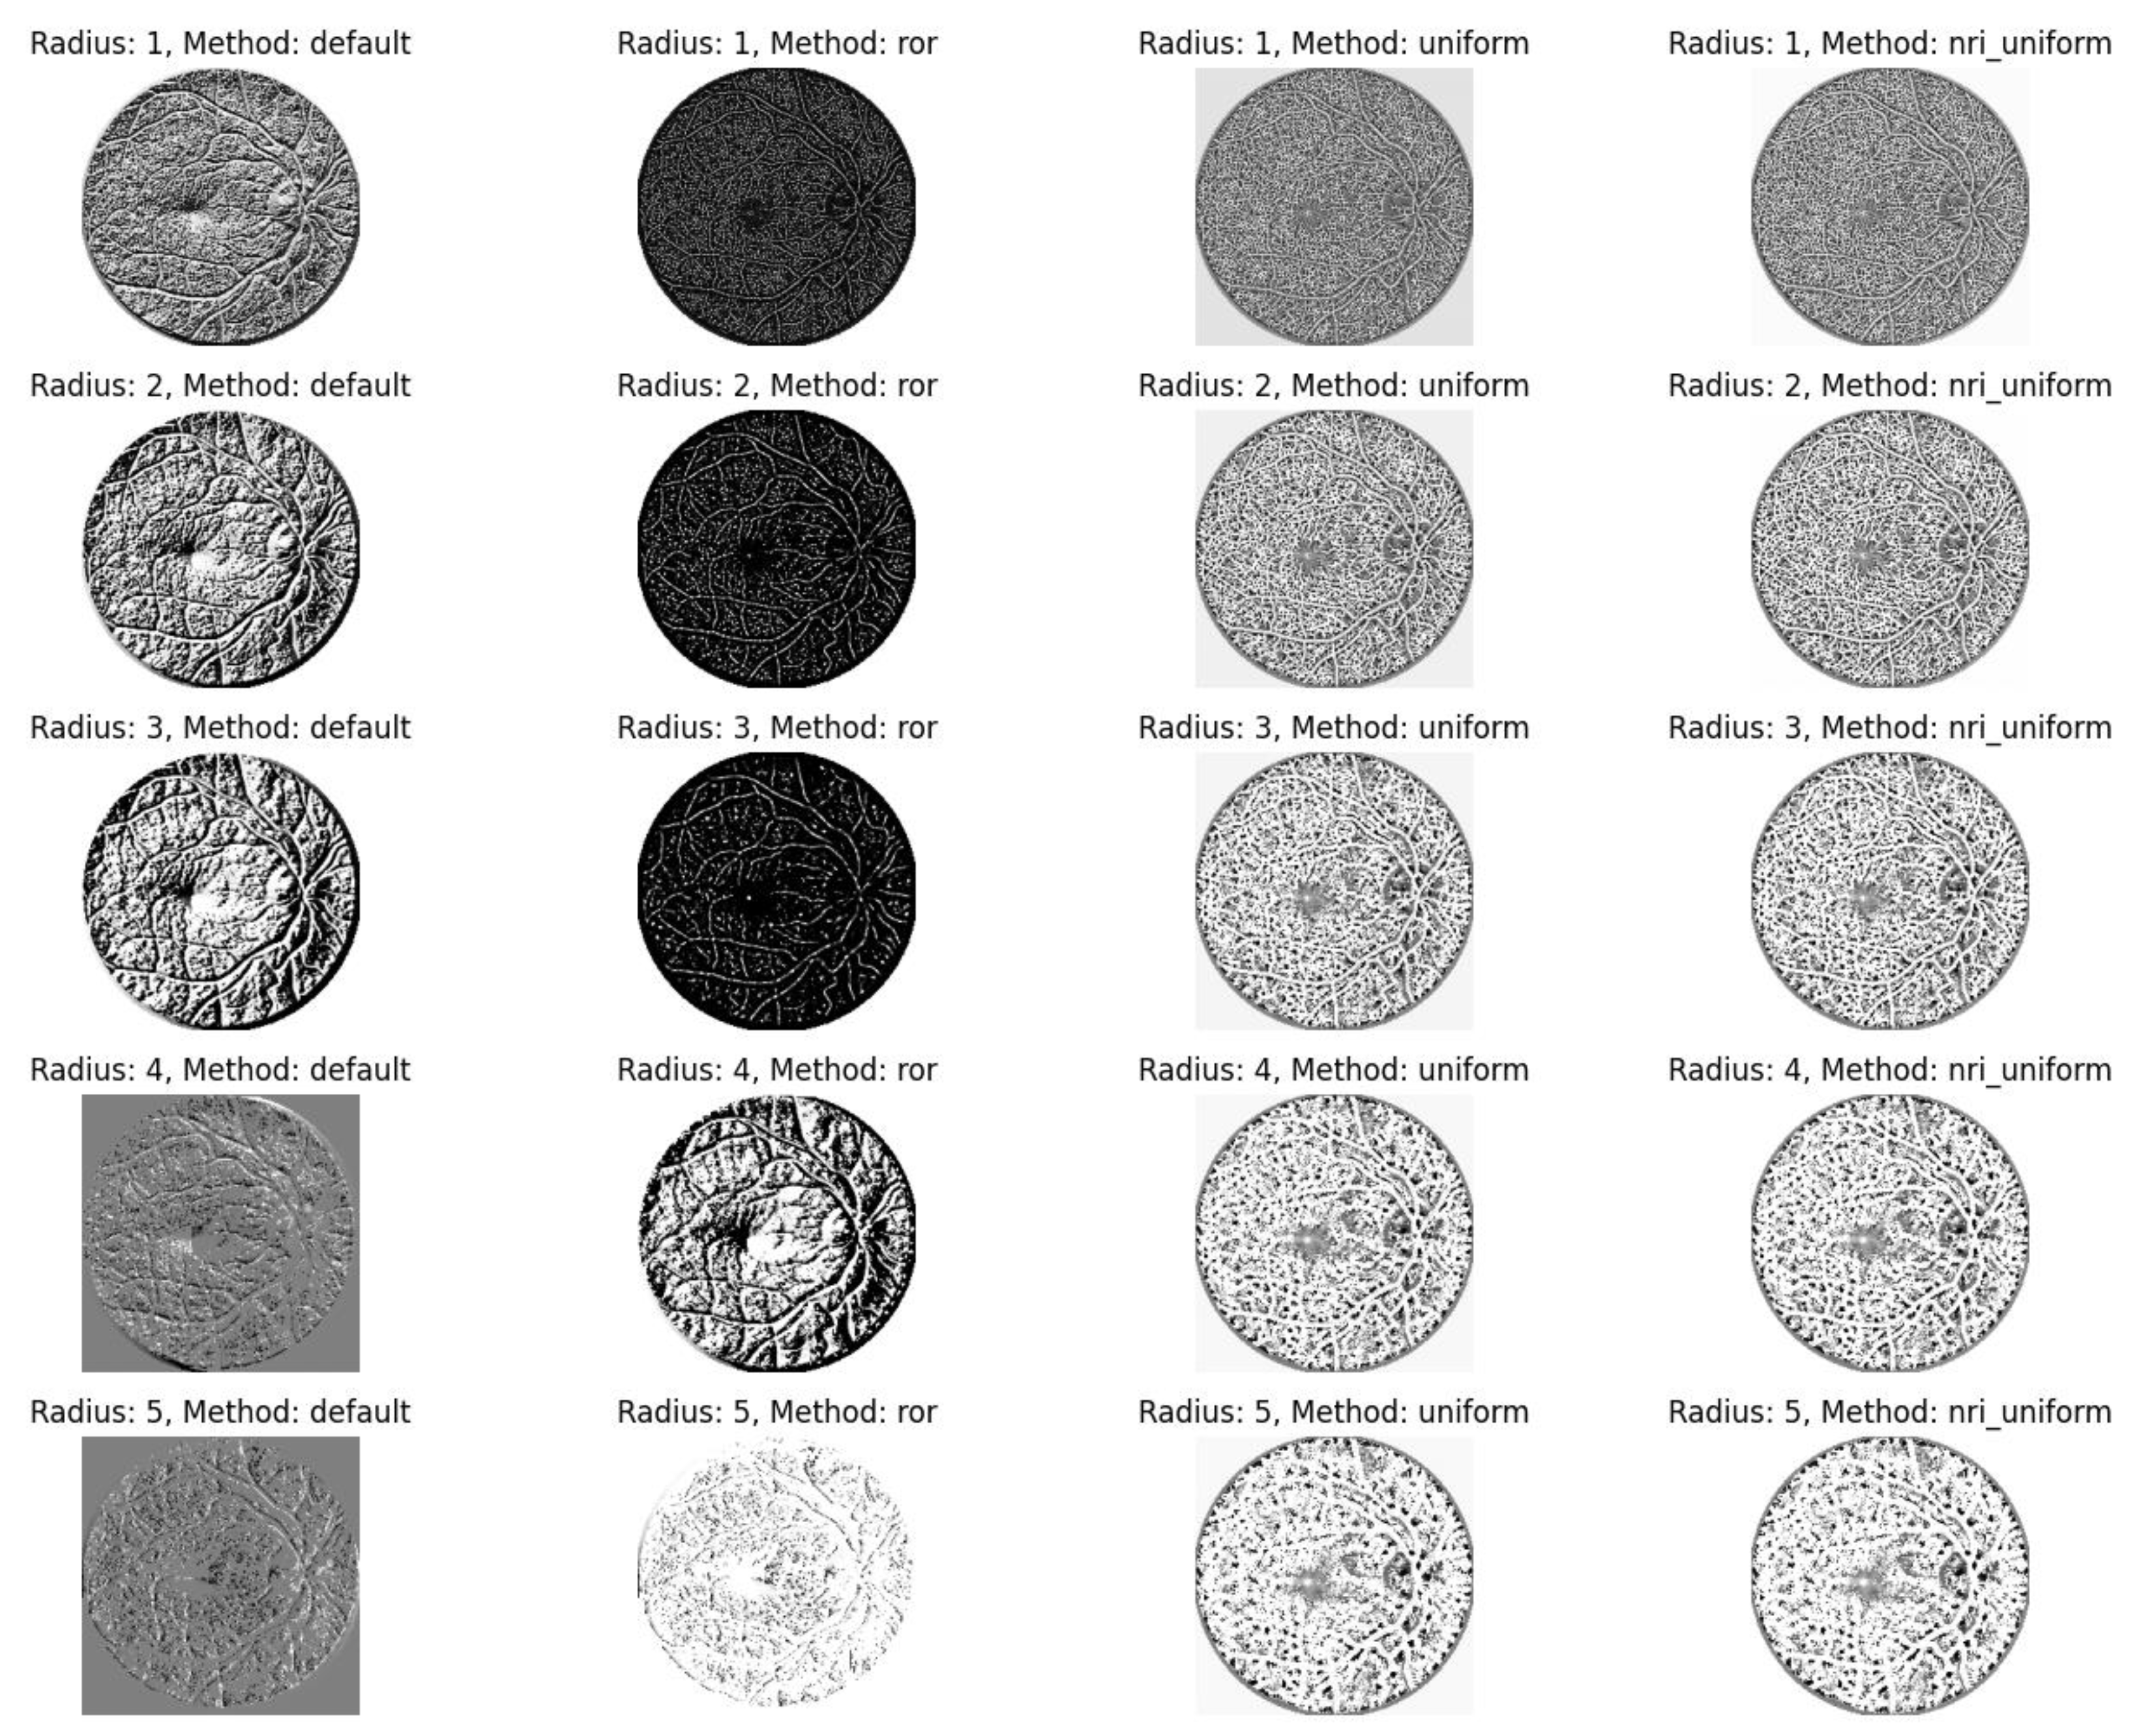
Figure 10.
Histogram of LBP in the fundus image of diabetic retinopathy.
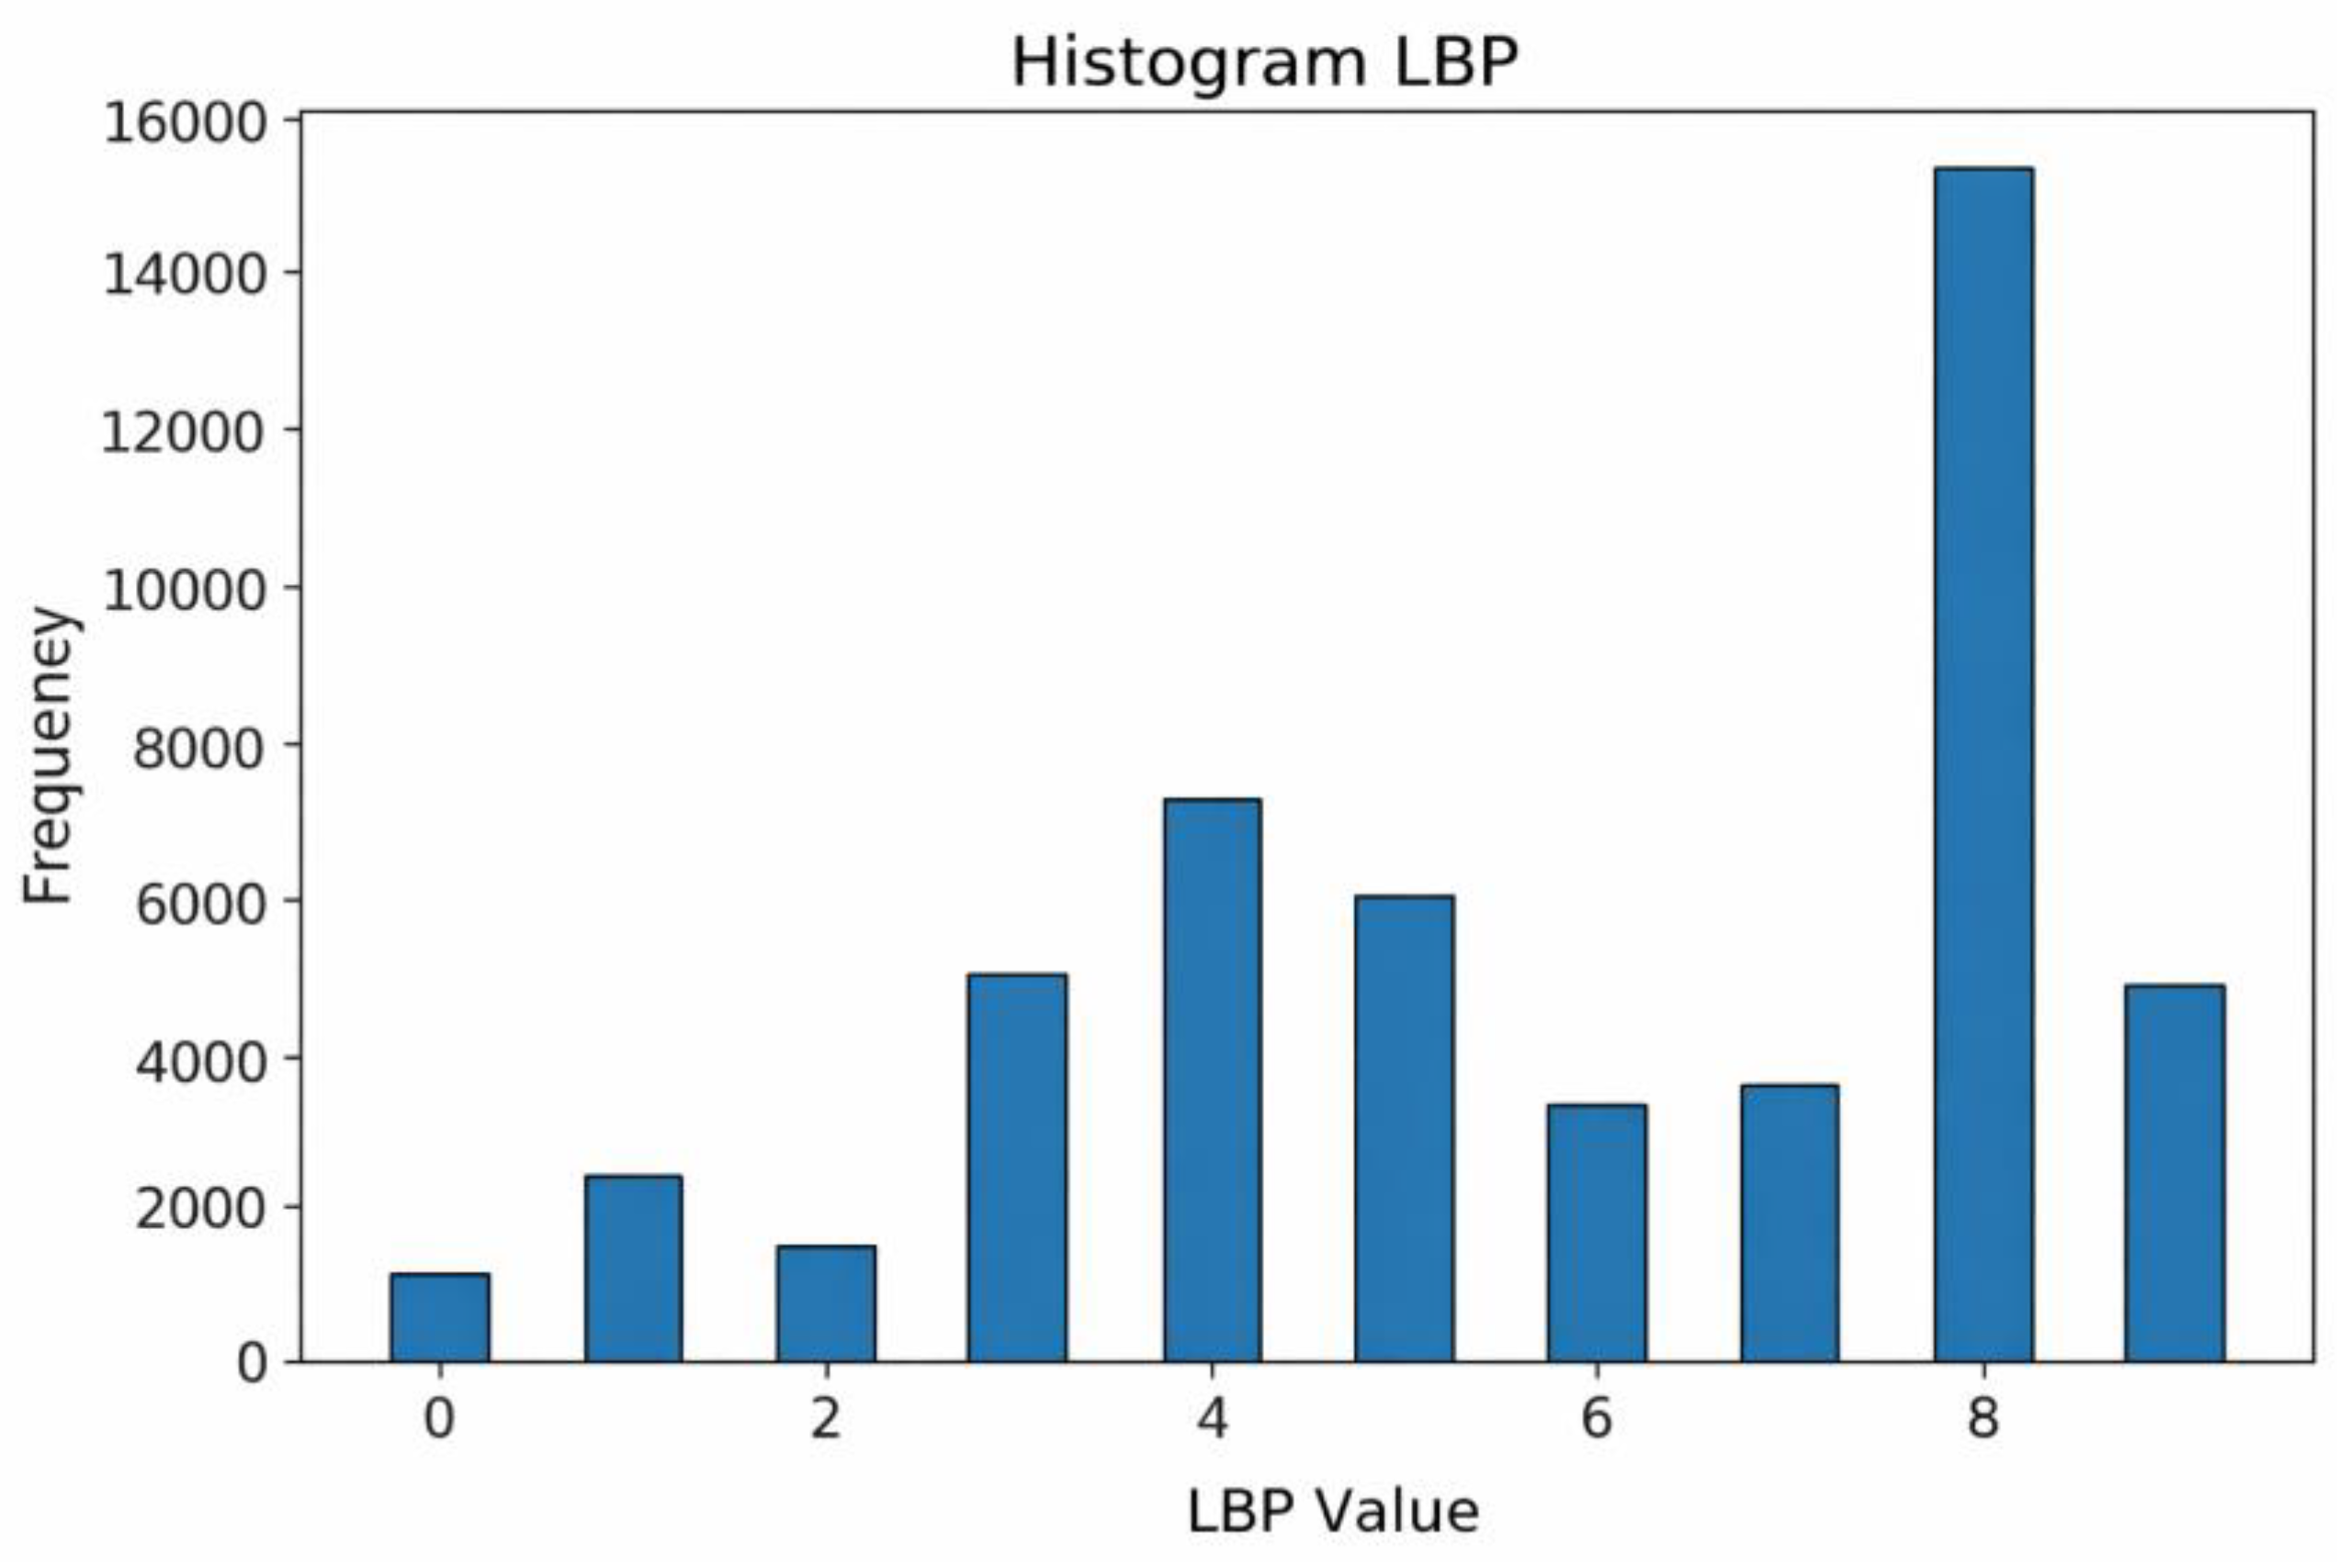
Figure 11.
Confusion matrix classification of diabetic retinopathy fundus images using LBP and CNN methods.
Figure 11.
Confusion matrix classification of diabetic retinopathy fundus images using LBP and CNN methods.
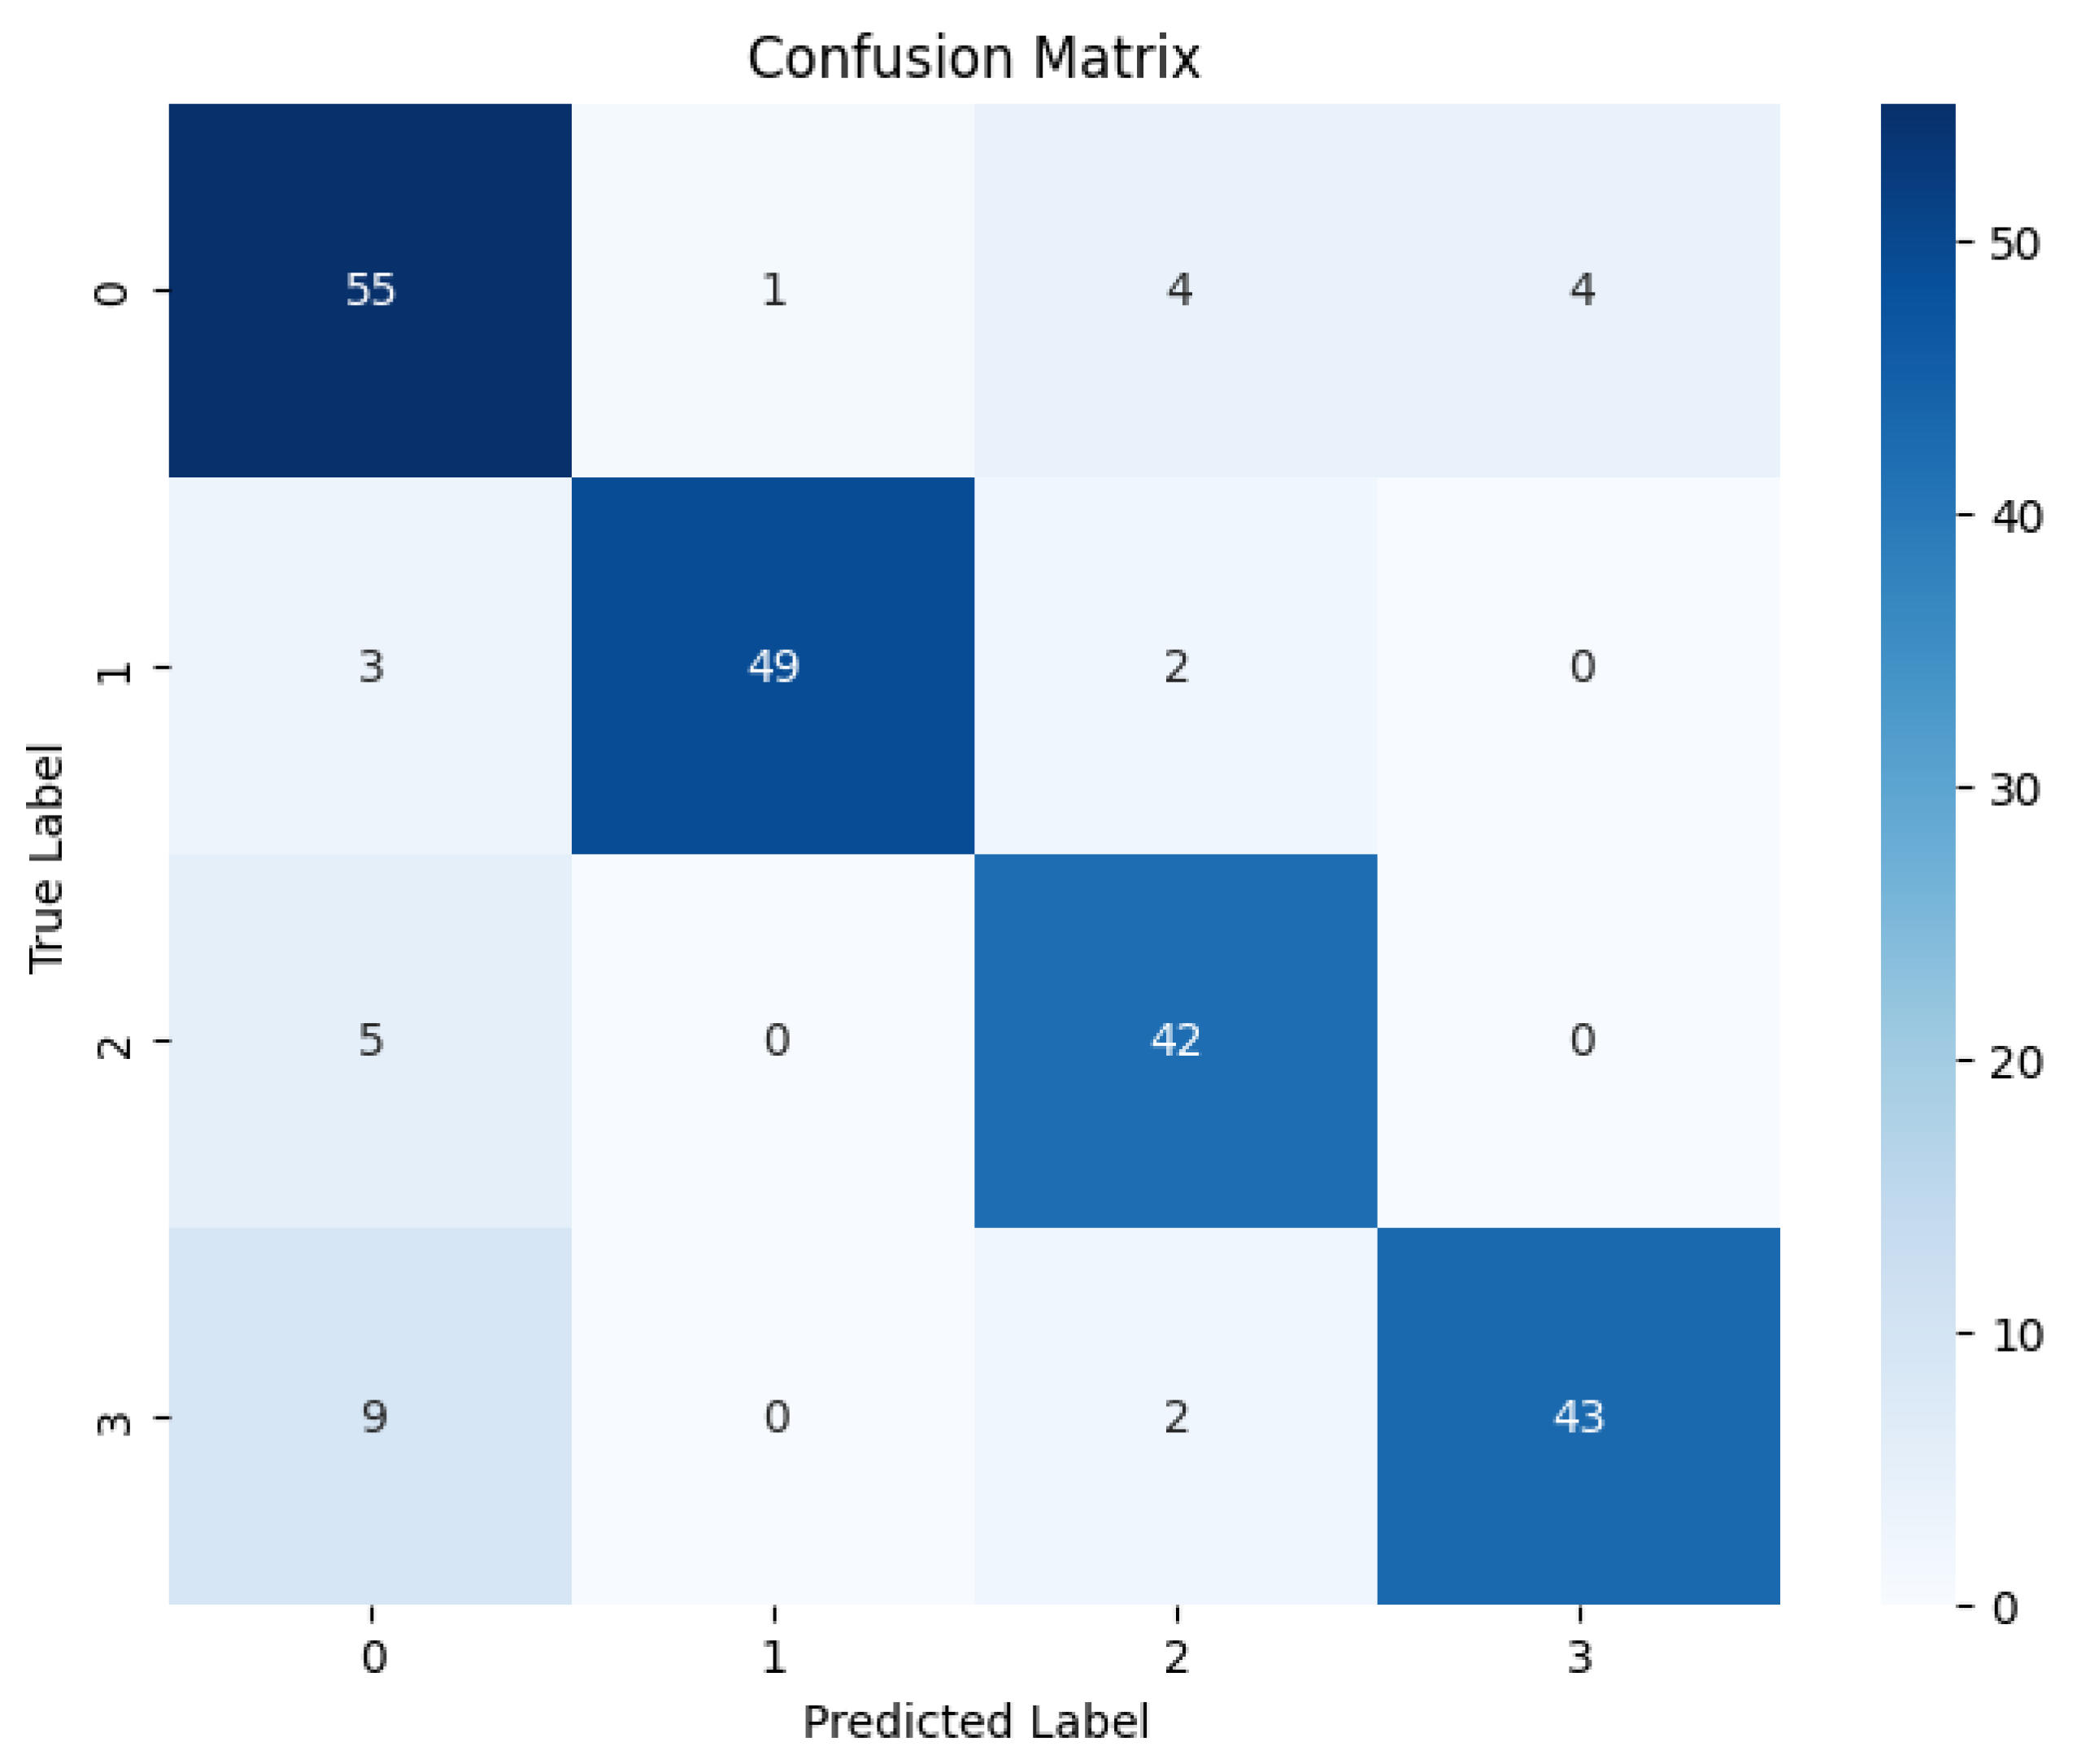
Figure 12.
ROC curve of diabetic retinopathy fundus image classification using LBP and CNN methods.
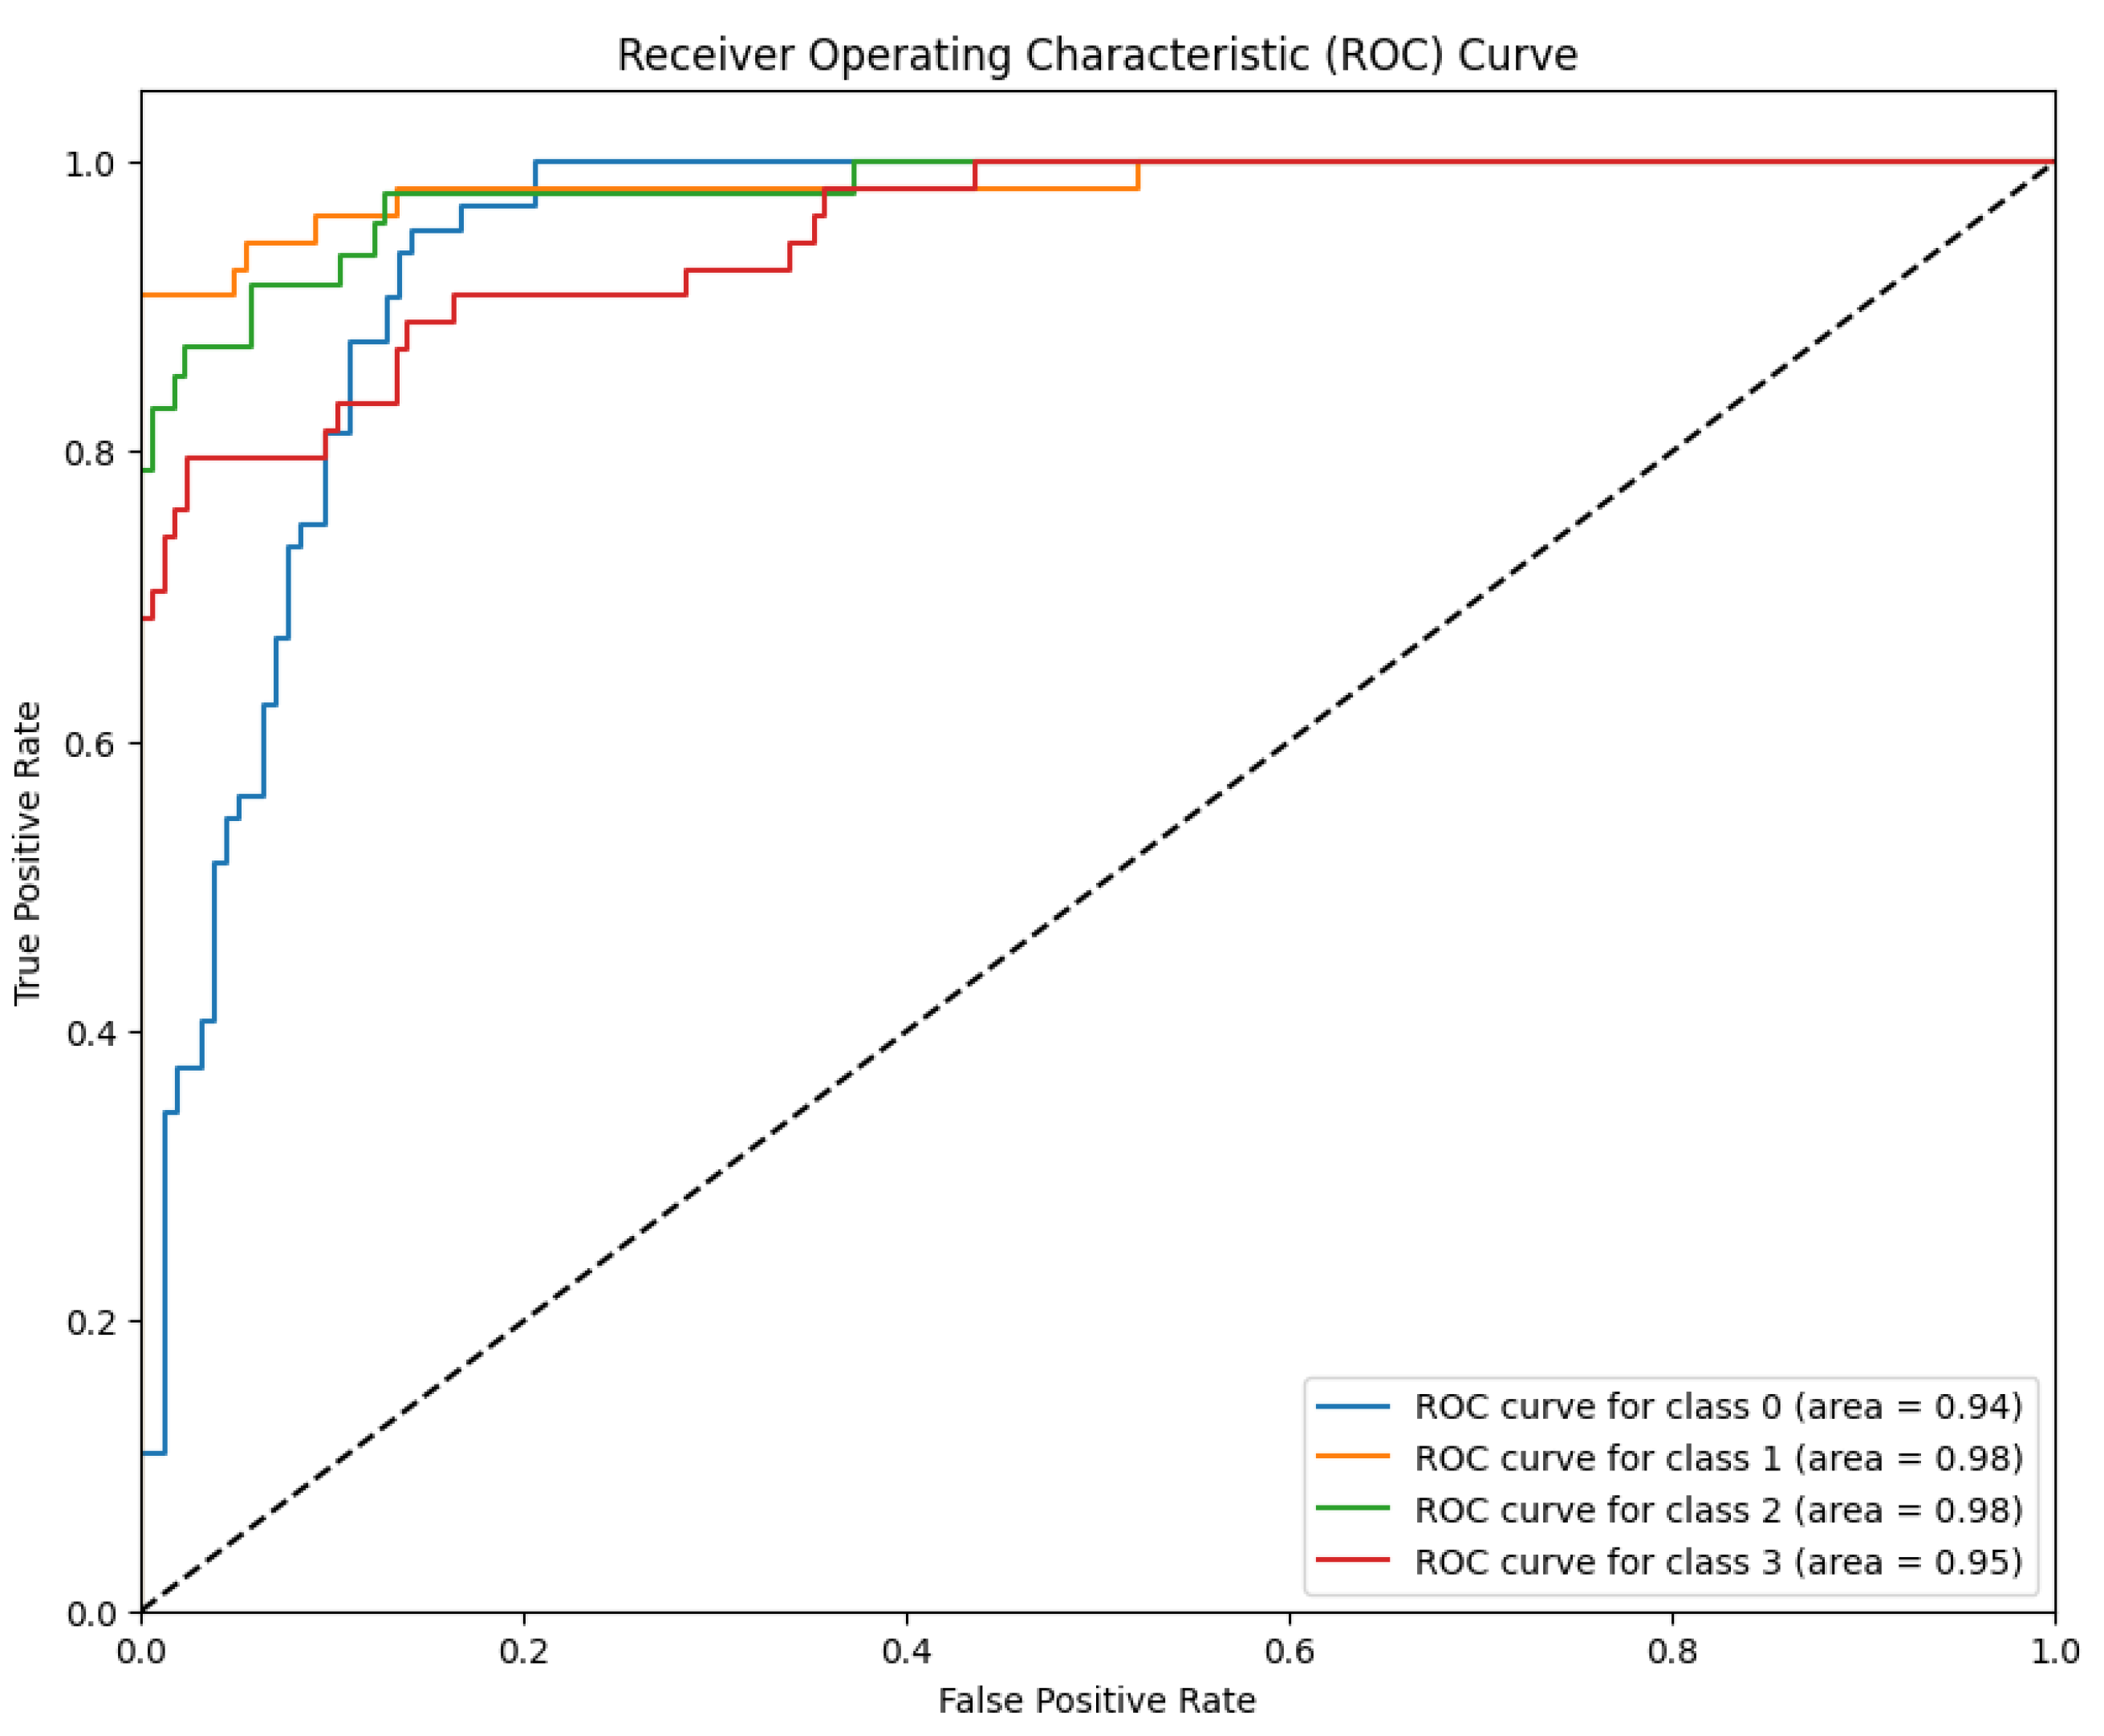
Figure 13.
Results of applying a color histogram to a fundus image of diabetic retinopathy.
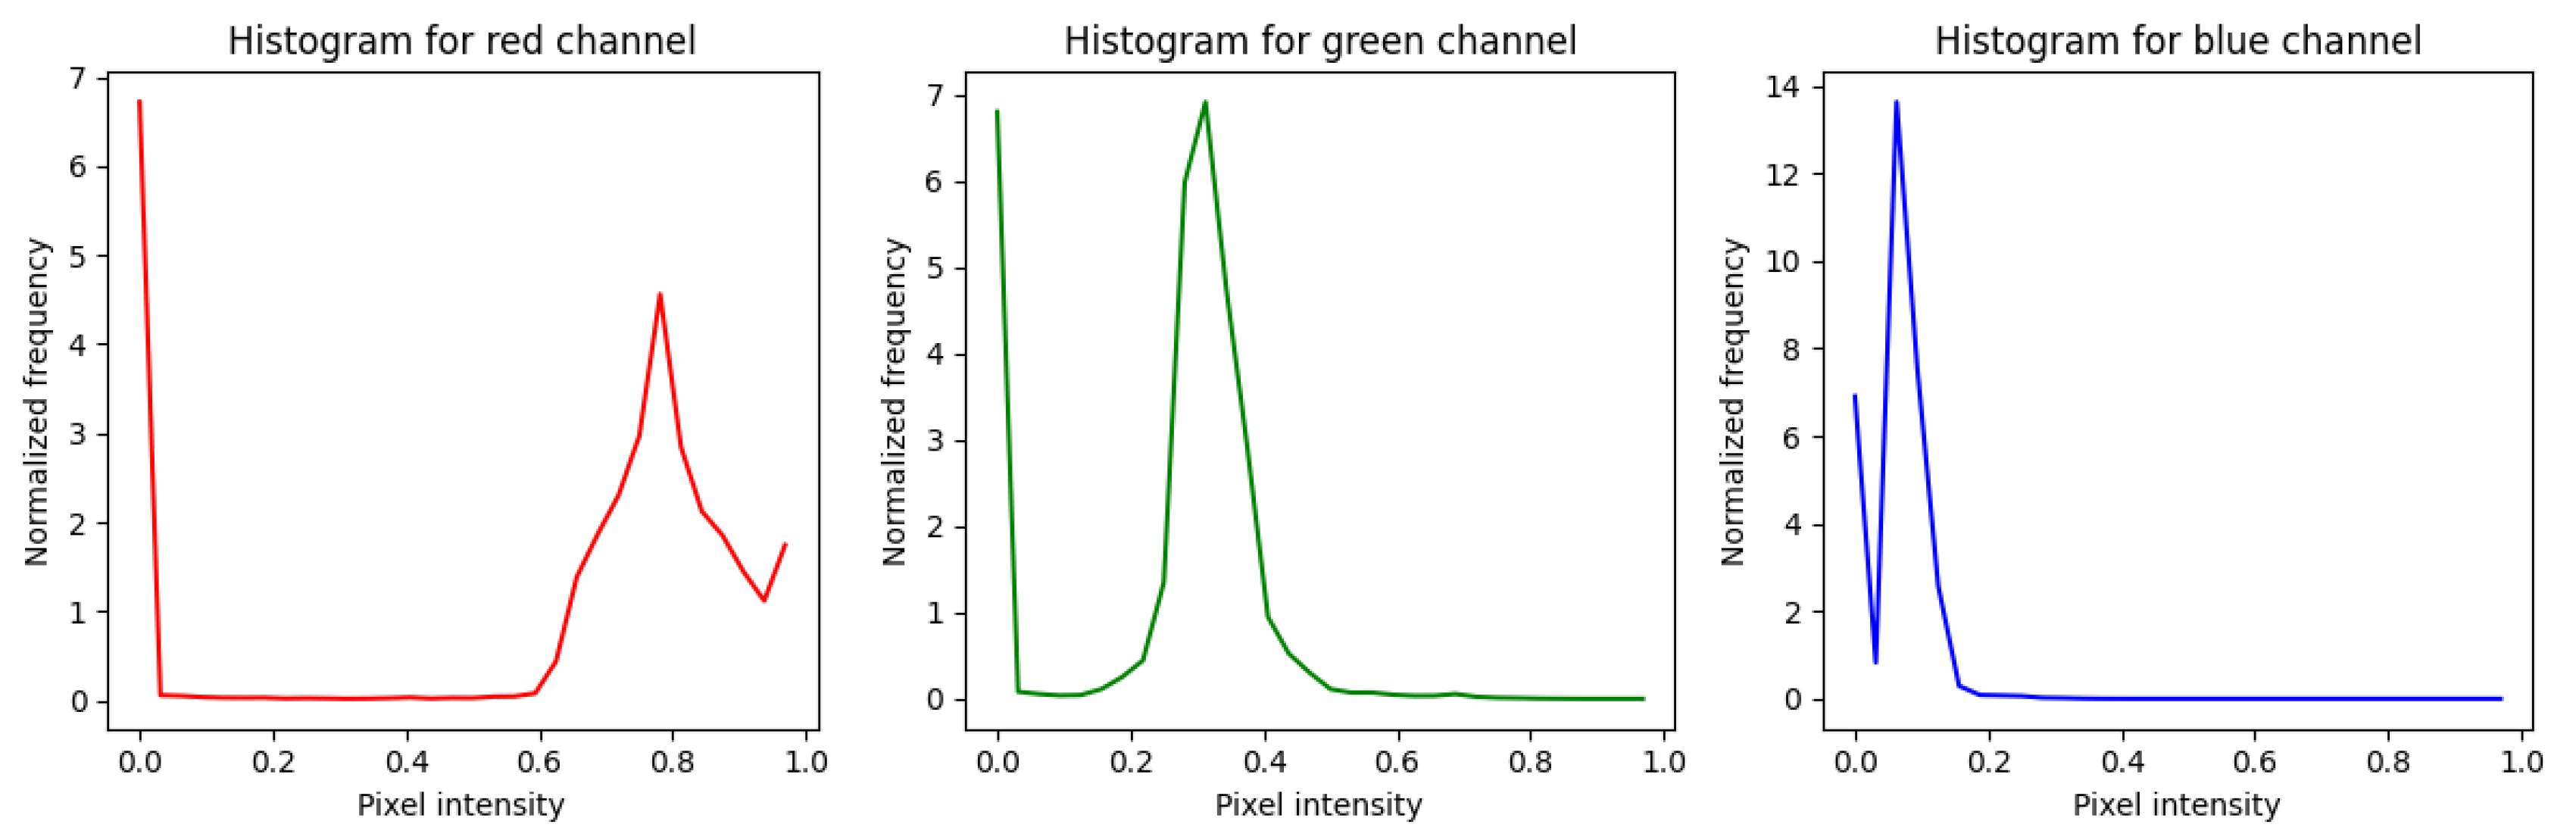
Figure 14.
Confusion matrix classification of diabetic retinopathy fundus images using the color histogram and CNN methods.
Figure 14.
Confusion matrix classification of diabetic retinopathy fundus images using the color histogram and CNN methods.
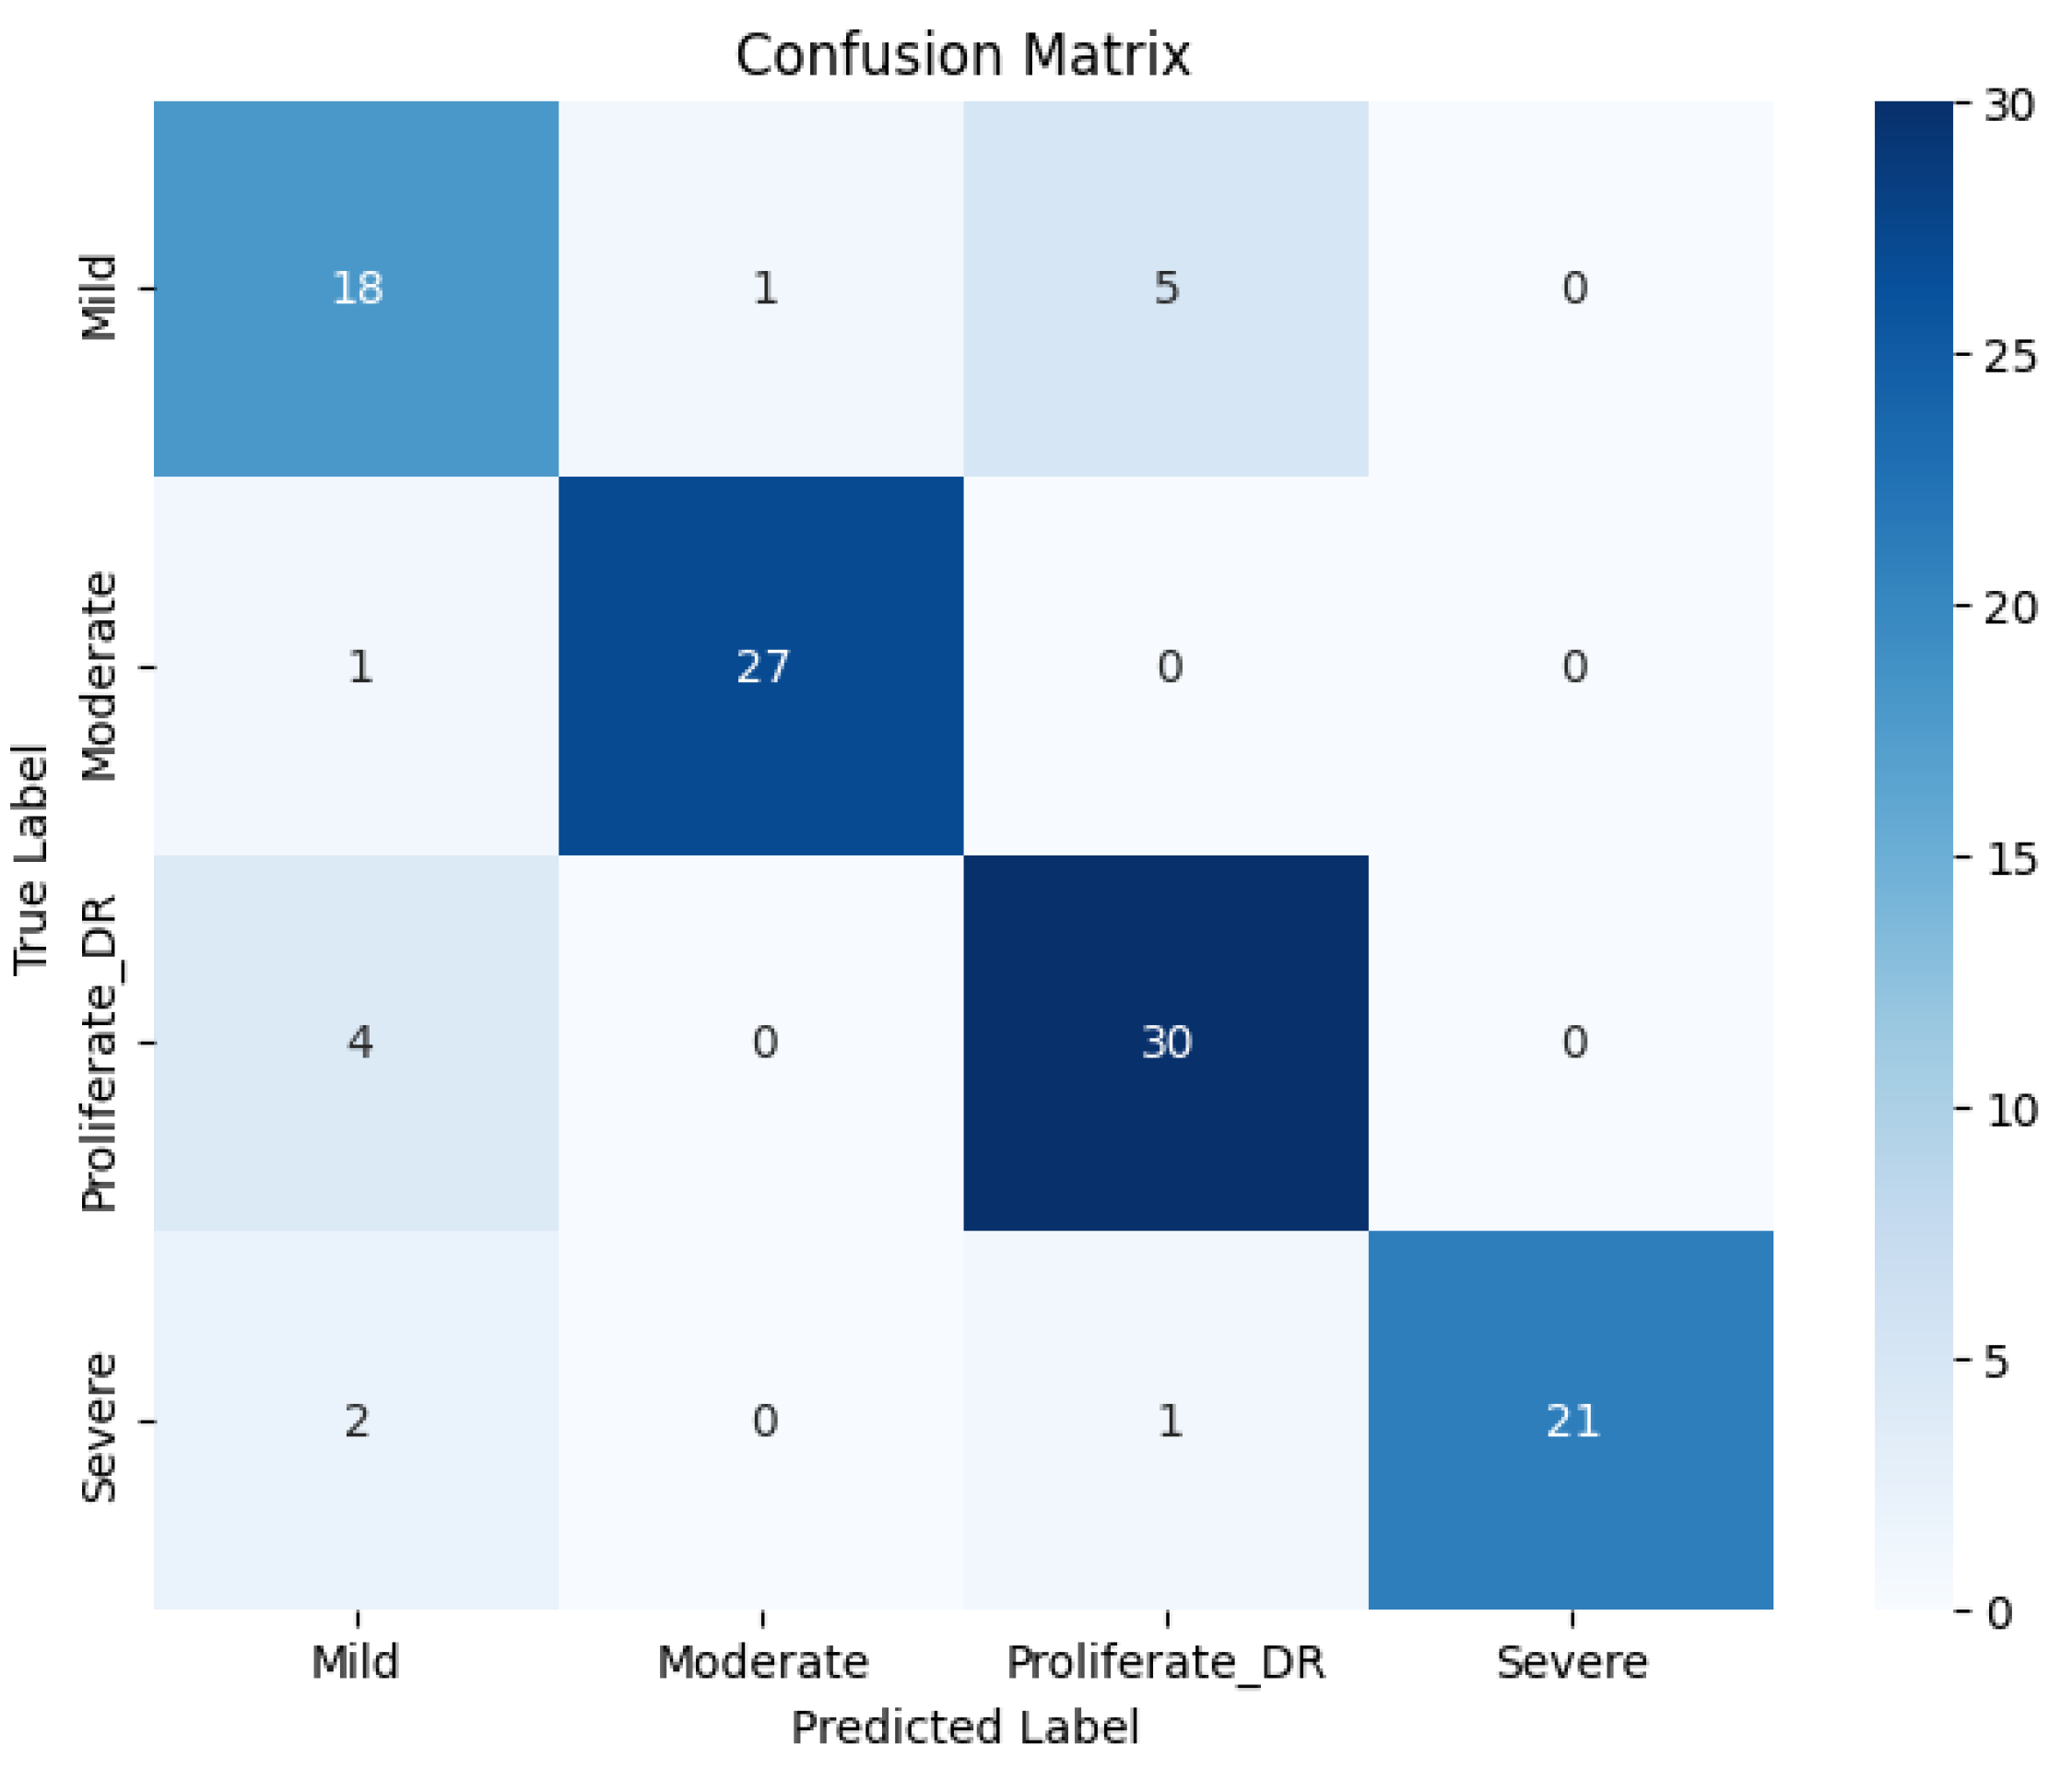
Figure 15.
ROC curve of diabetic retinopathy fundus image classification using color histogram and CNN methods.
Figure 15.
ROC curve of diabetic retinopathy fundus image classification using color histogram and CNN methods.
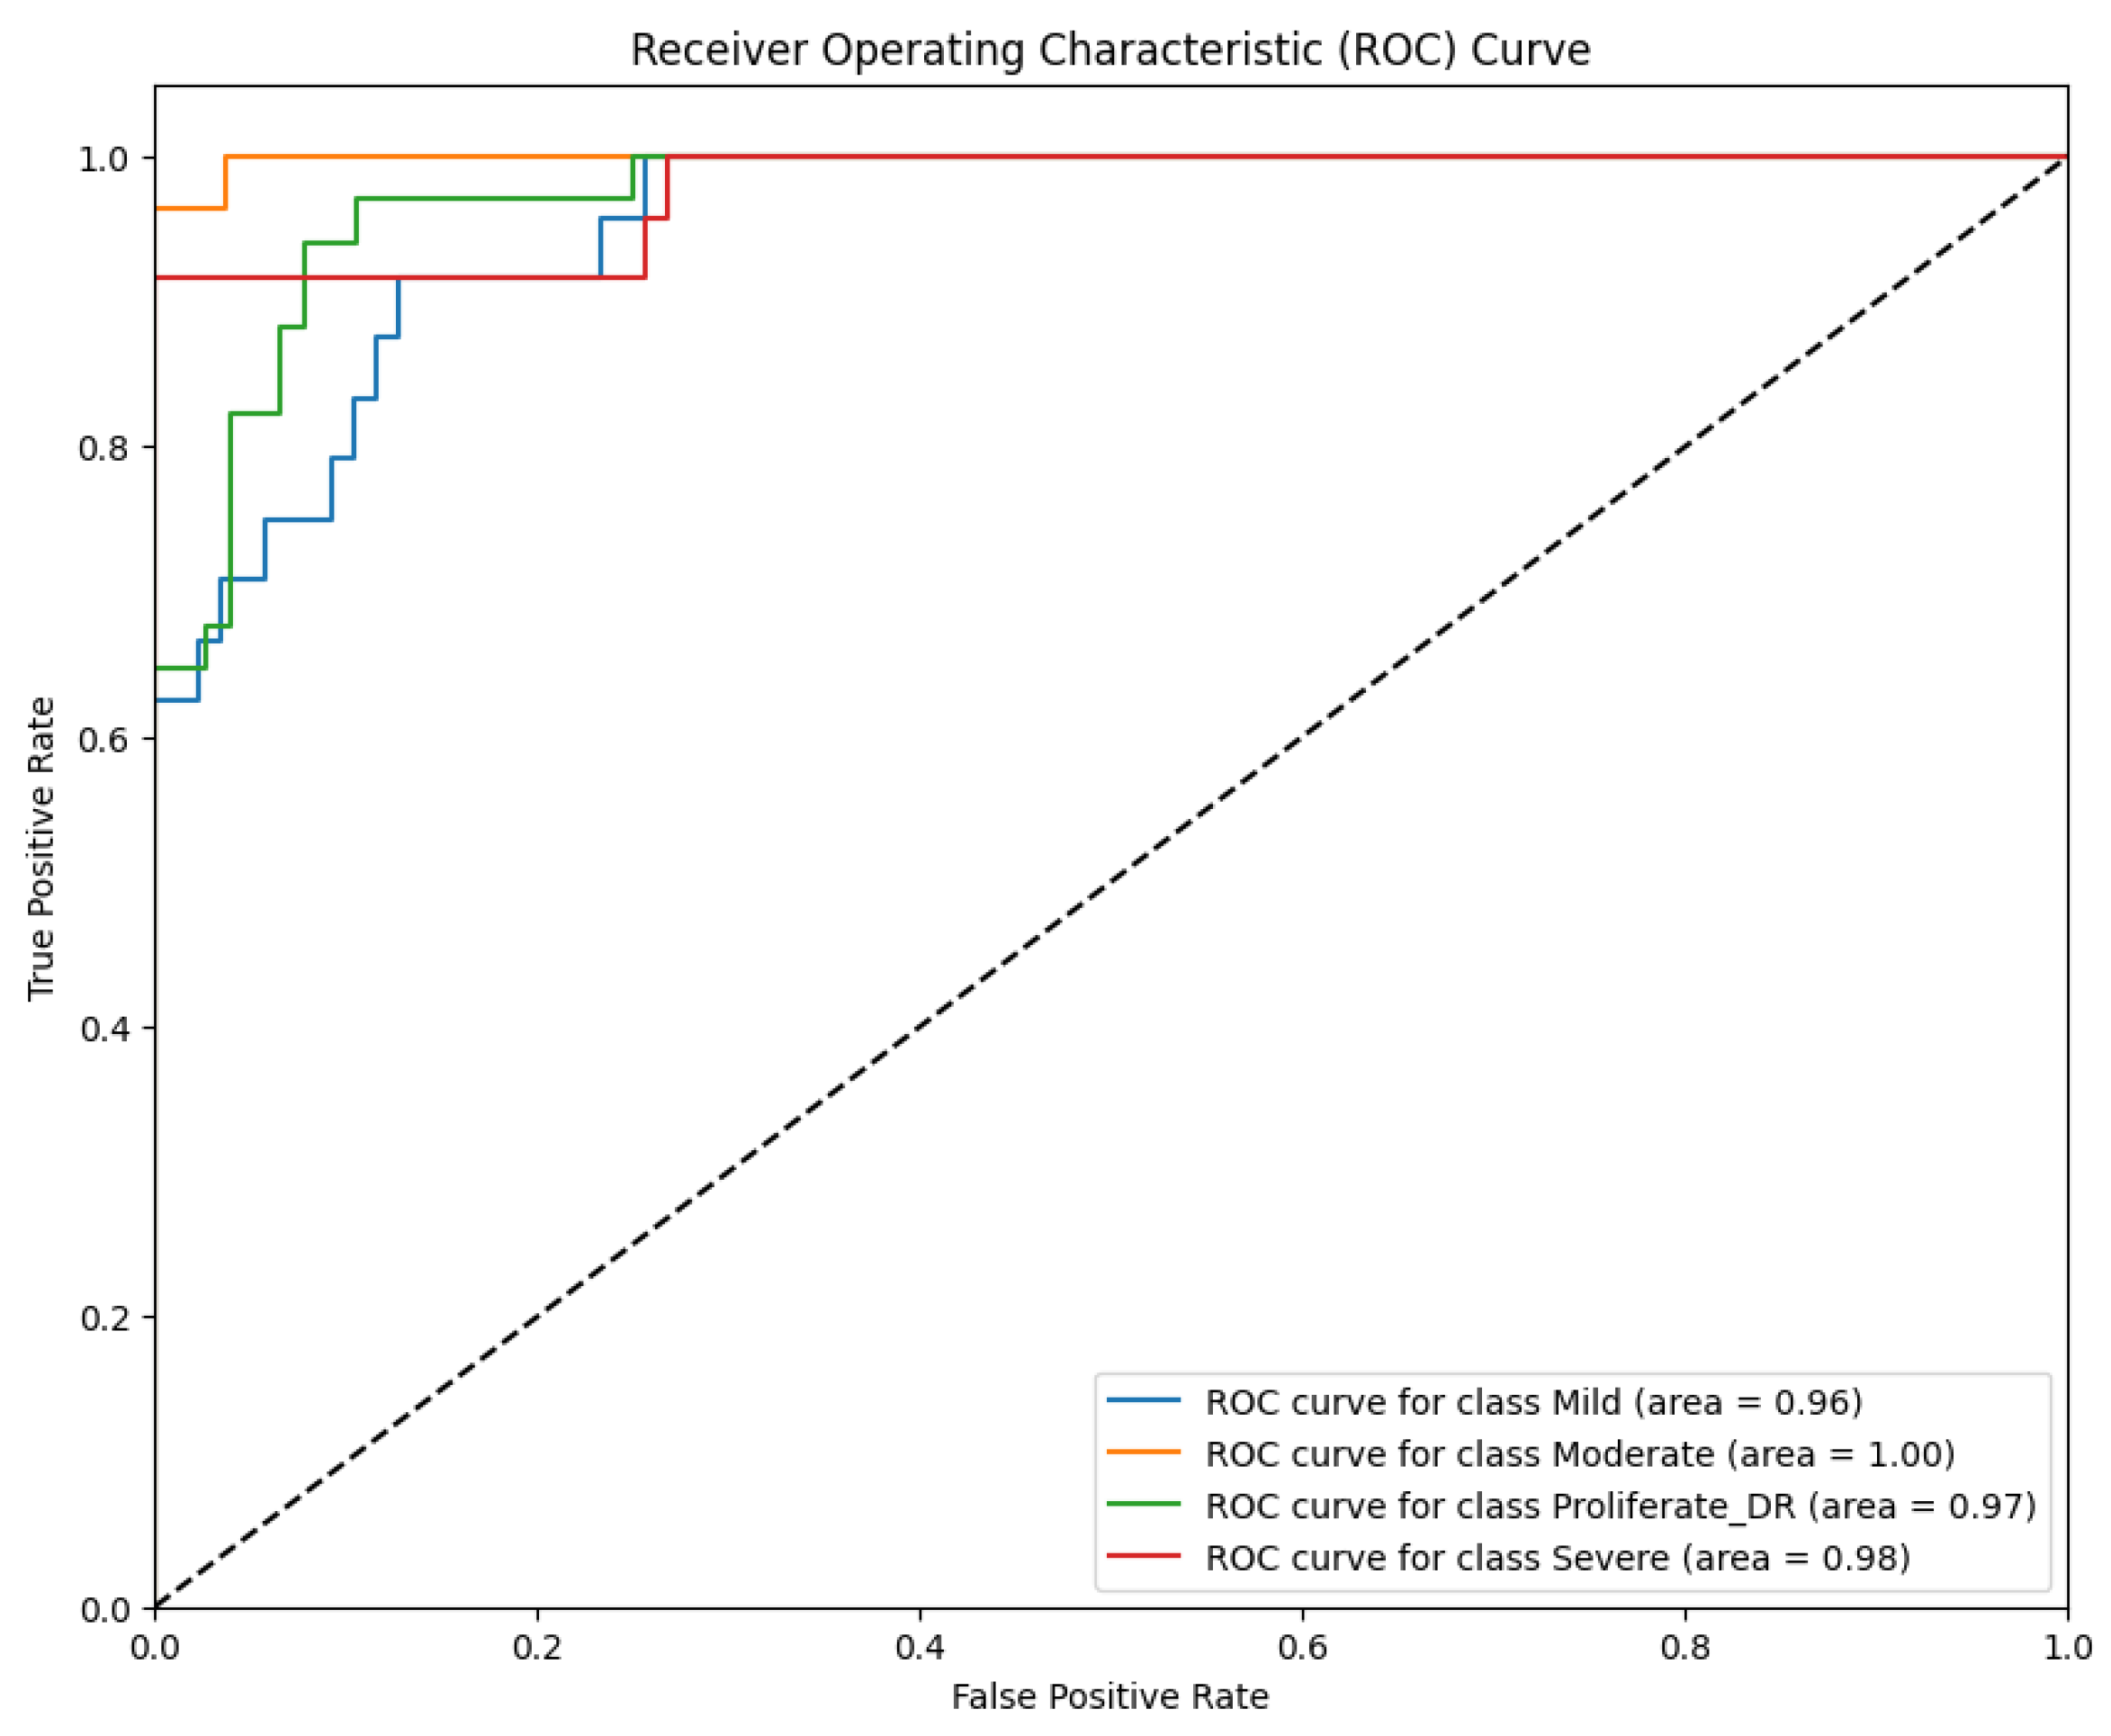

Table 1.
Results of the fundus image classification experiment of diabetic retinopathy using the Gabor filter and CNN methods.
Table 1.
Results of the fundus image classification experiment of diabetic retinopathy using the Gabor filter and CNN methods.
| Class | Precision | Recall | F1 Score |
| Mild | 84% | 75% | 80% |
| Moderate | 98% | 96% | 97% |
| Severe | 89% | 94% | 91% |
| Proliferate DR | 84% | 91% | 88% |
| Accuracy | 89% | ||
| Macro Avg | 89% | 89% | 89% |
| Weighted Avg | 89% | 89% | 89% |
Table 2.
Results of the Fundus Image Classification Experiment of Diabetic Retinopathy Using LBP and CNN Methods.
Table 2.
Results of the Fundus Image Classification Experiment of Diabetic Retinopathy Using LBP and CNN Methods.
| Class | Precision | Recall | F1 Score |
| Mild | 76% | 86% | 81% |
| Moderate | 98% | 91% | 94% |
| Severe | 84% | 89% | 87% |
| Proliferate DR | 91% | 80% | 85% |
| Accuracy | 86% | ||
| Macro Avg | 87% | 86% | 87% |
| Weight Avg | 87% | 86% | 86% |
Table 3.
Results of the fundus image classification experiment of diabetic retinopathy using color histogram and CNN methods.
Table 3.
Results of the fundus image classification experiment of diabetic retinopathy using color histogram and CNN methods.
| Class | Precision | Recall | F1 Score |
| Mild | 72% | 75% | 73% |
| Moderate | 96% | 96% | 96% |
| Severe | 100% | 88% | 93% |
| Proliferate DR | 83% | 88% | 86% |
| Accuracy | 87% | ||
| Macro Avg | 88% | 87% | 87% |
| Weighted Avg | 88% | 87% | 87% |
Table 4.
Comparison of the confusion matrix evaluation results in the diabetic retinopathy fundus image classification model experiment (in percent).
Table 4.
Comparison of the confusion matrix evaluation results in the diabetic retinopathy fundus image classification model experiment (in percent).
| Model | Accuracy | Precision | Recall | F1 Score |
| Model 1 (Gabor+CNN) | 89% | 88.75% | 89% | 89% |
| Model 2 (LBP+CNN) | 86% | 87.25% | 86.50% | 86.75% |
| Model 3 (CH+CNN) | 87% | 87.25% | 86.75% | 87% |
Table 5.
Comparison of AUC ROC curve evaluation results in diabetic retinopathy fundus image classification model experiment (in percent).
Table 5.
Comparison of AUC ROC curve evaluation results in diabetic retinopathy fundus image classification model experiment (in percent).
| Class |
Model 1 (Gabor+CNN) |
Model 2 (LBP+CNN) | Model 1 (CH+CNN) |
| Mild | 93% | 94% | 96% |
| Moderate | 100% | 98% | 100% |
| Severe | 97% | 98% | 98% |
| Proliferate DR | 99% | 95% | 95% |
Disclaimer/Publisher’s Note: The statements, opinions and data contained in all publications are solely those of the individual author(s) and contributor(s) and not of MDPI and/or the editor(s). MDPI and/or the editor(s) disclaim responsibility for any injury to people or property resulting from any ideas, methods, instructions or products referred to in the content. |
© 2026 by the authors. Licensee MDPI, Basel, Switzerland. This article is an open access article distributed under the terms and conditions of the Creative Commons Attribution (CC BY) license.
Copyright: This open access article is published under a Creative Commons CC BY 4.0 license, which permit the free download, distribution, and reuse, provided that the author and preprint are cited in any reuse.


