
Submitted:
03 January 2026
Posted:
06 January 2026
You are already at the latest version
Abstract
Alcohol-associated liver disease (ALD) is driven by complex interactions among hepatic lipid accumulation, oxidative stress, inflammation, cell death, and disruption of the gut–liver axis. Therapeutic strategies capable of targeting multiple interconnected pathogenic pathways remain limited. In this study, we investigated the protective potential of graphene oxide nanoparticles (GNPs) in a chronic ethanol-fed rat model of ALD. Male Wistar rats were subjected to ethanol feeding and intermittently treated with GNPs (10 mg/kg) by oral gavage. Hepatic injury was assessed by biochemical parameters, histology, lipid accumulation, gene and miRNA expression, protein analysis, and gut microbiome profiling. Ethanol feeding induced hepatic steatosis, oxidative stress, apoptotic and necroptotic signaling, intestinal barrier disruption, gut dysbiosis, and activation of hepatic inflammatory pathways. GNP treatment markedly attenuated ethanol-induced lipid accumulation, normalized liver morphology, and reduced biochemical markers of liver injury. These effects were accompanied by restoration of antioxidant defenses, including Nrf2 and HO-1, and suppression of CYP2E1 expression and cell death–associated markers. In parallel, GNPs preserved intestinal architecture, maintained tight junction gene expression, and suppressed intestinal inflammatory responses. Gut microbiome analysis revealed partial restoration of ethanol-induced dysbiosis, including recovery of beneficial postbiotic-associated bacterial taxa. Improved intestinal homeostasis was associated with attenuation of hepatic TLR4-associated inflammatory signalling and modulation of macrophage-associated markers. Furthermore, GNP treatment partially normalized ethanol-induced dysregulation of miRNAs implicated in lipid metabolism, inflammation, and oxidative stress. Collectively, these findings demonstrate that GNPs exert a coordinated protective effect against ethanol-induced liver injury by modulating multiple pathological processes along the gut–liver axis. This multi-targeted activity highlights the therapeutic potential of graphene oxide nanoparticles as an intervention strategy for early-stage alcohol-associated liver disease.
Keywords:
alcohol abuse
; stress mechanism
; gut-liver axis
; pro-inflammatory cytokines
; anti-oxidants
; mitigation
Introduction
Alcohol-associated liver disease (ALD) remains a major cause of chronic liver morbidity and mortality worldwide [1]. Prolonged alcohol consumption induces a spectrum of pathological changes ranging from hepatic steatosis to steatohepatitis and progressive liver injury. Despite the liver’s inherent regenerative capacity, sustained metabolic stress, oxidative damage, inflammation, and cell death impair effective regeneration and promote disease progression [2]. Current therapeutic strategies for ALD are limited and largely supportive, highlighting the need for interventions that can target multiple interconnected pathogenic processes.
Increasing evidence indicates that ALD progression is strongly influenced by disruption of the gut–liver axis. Ethanol-induced intestinal barrier dysfunction and gut dysbiosis enhance translocation of microbial-derived inflammatory signals to the liver, amplifying hepatic inflammation and immune activation [3,4,5]. In parallel, ethanol metabolism promotes lipid accumulation, oxidative stress, and activation of inflammatory signalling pathways, including TLR4-associated mechanisms, which together drive hepatocellular injury. Owing to the multifactorial nature of ALD, therapeutic approaches targeting single downstream pathways have shown limited efficacy, underscoring the need for multi-target strategies that can modulate both hepatic and intestinal pathology [6].
Graphene oxide nanoparticles (GNPs) have emerged as promising bioactive nanomaterials owing to their unique two-dimensional structure, high surface area, and capacity to interact with biological membranes and signalling pathways. Previous studies have demonstrated that graphene-based nanomaterials can influence lipid metabolism, oxidative stress responses, and inflammatory signalling in a context-dependent manner[7]. Importantly, our earlier in vitro work showed that GNPs exert protective effects in hepatic and intestinal epithelial cell models without compromising cell viability or barrier integrity [8]. However, the therapeutic potential of GNPs in vivo, particularly in the context of ethanol-induced gut–liver axis dysfunction, remains poorly understood.
In the present study, we investigated the protective effects of GNPs in a chronic ethanol-fed rat model of alcohol-associated liver disease. By integrating hepatic, intestinal, microbiome, transcriptional, miRNA, and protein-level analyses, we evaluated whether GNP treatment attenuates ethanol-induced liver injury through coordinated modulation of pathological processes along the gut–liver axis. Collectively, these findings suggest that GNPs function as a protective nanoplatform that may be further optimized or combined with complementary therapeutic strategies to enhance efficacy against the complex pathophysiology of alcohol-associated liver disease.
Materials and Methodology
Materials
Animals were procured from Cadila Pharmaceuticals Pvt. Ltd., Ahmedabad. For Biochemical parameters, cholesterol, triglyceride, ALT, AST, and GGT kits were procured from Choral Science Pvt. Ltd. For H and E staining the stains were procured from HiMedia Thane, India. Nile red was procured from Sisco Research Laboratories, Mumbai, India; RNAisoplus (Cat. No. 9109) from Singa, Japan; cDNA synthesis kit (Cat. No. AB1453) from Thermo Scientific and PowerUp SYBR Green Master Mix from Thermo Scientific (Waltham, MA, USA). For miRNA primers, they were procured from Barcode Bioscience Pvt. Ltd. from Bangalore, India, and from gene expression studies, primers were procured from Imperial Life Sciences Pvt. Ltd. from Gurgaon, India; SyBr Green (Cat no. NXG444-XL) for miRNA was used from NextGen Pvt. Ltd., Delhi, India. Antibodies for protein studies were used from CSL, Melbourne, Australia. All the food components for animal studies were procured from HiMedia, Thane, India.
Methodology
Animals and Ethics Statement
All animal experiments were conducted in accordance with the CPCSEA (Committee for the Purpose of Control and Supervision of Experiments on Animals) guidelines and were approved by the Institutional Animal Ethics Committee of Charotar University of Science and Technology (IAEC approval no. RPCP/IAEC/2023-24/R16).
Eight- to ten-week-old male Wistar rats (180-200 g) were procured from Cadila Pharmacy Pvt. Ltd. (Ahmedabad, Gujarat, India). Upon arrival, animals were housed under controlled environmental conditions (temperature 25 ± 2 °C; relative humidity 55 ± 5%) with a 12 h light/dark cycle. Rats were housed two per cage and provided with standard chow diet and water ad libitum. Animals were allowed to acclimatize for 7 days prior to initiation of experimental procedures.
Experimental Design and Animal Dossing
Following the acclimatization period, animals were randomly allocated into experimental groups (n = 6 per group). Ethanol-fed groups received a Lieber–DeCarli liquid diet with a gradual escalation of ethanol concentration from 1% to 5% (v/v) over the first week, followed by maintenance at 5% ethanol for a total duration of 28 days. Over 28 days, animals were fed 31.5% (v/v) of ethanol once in 10 days of interval [9]. Pair-fed control animals were provided an isocaloric liquid diet matched to the ethanol-fed group to ensure comparable caloric intake. Control animals received a standard chow diet.
For treatment studies, graphene oxide nanoparticles (GNPs) were administered orally by gavage at a dose of 10 mg/kg body weight. Dosing was performed once every five days throughout the experimental period. The dosing volume was adjusted according to individual body weight measurements recorded weekly. All treatments were administered at consistent times to minimize circadian variability.
Biochemical Studies
At the end of the study, animals were fasted for atleast 20 h and then their blood was collected from retroorbital region. The collected blood was then centrifuged and their serum was separated. The separated serum was further used for biochemical studies. The biochemical studies were performed as per the kit manufacturer's protocol.
Histological Analysis
At the end of the experimental period, tissue samples (liver/colon/kidney, as applicable) were collected, weighed, and gross morphological features were recorded. Tissues were fixed in 10% neutral-buffered formalin, followed by routine processing and paraffin embedding. Briefly, fixed tissues were washed under running water, dehydrated through a graded series of isopropyl alcohol (30%, 70%, 90%, and 100%), cleared in xylene, and embedded in molten paraffin wax.
Paraffin blocks were sectioned at 4–5 μm thickness using an automated rotary microtome (Leica RM2255). Sections were mounted on poly-L-lysine–coated glass slides (0.1% w/v), deparaffinized, rehydrated, and stained with hematoxylin, followed by counterstaining with eosin using a Gemini AS Automated Slide Stainer (Thermo Scientific). Stained sections were examined under a light/phase-contrast microscope at ×40 magnification, and representative images were captured using identical acquisition settings across groups.
Immunohistochemical Studies
Paraffin-embedded tissue sections were deparaffinized and rehydrated. Antigen retrieval was performed using the autoclave method in alkaline retrieval buffer (pH 9.0) as previously described [10]. Endogenous peroxidase activity was quenched with 3% hydrogen peroxide for 30 min. Sections were incubated with primary antibodies against CYP2E1 or cleaved caspase-3 (1:200), followed by EnVision™ HRP/DAB detection (Agilent Dako, Denmark). Slides were counterstained with Mayer’s hematoxylin, mounted, and examined by light microscopy [11].
Lipid Accumulation Studies
For lipid accumulation, the liver tissue sample was prefixed, sectioned at 4 μm, and mounted on a glass slide. The slide was then stained with 40 μM Nile red stain and incubated for 15 min. Furthermore, the slides were imaged using a confocal microscope.
Gut Microbiome Studies
Metagenomic DNA was extracted from fecal samples using the QIAamp DNA Stool Mini Kit (Qiagen) according to the manufacturer’s instructions. DNA quality and concentration were assessed using a NanoDrop spectrophotometer by determining the A260/280 ratio.
The V3–V4 region of the bacterial 16S rRNA gene was amplified using universal primers (forward: GCCTACGGGNGGCWGCAG; reverse: ACTACHVGGGTATCTAATCC). Amplicon libraries were prepared using the Nextera XT Index Kit (Illumina) following the standard 16S Metagenomic Sequencing Library Preparation protocol. Libraries were purified using AMPure XP beads and quantified using a Qubit fluorometer.
Library quality and fragment size distribution were assessed using the Agilent 4200 TapeStation system with D1000 ScreenTape. Paired-end sequencing (2 × 300 bp) was performed on an Illumina MiSeq platform after cluster generation at a final loading concentration of 10 pM. Bioinformatic analysis was performed using standard pipelines (e.g., QIIME2) with taxonomic assignment against a reference database
Gene Expression Analysis
Total RNA was isolated from 100 mg of tissue homogenized in RNAiso Plus using a homogenizer. cDNA was synthesized from 1 μg of total RNA using a Verso cDNA synthesis kit. Quantitative real-time PCR was performed using 50 ng of cDNA, and relative gene expression was calculated using the 2^−ΔΔCt method, with β-actin used as the internal reference gene.
miRNA Expression Analysis
miRNA expression analysis was performed as described previously. Briefly, total RNA was reverse-transcribed using a universal poly(T) adaptor (5′-GCGAGCACAGAATTAATACGAC-3′). Quantitative PCR was carried out using miRNA-specific forward primers and the universal adaptor as the reverse primer mentioned in table 1. miRNA expression levels were normalized and analyzed using comparative CT methods [12].
Protein Expression Analysis
Liver tissue (50 mg) was homogenized in mammalian protein extraction buffer supplemented with protease inhibitors. Proteins were separated by SDS–PAGE and transferred onto PVDF membranes. Membranes were incubated with primary antibodies against Nrf2, HO-1, and β-actin, followed by appropriate HRP-conjugated secondary antibodies. Protein bands were visualized using enhanced chemiluminescence (ECL) on a Bio-Rad imaging system [12].
Results
Liver Histology and Biochemical Parameters
Chronic ethanol feeding resulted in marked hepatomegaly, as evidenced by increased liver size and a higher liver-to-body weight ratio compared with the control and pair-fed groups (Fig. 1A,C). Histological examination revealed pronounced hepatic vacuolation and inflammatory infiltration in ethanol-fed rats. In contrast, these alterations were markedly reduced in GNP-treated animals (Fig. 1B). Consistent with these findings, ethanol exposure significantly increased serum ALT, AST, and GGT levels, along with elevated total cholesterol and triglycerides (Fig. 1C). Treatment with GNPs significantly attenuated these biochemical alterations, indicating improved hepatic function.
GNPs Attenuate Ethanol-Induced Hepatic Lipid Accumulation and Dysregulation of Lipid-Associated Genes
Nile Red staining revealed extensive neutral lipid accumulation in the livers of ethanol-fed rats, which was markedly reduced following GNP treatment (Fig. 2A). Consistent with these findings, ethanol feeding significantly increased hepatic mRNA expression of CYP2E1, AKT, mTORC, and MCP1, whereas GNP treatment attenuated the expression of these genes (Fig. 2B). In parallel, ethanol exposure altered the expression of oxidative stress and metabolic regulators, including Nrf2, HO-1, and PPARα. GNP treatment partially restored the expression of these genes toward control levels (Fig. 2C). Consistent with improved hepatic lipid accumulation, GNP treatment was associated with a gradual trend toward normalization of PPARα, Nrf2, and HO-1 mRNA expression, although these changes did not reach statistical significance. Taken together, the data presented suggest that GNPs attenuate ethanol-induced toxicity by reducing hepatic lipid accumulation and lipid-associated gene expression.
Furthermore, the expression of CYP2E1 and mTORC/AKT is associated with cell death-related mechanisms, primarily by targeting necroptosis, apoptosis, and necrosis.
GNPs Attenuate Ethanol-Induced Apoptotic and Necroptotic Signalling
Chronic ethanol feeding significantly increased hepatic mRNA expression of genes associated with apoptotic and necroptotic pathways, including RIPK1, RIPK3, MLKL, Caspase-3, and Caspase-8, compared with control animals (Fig. 3). In parallel, ethanol exposure altered the expression of autophagy- and survival-related markers, including Beclin1 and BCL2. Treatment with GNPs markedly attenuated the ethanol-induced upregulation of apoptotic and necroptotic markers, restoring their expression levels toward those observed in control animals (Fig. 3). These changes were consistent across multiple cell death–associated pathways, indicating suppression of ethanol-induced cell death–related signalling at the transcriptional level.
Inflammation arising from hepatocellular death can activate pattern recognition receptors, leading to Kupffer cell–mediated inflammatory responses. In parallel, gut dysbiosis represents an additional indirect mechanism that promotes Kupffer cell activation, thereby contributing to progressive liver injury.
GNPs Attenuate Ethanol-Induced Intestinal Injury and Modulate Gut–Liver Axis–Associated TLR4 Signalling and miRNA Expression
GNPs Attenuate Ethanol-Induced Intestinal Injury and Gut Dysbiosis
Ethanol feeding resulted in marked disruption of intestinal architecture, characterized by altered mucosal organization and inflammatory features, whereas these histological changes were substantially attenuated following GNP treatment (Fig. 4A). Analysis of gut microbiota composition revealed ethanol-induced alterations in the relative abundance of major bacterial phyla, indicative of gut dysbiosis. GNP treatment partially restored the microbial composition toward that observed in control animals (Fig. 4B). Consistent with these findings, ethanol exposure significantly reduced intestinal expression of tight junction markers, including ZO-1, occludin, and claudin. GNP treatment significantly improved tight junction gene expression and attenuated ethanol-induced inflammatory gene expression (Fig. 4C). These alterations in gut microbial composition occurred in parallel with intestinal barrier disruption
Hierarchical clustering analysis revealed distinct alterations in gut microbial composition following ethanol exposure, with clear separation from control samples (Fig. 5A). GNP-treated samples clustered more closely with control samples, indicating partial restoration of ethanol-induced microbiota alterations. β-diversity analysis demonstrated clear separation between ethanol-fed and control animals using unweighted PCoA, indicating changes in microbial community membership (Fig. 5B). In contrast, weighted PCoA showed that GNP treatment partially restored ethanol-induced alterations in microbial community structure, reflecting changes in both taxa presence and relative abundance (Fig. 5C).
GNPs Suppress Ethanol-Induced Intestinal Inflammatory Responses
Ethanol feeding resulted in a marked upregulation of intestinal pro-inflammatory markers, including IL-1β, NF-κB, and IL-6, compared with control animals (Fig. 6). In contrast, expression of the anti-inflammatory cytokine IL-4 was significantly reduced. GNP treatment significantly attenuated ethanol-induced increases in IL-1β, NF-κB, and IL-6 expression, restoring their levels toward those observed in control animals. IL-4 expression was also partially restored following GNP treatment (Fig. 6). These inflammatory changes were consistent with the improvements in intestinal histology and gut microbiota composition observed in preceding figures.
GNPs Modulate Hepatic TLR4-Associated Inflammatory Signalling
Ethanol feeding resulted in a significant upregulation of hepatic TLR4 expression, accompanied by increased expression of downstream inflammatory mediators, including iNOS and NF-κB, compared with control animals (Fig. 7). In parallel, expression of arginase was reduced following ethanol exposure. GNP treatment significantly attenuated ethanol-induced increases in TLR4, iNOS, and NF-κB expression, while restoring arginase expression toward control levels (Fig. 7). These findings indicate modulation of hepatic inflammatory signalling pathways associated with TLR4 following GNP treatment.
To explore potential regulatory mechanisms underlying these changes, we next assessed miRNA expression
GNPs Regulate miRNA Expression Linked to Gut–Liver Axis Signalling
Ethanol feeding resulted in significant dysregulation of multiple miRNAs implicated in hepatic metabolism and inflammatory regulation. Expression of miR-122, miR-22, and miR-203a was significantly reduced in ethanol-fed animals compared with controls, whereas miR-21 and miR-214 were markedly upregulated (Fig. 8). GNP treatment significantly modulated ethanol-induced miRNA alterations, partially restoring the expression of miR-122, miR-22, and miR-203a, while attenuating the ethanol-induced upregulation of miR-21 and miR-214 (Fig. 8). These miRNA expression changes were observed in parallel with improved intestinal inflammatory status and modulation of hepatic TLR4-associated signalling.
We next evaluated whether these transcriptional changes were reflected at the protein level.
GNPs Modulate Ethanol-Induced Stress–Related Protein Expression
Immunohistochemical analysis revealed marked induction of CYP2E1 and cleaved caspase-3 in the livers of ethanol-fed animals compared with pair-fed controls (Fig. 9A,B). In contrast, GNP treatment markedly reduced ethanol-induced CYP2E1 and cleaved caspase-3 immunoreactivity.
Consistent with these findings, immunoblot analysis demonstrated altered expression of oxidative stress–responsive proteins following ethanol exposure, characterized by reduced Nrf2 and HO-1 levels. GNP treatment restored Nrf2 and HO-1 protein expression toward levels observed in control animals (Fig. 9C), indicating modulation of ethanol-induced oxidative stress–related signalling.
Collectively, these findings demonstrate that GNP treatment consistently attenuates ethanol-induced intestinal and hepatic injury, improves gut microbial composition and intestinal barrier integrity, suppresses intestinal and hepatic inflammatory responses, and modulates TLR4-associated signalling, miRNA expression, and stress-related protein expression. Together, these coordinated changes highlight a broad protective effect of GNPs across the gut–liver axis in the context of ethanol exposure.
Discussion
Alcohol abuse leads to damage of both parenchymal and non-parenchymal liver cells, resulting in progressive liver degeneration. Although the liver possesses a remarkable regenerative capacity, effective regeneration requires prior resolution of the underlying inflammatory and metabolic insults. In the present study, GNPs were evaluated as a multi-target therapeutic approach aimed at modulating inflammation and key pathological mechanisms responsible for disease progression. In alcohol-associated liver disease, processes such as lipid accumulation, autophagy dysregulation, cell death, hepatic and intestinal inflammation, and gut dysbiosis play central roles in disease initiation and progression. Targeting these interconnected pathways may therefore support hepatic regeneration at early stages of disease.
Previously, we demonstrated that GNPs exert protective effects in in vitro models using HepG2 and Caco-2 cells, with minimal toxicity and preserved cellular integrity [8]. However, evidence supporting the therapeutic potential of GNPs in vivo remains limited. Owing to their unique two-dimensional allotropic structure, graphene-based nanomaterials have attracted interest across diverse biological and biomedical applications [13]. In the present study, male Wistar rats subjected to chronic ethanol feeding were intermittently treated with GNPs (10 mg/kg), allowing evaluation of both protective and preventive effects in a diseased animal model.
Ethanol exposure resulted in increased liver weight, yellowish discoloration, and pronounced lipid accumulation, whereas GNP treatment substantially normalized liver morphology and reduced hepatic lipid burden. Graphene-based nanomaterials have been reported to interact with lipid membranes and cholesterol-rich domains, potentially stabilizing membrane integrity and influencing lipid handling [14,15]. Such interactions may contribute to reduced hepatocellular ballooning and inflammatory infiltration observed in GNP-treated animals. Moreover, graphene and related carbon-based materials have been shown to exert lipid-lowering effects in experimental models of obesity and fatty liver disease [16].
In addition to lipid modulation, GNPs may influence cellular redox balance. Few-layer graphene has been reported to exhibit higher scavenging activity than mono layered graphene oxide despite a lower surface area, suggesting that pristine sp² carbon domains play a dominant role in redox activity rather than hydrogen donation from oxygen-containing groups [17]. Furthermore, GNPs have been reported to reduce lipid peroxidation and enhance antioxidant enzyme activity, including catalase and superoxide dismutase [18]. Consistent with this, ethanol-induced oxidative stress and cell death were attenuated following GNP treatment, accompanied by restoration of antioxidant defense pathways such as Nrf2 and HO-1. While graphene oxide has been shown to induce apoptosis in a dose-dependent manner in certain contexts, it can also activate adaptive stress responses and autophagy-related pathways, including AMPK/Beclin1 signaling and mTORC suppression [19].
Ethanol-induced gut dysbiosis and increased intestinal permeability further exacerbate liver injury. Although GNPs may induce inflammatory responses under conditions of severe intestinal compromise [20], previous studies have shown that GNPs do not disrupt epithelial viability, tight junction integrity, or microvilli structure in Caco-2 cells, even at higher concentrations [8,21,22]. Consistent with these observations, GNP treatment preserved intestinal architecture and tight-junction gene expression while suppressing pro-inflammatory cytokine expression in ethanol-fed animals.
Emerging evidence suggests that graphene oxide can modulate gut microbiota composition and host–microbe interactions in a context-dependent manner. Peng et al., ,2023 demonstrated that graphene oxide influences microbiome-dependent immune responses via AhR signaling, highlighting its role in host–microbiome crosstalk. In the present study, ethanol feeding reduced the abundance of beneficial postbiotic-associated taxa, whereas GNP treatment partially restored microbial balance. Beneficial taxa such as Oscillospiraceae, Ruminococcaceae, and Clostridia XIV known contributors to short-chain fatty acid–associated gut homeostasis were increased following GNP treatment [24,25]. In contrast, dysbiosis-associated taxa such as Patescibacteriaceae and Desulfobacterota were reduced. Restoration of microbial diversity and Firmicutes/Bacteroidota balance was consistent with improved gut homeostasis while alpha-diversity analysis further supported reversal of ethanol-induced dysbiosis [26,27,28].
Improved gut integrity and microbial balance were accompanied by attenuation of hepatic inflammatory signalling. Reduced TLR4-associated signalling and restoration of arginase expression suggest a shift away from pro-inflammatory macrophage activation toward a more regenerative immune environment [29]. Such immune modulation is critical for limiting chronic inflammation and supporting hepatic repair [30,31].
miRNAs are key regulatory mediators involved in both disease progression and resolution in ALD. Among these, miR-122 and miR-22 play critical hepatoprotective roles by regulating lipid metabolism and antioxidant responses. Chronic ethanol exposure markedly suppressed the expression of these miRNAs, which was associated with impaired lipid homeostasis and reduced antioxidant capacity [32]. In parallel, ethanol-induced oxidative and inflammatory stress was accompanied by downregulation of miR-203a, a miRNA implicated in the regulation of macrophage polarization, thereby favoring a pro-inflammatory hepatic environment. GNP treatment subsequently restored antioxidant and regenerative signalling pathways, which was accompanied by normalization of miR-122 and miR-22 expression, suggesting an indirect association between improved redox homeostasis and miRNA regulation. Preservation of intestinal integrity and attenuation of gut dysbiosis following GNP administration further prevented ethanol-associated suppression of miR-203a, thereby limiting M1-type macrophage activation and inflammatory signalling [33].
In addition, GNP treatment reduced the expression of miRNAs linked to disease progression, including miR-214 and miR-21, which are known to regulate CYP2E1 expression and mTORC-associated inflammatory signalling, respectively [32,34,35]. The coordinated modulation of these miRNAs supports a role for GNPs in attenuating ethanol-induced metabolic stress, inflammation, and cell death pathways. However, the precise molecular mechanisms by which GNPs influence miRNA expression whether through indirect modulation of cellular stress responses or direct interactions affecting miRNA stability or activity remain to be fully elucidated and want further investigation.
In summary, this study demonstrates that graphene oxide nanoparticles exert a coordinated protective effect against ethanol-induced liver injury by simultaneously modulating hepatic lipid metabolism, oxidative stress, inflammatory signalling, cell death pathways, and gut–liver axis dysfunction. By restoring intestinal barrier integrity, rebalancing gut microbiota composition, and attenuating hepatic inflammatory and stress-associated responses, GNPs limit disease progression in a multifactorial model of alcohol-associated liver disease. Importantly, the protective nature of GNPs highlights their potential as a nanoplatform that could be further optimized or combined with complementary therapeutic strategies to enhance efficacy against complex liver pathologies.
Conclusion
This study demonstrates that graphene oxide nanoparticles exert a broad protective effect against ethanol-induced liver injury by targeting multiple, interconnected pathogenic mechanisms underlying alcohol-associated liver disease. GNP treatment attenuated hepatic lipid accumulation, oxidative stress, inflammatory signalling, and cell death, while preserving intestinal barrier integrity and partially restoring gut microbial homeostasis. The coordinated modulation of hepatic TLR4-associated pathways and disease-relevant miRNAs further supports the role of GNPs in regulating both metabolic and inflammatory responses along the gut–liver axis. Importantly, these findings highlight GNPs as a protective nanoplatform rather than a single-target therapeutic, capable of modulating complex regulatory networks that drive disease progression. While the precise molecular mechanisms governing GNP–miRNA interactions and downstream signalling remain to be fully elucidated, the multi-level protective effects observed in this study suggest that GNPs may be further optimized or combined with complementary therapeutic strategies to enhance efficacy in early-stage alcohol-associated liver disease.
Supplementary Materials
The following supporting information can be downloaded at the website of this paper posted on Preprints.org.
Author Contributions
Conceptualisation, Investigation, Data Curation, Validation, Methodology, Formal Analysis, Writing Original Draft: HA: Investigation, Data Curation, Formal Analysis: MP And PC; Investigation, Data Curation, Validation, Formal Analysis: TNS And MI; Investigation And Data Analysis: DR And SK; Data Curation And Validation: PG And MR; Supervision And Resources: SV And PM; Project Administration, Data Visualisation, Reviewing And Editing Final Draft: PM.
Funding
This research did not receive any specific grant from funding agencies in the public, commercial, or not-for-profit sectors.
Data Availability Statement
Data available on request from the authors.
Acknowledgments
The authors acknowledge the technical assistance of Budhabhai Patel, during animal studies and thank Alkesh Patel for his valuable support.
Conflicts of Interest
The authors declare that there are no conflicts of interest.
Abbreviations
| ALD | Alcohol-associated liver disease |
| ALT | Alanine aminotransferase |
| AST | Aspartate aminotransferase |
| Arg | Arginase |
| CYP2E1 | Cytochrome P450 2E1 |
| GGT | Gamma-glutamyl transferase |
| GNPs | Graphene oxide nanoparticles |
| HO-1 | Heme oxygenase-1 |
| iNOS | Inducible nitric oxide synthase |
| mTORC | Mammalian target of rapamycin complex |
| MCP1 | Monocyte chemoattractant protein-1 |
| NF-κB | Nuclear factor kappa B |
| Nrf2 | Nuclear factor erythroid 2–related factor 2 |
| PCoA | Principal coordinate analysis |
| PPARα | Peroxisome proliferator-activated receptor alpha |
| RIPK1 | Receptor-interacting protein kinase 1 |
| RIPK3 | Receptor-interacting protein kinase 3 |
| MLKL | Mixed lineage kinase domain-like protein |
| SCFAs | Short-chain fatty acids |
| TLR4 | Toll-like receptor 4 |
References
- Danpanichkul, P; Suparan, K; Ng, CH; Dejvajara, D; Kongarin, S; Panpradist, N; et al. Global and regional burden of alcohol-associated liver disease and alcohol use disorder in the elderly. JHEP Reports 2024, 6(4). [Google Scholar] [CrossRef] [PubMed]
- Aghara, H; Chadha, P; Zala, D; Mandal, P. Stress mechanism involved in the progression of alcoholic liver disease and the therapeutic efficacy of nanoparticles. Front Immunol 2023, 14. [Google Scholar] [CrossRef] [PubMed]
- Kuo, CH; El-Omar, E; Kao, CY; Lin, JT; Wu, CY. Compositional and Metabolomic Shifts of the Gut Microbiome in Alcohol-Related Liver Disease. Journal of Gastroenterology and Hepatology (Australia) 2025, 40(9). [Google Scholar] [CrossRef]
- Albillos, A; de Gottardi, A; Rescigno, M. The gut-liver axis in liver disease: Pathophysiological basis for therapy. J Hepatol. 2020, 72(3). [Google Scholar] [CrossRef]
- Bajaj, JS. Alcohol, liver disease and the gut microbiota. Nat Rev Gastroenterol Hepatol 2019, 16(4), 235–246. [Google Scholar] [CrossRef]
- Aghara, H; Patel, M; Chadha, P; Parwani, K; Chaturvedi, R; Mandal, P. Unraveling the Gut–Liver–Brain Axis: Microbiome, Inflammation, and Emerging Therapeutic Approaches. Mediators Inflamm. 2025, 2025(1). [Google Scholar] [CrossRef]
- Ramli, MM; Rosman, AS; Mazlan, NS; Ahmad, MF; Halin, DSC; Mohamed, R; et al. Cell viability and electrical response of breast cancer cell treated in aqueous graphene oxide solution deposition on interdigitated electrode. Sci Rep. 2021, 11(1). [Google Scholar] [CrossRef] [PubMed]
- Aghara, H; Chadha, P; Mandal, P. Mitigative Effect of Graphene Oxide Nanoparticles in Maintaining Gut–Liver Homeostasis against Alcohol Injury. Gastroenterol Insights 2024, 15(3), 574–587. [Google Scholar] [CrossRef]
- Liu, H; Meng, W; Zhao, D; Ma, Z; Zhang, W; Chen, Z; et al. Study on mechanism of action of total flavonoids from Cortex Juglandis Mandshuricae against alcoholic liver disease based on gut-liver axis. Front Pharmacol 2023, 13. [Google Scholar] [CrossRef]
- Gao, M; Yin, D; Chen, J; Qu, X. Activating the interleukin-6-Gp130-STAT3 pathway ameliorates ventricular electrical stability in myocardial infarction rats by modulating neurotransmitters in the paraventricular nucleus. BMC Cardiovasc Disord. 2020, 20(1). [Google Scholar] [CrossRef]
- Chadha, P; Aghara, H; Solanki, H; Patel, M; Sharma, D; Thiruvenkatam, V; et al. Modulation of TNFα-driven neuroinflammation by Gardenin A: insights from in vitro, in vivo, and in silico studies. Front Pharmacol. 2025, 16. [Google Scholar] [CrossRef]
- Sata, TN; Ismail, M; Sah, AK; Venugopal, SK. Production of Functional miRNA Mimics Using In Vitro Transcription. Curr Protoc. 2025, 5(6). [Google Scholar] [CrossRef]
- Priyadarsini, S; Mohanty, S; Mukherjee, S; Basu, S; Mishra, M. Graphene and graphene oxide as nanomaterials for medicine and biology application. J Nanostructure Chem. 2018, 8(2). [Google Scholar] [CrossRef]
- Puigpelat, E; Ignés-Mullol, J; Sagués, F; Reigada, R. Interaction of Graphene Nanoparticles and Lipid Membranes Displaying Different Liquid Orderings: A Molecular Dynamics Study. Langmuir 2019, 35(50). [Google Scholar] [CrossRef] [PubMed]
- Tan, B; Hu, J; Wu, F. Cholesterols Induced Distinctive Entry of the Graphene Nanosheet into the Cell Membrane. ACS Omega 2024, 9(8). [Google Scholar] [CrossRef]
- de Frutos, S; Griera, M; Lavín-López, M; del, P; Martínez-Rovira, M; Martínez-Rovira, JA; Rodríguez-Puyol, M; et al. A new graphene-based nanomaterial increases lipolysis and reduces body weight gain through integrin linked kinase (ILK). Biomater Sci. 2023, 11(14). [Google Scholar] [CrossRef] [PubMed]
- Abbigeri, MB; Thokchom, B; Singh, SR; Bhavi, SM; Harini, BP; Yarajarla, RB. Antioxidant and anti-diabetic potential of the green synthesized silver nanoparticles using Martynia annua L. root extract. Nano TransMed 2025, 4. [Google Scholar] [CrossRef]
- Oukhrib, M; Tamegart, L; Assafi, A; Hejji, L; Azzouz, A; Villarejo, LP; et al. Effects of graphene oxide nanoparticles administration against reserpine-induced neurobehavioral damage and oxidative stress in an animal model of Parkinson’s disease. Food and Chemical Toxicology 2023, 178. [Google Scholar] [CrossRef] [PubMed]
- Xiaoli, F; Yaqing, Z; Ruhui, L; Xuan, L; Aijie, C; Yanli, Z; et al. Graphene oxide disrupted mitochondrial homeostasis through inducing intracellular redox deviation and autophagy-lysosomal network dysfunction in SH-SY5Y cells. J Hazard Mater 2021, 416. [Google Scholar] [CrossRef]
- Liu, S; Xu, A; Gao, Y; Xie, Y; Liu, Z; Sun, M; et al. Graphene oxide exacerbates dextran sodium sulfate-induced colitis via ROS/AMPK/p53 signaling to mediate apoptosis. J Nanobiotechnology 2021, 19(1). [Google Scholar] [CrossRef]
- Guarnieri, D; Sánchez-Moreno, P; Del Rio Castillo, AE; Bonaccorso, F; Gatto, F; Bardi, G; et al. Biotransformation and Biological Interaction of Graphene and Graphene Oxide during Simulated Oral Ingestion. Small 2018, 14(24). [Google Scholar] [CrossRef]
- Castagnola, V; Deleye, L; Podestà, A; Jaho, E; Loiacono, F; Debellis, D; et al. Interactions of Graphene Oxide and Few-Layer Graphene with the Blood-Brain Barrier. Nano Lett. 2023, 23(7). [Google Scholar] [CrossRef]
- Peng, G; Sinkko, HM; Alenius, H; Lozano, N; Kostarelos, K; Bräutigam, L; et al. Graphene oxide elicits microbiome-dependent type 2 immune responses via the aryl hydrocarbon receptor. Nat Nanotechnol 2023, 18(1). [Google Scholar] [CrossRef]
- Li, J; Yang, S; Yu, J; Cui, R; Liu, R; Lei, R; et al. Lipid- and gut microbiota-modulating effects of graphene oxide nanoparticles in high-fat diet-induced hyperlipidemic mice. RSC Adv. 2018, 8(55). [Google Scholar] [CrossRef]
- Wojciechowska, O; Costabile, A; Kujawska, M. The gut microbiome meets nanomaterials: exposure and interplay with graphene nanoparticles. Nanoscale Adv. 2023, 5(23). [Google Scholar] [CrossRef]
- Shen, J; Dong, J; Zhao, J; Ye, T; Gong, L; Wang, H; et al. The effects of the oral administration of graphene oxide on the gut microbiota and ultrastructure of the colon of mice. Ann Transl Med. 2022, 10(6). [Google Scholar] [CrossRef] [PubMed]
- Couvillion, SP; Danczak, RE; Cao, X; Yang, Q; Keerthisinghe, TP; McClure, RS; et al. Graphene oxide exposure alters gut microbial community composition and metabolism in an in vitro human model. NanoImpact 2023, 30. [Google Scholar] [CrossRef]
- Wang, C; Yan, J; Du, K; Liu, S; Wang, J; Wang, Q; et al. Intestinal microbiome dysbiosis in alcohol-dependent patients and its effect on rat behaviors. mBio 2023, 14(6). [Google Scholar] [CrossRef] [PubMed]
- Chen, GY; Chen, CL; Tuan, HY; Yuan, PX; Li, KC; Yang, HJ; et al. Graphene oxide triggers toll-like receptors/autophagy responses in vitro and inhibits tumor growth in vivo. Adv Healthc Mater. 2014, 3(9). [Google Scholar] [CrossRef] [PubMed]
- Fonticoli, L; Diomede, F; Nanci, A; Fontana, A; Della Rocca, Y; Guadarrama Bello, D; et al. Enriched Graphene Oxide-Polypropylene Suture Threads Buttons Modulate the Inflammatory Pathway Induced by Escherichia coli Lipopolysaccharide. Int J Mol Sci. 2023, 24(7). [Google Scholar] [CrossRef]
- Han, J; Kim, YS; Lim, MY; Kim, HY; Kong, S; Kang, M; et al. Dual Roles of Graphene Oxide to Attenuate Inflammation and Elicit Timely Polarization of Macrophage Phenotypes for Cardiac Repair. ACS Nano 2018, 12(2). [Google Scholar] [CrossRef]
- Jouve, M; Carpentier, R; Kraiem, S; Legrand, N; Sobolewski, C. MiRNAs in Alcohol-Related Liver Diseases and Hepatocellular Carcinoma: A Step toward New Therapeutic Approaches? Cancers (Basel) 2023, 15(23). [Google Scholar] [CrossRef]
- Torres, JL; Novo-Veleiro, I; Manzanedo, L; Suárez, LA; MacÍas, R; Laso, FJ; et al. Role of microRNAs in alcohol-induced liver disorders and non-alcoholic fatty liver disease. World J Gastroenterol. 2018, 24(36). [Google Scholar] [CrossRef] [PubMed]
- Messner, CJ; Schmidt, S; Özkul, D; Gaiser, C; Terracciano, L; Krähenbühl, S; et al. Identification of mir-199a-5p, mir-214-3p and mir-99b-5p as fibrosis-specific extracellular biomarkers and promoters of hsc activation. Int J Mol Sci. 2021, 22(18). [Google Scholar] [CrossRef] [PubMed]
- Wang, J; Gao, Y; Duan, L; Wei, S; Liu, J; Tian, L; et al. Metformin ameliorates skeletal muscle insulin resistance by inhibiting miR-21 expression in a high-fat dietary rat model. Oncotarget 2017, 8(58). [Google Scholar] [CrossRef] [PubMed]
Figure 1.
GNPs mitigate ethanol-induced hepatic injury. (A) Representative gross images of livers from control, pair-fed, ethanol, GNP, and treatment groups, with corresponding liver and body weights. (B) Representative hematoxylin and eosin–stained liver sections (400×) showing histological alterations, with semi-quantitative scoring of vacuolation, inflammatory infiltration, and sinusoidal dilatation. (C) Liver-to-body weight ratio and serum biochemical parameters, including ALT, AST, GGT, total cholesterol, and triglycerides. Data are presented as mean ± SD, one-way ANOVA with comparison to the ethanol group. (n = 6 per group). *p < 0.05, **p < 0.01, ***p < 0.001, ****p < 0.0001.
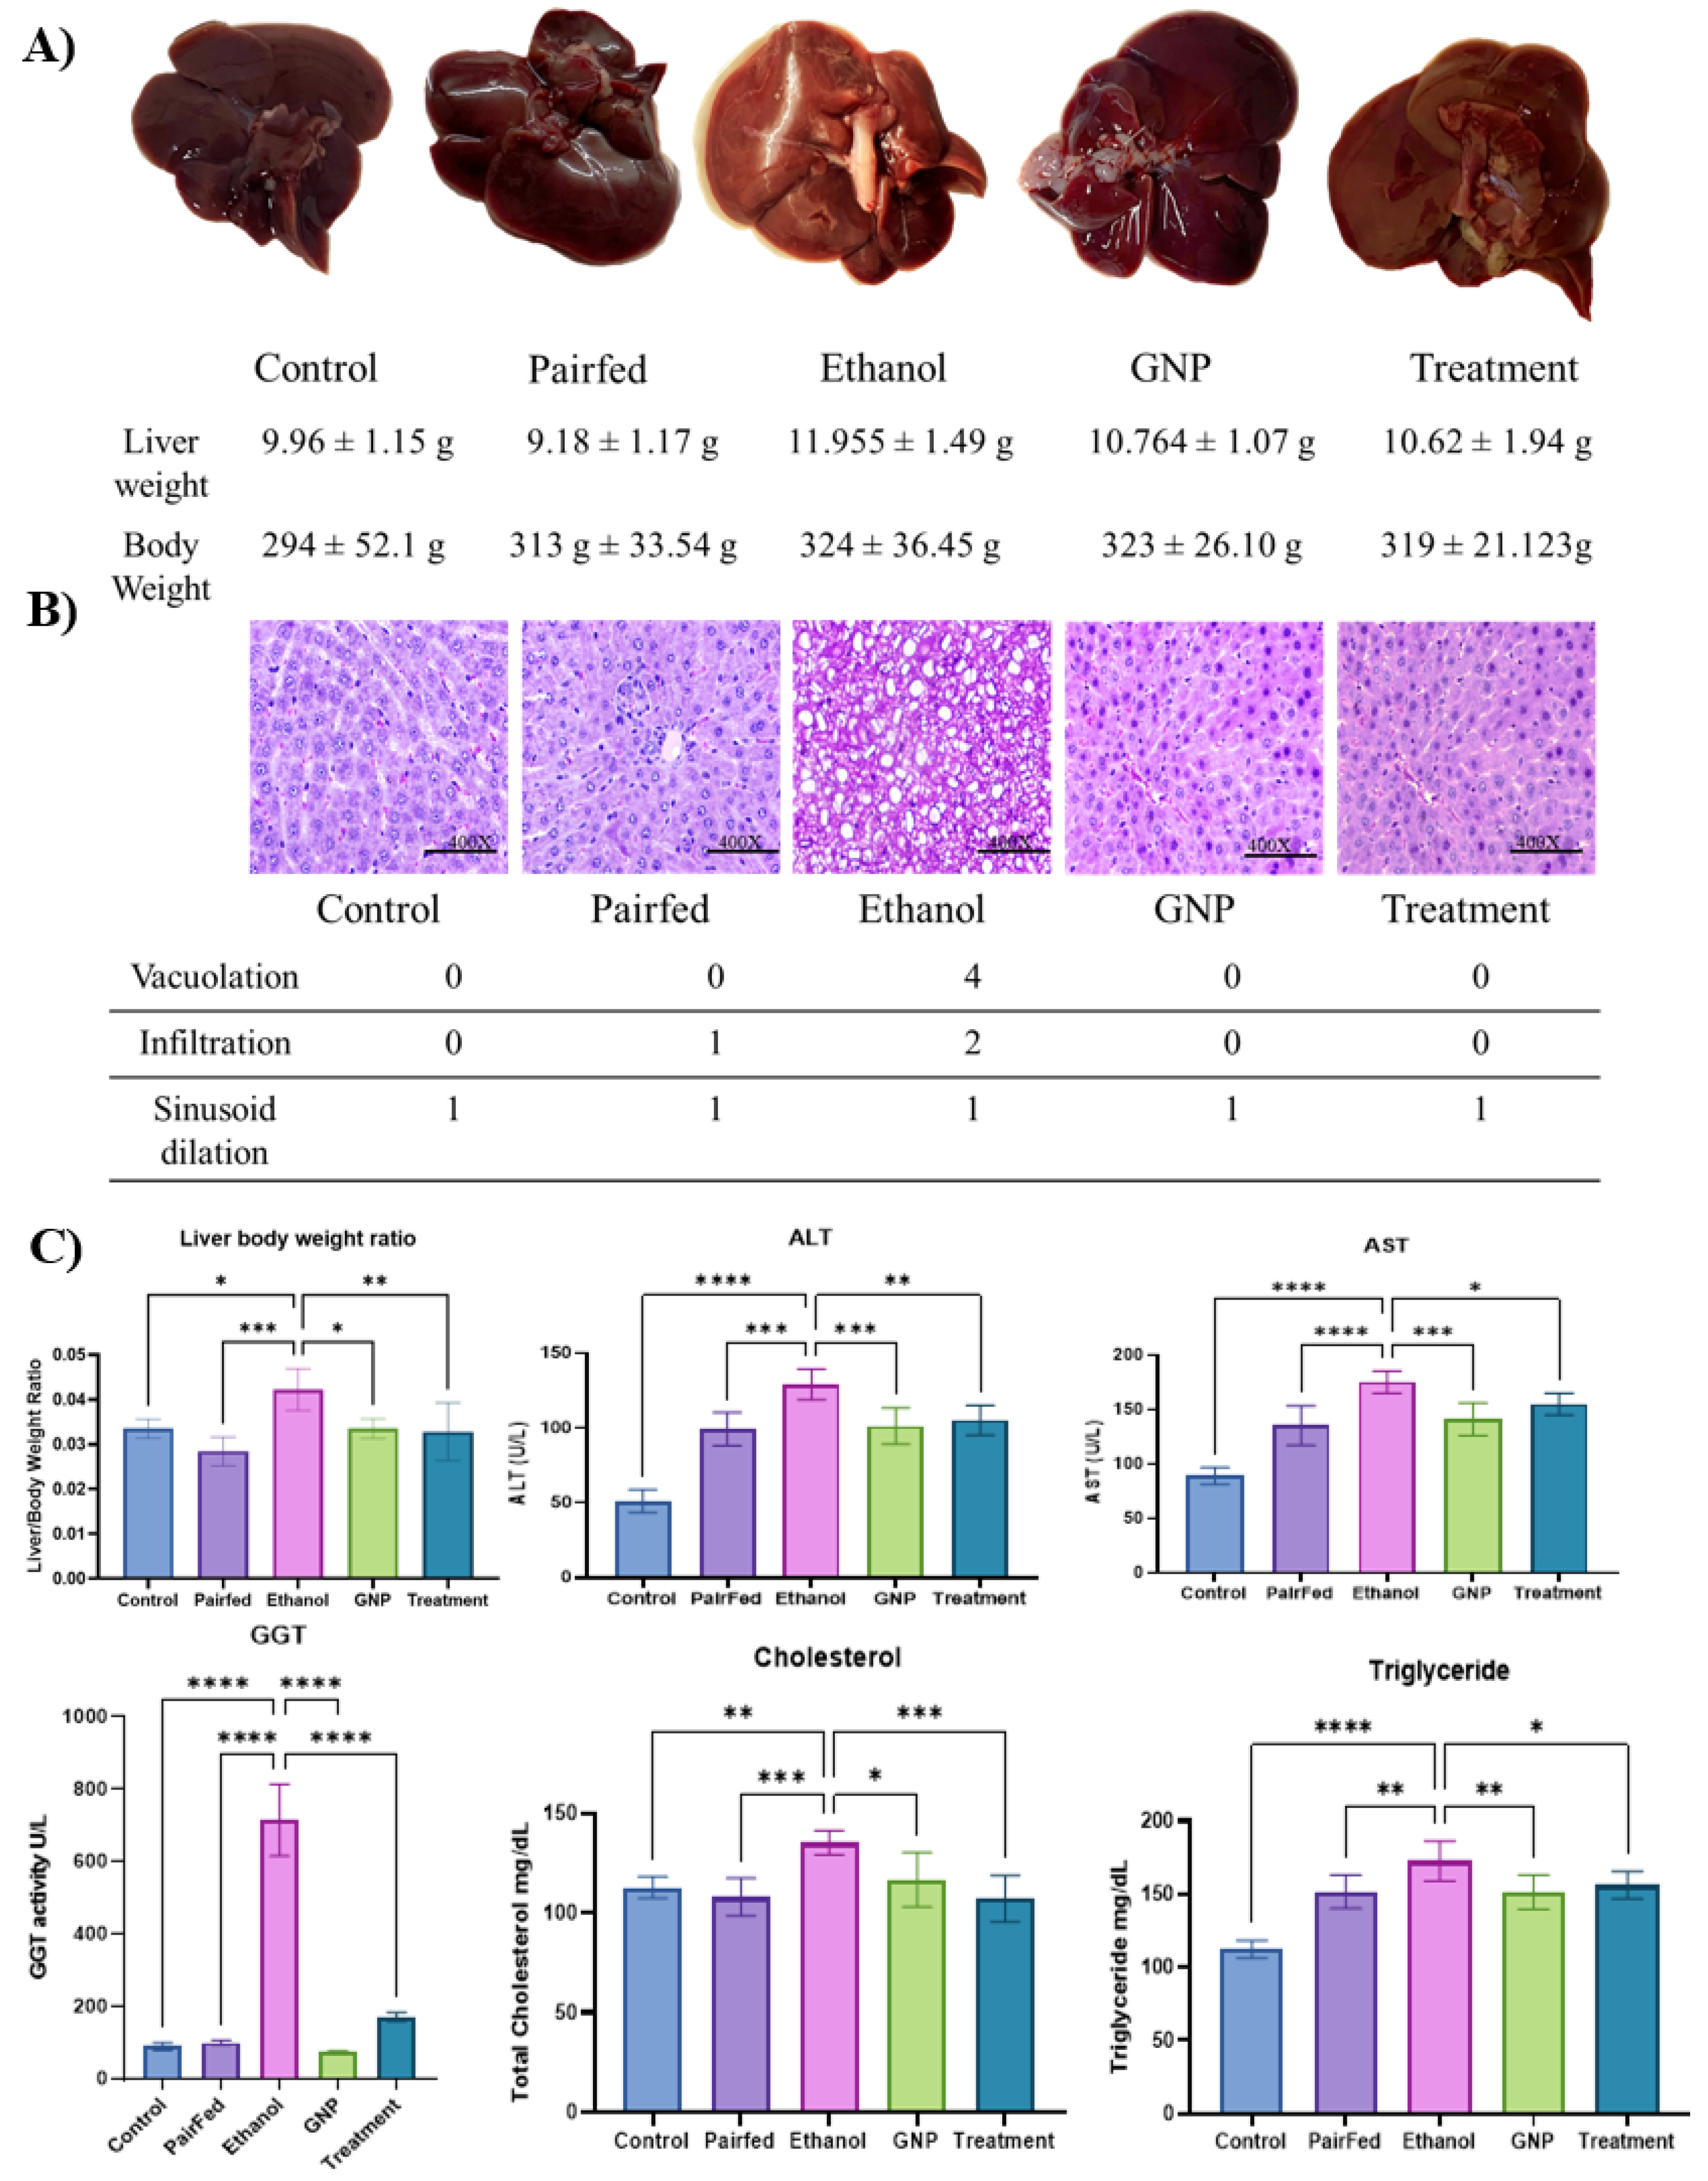
Figure 2.
GNPs attenuate ethanol-induced hepatic lipid accumulation and dysregulation of lipid-associated genes. (A) Representative Nile Red–stained liver sections from control, ethanol, pair-fed, GNP, and treatment groups showing neutral lipid accumulation. (B) Relative mRNA expression of CYP2E1, AKT, mTORC, and MCP1 in liver tissue. (C) Relative mRNA expression of Nrf2, HO-1, and PPARα. Data are presented as mean ± SD, one-way ANOVA with comparison to the ethanol group. (n = 3 per group). *p < 0.05, **p < 0.01, ***p < 0.001, ****p < 0.0001.
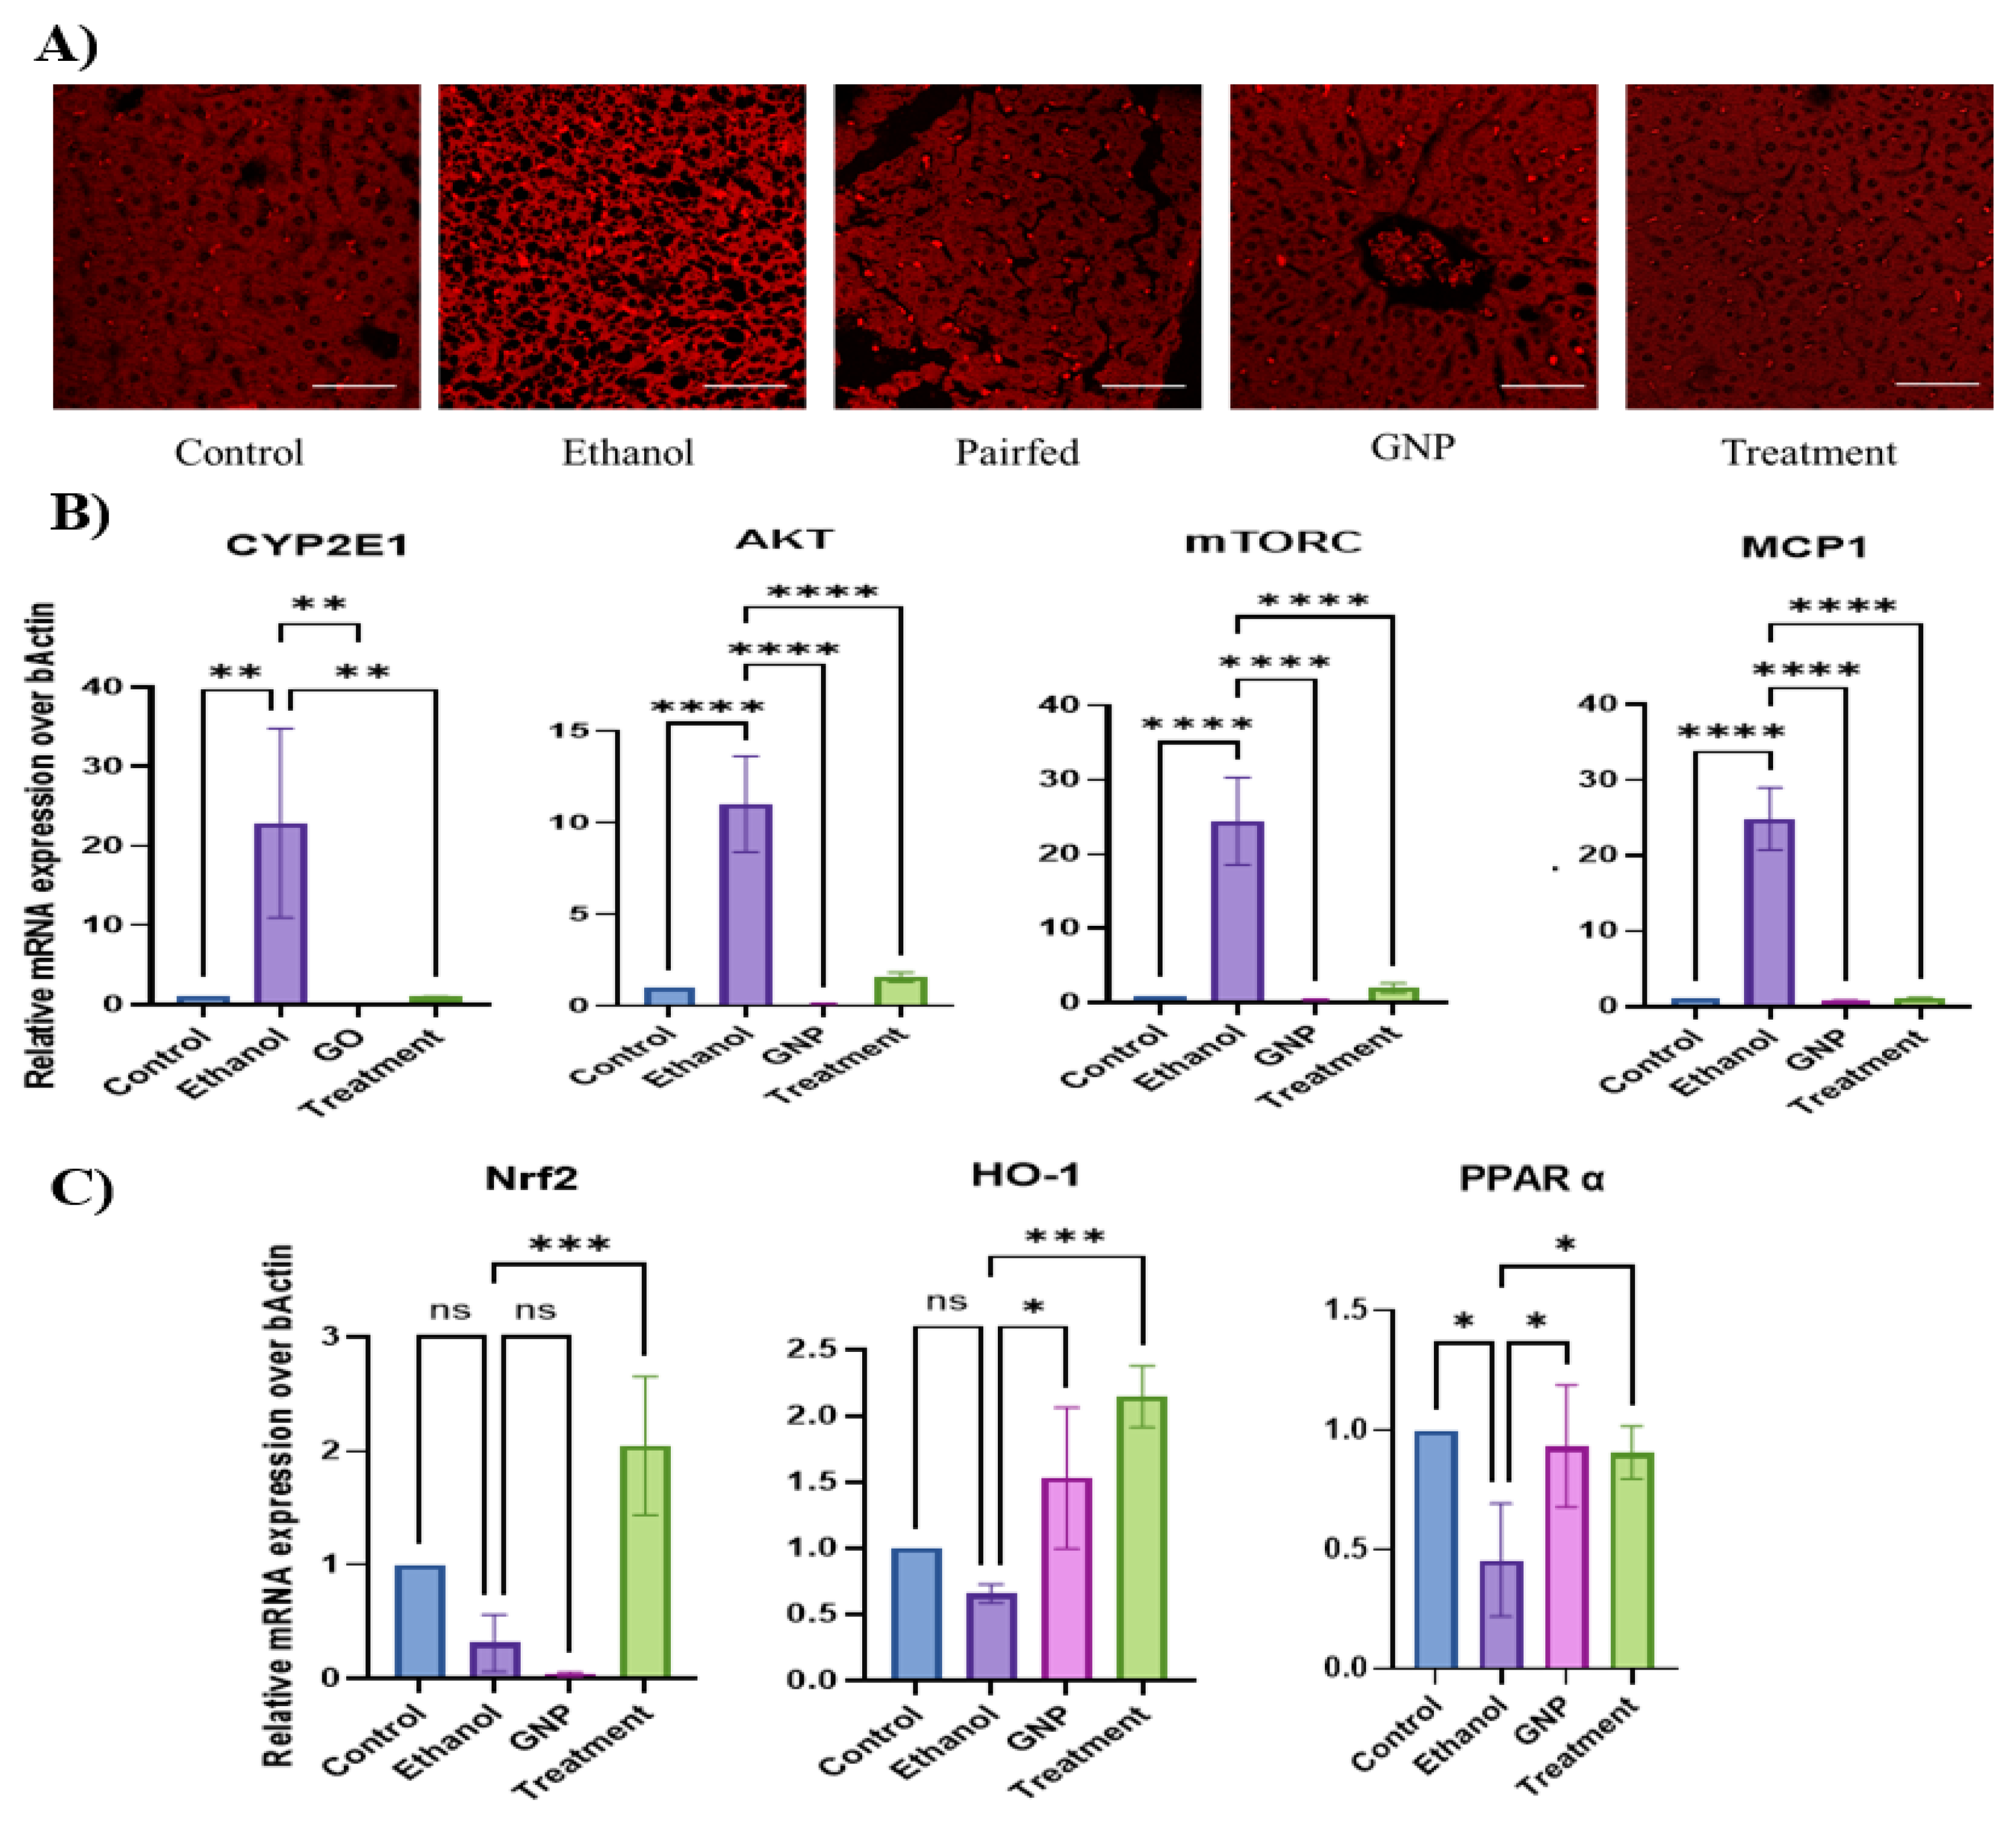
Figure 3.
GNPs modulate ethanol-induced cell death–associated gene expression. Relative mRNA expression of Beclin1, BCL2, RIPK3, RIPK1, MLKL, Caspase-3, and Caspase-8 in liver tissue from control, ethanol, GNP, and treatment groups. Data are presented as mean ± SD, one-way ANOVA with comparison to the ethanol group. (n = 3 per group). *p < 0.05, **p < 0.01, ***p < 0.001, ****p < 0.0001.
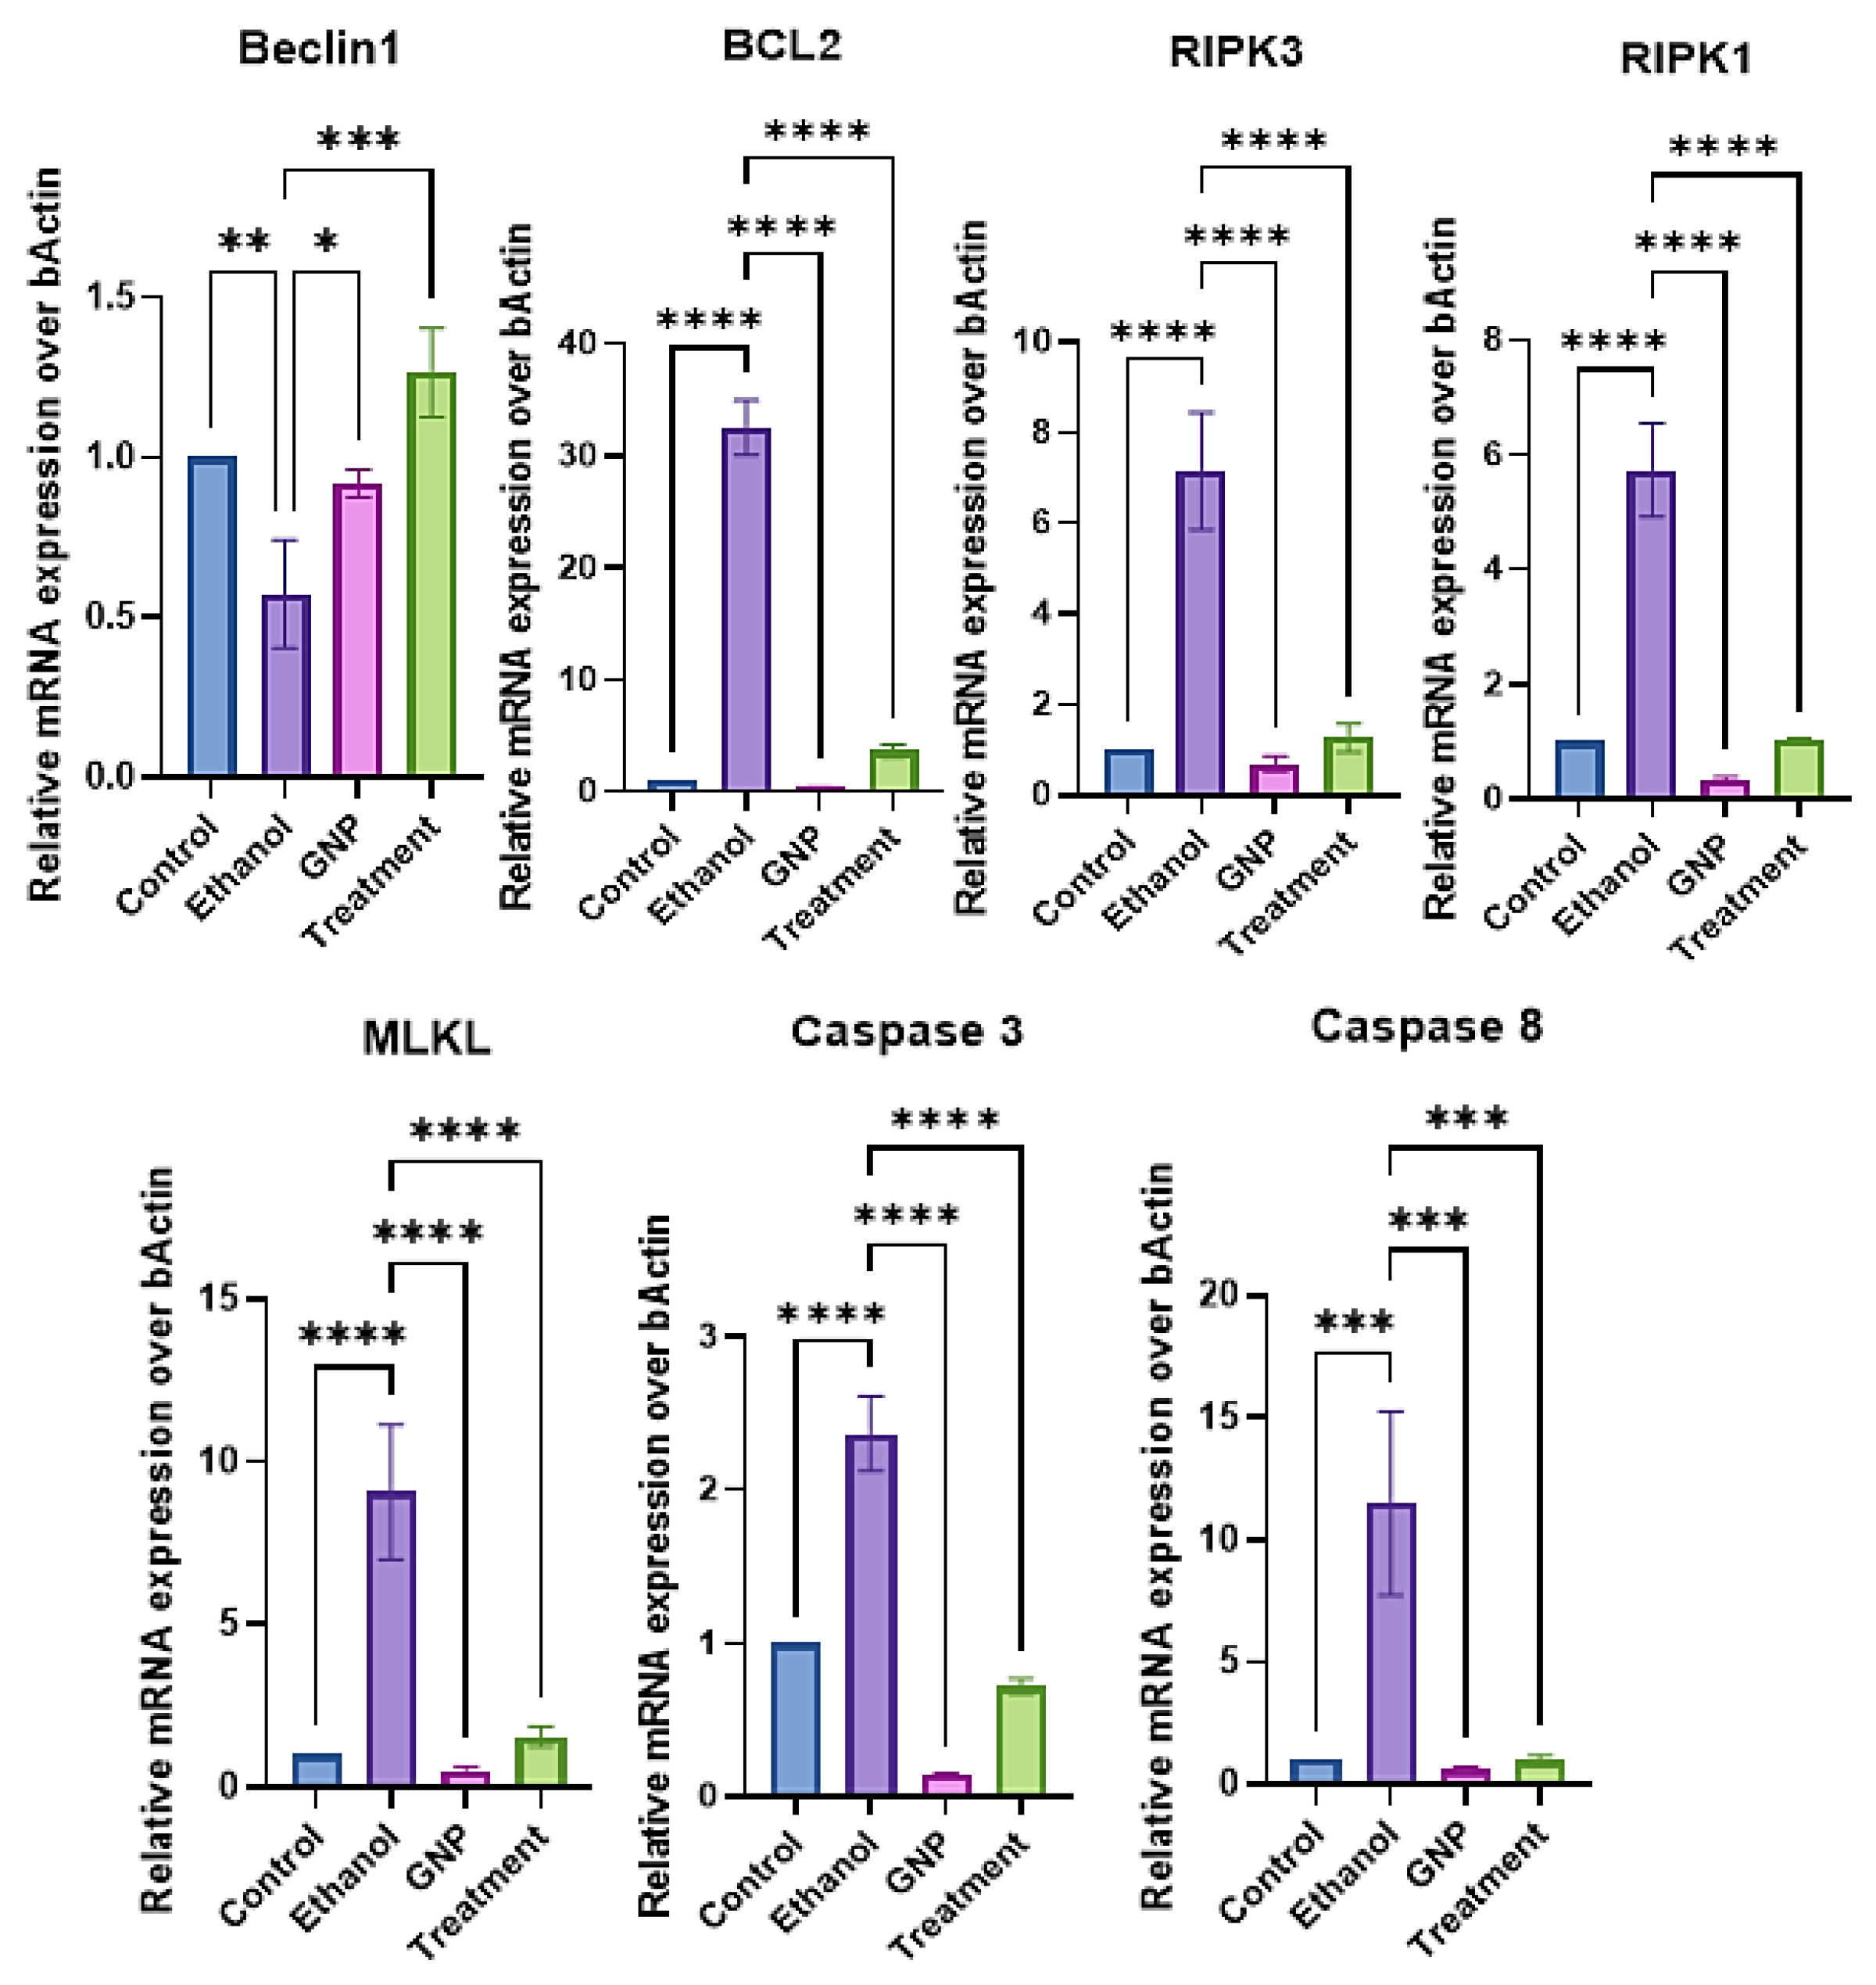
Figure 4.
GNPs attenuate ethanol-induced intestinal injury and gut dysbiosis. (A) Representative hematoxylin and eosin–stained intestinal sections from control, ethanol, GNP, and treatment groups. (B) Relative abundance of major bacterial phyla in fecal samples across experimental groups. (C) Relative mRNA expression of tight junction markers (ZO-1, occludin, claudin) and inflammatory mediators (IL-6, IL-4, lectin) in intestinal tissue. Data are presented as mean ± SD, one-way ANOVA with comparison to the ethanol group. (n = 3 per group). *p < 0.05, **p < 0.01, ***p < 0.001, ****p < 0.0001.
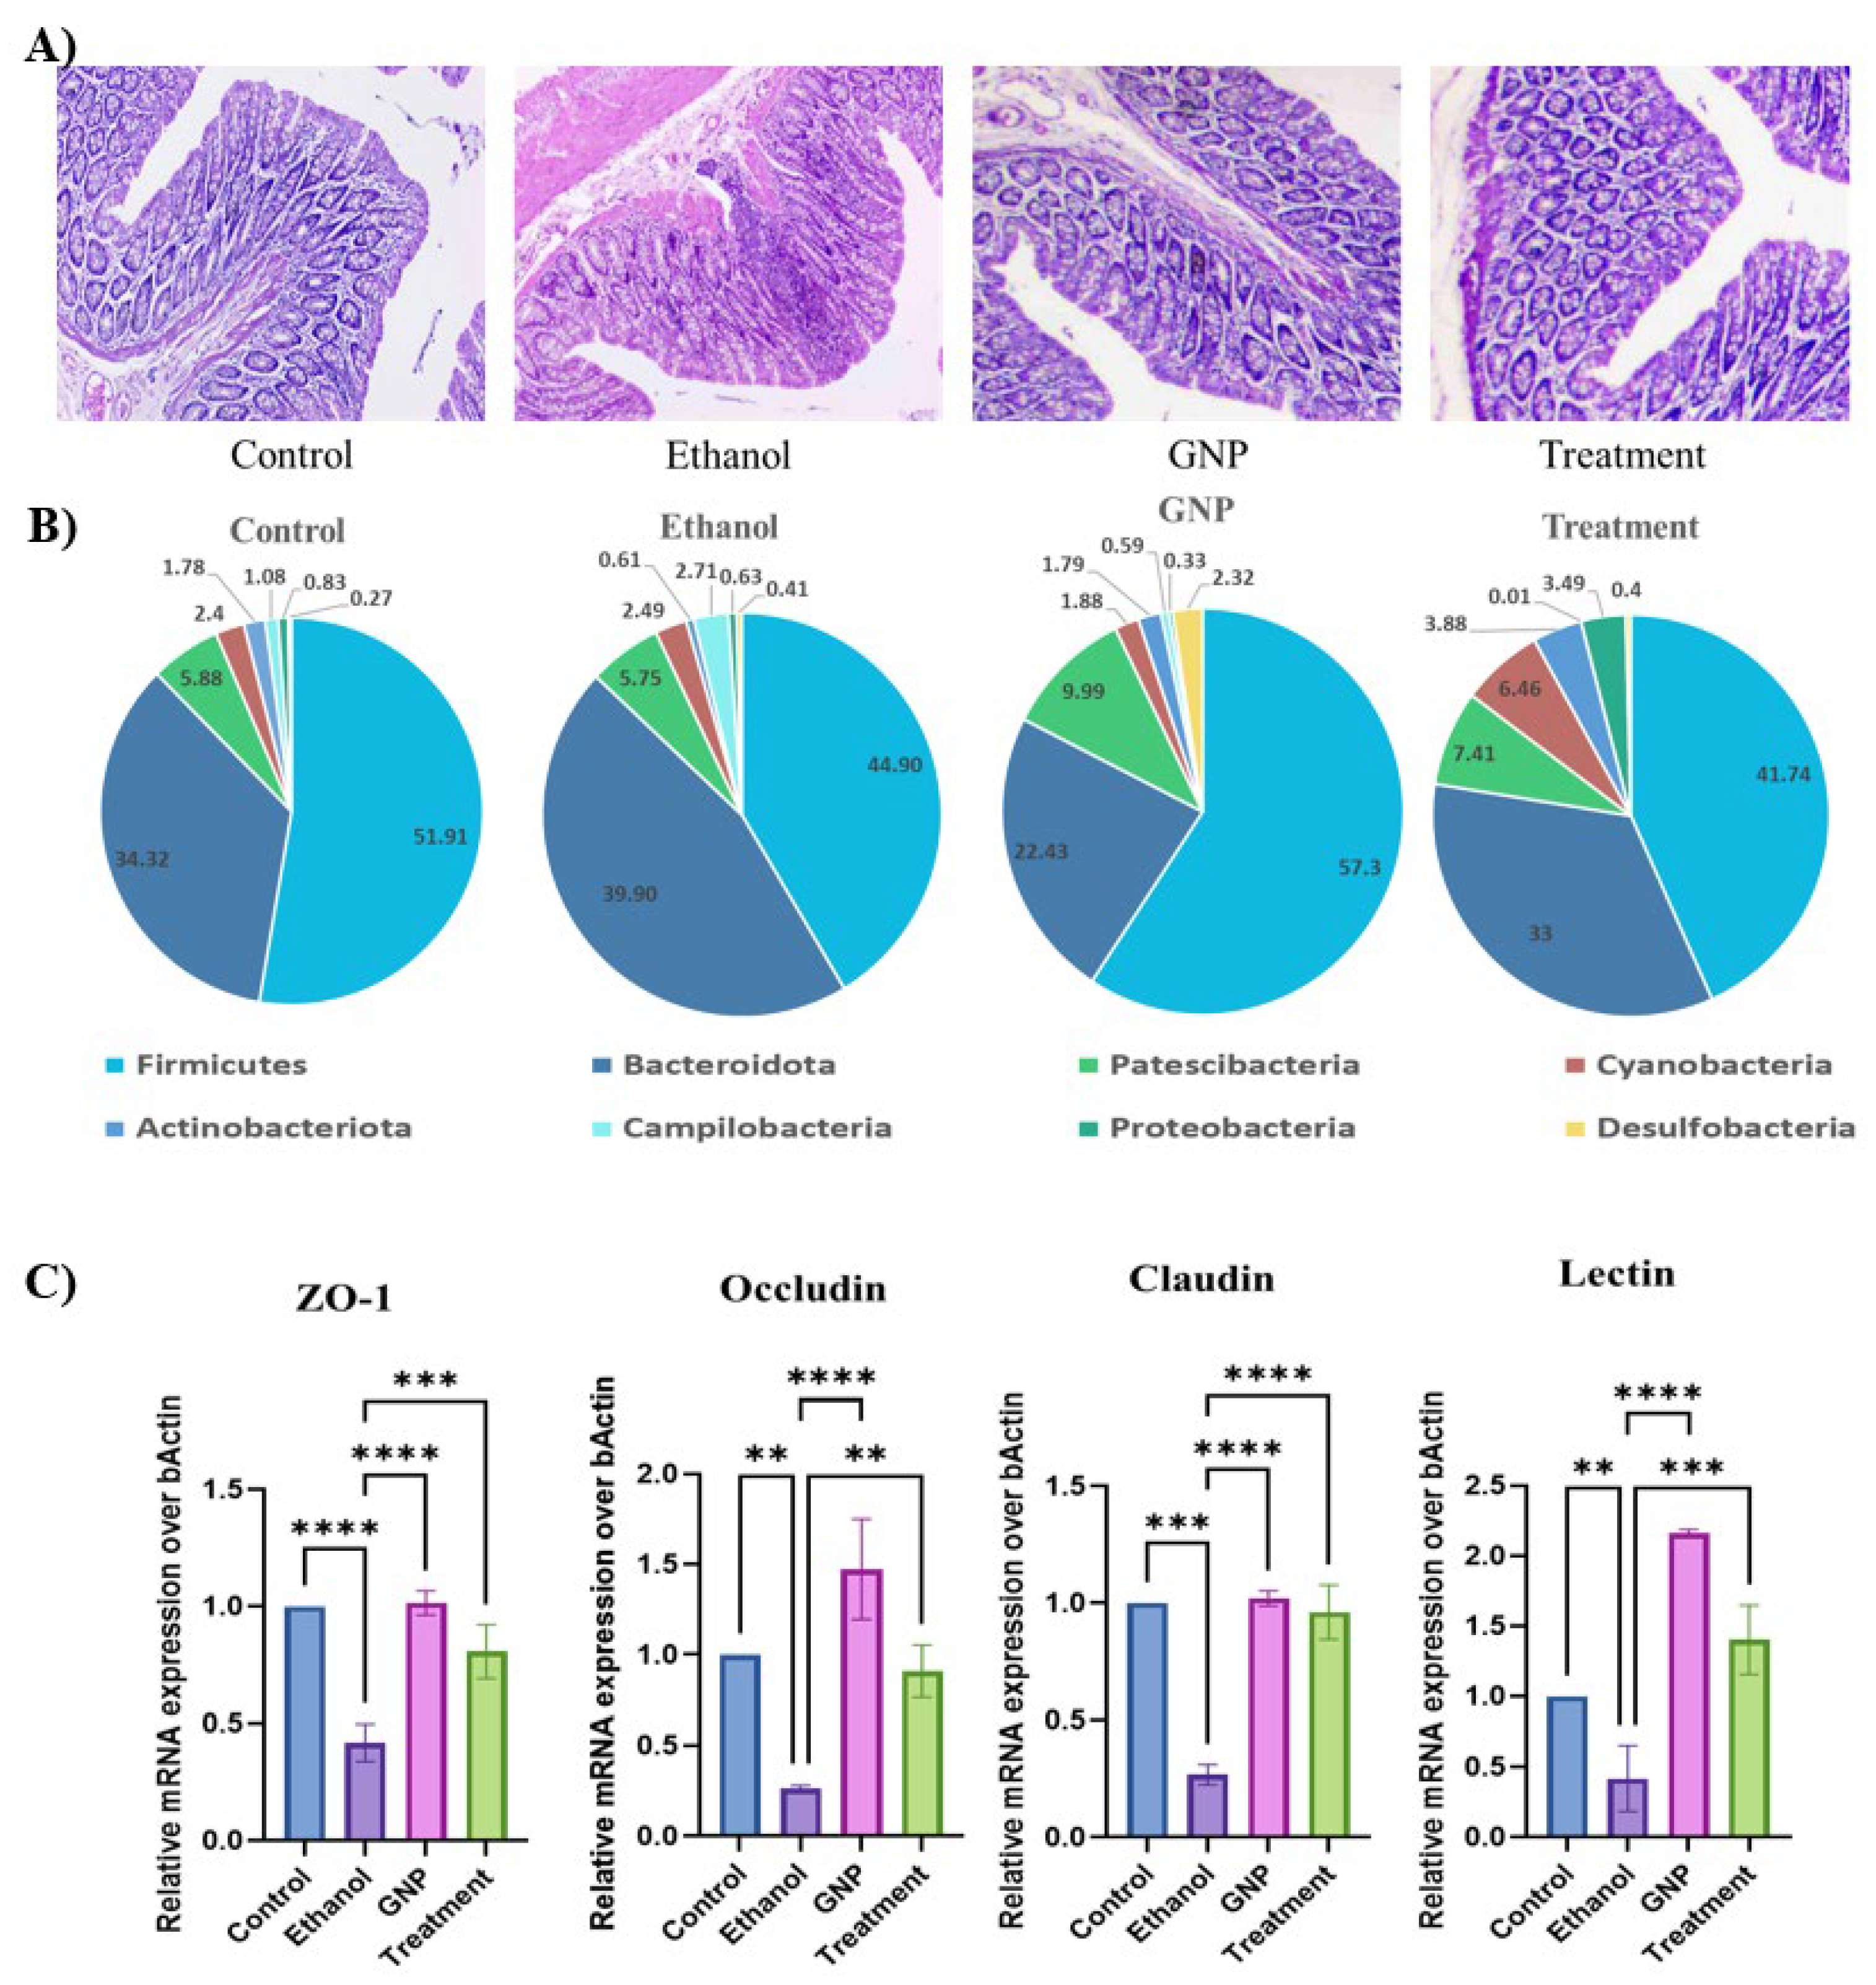
Figure 5.
GNPs modulate ethanol-induced gut microbiota composition. (A) Heatmap with hierarchical clustering depicting the relative abundance of bacterial taxa across experimental groups. Color intensity represents log10-transformed relative abundance. (B) Principal coordinate analysis (PCoA) based on unweighted beta diversity, illustrating differences in microbial community membership among groups. (C) PCoA based on weighted beta diversity, reflecting differences in both microbial community composition and relative abundance across groups. Each point represents an individual sample.
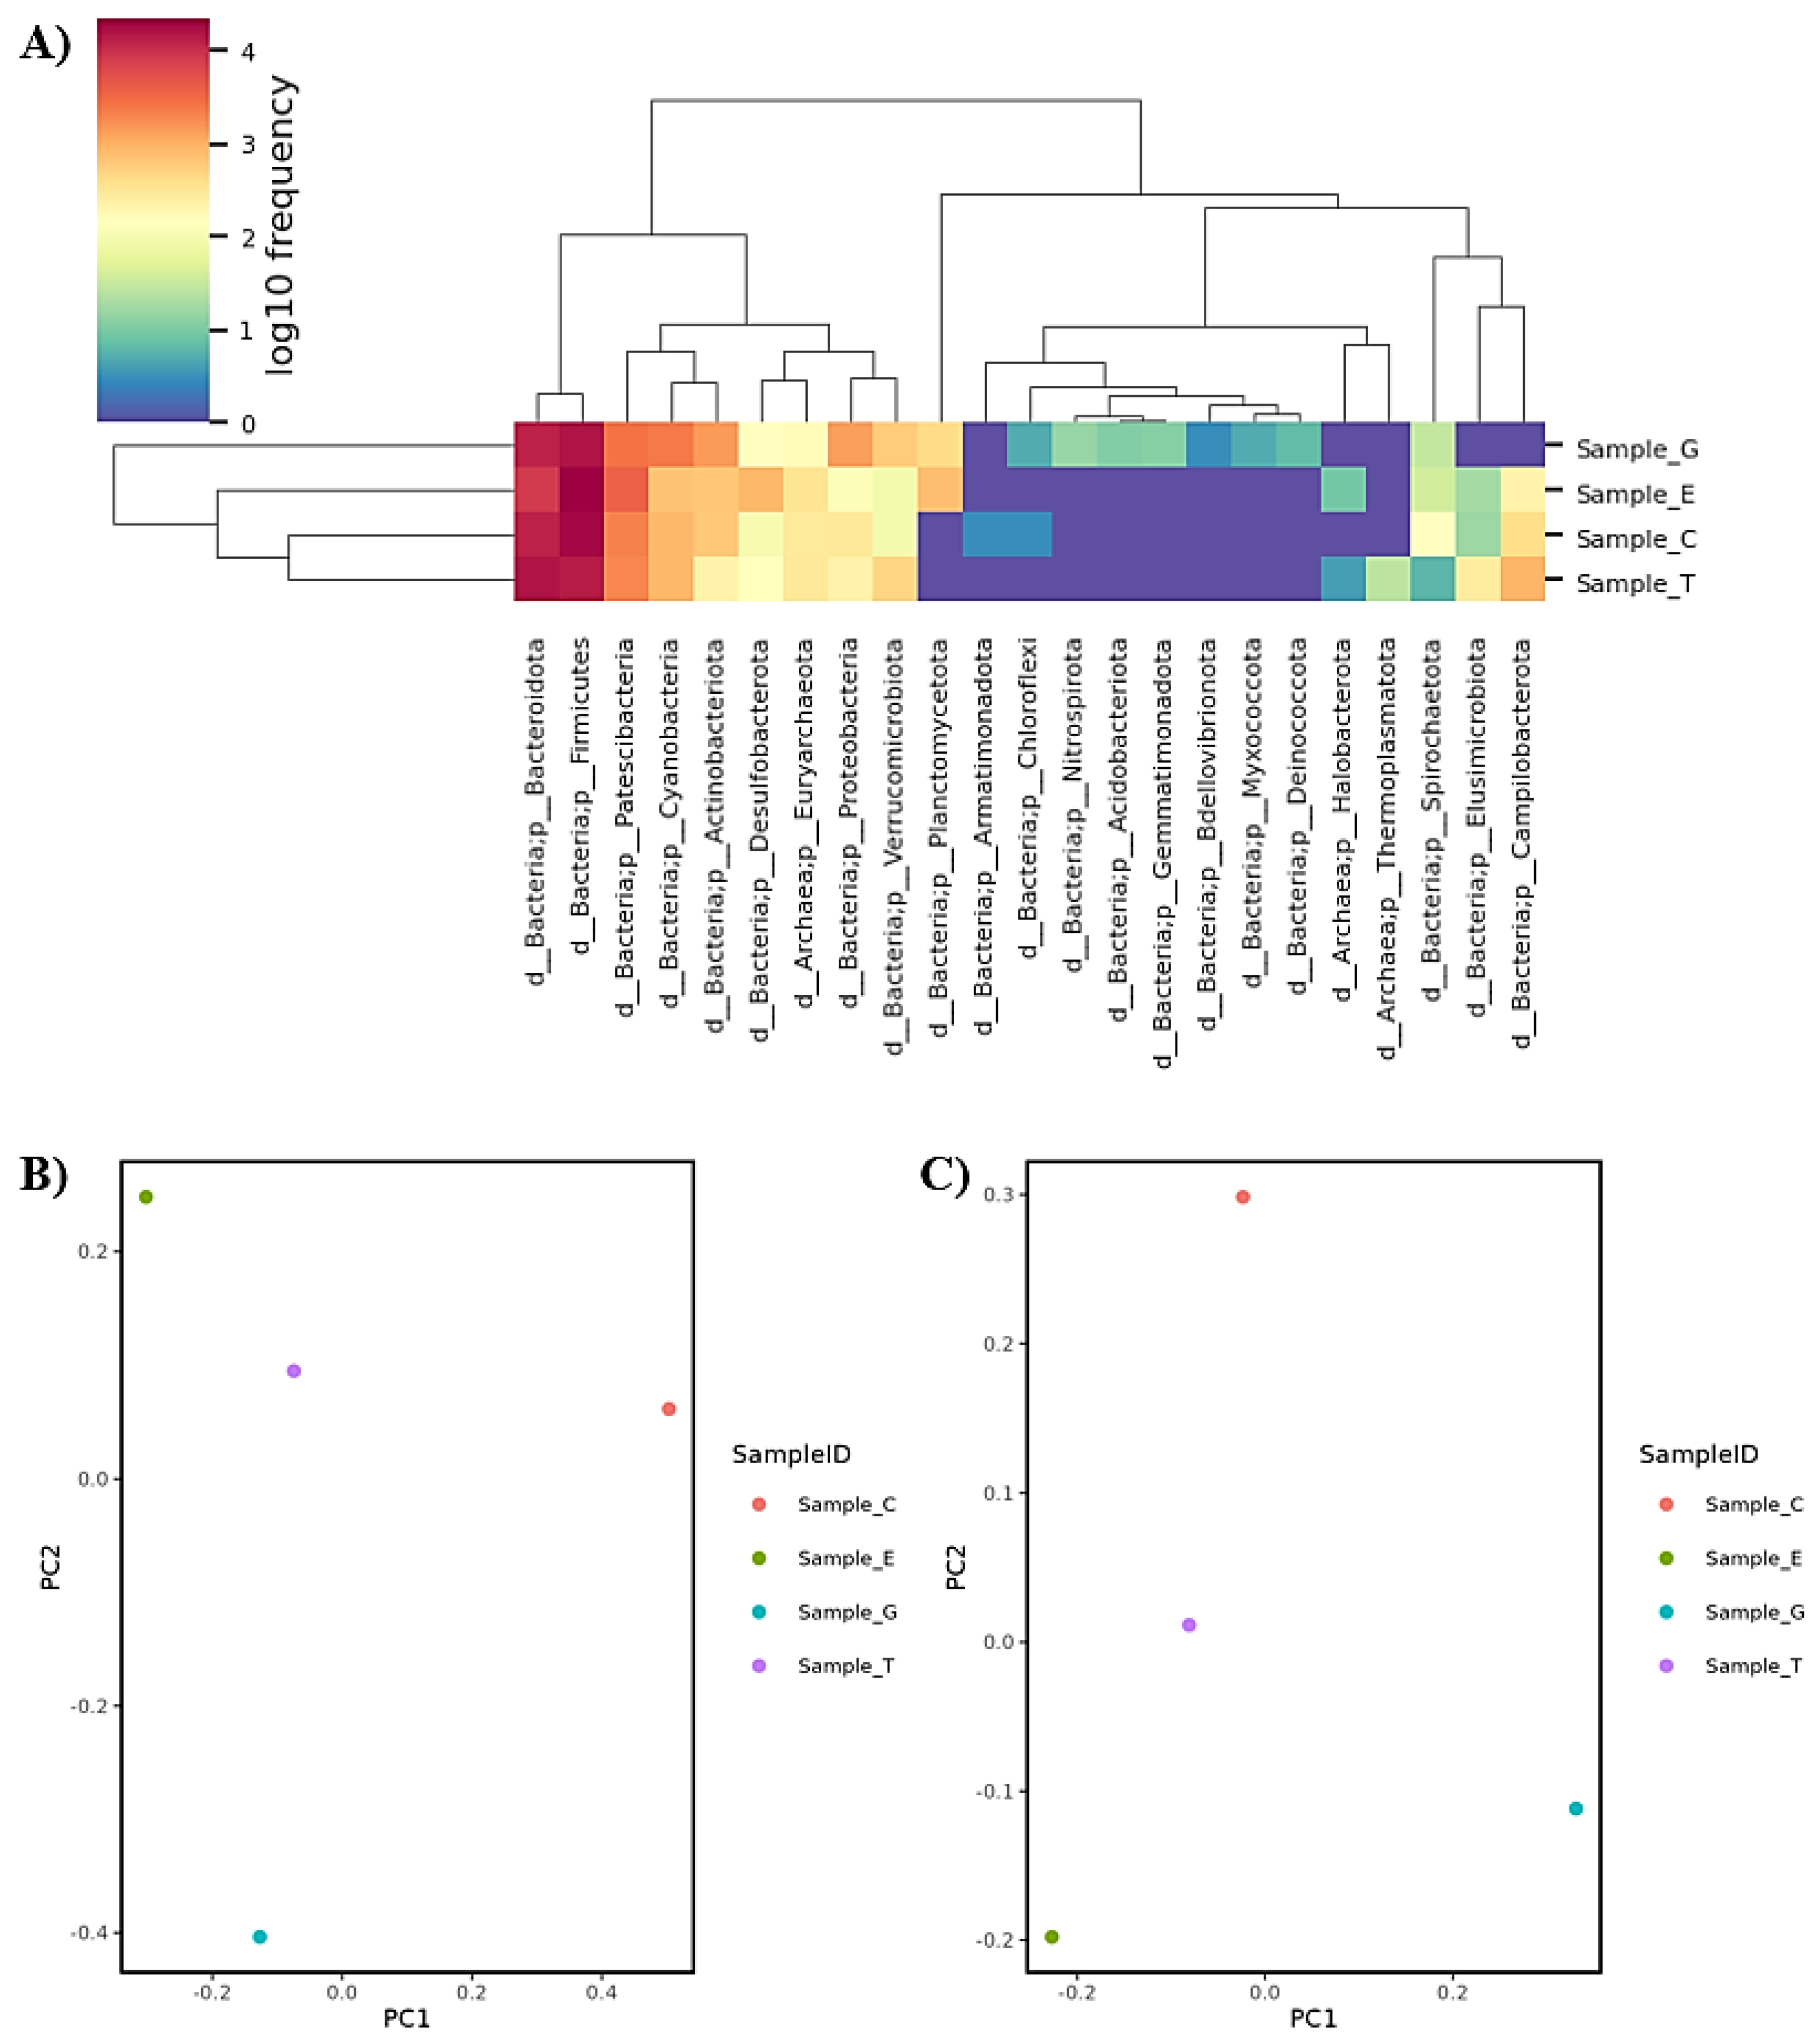
Figure 6.
GNPs suppress ethanol-induced intestinal inflammatory responses. Relative mRNA expression of inflammatory markers IL-1β, NF-κB, IL-6, and IL-4 in intestinal tissue from control, ethanol, GNP, and treatment groups. Data are presented as mean ± SD, one-way ANOVA with comparison to the ethanol group. (n = 3 per group). *p < 0.05, **p < 0.01, ***p < 0.001, ****p < 0.0001.
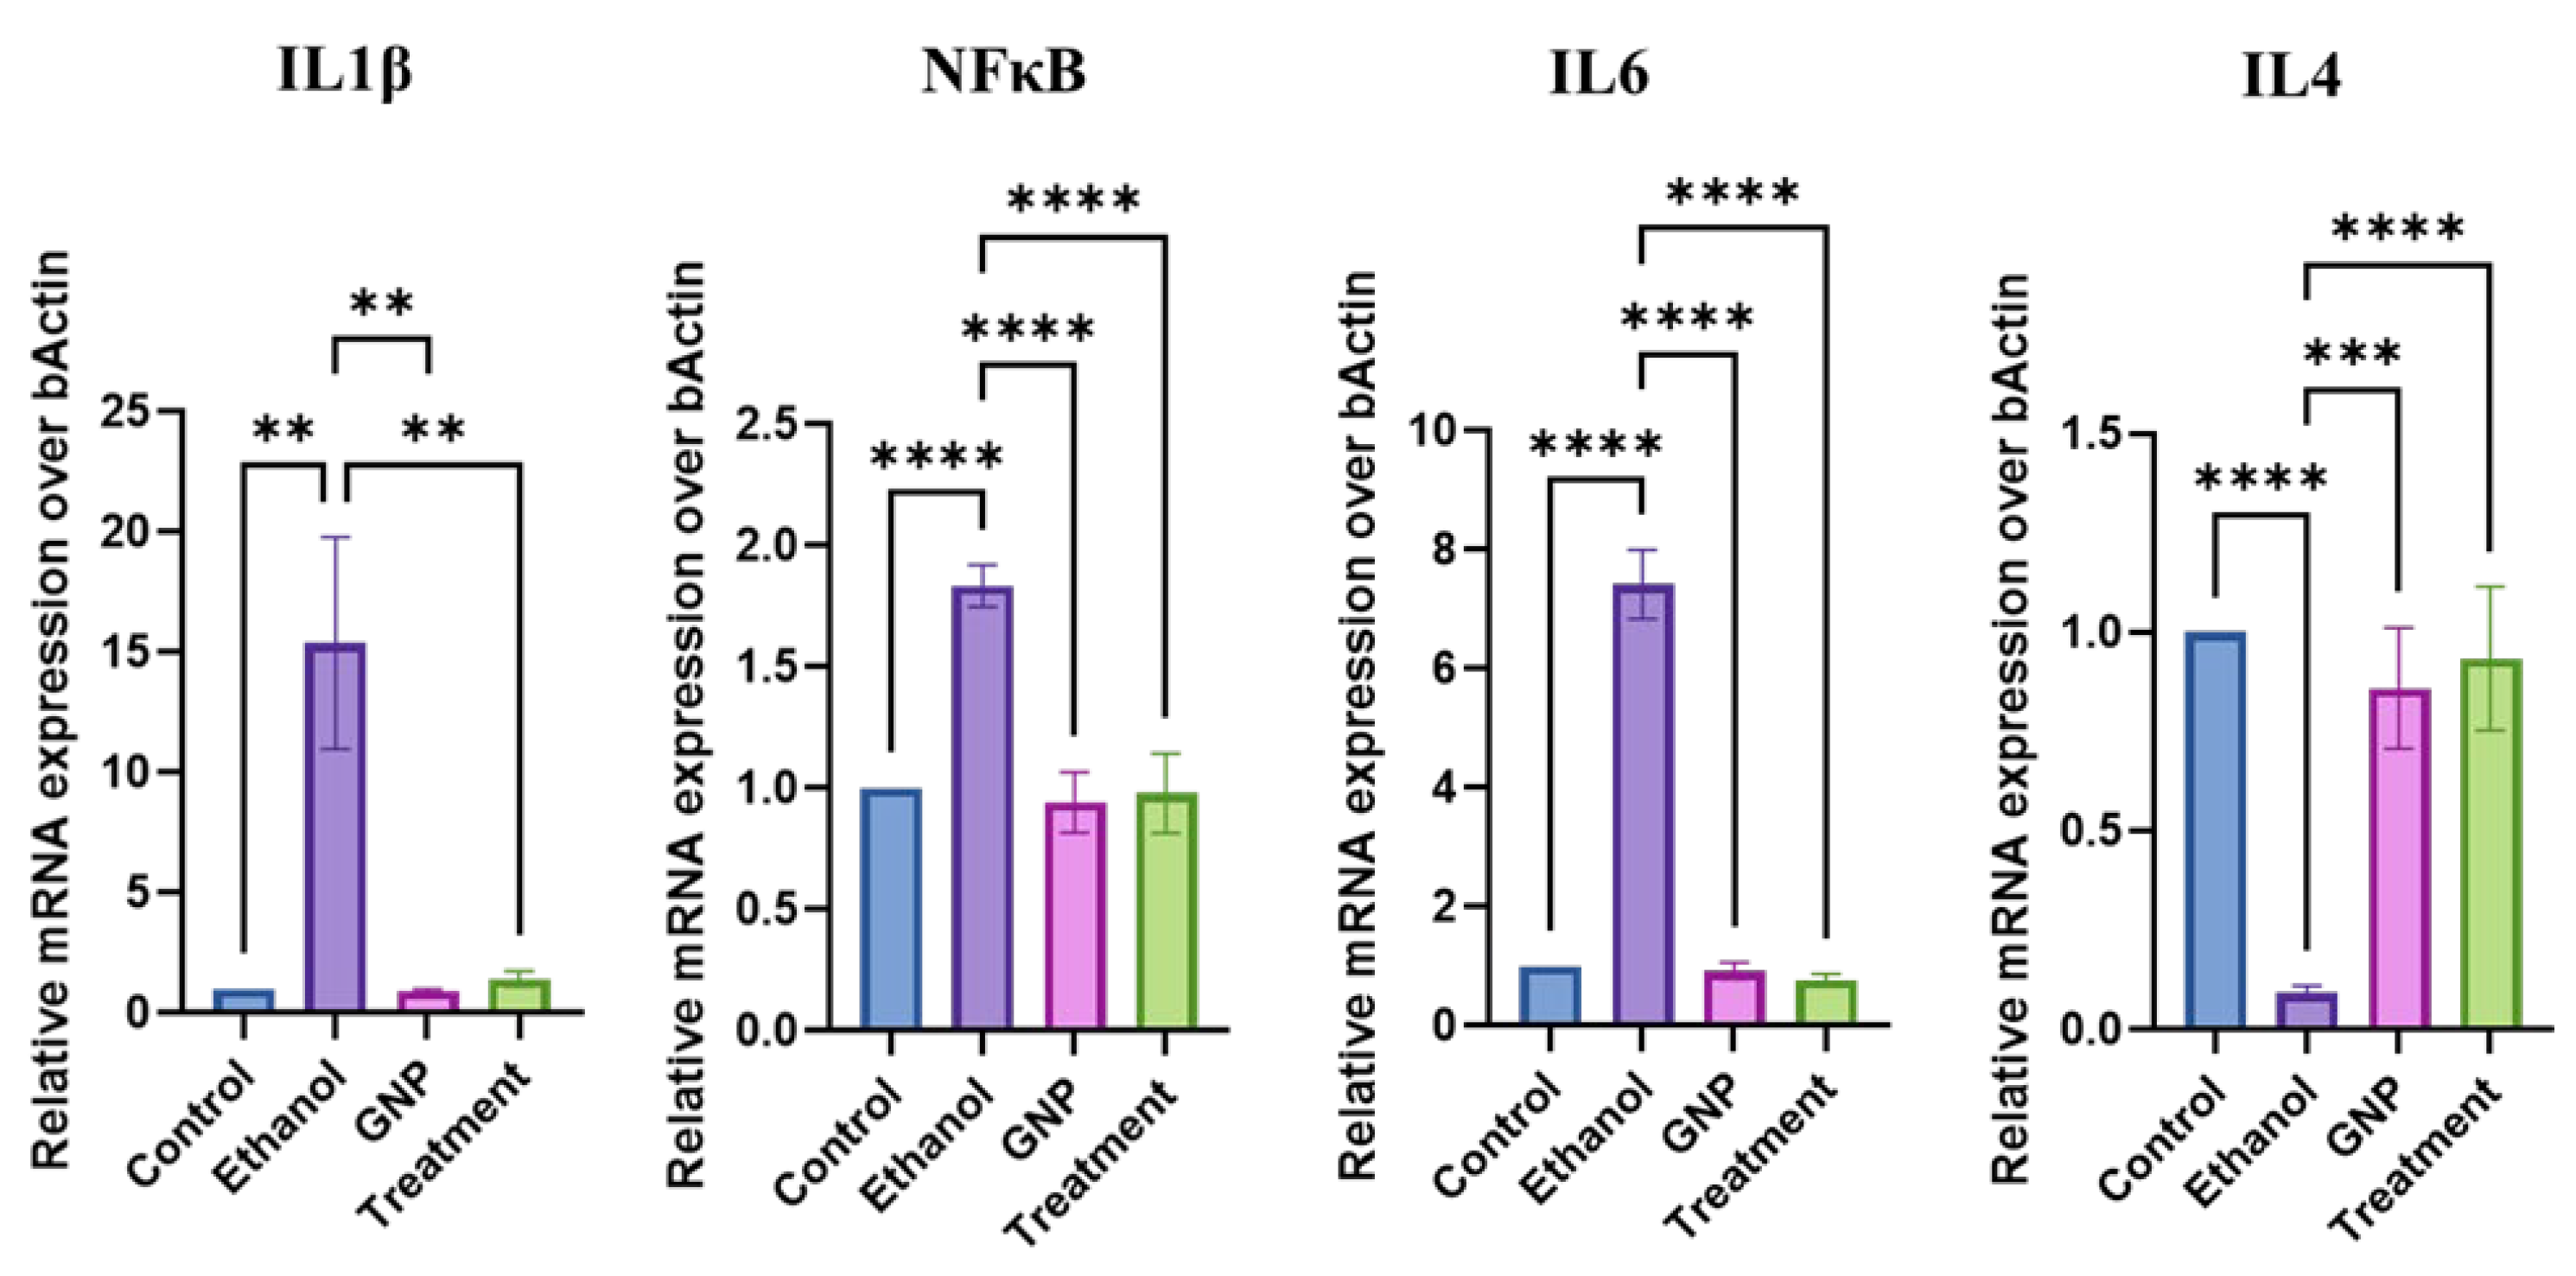
Figure 7.
GNPs modulate hepatic TLR4-associated inflammatory signalling. Relative mRNA expression of TLR4, iNOS, NF-κB, and arginase (Arg) in liver tissue from control, ethanol, GNP, and treatment groups. Data are presented as mean ± SD, one-way ANOVA with comparison to the ethanol group. (n = 3 per group). *p < 0.05, **p < 0.01, ***p < 0.001, ****p < 0.0001.
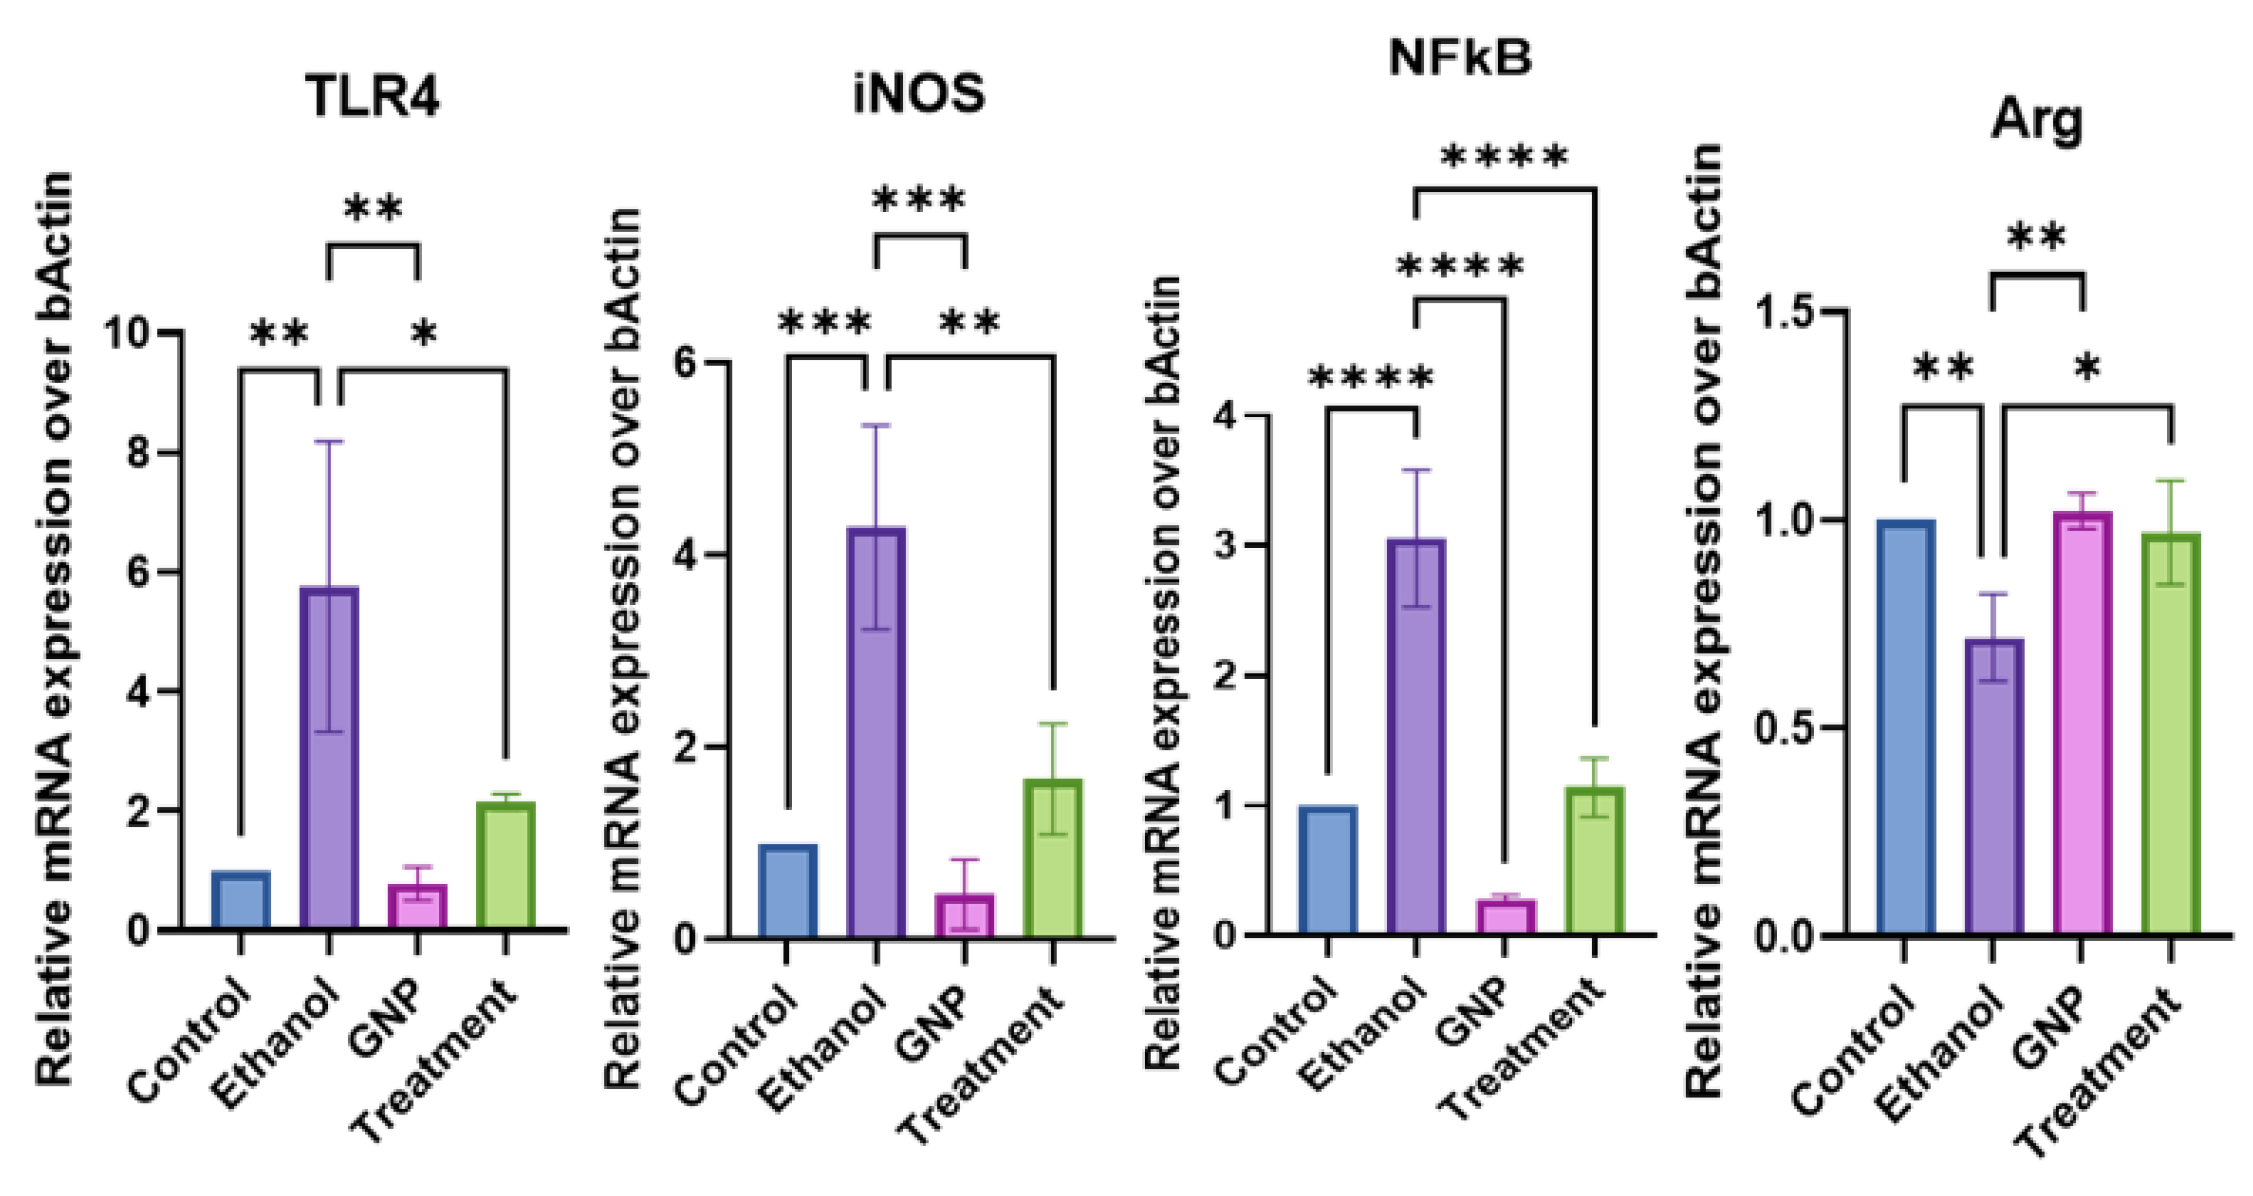
Figure 8.
GNPs regulate miRNA expression linked to gut–liver axis signalling. Relative expression of miR-122, miR-22, miR-203a, miR-21, and miR-214 in liver tissue from control, ethanol, GNP, and treatment groups. Data are presented as mean ± SD (n = 3 per group). *p < 0.05; **p < 0.01; ***p < 0.001; ns, not significant.
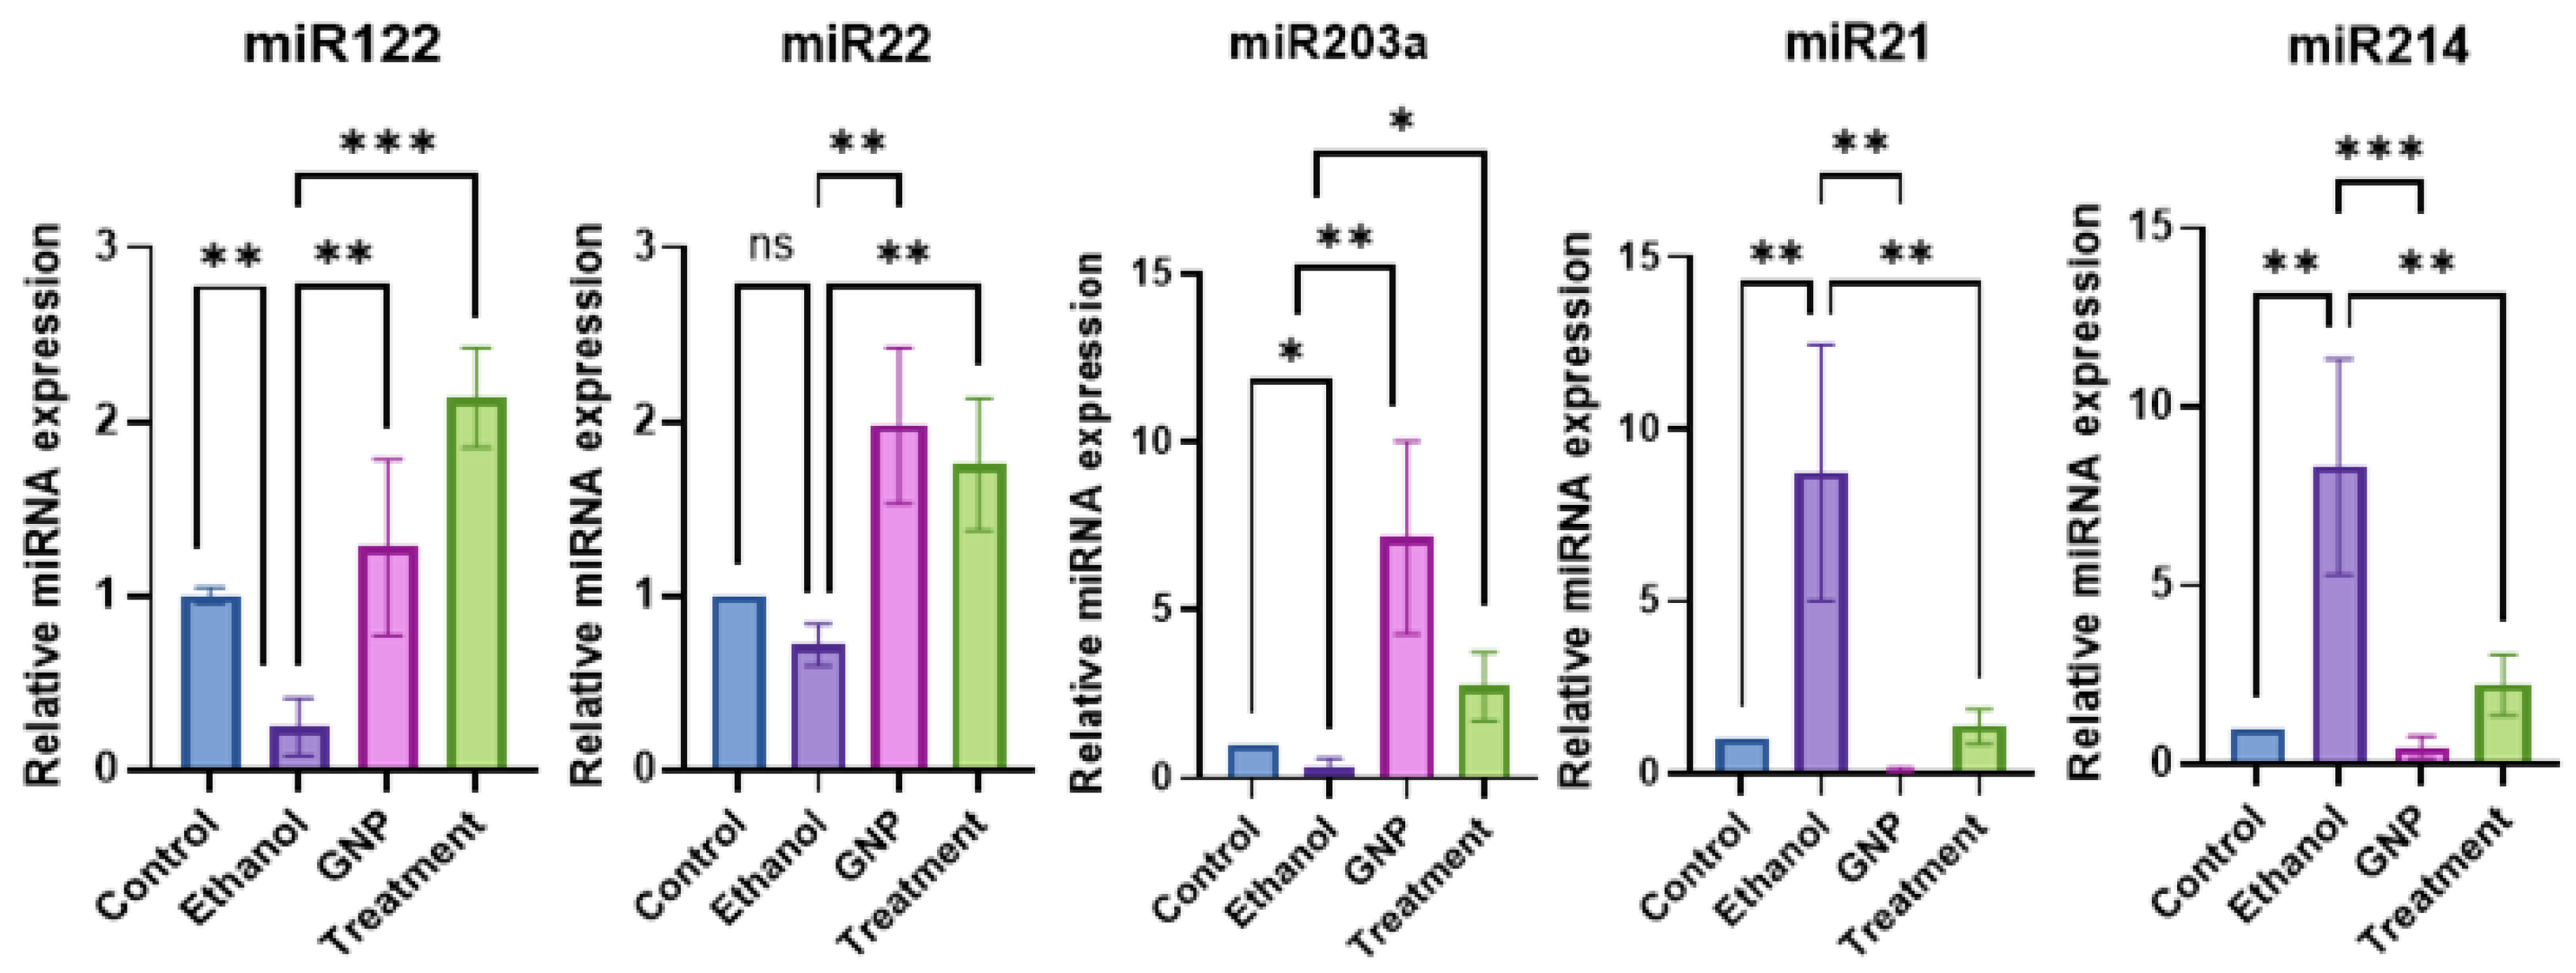
Figure 9.
GNPs modulate ethanol-induced stress–related protein expression. (A) Representative immunohistochemical staining of CYP2E1 in liver sections from pair-fed, ethanol, GNP, and treatment groups. (B) Representative immunohistochemical staining of cleaved caspase-3 in liver sections across experimental groups. (C) Representative immunoblots showing hepatic protein expression of HO-1 and Nrf2, with β-actin used as a loading control. (All immunohistochemical images were acquired at 400× magnification.).
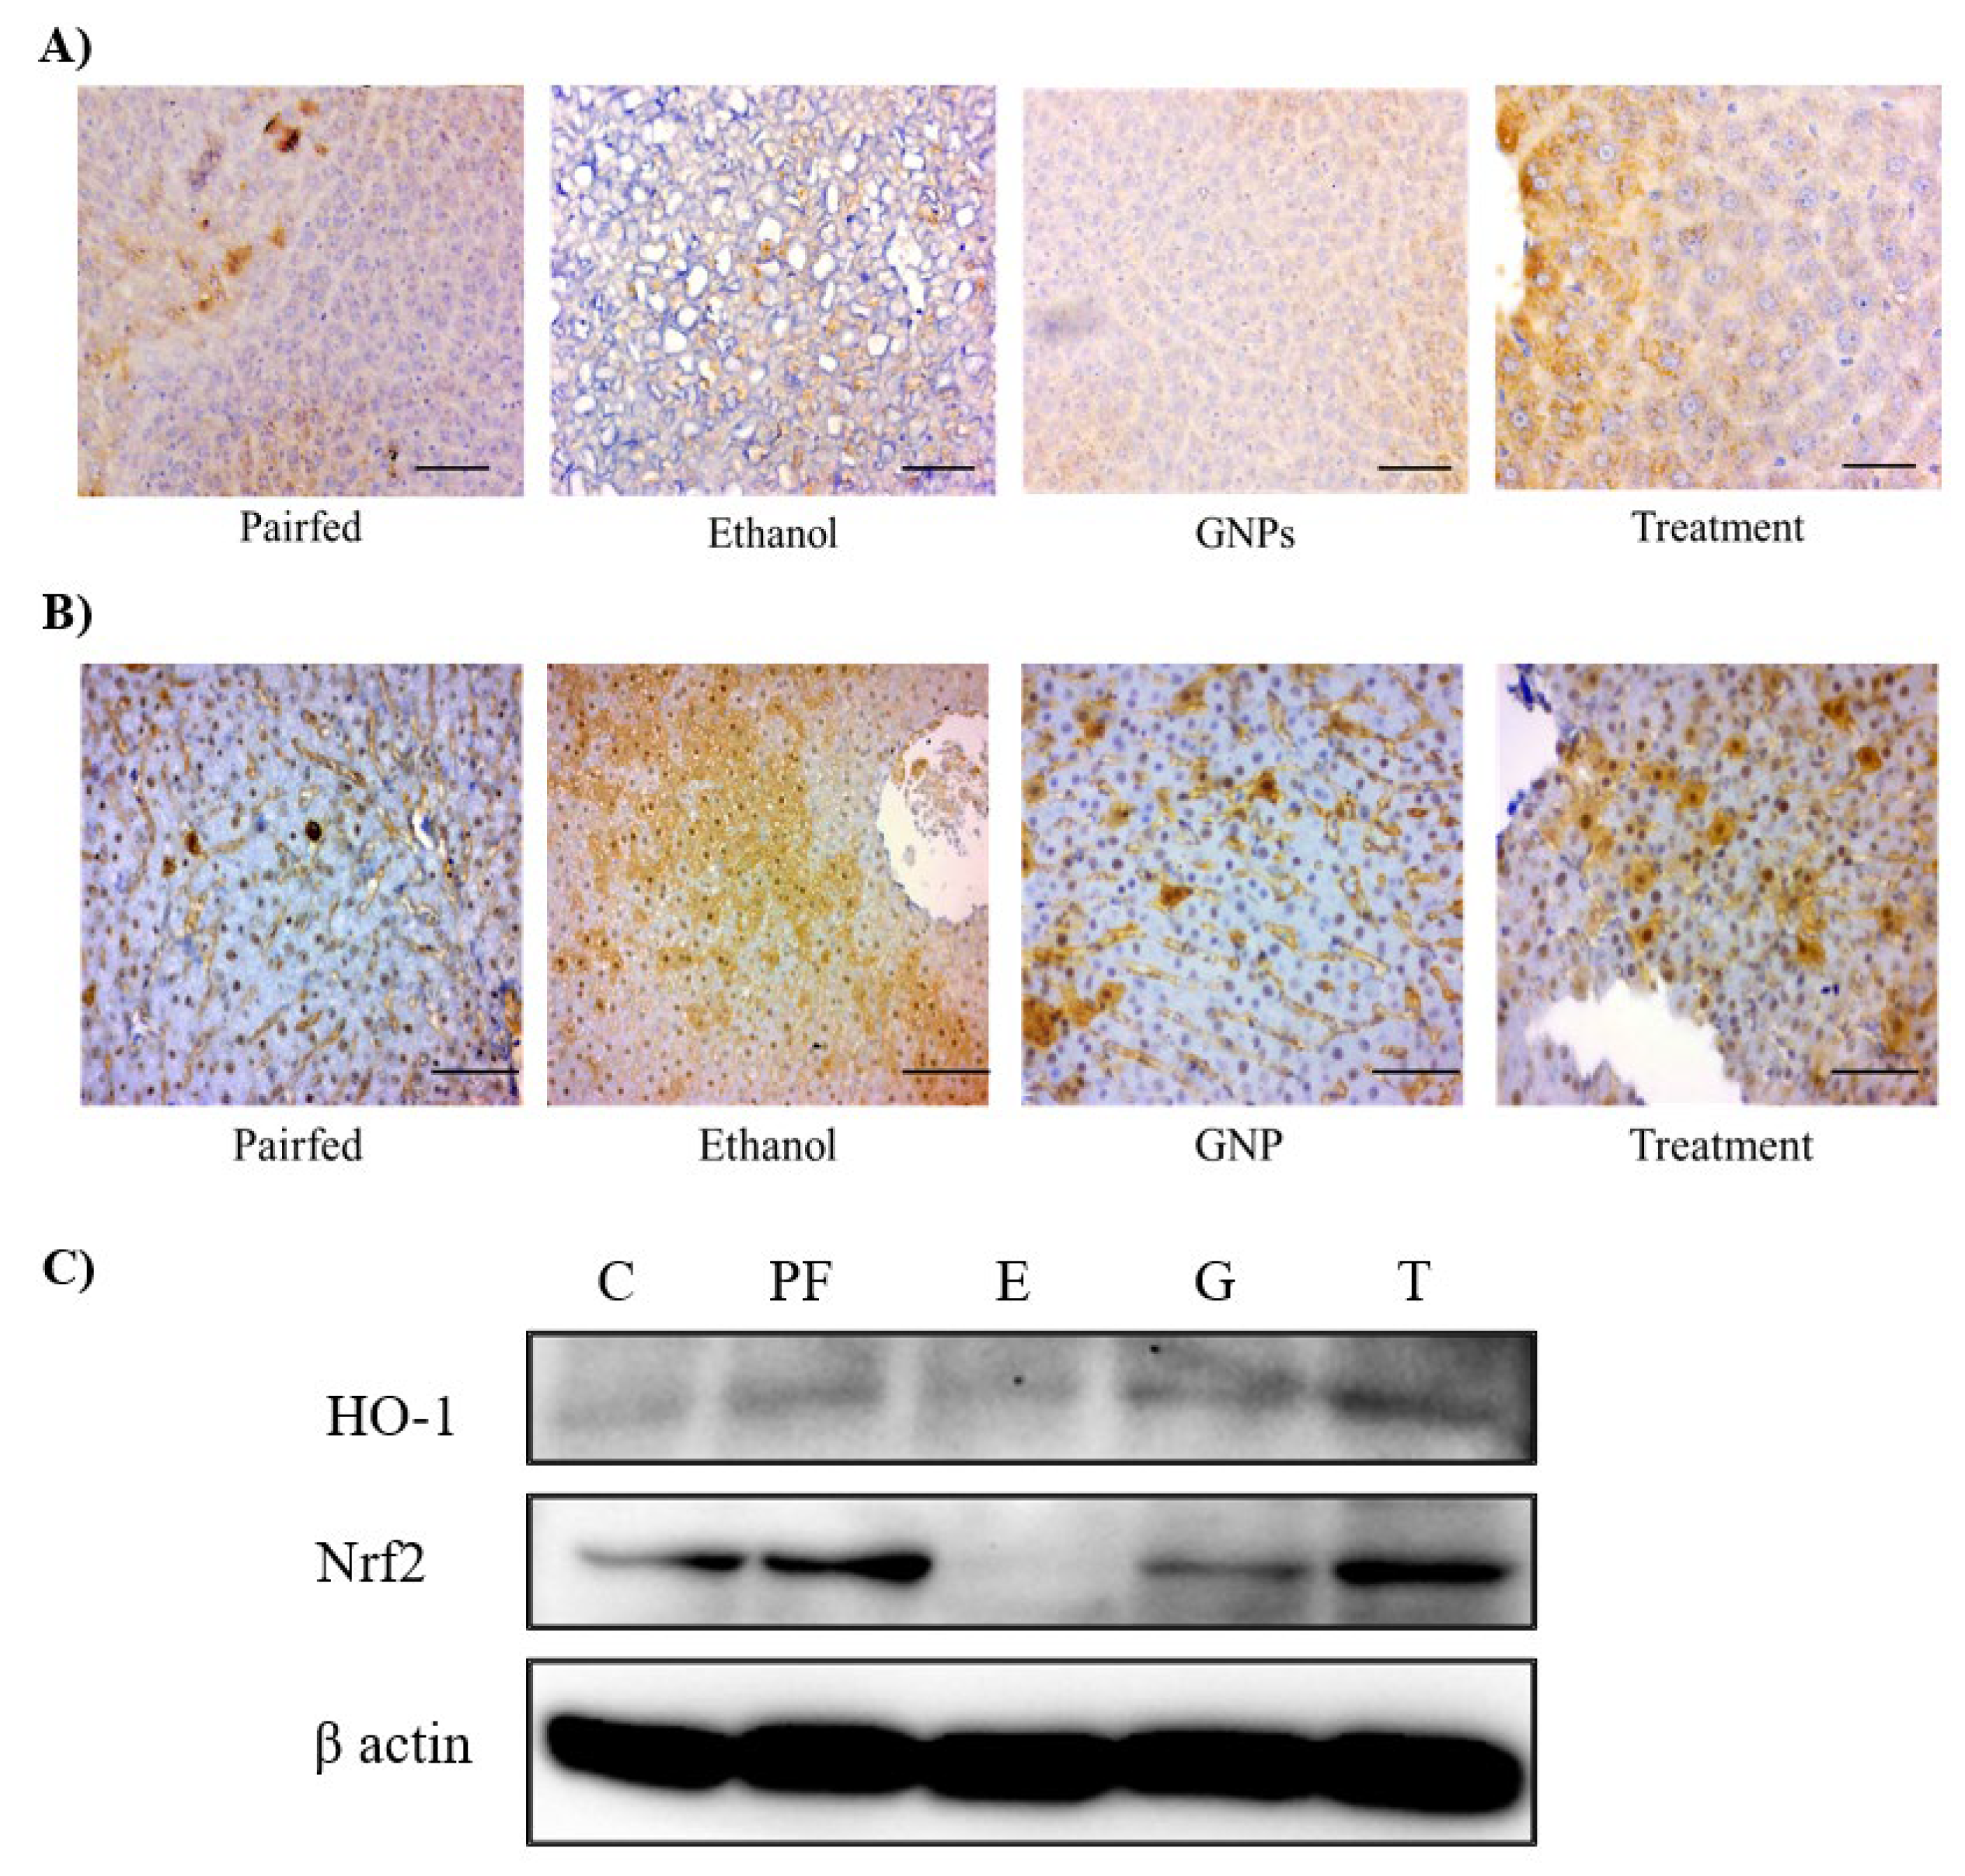

Table 1.
miRNA primer sequence for rats.
| miRNA name | Sequence 5’-3’ |
| miRNA21-5p | TAGCTTATCAGACTGATGTTGAAAA |
| miRNA203a-3p | GTGAAATGTTTAGGACCACTAGAA |
| miRNA214-3p | CAGGCACAGACAGGCAG |
| miRNA122-5p | TGGAGTGTGACAATGGTGTTTG |
| miRNA22-5p | AGTTCTTCAGTGGCAAGCT |
Disclaimer/Publisher’s Note: The statements, opinions and data contained in all publications are solely those of the individual author(s) and contributor(s) and not of MDPI and/or the editor(s). MDPI and/or the editor(s) disclaim responsibility for any injury to people or property resulting from any ideas, methods, instructions or products referred to in the content. |
© 2026 by the authors. Licensee MDPI, Basel, Switzerland. This article is an open access article distributed under the terms and conditions of the Creative Commons Attribution (CC BY) license (http://creativecommons.org/licenses/by/4.0/).
Copyright: This open access article is published under a Creative Commons CC BY 4.0 license, which permit the free download, distribution, and reuse, provided that the author and preprint are cited in any reuse.


