
Submitted:
01 January 2026
Posted:
05 January 2026
You are already at the latest version
Abstract
Direct-to-consumer (D2C) brands increasingly rely on A/B testing to optimize paid social advertising, yet common execution errors—inconsistent attribution, underpowered samples, mid-test edits, and metric flexibility—undermine inferential validity [1]. This paper develops a methodological framework for decision-grade experimentation on Meta (Facebook) Ads that balances statistical rigor with business guardrails. We synthesize established practices in online experiments [1–3] and operationalize them into a prioritized test sequence, integrating power analysis, Sample Ratio Mismatch (SRM) diagnostics [4,5] optional CUPED variance reduction [6] and economic guardrails (e.g., ROASthresholds, delivery balance, frequency parity). Evidence and scope. All analyses use a synthetic/simulated dataset calibrated to D2C benchmarks; no live-traffic data are analyzed. The simulation demonstrates the analytical workflow and decision logic without making empirical claims about real-world effectiveness. The contribution is methodological: a reproducible template practitioners can adapt and validate in production.
Keywords:
framework
; A/B testing
; CPA
; ROAS
; CUPED
; SRM
; power/MDE
; governance
; D2C
; Meta Ads
; simulation
1. Introduction
Execution mistakes in paid social testing routinely erode validity: moving attribution windows, premature stopping, overlapping audiences, and noisy secondary metrics produce unstable conclusions and poor reproducibility.[1] Popular guidance is either platform-agnostic (statistics-first) or overly tactical (platform tips). Few sources integrate statistical discipline and operational guardrails into a single protocol tailored to Meta Ads.
Contribution. We design an integrated framework that (i) locks a single decision metric (CPA) and consistent attribution, (ii) enforces integrity gates (SRM, delivery/frequency balance, tracking QA), (iii) sizes tests to decision-relevant MDEs, and (iv) codifies guardrails linking statistical significance to unit economics. We then illustrate the framework via a calibrated simulation to show end-to-end analysis and decisions. This is a methods paper with a simulated proof-of-concept, not an empirical study.
2. Glossary and Notation
| Term | Definition |
| CPA | Cost per Acquisition: Spend/Purchases (reporting currency INR). Primary decision metric. |
| CVR | Purchase conversion rate: Purchases/Link Clicks. Inference metric for two-proportion tests. |
| ROAS | Return on Ad Spend: Revenue/Spend (platform-reported). Guardrail, not a decision metric. |
| SRM | Sample Ratio Mismatch: statistically significant deviation from planned traffic split.[4] |
| CUPED | Controlled-experiment Using Pre-Experiment Data; variance reduction using pre-period covariates.[6] |
| Attribution | 7-day click / 1-day view window, applied uniformly across arms for optimization and reporting.[7] |
| Guardrails G1–G5 | G1: ROAS threshold; G2: delivery 45–55%; G3: frequency parity ; G4: web vitals (LCP < 2.5 s, CLS < 0.1, INP target);[8] G5: SRM pass (). |
3. Literature Review
- Foundations in online experimentation.
Best practices emphasize prospective hypotheses, mutually exclusive randomization, fixed analysis plans, adequate power, and disciplined monitoring.[1] Always-valid or sequential procedures control error when interim looks are unavoidable.[2,9] SRM tests detect allocation anomalies that can invalidate inference.[4,5] CUPED leverages pre-period covariates to reduce variance without changing the estimand.[6]
- Paid social experimentation: platform-specific challenges.
Meta’s delivery system introduces complexities beyond generic web testing: attribution-window drift can rerank variants; audience overlap and learning-phase dynamics threaten balance; pacing and frequency caps constrain delivery; and platform-reported conversions may diverge from causal incrementality.[7,10,11,12] Practitioner guidance highlights creative modality, CTA framing, and audience quality as high-impact levers,[13,14] while landing performance (LCP, CLS, INP) shapes realized lift.[8]
- Gap and this framework.
Existing work is either platform-agnostic (statistics-first) or narrowly tactical. We operationalize established statistical methods (power/MDE, SRM, CUPED, multiplicity control[15,16]) into a protocol aligned with Meta’s split-testing mechanics[10] and tie decisions to unit economics via guardrails—offering a reproducible template practitioners can adopt without advanced statistical tooling.
4. Framework Development
4.1. Design Principles
Each test isolates one lever—creative, copy/CTA, audience, or placement—while mirroring budgets, schedules, placements, and audiences to preserve interpretability.[1] Allocation uses Meta split-tests with mutually exclusive arms (e.g., 50/50) and mirrored pacing to target balanced delivery.[10] We predefine the decision metric (CPA), secondary diagnostics (CVR, CTR, CPC, ROAS), and a single attribution window applied uniformly across arms (7C/1V) to prevent window-induced reversals.[7]
4.2. Measurement Plan
Primary. (INR).
Secondary. Purchase CVR, CTR, CPC, ROAS.
Guardrails (G1–G5). (G1) ROAS threshold; (G2) delivery 45–55%; (G3) frequency parity ; (G4) web vitals within targets; (G5) SRM pass at .[4,8]
Denominator standard. We compute CVR on link-click denominators to stabilize variance; CPA remains the decision variable.
4.3. Power, Sample Size, and MDE
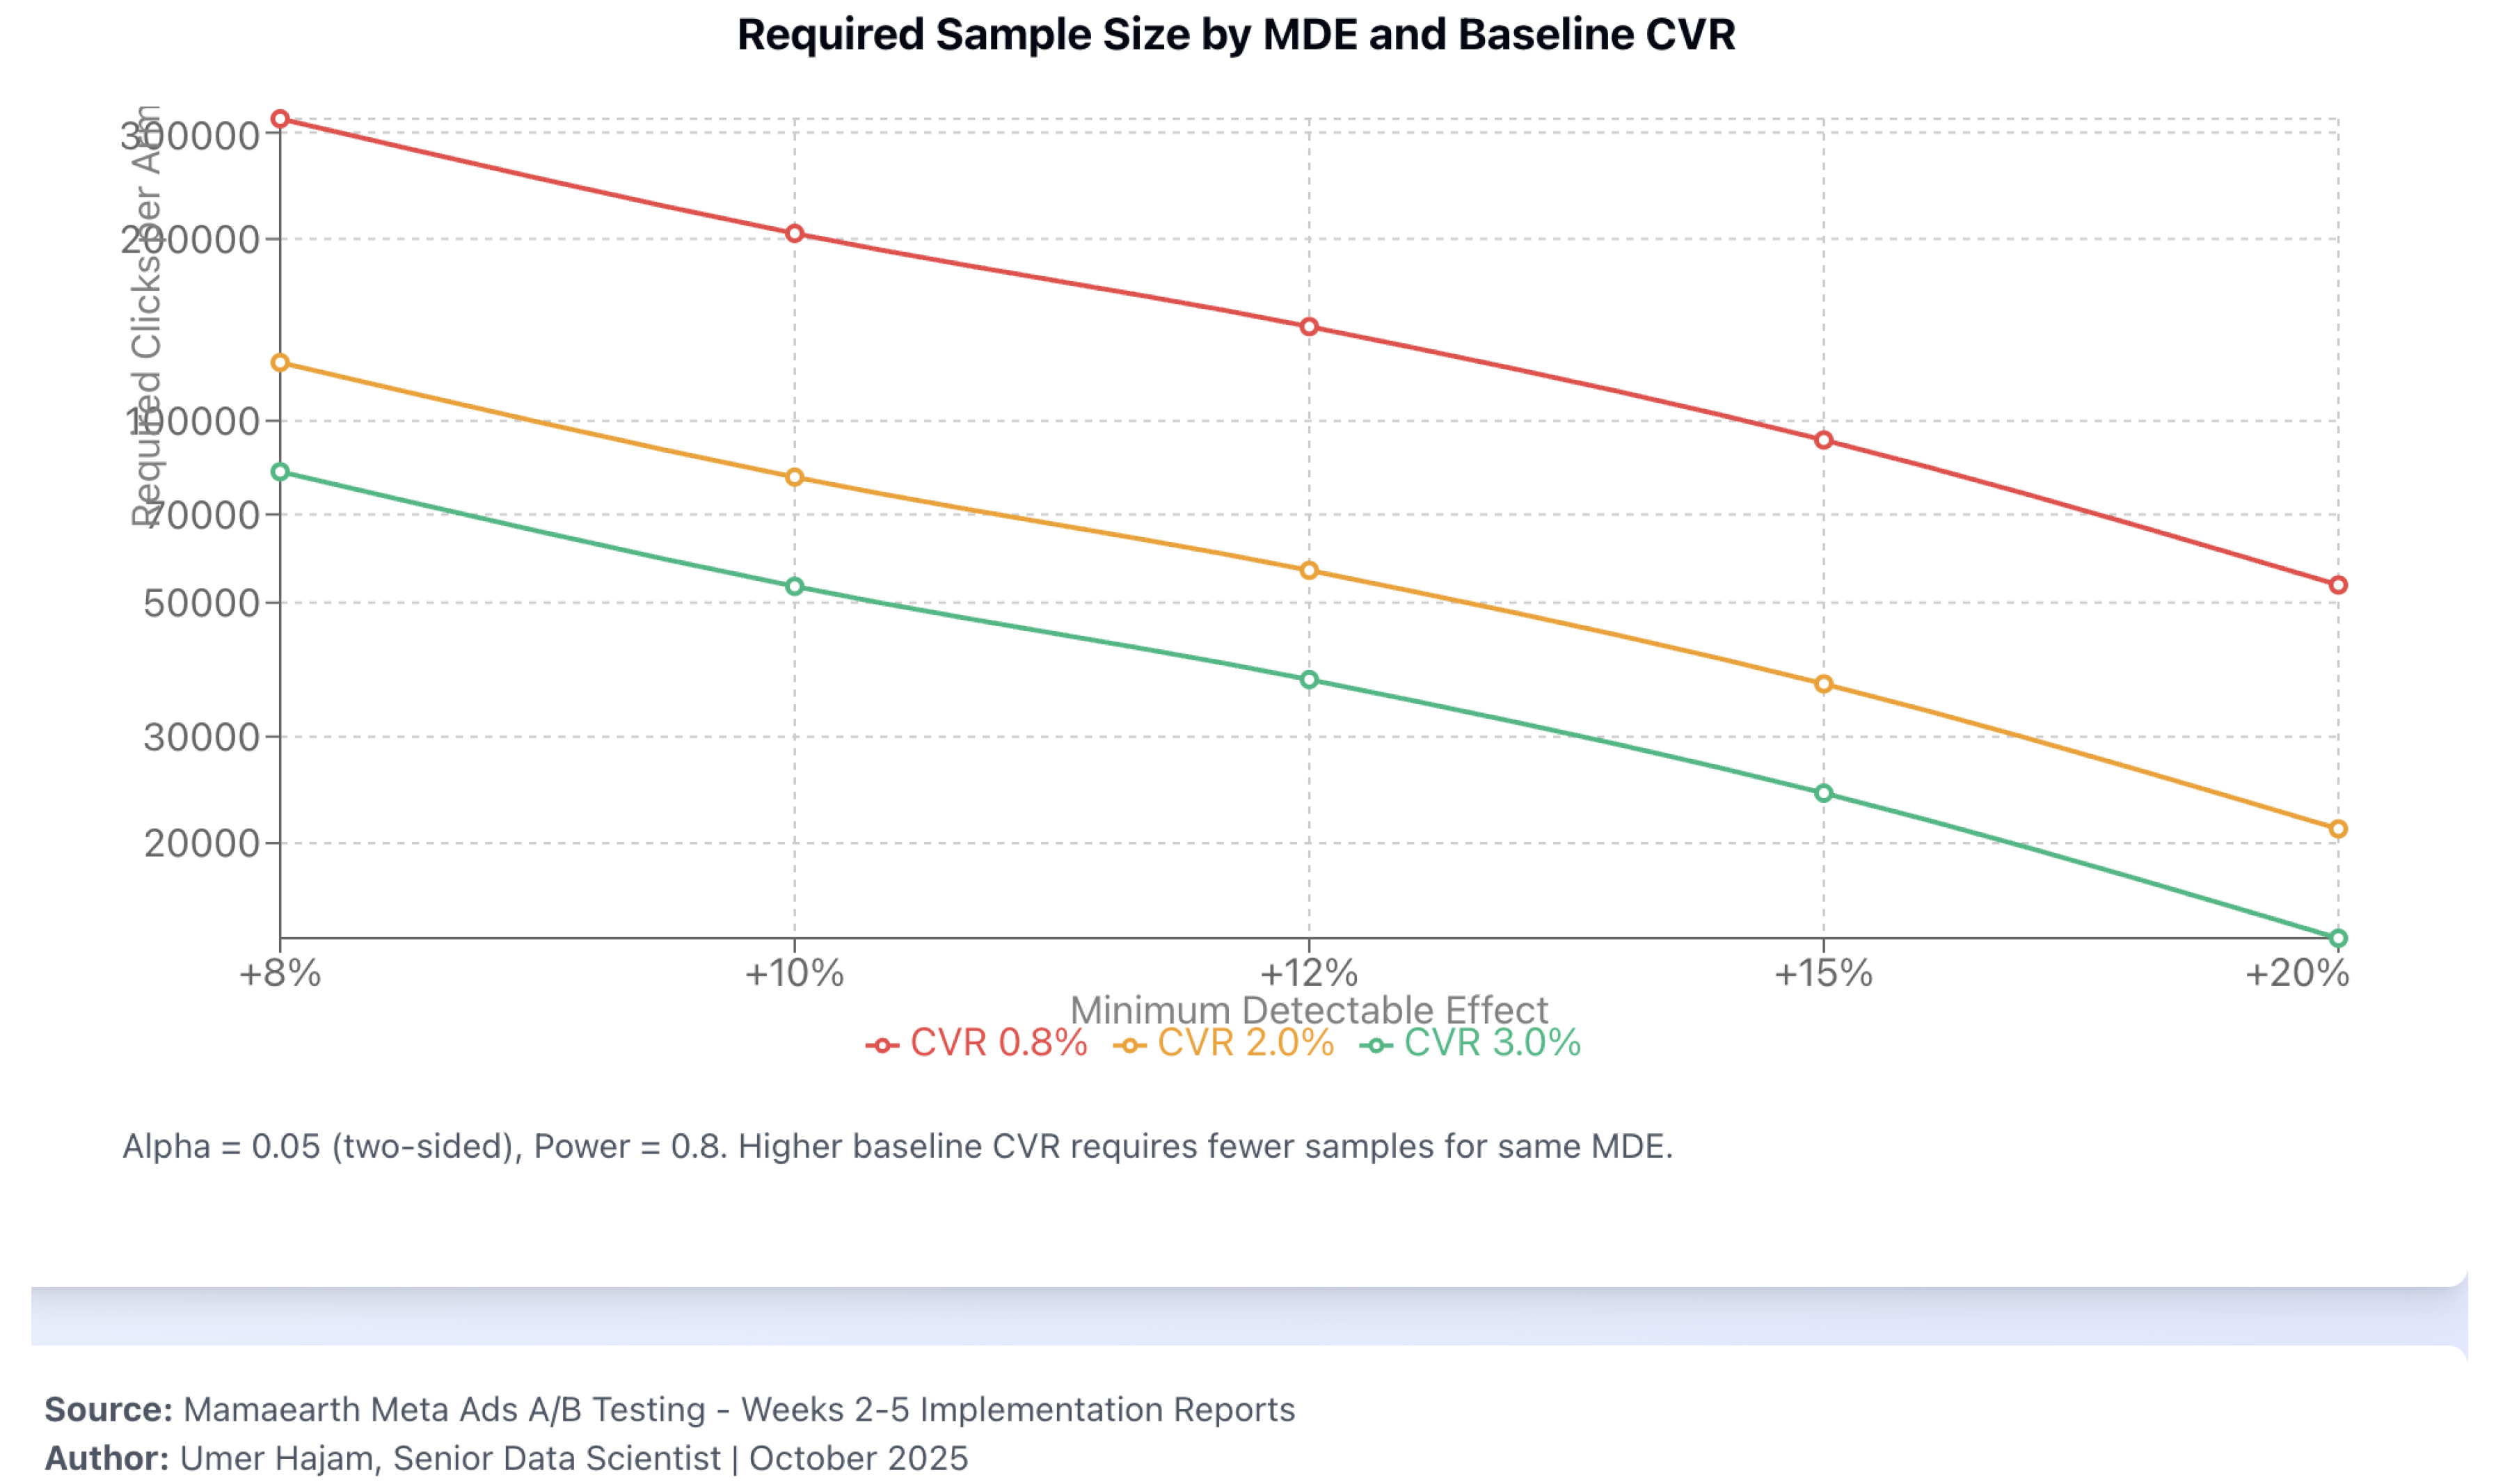
We determine sample size on the CVR scale via a two-proportion test with pooled standard error under and Wilson intervals for single-arm coverage.[17,18] Let be baseline CVR and the alternative (relative MDE ). For two-sided size and power ,
Figure 1.
Required clicks per arm vs. minimum detectable effect (MDE) and baseline CVR (, two-sided; power ). Simulated illustration; decision metric: CPA; inference metric: CVR; guardrails G1–G5 apply.
Figure 1.
Required clicks per arm vs. minimum detectable effect (MDE) and baseline CVR (, two-sided; power ). Simulated illustration; decision metric: CPA; inference metric: CVR; guardrails G1–G5 apply.
4.4. Integrity Diagnostics
Delivery/frequency. Monitor arm delivery share and frequency deltas; investigate deviations.
4.5. Variance Reduction (CUPED)
When stable pre-period covariates exist, compute with ; report raw and adjusted estimates without changing the estimand.[6]
4.6. Statistical Analysis and Decision Rule
Primary test. Two-proportion z-test on purchase CVR at preregistered ; report absolute/relative effects and CIs.
Decision. Decisions are made on CPA. Promotion requires: (i) CVR lift (or preregistered non-inferiority), (ii) CPA improvement consistent with the CVR/CPC profile, and (iii) guardrails satisfied.
5. Simulation Study (Illustrative, Not Empirical)
Provenance. All scenarios use simulated data calibrated to D2C beauty benchmarks; no live traffic is analyzed. The goal is to demonstrate the workflow and decision logic, not to claim real-world effects. We deliberately use modal verbs (“would”) and repeated reminders of simulation.
5.1. Overview and Uncertainty
Across seven simulated A/B tests, three scenarios would meet significance on CVR and align economically on CPA/ROAS; one would be harmful; three are inconclusive at . We report z statistics, exact p-values, and 95% CIs for absolute CVR differences under Section 4.6.
- T1 (Prospecting creative). Simulated CVR difference pp (4.46% vs. 4.00%; , ; 95% CI pp) illustrates a promote decision on lower CPA (INR 212 vs. INR 250; ) assuming G1–G5 hold.
- T2 (Retargeting creative). Borderline CVR lift ( pp; , ) but higher CPA for lifestyle (INR 167); retain product on the CPA rule.
- T3 (Copy/CTA). Claim Offer simulated CVR lift pp () with CPA improvement () → promote.
- T4–T6. Inconclusive at ; resize or extend duration.
- T7 (Retargeting reverse). Harmful CVR ( pp; ) → reject, regardless of nominal CPA decrease.
Figure 2.
Purchase CVR by test and variant (control vs. treatment). Simulated data; decision metric: CPA; inference metric: CVR; guardrails G1–G5 apply.
Figure 2.
Purchase CVR by test and variant (control vs. treatment). Simulated data; decision metric: CPA; inference metric: CVR; guardrails G1–G5 apply.
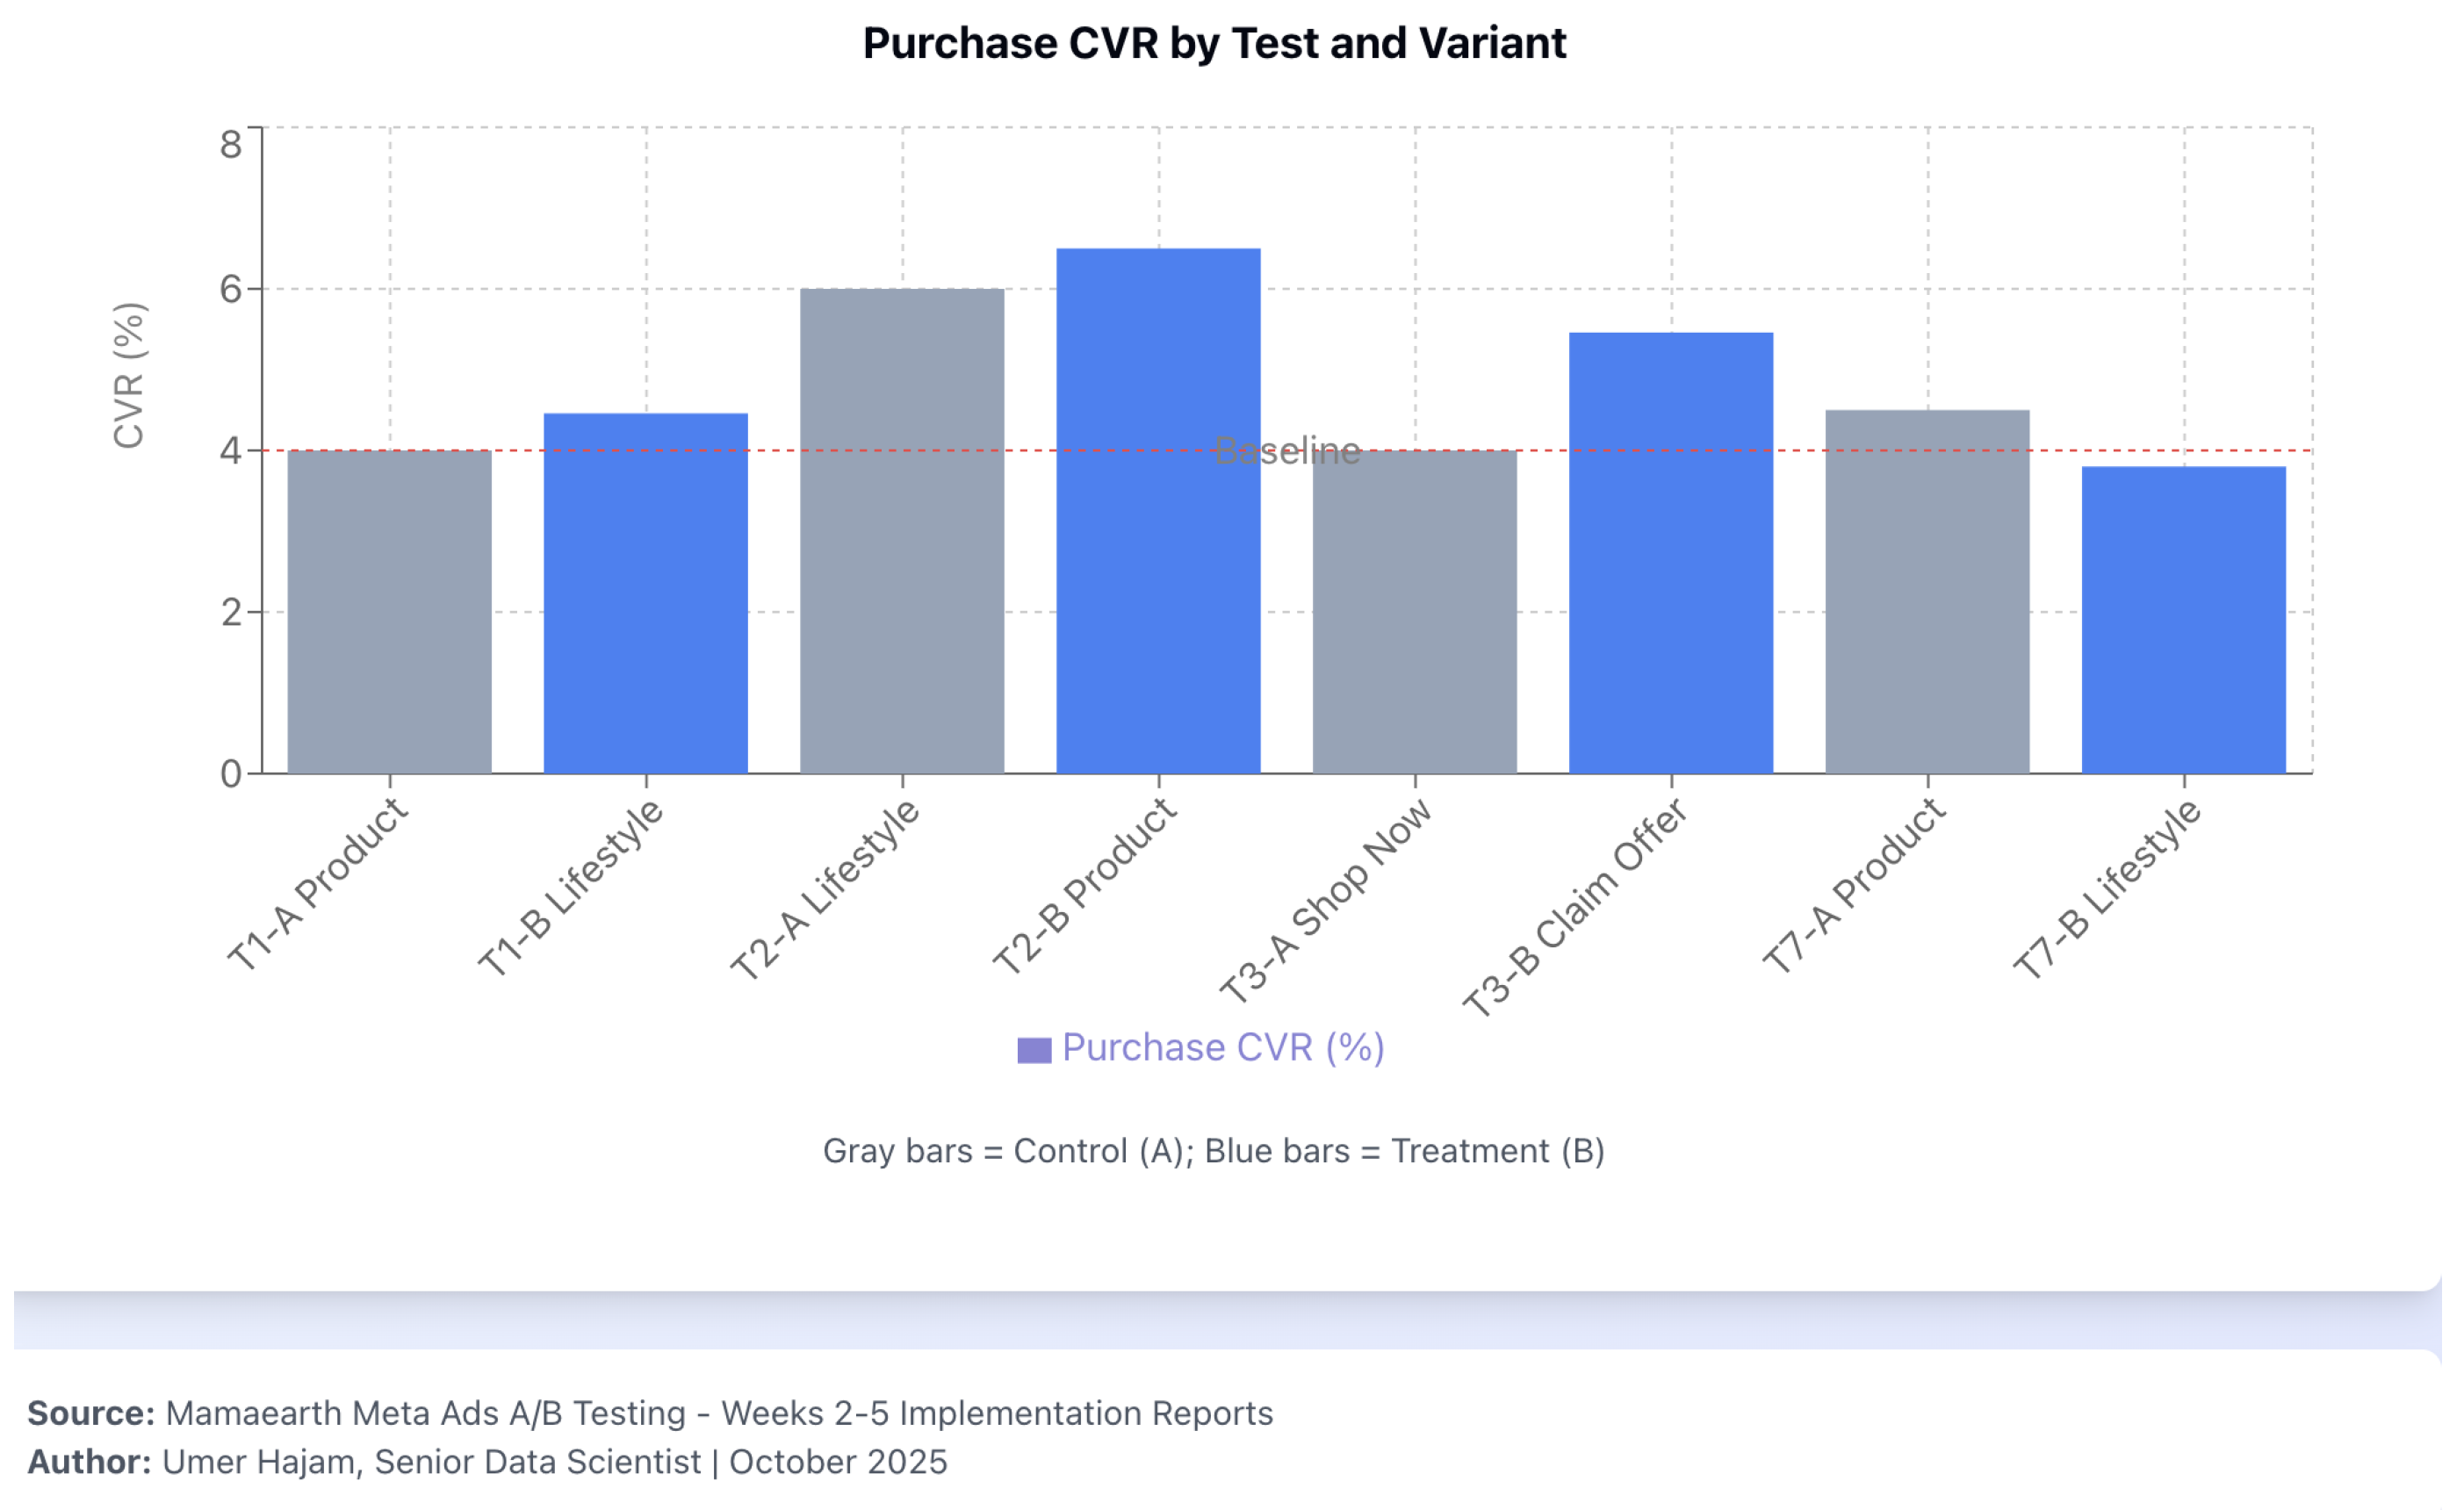
Figure 3.
CPA comparison (control vs. treatment) across tests. Simulated data; primary decision metric is CPA.
Figure 3.
CPA comparison (control vs. treatment) across tests. Simulated data; primary decision metric is CPA.
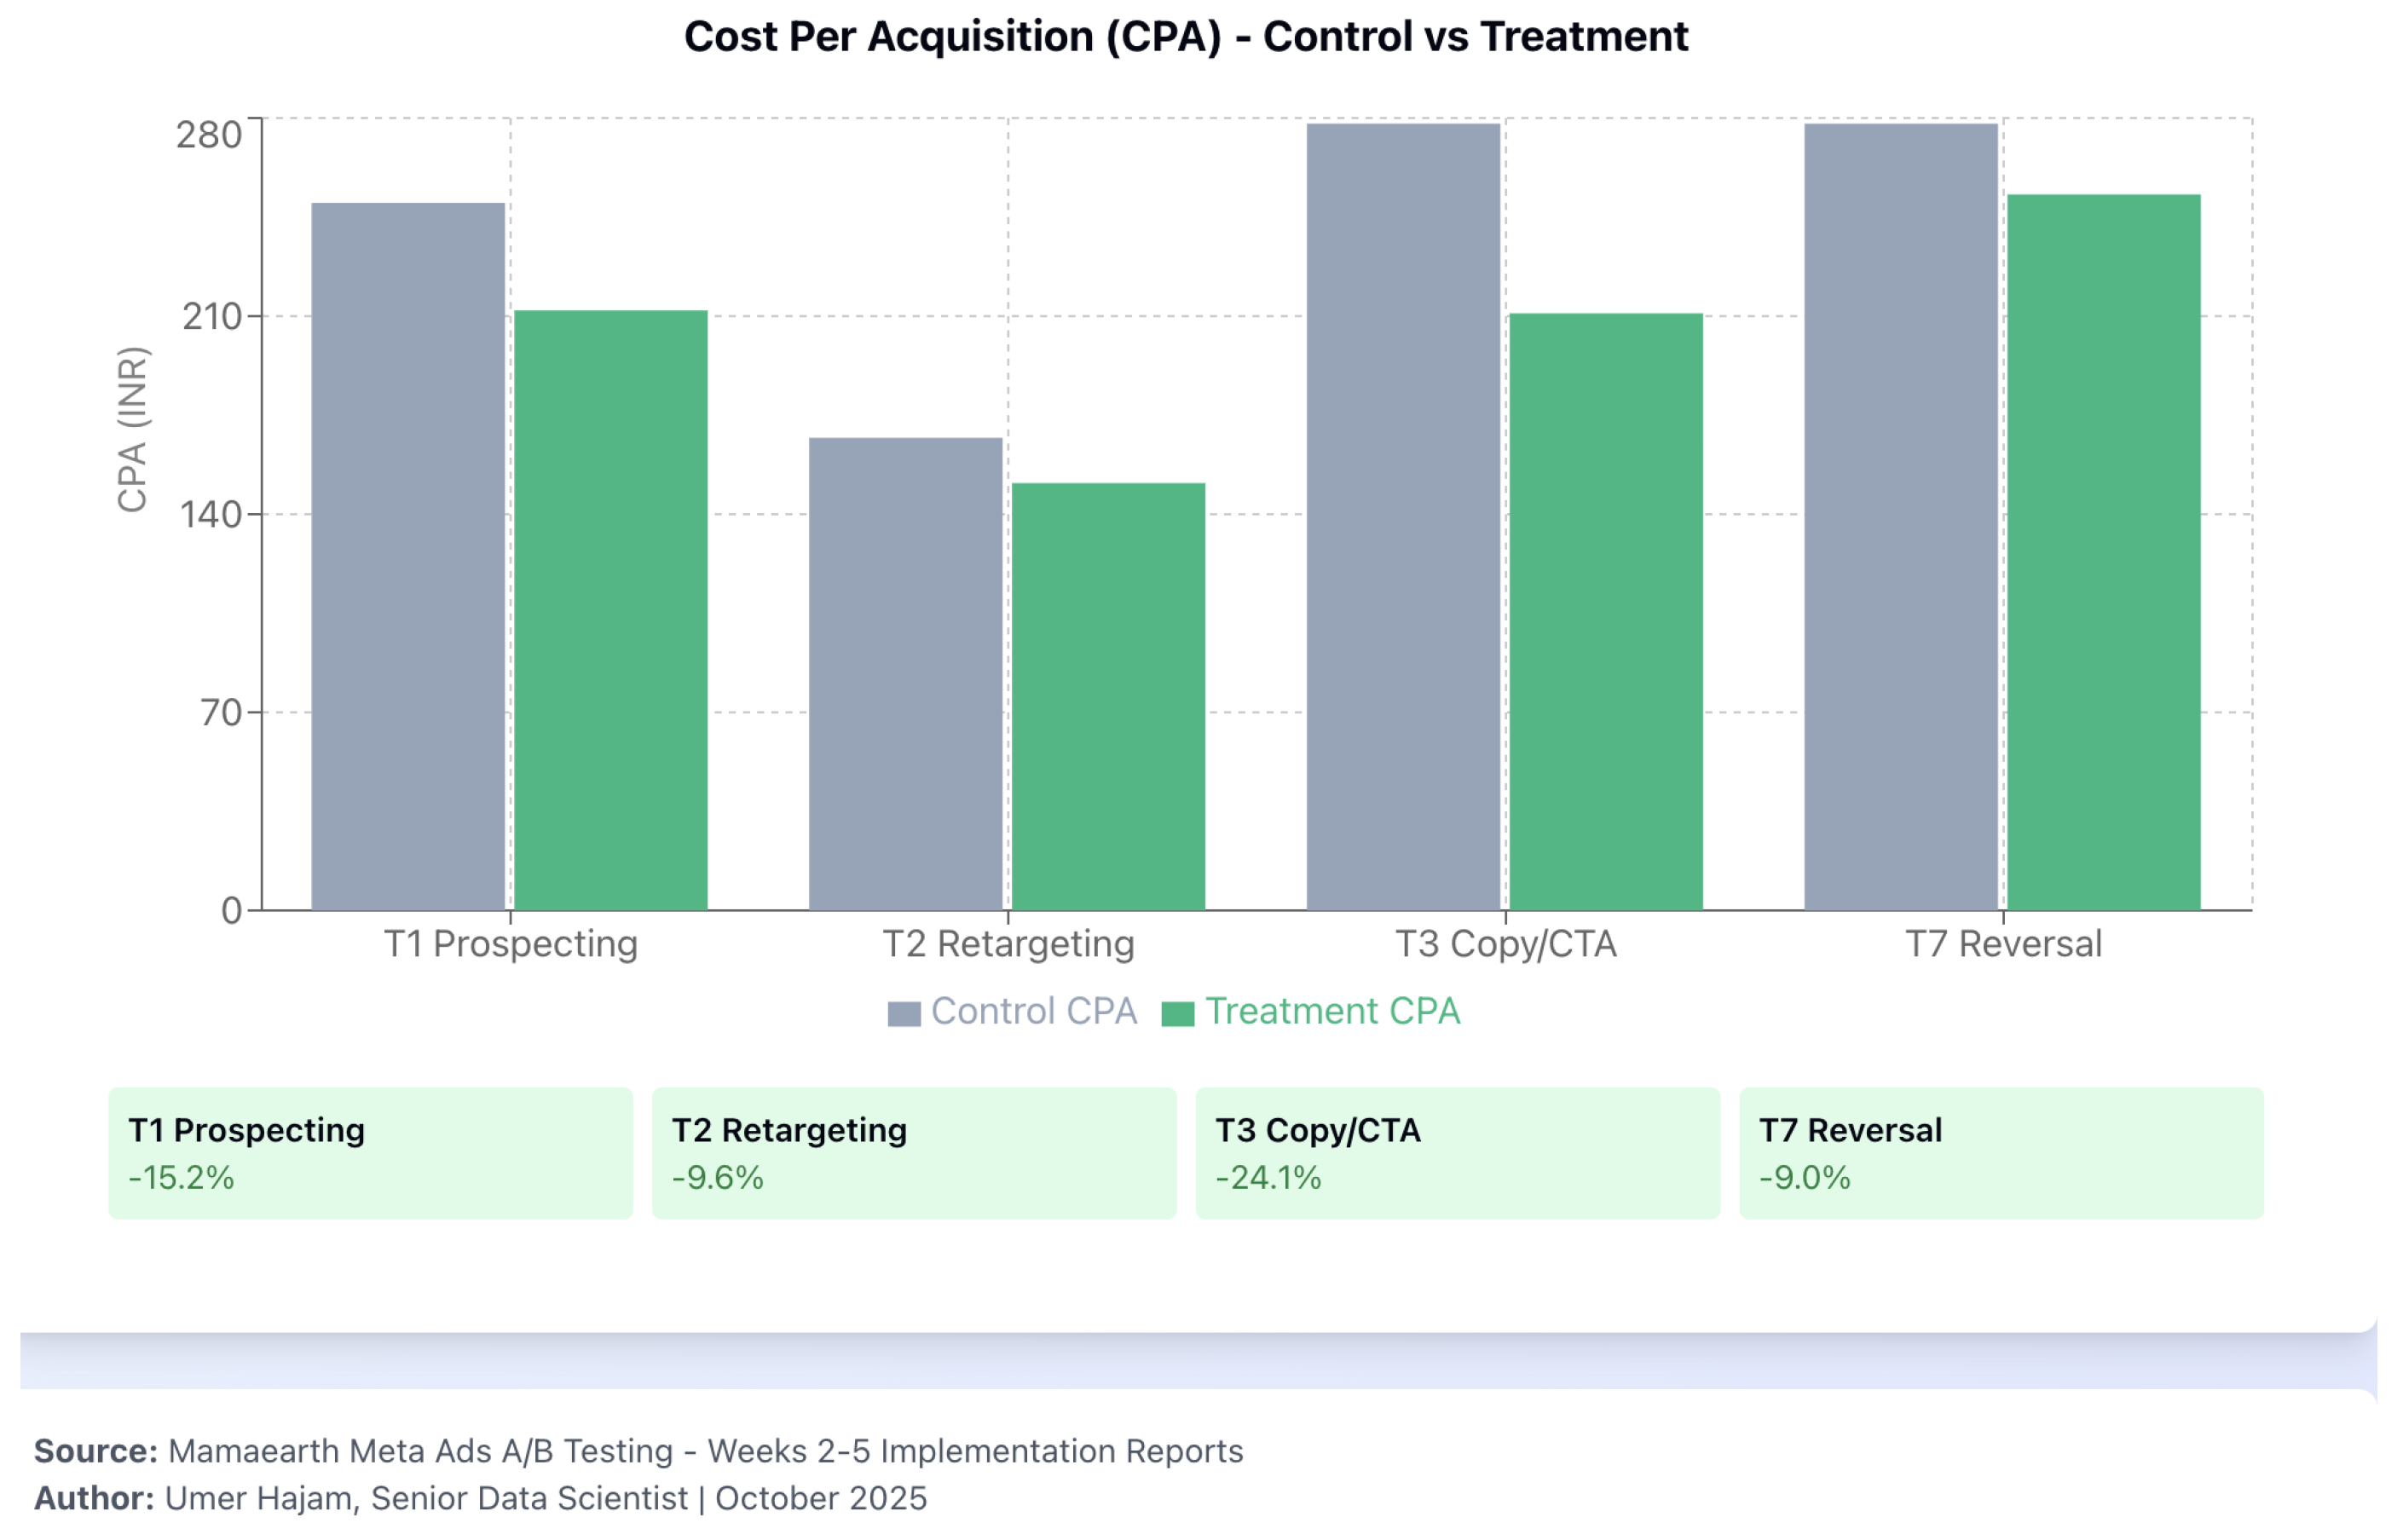
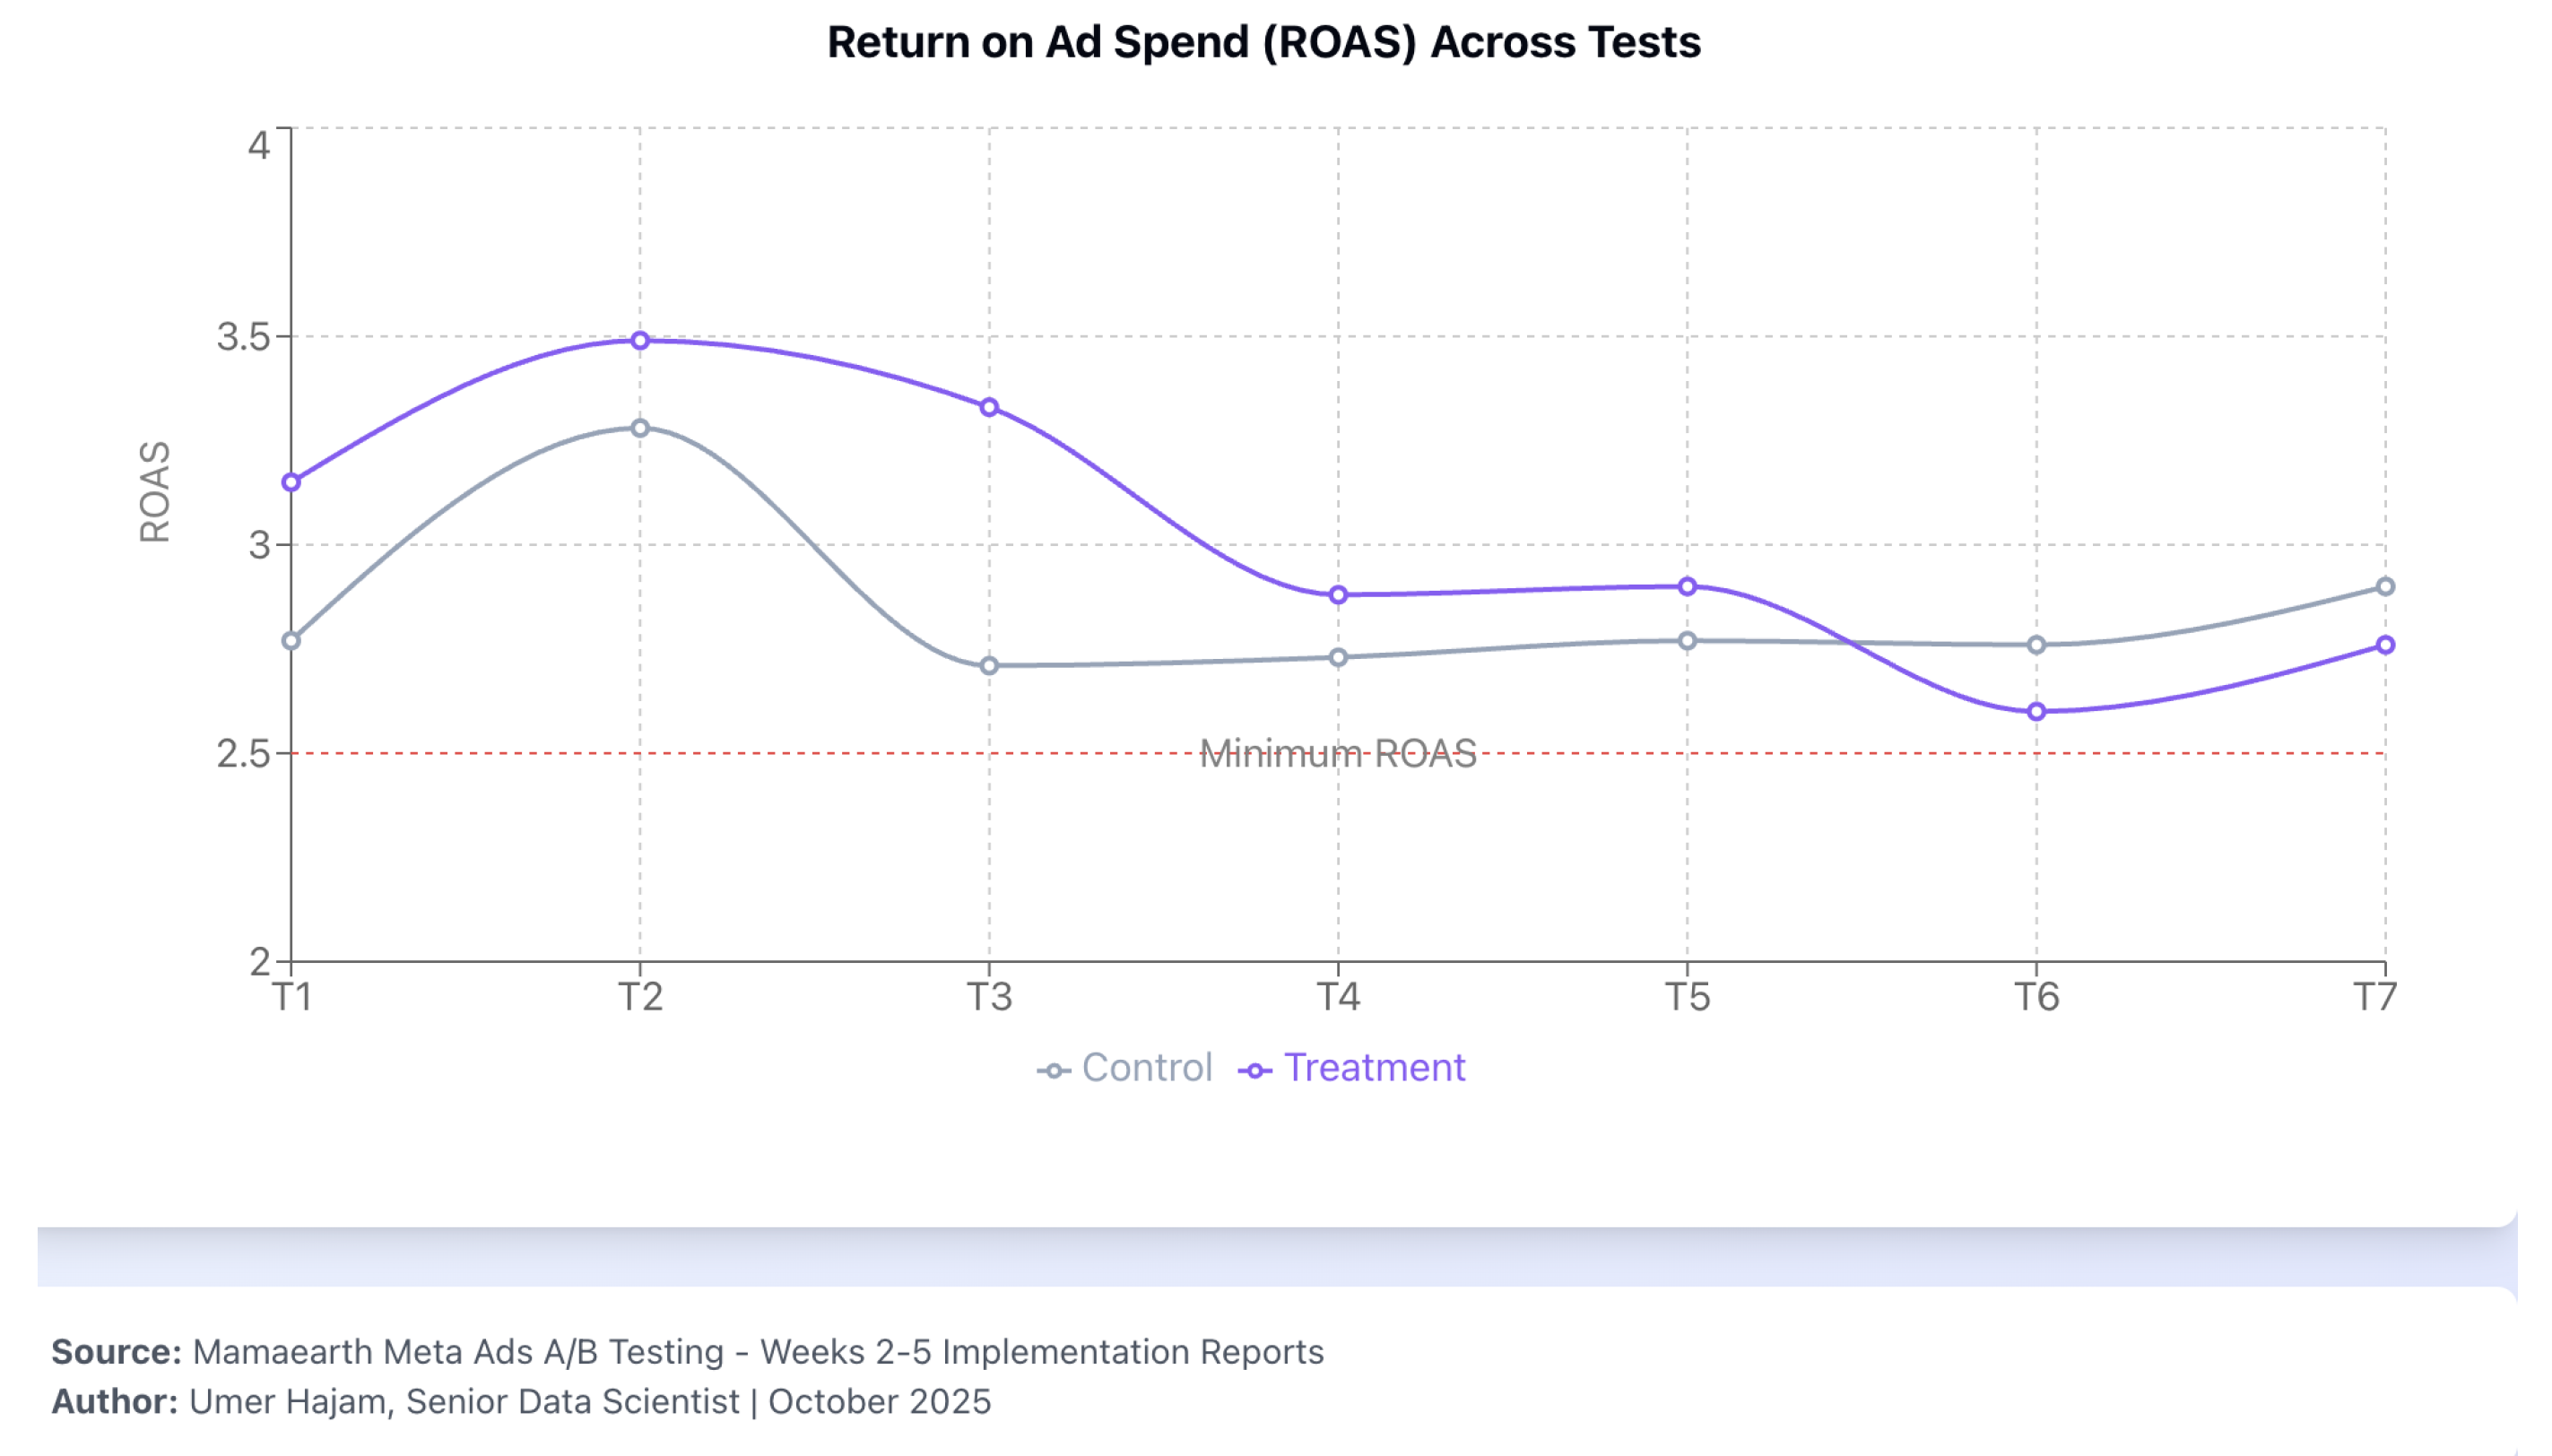
Figure 4.
ROAS across all tests with minimum-threshold reference line. Simulated data; guardrail G1 requires meeting or exceeding the reference line.
Figure 4.
ROAS across all tests with minimum-threshold reference line. Simulated data; guardrail G1 requires meeting or exceeding the reference line.
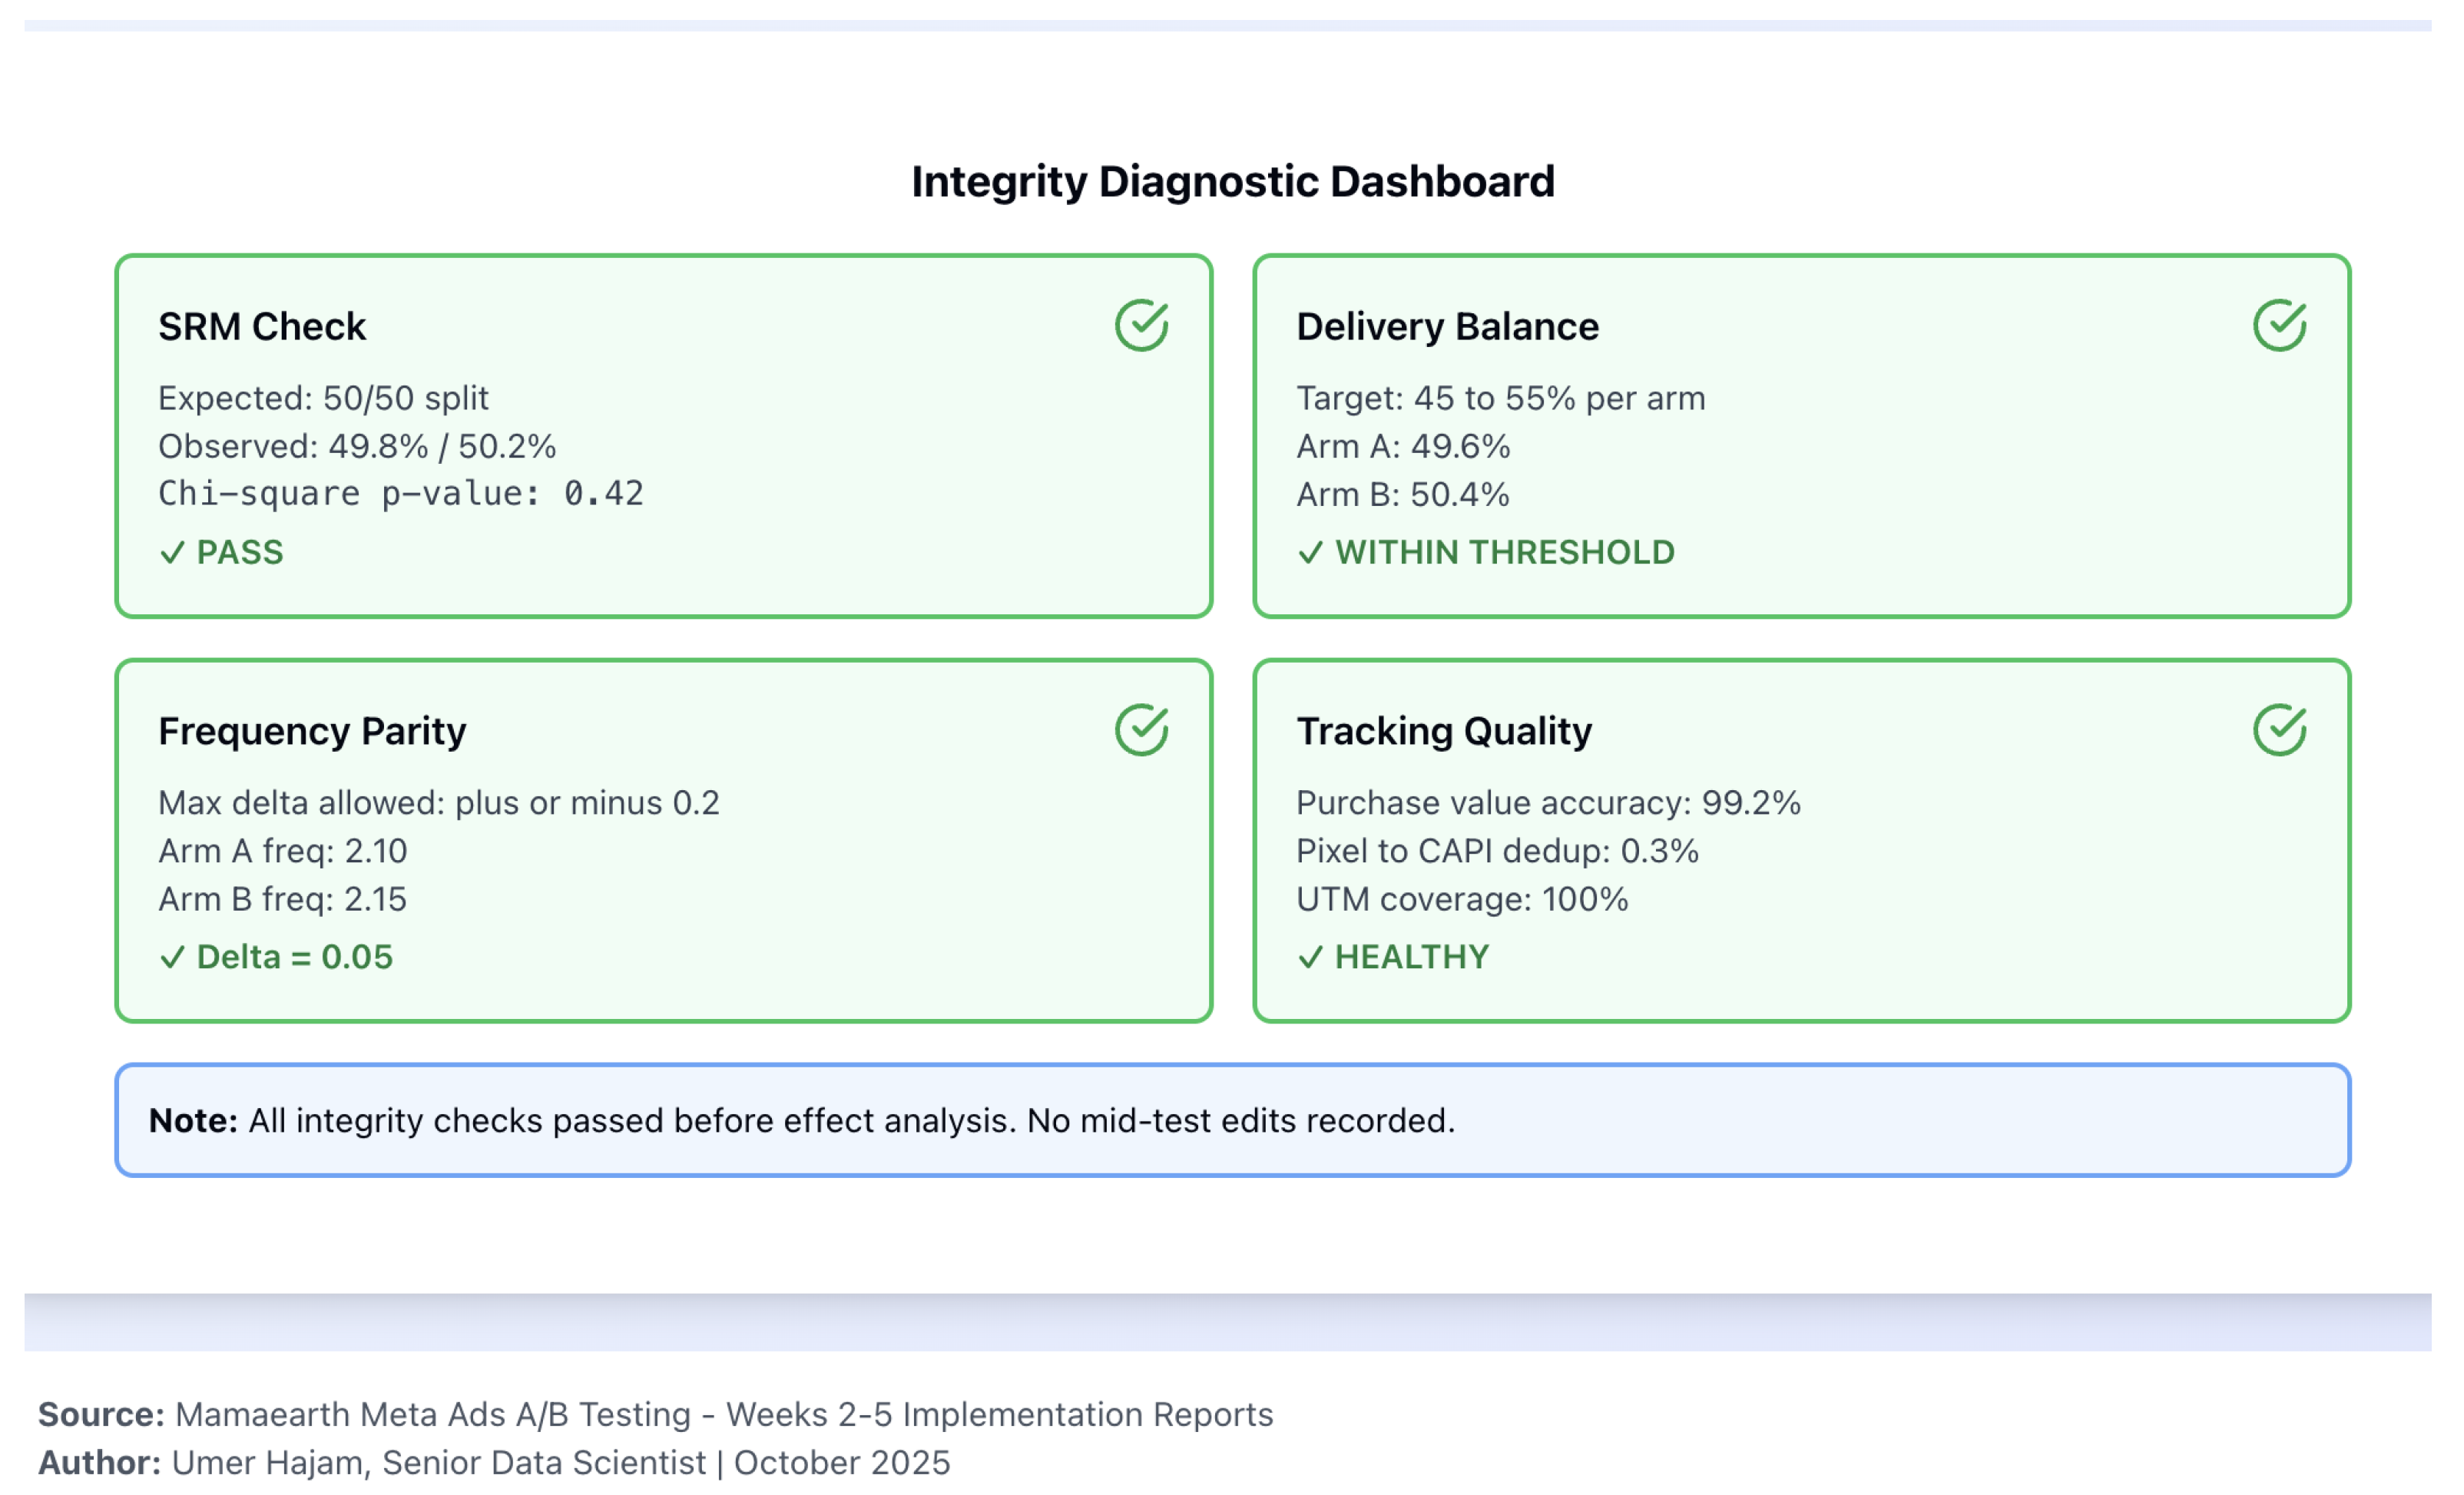
5.2. Diagnostics and Integrity
Effect computation follows integrity gates. In T1, SRM (pass); delivery 49.8%/50.2%; frequency . No mid-test edits in the incident log. Attribution windows are constant across arms; all amounts in INR.
Figure 5.
Integrity dashboard (T1 example). Simulated data: SRM () ; delivery 49.8%/50.2%; frequency ; tracking QA nominal.
Figure 5.
Integrity dashboard (T1 example). Simulated data: SRM () ; delivery 49.8%/50.2%; frequency ; tracking QA nominal.
5.3. Promotion Decisions (Hypothetical)
Under Section 4.6 and G1–G5, the framework would promote lifestyle for prospecting (T1) and Claim Offer (T3); retain product for retargeting (T2) on CPA; reject the harmful variant in T7; and defer T4–T6.

Table 2.
Summary of simulated A/B outcomes (CVR, uncertainty, economics, and hypothetical decisions). Simulated data. CVR diffs are absolute %-point differences; CPA are arm means.
Table 2.
Summary of simulated A/B outcomes (CVR, uncertainty, economics, and hypothetical decisions). Simulated data. CVR diffs are absolute %-point differences; CPA are arm means.
| Test | Lever | CVR A | CVR B | z | p | CPA A | CPA B | Hypothetical decision & rationale | |
|---|---|---|---|---|---|---|---|---|---|
| T1 | Prospecting creative | 4.00% | 4.46% | +0.46 pp | 2.62 | 0.009 | INR 250 | INR 212 | Promote B (lifestyle); CVR↑, CPA , ROAS guardrail met |
| T2 | Retargeting creative | 6.00% | 6.50% | +0.50 pp | 1.97 | 0.049 | INR 151 | INR 167 | Retain A (product); decision on CPA; A cheaper despite CVR favoring B |
| T3 | Copy/CTA | 4.00% | 5.46% | +1.46 pp | 6.92 | INR 278 | INR 211 | Promote B (Claim Offer); large CVR↑, CPA | |
| T4 | Placement/format | 4.00% | 4.27% | +0.27 pp | 1.31 | 0.19 | INR 278 | INR 252 | Inconclusive; continue or resize |
| T5 | Message match | 4.00% | 4.00% | +0.00 pp | 0.00 | 1.00 | INR 227 | INR 250 | Inconclusive; no CVR signal |
| T6 | Audience breadth | 4.00% | 4.20% | +0.20 pp | 1.05 | 0.29 | INR 250 | INR 264 | Inconclusive; widen sample or refine segments |
| T7 | Retargeting (reverse) | 4.50% | 3.80% | pp | INR 278 | INR 253 | Reject B (harmful CVR); do not promote despite nominal CPA drop |
6. Implementation Guide (Practitioner-Oriented)
6.1. Pre-Launch Checklist
Before activating any test, verify:
- Hypothesis preregistered (factor, direction, MDE, guardrails, decision rule).
- Sample-size calculation completed; duration ≥ 7 days (covers weekly cyclicality).
- Landing-page parity checked (headline, hero, CTA alignment); web vitals targets met.[8]
- Audience exclusions applied; no overlap between arms; learning-phase expectations documented.[10]
- Attribution window locked at 7C/1V across arms for both optimization and reporting.[7]
- Incident-log template prepared (settings snapshot, timestamps, remediation path).
6.2. Daily Monitoring Dashboard
Track the following to catch issues early:
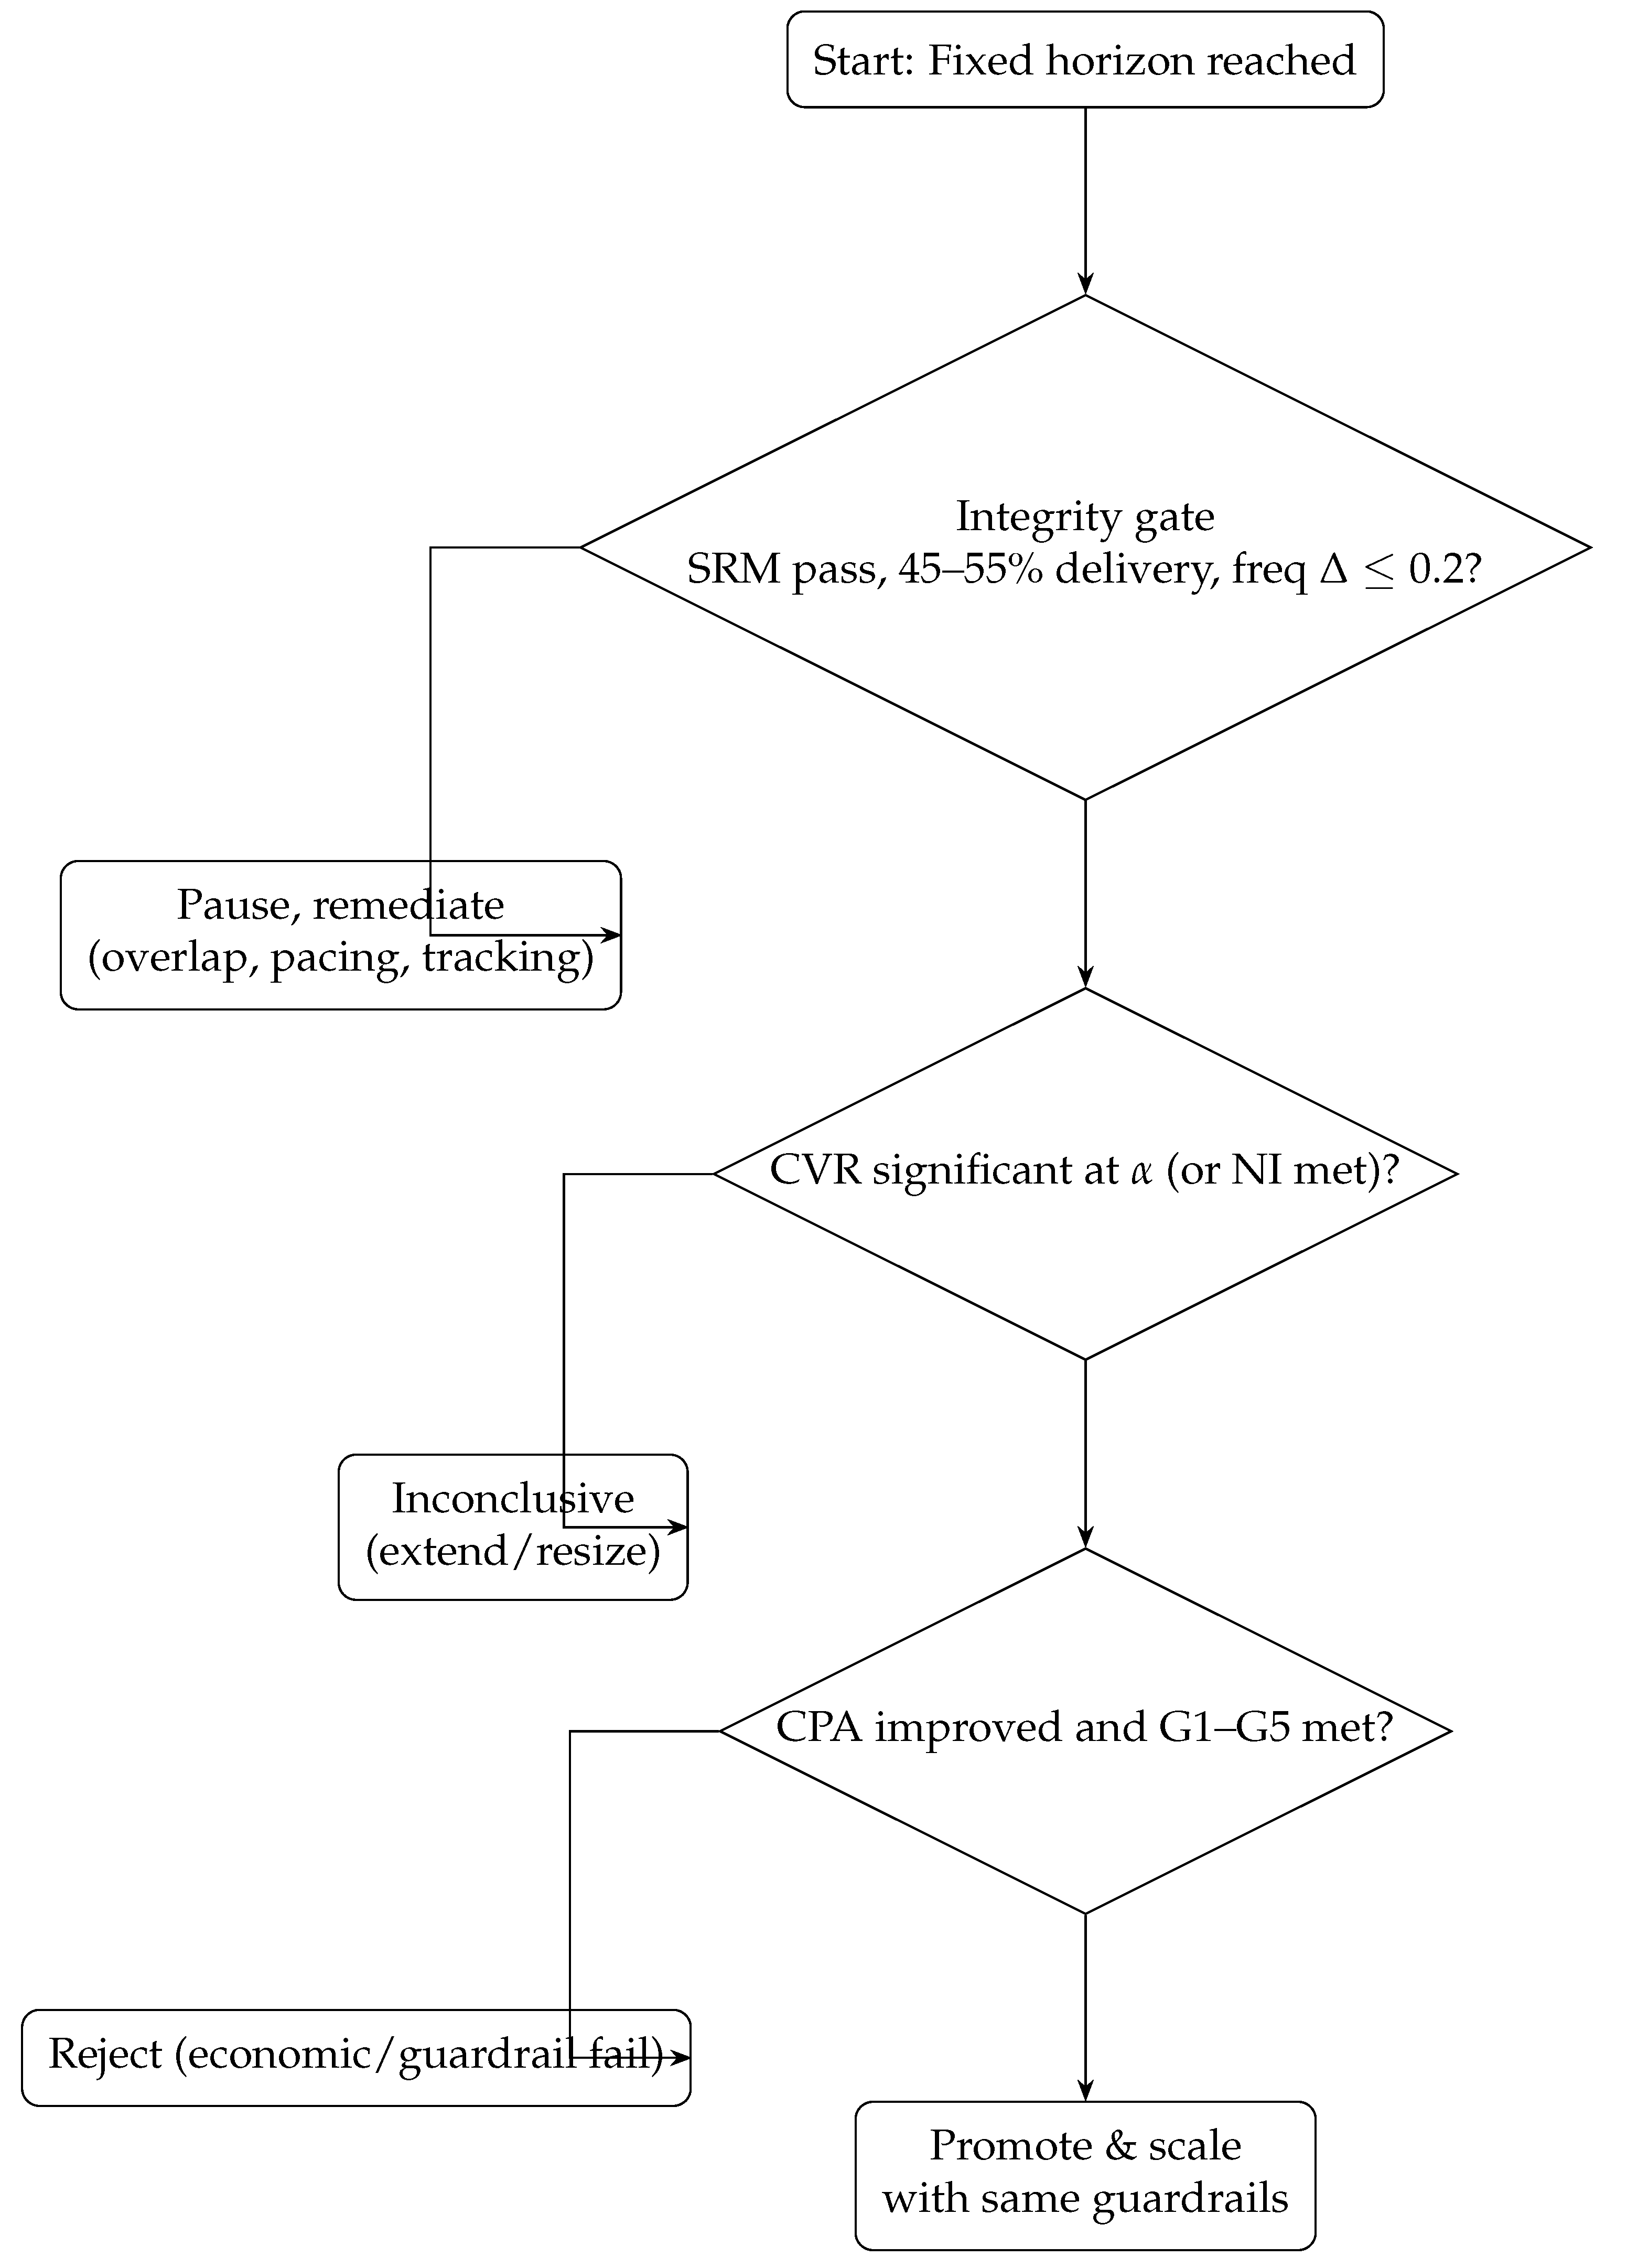
6.3. Decision Flowchart
Figure 6.
Promotion decision flow. Simulated framework logic; decision metric: CPA; inference metric: CVR; guardrails G1–G5 apply.
Figure 6.
Promotion decision flow. Simulated framework logic; decision metric: CPA; inference metric: CVR; guardrails G1–G5 apply.
6.4. Example Pre-Registration Template
| Field | Entry (example) |
| Test ID | T1_Prospecting_Creative_Nov2025 |
| Hypothesis | Lifestyle video increases CVR by ≥12% (relative) vs. product creative |
| Primary metric | CPA (INR); decision variable |
| Inference metric | Purchase CVR (Purchases/Link Clicks) |
| Attribution | 7-day click / 1-day view (fixed across arms) |
| Guardrails | G1: ROAS; G2: delivery 45–55%; G3: freq ; G4: LCP < 2.5 s, CLS < 0.1; G5: SRM pass |
| MDE (relative) | 12% (prospecting), 8% (retargeting) |
| Sample/arm | 114,327 clicks (from power curve at baseline CVR 1.0%, MDE 12%) |
| Duration | 10 days (covers weekdays/weekend) |
| Stop rule | Fixed horizon; no interim peeking (Pocock spending if forced) |
| Multiplicity | Holm–Bonferroni across concurrent tests; report BH-FDR as sensitivity |
| Incident protocol | Snapshot settings; pause on SRM/delivery imbalance; relaunch with fresh ID |
7. Discussion
- What this paper contributes.
A coherent, reproducible framework that integrates rigorous experimental design with business guardrails for Meta Ads, plus a simulated end-to-end demonstration of analysis and decisions.
- What this paper does not claim.
We do not assert real-world effectiveness of any creative, copy, audience, or placement; simulation cannot validate causal ordering nor guarantee profitability.
- Strengths.
(1) A single decision metric (CPA) tied to guardrails prevents “wins” that harm economics; (2) integrity checks (SRM, delivery/frequency, tracking QA) reduce false signals; (3) power/MDE planning aligns sample with decision intent; (4) CUPED offers sensitivity gains without changing the estimand.
- Threats not addressed.
(1) Creative fatigue: short-run tests may not predict long-run decay; rotation cadences are required. (2) Incrementality: platform conversions may capture demand rather than create it; geo-experiments or conversion-lift tests complement this framework.[11,12] (3) Seasonality: effects vary across peak periods; cadence-based revalidation is essential. (4) Cross-platform spillover: conversions may attribute to search while exposure occurred on Meta.
- Future work.
Validate the framework in production with staged rollouts; measure decision velocity (time-to-promotion) and outcome quality (post-scale CPA/ROASstability) vs. baseline; expand to contribution-margin guardrails and multi-platform settings.
8. Conclusion
We present a methodological framework for decision-grade experimentation on Meta Ads that combines statistical discipline (CPAas decision metric; consistent attribution; power/MDE; SRM; optional CUPED) with business guardrails (ROAS, delivery balance, frequency parity, landing health). A calibrated simulation shows how the framework would operate end-to-end. Practitioners should adapt and validate the template with live traffic before drawing substantive conclusions.
Funding
None.
Data & Code Availability
Synthetic dataset and analysis scripts will be provided as supplementary materials; no real-world data were used.
Conflicts of Interest
The author declares no conflicts of interest.
Appendix A. Evidence-Pack Checklist (Simulated)
SRM & Delivery. SRM p-values; arm shares; frequency deltas.
Attribution. 7C/1V, uniform across arms.
Windows. Concurrent runtime; no mid-test edits.
Artifacts. Synthetic dataset + seeded notebook for reproduction.
Captions. Every figure/table labeled “Simulated data” when applicable.
Appendix B. Simulation Data Generation (Pseudocode)
seed = 42
for test in T1..T7:
 set baseline_cvr by context (prospecting=0.040, retargeting=0.060)
 set rel_effect per scenario (e.g., T1 +11.5%, T3 +36.5%, T7 -15.6%)
 draw clicks per arm from planned sample size with small Poisson jitter
 purchases_A ~ Binomial(clicks_A, baseline_cvr)
 purchases_B ~ Binomial(clicks_B, baseline_cvr * (1 + rel_effect))
 spend_A, spend_B calibrated to produce target CPA and ROAS distributions
 compute metrics, SRM chi-square, integrity flags
Appendix C. Roles and Responsibilities (RACI Snapshot)
| Activity | Data Science | Media Buyer | Engineering/Analytics | Product/GM |
| Hypothesis & preregistration | R | C | C | A |
| Sample sizing & MDE | R | C | C | I |
| Split-test setup (Meta) | C | R | C | I |
| Tracking QA (Pixel+CAPI, GA4) | C | C | R | I |
| Monitoring (SRM, delivery) | R | R | C | I |
| Decision & rollout | C | R | C | A |
| Incident handling | R | R | R | I |
References
- Kohavi, R.; Tang, D.; Xu, Y. Trustworthy Online Controlled Experiments: A Practical Guide to A/B Testing; Cambridge University Press, 2020.
- Johari, R.; Pekelis, L.; Walsh, D. Always Valid Inference: Bringing Sequential Analysis to A/B Testing, 2017, [arXiv:stat.ME/1512.04922].
- Bakshy, E.; Eckles, D.; Bernstein, M.S. Designing and Deploying Online Field Experiments. In Proceedings of the Proceedings of the 23rd International Conference on World Wide Web, 2014.
- Miller, E. Seven Pitfalls to Avoid in A/B Testing, 2015. Includes Sample Ratio Mismatch (SRM) diagnostics.
- Vermeer, L. Sample Ratio Mismatch: Why and How to Detect It. https://lukasz.cepowski.com/srm, 2019. Blog post.
- Deng, A.; Xu, Y.; Kohavi, R.; Walker, T. Improving the Sensitivity of Online Controlled Experiments by Utilizing Pre-Experiment Data. In Proceedings of the Proceedings of the 19th ACM SIGKDD International Conference on Knowledge Discovery and Data Mining, 2013, pp. 1239–1247. [CrossRef]
- Meta. About Attribution in Meta Ads Reporting, 2025. Accessed 1 Nov 2025.
- Google. Web Vitals, 2025. Accessed 1 Nov 2025.
- Pocock, S.J. Group Sequential Methods in the Design and Analysis of Clinical Trials. Biometrika 1977, 64, 191–199.
- Meta. A/B Tests and Experiments on Meta Ads, 2025. Accessed 1 Nov 2025.
- Gordon, B.R.; Zettelmeyer, F.; Bhargava, N.; Chapsky, D. A Comparison of Approaches to Advertising Measurement: Evidence from Big Field Experiments at Facebook. Marketing Science 2019, 38, 193–225.
- Lewis, R.A.; Rao, J.M. The Unfavorable Economics of Measuring the Returns to Advertising. Quarterly Journal of Economics 2015, 130, 1941–1973.
- Meta. Creative Best Practices for Mobile and Feed Environments, 2025. Accessed 1 Nov 2025.
- Meta. About Lookalike Audiences, 2025. Accessed 1 Nov 2025.
- Benjamini, Y.; Hochberg, Y. Controlling the False Discovery Rate: A Practical and Powerful Approach to Multiple Testing. Journal of the Royal Statistical Society: Series B 1995, 57, 289–300.
- Holm, S. A Simple Sequentially Rejective Multiple Test Procedure. Scandinavian Journal of Statistics 1979, 6, 65–70.
- NIST/SEMATECH e-Handbook of Statistical Methods: Two-Proportion Tests. https://www.itl.nist.gov/div898/handbook/prc/section3/prc33.htm. Accessed 2025-10-15.
- Brown, L.D.; Cai, T.T.; DasGupta, A. Interval Estimation for a Binomial Proportion. Statistical Science 2001, 16, 101–133.
- Analytics-Toolkit.com. Sample Ratio Mismatch (SRM) in A/B Testing. https://blog.analytics-toolkit.com/, 2019.
- Meta Developers. Deduplicate Pixel and Conversions API Events. https://developers.facebook.com/docs/marketing-api/conversions-api/deduplicate-pixel-and-server-events/, 2025. Accessed 2025-10-15.
- Meta Business Help Center. About Deduplication for Pixel and Conversions API. https://www.facebook.com/business/help/823677331451951, 2025. Accessed 2025-10-15.
- Google Support. GA4 URL Builders (UTM Parameters). https://support.google.com/analytics/answer/10917952, 2025. Accessed 2025-10-15.
- Fedorovicius, J. Guide to UTM Parameters in Google Analytics 4. https://www.analyticsmania.com/post/utm-parameters-in-google-analytics-4/, 2025. Accessed 2025-10-15.
Disclaimer/Publisher’s Note: The statements, opinions and data contained in all publications are solely those of the individual author(s) and contributor(s) and not of MDPI and/or the editor(s). MDPI and/or the editor(s) disclaim responsibility for any injury to people or property resulting from any ideas, methods, instructions or products referred to in the content. |
© 2026 by the authors. Licensee MDPI, Basel, Switzerland. This article is an open access article distributed under the terms and conditions of the Creative Commons Attribution (CC BY) license (http://creativecommons.org/licenses/by/4.0/).
Copyright: This open access article is published under a Creative Commons CC BY 4.0 license, which permit the free download, distribution, and reuse, provided that the author and preprint are cited in any reuse.


