
Submitted:
03 January 2026
Posted:
04 January 2026
You are already at the latest version
Abstract
This paper offers a comprehensive overview of academic research on sentiment analysis in urban built environments from 1999 to 2024. Based on data from the scientific database Scopus and drawing on bibliometric tools like Bibliometrix (R) and VOSviewer for performance analysis and scientific mapping, it identifies publication trends, key influential works, leading authors and institutions, funding sources, and thematic clusters. The final dataset comprises 871 English‐language documents authored by 2,068 researchers across 307 sources in 70 countries, with a total of 5,642 citations worldwide. The academic production increased after 2009, peaking in 2024. Keyword and network analyses highlight central themes (and methodological approaches?) to the study of sentiment analysis in urban built environments. These include social media platforms like Twitter/X/X, machine learning, Natural Language Processing, smart cities, and tourism. China, the USA, and India lead in publication output. Over the last twenty-five years, key publication outlets include the International Journal of Environmental Research and Public Health, Cities, and Lecture Notes in Computer Science, while the National Natural Science Foundation of China is the most common funder. The paper discusses how sentiment analysis can support urban planning and public health by linking environmental features to well-being and explores methodological emerging trends like deep learning, multimodal approaches, and context-aware models. Overall, it maps the intellectual landscape of the field and argues for future directions for human-centred, data-driven urban decision-making.
Keywords:
sentiment analysis
; urban environment
; performance analysis
; science mapping
1. Introduction
Urban environments have long been recognized as key determinants of human health and well-being. While early research primarily highlighted issues such as pollution, disease, and overpopulation, there is now increasing evidence of both positive and negative effects stemming from diverse aspects of the urban environment [1]. Urban planners and public health professionals have raised concerns about how urban features, such as the uneven presence of, and access to, blue spaces, green spaces and other urban amenities air quality, impact residents’ physical, social, and mental well-being [2].
Although overall quality of life has improved worldwide, mental health issues have escalated, often attributed to the stressors of urban lifestyles. Several common mental disorders seem to be triggered by the high stress levels linked to urban living and rhythms [3]. Rapid urbanization has significantly affected mental health globally, with city residents facing higher risks of depression, generalized anxiety disorders, addiction, mood disorders, and psychoses [4,5]. Notably, one study found that urban residents have a 38% higher risk of developing mental disorders compared to rural populations, including39% higher for mood disorders and 21% higher for anxiety disorders [5].
Social stressors, isolation, and high population density are independent health factors that happen more often in cities—a concept often called the “social stress hypothesis.” When compounded by individual risk factors, such as genetic predisposition, socio-economic status, or migration background), these urban stressors can significantly impact mental health. The risk to mental health is further worsened by major socioeconomic gaps within small spaces, poor housing, and exposure to violence [3].
There is broad agreement in the literature that psychotic disorders are more prevalent in urban areas than in non-urban areas [6]. This trend is partly due to reduced access to nature and increasingly sedentary lifestyles [7]. Strong evidence indicates that urban design and landscape architecture can significantly improve human health and well-being [3]. For instance, urban studies have explored the regenerative and restorative effects of human-nature connection, such as community gardens, urban parks, and water bodies within urban built environments [8,9]. Living in urban areas with natural features such as parks, gardens, water, trees, and birdlife is linked to better mental health and reduced rates of chronic mental illness [10,11,12,13].
The dynamic nature of cities, viewed as complex systems with many interacting factors, presents significant challenges for urban analysis to support planning. With the growth of large-scale, user-generated datasets, social media platforms (e.g., Twitter/X) now offer the potential for detailed spatial and temporal analysis, especially concerning people’s emotions and sentiments [14,15]. The simultaneous transformation of urban spaces and society’s digitization has enhanced our understanding of how individual well-being is produced and mediated by surrounding urban built environments [16,17]. Digital technologies have enabled new ways of exercising freedoms of association, assembly, and expression, while also creating new methods to restrict them [18,19,20,21,22]. This duality makes well-being an ideal case for sentiment analysis. Sentiment analysis, sometimes mistakenly called opinion mining, aims to automatically classify the sentiment expressed in text [23]. While opinion mining focuses on extracting and analyzing opinions about entities, sentiment analysis seeks to identify sentiments, determine their polarity, and categorize them [24].
Although studying human sentiments and emotions has been ongoing for decades, the term “sentiment analysis” and its computational application gained prominence in the early 2000s with the rise of automated emotion assessment methods like opinion mining, subjectivity detection, and emotion analysis [24,25]. Early sentiment analysis relied heavily on sentiment lexicons, manually created lists of words labeled with positive or negative polarity [26], but has since shifted toward machine learning and hybrid approaches [27]. The rapid growth of sentiment analysis coincides with the rise of Web 2.0 and the increasing availability of online, user-generated content [23]. As digitally-mediated interactions on social media platforms shows no signs of abating, sentiment analysis has opened new ways to understand the production and mediation of urban spatialities in the twenty-first-century city [28]. By evaluating the emotional impact of urban environmental features, sentiment analysis offers valuable insights into the connection between city life and well-being, which is increasingly important for urban planners and public health officials.
Against this background, the present study aims to provide a comprehensive bibliometric and thematic assessment of scholarly research on sentiment analysis applied to urban built environments from 1999 to 2024. Specifically, it seeks to systematically map the field’s intellectual structure and evolution by identifying publication trends, highly influential articles, leading authors and research institutions, major funding bodies, and the geographical distribution of scientific output. In addition, the study explores the dominant and emerging thematic areas, methodological trajectories, and interdisciplinary linkages that have shaped research in this domain, with the objective of identifying knowledge gaps and outlining promising directions for future research on sentiment-driven analyses of urban environments.
2. Materials and Methods
Bibliometric analysis techniques are generally divided into two categories: (1) performance analysis and (2) scientific mapping. Performance analysis assesses the contributions of research components (data and methods for instance) to a specific field. Common indicators include the number of publications and citations per year or per research component. While publication counts reflect productivity, citations counts reflect scholarly impact and influence [29,30]. Additional composite measures, such as citations per publication, h-index, and g-index, combine citation data and productivity to evaluate research performance more comprehensively, so the argument goes. For example, an h-index of 5 means the author has published at least five articles, each cited at least five citations. The g-index is based on the distribution of citations across publications; a g-index of 5 means the author has published at least five articles collectively cited at least 25 times (g-2). While primarily descriptive, performance analysis unpacks the relative significance of different components within a research field.
Scientific mapping, on the other hand, explores the intellectual structure of a research field by examining relationships among its elements [31,32,33]. This includes citation analysis, co-citation analysis, bibliographic coupling, co-word analysis, and co-authorship analysis. When paired with network analysis, these techniques effectively reveal the bibliometric and intellectual structure of a research area [30,34,35].
For instance, a bibliometric study by Niu and Silva in 2020 analyzed the use of crowdsourcing data in urban activities, focusing on themes, publication sources, most cited references, authors, and keywords. They organized their findings into three sections, one of which involves sentiment analysis [28]. Bibliometric methods have become widely used to analyse scientific output across various research disciplines [36].
2.1. Data Source
This paper is based on the Scopus electronic database (https://www.scopus.com/) (powered by Elsevier) as of December, 2024, as it offers broader research coverage compared to other databases (e.g., Google Scholar and Web of Science) [37]. The analytical methodological approaches were adopted from previous studies conducted by [30] and [36].
2.2. Research Strategy
The Scopus database was used to gather the desired publications by applying a query with the following keywords: (“sentiment analysis” AND urban OR city OR “built environment”). The Boolean operator ‘AND’ was employed to retrieve research documents that connect sentiment analysis to the built, urban, or city environments. The search in Scopus was open to all scientific disciplines. Figure 1 shows the flowchart outlining the document extraction process.
This search yielded a database of 1,091 documents, which was then limited to those published in English, with final publication dates after 2000, and categorized as journal articles, conference papers, or book chapters. Consequently, 871 documents were retained. The decision to use only Scopus was based on its status as the largest database of peer-reviewed literature and its widespread use for compiling datasets for reviews. The Elsevier–Scopus database is also regarded as more comprehensive in representing research within social sciences [38]. Furthermore, there has been an increasing overlap between Scopus and Thomson Reuters Web of Science [39].
2.3. Statistical Analysis
The bibliometrix library (https://CRAN.R-project.org/package=bibliometrix) in R software, developed by Aria and Cuccurullo (2017), was used to analyze the data, as it enables performance analyses of groups of components such as documents, keywords, authors, journals, and countries/territories, and to assess their impact within the research domain [39].
VOSviewer, the other software used, combines high-quality graphics with simplicity, flexibility, and responsiveness to user needs. However, it requires repeated analyses because it cannot combine data from different sources. Bibliometrix is more robust and versatile, allowing greater customization by users and performing analyses with files from multiple databases. It offers more advanced analysis options, although it has a steeper learning curve that includes programming [40].
Descriptive statistics were employed to determine frequency, percentage, sum, mean, h-index, and g-index. The former is generally less sensitive to extremely highly cited works than the latter. This indicates that the h-index may not be as influenced by a single highly cited publication as the g-index. Therefore, the h-index is often regarded as a more conservative indicator of academic impact, while the g-index may better represent the distribution of impact across a researcher’s publications. For scientific mapping, VOSviewer version 1.6.19 was also utilized, enabling social network analysis. It examines co-authorship, co-occurrence, citations, bibliographic coupling, and co-citation links.
3. Results
3.1. Document Characteristics, Trends, and Citations
From the Scopus electronic database, 871 documents published between 1999 and 2024 related to sentiment analysis and the built, urban, or city environment were identified (Figure 2). These include 450 (51.66%) journal articles, 378 (43.39%) conference papers, and 35 (4.02%) book chapters as of December 31, 2024. These documents were authored by 2,068 authors and published in 307 sources (such as journals and books) from 70 countries. The documents received 142 local citations and 5,642 global citations, with an average of 7.75 citations per document. The number of contributors was 2,068 authors, averaging approximately 2.84 co-authors per document, with a collaboration index of 3.4 (calculated as the total number of authors of multiauthor papers divided by the total number of multiauthor papers).
The earliest published document on sentiment related to built, urban, or city environments was published in 1999 by Busteed: Little Islands of Erin: Irish Settlement and Identity in Mid-Nineteenth-Century Manchester. The author analyzed sentiment during Irish colonization in British cities in the 19th century, focusing on popular Irish opinions expressed through ballads (songs) that circulated widely in cities [41]. However, there was a nearly ten-year gap, and the first work on sentiment analysis and its relation to the environment after 2000 appeared in 2009 (Figure 2). Afterwards, interest in the topic grew over the years (slope of 12.0; Figure 2), with a steady rise in publications (R² = 0.908), except in 2017 when there was a decline. From 2009 to 2023, the average annual publication rate was 47 documents. In 2020, 92 documents were published, followed by 137 in 2021 (+48.9% compared to 2020), then 142 in 2022, 140 in 2023, and 176 in 2024. Based on this recent growth pattern, it is likely that this trend will continue over the next decade. There was also a noticeable decrease in the average number of citations (slope of -0.04), especially from 2019 onward, but with a high increase in 2024, returning to the values of 2019.
3.1.1. Most Influential Publications on Sentiment Analysis in Urban Built Environment
Of the 871 documents in the database on sentiment analysis related to urban built environments, the ten most globally cited articles (TGC) are listed in Table 1. The total number of local and global citations differs—142 and 5,642 respectively—because local citations are counted within the dataset of eligible documents, while global citations include all documents indexed in the Scopus electronic database. The total normalized citations (Normalised TC) of a document are calculated by dividing its actual citation count by the expected citation rate for documents published in the same year.
The total global citations (TGC) in the Top 10 range from 90 to 170. The highest-ranked article is “What makes local governments’ online communications successful? Insights from a multi-method analysis of Facebook” by Sara Hofmann et al. (2013), with 170 citations (see Table 1). However, from a temporal perspective, more recent articles tend to have a higher average number of citations per year (e.g., T = 2, 3, 5, 7, and 8), which could make them more prominent in the future. In this context, three very recent articles stand out: “Social Media Insights Into US Mental Health During the COVID-19 Pandemic: Longitudinal Analysis of Twitter Data” and “COVID-19 Sensing: Negative Sentiment Analysis on Social Media in China via BERT Model,” both from 2020, with 21.20 (106 total) and 20.20 (101 total) citations per year, respectively; and “COVID-19 open source data sets: a comprehensive survey” from 2021, with 27.5 citations per year (110 total). The latter also has the highest normalized TC at 17.9.
The 10 most locally cited references, out of 21,676 cited references across 728 documents, are listed in Table 2. The total local citations for these references reach 22,808. The total citations (TC) within the Top 10 range from 8 to 21. The highest-ranked article is ‘Opinion mining and sentiment analysis’ by Pang and Lee (2008), with 21 citations. Unlike the globally most cited documents, in this case, the most cited also has the best citation per year ratio (1.24).
3.1.2. Author Analysis
Table 3 lists the ten most productive and influential authors locally. Authors were ranked based on their g-index, h-index, total citations (TC), number of publications (NP), and the year they started activity (PY_start) in the thematic area and period under review. According to these indicators, Manar Alkhatib is considered the most productive and influential author, with a total of seven publications and a g-index of six (meaning he published at least six articles that received at least 36 citations collectively). He was followed by Yan Wang, who has a g-index of four and four publications.
Examining the authors’ (and co-authors’) affiliations, 70 different countries were identified using Bibliometrix. The results show that China is the most productive country in sentiment analysis related to the built, urban, or city environment, with 391 articles, followed by the USA with 337, India with 174, and Indonesia with 125, among others (Figure 3). This could be correlated with the country’s relatively open data policies and extensive use of social media platforms [61,62].
Additionally, 58 countries with the most productive and cited authors were recognized (Table 4). The data indicate that China leads in productivity, with 80 articles (11%), followed by the USA with 55 (7.6%), India with 26 (3.6%), and the United Kingdom with 15 (2.1%). Moreover, the countries with the highest number of publications involving authors from different countries (MCP = Multiple Country Publications) are China (n = 23), the USA (n = 16), and the United Kingdom (n = 7), as shown in Table 4.
3.1.3. Influential Sources Publishing on Sentiment Analysis …
The documents on sentiment analysis related to urban, built, or city environments were published across 307 different sources (Table 5). Among these, the ten most prominent sources published 120 articles, representing 16% of the total sampled articles (120 out of 728). The source with the greatest local impact was the International Journal of Environmental Research and Public Health, which published 15 documents, with a g-index of 12 and a total of 147 citations (Table 6). This was followed by Cities (10), Lecture Notes in Computer Science (10), Sustainability (7), and Sustainable Cities and Society (6), ordered by citation counts according to the g-index.
The sources with the highest number of publications are Lecture Notes in Computer Science (44), Communications in Computer and Information Science (24), The ACM International Conference Proceedings Series (23), Lecture Notes in Networks and Systems (21), and Advances in Intelligent Systems and Computing. While the journals with the highest number of publications mainly belong to the field of computer science, they are not necessarily the most highly cited. In fact, the fields of environmental health, public health, planning, and urban policy have the greatest influence on this topic.
3.1.4. Funding and Authorship Affiliation Funds
A total of 159 funders and 160 institutions were identified from 2009 to 2024. The National Natural Science Foundation of China was the leading funder with 42 documents (Table 6).
Among the top institutions, the Chinese Academy of Sciences in China had nine publications (1.96%), followed by the British University in Dubai in the United Arab Emirates with eight publications (1.74%) (Table 7).
3.2. Network analysis
In the case of co-authorship links, the Links attribute indicates the number of co-authorship connections between a specific component and other components, while the Total Link Strength attribute shows the overall strength of these co-authorship links [63]. For co-occurrence links (i.e., co-words), each line represents the relationship between two keywords—when they appear together in the same document. The size of the nodes reflects the frequency of the keywords—higher frequency results in larger nodes. Clusters, identified by colors, are automatically generated by the VOSViewer software and distinguish different networks from one another [64]. The 871 documents analyzed include 1,615 different keywords selected by the authors. Figure 5 displays the 52 keywords with a frequency greater than 5. The closer the keywords, the more collaboration exists. Overall, eight keyword clusters are visualized, with 341 links (L) and a Total Link Strength (TLS) of 1,059. The main keywords in each cluster are machine learning (red cluster / smart city), Twitter/COVID-19 (health - green cluster), text mining (yellow), sentiment analysis/ tourism (dark blue cluster), deep learning (purple cluster), support vector machine (light blue), NLP (natural language processing) (orange), and social network (brown). The keyword sentiment analysis appears 356 times, followed by Twitter with 89 mentions and social media with 88.
Red Cluster shows connections between machine learning, natural language processing, smart cities, and big data. This cluster highlights the frequent use of big data and machine learning techniques in smart city research. These studies are essential for making better decisions and developing more efficient solutions to urban challenges. Green Cluster displays links between terms such as Twitter, social media and the COVID-19pandemic. The COVID-19 pandemic influenced society, as seen in user interactions on social media, emphasizing the importance of sentiment analysis using Twitter data to understand people’s emotions and opinions during this time. Blue Cluster demonstrates links between sentiment analysis, topic modeling, social media analysis, TripAdvisor, and tourism. TripAdvisor has become more popular in sentiment analysis because of the increasing amount of data it provides, like user reviews and opinions (restaurants?). This data is semi-structured, making it easier to extract relevant information for the tourism industry, such as market opportunities. Additionally, there are clear connections in purple between deep learning, data mining, and sentiment classification. These links show the recent use of deep learning techniques in sentiment analysis, thanks to their effectiveness in solving complex problems in natural language processing.
Figure 6 shows the trends in research topics over time. It emphasizes the important role of social media in sentiment analysis in recent years, with Twitter being especially prominent, used in studies related to urban planning (2017 to 2020) and smart cities (2018 to 2021). More recently, TripAdvisor data has been included in tourism-related research because user reviews provide detailed and subjective insights about locations [65]. Indeed, with the increase of reviews on online travel platforms and their impact on consumers, many researchers have examined the connection between online travel reviews and consumer behavior, as well as how these reviews influence consumer decisions and choices towards particular places? [66].
Many developments have taken place over the last eight years (2016-2024), coinciding with the rise of big data. The keywords big data, text mining, and social media reached their peak in 2019, while machine learning, Twitter, and sentiment analysis peaked in 2021. Urban planning has become less prominent in recent years, with the focus shifting to tourism-related issues, which may suggest a lack of recent urban planning studies using newer techniques.
Based on data from Scopus analyzed with VosViewer, the identified documents originated from institutions in 85 different countries. Figure 7 shows 33 countries with circles, out of 36 that have more than five publications. The larger the collaboration, the closer the countries are to each other. Overall, six country clusters are visible, with 127 connections (L) and a Total Link Strength (TLS) of 226. The country with the most publications was the USA (123), followed by China (109), India (65), Italy (38), and the United Kingdom (33). Notably, Red Cluster, representing an Asian axis, stands out. The Green Cluster (countries and Brazil) and the Yellow Cluster (Muslim countries) are less productive but equally well-connected.
4. Discussion
This study provides a bibliometric analysis of documents on sentiment analysis related to the urban, built, and city environment indexed in the Scopus electronic database over the past 25 years. Two complementary bibliometric methods were used – performance analysis and scientific mapping – to identify the most influential authors and the most productive countries, sources, institutions, and funding agencies. The results show consistent growth in urban sentiment analysis research over the past decade, with academic production expected to continue increasing.
Annual citations rose significantly from 2010, then declined starting in 2019; however, the latest totals for recent articles, particularly normalized citation counts, indicate this decline may be reversing. The most prolific author on this topic is currently Manar Alkhatib, an assistant professor of artificial intelligence at The British University in Dubai (BUiD), while a few years ago, the leading author was Cambria Erik from Nanyang Technological University, Singapore [36]. Major publication venues include the International Journal of Environmental Research and Public Health, Cities, and Lecture Notes in Computer Science (LNCS), which features subseries like Lecture Notes in Artificial Intelligence (LNAI) and Lecture Notes in Bioinformatics (LNBI). China, the USA, and India produce the largest number of papers and citations, dominating both single-country publications and multi-country collaborations; authorship patterns similarly show those affiliated to China as leading contributors, followed by the US and India, aligning with [67]and [36].
The thematic structure identified through KeyWords Plus (the 50 most frequent terms out of 2,985) focuses on sentiment analysis, social media, online social networking, data mining, and smart cities. It offers a concise overview of the field’s most prominent topics over the past 14 years and highlights the benefit of KeyWords Plus in broadening the keyword set [68]. Author keywords (the 50 most frequent out of 1,612) emphasize sentiment analysis, Twitter, social media, machine learning, and natural language processing—patterns that may reflect author preferences, particular interests, or publishing strategies. These findings are consistent with previous bibliometric studies of opinion mining and sentiment analysis [36,67], which similarly mapped influential authors and institutions, highly cited papers, and keyword trends. Machine learning remains the predominant method for sentiment classification, and Twitter/X) continues to be the most used social platform, although TripAdvisor has gained importance, partly due to recent access restrictions enforced by X (and the growing of tourism-related platforms such as Airbnb, TripAdvisor, Booking, etc.)
Looking at results based on its core meaning, facts, evidence, and practical importance, rather than superficial details, personal feelings, or mere appearances, focusing on what is real, significant, and meaningful, often contrasting with a subjective or purely procedural view. This substantive perspective emphasizes well-reasoned arguments, significant content, and genuine substance, making it crucial in academic, legal, and policy discussions. From this perspective, the literature indicates a higher prevalence of psychotic disorders in urban areas compared to non-urban areas [6], a pattern linked to increasing disconnection from nature and more sedentary urban lifestyles [7]. Urban design and landscape architecture serve as crucial tools for enhancing health and the human condition [3]. Exposure to natural elements and systems within cities, such as parks, gardens, water bodies, trees, and birds, has been connected to improved mental well-being and a lower occurrence of chronic mental illnesses [8,9,10,11,12].
Cities are seen as complex systems with many interacting factors, making them challenging to analyze for planning purposes. However, the availability of large datasets and the digitalization of urban life now allow for highly detailed spatiotemporal assessments of sentiments and emotions through social networks (e.g., Twitter/X) [15,16]. Digital transformation reshapes the spaces where people connect, express themselves, and gather, offering both opportunities and constraints for civic life. In this context, social media data is an important trigger to use sentiment analysis as a compelling case for well-being [23].
Conceptually, sentiment analysis, sometimes mistakenly conflated with opinion mining, aims to automatically identify opinions, detect the sentiments expressed, and classify their polarity (positive, negative, neutral, or more detailed schemes like OpeNER 2014 and EmoLex) [24,55,69]. While early work relied on lexicon-based methods with manually labeled polarity lists [26], the field has shifted toward machine learning, hybrid approaches [27], and landmark contributions that established modern pipelines (e.g., [70]). The rise of Web 2.0 and the surge of user-generated content have accelerated both the breadth and depth of sentiment analysis [23,71], opening new avenues for understanding human geography in urban environments [28]. Taking on a bibliometric approach, this paper focused on trends and publications, leading authors, institutions, funding sources, countries, thematic areas, and potential future hotspots in the field.
Against this background, social media platforms like Weibo, Twitter/X, and others are becoming key sources for sentiment analysis, providing real-time data on public perceptions and emotions related to urban environments [72,73,74]. Using large datasets from social media enables more comprehensive and dynamic analysis of sentiments across different urban areas and time periods [75,76,77]. Advances in deep learning and natural language processing (NLP), including object detection, image segmentation, and machine learning algorithms, are enhancing the accuracy and detail of sentiment classification and visualization [72,74,75,76,77]. Additionally, new methods such as dual-polarity metrics better capture distinctions between positive and negative sentiments [78]. There is a growing awareness of how the built environment influences public sentiment and mental health, with increasing focus on factors like green spaces, building density, and urban infrastructure. As a result, sentiment analysis is intertwined with the making-up of urban planning and public policies aimed at improving (mental, physical?) well-being and reducing negative emotions, with growing attention to elements such as green spaces, building density, and urban infrastructure [72,76,79,80].
Methodologically, this paper combines performance analysis and scientific mapping following established practices for summarizing large bibliometric corpora to reveal structural patterns and emerging trends [81]. Performance indicators such as publications, citations, citations per publication, and composite metrics like the h-index and g-index help assess productivity and impact [30], while scientific mapping—using citation/co-citation analysis, bibliographic coupling, co-word analysis, and co-authorship analyses—illuminates the intellectual and structural relationships within the field [31,32,33,34,35]. Complementary evidence from related bibliometric surveys, such as Niu and Silva (2020) mapping of crowdsourced data in urban activities, where sentiment analysis is paired with machine learning methods (e.g., Maximum entropy classifier, Multinomial Naïve Bayes) and lexical tools (e.g., AFINN), reinforces the present study’s depiction of methodological convergence [28,36].
Finally, researchers are increasingly examining the spatial distributions and temporal variations of sentiments to understand how different urban areas and time periods influence public emotions during specific events, seasons, or under changing environmental conditions [73,75,76,77,78]. Geotagged data enables detailed mapping of the emotional landscape within cities [76,77,78]. External shocks such as the COVID-19 pandemic have significantly affected public sentiment, highlighting the importance of including contextual variables; studies document shifts related to lockdowns, environmental changes, and urban renewal projects [73,75,77], which inform strategies for urban resilience and crisis management [73]. In practice, sentiment analysis guides urban development projects to ensure new initiatives align with public preferences and enhance quality of life [72,79,80]. It also supports strategies for managing green spaces, air quality, and other environmental factors that impact public sentiment [76,77,82]. Integrating these insights into smart city frameworks helps create more responsive, human-centered urban environments. Meanwhile, trend analysis indicates a relative decline in work specifically labeled as “urban planning” and a shift toward smart cities and tourism, suggesting a healthy diversification of applications and the need to revisit planning-focused studies to keep them current and human-centric urban environments [83].
5. Conclusion
The present paper offers a bibliometric overview of research findings on sentiment analysis in urban built environments. Recently, there has been increased use of sentiment analysis in topics like smart cities, the COVID-19 pandemic, and tourism. Since sentiment analysis plays a crucial role in understanding how environmental characteristics affect individual well-being, it makes sense to develop future studies focused on this area, incorporating newer methods like deep learning, which recognize complex text patterns and process data in ways inspired by the human brain. In fact, deep neural network architectures, such as convolutional neural networks (CNNs) and recurrent neural networks (RNNs), have shown promising results in sentiment analysis from text. More advanced models, like Google’s Transformer neural network, have also been explored because of their ability to capture complex semantic relationships.
Transfer learning, which fine-tunes models pre-trained on large datasets for sentiment analysis on social media, further enhances model performance, especially when training data is scarce. Yet, obtaining large, annotated datasets for training sentiment analysis models remains challenging. In such cases, semi-supervised learning, which combines labeled and unlabeled data, can improve performance by allowing models to learn from unclassified examples during training. Future methodologies to explore include multimodal models capable of analyzing multiple data types simultaneously, that is, social data not only consists of text but also includes images, videos, and audio, becoming increasingly important for capturing subtle nuances in sentiment expression. This naturally leads to research into the realm of urban environments and context analysis.
Considering the contextual, positional and situational specificity in which messages are posted can significantly enhance the accuracy of sentiment analysis. Methods that account for social, temporal, and situational context can help interpret expressed sentiment more precisely. Such analyses offer future researchers guidance and insights into potential challenges and limitations within the field, as well as a comprehensive overview of the global scientific research on this topic by authors, countries, sources, funding, and active institutions, thereby supporting the development of more comprehensive academic production on sentiment analysis related to urban built environments. Of course, the bibliometric analysis drawn in this paper has some limitations, especially since it relies on data from only one indexer, Scopus. Future research could incorporate additional databases beyond electronic sources, such as Google Scholar, Web of Science, PubMed, Embase, as well as physical libraries and repositories, print publications, and others.
Overall, sentiment analysis supported by social media data is a powerful tool for understanding public emotions, perceptions and thus well-being, which is essential for effective urban planning, health services, and policymaking. By leveraging near real-time data, policymakers and researchers can make informed decisions that better reflect the needs and sentiments of the general population.
Author Contributions
Conceptualization, I.B, J.R. and C.M.V.; methodology, I.B, J.R. and C.M.V.; validation, I.B, C.M.V. E.G. and J.R.; formal analysis, I.B, C.M.V., E.G. and J.R; investigation, I.B., C.M.V. and J.R..; resources, I.B, J.R. and C.V; data curation, I.B, J.R. and C.M.V.; writing—original draft preparation, I.B, J.R. and C.M.V.; writing—review and editing, J.R., E.G., D.G.S. and C.M.V.; supervision, J.R and C.M.V.; project administration, J.R. and D.G.S.; funding acquisition, J.R. and D.G.S. All authors have read and agreed to the published version of the manuscript.
Funding
This research was funded by the Portuguese Foundation for Science and Technology (FCT), grant number 2022.11665.BD, awarded to Iuria Betco and “The APC was funded by The Center for Geographical Studies at the University of Lisbon and the FCT), grant number UID/00295/2025 (https://doi.org/10.54499/UID/00295/2025).
Data Availability Statement
The datasets presented in this article are not readily available because the data are part of an ongoing PhD Thesis. Requests to access the datasets should be directed to betcoiuria@edu.ulisboa.pt.
Acknowledgments
We thank GEOMODLAB — Remote Sensing, Geographical Analysis, and Modeling Laboratory — of the Center for Geographical Studies (CEG) and the Institute of Geography and Spatial Planning (IGOT) for providing the necessary equipment and software.
Conflicts of Interest
The authors declare no conflict of interest.
References
- Pineo, H.; Rydin, Y. Cities, Health and Well-Being. R. Inst. Chart. Surv. London, UK. 2018, 1–40. [Google Scholar]
- Hidaka, B.H. Depression as a Disease of Modernity: Explanations for Increasing Prevalence. Natl. Institutes Heal. 2012, 140, 205–214. [Google Scholar] [CrossRef]
- Adli, M.; Berger, M.; Brakemeier, E.L.; Engel, L.; Fingerhut, J.; Gomez-Carrillo, A.; Hehl, R.; Heinz, A.; Mayer, J.; Mehran, N.; et al. Neurourbanism: Towards a New Discipline. The Lancet Psychiatry 2017, 4, 183–185. [Google Scholar] [CrossRef] [PubMed]
- Lederbogen, F.; Kirsch, P.; Haddad, L.; Streit, F.; Tost, H.; Schuch, P.; Wüst, S.; Pruessner, J.C.; Rietschel, M.; Deuschle, M.; et al. City Living and Urban Upbringing Affect Neural Social Stress Processing in Humans. Nature 2011, 474, 498–501. [Google Scholar] [CrossRef]
- Peen, J.; Schoevers, R.A.; Beekman, A.T.; Dekker, J. The Current Status of Urban-Rural Differences in Psychiatric Disorders. Acta Psychiatr. Scand. 2010, 121, 84–93. [Google Scholar] [CrossRef]
- Galea, S. The Urban Brain: New Directions in Research Exploring the Relation between Cities and Mood–Anxiety Disorders. Depress. Anxiety 2011, 28, 857–862. [Google Scholar] [CrossRef] [PubMed]
- Miller, J.R. Biodiversity Conservation and the Extinction of Experience. Trends Ecol. Evol. 2005, 20, 430–434. [Google Scholar] [CrossRef] [PubMed]
- Hartig, T. Nature Experience in Transactional Perspective. Landsc. Urban Plan. 1993, 25, 17–36. [Google Scholar] [CrossRef]
- Kaplan, S. The Restorative Benefits of Nature: Toward an Integrative Framework. J. Environ. Psychol. 1995, 15, 169–182. [Google Scholar] [CrossRef]
- Bakolis, I.; Hammoud, R.; Smythe, M.; Gibbons, J.; Davidson, N.; Tognin, S.; Mechelli, A. Urban Mind: Using Smartphone Technologies to Investigate the Impact of Nature on Mental Well-Being in Real Time. Bioscience 2018, 68, 134–145. [Google Scholar] [CrossRef]
- Cox, D.T.C.; Shanahan, D.F.; Hudson, H.L.; Plummer, K.E.; Siriwardena, G.M.; Fuller, R.A.; Anderson, K.; Hancock, S.; Gaston, K.J. Doses of Neighborhood Nature: The Benefits for Mental Health of Living with Nature. Bioscience 2017, 67, 147–155. [Google Scholar] [CrossRef]
- Hammoud, R.; Tognin, S.; Burgess, L.; Bergou, N.; Smythe, M.; Gibbons, J.; Davidson, N.; Afifi, A.; Bakolis, I.; Mechelli, A. Smartphone-Based Ecological Momentary Assessment Reveals Mental Health Benefits of Birdlife. Sci. Rep. 2022, 12, 6–15. [Google Scholar] [CrossRef]
- Sá, R.; Roquette, R.; Rebecchi, A.; Matias, J.; Rocha, J.; Buffoli, M.; Capolongo, S.; Ribeiro, A.I.; Nunes, B.; Dias, C.; et al. Association between Area-Level Walkability and Glycated Haemoglobin: A Portuguese Population-Based Study. BMC Public Health 2024, 24, 1116. [Google Scholar] [CrossRef]
- Kovács-Györi, A.; Ristea, A.; Kolcsar, R.; Resch, B.; Crivellari, A.; Blaschke, T. Beyond Spatial Proximity-Classifying Parks and Their Visitors in London Based on Spatiotemporal and Sentiment Analysis of Twitter Data. ISPRS Int. J. Geo-Information 2018, 7. [Google Scholar] [CrossRef]
- Kovács-Györi, A.; Ristea, A.; Havas, C.; Resch, B.; Cabrera-Barona, P. #London2012: Towards Citizen-Contributed Urban Planning through Sentiment Analysis of Twitter Data. Urban Plan. 2018, 3, 75–99. [Google Scholar] [CrossRef]
- Romice, O.; Thwaites, K.; Porta, S.; Greaves, M.; Barbour, G.; Pasino, P. City Form and Wellbeing. In The Handbook of Environmental Psychology and Quality of Life Research; Fleury-Bahi, Ghozlane, Pol, Enric, Navarro, O., Eds.; Springer, 2016; pp. 241–273. [Google Scholar]
- Ash, James; Kitchin, Rob; Leszczynski, Agnieszka. Digital Turn, Digital Geographies? Prog. Hum. Geogr. 2016, 42, 25–43. [Google Scholar] [CrossRef]
- Alsharif, M.; Hnit, H. Digital Human Rights: Legal Debates and Emerging Foundations under the International Bill of Human Rights. Soc. Sci. Humanit. Open 2025, 12. [Google Scholar] [CrossRef]
- Jørgensen, R.F. Social Media, Human Rights and Society. In Routledge Handbook of Social: Media, Law and Society; 2025; pp. 7–9. [Google Scholar]
- Charoenloasiri, N.; Yimsook, N.; Walsh, C. Understand and Find a Mechanism to Enhance the Power of App-Based Food Delivery Riders in Thailand. J. Arts Thai Stud. 2025, 47. [Google Scholar] [CrossRef]
- Arginbekova, G.; Amitov, S.; Kyndybayeva, R.; Bakbergen, K. Human Values in the Age of Digitalization. Sci. Her. Uzhhorod Univ. Ser. Phys. 2024, 2275–2284. [Google Scholar] [CrossRef]
- Lynch, N. Facial Recognition Technology in Policing and Security—Case Studies in Regulation. Laws 2024, 13. [Google Scholar] [CrossRef]
- Zunic, A.; Corcoran, P.; Spasic, I. Sentiment Analysis in Health and Well-Being: Systematic Review. JMIR Med. informatics 2020, 8, 22. [Google Scholar] [CrossRef]
- Medhat, W.; Hassan, A.; Korashy, H. Sentiment Analysis Algorithms and Applications : A Survey. Ain Shams Eng. J. 2014, 5, 1093–1113. [Google Scholar] [CrossRef]
- Balahur, A.; Mihalcea, R.; Montoyo, A. Preface: Computational Approaches to Subjectivity and Sentiment Analysis: Present and Envisaged Methods and Applications. Comput. Speech Lang. 2014, 28, 1–6. [Google Scholar] [CrossRef]
- Shayaa, S.; Jaafar, N.I.; Bahri, S.; Sulaiman, A.; Wai, P.S.; Chung, Y.W.; Piprani, A.Z.; Al-garadi, M.A. Sentiment Analysis of Big Data : Methods, Applications, and Open Challenges. IEEE Access 2018, 6, 37807–37827. [Google Scholar] [CrossRef]
- Maynard, D.; Funk, A. Automatic Detection of Political Opinions in Tweets. In The Semantic Web: ESWC 2011 Workshops. ESWC 2011. Lecture Notes in Computer Science; García-Castro, R., Fensel, D., Antoniou, G., Eds.; Springer Berlin Heidelberg: Berlin, Heidelberg, 2012; pp. 88–99. ISBN 978-3-642-25953-1. [Google Scholar]
- Niu, H.; Silva, E.A. Crowdsourced Data Mining for Urban Activity: Review of Data Sources, Applications, and Methods. J. Urban Plan. Dev. 2020, 146. [Google Scholar] [CrossRef]
- Zupic, Ivan; Čater, Tomaž. Bibliometric Methods in Management and Organization. Organ. Res. Methods 2014, 18, 429–472. [Google Scholar] [CrossRef]
- Donthu, N.; Kumar, S.; Mukherjee, D.; Pandey, N.; Lim, W.M. How to Conduct a Bibliometric Analysis: An Overview and Guidelines. J. Bus. Res. 2021, 133, 285–296. [Google Scholar] [CrossRef]
- Baker, H.K.; Kumar, S.; Pandey, N. Forty Years of the Journal of Futures Markets: A Bibliometric Overview. J. Futur. Mark. 2021, 41, 1027–1054. [Google Scholar] [CrossRef]
- Cobo, M.J.; López-Herrera, A.G.; Herrera-Viedma, E.; Herrera, F. An Approach for Detecting, Quantifying, and Visualizing the Evolution of a Research Field: A Practical Application to the Fuzzy Sets Theory Field. J. Informetr. 2011, 5, 146–166. [Google Scholar] [CrossRef]
- Ramos-Rodrígue, A.-R.; Ruíz-Navarro, J. Changes in the Intellectual Structure of Strategic Management Research: A Bibliometric Study of the Strategic Management Journal, 1980-2000. Strateg. Manag. J. 2004, 25, 981–1004. [Google Scholar] [CrossRef]
- Baker, H.K.; Pandey, N.; Kumar, S.; Haldar, A. A Bibliometric Analysis of Board Diversity: Current Status, Development, and Future Research Directions. J. Bus. Res. 2020, 108, 232–246. [Google Scholar] [CrossRef]
- Tunger, D.; Eulerich, M. Bibliometric Analysis of Corporate Governance Research in German-Speaking Countries: Applying Bibliometrics to Business Research Using a Custom-Made Database. Scientometrics 2018, 117, 2041–2059. [Google Scholar] [CrossRef]
- Musa, I.H.; Zamit, I.; Xu, K.; Boutouhami, K.; Qi, G. A Comprehensive Bibliometric Analysis on Opinion Mining and Sentiment Analysis Global Research Output. J. Inf. Sci. 2021. [Google Scholar] [CrossRef]
- Bakkalbasi, N.; Bauer, K.; Glover, J.; Wang, L. Three Options for Citation Tracking: Google Scholar, Scopus and Web of Science. Biomed. Digit. Libr. 2006, 3, 1–8. [Google Scholar] [CrossRef]
- Burnham, J.F. Scopus Database: A Review. Biomed. Digit. Libr. 2006, 3, 1–8. [Google Scholar] [CrossRef] [PubMed]
- Aria, M.; Cuccurullo, C. Bibliometrix: An R-Tool for Comprehensive Science Mapping Analysis. J. Informetr. 2017, 11, 959–975. [Google Scholar] [CrossRef]
- Arruda, H.; Silva, E.R.; Lessa, M.; Proença, D.J.; Bartholo, R. VOSviewer and Bibliometrix. J. Med. Libr. Assoc. 2022, 110, 392–395. [Google Scholar] [CrossRef] [PubMed]
- Busteed, M. Little Islands of Erin: Irish Settlement and Identity in Mid-Nineteenth-Century Manchester. Immigrants Minor. 1999, 18, 94–127. [Google Scholar] [CrossRef]
- Hofmann, S.; Beverungen, D.; Räckers, M.; Becker, J. What Makes Local Governments’ Online Communications Successful? Insights from a Multi-Method Analysis of Facebook. Gov. Inf. Q. 2013, 30, 387–396. [Google Scholar] [CrossRef]
- Lee, M.; Jeong, M.; Lee, J. Roles of Negative Emotions in Customers’ Perceived Helpfulness of Hotel Reviews on a User-Generated Review Website: A Text Mining Approach. Int. J. Contemp. Hosp. Manag. 2017, 29, 762–783. [Google Scholar] [CrossRef]
- Barbado, R.; Araque, O.; Iglesias, C.A. A Framework for Fake Review Detection in Online Consumer Electronics Retailers. Inf. Process. Manag. 2019, 56, 1234–1244. [Google Scholar] [CrossRef]
- González-Rodríguez, M.R.; Martínez-Torres, R.; Toral, S. Post-Visit and Pre-Visit Tourist Destination Image through EWOM Sentiment Analysis and Perceived Helpfulness. Int. J. Contemp. Hosp. Manag. 2016, 28, 2609–2627. [Google Scholar] [CrossRef]
- Shuja, J.; Alanazi, E.; Alasmary, W.; Alashaikh, A. COVID-19 Open Source Data Sets: A Comprehensive Survey. Appl. Intell. 2021, 51, 1296–1325. [Google Scholar] [CrossRef]
- Zavattaro, S.M.; French, P.E.; Mohanty, S.D. A Sentiment Analysis of U.S. Local Government Tweets: The Connection between Tone and Citizen Involvement. Gov. Inf. Q. 2015, 32, 333–341. [Google Scholar] [CrossRef]
- Valdez, D.; ten Thij, M.; Bathina, K.; Rutter, L.A.; Bollen, J. Social Media Insights into US Mental Health during the COVID-19 Pandemic: Longitudinal Analysis of Twitter Data. J. Med. Internet Res. 2020, 22. [Google Scholar] [CrossRef] [PubMed]
- Wang, T.; Lu, K.; Chow, K.P.; Zhu, Q. COVID-19 Sensing: Negative Sentiment Analysis on Social Media in China via BERT Model. IEEE Access 2020, 8, 138162–138169. [Google Scholar] [CrossRef]
- Ali, F.; Kwak, D.; Khan, P.; Islam, S.M.R.; Kim, K.H.; Kwak, K.S. Fuzzy Ontology-Based Sentiment Analysis of Transportation and City Feature Reviews for Safe Traveling. Transp. Res. Part C Emerg. Technol. 2017, 77, 33–48. [Google Scholar] [CrossRef]
- Chen, X.; Cho, Y.; Jang, S.Y. Crime Prediction Using Twitter Sentiment and Weather. In Proceedings of the 2015 Systems and Information Engineering Design Symposium, SIEDS 2015, 2015; Institute of Electrical and Electronics Engineers Inc.; pp. 63–68. [Google Scholar]
- Pang, B.; Lee, L. Opinion Mining and Sentiment Analysis. Found. Trends Inf. Retr. 2008, 2, 1–135. [Google Scholar] [CrossRef]
- Mitchell, L.; Frank, M.R.; Harris, K.D.; Dodds, P.S.; Danforth, C.M. The Geography of Happiness: Connecting Twitter Sentiment and Expression, Demographics, and Objective Characteristics of Place. PLoS One 2013, 8, e64417. [Google Scholar] [CrossRef] [PubMed]
- Blei, D.M.; Ng, A.Y.; Jordan, M.I. Latent Dirichlet Allocation. J. Mach. Learn. Res. 2003, 3, 993–1022. [Google Scholar]
- Bollen, J.; Mao, H.; Zeng, X. Twitter Mood Predicts the Stock Market. J. Comput. Sci. 2011, 2, 1–8. [Google Scholar] [CrossRef]
- Liu, B. Sentiment Analysis and Opinion Mining; Springer Nature, 2022; ISSN ISBN 3031021452. [Google Scholar]
- Liu, B.; Zhang, L. A Survey of Opinion Mining and Sentiment Analysis BT - Mining Text Data; Aggarwal, C.C., Zhai, C., Eds.; Springer US: Boston, MA, 2012; pp. 415–463. ISBN 978-1-4614-3223-4. [Google Scholar]
- Xiang, Z.; Du, Q.; Ma, Y.; Fan, W. A Comparative Analysis of Major Online Review Platforms: Implications for Social Media Analytics in Hospitality and Tourism. Tour. Manag. 2017, 58, 51–65. [Google Scholar] [CrossRef]
- Litvin, S.W.; Goldsmith, R.E.; Pan, B. Electronic Word-of-Mouth in Hospitality and Tourism Management. Tour. Manag. 2008, 29, 458–468. [Google Scholar] [CrossRef]
- Sakaki, T.; Okazaki, M.; Matsuo, Y. Earthquake Shakes Twitter Users: Real-Time Event Detection by Social Sensors. In Proceedings of the Proceedings of the 19th International Conference on World Wide Web, New York, NY, USA, 2010; Association for Computing Machinery; pp. 851–860. [Google Scholar]
- Nugroho, R.P.; Zuiderwijk, A.; Janssen, M.; de Jong, M. A Comparison of National Open Data Policies: Lessons Learned. Transform. Gov. People, Process Policy 2015, 9, 286–308. [Google Scholar] [CrossRef]
- Ahmad, I.; Khan, I.A.; Verma, A.; Sharma, S. Recent Trends in Sentiment Analysis Tools. In Proceedings of the AIP Conference Proceedings, 2023; Vol. 2771. [Google Scholar]
- van Eck, N.J.; Waltman, L. {VOSviewer} Manual. In Leiden: Univeristeit Leiden; 2023. [Google Scholar]
- Knani, M.; Echchakoui, S.; Ladhari, R. Artificial Intelligence in Tourism and Hospitality: Bibliometric Analysis and Research Agenda. Int. J. Hosp. Manag. 2022, 107. [Google Scholar] [CrossRef]
- Raja, J.G.J.S.; Juliet, S. Deep Learning-Based Sentiment Analysis of Trip Advisor Reviews. In Proceedings of the 2023 2nd International Conference on Applied Artificial Intelligence and Computing (ICAAIC), 2023; pp. 560–565. [Google Scholar]
- Chu, M.; Chen, Y.; Yang, L.; Wang, J. Language Interpretation in Travel Guidance Platform: Text Mining and Sentiment Analysis of TripAdvisor Reviews. Front. Psychol. 2022, 13. [Google Scholar] [CrossRef]
- Keramatfar, A.; Amirkhani, H. Bibliometrics of Sentiment Analysis Literature. J. Inf. Sci. 2018, 45. [Google Scholar] [CrossRef]
- Zhang, Z.; Wu, G.; Lan, M. ECNU: Multi-Level Sentiment Analysis on Twitter Using Traditional Linguistic Features and Word Embedding Features. In Proceedings of the SemEval 2015 - 9th International Workshop on Semantic Evaluation, co-located with the 2015 Conference of the North American Chapter of the Association for Computational Linguistics: Human Language Technologies, NAACL-HLT 2015 - Proceedings; Nakov P. Zesch T., C.D.J.D., Ed.; Association for Computational Linguistics (ACL), 2015; pp. 561–567. [Google Scholar]
- Mohammad, S.M.; Turney, P. NRC Word-Emotion Association Lexicon (Aka EmoLex). Available online: https://saifmohammad.com/WebPages/NRC-Emotion-Lexicon.htm (accessed on 10 November 2024).
- Pang, B.; Lee, L. A Sentimental Education: Sentiment Analysis Using Subjectivity Summarization Based on Minimum Cuts. Proc. Annu. Meet. Assoc. Comput. Linguist., 2004 ; pp. 271–278. [Google Scholar]
- Afriliana, N.; Iswari, N.M.S. Suryasari Sentiment Analysis of User-Generated Content: A Bibliometric Analysis. J. Syst. Manag. Sci. 2022, 12, 583–598. [Google Scholar] [CrossRef]
- Duan, S.; Shen, Z.; Luo, X. Exploring the Relationship between Urban Youth Sentiment and the Built Environment Using Machine Learning and Weibo Comments. Int. J. Environ. Res. Public Health 2022, 19. [Google Scholar] [CrossRef]
- He, Y.; Zhao, Q.; Sun, S.; Li, W.; Qiu, W. Measuring the Spatial-Temporal Heterogeneity of Helplessness Sentiment and Its Built Environment Determinants during the COVID-19 Quarantines: A Case Study in Shanghai. ISPRS Int. J. Geo-Information 2024, 13. [Google Scholar] [CrossRef]
- Ashayeri, M.; Abbasabadi, N. Unraveling Energy Justice in NYC Urban Buildings through Social Media Sentiment Analysis and Transformer Deep Learning. Energy Build. 2024, 306. [Google Scholar] [CrossRef]
- Huang, J.; Tu, H. Inconsistent Affective Reaction: Sentiment of Perception and Opinion in Urban Environments. Proceedings of the Proceedings of the International Conference on Computer-Aided Architectural Design Research in Asia 2024, Vol. 2, 395–404. [Google Scholar]
- He, H.; Sun, R. Sentiment Variations Affected by Urban Temperature and Landscape across China. Cities 2024, 149. [Google Scholar] [CrossRef]
- He, H.; Sun, R.; Li, J.; Li, W. Urban Landscape and Climate Affect Residents’ Sentiments Based on Big Data. Appl. Geogr. 2023, 152, 102902. [Google Scholar] [CrossRef]
- Gao, Y.; Chen, Y.; Mu, L.; Gong, S.; Zhang, P.; Liu, Y. Measuring Urban Sentiments from Social Media Data: A Dual-Polarity Metric Approach. J. Geogr. Syst. 2022, 24, 199–221. [Google Scholar] [CrossRef]
- Fan, C.; Gai, Z.; Li, S.; Cao, Y.; Gu, Y.; Jin, C.; Zhang, Y.; Ge, Y.; Zhou, L. Does the Built Environment of Settlements Affect Our Sentiments? A Multi-Level and Non-Linear Analysis of Xiamen, China, Using Social Media Data. Front. Public Heal. 2023, 10. [Google Scholar] [CrossRef] [PubMed]
- He, P.; Yu, B.; Ma, J.; Luo, K.; Chen, S.; Shen, Z. Exploring the Non-Linear Relationship and Synergistic Effect between Urban Built Environment and Public Sentiment Integrating Macro- and Micro-Level Perspective: A Case Study in San Francisco. Front. Psychol. 2024, 15. [Google Scholar] [CrossRef] [PubMed]
- Verma, S.; Gustafsson, A. Investigating the Emerging COVID-19 Research Trends in the Field of Business and Management: A Bibliometric Analysis Approach. J. Bus. Res. 2020, 118, 253–261. [Google Scholar] [CrossRef] [PubMed]
- Betco, I.; Ribeiro, A.I.; Vale, D.S.; Encalada-Abarca, L.; Viana, C.M.; Rocha, J. Sentiment Analysis Using a Lexicon-Based Approach in Lisbon, Portugal. Geospat. Health 2025, 20, 1344. [Google Scholar] [CrossRef]
- de Oliveira, T.H.M.; Painho, M. Open Geospatial Data Contribution Towards Sentiment Analysis Within the Human Dimension of Smart Cities. Lecture Notes in Intelligent Transportation and Infrastructure 2021, Vol. Part F1384, 75–95. [Google Scholar]
Figure 1.
Flowchart of the documentation extraction process.
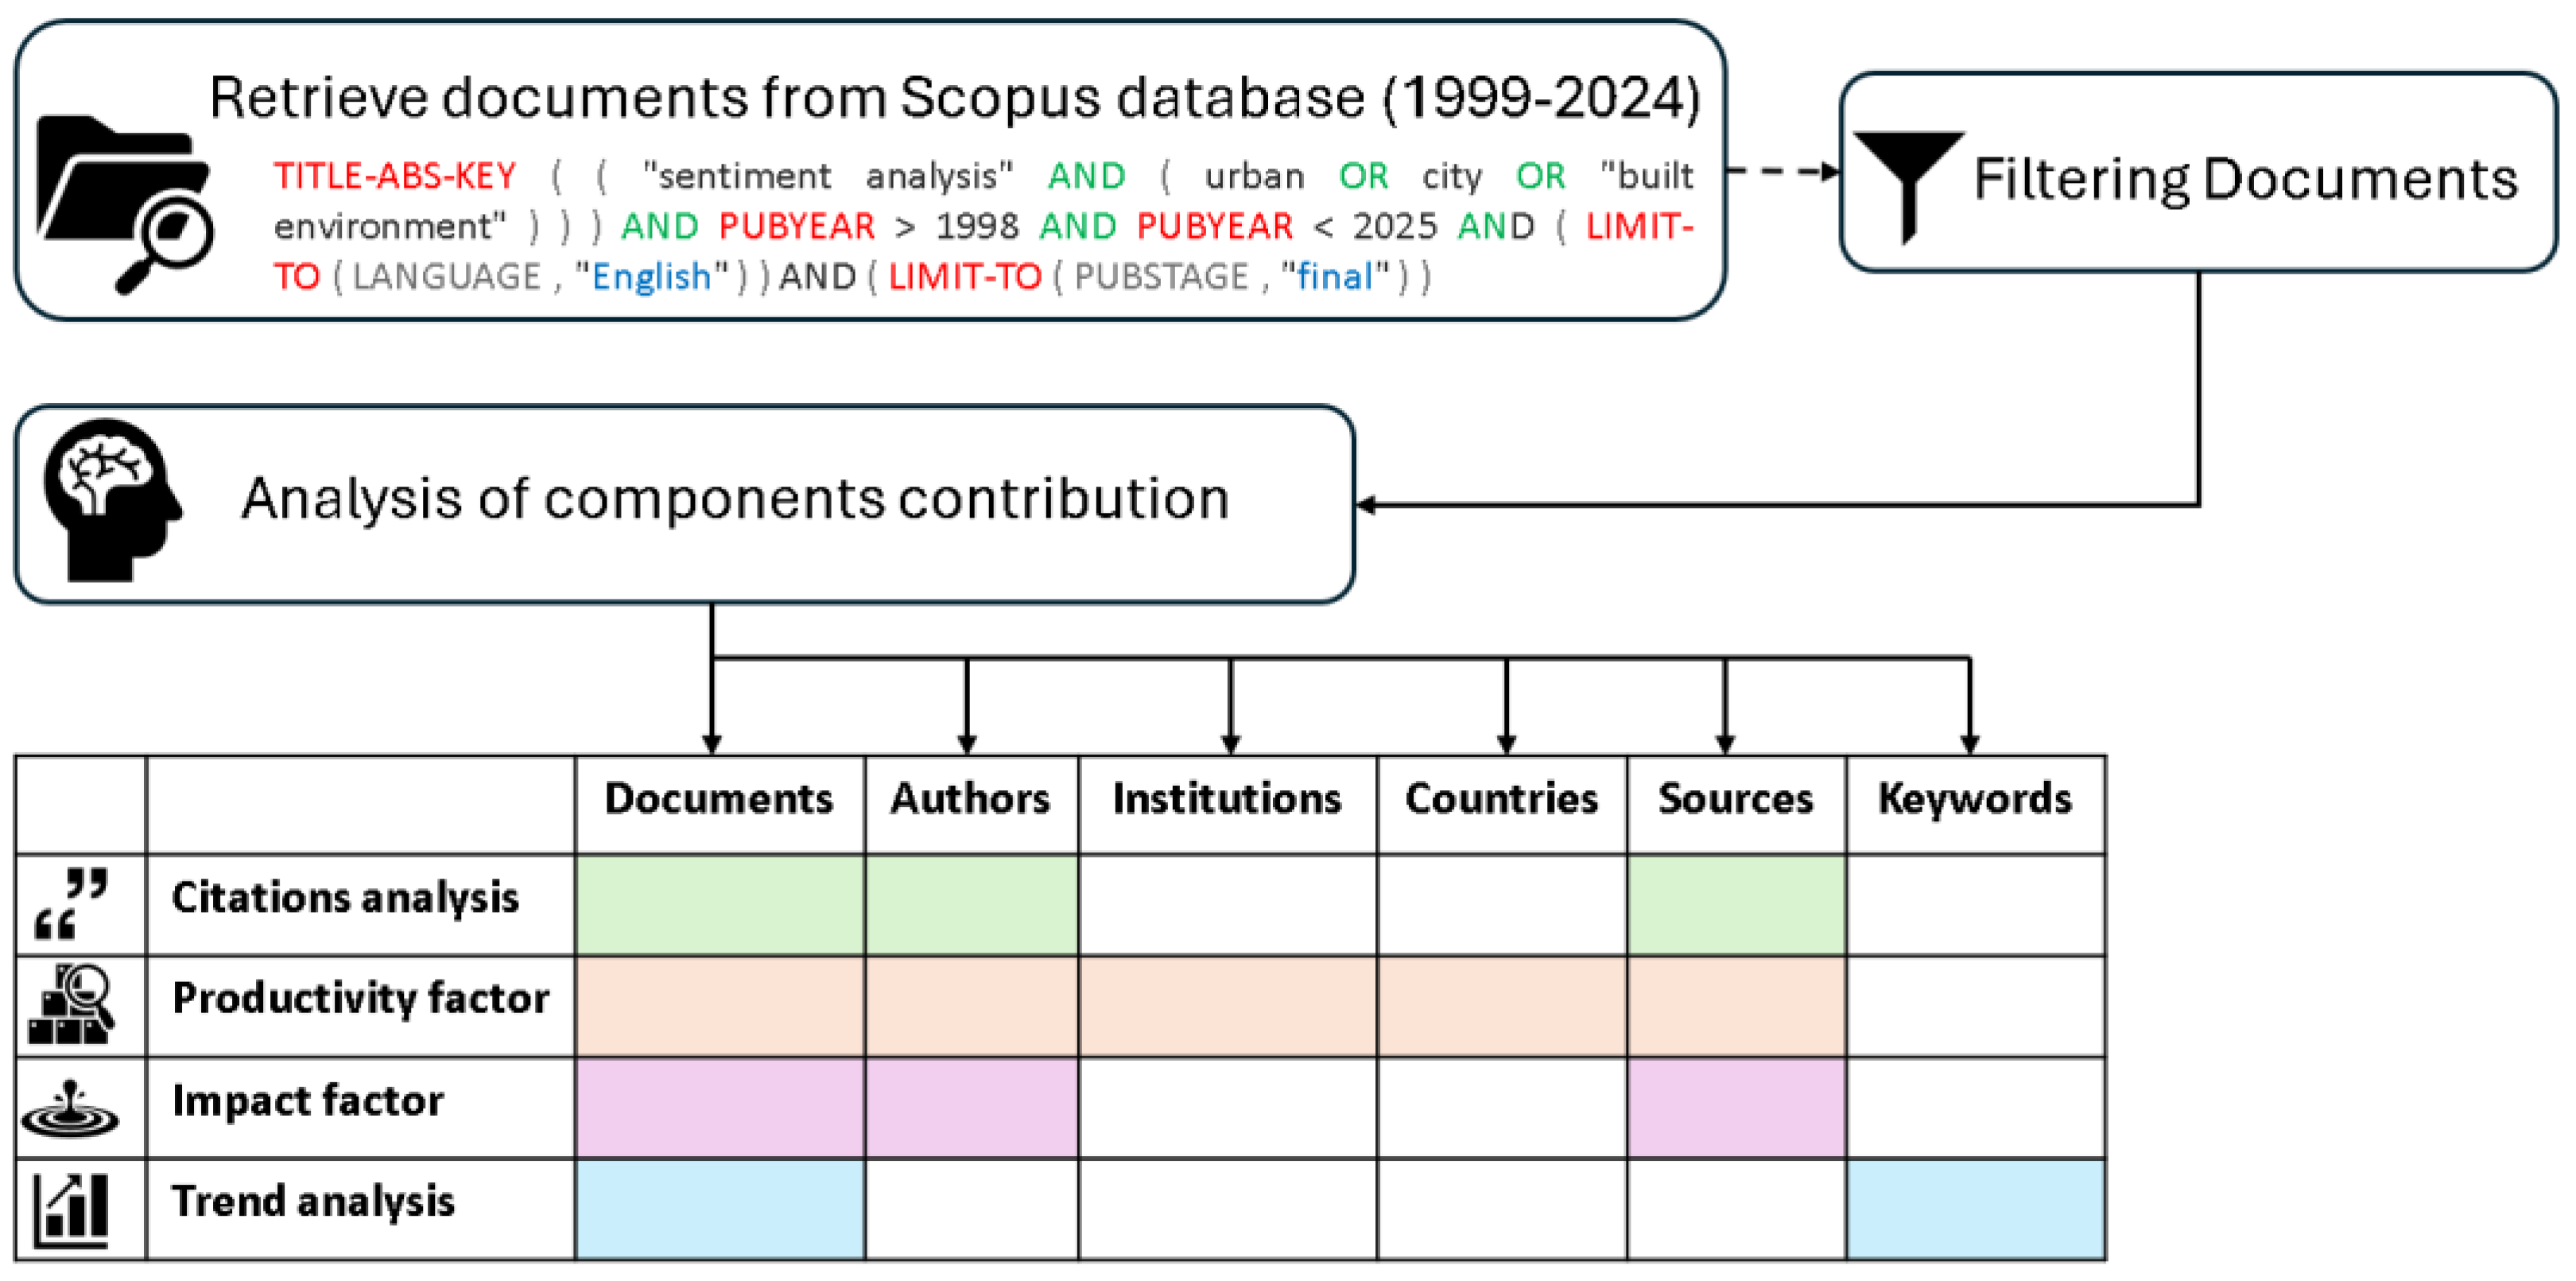
Figure 2.
Annual trends and total average citations per year of publications on sentiment analysis related to built, urban, or city environments.
Figure 2.
Annual trends and total average citations per year of publications on sentiment analysis related to built, urban, or city environments.
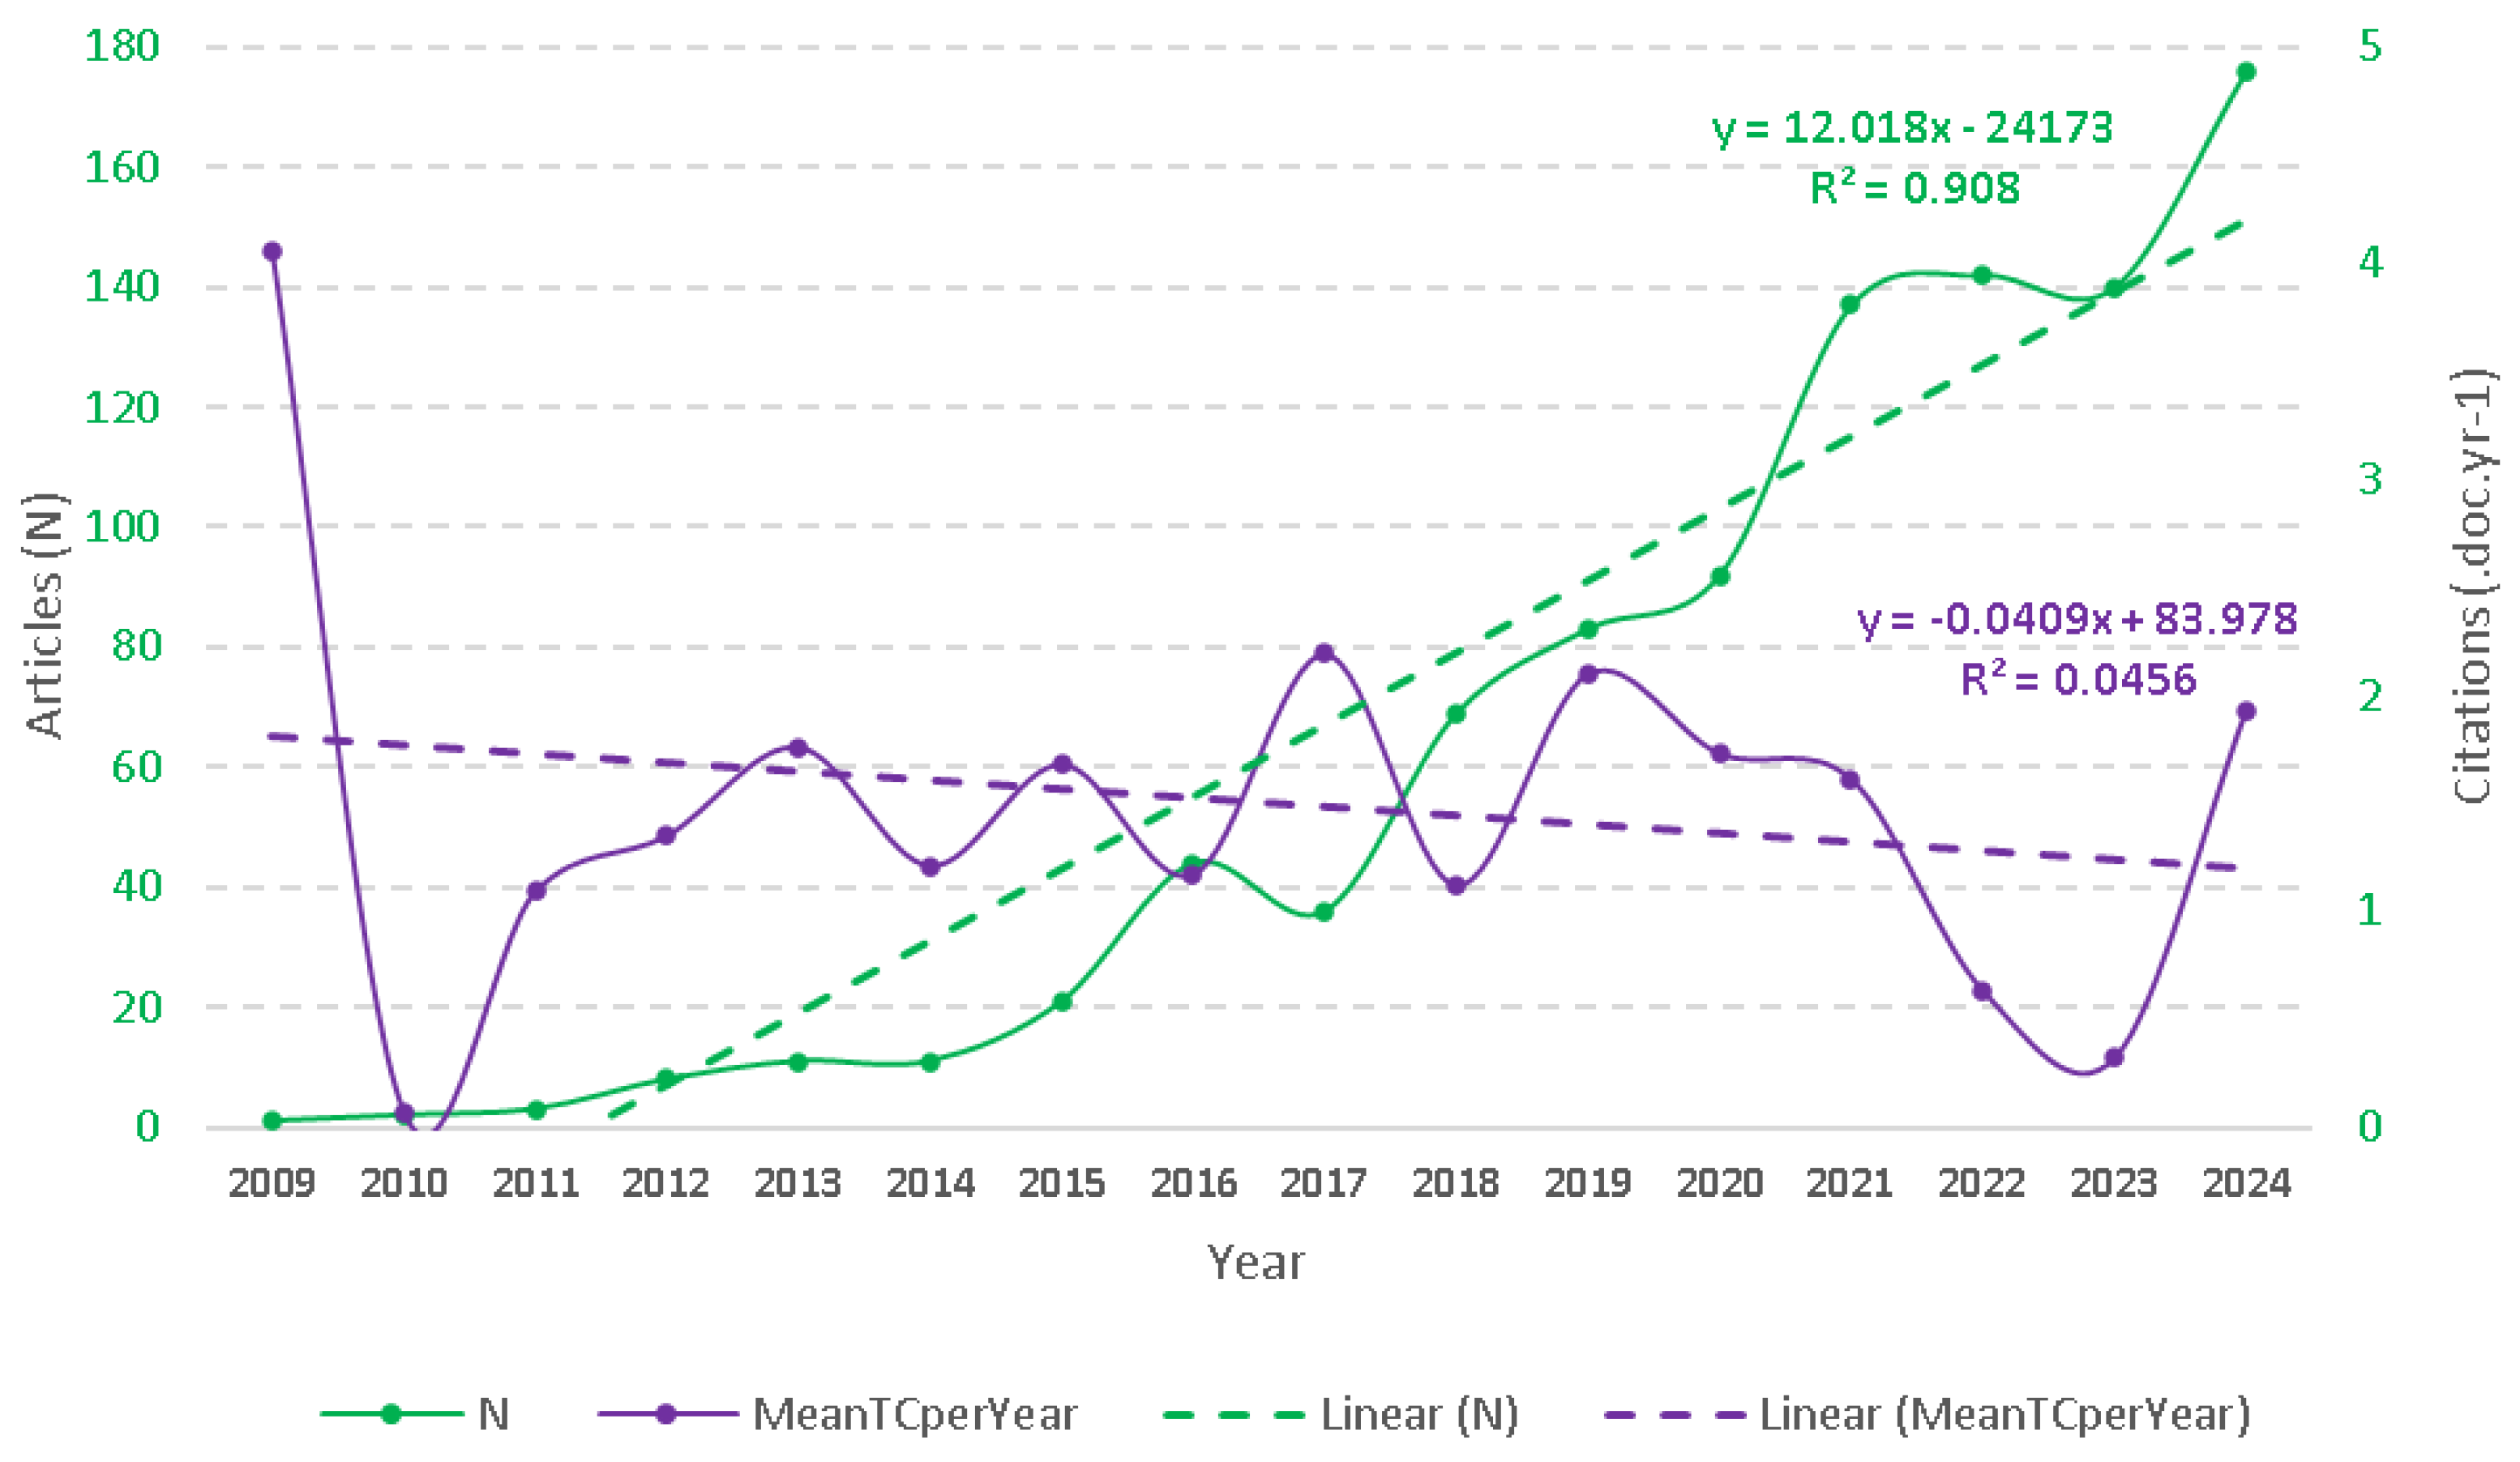
Figure 3.
Countries’ scientific production. TOP 10, China (391), USA (337), India (174), Indonesia (125), Italy (115), Australia (84), United Kingdom (77), Spain (61), Canada (57) and Saudi Arabia (53).
Figure 3.
Countries’ scientific production. TOP 10, China (391), USA (337), India (174), Indonesia (125), Italy (115), Australia (84), United Kingdom (77), Spain (61), Canada (57) and Saudi Arabia (53).

Figure 5.
Keyword co-occurrence analysis.
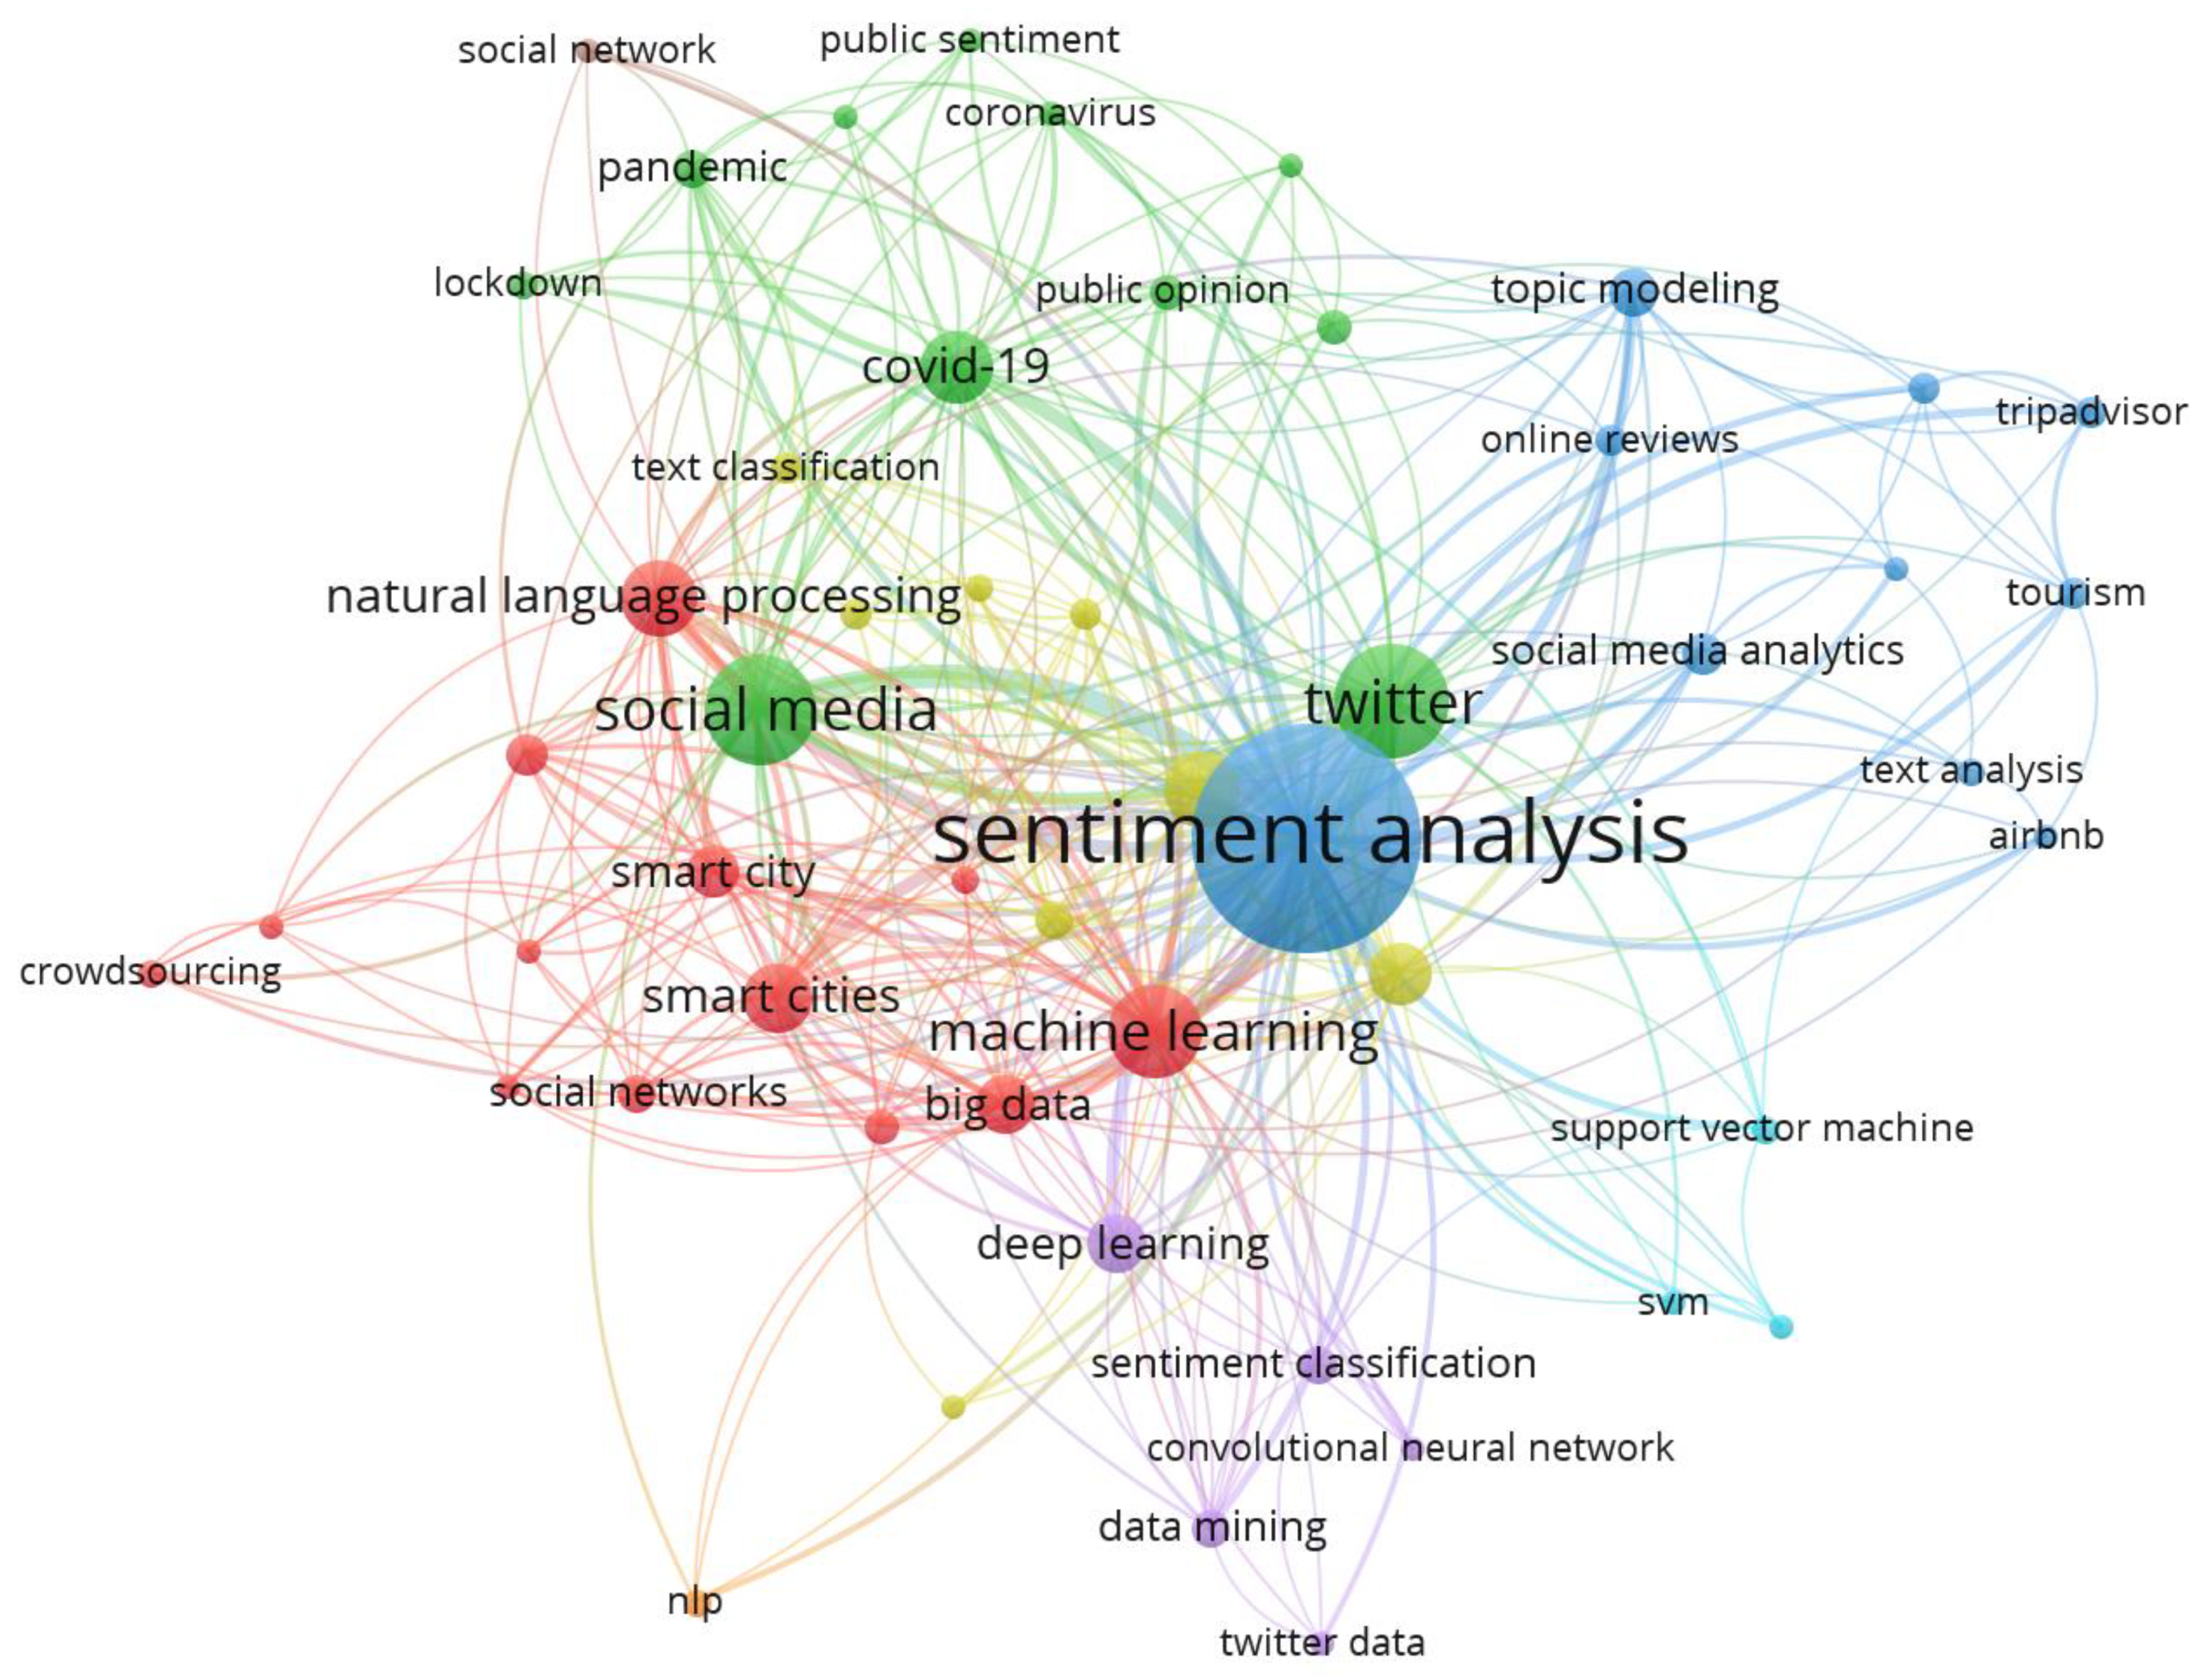
Figure 6.
Trending topics based on the frequency of authors’ keywords over time.
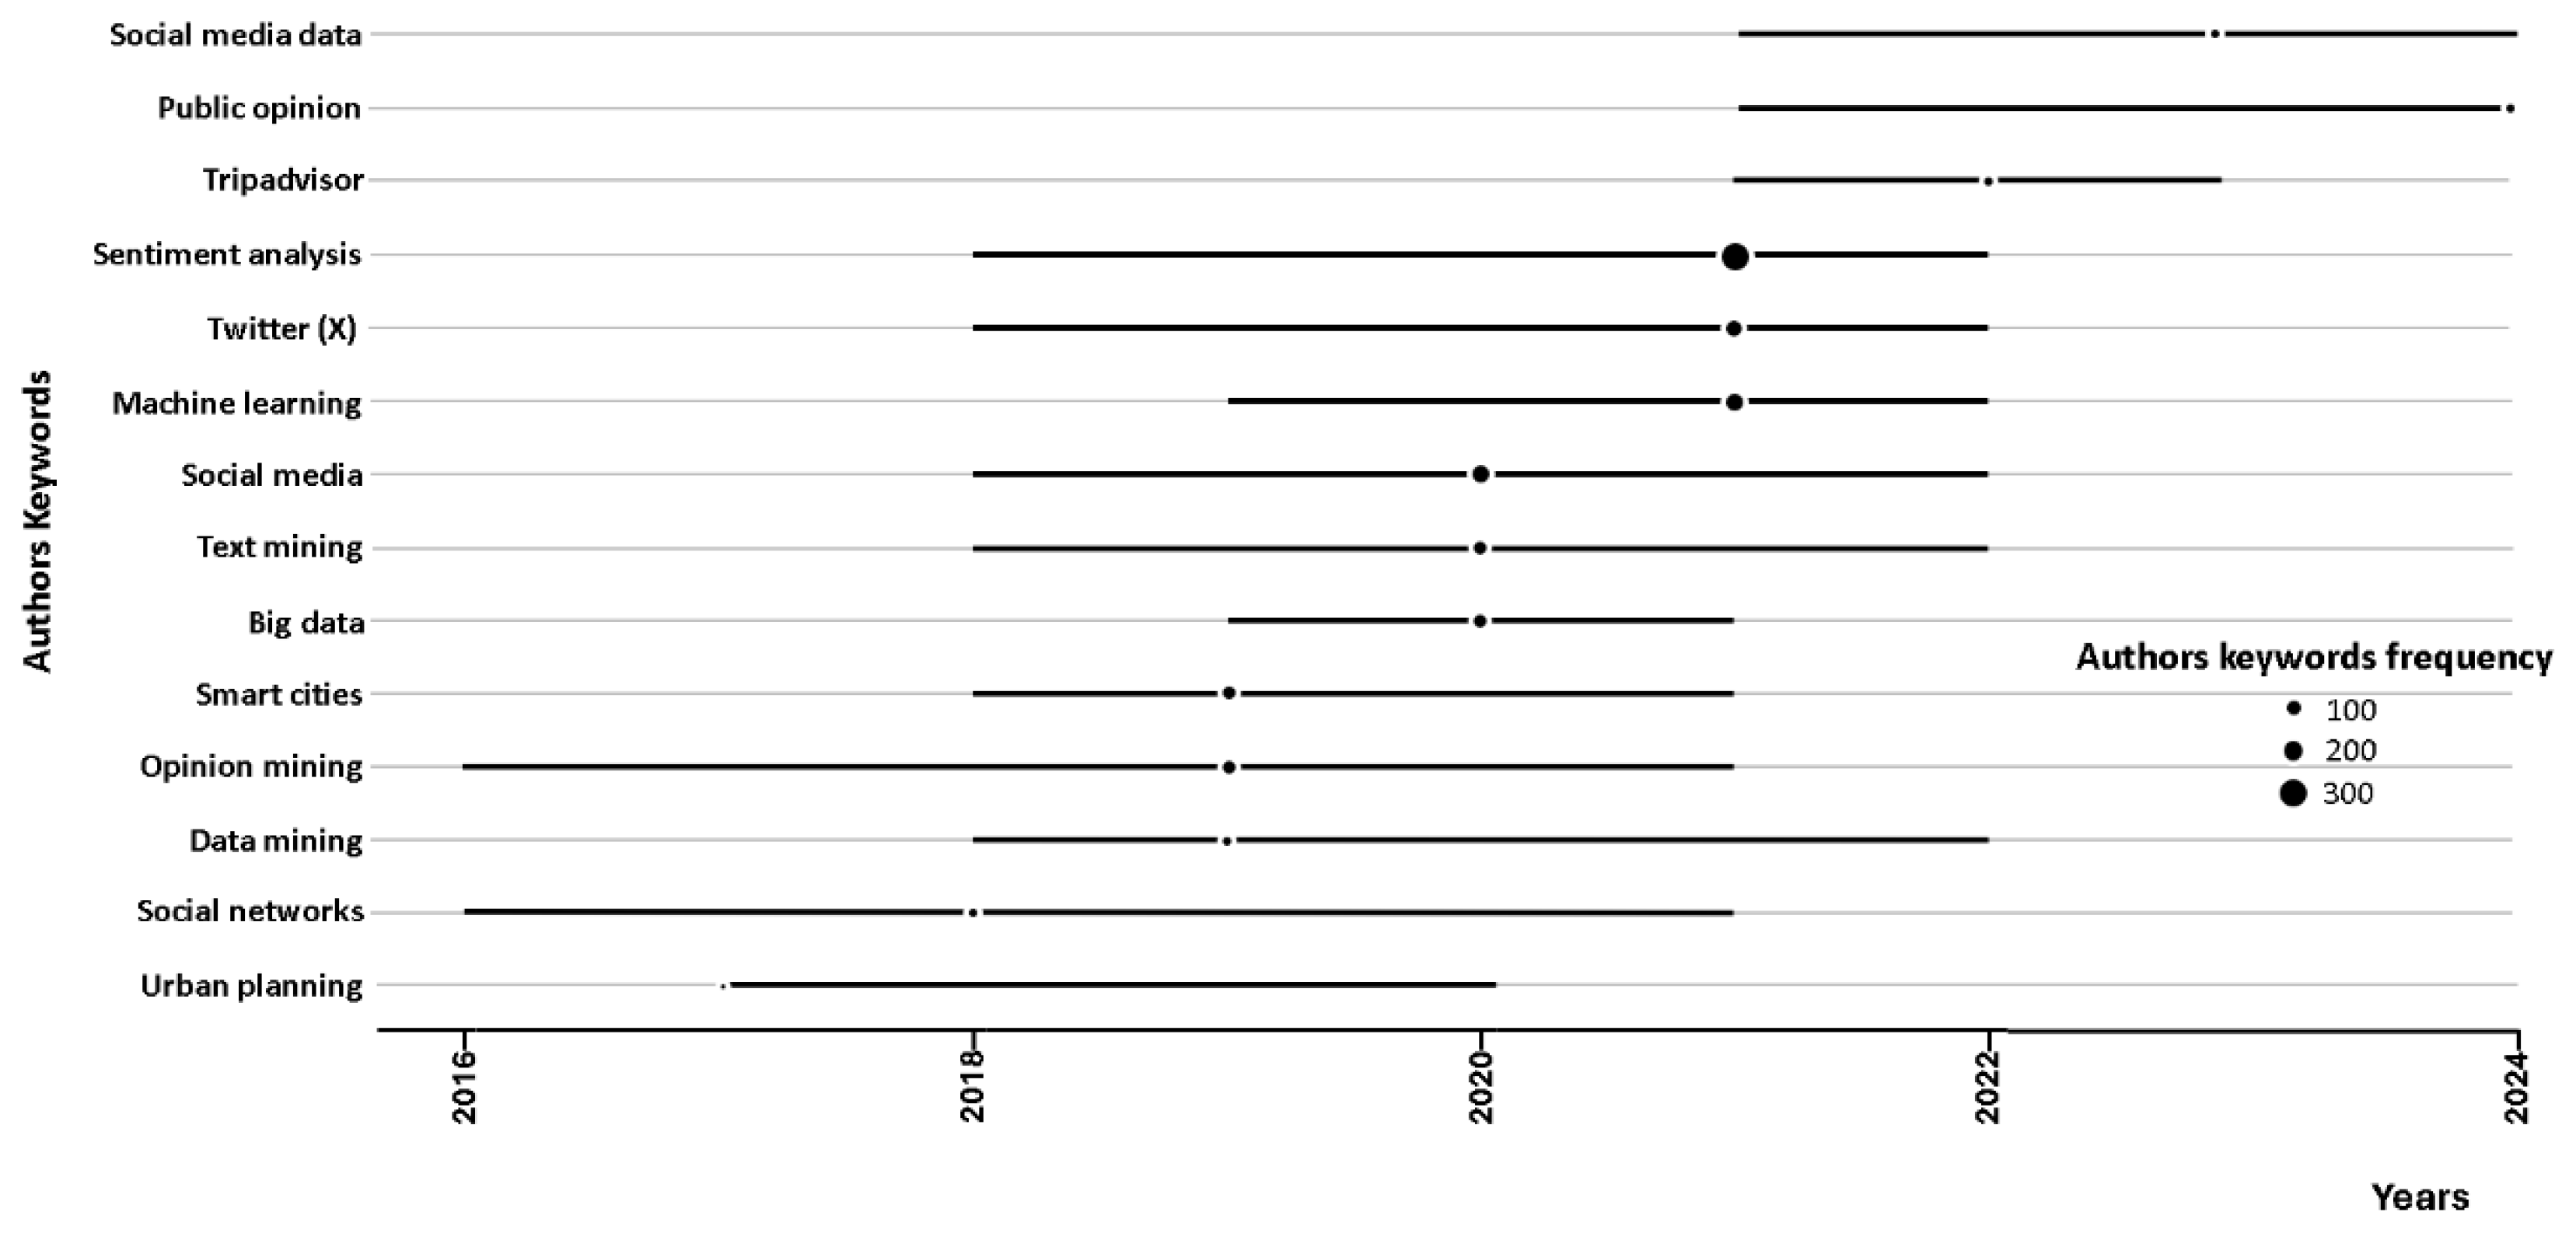
Figure 7.
Co-authorship analysis (countries).
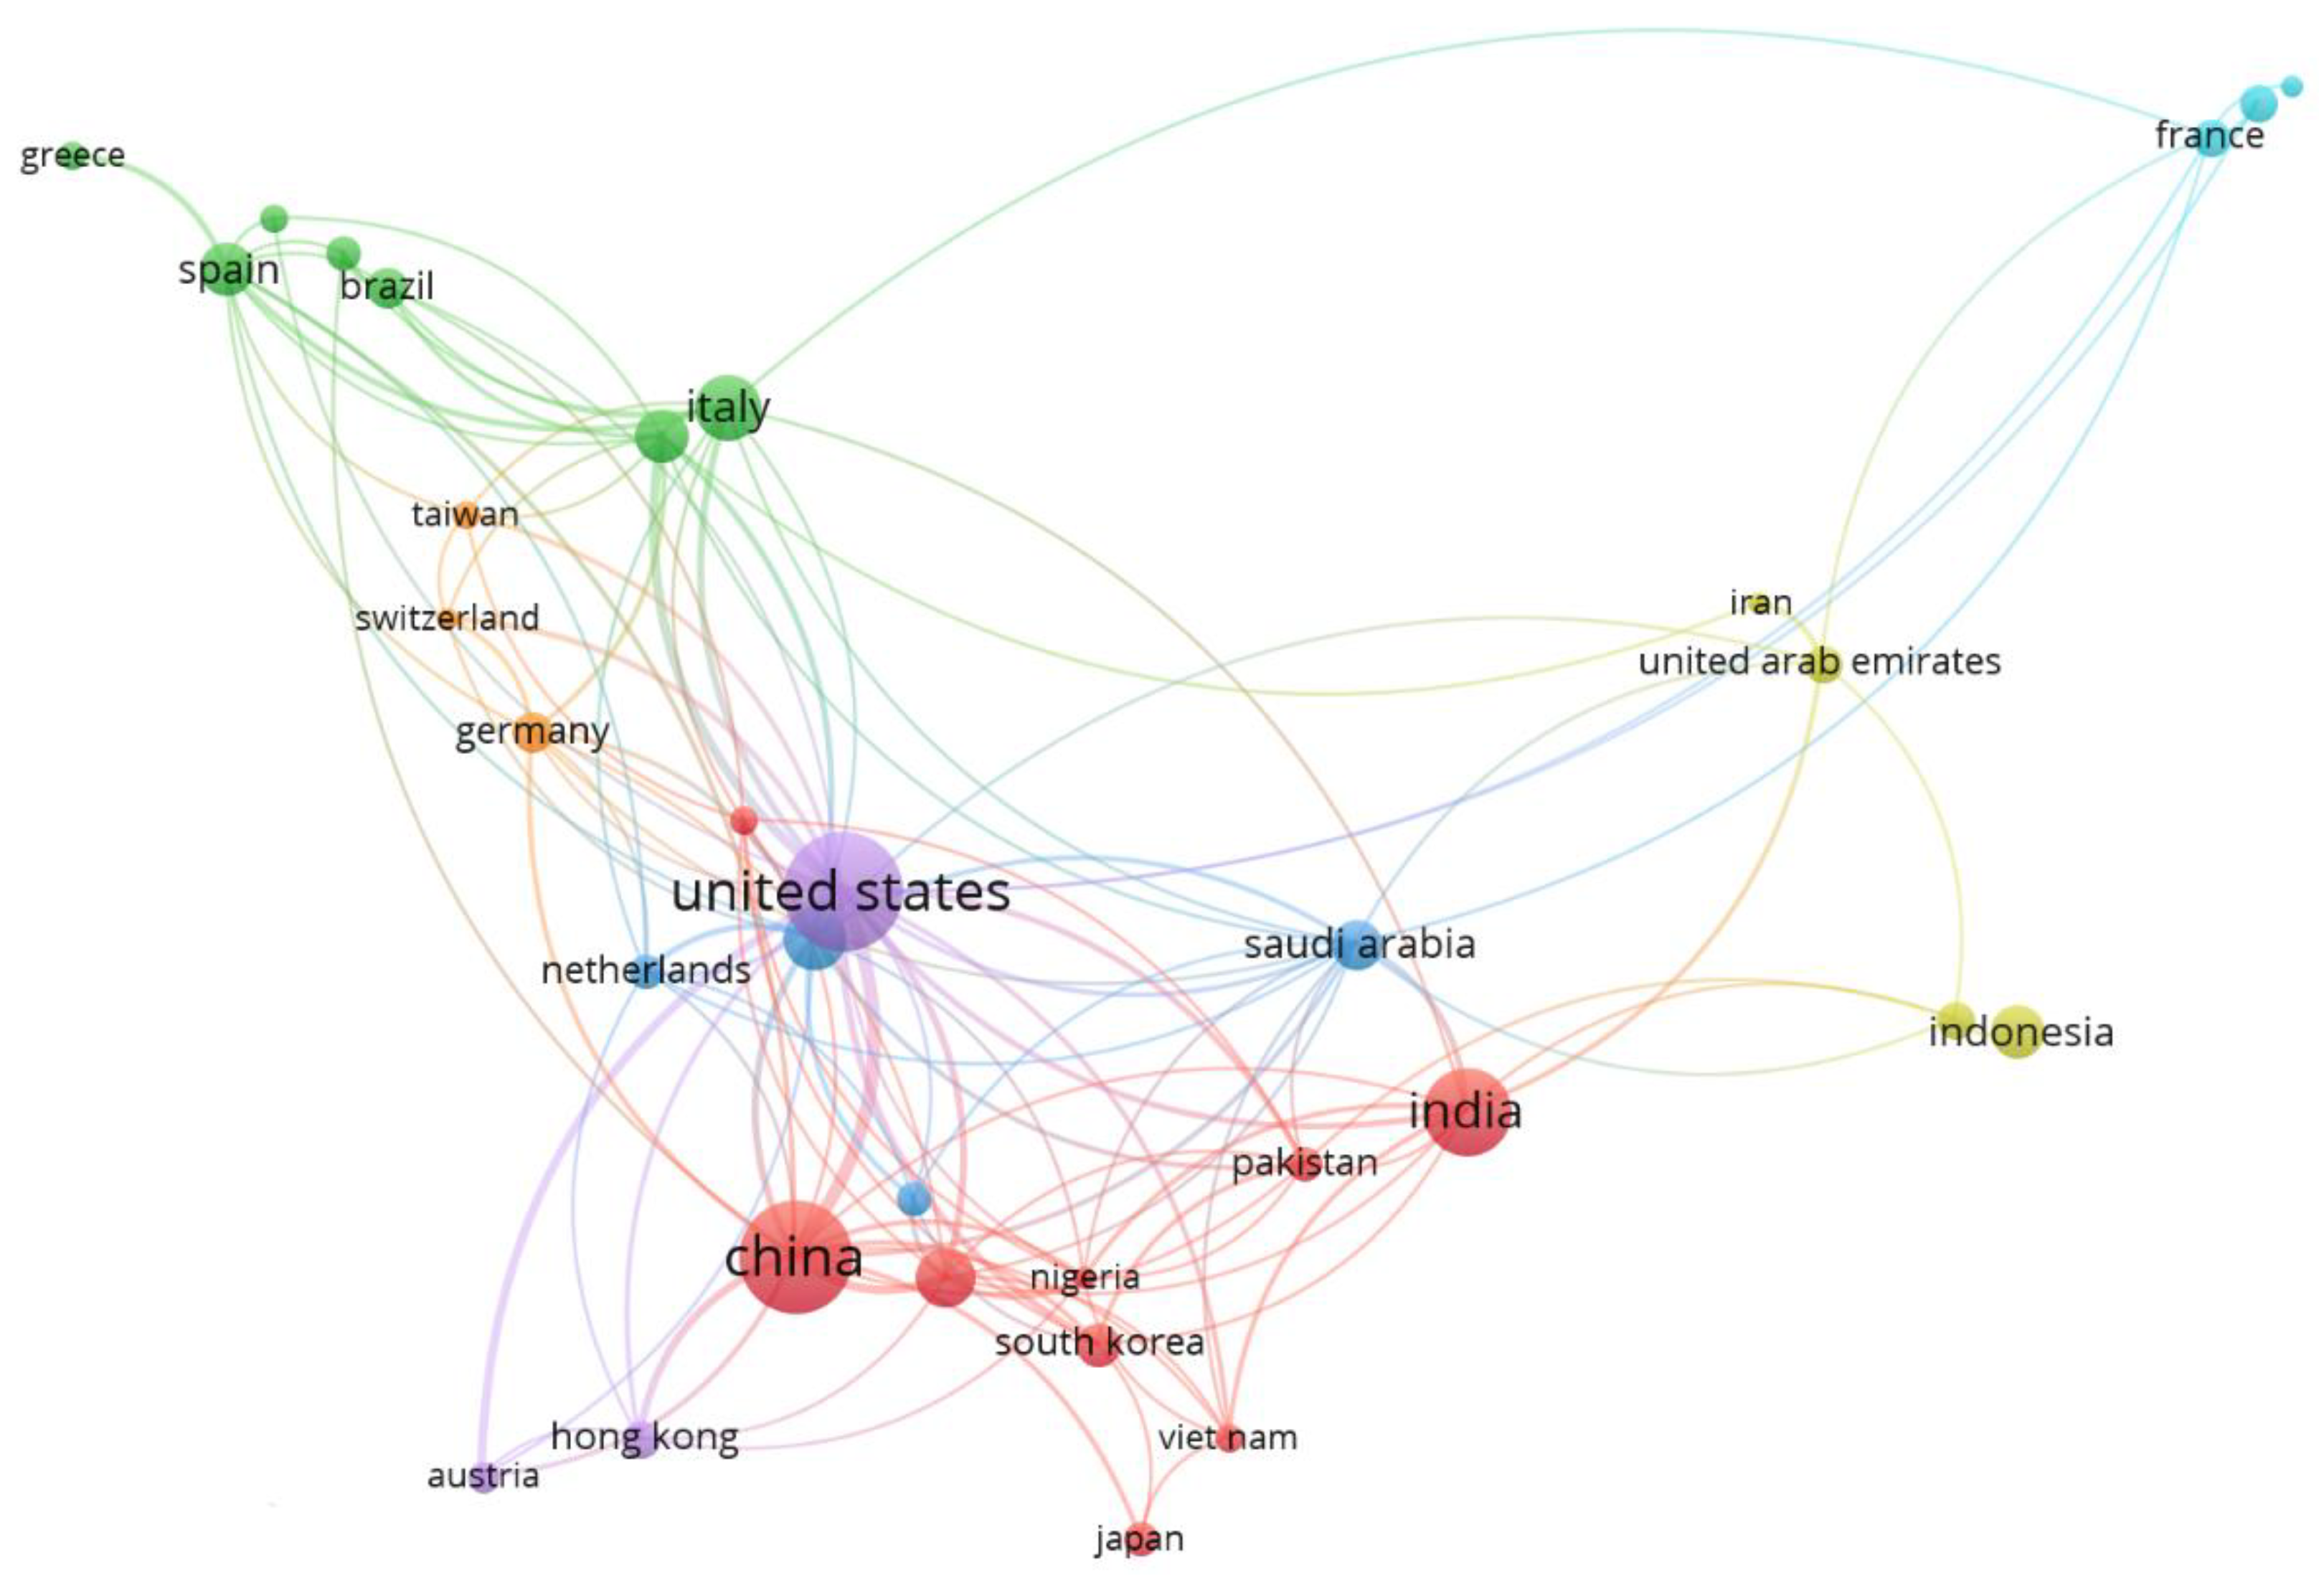

Table 1.
TOP 10 most globally cited documents (T: top; TC: total citations).
| Rank | Authors | Title | Year | TC | TC.yr-1 | Normalized TC | Source |
|---|---|---|---|---|---|---|---|
| 1 | Sara Hofmann Daniel Beverungen Michael Räckers Jörg Becker |
What makes local governments’ online communications successful? Insights from a multi-method analysis of Facebook | 2013 | 170 | 14.17 | 8.03 | Government Information Quarterly[42] |
| 2 | Minwoo Lee Miyoung Jeong Jongseo Lee |
Roles of negative emotions in customers’ perceived helpfulness of hotel reviews on a user-generated review website: A text mining approach | 2017 | 146 | 18.25 | 8.33 | International Journal of Contemporary Hospitality Management[43] |
| 3 | Rodrigo Barbado Oscar Araque Carlos A. Iglesias |
A framework for fake review detection in online consumer electronics retailers | 2019 | 130 | 21.67 | 10.33 | Information Processing & Management[44] |
| 4 | M. Rosario González-Rodríguez Rocio Martínez-Torres Sergio Toral |
Post-visit and pre-visit tourist destination image through eWOM sentiment analysis and perceived helpfulness | 2016 | 118 | 13.11 | 11.17 | International Journal of Contemporary Hospitality Management [45] |
| 5 | Junaid Shuja Eisa Alanazi Waleed Alasmary Abdulaziz Alashaikh |
COVID-19 open source data sets: a comprehensive survey | 2021 | 110 | 27.50 | 17.09 | Applied Intelligence[46] |
| 6 | Staci M. Zavattaro P. Edward French Somya D. Mohanty |
A sentiment analysis of U.S. local government tweets: The connection between tone and citizen involvement | 2015 | 109 | 10.90 | 6.48 | Government Information Quarterly [47] |
| 7 | Danny Valdez Marijn ten Thij Krishna Bathina Lauren A Rutter Johan Bollen |
Social Media Insights into US Mental Health During the COVID-19 Pandemic: Longitudinal Analysis of Twitter Data | 2020 | 106 | 21.20 | 12.28 | Journal Of Medical Internet Research [48] |
| 8 | Tianyi Wang Ke Lu Kam Pui Chow Qing Zhu |
COVID-19 Sensing: Negative Sentiment Analysis on social media in China via BERT Model | 2020 | 101 | 20.20 | 11.70 | IEEE Access [49] |
| 9 | Farman Ali Daehan Kwak Pervez Khan S.M. Riazul Islam Kye Hyun Kim K.S. Kwak |
Fuzzy ontology-based sentiment analysis of transportation and city feature reviews for safe traveling | 2017 | 101 | 12.63 | 5.76 | Transportation Research Part C [50] |
| 10 | Xinyu Chen Youngwoon Cho Suk young Jang |
Crime Prediction Using Twitter Sentiment and Weather | 2015 | 90 | 9.00 | 5.35 | 2015 Systems & Information Engineering Design Symposium [51] |
Table 2.
TOP 10 most locally cited references (T: top; TC: total citations).
| T | Authors | Article | Year | TC | TC.yr-1 | Source |
|---|---|---|---|---|---|---|
| 1 | Bo Pang Lillian Lee |
Opinion mining and sentiment analysis | 2008 | 21 | 1.24 | Foundations and Trends in Information Retrieval [52] |
| 2 | Lewis Mitchell Morgan R. Frank Kameron Decker Harris Peter Sheridan Dodds Christopher M. Danforth |
The geography of happiness: Connecting twitter sentiment and expression, demographics, and objective characteristics of place | 2013 | 14 | 1.17 | PLOS ONE [53] |
| 3 | David M. Blei Andrew Y. Ng Michael I. Jordan |
Latent Dirichlet Allocation | 2003 | 13 | 0.59 | Journal of Machine Learning Research [54] |
| 4 |
Johan Bollen Huina Mao Xiaojun Zeng |
Twitter mood predicts the stock market | 2011 | 11 | 0.79 | Journal of Computational Science [55] |
| 5 | Bing Liu | Sentiment analysis and opinion mining | 2022 | 11 | 3.67 | Synthesis Lectures on Human Language Technologies [56] |
| 6 | Bing Liu Lei Zhang |
A Survey of Opinion Mining and Sentiment Analysis | 2012 | 10 | 0.77 | Mining Text Data [57] |
| 7 | Walaa Medhat Ahmed Hassan Hoda Korashy |
Sentiment analysis algorithms and applications: A survey |
2014 | 10 | 0.91 | Ain Shams Engineering Journal [24] |
| 8 | Zheng Xiang Qianzhou Du Yufeng Ma Weiguo Fan |
A comparative analysis of major online review platforms: Implications for social media analytics in hospitality and tourism | 2017 | 9 | 1.13 | Tourism Management [58] |
| 9 | Stephen W. Litvin Ronald E. Goldsmith Bing Pan |
Electronic word-of-mouth in hospitality and tourism management | 2008 | 8 | 0.47 | Tourism Management [59] |
| 10 | Takeshi Sakaki Makoto Okazaki Yutaka Matsuo |
Earthquake shakes Twitter users: real-time event detection by social sensors | 2010 | 8 | 0.53 | WWW’10: Proceedings of the 19th international conference on World wide web [60] |
Table 3.
TOP 10 authors’ local impact (T: top; TC: total citations; NP: number of publications; PY_start: start publication year).
Table 3.
TOP 10 authors’ local impact (T: top; TC: total citations; NP: number of publications; PY_start: start publication year).
| Rank | Author | g-index | h-index | TC | NP | PY_start |
|---|---|---|---|---|---|---|
| 1 | Alkhatib, Manar | 6 | 3 | 45 | 7 | 2019 |
| 2 | Wang, Yan | 4 | 4 | 93 | 4 | 2019 |
| 3 | El Barachi, May | 4 | 3 | 41 | 4 | 2020 |
| 4 | Resch, Bernd | 4 | 3 | 119 | 4 | 2018 |
| 5 | Hollander, Justin B. | 4 | 2 | 20 | 5 | 2017 |
| 6 | Mathew, Sujith | 4 | 2 | 28 | 4 | 2020 |
| 7 | Oroumchian, Farhad | 4 | 2 | 40 | 4 | 2019 |
| 8 | Sykora, Martin | 3 | 3 | 97 | 3 | 2017 |
| 9 | Varde, Aparna S. | 3 | 3 | 44 | 3 | 2018 |
| 10 | Shankardass, Ketan | 3 | 3 | 97 | 3 | 2017 |
Table 4.
TOP 10 corresponding authors’ countries (T: top; NA: number of articles; SCP: single country publication; MCP: multi-country publication; MCP_Ratio; TC: total citations; AAC: average citations per article).
Table 4.
TOP 10 corresponding authors’ countries (T: top; NA: number of articles; SCP: single country publication; MCP: multi-country publication; MCP_Ratio; TC: total citations; AAC: average citations per article).
| Rank | Country (n = 58) | NA | SCP | MCP | Frequence | MCP Ratio | TC | AAC |
|---|---|---|---|---|---|---|---|---|
| 1 | China | 80 | 57 | 23 | 0.110 | 0.287 | 322 | 4 |
| 2 | USA | 55 | 39 | 16 | 0.076 | 0.291 | 1060 | 19.3 |
| 3 | India | 26 | 25 | 1 | 0.036 | 0.038 | 70 | 2.7 |
| 4 | United Kingdom | 15 | 8 | 7 | 0.021 | 0.467 | 158 | 10.5 |
| 5 | Australia | 13 | 11 | 2 | 0.018 | 0.154 | 97 | 7.5 |
| 6 | Spain | 13 | 7 | 6 | 0.018 | 0.462 | 374 | 28.8 |
| 7 | Italy | 11 | 11 | 0 | 0.015 | 0.000 | 73 | 6.6 |
| 8 | Canada | 10 | 4 | 6 | 0.014 | 0.600 | 91 | 9.1 |
| 9 | Indonesia | 10 | 10 | 0 | 0.014 | 0.000 | 35 | 3.5 |
| 10 | South Corea | 10 | 5 | 5 | 0.014 | 0.500 | 234 | 23.4 |
Table 5.
Top 10 sources’ local impact (T: top; TC: total citations; NP: number of publications; PY_start: year of first publication).
Table 5.
Top 10 sources’ local impact (T: top; TC: total citations; NP: number of publications; PY_start: year of first publication).
| Rank | Source | g-index | h-index | TC | NP | PY_start |
|---|---|---|---|---|---|---|
| 1 | International Journal of Environmental Research and Public Health | 12 | 6 | 147 | 15 | 2018 |
| 2 | Cities | 10 | 6 | 146 | 10 | 2017 |
| 3 | Lecture Notes in Computer Science (including subseries Lecture Notes in Artificial Intelligence and Lecture Notes in Bioinformatics) | 10 | 6 | 136 | 44 | 2012 |
| 4 | Sustainability (Switzerland) | 7 | 4 | 55 | 14 | 2019 |
| 5 | Sustainable Cities and Society | 6 | 6 | 150 | 6 | 2019 |
| 6 | Journal of Medical Internet Research | 6 | 4 | 154 | 6 | 2019 |
| 7 | IEEE Access | 6 | 3 | 182 | 6 | 2017 |
| 8 | 2018 IEEE SmartWorld | 6 | 2 | 65 | 6 | 2018 |
| 9 | CEUR Workshop Proceedings | 5 | 2 | 32 | 8 | 2013 |
| 10 | ISPRS International Journal of Geo-Information | 5 | 2 | 59 | 5 | 2018 |
Table 6.
TOP 10 funding sponsor (NP: number of publications).
| rank | Funding sponsor (n = 159) | NP | Percentage (%) |
|---|---|---|---|
| 1 | National Natural Science Foundation of China | 42 | 5.07 |
| 2 | National Science Foundation | 13 | 1.57 |
| 3 | Horizon 2020 Framework Program | 9 | 1.09 |
| 4 | European Commission | 8 | 0.97 |
| 5 | Fundamental Research Funds for the Central Universities | 7 | 0.84 |
| 6 | National Office for Philosophy and Social Sciences | 7 | 0.84 |
| 7 | Coordenação de Aperfeiçoamento de Pessoal de Nível Superior | 6 | 0.72 |
| 8 | Fundação para a Ciência e a Tecnologia | 6 | 0.72 |
| 9 | China Scholarship Council | 5 | 0.60 |
| 10 | Engineering and Physical Sciences Research Council | 5 | 0.60 |
Table 7.
Top 10 affiliation (NP: number of publications).
| T | Institution (n = 160) | Country | NP | (%) |
|---|---|---|---|---|
| 1 | Chinese Academy of Sciences | China | 9 | 1.96 |
| 2 | British University in Dubai | United Arab Emirates | 8 | 1.74 |
| 3 | University of Melbourne | Australia | 7 | 1.53 |
| 4 | Tongji University | China | 7 | 1.53 |
| 5 | University of Florida | USA | 6 | 1.31 |
| 6 | University of Toronto | Canada | 6 | 1.31 |
| 7 | Wuhan University | China | 6 | 1.31 |
| 8 | University of Wollongong in Dubai | United Arab Emirates | 6 | 1.31 |
| 9 | Ministry of Education China | China | 5 | 1.09 |
| 10 | The University of Hong Kong | China | 5 | 1.09 |
Disclaimer/Publisher’s Note: The statements, opinions and data contained in all publications are solely those of the individual author(s) and contributor(s) and not of MDPI and/or the editor(s). MDPI and/or the editor(s) disclaim responsibility for any injury to people or property resulting from any ideas, methods, instructions or products referred to in the content. |
© 2026 by the authors. Licensee MDPI, Basel, Switzerland. This article is an open access article distributed under the terms and conditions of the Creative Commons Attribution (CC BY) license.
Copyright: This open access article is published under a Creative Commons CC BY 4.0 license, which permit the free download, distribution, and reuse, provided that the author and preprint are cited in any reuse.


