
Submitted:
01 January 2026
Posted:
04 January 2026
You are already at the latest version
Abstract
Additive manufacturing is increasingly used in construction, yet reliable quality assurance for 3D-printed concrete elements remains a major challenge. Existing digital defect-detection methods, particularly voxel-based and mesh-based approaches, are often evaluated separately, which limits understanding of their relative capabilities for construction-scale inspection. This study establishes a controlled comparison of the two representations using identical scan-to-design data, consistent preprocessing, and unified defect thresholding. A voxel pipeline employing signed distance fields and a three-dimensional convolutional neural network, and a mesh pipeline using triangular surface reconstruction, geometric surface descriptors, and MeshCNN, were applied to structured-light scans of printed clay wall segments containing intentional voids, material buildup, and layer-height inconsistencies. Across common performance metrics, voxel-based methods showed superior detection of volumetric and subsurface defects, while mesh-based methods achieved more precise localization of surface irregularities with substantially lower computational cost in runtime and memory. These results clarify representation-dependent trade-offs and provide guidance for selecting appropriate inspection pipelines in extrusion-based construction. The findings establish a construction-oriented benchmark for digital defect detection and support more efficient, reliable, and scalable quality-assurance workflows for sustainable additive manufacturing.
Keywords:
digital defect detection
; 3D concrete printing
; voxel and mesh representation
1. Introduction
Additive manufacturing (AM), particularly extrusion-based three-dimensional concrete printing (3DCP), is transforming construction by enabling rapid, customizable, and cost-effective fabrication of structural and architectural elements [1]. The technique is especially promising for modular and affordable housing [2]. Clay-based composites have gained attention as printable materials due to their workability, environmental sustainability, and low embodied carbon [3,4]. However, their rheological sensitivity to moisture, shrinkage, and heterogeneity introduces variability that affects geometric fidelity and surface quality [5]. Defects such as voids, material buildup, and layer-height inconsistency weaken structural performance and reduce finish quality, motivating the need for reliable digital inspection methods tailored to clay extrusion.
Although progress has been made in hardware and process monitoring, quality assurance in 3DCP remains largely manual and is often insufficient for detecting subtle or internal defects in large printed elements [7]. Existing automated detection systems vary in reliability depending on the geometric representation used to interpret scan data [8]. Consequently, practitioners lack clear guidance on which representation offers dependable performance across different defect types and printing conditions. This challenge is magnified in construction workflows where inspection must balance accuracy, scalability, and robustness to material and environmental variability [9].
Defect detection fundamentally depends on how the scanned geometry is represented. Voxel-based approaches, often combined with three-dimensional convolutional neural networks, support volumetric analysis of internal and subsurface defects [10]. Mesh-based approaches, which rely on geometric descriptors or graph-based networks such as MeshCNN, provide high-fidelity surface characterization [11]. Prior research has typically evaluated these representations independently using different datasets, preprocessing procedures, and metrics, which limits meaningful comparison and obscures representation-dependent strengths and limitations [12]. The lack of standardized evaluation constitutes a critical gap for construction-oriented quality assurance.
This study addresses that gap by developing and evaluating two digital defect-detection pipelines under identical experimental conditions. A voxelized signed-distance-field representation processed by a three-dimensional convolutional neural network is compared with a mesh-based pipeline that incorporates triangular surface reconstruction, geometric descriptors, and MeshCNN. Both are applied to structured-light scans of 3D-printed clay wall segments containing intentional voids, material buildup, and layer-height inconsistencies, using the same scan-to-design dataset, preprocessing steps, and thresholding criteria [5,16,18].
The objectives of this study are to: (1) establish a unified evaluation framework for voxel-based and mesh-based digital defect detection for construction-scale additive manufacturing; (2) quantify and contrast their performance in detecting internal and surface-level defects using accuracy, localization precision, computational efficiency, and robustness to scan noise as evaluation criteria; and (3) provide practical guidance for selecting appropriate inspection pipelines according to defect type and operational constraints relevant to post-process inspection. The scope is limited to post-process digital analysis of extrusion-based clay printing and does not include mechanical testing or real-time monitoring.
The contributions of this work are threefold. First, it presents the first controlled comparison of voxel-based and mesh-based defect detection for extrusion-printed clay elements, addressing a key gap in the literature. Second, it reveals systematic trade-offs between volumetric and surface-based representations in terms of detection reliability, localization capability, computational cost, and sensitivity to noise [16,17,20,21,22]. Third, it translates these findings into decision-oriented guidance for practical inspection workflows and establishes a foundation for future integration with real-time monitoring and autonomous quality-control systems [23,24,25].
2. Related Works
Research on digital defect detection in additive manufacturing has advanced along two primary methodological paths distinguished by the geometric representations used for analysis. One path employs volumetric voxel-based models, often integrated with three-dimensional convolutional neural networks, to capture internal and subsurface defects. The other path uses surface-based mesh representations to analyze geometric deviations and surface irregularities. Although each has demonstrated value, they have typically been developed and evaluated independently across different datasets, inspection conditions, and evaluation metrics. The following subsections summarize representative work in both categories and highlight the need for unified comparison methodologies.
2.1. Voxel-Based Approaches
Voxel-based methods are widely used for volumetric inspection and porosity analysis, particularly when paired with 3D CNNs [13,18,19]. Iuso et al. (2023) developed a voxel-wise porosity classifier trained on synthetic CT datasets, though generalizability to real structured-light scans remains uncertain [13]. Otto (2024) proposed a voxel-based reconstruction framework for porous structures but did not address geometric deformation effects common in construction-scale printing [18]. Bidkhori et al. (2022) explored resolution-dependent classification trade-offs for porosity monitoring, underscoring the computational burden inherent to volumetric models [19]. More recent work by George et al. (2024) integrated process, sensor, and CT data for porosity prediction in L-PBF components, achieving promising results yet requiring improved robustness for broader adoption [26]. Studies by Sun et al. (2024) and Poudel et al. (2022) further emphasized that voxel size strongly influences defect detectability and morphology estimation, particularly for sub-millimeter-scale defects [27,28].
2.2. Mesh-Based Approaches
Mesh-based strategies maintain fine surface detail and are therefore well suited for surface-defect localization. Hanocka et al. (2019) introduced MeshCNN, a pioneering edge-based learning architecture for triangular meshes [14], later adapted for medical and engineering applications [20]. Improvements in mesh repair, such as removal of overlapping or inconsistent elements, have enabled more reliable defect analysis in downstream algorithms [29]. Charia et al. (2025) employed combined optical and thermal imaging to detect surface anomalies during FDM printing [30]. Ye et al. (2023) used multi-view scans aligned with CAD models to identify geometric deviations [31]. Su et al. (2025) demonstrated enhanced surface-defect detection by pairing polarization-based imaging with YOLO-V5W, improving accuracy in visually challenging environments [32].
2.3. Comparative and Hybrid Studies
Comparative or hybrid inspection frameworks have been proposed but remain limited in scope. Carstensen et al. (2023) and Wolfs (2023) advocated integrating volumetric and surface-based inspection methods to capture a broader range of defects, although their analyses were conceptual rather than experimentally benchmarked [8,22]. Deshpande et al. (2024) and Saimon et al. (2024) demonstrated deep-learning-based defect detection but focused primarily on 2D segmentation or CT-driven inspection rather than design-to-scan comparison using structured-light data [23,24]. Petrich et al. (2023) introduced a saliency-based voxel clustering approach for CT-driven defect detection but did not incorporate surface-based pipelines [25]. Broader reviews, such as those by Peng (2023) and Fan et al. (2024), surveyed sensing and monitoring approaches for metal AM or optical systems but did not compare voxel and mesh representations under unified experimental conditions [10,15,33]. Recent AI-driven defect detection systems for metal AM, such as those by Akmal et al. (2025) and Yin et al. (2025), achieved high accuracy yet did not evaluate voxel and mesh pipelines side-by-side nor apply structured-light scans representative of construction-scale extrusion [34,35].
Additional work on non-destructive testing and in-situ monitoring, including XCT-based critical defect analysis, selective laser melting (SLM) process reviews, and thermal- or vision-based CNN classification frameworks, further demonstrates the potential of AI-enabled, sensor-rich inspection pipelines across metal additive manufacturing [36,37,38,39].
Although voxel-based and mesh-based pipelines have individually matured, prior studies have evaluated them under differing datasets, resolutions, defect definitions, and performance measures, making cross-study comparison unreliable. The absence of controlled experimental benchmarking limits understanding of their respective strengths, weaknesses, and suitability for construction-scale additive manufacturing. This is particularly important for the extrusion of clay or concrete, where defects vary in scale, morphology, and visibility. To enable meaningful comparison, both geometric representations must be assessed under identical conditions, using aligned scan-to-design data, consistent preprocessing, and unified evaluation metrics.
To address this need, the present study applies a voxel-based pipeline (signed-distance fields with 3D-CNN analysis) and a mesh-based pipeline (triangular reconstruction with geometric descriptors and MeshCNN) to identical structured-light scans of 3D-printed clay wall segments containing intentional voids, material buildups, and layer-height inconsistencies. Both methods are evaluated under consistent preprocessing, thresholding, and accuracy, localization, computational-efficiency, and noise-robustness criteria, enabling a rigorous assessment of their relative capabilities for construction-scale inspection.
3. Methodology
The experimental workflow was designed for a controlled comparison of voxel-based and mesh-based digital defect-detection approaches. The workflow consisted of four sequential stages: (i) fabrication of clay-based wall specimens that contained intentionally introduced geometric defects, (ii) high-resolution structured-light scanning and preprocessing to produce aligned point cloud, mesh, and voxel representations, (iii) implementation of two independent defect-detection pipelines based on voxel and mesh geometry, and (iv) standardized comparative evaluation using consistent datasets, normalization steps, and performance metrics. This structure ensured that all performance differences resulted from the geometric representations rather than from variations in scanning, preprocessing, or alignment.
3.1. Preparation of Test Specimens with Controlled Defects
Clay-based wall specimens were fabricated using an extrusion-style 3D printing process to create a controlled dataset representative of construction-scale elements. Each specimen measured approximately 300 mm in height, 200 mm in width, and 50 mm in depth. The reference CAD model of each specimen was first sliced to generate the toolpath used for printing. The sliced representation, illustrated in Figure 1, provided a basis for both fabrication planning and later design-to-scan alignment.
Three geometric defects were intentionally introduced during printing: over-extrusion bulges, under-extrusion voids, and irregular layer heights. A representative printed specimen containing these intentionally induced anomalies is shown in Figure 2. These known defects served as ground truth for subsequent evaluation.
After printing, specimens were stored for 48 hours at 22 °C under ambient humidity to stabilize their geometry. High-resolution structured-light scanning with accuracy of 100 micrometers or better was then used to digitize each specimen. Point clouds were filtered to remove noise, and consistent scanning conditions were maintained to ensure repeatability. Table 1 summarizes the geometric and scanning characteristics of the dataset.
3.2. Voxel-Based Pipeline
The voxel-based pipeline converted the structured-light point clouds into volumetric grids of 128 × 128 × 128 resolution aligned to the CAD coordinate system. Signed distance fields (SDFs) were computed so that each voxel stored the shortest distance to the nearest surface, with the sign indicating interior or exterior location. This representation enabled volumetric comparison between the scanned and reference geometries.
Defects were identified through voxel-wise classification using a 3D convolutional neural network (3D CNN). Training labels were generated by comparing SDF values between the scan and CAD model. To distinguish normal geometric variation from true anomalies, a percentile-based thresholding strategy was applied. As illustrated in Figure 3, deviations falling below the 5th percentile were labeled as void-related under-extrusion, while deviations above the 95th percentile were labeled as buildup-related over-extrusion. Values within the central 90% band represented normal geometric variability.
Performance of the voxel-based method was quantified using voxel-level accuracy, precision, recall, and F1-score, evaluated against manually annotated ground truth. Computational efficiency was assessed by measuring inference time per specimen and GPU memory consumption across multiple resolutions (64³, 128³, 256³). Noise robustness was evaluated by injecting perturbations into the scans and analyzing the stability of classification outputs.
3.3. Mesh-Based Pipeline
For the mesh-based pipeline, triangular surface meshes were reconstructed from the point clouds using the trimesh library. Mesh alignment to the CAD design was performed with the Iterative Closest Point (ICP) algorithm to minimize rigid-body misalignment. Defect localization was then carried out in two stages: (1) global deviation analysis using point-to-surface distances, and (2) local anomaly detection using discrete Gaussian curvature. Regions with deviations beyond tolerance or abnormally high curvature were flagged as defective.
Mesh method performance was evaluated through accuracy and F1-score against annotated defect zones. Computational metrics included average processing time and memory usage, with special attention to ICP alignment and curvature analysis. Robustness to scanning noise was tested by perturbing vertex positions and applying mesh smoothing. Scalability was assessed by applying the pipeline to meshes of varying resolutions to simulate construction-scale datasets.
3.4. Comparative Analysis Setup and Evaluation Protocol
Both pipelines were applied to the same structured-light scan of a clay-printed wall segment, containing approximately 1.8 million mesh vertices and a voxel grid with 0.3 mm pitch. Curvature fields were computed using discrete Gaussian curvature on the mesh and a 3D Sobel operator in the voxel grid. Curvature values were normalized, and defects were identified using a consistent percentile-based threshold of the top 5% of curvature values.
This unified evaluation protocol ensured that observed performance differences reflected the inherent properties of voxel-based and mesh-based representations rather than differences in preprocessing or evaluation methods.
4. Results
Under the controlled comparison protocol described in the Methodology, both voxel-based and mesh-based pipelines demonstrated reliable detection of high-curvature regions associated with intentional geometric defects. The following subsections present quantitative and qualitative analyses that compare the performance of the two representation methods under consistent conditions.
This section may be divided by subheadings. It should provide a concise and precise description of the experimental results, their interpretation, as well as the experimental conclusions that can be drawn.
4.1. Comparative Performance Analysis of Detection Methods
Both voxel-based and mesh-based approaches detected high-curvature regions associated with geometric anomalies. Defective regions were defined using a 95 percent curvature threshold for each method. This threshold was selected after sensitivity analysis between the 90 percent and 98 percent cutoffs. Thresholds below 90 percent failed to capture subtle but important defect signatures, while thresholds above 98 percent became overly sensitive to noise. Each curvature distribution was normalized to a [0, 1] scale so thresholding would remain consistent despite differences in resolution between voxel and mesh models.
Using the 95 percent cutoff, the mesh method identified 93,906 defective vertices, while the voxel method identified 68,877 defective voxels. These numerical differences reflect the higher density of mesh vertices relative to voxel elements. The mesh method demonstrated higher sensitivity to fine surface irregularities due to its high spatial resolution, while the voxel method captured broader volumetric or layer-aligned anomalies that were more structurally significant.
A comparative summary of classification accuracy, defect localization performance, and computational efficiency is provided in Table 2.
4.2. Defect Type Sensitivity and Interpretability
Visual inspection showed that mesh-based detection highlighted sharp surface irregularities such as ridges, surface buildup, and abrupt curvature transitions. This behavior is consistent with its sensitivity to local curvature spikes. The voxel-based method highlighted continuous regions along curved toolpaths, which typically corresponded to under-extrusion, over-extrusion, or layer-height deviations. Voxel curvature values were distributed more evenly, indicating robustness to noise and suitability for detecting gradual geometric drift or distributed defects.
These differences show that mesh-based methods are suited to fine localized detection tasks, while voxel-based methods better capture volumetric or path-dependent anomalies.
4.3. Visualization and Qualitative Comparisons
To visually compare the methods, curvature-based defect distributions were plotted using a series of diagnostic figures. Figure 4 shows a boxplot of normalized curvature values detected by both pipelines.
A scatter plot of curvature values versus defect labels for both methods is shown in Figure 5, illustrating how defects cluster at higher curvature values.
To compare the aggressiveness of defect detection, the number of elements classified as defective using the 5 percent threshold was analyzed. Figure 6 displays this comparison.
Finally, curvature histograms for both methods are shown in Figure 7, validating the percentile thresholds used for classification.
4.4. Defect-Type-Specific Performance
Construction-scale inspection must address defects with distinct geometric signatures: internal voids, material buildup, and layer-height inconsistencies. These categories were evaluated separately using precision, recall, and F1-score. Results are presented in Table 3.
The results indicate that voxel-based analysis excels at detecting internal voids and distributed anomalies, while mesh-based detection is more effective for sharp material buildups and surface-level inconsistencies.
5. Discussion
5.1. Situations Where Voxel-Based Methods Are Preferable
Voxel-based methods are particularly advantageous in construction applications that require the detection of volumetric or internal defects such as voids, air pockets, or subsurface layer separation. These flaws often cannot be identified through visual inspection but can significantly reduce the load-bearing capacity and long-term durability of printed structural elements including walls, columns, and slabs. For construction-scale additive manufacturing, where safety margins and adherence to building codes are essential, the ability to identify internal anomalies with high reliability is a critical requirement.
From a methodological standpoint, voxel representations support the use of three-dimensional convolutional neural networks, which capture spatial relationships within a uniform grid and can detect subtle geometric deviations distributed throughout the volume. Signed distance field representations further strengthen sensitivity to fine deviations relative to the reference model, improving volumetric labeling accuracy.
In practice, voxel-based detection offers construction teams the ability to map, quantify, and verify defects before components are placed into service. This capability reduces rework, supports automated digital approval procedures, and enhances confidence in the structural performance of additively manufactured components. The volumetric nature of voxel grids also aligns naturally with CAD tools, finite element analysis workflows, and digital twins for as-built documentation. Although voxel-based inspection requires increased computational resources, its volumetric insight makes it especially well-suited for assessing safety-critical elements where defect tolerance is low and long-term performance is a priority.
5.2. Situations Where Mesh-Based Methods Are Preferable
Mesh-based methods, in contrast, are most effective when surface-level precision, visual clarity, and rapid inspection are required. Triangular mesh representations preserve fine surface detail with relatively low memory usage, making them ideal for on-site inspection, early-stage screening, and architectural surface quality evaluation. These methods capture small ridges, bulges, and layer-height irregularities with high resolution and can operate at speeds suitable for real-time workflows.
Academically, mesh methods are beneficial in low-data environments because geometric descriptors such as curvature or distance-to-CAD enable effective defect detection without the need for extensive labeled datasets. Practically, mesh representations integrate directly with photogrammetry, laser scanning, and structured-light systems commonly used in construction environments. The graphical nature of mesh data also supports intuitive visual review, allowing inspectors and engineers to quickly interpret defect locations and severity.
However, mesh-based inspection cannot reveal internal voids or subsurface anomalies, which limits its usefulness for structural integrity assessments. This makes mesh methods most appropriate for scenarios where the primary interest is surface accuracy or rapid pass–fail evaluation rather than complete volumetric assessment.
5.3. Representation Trade-Offs and Their Implications for Construction-Scale Inspection
The comparative results of this study highlight a fundamental representation-dependent trade-off. Mesh-based methods provide high-fidelity surface localization at low computational cost, enabling fast, visually interpretable inspection suitable for immediate post-print evaluation. Voxel-based methods provide volumetric observability that captures internal and distributed defects, supporting high-assurance inspection where structural reliability is essential.
These complementary strengths suggest a two-stage inspection workflow. Mesh-based screening can be performed on-site immediately after printing to identify elements that require attention. Voxel-based evaluation can then be applied selectively to components that must meet stringent structural acceptance thresholds before installation.
A synthesis of these representation trade-offs is presented in Table 4, which integrates the quantitative findings from Table 2 and Table 3 and summarizes implications for detection objectives, computational requirements, and deployment contexts.
Overall, the results indicate that mesh-based methods prioritize deployment speed and surface precision, while voxel-based methods offer comprehensive volumetric insight at higher computational cost. Together, these findings inform a representation-aware inspection strategy that supports both rapid field assessment and high-assurance structural evaluation in construction-scale additive manufacturing.
6. Conclusion
Additive manufacturing for construction-scale extrusion, including clay-based 3D printing, continues to gain interest for modular and sustainable building systems, but dependable quality assurance remains a major impediment to wider adoption. Common defects such as internal voids, material buildup, and layer-height inconsistency can compromise both structural integrity and surface quality, yet inspection practices remain predominantly manual and highly dependent on the geometric representation used during digital analysis. Because defect observability and localization are shaped by the choice of voxel or mesh representation, practitioners lack controlled evidence to guide method selection under consistent datasets and evaluation criteria.
This study addressed this gap by developing a unified comparison protocol and conducting a controlled, side-by-side evaluation of voxel-based (SDF with 3D-CNN) and mesh-based (triangular reconstruction with geometric descriptors and MeshCNN) defect-detection pipelines. Both methods were applied to identical structured-light scan–to–design datasets of 3D-printed clay wall segments containing intentionally embedded defects. Under identical preprocessing, normalization, and percentile-based thresholding, both pipelines successfully detected high-curvature anomaly regions, though their strengths diverged according to defect mechanisms and operational constraints. The voxel-based approach demonstrated stronger performance for volumetric and subsurface defects, with higher recall and F1-score for identifying internal voids and distributed under-extrusion. In contrast, the mesh-based approach achieved finer surface localization with lower mean localization error and substantially lower computational cost, making it more suitable for rapid inspection of visually accessible defects such as ridges, bulges, and layer-height irregularities.
The primary contribution of this work is the development of a construction-oriented benchmark that enables fair and reproducible comparison between voxel and mesh pipelines. The study clarifies representation-dependent trade-offs that directly inform inspection strategy: voxel-based representations provide volumetric observability that supports structural assurance, while mesh-based representations offer high-fidelity surface detail with significantly faster runtime and lower memory requirements. Together, these findings support decision-oriented method selection and motivate staged inspection workflows in which fast mesh-based screening is followed by higher-assurance voxel evaluation for safety-critical elements.
Several limitations should be acknowledged. The experiments were restricted to a single specimen geometry and a defined set of intentional defects; performance may vary for more complex geometries or natural defect formations. Sensitivity to voxel resolution, SDF thresholding, mesh reconstruction quality, and scan noise also introduces representation-specific variability. Moreover, this study focused on post-process detection using controlled structured-light scans and did not examine real-time processing, integration with feedback control, or relationships to mechanical acceptance criteria.
Future work will extend this benchmark to broader materials, larger components, and field-representative conditions including occlusions and environmental noise. Methodological advances such as adaptive-resolution voxelization, uncertainty quantification, and hybrid voxel–mesh fusion approaches represent promising avenues for improving both accuracy and efficiency. Integrating defect detection with in-situ sensing and printer feedback will further support the development of closed-loop quality-control systems capable of reducing rework and improving reliability in construction-scale additive manufacturing.
References
- Kim, J.-J.; et al. Extrusion-based additive manufacturing of concrete: A comprehensive review of processes, applications and challenges. Cement and Concrete Research 2023, 161, 106753. [Google Scholar] [CrossRef]
- Girskas, G. 3D concrete printing review: Equipment, materials, mix design, and applications. Buildings 2025, 15(12), 2049. [Google Scholar] [CrossRef]
- Ortega, G.; et al. 3D Claying: 3D printing and recycling clay. Crystals 2023, 13(3), 375. [Google Scholar] [CrossRef]
- Khan, M. Recent developments on low-carbon 3D printing concrete. Journal of Cleaner Production 2024, 400, 136702. [Google Scholar] [CrossRef]
- Rehman, A. U.; et al. 3D concrete printing: A systematic review of rheology. Applied Sciences 2021, 11(22), 10420. [Google Scholar] [CrossRef]
- Wangler, T.; et al. Digital concrete: A review. Cement and Concrete Research 2020, 133, 106036. [Google Scholar] [CrossRef]
- Mawas, K.; Maboudi, M.; Gerke, M. A review on geometry and surface inspection in 3D concrete printing. arXiv 2025. [Google Scholar] [CrossRef]
- Wolfs, R. On-line and in-line quality assessment across all scale levels of 3D concrete printing. Cement and Concrete Research 2023, 172, 107163. [Google Scholar] [CrossRef]
- Labonnote, N.; et al. Additive construction: State-of-the-art, challenges and opportunities. Automation in Construction 2016, 72, 347–366. [Google Scholar] [CrossRef]
- Bajwa, A. U. R.; et al. Sustainability of 3D construction printing technology: A review of research trends. Sustainability 2024, 16, 2593. [Google Scholar] [CrossRef]
- Mechtcherine, V.; et al. Extrusion-based additive manufacturing with cement-based materials: Review of processes and physics. Cement and Concrete Research 2020, 132, 106037. [Google Scholar] [CrossRef]
- Barbosa, R.; et al. Affordable and safe 3D-printed concrete for social housing: A feasibility study. Automation in Construction 2025, 158, 105874. [Google Scholar] [CrossRef]
- Iuso, D.; et al. Voxel-wise classification for porosity analysis. arXiv 2023. [Google Scholar] [CrossRef]
- Hanocka, R.; et al. MeshCNN: A network with an edge. ACM Transactions on Graphics 2019, 38(4), 1–12. [Google Scholar] [CrossRef]
- Peng, X. A review of in-situ defect detection and monitoring for additive manufacturing. Sensors 2023, 23, 6352. [Google Scholar] [CrossRef]
- Jadayel, M.; et al. Structured-light 3D scanning performance in offline and in-line metrology. Additive Manufacturing 2024, 68, 103634. [Google Scholar] [CrossRef]
- Bordekar, H. Explainable AI for automatic defect detection in CT images using SVM. Journal of Intelligent Manufacturing 2025. [Google Scholar] [CrossRef]
- Otto, R. Voxel-based 3D reconstruction of additively manufactured porous structures. International Journal of Advanced Manufacturing Technology 2024. [Google Scholar] [CrossRef]
- Bidkhori, B.; et al. Machine learning strategies for monitoring porosity in additive manufacturing. Additive Manufacturing 2022, 53, 102660. [Google Scholar] [CrossRef]
- Schneider, L.; et al. MedMeshCNN: Enabling MeshCNN for medical surface models. Medical Image Analysis 2021, 70, 102017. [Google Scholar] [CrossRef]
- Bazli, M.; et al. 3D printing for remote housing: Benefits and challenges. Automation in Construction 2023, 148, 104772. [Google Scholar] [CrossRef]
- Carstensen, J. V.; et al. 3D printing concrete structures: State of the art, challenges, and opportunities. Construction and Building Materials 2023, 301, 124136. [Google Scholar] [CrossRef]
- Saimon, A. I.; et al. Advancing additive manufacturing through deep learning: A comprehensive review. arXiv 2024. [Google Scholar] [CrossRef]
- Deshpande, S.; et al. Deep learning-based image segmentation for defect detection in additive manufacturing. International Journal of Advanced Manufacturing Technology 2024, 134, 2081–2105. [Google Scholar] [CrossRef]
- Petrich, J.; et al. Automated defect recognition for additive manufactured parts using CT scans. Scientific Reports 2023, 13, 15034. [Google Scholar] [CrossRef]
- George, A.; et al. Using Voxelisation-Based Data Analysis Techniques for In-Process Porosity Prediction in Metal AM. Applied Sciences 2024, 14(11), 4367. [Google Scholar] [CrossRef]
- Sun, S.; et al. Detectability by X-ray micro CT of defects: Influence of voxel size. Additive Manufacturing 2024. [Google Scholar] [CrossRef]
- Poudel, A.; et al. Feature-based volumetric defect classification in metal additive manufacturing. Nature Communications 2022, 13, 1. [Google Scholar] [CrossRef]
- Idram, I.; et al. Development of mesh-defect removal algorithm to assemble 3D-printed bone fragments. Journal of Medical Engineering and Technology 2019, 43, 569–580. [Google Scholar] [CrossRef]
- Charia, O.; et al. Real-time stringing detection for additive manufacturing using multi-sensor vision and thermal data. Engineering Applications of Artificial Intelligence 2025. [Google Scholar] [CrossRef]
- Ye, B.; et al. Global and local defect detection for 3D printout surface via mesh–CAD comparison. International Journal of Machine Tools and Manufacture 2023. [Google Scholar] [CrossRef]
- Su, X.; Peng, X.; et al. Enhanced defect detection via virtual polarization filtering and deep learning optimization. Photonics 2025, 12(6), 599. [Google Scholar] [CrossRef]
- Fan, B.; et al. Spatially resolved defect characterization and fidelity assessment using printer-associated optical data. Sensors 2024. [Google Scholar] [CrossRef]
- Akmal, J.; et al. AI-based defect detection and self-healing in metal additive manufacturing. International Journal of Production Research 2025. [Google Scholar] [CrossRef]
- Yin, X.; et al. Artificial intelligence-driven defect detection: Annotated powder-bed dataset and CNN benchmarking. MSAM 2025, 4(3), 022. [Google Scholar] [CrossRef]
- Baig, S.; et al. Non-destructive detection of critical defects in AM using XCT and shape-dependency analysis. Scientific Reports 2025. [Google Scholar] [CrossRef]
- Peng, X. A review of in-situ defect detection and monitoring for SLM processes. In 3D Printing and Additive Manufacturing; 2021. [Google Scholar] [CrossRef]
- Estalaki, S. M.; et al. Predicting defects in LPBF using in-situ thermal imaging and ML. Additive Manufacturing 2022. [Google Scholar] [CrossRef]
- Liu, X.; Mileo, A.; Smeaton, A. F. Defect classification in additive manufacturing using CNN-based vision processing. arXiv 2023. [Google Scholar] [CrossRef]
Figure 1.
Sliced model used to generate the extrusion toolpath and establish the design reference for alignment and evaluation.
Figure 1.
Sliced model used to generate the extrusion toolpath and establish the design reference for alignment and evaluation.
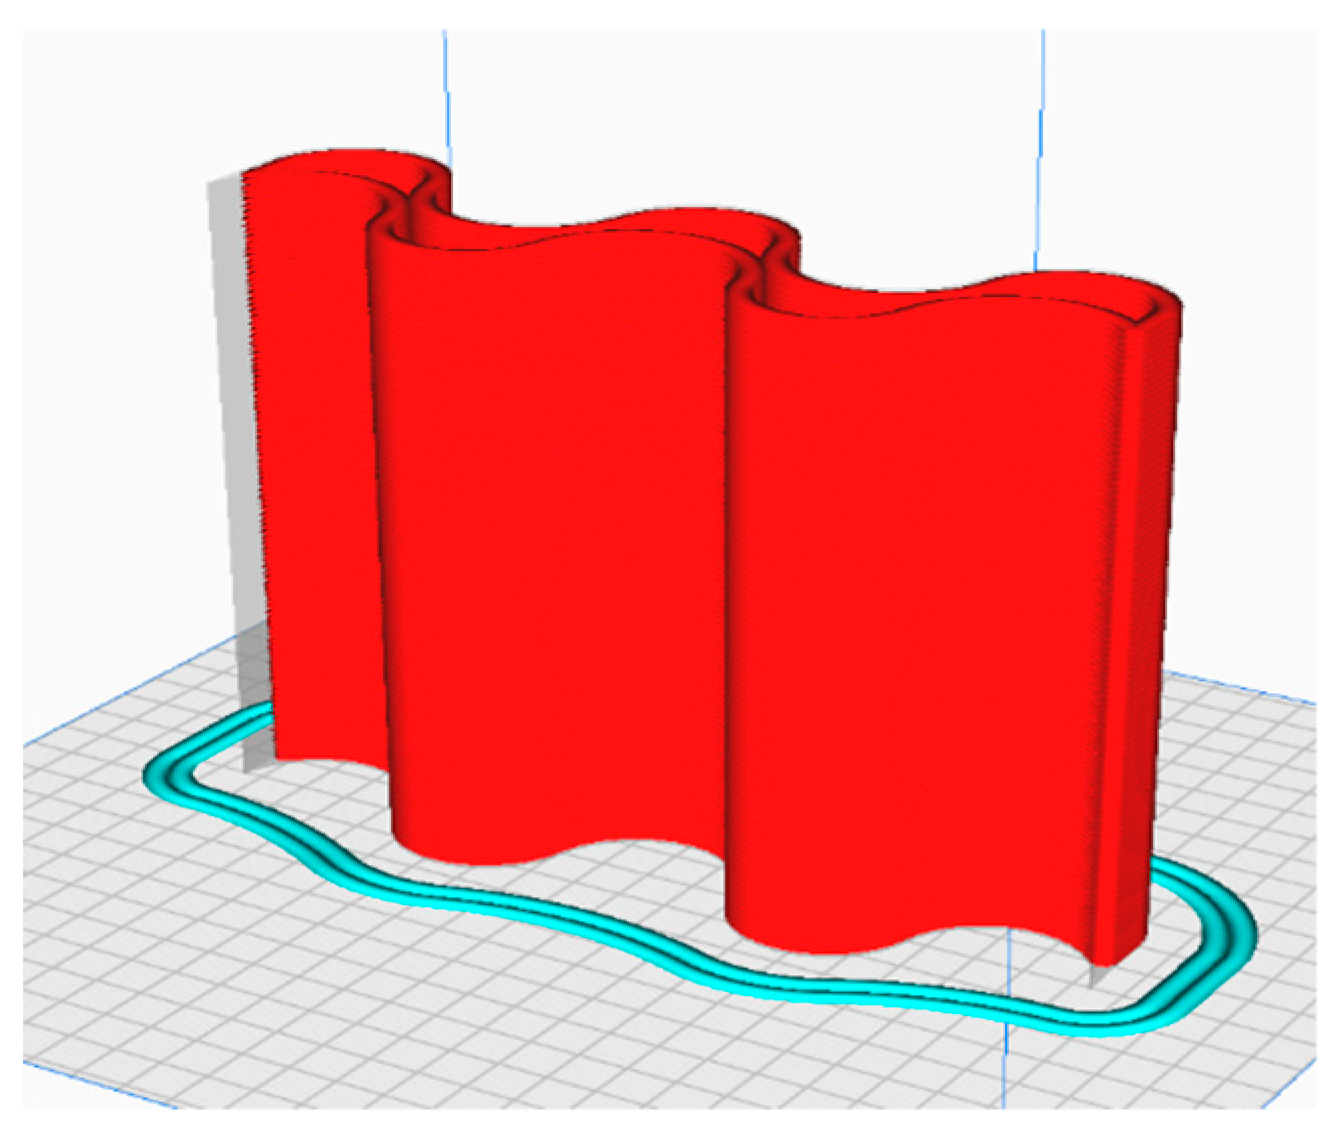
Figure 2.
Printed clay wall specimen showing intentionally introduced defects including voids, bulges, and irregular layer heights.
Figure 2.
Printed clay wall specimen showing intentionally introduced defects including voids, bulges, and irregular layer heights.
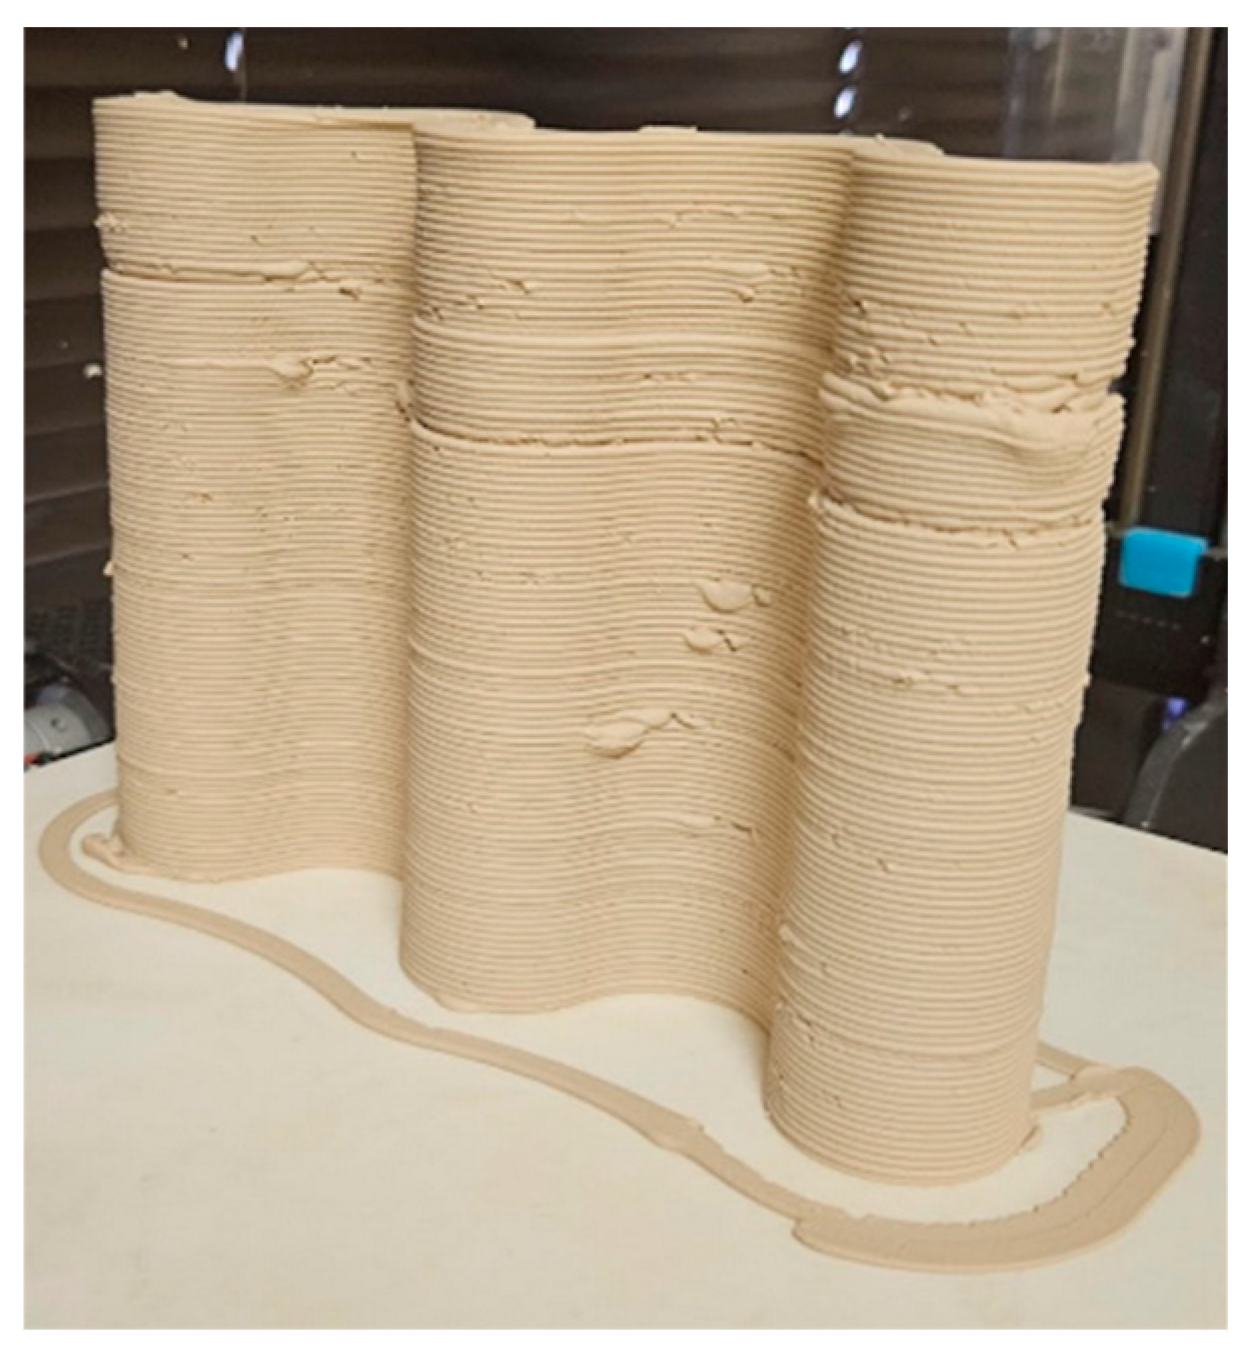
Figure 3.
Percentile-based labeling strategy for voxel-wise defect classification. Deviations below the lower 5th percentile are labeled as voids, and deviations above the upper 95th percentile are labeled as buildups, while the center band represents normal geometry.
Figure 3.
Percentile-based labeling strategy for voxel-wise defect classification. Deviations below the lower 5th percentile are labeled as voids, and deviations above the upper 95th percentile are labeled as buildups, while the center band represents normal geometry.
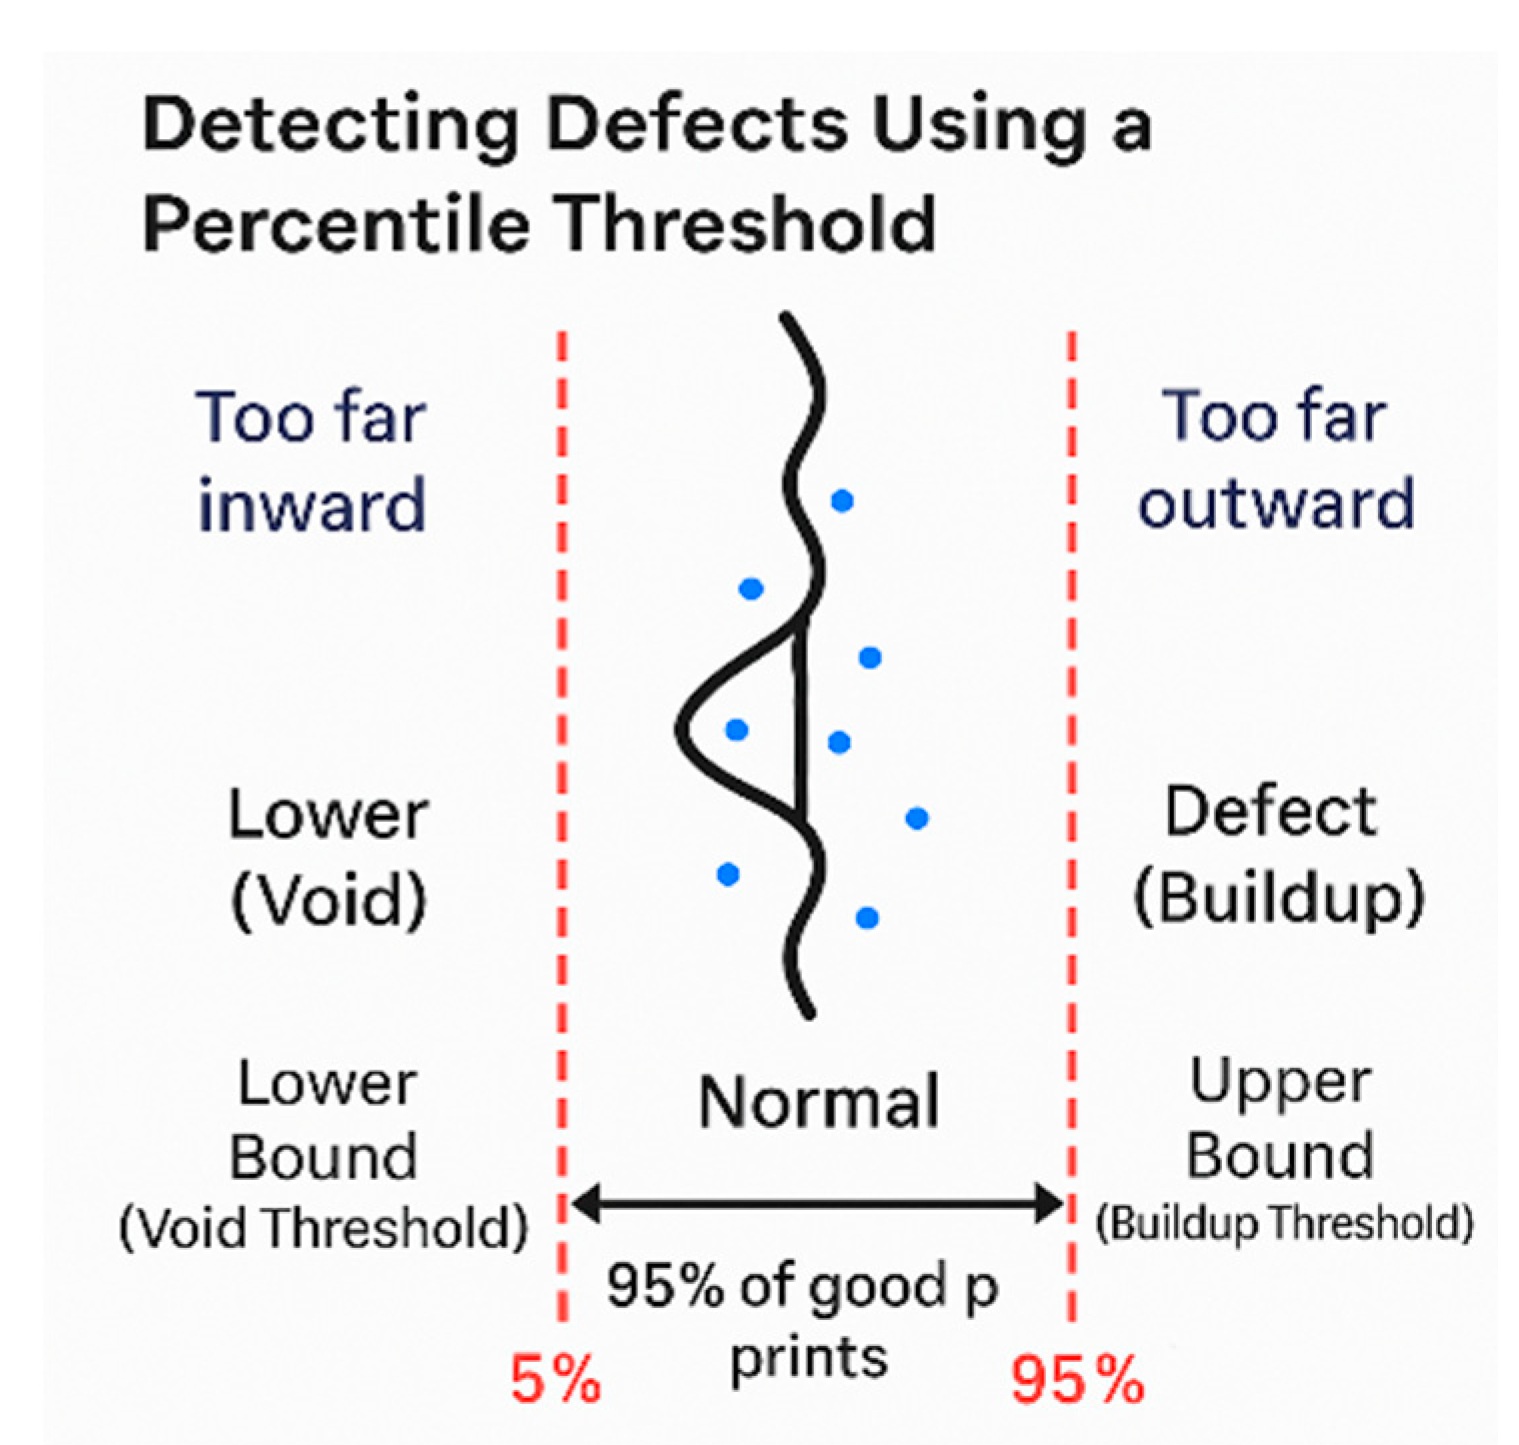
Figure 4.
Boxplot of normalized curvature values detected by the mesh-based and voxel-based methods. The mesh method shows higher curvature variance, while the voxel method exhibits smoother curvature values consistent with noise robustness.
Figure 4.
Boxplot of normalized curvature values detected by the mesh-based and voxel-based methods. The mesh method shows higher curvature variance, while the voxel method exhibits smoother curvature values consistent with noise robustness.
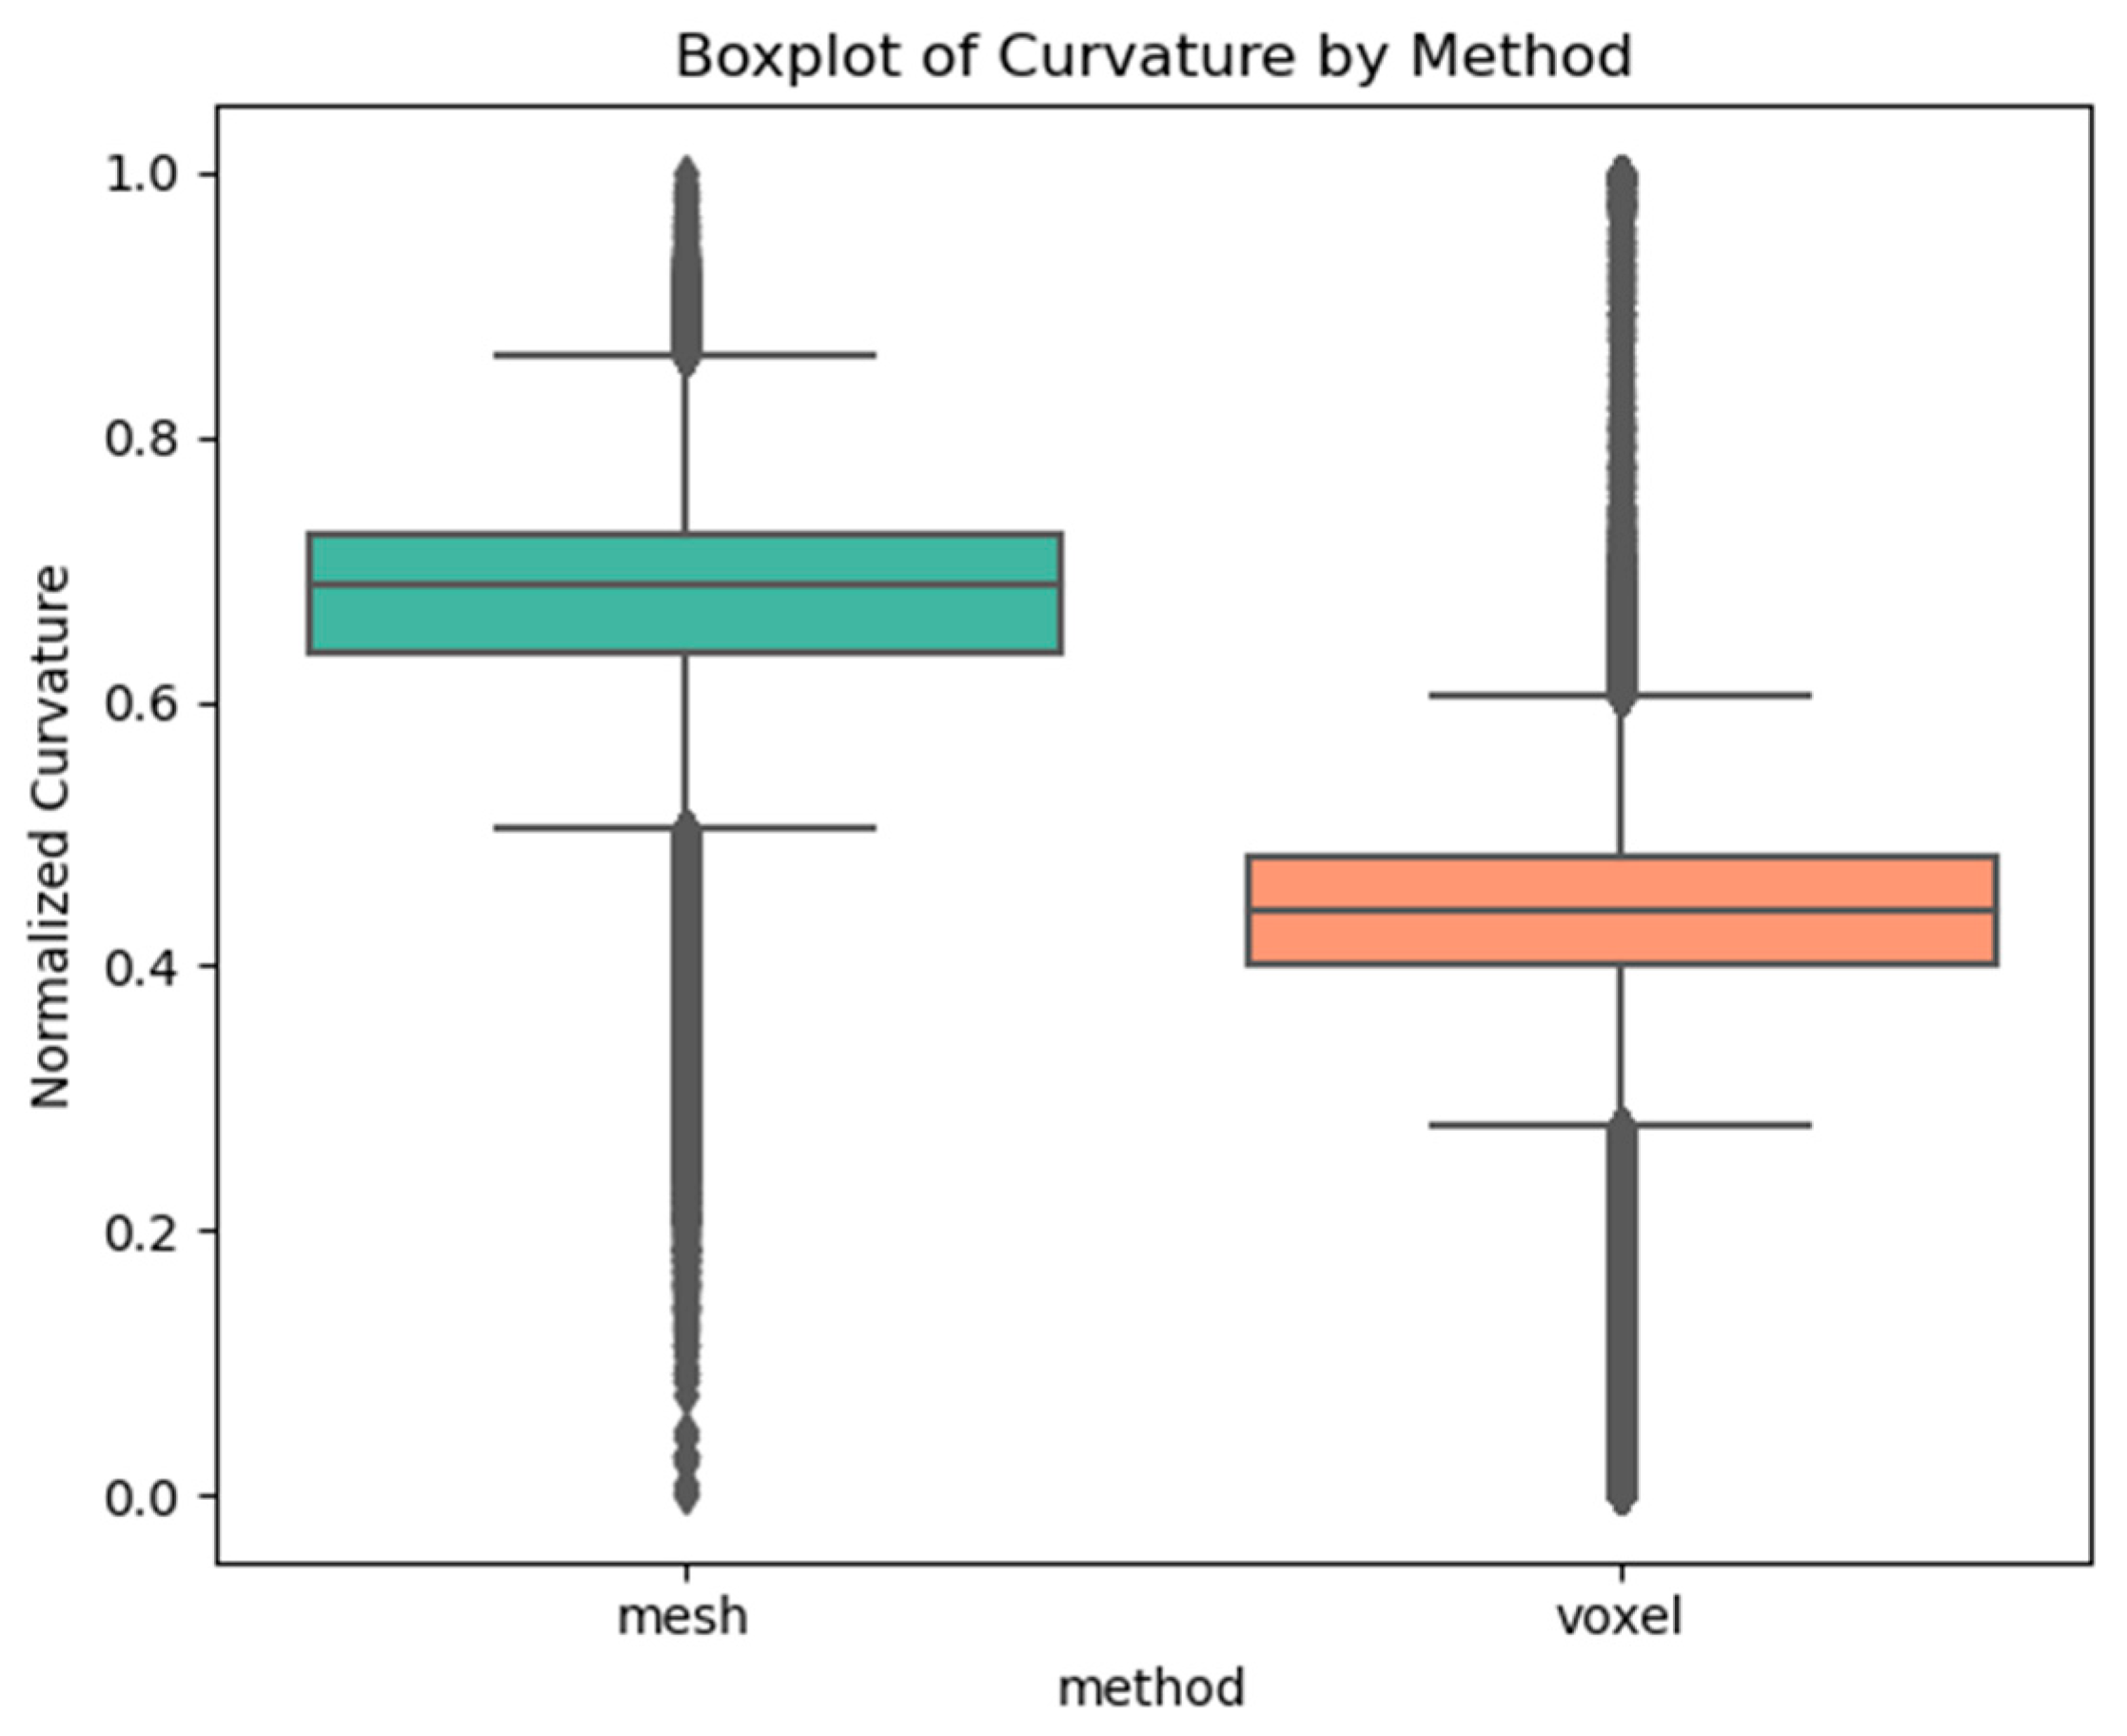
Figure 5.
Scatter plot of curvature versus defect classification. Blue indicates defects and red indicates non-defects. The voxel method exhibits clearer class separation.
Figure 5.
Scatter plot of curvature versus defect classification. Blue indicates defects and red indicates non-defects. The voxel method exhibits clearer class separation.
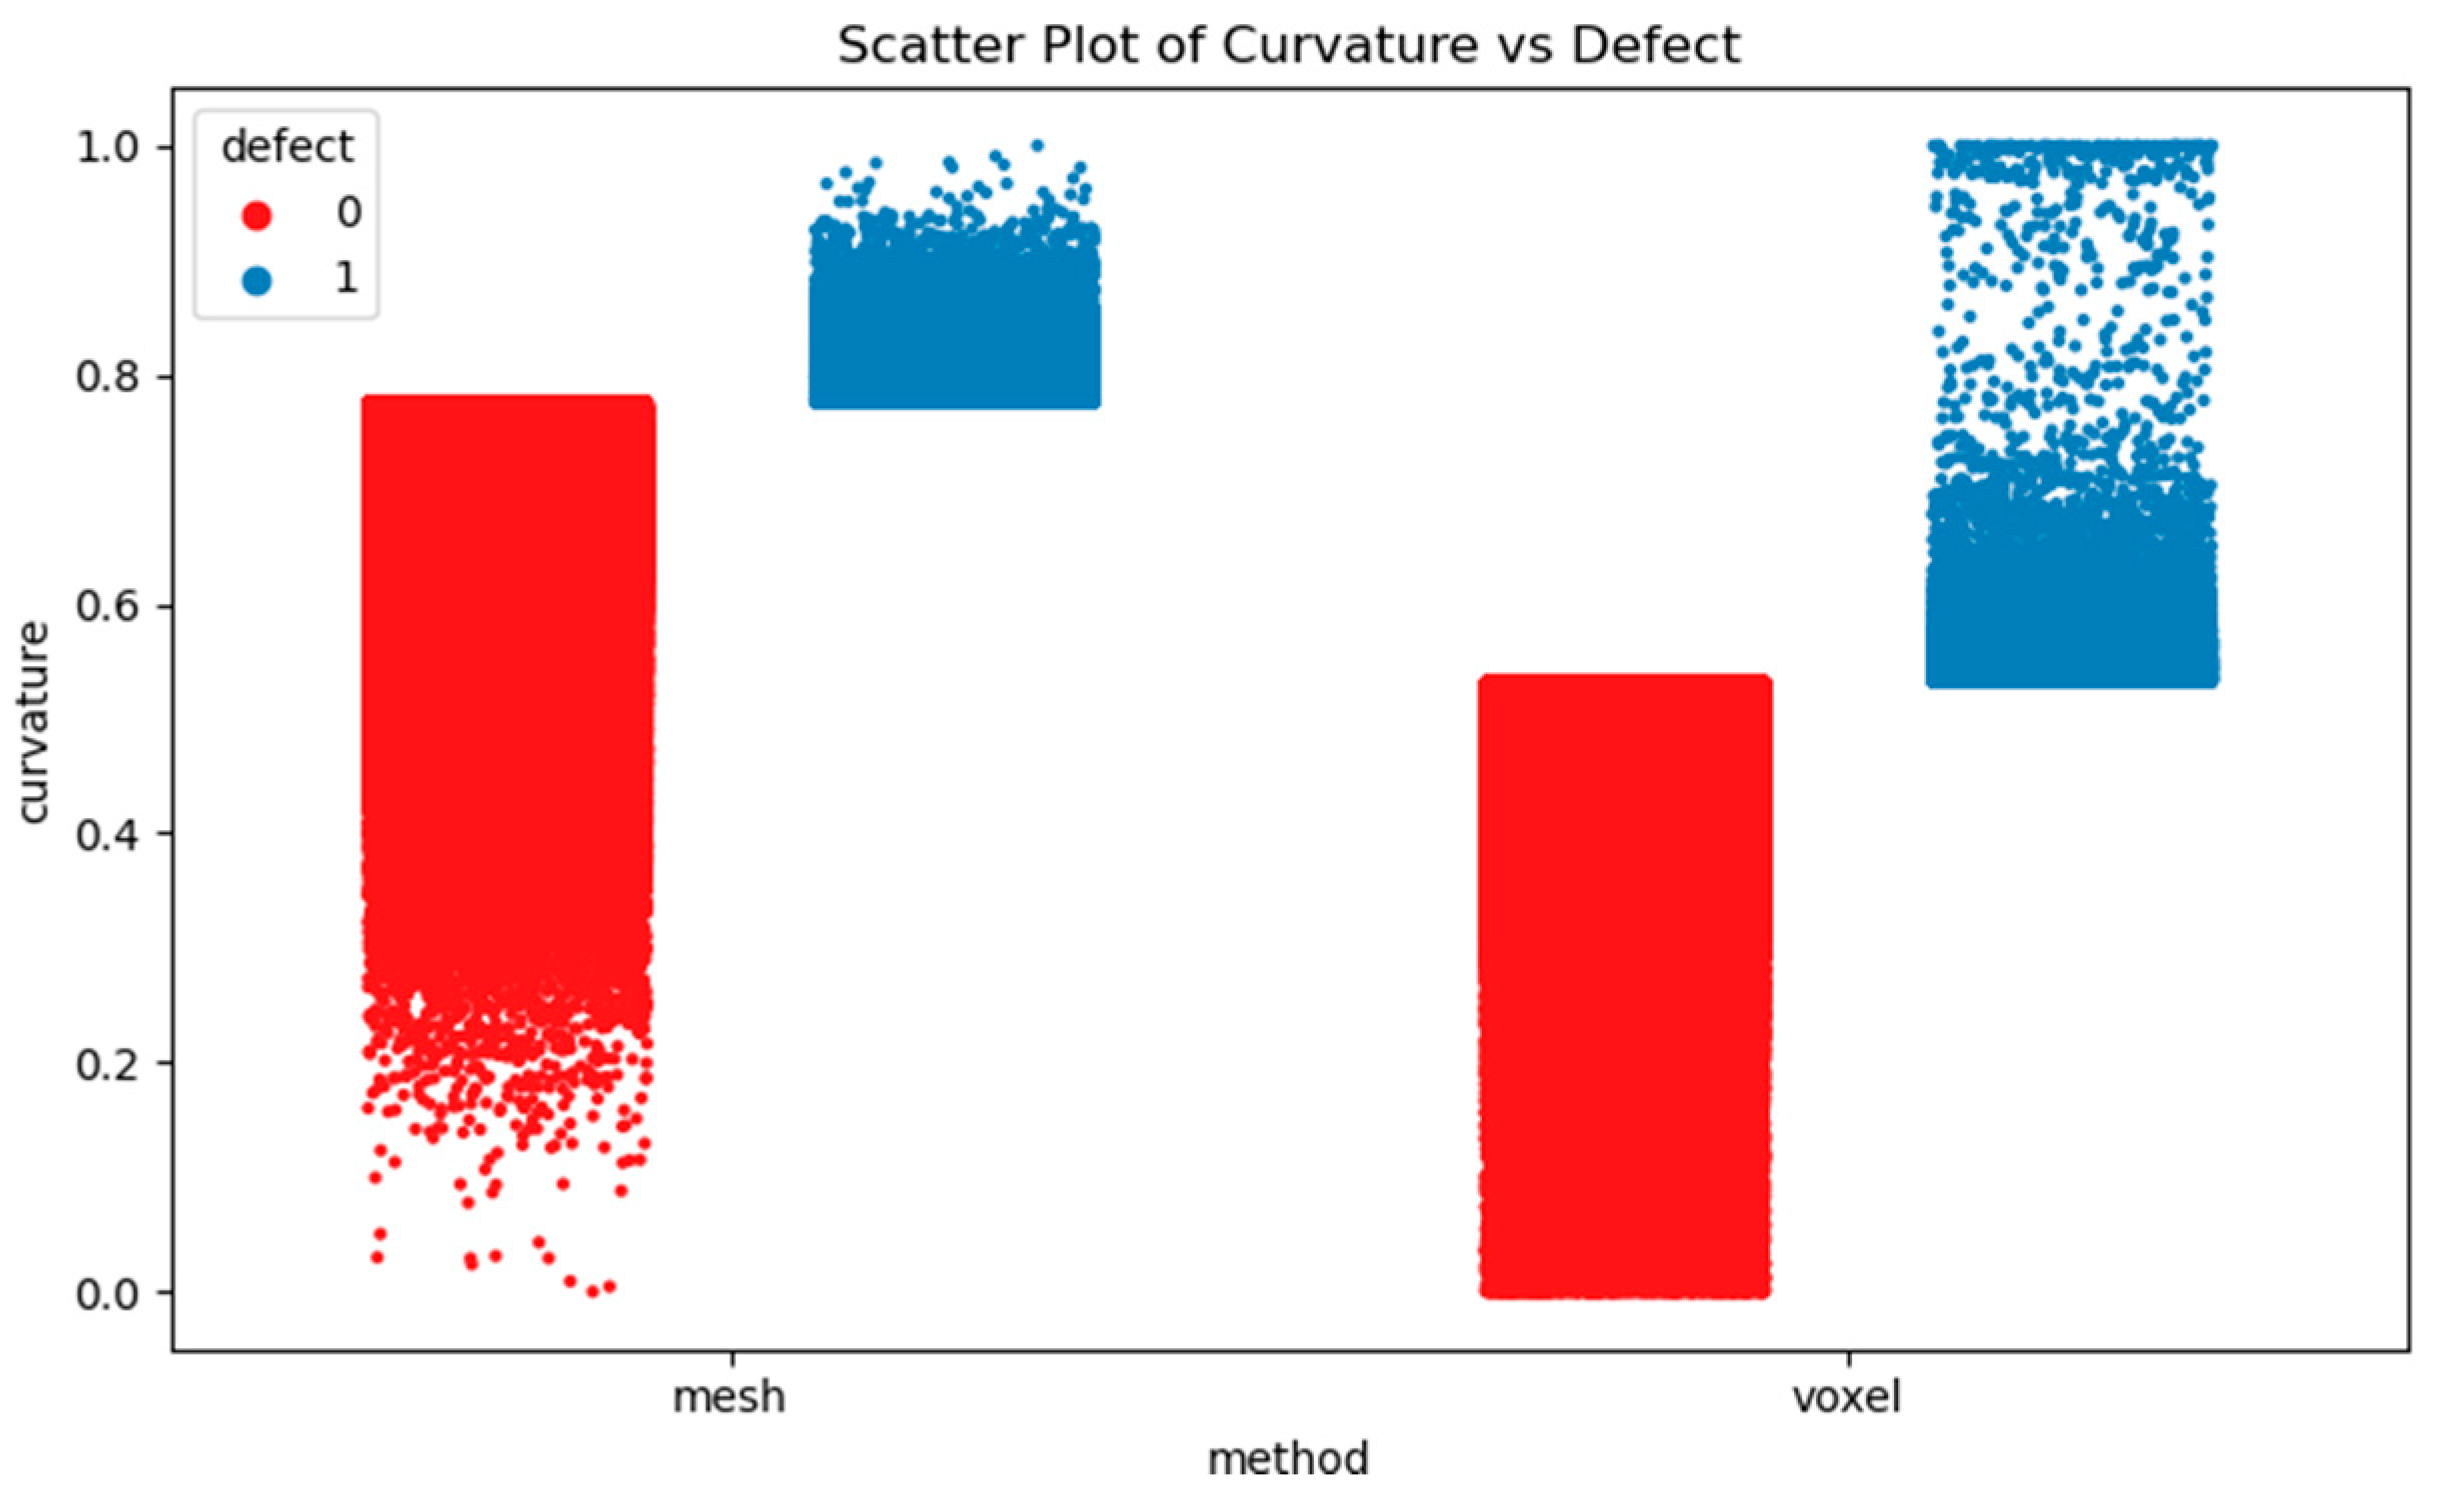
Figure 6.
Comparison of the number of elements classified as defective by the mesh-based and voxel-based pipelines using the top 5 percent curvature threshold.
Figure 6.
Comparison of the number of elements classified as defective by the mesh-based and voxel-based pipelines using the top 5 percent curvature threshold.
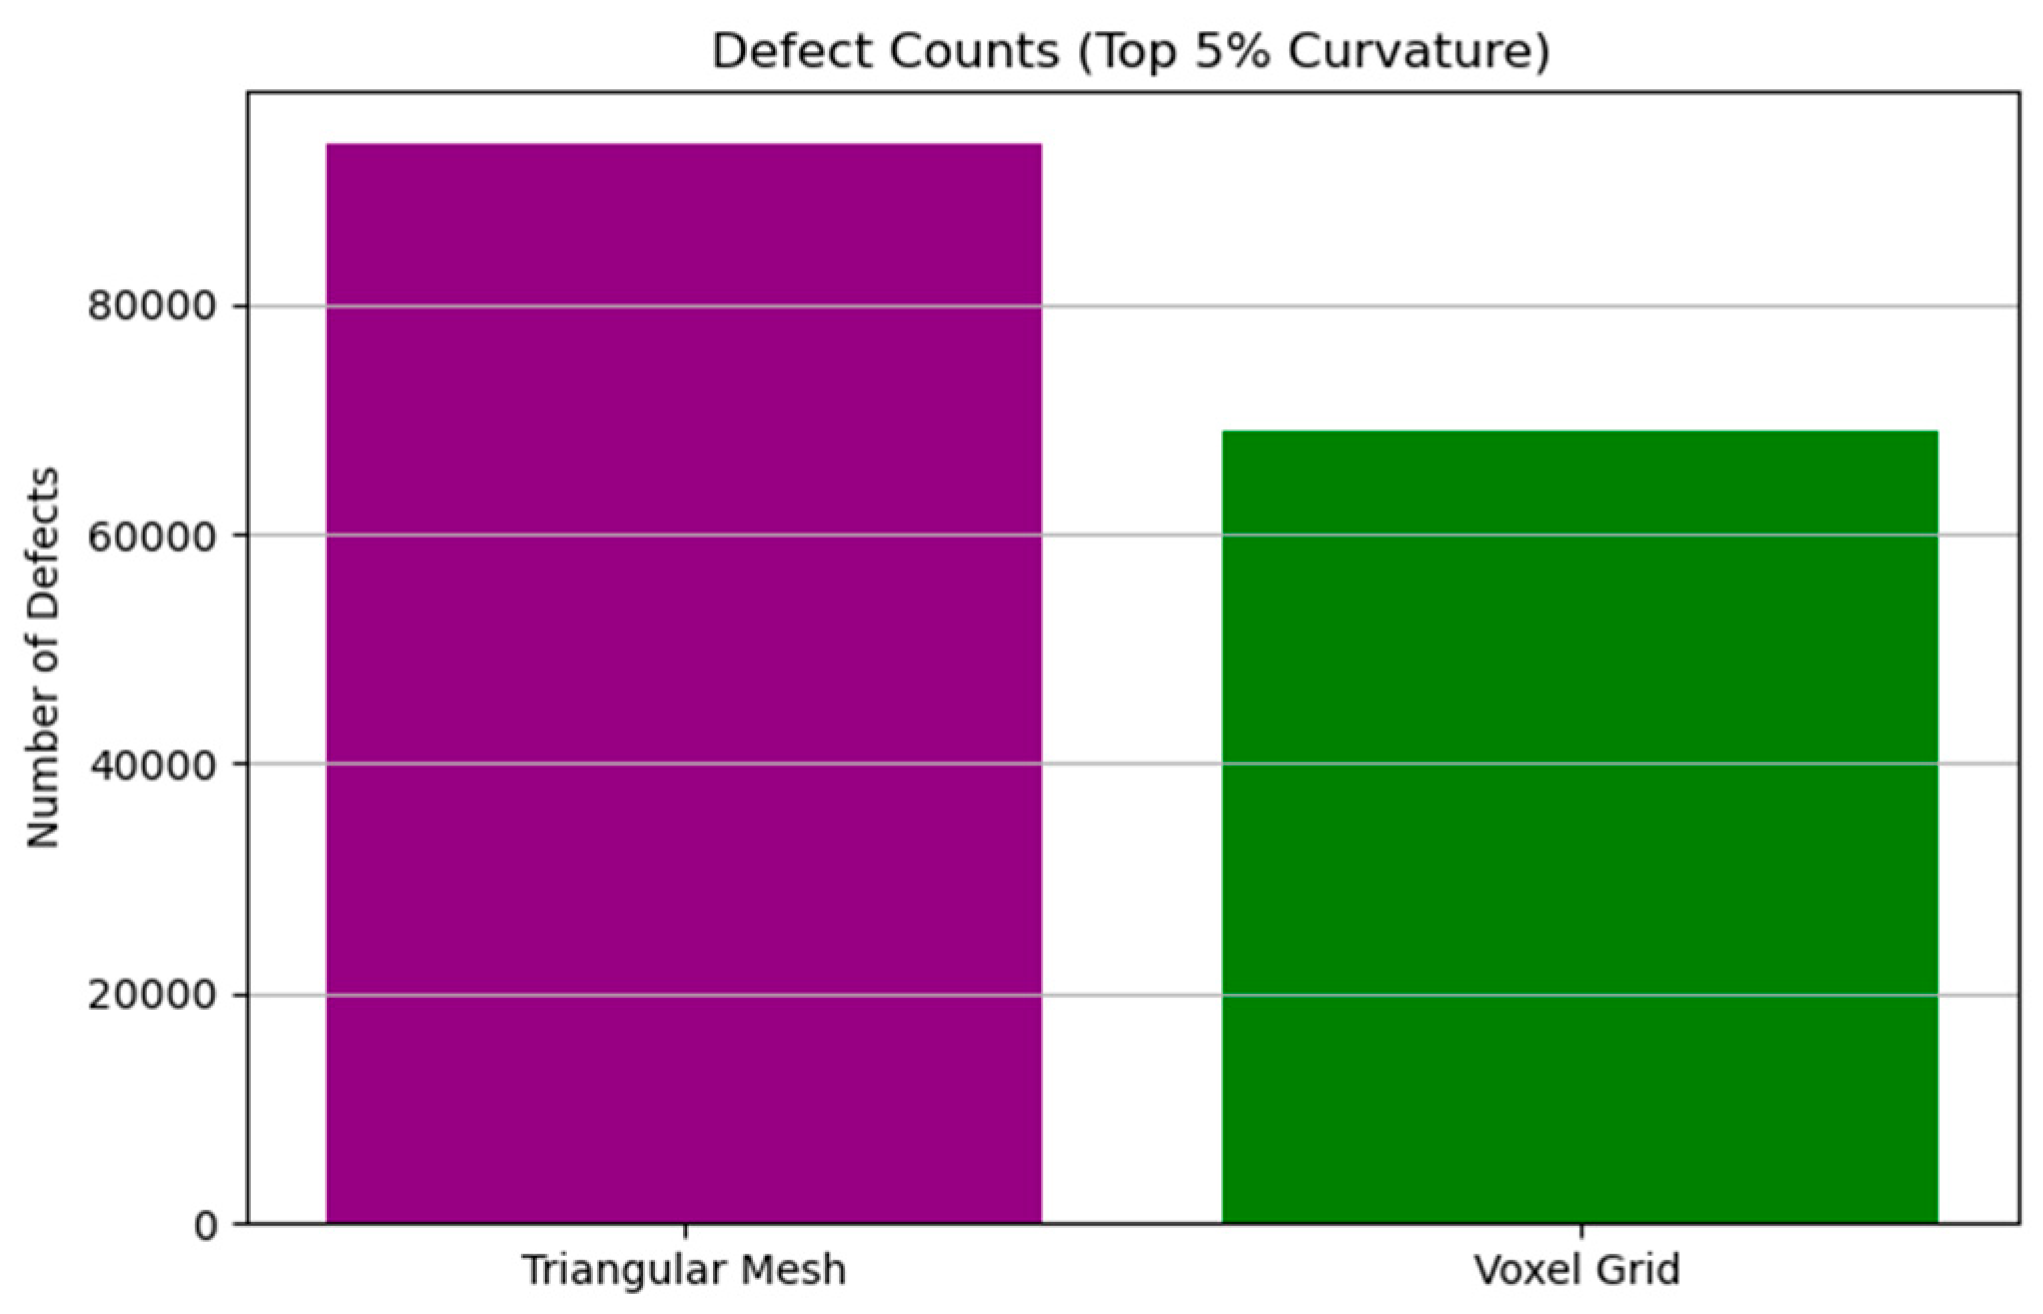
Figure 7.
Histograms of normalized curvature values for the mesh (left) and voxel (right) pipelines. The mesh method peaks at higher curvature values, while the voxel method peaks at lower values, reflecting differences in sensitivity and smoothness.
Figure 7.
Histograms of normalized curvature values for the mesh (left) and voxel (right) pipelines. The mesh method peaks at higher curvature values, while the voxel method peaks at lower values, reflecting differences in sensitivity and smoothness.
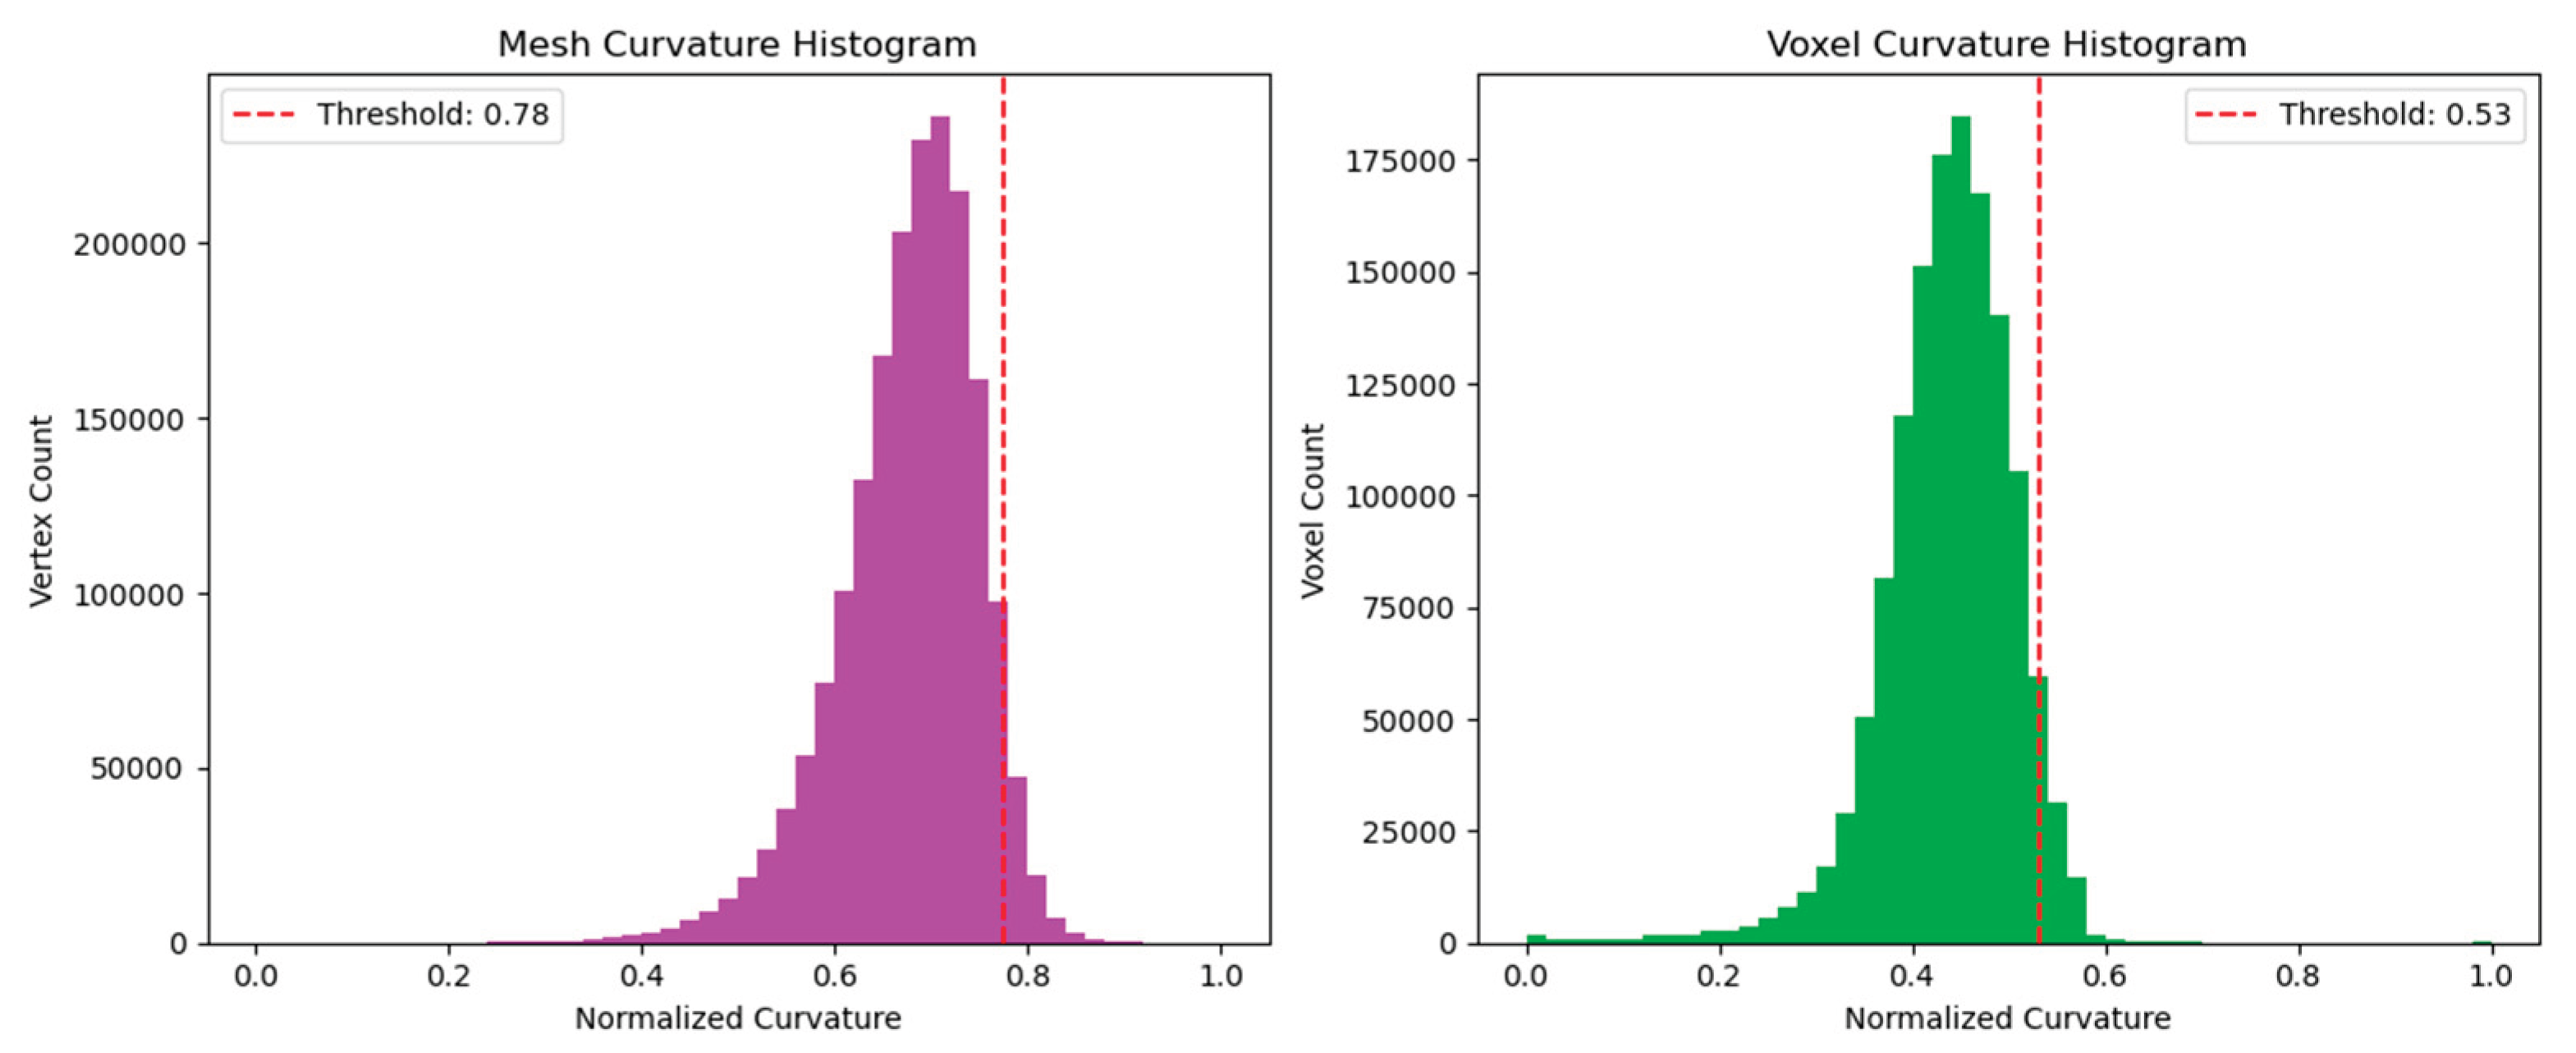

Table 1.
Specimen geometry, scanning, and dataset characteristics.
| Parameter | Value | Unit | Notes |
|---|---|---|---|
| Specimen height | 300 | mm | Wall segment |
| Specimen width | 200 | mm | – |
| Specimen depth | 50 | mm | – |
| Nozzle diameter | 5 | mm | Extrusion nozzle |
| Nominal layer height | 5 | mm | Approximate |
| Number of printed layers | 60 | – | Approx. |
| Scan technology | Structured light | – | Offline scan |
| Scan accuracy | ≤100 | µm | Manufacturer specification |
| Point cloud size | 3.4 × 10⁶ | points | After filtering |
| Mesh vertices | 1.82 × 10⁶ | vertices | Triangular mesh |
| Mesh faces | 3.64 × 10⁶ | faces | ~2× vertices |
| CAD–scan ICP RMS error | 0.41 | mm | After alignment |
| Introduced defect types | 3 | – | Voids, buildups, layer height |
Table 2.
Quantitative performance comparison of defect-detection pipelines.
| Metric | Voxel-based | Mesh-based | Unit |
|---|---|---|---|
| Accuracy | 92.4 | 88.1 | % |
| Precision | 0.90 | 0.93 | – |
| Recall | 0.94 | 0.86 | – |
| F1-score | 0.92 | 0.89 | – |
| Mean localization error | 0.58 | 0.32 | mm |
| Runtime per specimen | 96.4 | 18.7 | s |
| Peak memory usage | 6.8 | 1.9 | GB |
| Defective elements detected | 68,877 | 93,906 | count |
Table 3.
Defect-type-specific performance comparison.
| Defect Type | Method | Precision | Recall | F1-Score |
|---|---|---|---|---|
| Internal Voids | Voxel-based | 0.91 | 0.95 | 0.93 |
| Mesh-based | 0.78 | 0.70 | 0.74 | |
| Material Buildup | Voxel-based | 0.88 | 0.90 | 0.89 |
| Mesh-based | 0.94 | 0.92 | 0.93 | |
| Layer-Height Inconsistency | Voxel-based | 0.90 | 0.93 | 0.91 |
| Mesh-based | 0.92 | 0.89 | 0.90 |
Table 4.
Synthesis of observed trade-offs between mesh-based and voxel-based defect-detection methods, including implications for defect types, inspection accuracy, runtime, and suitability for construction-scale workflows.
Table 4.
Synthesis of observed trade-offs between mesh-based and voxel-based defect-detection methods, including implications for defect types, inspection accuracy, runtime, and suitability for construction-scale workflows.
| Feature | Triangular Mesh | Voxel-Based |
|---|---|---|
| Surface defect detection | Strong | Moderate |
| Internal defect detection | Limited | Strong |
| Visual inspection readiness | Good | Fair |
| Real-time monitoring suitability | Limited | Suitable |
| Structural quality assurance | Limited | Strong |
| Computational efficiency | High | Heavy |
Disclaimer/Publisher’s Note: The statements, opinions and data contained in all publications are solely those of the individual author(s) and contributor(s) and not of MDPI and/or the editor(s). MDPI and/or the editor(s) disclaim responsibility for any injury to people or property resulting from any ideas, methods, instructions or products referred to in the content. |
© 2026 by the authors. Licensee MDPI, Basel, Switzerland. This article is an open access article distributed under the terms and conditions of the Creative Commons Attribution (CC BY) license (http://creativecommons.org/licenses/by/4.0/).
Copyright: This open access article is published under a Creative Commons CC BY 4.0 license, which permit the free download, distribution, and reuse, provided that the author and preprint are cited in any reuse.


