
Submitted:
02 January 2026
Posted:
04 January 2026
You are already at the latest version
Abstract
R-loops, three-stranded nucleic acid structures formed by an RNA-DNA hybrid, have emerged as important regulators of transcription and genome stability. Although ad-vances in high-throughput sequencing have revealed widespread R-loop landscapes, platform-specific biases hinder the identification of conserved R-loops in specific cell types. Mouse embryonic stem cells, which are transcriptionally active, provide an ideal system for investigating the potential roles of stable R-loops in RNA biology. In this study, we integrated 13 independent R-loop profiling datasets from four experimental platforms to define 27,950 Common R-loop regions in mouse embryonic stem cells and characterized their chromatin environment and associated biological functions. Common R-loop regions were reproducibly detected across methods and were preferentially localized to pro-moter-proximal and genic regions enriched in CpG islands. Genes associated with Common R-loops were highly and stably expressed, showing strong functional en-richment in RNA metabolism process such as mRNA processing, RNA splicing, and ribonucleoprotein complex biogenesis. Chromatin state analysis revealed that Common R-loops are enriched in transcriptionally active and regulatory contexts. Transcription factor motif analyses have identified distinct regulatory environments in Common R-loop regions, including pluripotency-associated OCT4-SOX2-TCF-NANOG motifs in en-hancer, CTCF motifs in open chromatin, and YY1 motifs in promoter. Together, this study provided the first integrated analysis of conserved R-loop regions in mouse embryonic stem cells, revealing their preferential localization at regulatory loci linked to RNA metabolism and highlight R-loops as structural and functional nodes in RNA biology.
Keywords:
R-loop
; mouse embryonic stem cell
; chromatin states
; GC skew
; G-quadruplex
; transcription regulation
; post-transcriptional regulation
; RNA metabolism
1. Introduction
R-loops are three-stranded nucleic acid structures in which an RNA transcript hybridizes with its complementary DNA strand, displacing the non-template DNA into single-stranded DNA [1,2]. Initially regarded as rare byproducts of transcription, R-loops are now recognized as important regulators of transcription and genome stability [3,4,5]. Dysregulation of R-loop homeostasis has been implicated in diverse pathological contexts, including neurodegenerative disorders, immunodeficiencies, and cancer, often through the disruption of RNA metabolism and transcription-coupled genome maintenance [6,7,8,9,10].
The importance of the R-loops in RNA biology lies in their ability to modulate multiple stages of gene expression. They influence transcription initiation and pausing, pre-mRNA processing, RNA stability, and recruitment of chromatin modifiers [11,12,13,14,15,16,17,18,19]. These functions directly intersect processes central to both development and disease. For instance, aberrant R-loop accumulation can impair RNA splicing, alter RNA export, and destabilize transcriptional mechanisms linked to tumorigenesis and other RNA-associated disorders [20,21,22,23,24,25,26,27,28,29].
Advances in high-throughput R-loop profiling, including DRIP-seq (DNA-RNA immunoprecipitation), MapR, HBD-seq (Hybrid binding domain), and CUT&Tag, have provided the precise, genome-wide R-loop distributions [30,31,32,33,34,35]. However, platform-specific biases generate variability in the R-loop peaks, complicating the identification of conserved R-loop regions that represent stable functional features within a given cell type. Previous studies have classified R-loops by their genomic context, such as promoter-paused or elongation-associated, and distinguished constitutive from variable R-loops [12,36]. Although these studies aggregated heterogeneous datasets from multiple cell types, limiting insights into cell-type-specific and biologically conserved features.
Here, we address these limitations by integrating 13 R-loop datasets from mouse embryonic stem cells (mESCs) and applying stringent criteria to identify R-loop regions consistently detected across multiple profiling strategies. We analyzed chromatin state and sequence feature to define the genomic, epigenomic, and regulatory landscapes of conserved R-loop regions. Our findings revealed that Common R-loops are preferentially located in transcriptionally active and regulatory chromatin states. The genes harboring these R-loops are enriched for RNA metabolic pathways. Furthermore, these R-loops intersect with transcription factor networks critical for pluripotency and RNA processing, underscoring their potential role as structural and functional nodes in RNA biology and disease.
2. Results
2.1. Integration of R-Loop Datasets Defines Common R-Loop Regions
To define the R-loop regions reproducibly detected across diverse experimental platforms, we integrated 13 R-loop datasets using four methods: DRIP-based approaches, CUT&Tag, HBD-seq, and MapR (Figure 1A). Using a stringent intersection strategy with bedtools multiIntersectBed, we identified the genomic loci supported by at least one dataset from each method and reconstructed the full span of these overlapping peaks. This approach yielded 27,950 method-independent R-loop regions, which we hereafter refer to as Common R-loop regions. Despite platform-specific differences in signal intensity (Figure S1A), these regions showed consistent and robust R-loop enrichment across datasets (Figure 1B). Genome browser views at representative loci (e.g., Gapdh, Actb, and mESC markers Pou5f1, Nanog, and Sox2) confirmed that multiple independent datasets converged at the same genomic locations, underscoring the reliability of the defined regions (Figure 1C and Figure S1B). The most Common R-loop regions were compact, with 93.5% ranging between 10 and 1,000 bp and most frequently between 100 and 200 bp (Figure 1D, Figure S1C, Figure S1D and Figure S1E), which is consistent with the expected physical footprint of R-loops [37,38,39]. Although these regions collectively cover only 0.31% of the mouse genome, they are preferentially enriched within transcribed regions rather than intergenic spaces (Figure 1E). Notably, 20.3% of CpG islands and 4.49% of candidate cis-regulatory elements (cCRE) overlapped with Common R-loop regions, suggesting a potential role for R-loops in gene regulatory mechanisms.
To explore the regulatory potential of these regions, we analyzed their genomic proximity and functional associations using GREAT [40]. Most Common R-loop regions were located within 500 kb of a transcription start site (TSS) and were associated with one or two genes (Figure S2A). Functional enrichment analysis revealed a strong association with post-transcriptional gene regulation, particularly with pathways related to RNA processing, splicing, and translation (Figure S2B). Gene Ontology Cellular Component (GOCC) and Molecular Function (GOMF) analysis results highlighted ribonucleoprotein complexes, P-bodies, and RNA-binding activities which raises the possibility that R-loops may be strategically positioned to influence genes involved in RNA metabolism.
2.2. Common R-Loops Are Preferentially Enriched at Genic Regions
To characterize the genomic distribution of Common R-loops, we compared their annotation profiles with those of individual datasets using HOMER. Common R-loop regions were markedly enriched at CpG island, promoter, 5′UTR, exon, and transcription termination sites (TTS), with enrichment exceeding those of individual peaks (Figure 2A and B). This indicates that R-loops are preferentially retained in canonical regulatory elements and gene regions, consistent with their established roles in transcriptional regulation. Because annotation criteria differ among tools, we cross-validated the results using ChIPseeker, which defines promoter regions more broadly and separates the first exon and intron from the rests. While HOMER annotated 21.9% of the regions as promoter-TSS, ChIPseeker classified 64.9% as promoter (Figure S3A, Figure S3B, and Figure S3C). More than half of introns (57.3%) and exons (68.3%) annotated by HOMER corresponded to the promoter regions defined by the ChIPseeker (Figure S3E and Figure S3F). Thus, many Common R-loop regions are localized to areas proximal to TSS. HOMER also assigns a larger fraction of R-loops to TTS regions because of its broader definition of gene-end boundaries. UpSet analysis confirmed that many of these TTS-labeled regions overlapped with the promoter or gene body elements (Figure S3D). Taken together, these results demonstrated that Common R-loops predominantly reside within genic and promoter-proximal regulatory regions, serving as genomic landmarks critical for transcriptional control and gene regulation.
2.3. Common R-Loops Are Associated with Highly Expressed RNA-Regulatory Genes
Given that the Common R-loop regions are predominantly localized to promoter-proximal regions, we next examined the genes associated with these sites and their biological functions. To do this, we analyzed 10 RNA-seq datasets and identified 14,655 genes expressed in mESCs. Based on TSS proximity, 7,757 genes were classified as Common R-loop-associated. These R-loop-associated genes showed high and stable expression in mESCs (Figure 3A). GO over-representation analysis of R-loop-associated genes identified 166 statistically significant Gene Ontology Biological Process (GOBP). The most enriched biological process was post-transcriptional regulatory pathway, such as mRNA processing, RNA splicing, and ribonucleoprotein complex biogenesis (Figure 3B and Figure S4A). Processes essential for cellular maintenance were also identified, such as chromatin remodelling, DNA replication and repair, cell cycle regulation, protein degradation, and signal transduction (Figure S4B). To group these 166 GOBP terms into broader categories, we performed a semantic similarity-based network analysis, which identified eight functional clusters (Figure 3C and Figure S4C). Cluster 1, the largest and most cohesive cluster, was centered on RNA metabolism and was subdivided into modules related to post-transcriptional regulation, ribosome biogenesis, and protein turnover. Other clusters encompassed processes such as cell cycle regulation, DNA replication, chromatin regulation, and signaling pathways, underscoring the broader functional landscape of R-loop-associated genes. These trends were further supported by GOCC and GOMF analyses. Common R-loop-associated genes were significantly enriched for ribonucleoprotein structures, such as the spliceosome, nuclear speckles, and P-body (Figure S5). Functionally, these genes were characterized by mRNA binding, ribonucleoprotein complex binding and catalytic activity, acting on a nucleic acid (Figure S6). Cross-validation using DAVID confirmed similar enrichment patterns, particularly for RNA-related functions (Table S2). Collectively, these findings suggest that Common R-loops are not randomly distributed but are closely linked to genes orchestrating post-transcriptional regulation.
2.4. Common R-Loops Exhibit Uniform Positional Patterns Independent of Gene Function
Our GO analysis demonstrated that Common R-loop-associated genes cluster into distinct functional categories. This finding prompted us to investigate whether the genomic positioning of R-loops also differ between these functional groups. We next assessed whether R-loop localization is dictated by specific gene function or if it occurs as a structural by-product of transcription [3]. Using the functional clusters derived from the GOBP network analysis, we compared the distribution of Common R-loops across 11 distinct clusters (Figure S7A). As expected, the positional profiles of the Common R-loops were highly consistent across all functional categories. This uniformity suggests that R-loop localization is not dictated by gene function but is instead governed by general determinants of transcriptional activity and local chromatin structure. This observation supports the view that R-loops form opportunistically during transcription and are stabilized in specific chromatin and sequence contexts [41,42]. To further investigate this, we explored the chromatin state and sequence-level features of Common R-loop regions.
2.5. Common R-Loops Are Enriched in Transcriptionally Active and Regulatory Chromatin States
Building on our observation that R-loop positioning does not depend on gene function, we next investigated their localization in relation to local chromatin environment. Using a universal chromatin state model that integrates 901 mouse epigenomic datasets [43], we assessed the enrichment of Common R-loop regions across 100 chromatin states. Among these, 38 states were significantly enriched, spanning 12 categories: Transcription Start Site (TSS), Promoter Flank (PromF), Bivalent Promoter (BivProm), Transcription and Exon (TxEx), Transcription (Tx), Transcribed Enhancer (TxEnh), Weak Enhancer (EnhWk), Active Enhancer (EnhA), Open Chromatin (OpenC), Polycomb Repressed and Open Chromatin (ReprPC openC), Zinc Finger Genes (ZNF), and Assembly Gaps and Artifacts (GapArtf) (Figure 4A and Figure S8A). The TSS and PromF states displayed the highest enrichment, followed by TxEx, EnhA, and OpenC, which is consistent with our earlier genomic annotations. These results indicate that Common R-loops preferentially located within transcriptionally active or regulatory chromatin contexts.
2.6. GC Skew as a Sequence Signature of R-Loops in Transcribed Chromatin States
We then characterized the sequence features within each state, focusing on features known to promote R-loop formation, specifically GC skew and G-quadruplex (G4) [42,44]. We first evaluated the nucleotide compositional asymmetry. GC skew was significantly higher in Common R-loop regions than in their state-matched background regions, particularly within the EnhWk, Tx, TxEx, and TSS states (Figure S9B). This trend was most pronounced in transcription elongation states (Tx and TxEx), indicating that GC skew is a key sequence feature that facilitates R-loop formation in transcriptionally active contexts (Figure 4B). We next assessed the enrichment of predicted G4 structures. G4 motif searches using Quadparser and G4Hunter yielded consistent results, showing that G4 motifs are abundant across most chromatin states, with strong enrichment in TxEnh, Tx, and ZNF, but relatively lower abundance at TSS and BivProm (Figure 4C, Figure S9C, and Figure S9D). In contrast, a machine-learning-based predictor (G4Boost), which estimates G4 folding propensity based on G4-seq data, indicated that the number of predicted G4 structures was comparable between R-loop regions and background regions (Figure S9E right). The predicted G4 motifs exhibited high folding probabilities (0.9-0.92; Figure S9E left). This suggests that the potential to form a G4 structure is a general genomic property, not a feature unique to R-loop regions. Collectively, these results indicate that the GC skew, rather than G4 structure, is a robust sequence signature for R-loop localization especially in active transcribed chromatin states.
2.7. Chromatin State-Dependent Motif Enrichment Delineates the Regulatory Context of Common R-Loop Regions
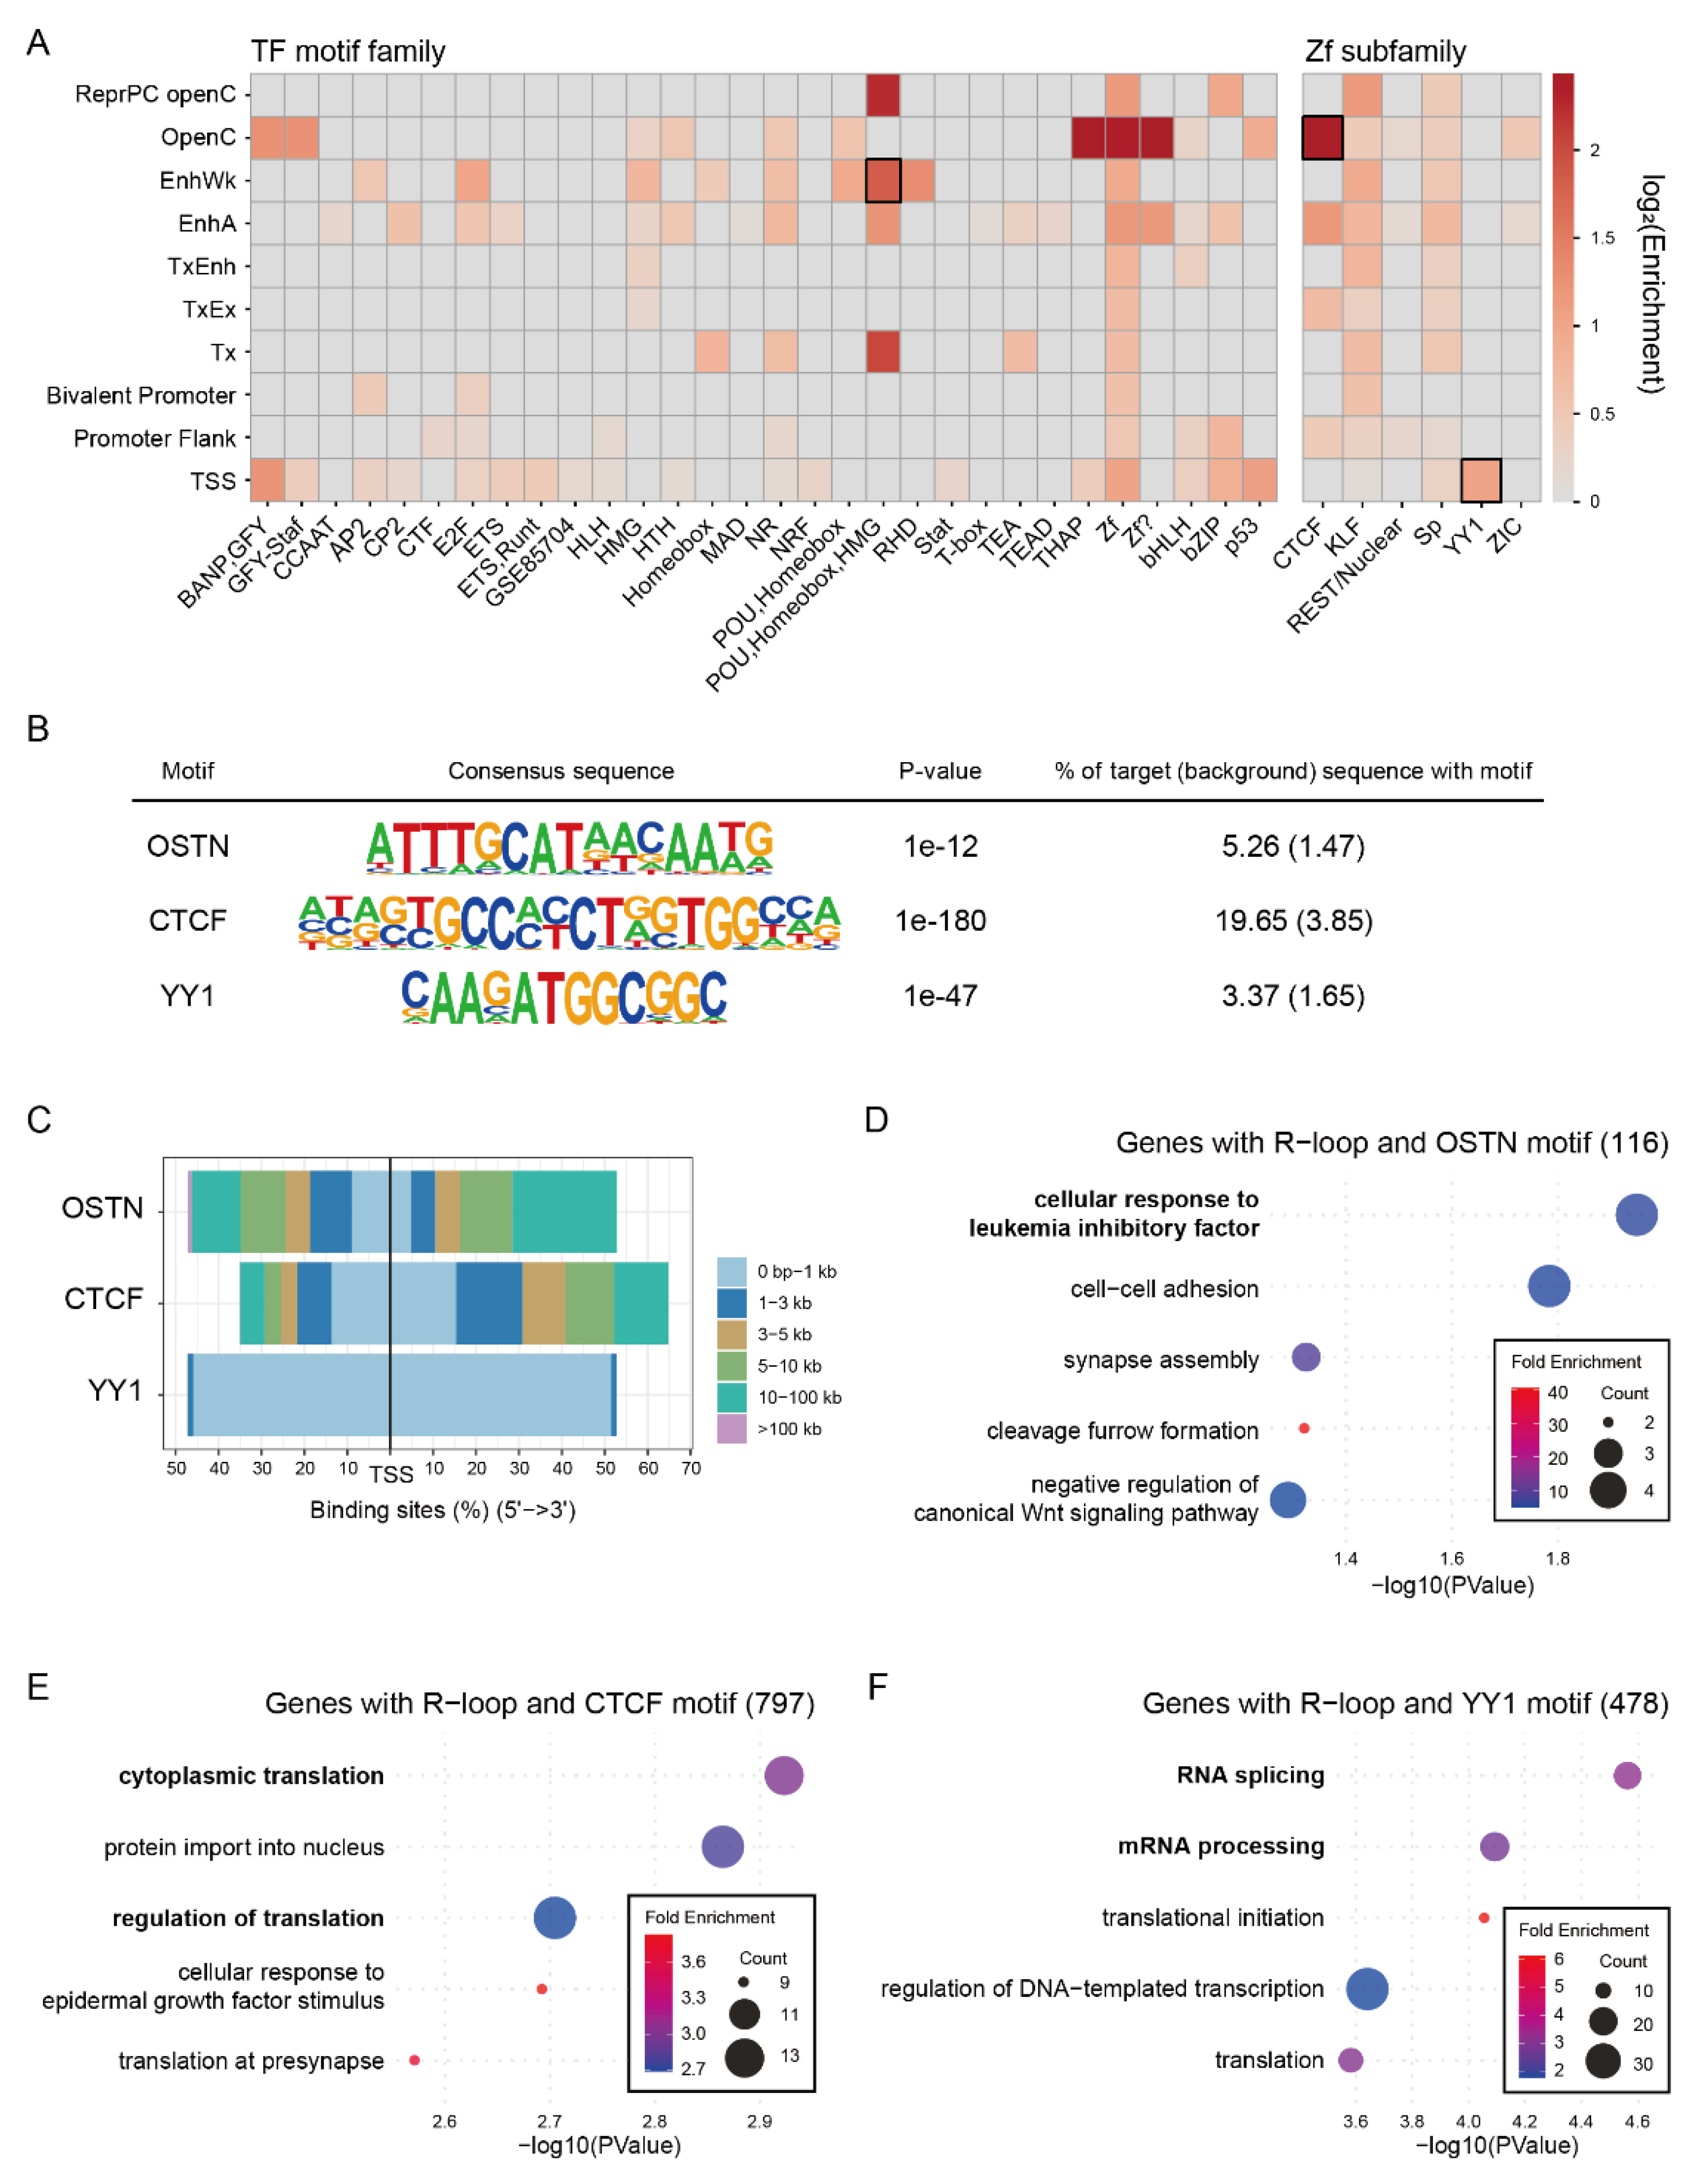
To investigate the regulatory environment of the Common R-loop regions, we analyzed the enrichment of transcription factor (TF) motifs across the chromatin states (Figure 5A). Analysis revealed distinct chromatin state–specific motif patterns. Notably, the POU-Homeobox-HMG motifs, corresponding to the core pluripotency factors OCT4, SOX2, TCF, and NANOG (OSTN), were highly enriched in the EnhA, EnhWk, ReprPC openC, and Tx states. These results suggest that R-loops may cooperate with stem cell master transcription factor at distal regulatory regions. Meanwhile, zinc finger (Zf) motifs were widespread across the chromatin states. However, unique chromatin-state preferences were revealed after classifying them into six subclasses. CTCF motifs were enriched in the OpenC, TxEx, EnhA, and PromF states. This is an expected finding, as these states represent key regulatory regions for chromatin insulation and enhancer-promoter interactions which are established roles of CTCF. Previous studies have reported that R-loops are enriched at CTCF binding regions, and our results support these findings [44]. The YY1 motifs were enriched in TSS states, suggesting a promoter-specific regulatory role with R-loops. It is noteworthy that the YY1 protein has been shown to bind G4 structures, which often co-occur with R-loops, to mediate enhancer-promoter looping [45,46]. To further explore the functional relevance of these motifs, we performed GO analysis of genes proximal to the R-loop regions co-occupied by specific TF motifs. Genes associated with both OSTN motif and Common R-loops were enriched for cellular response to leukemia inhibitory factors, consistent with their role in maintaining pluripotency [47,48] (Figure 5D). Genes associated with CTCF motifs and Common R-loops were enriched for cytoplasmic translation (Figure 5E), whereas genes with YY1 motifs and Common R-loops were enriched for RNA splicing and mRNA processing (Figure 5F).
Collectively, these results revealed that R-loops, in conjunction with specific TF motifs, occupy distinct positional and functional niches: OSTN motifs at enhancers are linked to pluripotency, CTCF motifs in open chromatin are linked to translation and YY1 motifs at promoters are linked to RNA processing.
3. Discussion
By integrating multi-platform R-loop profiling datasets from mESCs, we generated high-confidence Common R-loop regions and systematically characterized their genomic distribution, chromatin environment and functional relevance. This resource offers new insights into the integration of R-loops into RNA biology, with implications for development, genome regulation, and disease.
Our findings reinforce the concept that R-loops are preferentially localized to promoter-proximal and genic regions enriched in CpG islands, consistent with their established roles in transcriptional regulation. Notably, genes associated with Common R-loops were highly and stably expressed, with functional enrichment in RNA metabolism, particularly in mRNA processing, splicing, and ribonucleoprotein complex assembly. Although our analysis focused on the biological functions of genes associated with Common R-loop regions rather than their physical interactions with RNA processing proteins, multiple experimental studies have demonstrated that R-loops directly interact with RNA processing machinery. For instance, proximity proteomics has revealed enrichment of splicing factors, mRNA export and 3’ end processing proteins near R-loops, while DEAD-box helicases have been shown to bind R-loops and regulate rRNA processing [49,50,51]. Moreover, the splicing factor XAB2 can bind directly to R-loops and modulate intron retention and genomic stability [20], and RNA-processing complexes, such as splicing proteins and the TREX complex, functionally prevent R-loop formation and promote mRNA export [6]. These strong associations with post-transcriptional regulatory pathways suggest that Common R-loops serve as structural platforms at the transcriptional level by integrating gene expression with post-transcriptional regulation in RNA biology.
Chromatin state-aware analyses have revealed that Common R-loops are most enriched in transcriptionally active and regulatory chromatin states, including transcription start sites, promoter flanks, and active enhancers, which are often marked by histone modifications, such as H3K4me3 and H3K27ac. This context likely facilitates R-loop stabilization by promoting transcription initiation and elongation as well as by maintaining accessible DNA templates. At the sequence level, we identified the GC skew as a consistent determinant of R-loop formation in active chromatin contexts. Using quadparser and G4Hunter, we found that putative G4 motifs are significantly enriched within R-loop regions compared with background loci. In contrast, G4Boost, which was trained on G4-seq data to predict sequences with high intrinsic G4-folding propensity, did not reveal a corresponding enrichment of strongly predicted G4 structures in R-loop regions. These observations suggest that R-loops preferentially occur at G-rich loci harboring potential G4 motifs, but that R-loop localization is not strictly determined by sequences with exceptionally high intrinsic G4-forming capacity as defined by G4Boost. Rather, we propose that R-loop formation itself, by generating stretches of single-stranded G-rich DNA, may increase the opportunity for G4 folding at these sites.
Co-localization of R-loops with transcription factor motifs revealed distinct regulatory environments. Pluripotency-associated factors (OCT4, SOX2, TCF, and NANOG) were enriched in enhancer-like R-loop regions, suggesting their role in maintaining stem cell identity. CTCF-associated R-loops were enriched in the open chromatin state and linked to translation-related genes. This association may reflect broader role of CTCF in organizing the chromatin architecture to facilitate transcriptional programs, including those that govern protein synthesis [44]. YY1-associated R-loops in promoters are enriched for RNA splicing and mRNA processing, reinforcing the connection between R-loops and RNA metabolism. Moreover, CTCF and YY1 cooperate to establish developmentally regulated chromatin loops, with YY1-mediated enhancer-promoter interactions often nested within CTCF-anchored topological domains [52,53]. This raises the possibility that R-loops, together with CTCF and YY1, act cooperatively as structural platforms to coordinate post-transcriptional pathway regulation in pluripotent cells.
From a disease perspective, our data suggest that the disruption of R-loop regulation at these conserved sites could impact essential RNA processing pathways, potentially contributing to the pathogenesis of RNA metabolism disorders, cancer, and other transcription-associated diseases [41,54,55,56]. The identification of sequences and chromatin features that stabilize R-loops may inform strategies to selectively target pathological R-loop accumulation or harness R-loops as biomarkers for RNA-targeted therapies.
In summary, this study defined the conserved R-loop landscape in mESCs and provided a framework for integrating chromatin context, sequence determinants, and transcription factor associations into models of R-loop function. By bridging transcription and RNA metabolism, these structures have emerged as key players in RNA biology, with broad relevance to development, disease, and therapeutic innovation.
4. Materials and Methods
Curation of R-Loop Datasets
Public R-loop profiling datasets for mESCs were collected by searching the GEO DataSets database with the keywords “R-loop” and “RNA-DNA hybrid,” filtering for Mus musculus data. This search yielded 78 R-loop and 35 RNA–DNA hybrid datasets. Of these, 22 datasets (13 R-loop, 4 RNase-treated, and 4 MNase) from seven studies were selected (Table S1) [34,35,44,57,58,59,60]. R-loop profiling methods include DRIP-seq, DRIP-RNA-seq, MapR, BisMapR, HBD-seq, and CUT&Tag. Datasets were categorized by R-loop probe type (S9.6 or dRNaseH) and the timing of R-loop detection (ex vivo or in situ).
Public Data Processing
The MapR, BisMapR, HBD-seq, CUT&Tag, and DRIP-seq datasets were processed as follows: reads were trimmed using fastp (v0.23.4) [61,62] and aligned to the mouse genome (mm10) using bowtie2 (v2.5.4) [63]. Raw BAM files were filtered using samtools (v1.19.2) [64] to remove low-quality and unmapped reads (flag 0×4), retaining only properly paired reads (flag 0×2) with a MAPQ ≥ 10. To minimize PCR duplicates, BAM files were processed with samtools fixmate, coordinate-sorted, and deduplicated using samtools markdup -r. To eliminate mitochondrial DNA, reads aligned to chromosome chrM were removed using samtools view. Reads mapped to the ENCODE mm10 blacklist regions were removed using bedtools intersect (v2.31.1) [65].
The DRIP-RNAseq datasets were processed as follows: reads were trimmed using fastp and aligned to the mouse genome (mm10) using STAR aligner (v2.7.11b) [66]. Raw BAM files were filtered using Samtools to retain only reads with MAPQ ≥ 10, excluding unmapped reads. The mitochondrial reads (chrM) were removed. Blacklist filtering was performed using bedtools intersect.
The coverage tracks were generated using deeptools (v3.5.5) bamCoverage [67]. Peak calling was performed using MACS3 (v3.0.2) callpeak [68].
RNA-seq datasets were processed as follows: reads were trimmed using fastp and aligned to the mouse genome (mm10) using the STAR aligner. The read counts per gene were quantified using featureCounts (v2.1.1) [69]. Lowly expressed genes were filtered by calculating counts per million (CPM), retaining genes with CPM 1 in at least one sample. Trimmed mean of M-value normalization was applied to correct for library size differences across samples. After filtering and normalization, a final set of expressed genes was established for use as the background gene set for subsequent enrichment analyses.
Identification of Common R-Loop Regions
To define the consensus R-loop regions reproducibly detected across different profiling methods, narrowPeak files were processed using bedtools multiIntersectBed (v2.31.1). Regions were retained if at least one dataset from each experimental group (CUT&Tag, HBD, DRIP, or MapR) exhibited a peak. To preserve the biological extent of the observed peaks and avoid the reduction in peak size that can occur with intersection operations, we retrieved the full span of the original peaks that contribute to each intersection. Adjacent or overlapping peaks were merged using bedtools merge. The final merged regions were designated Common R-loop regions.
Gene Annotation and Functional Enrichment Analysis
Common R-loop regions were annotated to the nearest genes using ChIPseeker (v1.44.0) [70] with the mm10 mouse genome annotation. Gene Ontology (GO) enrichment analysis was performed using clusterProfiler (v4.16.0) [71] using all expressed genes from the RNA-seq data as the background. GO terms with P-value < 0.01 and q-value < 0.05 were considered statistically significant. Redundancy reduction and clustering were performed using enrichment-map-based approaches. DAVID [72,73] was used for the cross-validation.
Chromatin State Annotation
Enrichment of Common R-loop regions across chromatin states was assessed using fold enrichment values calculated using ChromHMM (v1.26) [74] based on universal chromatin state annotation [43]. Fold enrichment was defined as (C/A)/(B/D), where:
A = total bases assigned to a chromatin state,
B = total bases covered by Common R-loop regions,
C = overlap bases between the chromatin state and Common R-loop regions,
D = total genome size.
Construction of Chromatin State-Specific R-Loop Rich Regions
The mouse genome was partitioned into non-overlapping 200 bp windows based on universal chromatin state annotation. The contiguous segments of the same state were divided into uniform windows. Windows overlapping Common R-loop regions were identified using bedtools intersect. Several overlap thresholds (-f options: no threshold, 0.2, 0.5, and 0.8) were tested; the -f 0.5 threshold was selected based on the coverage and chromatin state representation (Figure S8).
Nucleotide Skewness Analysis
GC skew [(G – C)/(G + C)] and AT skew [(A – T)/(A + T)] were calculated for each 200 bp window. Since strand information was not available, absolute skew values were used. Skewness was compared between the R-loop-rich regions and ex-R-loop background within each chromatin state.
G-Quadruplex Motif Analysis
Canonical G-quadruplex (G4) motifs were identified using a regular expression-based quadparser (G3+N1-7G3+N1-7G3+N1-7G3+) [75]. G4Hunter was applied to score G4-forming potential, scores ≥ 1.2 were considered G4-positive [76]. G4Boost, a machine-learning model trained on G4-seq data, was used to predict G4 formation. The frequency and score of the G4 motifs calculated using each method were compared between R-loop-rich regions and ex-R-loop backgrounds [77].
Transcription Factor Motif Enrichment Analysis
Motif enrichment was analyzed using HOMER (v5.1) [78]. R-loop-rich regions were used as the input and the corresponding ex-R-loop segments were used as the background. P-values, q-values, and fold enrichment were computed using HOMER with hypergeometric/binomial models.
Statistical Analysis
For nucleotide skewness and G4 motif analyses, the statistical significance was evaluated using a permutation-based subsampling approach. Within each chromatin state, the same number of background regions as the input was randomly sampled 10,000 times to generate a null distribution. The empirical p-values were calculated based on the proportion of background means greater than or equal to the observed input mean. Z-scores were computed for a standardized effect size. The enrichment score was calculated using following equation: . Statistical significance was determined internally for HOMER-based motif enrichment.
5. Conclusions
By systematically integrating multiplatform R-loop profiling datasets from mESCs, we identified a high-confidence set of conserved R-loop regions and characterized their genomic distribution, chromatin context, and regulatory associations. These Common R-loops are not randomly distributed but are enriched at promoter-proximal and genic loci, particularly in genes involved in RNA metabolism. Their localization within transcriptionally active chromatin states and association with specific transcription factor networks, such as OCT4-SOX2-TCF-NANOG, CTCF, and YY1, support a model in which conserved R-loops function as structural platforms that bridge transcriptional and post-transcriptional regulation. The identification of GC skew as a robust sequence determinant further refines our understanding of R-loop stability in active chromatin environments. Disruption of these conserved R-loop features can perturb essential RNA-processing pathways and contribute to disease pathogenesis. This work provides a foundational framework for future studies to explore the mechanistic roles of R-loops in RNA biology and evaluate their potential as biomarkers or therapeutic targets.
Supplementary Materials
The following supporting information can be downloaded at the website of this paper posted on Preprints.org.
Author Contributions
Conceptualization, K.H. and O.K.; Methodology, K.H. and O.K.; Validation, K.H. and O.K.; Formal Analysis, K.H. and O.K.; Investigation, K.H., O.K., H.L., S.Y., H.L. (Hyeonji Lee), H.L. (Heeji Lee), H.L. (Hoseong Lim), C.P., D.W.H., J.T.D., H.S. and Y.C.; Resources, K.H. and O.K.; Data curation, K.H. and O.K.; writing – original draft preparation, O.K.; writing – review & editing, K.H.; visualization, O.K.; supervision, K.H.; project administration, K.H. and O.K.; funding acquisition, K.H. All authors have read and agreed to the published version of the manuscript.
Funding
This research was funded by National Research Foundation of Korea (NRF) grant number RS-2024-00344340.
Institutional Review Board Statement
Not applicable.
Informed Consent Statement
Not applicable.
Data Availability Statement
The original data presented in the study are openly available in GSE70189, GSE67581, GSE173103, GSE208145, GSE226042, GSE160578, GSE254764, GSE262195, GSE232524, GSE226214, and GSE254763.
Acknowledgments
The authors gratefully acknowledge all members of the KH laboratory for their valuable discussions.
Conflicts of Interest
The authors declare no conflicts of interest.
Abbreviations
The following abbreviations are used in this manuscript:
| mESC | Mouse embryonic stem cell |
| DRIP | DNA-RNA immunoprecipitation |
| HBD | Hybrid binding domain |
| GO | Gene ontology |
| GOBP | Gene ontology biological process |
| GOCC | Gene ontology cellular component |
| GOMF | Gene ontology molecular function |
| cCRE | Candidate cis regulatory element |
| TTS | Transcription termination site |
| LINE | Long interspersed nuclear element |
| SINE | Short interspersed nuclear element |
| LTR | Long terminal repeat |
| ncRNA | Non-coding RNA |
| TSS | Transcription start site |
| PromF | Promoter flank |
| BivProm | Bivalent promoter |
| TxEx | Transcription and exon |
| Tx | Transcription |
| TxEnh | Transcribed enhancer |
| EnhA | Active enhancer |
| OpenC | Open chromatin |
| ReprPC openC | Polycomb repressed and open chromatin |
| ZNF | Zinc finger genes |
| GapArtf | Assembly gaps and artifacts |
| OSTN | OCT4-SOX2-TCF-NANOG |
| NR | Nuclear receptor |
| Zf | Zinc finger |
References
- Thomas, M.; White, R.L.; Davis, R.W. Hybridization of RNA to double-stranded DNA: formation of R-loops. Proc Natl Acad Sci U S A 1976, 73, 2294–2298. [Google Scholar] [CrossRef]
- White, R.L.; Hogness, D.S. R loop mapping of the 18S and 28S sequences in the long and short repeating units of Drosophila melanogaster rDNA. Cell 1977, 10, 177–192. [Google Scholar] [CrossRef] [PubMed]
- Aguilera, A.; Garcia-Muse, T. R loops: from transcription byproducts to threats to genome stability. Mol Cell 2012, 46, 115–124. [Google Scholar] [CrossRef]
- Santos-Pereira, J.M.; Aguilera, A. R loops: new modulators of genome dynamics and function. Nat Rev Genet 2015, 16, 583–597. [Google Scholar] [CrossRef]
- Petermann, E.; Lan, L.; Zou, L. Sources, resolution and physiological relevance of R-loops and RNA-DNA hybrids. Nat Rev Mol Cell Biol 2022, 23, 521–540. [Google Scholar] [CrossRef]
- Lee, S.Y.; Kwak, M.J.; Kim, J.J. R-loops: a key driver of inflammatory responses in cancer. Exp Mol Med 2025, 57, 1455–1466. [Google Scholar] [CrossRef] [PubMed]
- Xu, Y.; et al. R-loop and diseases: the cell cycle matters. Mol Cancer 2024, 23, 84. [Google Scholar] [CrossRef]
- Lee, H.G.; et al. Site-specific R-loops induce CGG repeat contraction and fragile X gene reactivation. Cell 2023, 186, 2593–2609 e18. [Google Scholar] [CrossRef]
- Zhang, S.; et al. Aberrant R-loop-mediated immune evasion, cellular communication, and metabolic reprogramming affect cancer progression: a single-cell analysis. Mol Cancer 2024, 23, 11. [Google Scholar] [CrossRef]
- Ouyang, Y.; et al. Dysregulation of R-loop homeostasis shapes the immunosuppressive microenvironment and induces malignant progression in melanoma. Apoptosis 2025, 30, 131–148. [Google Scholar] [CrossRef]
- Xu, C.; et al. R-loop-dependent promoter-proximal termination ensures genome stability. Nature 2023, 621, 610–619. [Google Scholar]
- Castillo-Guzman, D.; Chedin, F. Defining R-loop classes and their contributions to genome instability. DNA Repair (Amst) 2021, 106, 103182. [Google Scholar] [CrossRef] [PubMed]
- Moore, M.J.; Proudfoot, N.J. Pre-mRNA processing reaches back to transcription and ahead to translation. Cell 2009, 136, 688–700. [Google Scholar] [CrossRef] [PubMed]
- Allison, D.F.; Wang, G.G. R-loops: formation, function, and relevance to cell stress. Cell Stress 2019, 3, 38–46. [Google Scholar] [CrossRef]
- Luna, R.; Gomez-Gonzalez, B.; Aguilera, A. RNA biogenesis and RNA metabolism factors as R-loop suppressors: a hidden role in genome integrity. Genes Dev 2024, 38, 504–527. [Google Scholar] [CrossRef]
- Xu, C.; et al. R-loop resolution promotes co-transcriptional chromatin silencing. Nat Commun 2021, 12, 1790. [Google Scholar] [CrossRef]
- Qiu, Y.; et al. R-loops’ m6A modification and its roles in cancers. Mol Cancer 2024, 23, 232. [Google Scholar] [CrossRef] [PubMed]
- Chedin, F. Nascent Connections: R-Loops and Chromatin Patterning. Trends Genet 2016, 32, 828–838. [Google Scholar] [CrossRef]
- Kim, A.; Wang, G.G. R-loop and its functions at the regulatory interfaces between transcription and (epi)genome. Biochim Biophys Acta Gene Regul Mech 2021, 1864, 194750. [Google Scholar] [CrossRef]
- Goulielmaki, E.; et al. The splicing factor XAB2 interacts with ERCC1-XPF and XPG for R-loop processing. Nat Commun 2021, 12, 3153. [Google Scholar] [CrossRef]
- Jin, B.; et al. MEN1 is a regulator of alternative splicing and prevents R-loop-induced genome instability through suppression of RNA polymerase II elongation. Nucleic Acids Res 2023, 51, 7951–7971. [Google Scholar] [CrossRef]
- Stratigi, K.; Siametis, A.; Garinis, G.A. Looping forward: exploring R-loop processing and therapeutic potential. FEBS Lett 2025, 599, 244–266. [Google Scholar] [CrossRef] [PubMed]
- Chen, L.; et al. The Augmented R-Loop Is a Unifying Mechanism for Myelodysplastic Syndromes Induced by High-Risk Splicing Factor Mutations. Mol Cell 2018, 69, 412–425 e6. [Google Scholar] [CrossRef] [PubMed]
- Liu, Z.S.; et al. R-Loop Accumulation in Spliceosome Mutant Leukemias Confers Sensitivity to PARP1 Inhibition by Triggering Transcription-Replication Conflicts. Cancer Res 2024, 84, 577–597. [Google Scholar] [CrossRef]
- Chakraborty, P.; Huang, J.T.J.; Hiom, K. DHX9 helicase promotes R-loop formation in cells with impaired RNA splicing. Nat Commun 2018, 9, 4346. [Google Scholar] [CrossRef]
- Bhandari, J.; et al. The molecular chaperone ALYREF promotes R-loop resolution and maintains genome stability. J Biol Chem 2024, 300, 107996. [Google Scholar] [CrossRef]
- Merida-Cerro, J.A.; et al. Cellular imbalance of specific RNA-binding proteins associates with harmful R-loops. PLoS Genet 2025, 21, e1011491. [Google Scholar] [CrossRef]
- Jayakumar, S.; et al. PSIP1/LEDGF reduces R-loops at transcription sites to maintain genome integrity. Nat Commun 2024, 15, 361. [Google Scholar] [CrossRef]
- Belotserkovskii, B.P.; et al. R-loop generation during transcription: Formation, processing and cellular outcomes. DNA Repair (Amst) 2018, 71, 69–81. [Google Scholar] [CrossRef]
- Ginno, P.A.; et al. R-loop formation is a distinctive characteristic of unmethylated human CpG island promoters. Mol Cell 2012, 45, 814–825. [Google Scholar] [CrossRef]
- Sanz, L.A.; Chedin, F. High-resolution, strand-specific R-loop mapping via S9.6-based DNA-RNA immunoprecipitation and high-throughput sequencing. Nat Protoc 2019, 14, 1734–1755. [Google Scholar] [CrossRef]
- Yan, Q.; et al. Mapping Native R-Loops Genome-wide Using a Targeted Nuclease Approach. Cell Rep 2019, 29, 1369–1380 e5. [Google Scholar] [CrossRef] [PubMed]
- Wang, K.; et al. Genomic profiling of native R loops with a DNA-RNA hybrid recognition sensor. Sci Adv 2021, 7. [Google Scholar] [CrossRef] [PubMed]
- Wulfridge, P.; Sarma, K. A nuclease- and bisulfite-based strategy captures strand-specific R-loops genome-wide. Elife 2021, 10. [Google Scholar] [CrossRef] [PubMed]
- Chen, P.B.; et al. R loops regulate promoter-proximal chromatin architecture and cellular differentiation. Nat Struct Mol Biol 2015, 22, 999–1007. [Google Scholar] [CrossRef]
- Miller, H.E.; et al. Quality-controlled R-loop meta-analysis reveals the characteristics of R-loop consensus regions. Nucleic Acids Res 2022, 50, 7260–7286. [Google Scholar] [CrossRef]
- Yu, K.; et al. R-loops at immunoglobulin class switch regions in the chromosomes of stimulated B cells. Nat Immunol 2003, 4, 442–451. [Google Scholar] [CrossRef]
- Duquette, M.L.; et al. Intracellular transcription of G-rich DNAs induces formation of G-loops, novel structures containing G4 DNA. Genes Dev 2004, 18, 1618–1629. [Google Scholar] [CrossRef]
- Chen, L.; et al. R-ChIP Using Inactive RNase H Reveals Dynamic Coupling of R-loops with Transcriptional Pausing at Gene Promoters. Mol Cell 2017, 68, 745–757 e5. [Google Scholar] [CrossRef]
- McLean, C.Y.; et al. GREAT improves functional interpretation of cis-regulatory regions. Nat Biotechnol 2010, 28, 495–501. [Google Scholar] [CrossRef]
- Garcia-Muse, T.; Aguilera, A. R Loops: From Physiological to Pathological Roles. Cell 2019, 179, 604–618. [Google Scholar] [CrossRef]
- Ginno, P.A.; et al. GC skew at the 5’ and 3’ ends of human genes links R-loop formation to epigenetic regulation and transcription termination. Genome Res 2013, 23, 1590–1600. [Google Scholar] [CrossRef] [PubMed]
- Vu, H.; Ernst, J. Universal chromatin state annotation of the mouse genome. Genome Biol 2023, 24, 153. [Google Scholar] [CrossRef] [PubMed]
- Wulfridge, P.; et al. G-quadruplexes associated with R-loops promote CTCF binding. Mol Cell 2023, 83, 3064–3079 e5. [Google Scholar] [CrossRef] [PubMed]
- Li, L.; et al. YY1 interacts with guanine quadruplexes to regulate DNA looping and gene expression. Nat Chem Biol 2021, 17, 161–168. [Google Scholar] [CrossRef]
- Wulfridge, P.; Sarma, K. Intertwining roles of R-loops and G-quadruplexes in DNA repair, transcription and genome organization. Nat Cell Biol 2024, 26, 1025–1036. [Google Scholar] [CrossRef]
- Chambers, I.; Tomlinson, S.R. The transcriptional foundation of pluripotency. Development 2009, 136, 2311–2322. [Google Scholar] [CrossRef]
- Niwa, H.; et al. A parallel circuit of LIF signalling pathways maintains pluripotency of mouse ES cells. Nature 2009, 460, 118–122. [Google Scholar] [CrossRef]
- Mosler, T.; et al. R-loop proximity proteomics identifies a role of DDX41 in transcription-associated genomic instability. Nat Commun 2021, 12, 7314. [Google Scholar] [CrossRef]
- Wu, T.; et al. Characterization of R-Loop-Interacting Proteins in Embryonic Stem Cells Reveals Roles in rRNA Processing and Gene Expression. Mol Cell Proteomics 2021, 20, 100142. [Google Scholar] [CrossRef]
- Yan, Q.; et al. Proximity labeling identifies a repertoire of site-specific R-loop modulators. Nat Commun 2022, 13, 53. [Google Scholar] [CrossRef] [PubMed]
- Beagan, J.A.; et al. YY1 and CTCF orchestrate a 3D chromatin looping switch during early neural lineage commitment. Genome Res 2017, 27, 1139–1152. [Google Scholar] [CrossRef]
- Weintraub, A.S.; et al. YY1 Is a Structural Regulator of Enhancer-Promoter Loops. Cell 2017, 171, 1573–1588 e28. [Google Scholar] [CrossRef] [PubMed]
- Khan, E.S.; Danckwardt, S. Pathophysiological Role and Diagnostic Potential of R-Loops in Cancer and Beyond. Genes (Basel) 2022, 13. [Google Scholar] [CrossRef]
- Gatti, V.; et al. Senataxin and R-loops homeostasis: multifaced implications in carcinogenesis. Cell Death Discov 2023, 9, 145. [Google Scholar] [CrossRef] [PubMed]
- Zhang, F.; et al. Unraveling R-loops: The hidden drivers of inflammation and immune dysregulation. Medicine (Baltimore) 2025, 104, e42833. [Google Scholar] [CrossRef]
- Sanz, L.A.; et al. Prevalent, Dynamic, and Conserved R-Loop Structures Associate with Specific Epigenomic Signatures in Mammals. Mol Cell 2016, 63, 167–178. [Google Scholar] [CrossRef]
- Lyu, J.; et al. Genome-wide mapping of G-quadruplex structures with CUT&Tag. Nucleic Acids Res 2022, 50, e13. [Google Scholar]
- Huang, X.; et al. ZFP281 controls transcriptional and epigenetic changes promoting mouse pluripotent state transitions via DNMT3 and TET1. Dev Cell 2024, 59, 465–481 e6. [Google Scholar] [CrossRef]
- Liu, T.; et al. Genome-wide mapping of native co-localized G4s and R-loops in living cells. Elife 2024, 13. [Google Scholar] [CrossRef]
- Chen, S.; et al. fastp: an ultra-fast all-in-one FASTQ preprocessor. Bioinformatics 2018, 34, i884–i890. [Google Scholar] [CrossRef]
- Chen, S. Ultrafast one-pass FASTQ data preprocessing, quality control, and deduplication using fastp. Imeta 2023, 2, e107. [Google Scholar] [CrossRef]
- Langmead, B.; Salzberg, S.L. Fast gapped-read alignment with Bowtie 2. Nat Methods 2012, 9, 357–359. [Google Scholar] [CrossRef]
- Danecek, P.; et al. Twelve years of SAMtools and BCFtools. Gigascience 2021, 10. [Google Scholar] [CrossRef]
- Quinlan, A.R.; Hall, I.M. BEDTools: a flexible suite of utilities for comparing genomic features. Bioinformatics 2010, 26, 841–842. [Google Scholar] [CrossRef] [PubMed]
- Dobin, A.; et al. STAR: ultrafast universal RNA-seq aligner. Bioinformatics 2013, 29, 15–21. [Google Scholar] [CrossRef] [PubMed]
- Ramirez, F.; et al. deepTools2: a next generation web server for deep-sequencing data analysis. Nucleic Acids Res 2016, 44, W160–5. [Google Scholar] [CrossRef]
- Zhang, Y.; et al. Model-based analysis of ChIP-Seq (MACS). Genome Biol 2008, 9, R137. [Google Scholar] [CrossRef]
- Liao, Y.; Smyth, G.K.; Shi, W. featureCounts: an efficient general purpose program for assigning sequence reads to genomic features. Bioinformatics 2014, 30, 923–930. [Google Scholar] [CrossRef] [PubMed]
- Yu, G.; Wang, L.G.; He, Q.Y. ChIPseeker: an R/Bioconductor package for ChIP peak annotation, comparison and visualization. Bioinformatics 2015, 31, 2382–2383. [Google Scholar] [CrossRef]
- Yu, G.; et al. clusterProfiler: an R package for comparing biological themes among gene clusters. OMICS 2012, 16, 284–287. [Google Scholar] [CrossRef]
- Huang da, W.; Sherman, B.T.; Lempicki, R.A. Systematic and integrative analysis of large gene lists using DAVID bioinformatics resources. Nat Protoc 2009, 4, 44–57. [Google Scholar] [CrossRef]
- Sherman, B.T.; et al. DAVID: a web server for functional enrichment analysis and functional annotation of gene lists (2021 update). Nucleic Acids Res 2022, 50, W216–W221. [Google Scholar] [CrossRef]
- Ernst, J.; Kellis, M. Chromatin-state discovery and genome annotation with ChromHMM. Nat Protoc 2017, 12, 2478–2492. [Google Scholar] [CrossRef] [PubMed]
- Huppert, J.L.; Balasubramanian, S. Prevalence of quadruplexes in the human genome. Nucleic Acids Res 2005, 33, 2908–2916. [Google Scholar] [CrossRef]
- Bedrat, A.; Lacroix, L.; Mergny, J.L. Re-evaluation of G-quadruplex propensity with G4Hunter. Nucleic Acids Res 2016, 44, 1746–1759. [Google Scholar] [CrossRef] [PubMed]
- Cagirici, H.B.; Budak, H.; Sen, T.Z. G4Boost: a machine learning-based tool for quadruplex identification and stability prediction. BMC Bioinformatics 2022, 23, 240. [Google Scholar] [CrossRef]
- Heinz, S.; et al. Simple combinations of lineage-determining transcription factors prime cis-regulatory elements required for macrophage and B cell identities. Mol Cell 2010, 38, 576–589. [Google Scholar] [CrossRef]
Figure 1.
Integration of R-loop profiling datasets defines Common R-loop regions. (A) Schematic workflow for defining Common R-loop regions by integrating 13 datasets generated from four R-loop profiling methods. RNA-seq data were used for functional enrichment analysis, and chromatin state data were used for epigenome context profiling. (B) R-loop signals within ±2 kb of the center of Common R-loop regions. Each row on the y-axis corresponds to a single Common R-loop region. RPGC (Read Per Genome Coverage) normalized bigwig files were used for visualization. (C) Genome browser snapshot of R-loop datasets in Pou5f1 locus, showing that the Common R-loop regions (sky blue boxes) are consistently enriched for R-loop signals across methods. (D) Length distribution of Common R-loop regions, with the most frequent length range observed between 100 and 200 bp. (E) Genomic distribution of the Common R-loop regions, showing preferential enrichment within transcribed and regulatory regions. Transcript regions were defined using UCSC mm10 RefSeq annotations. CpG island and candidate cis regulatory elements (cCREs) were defined using UCSC genome annotations.
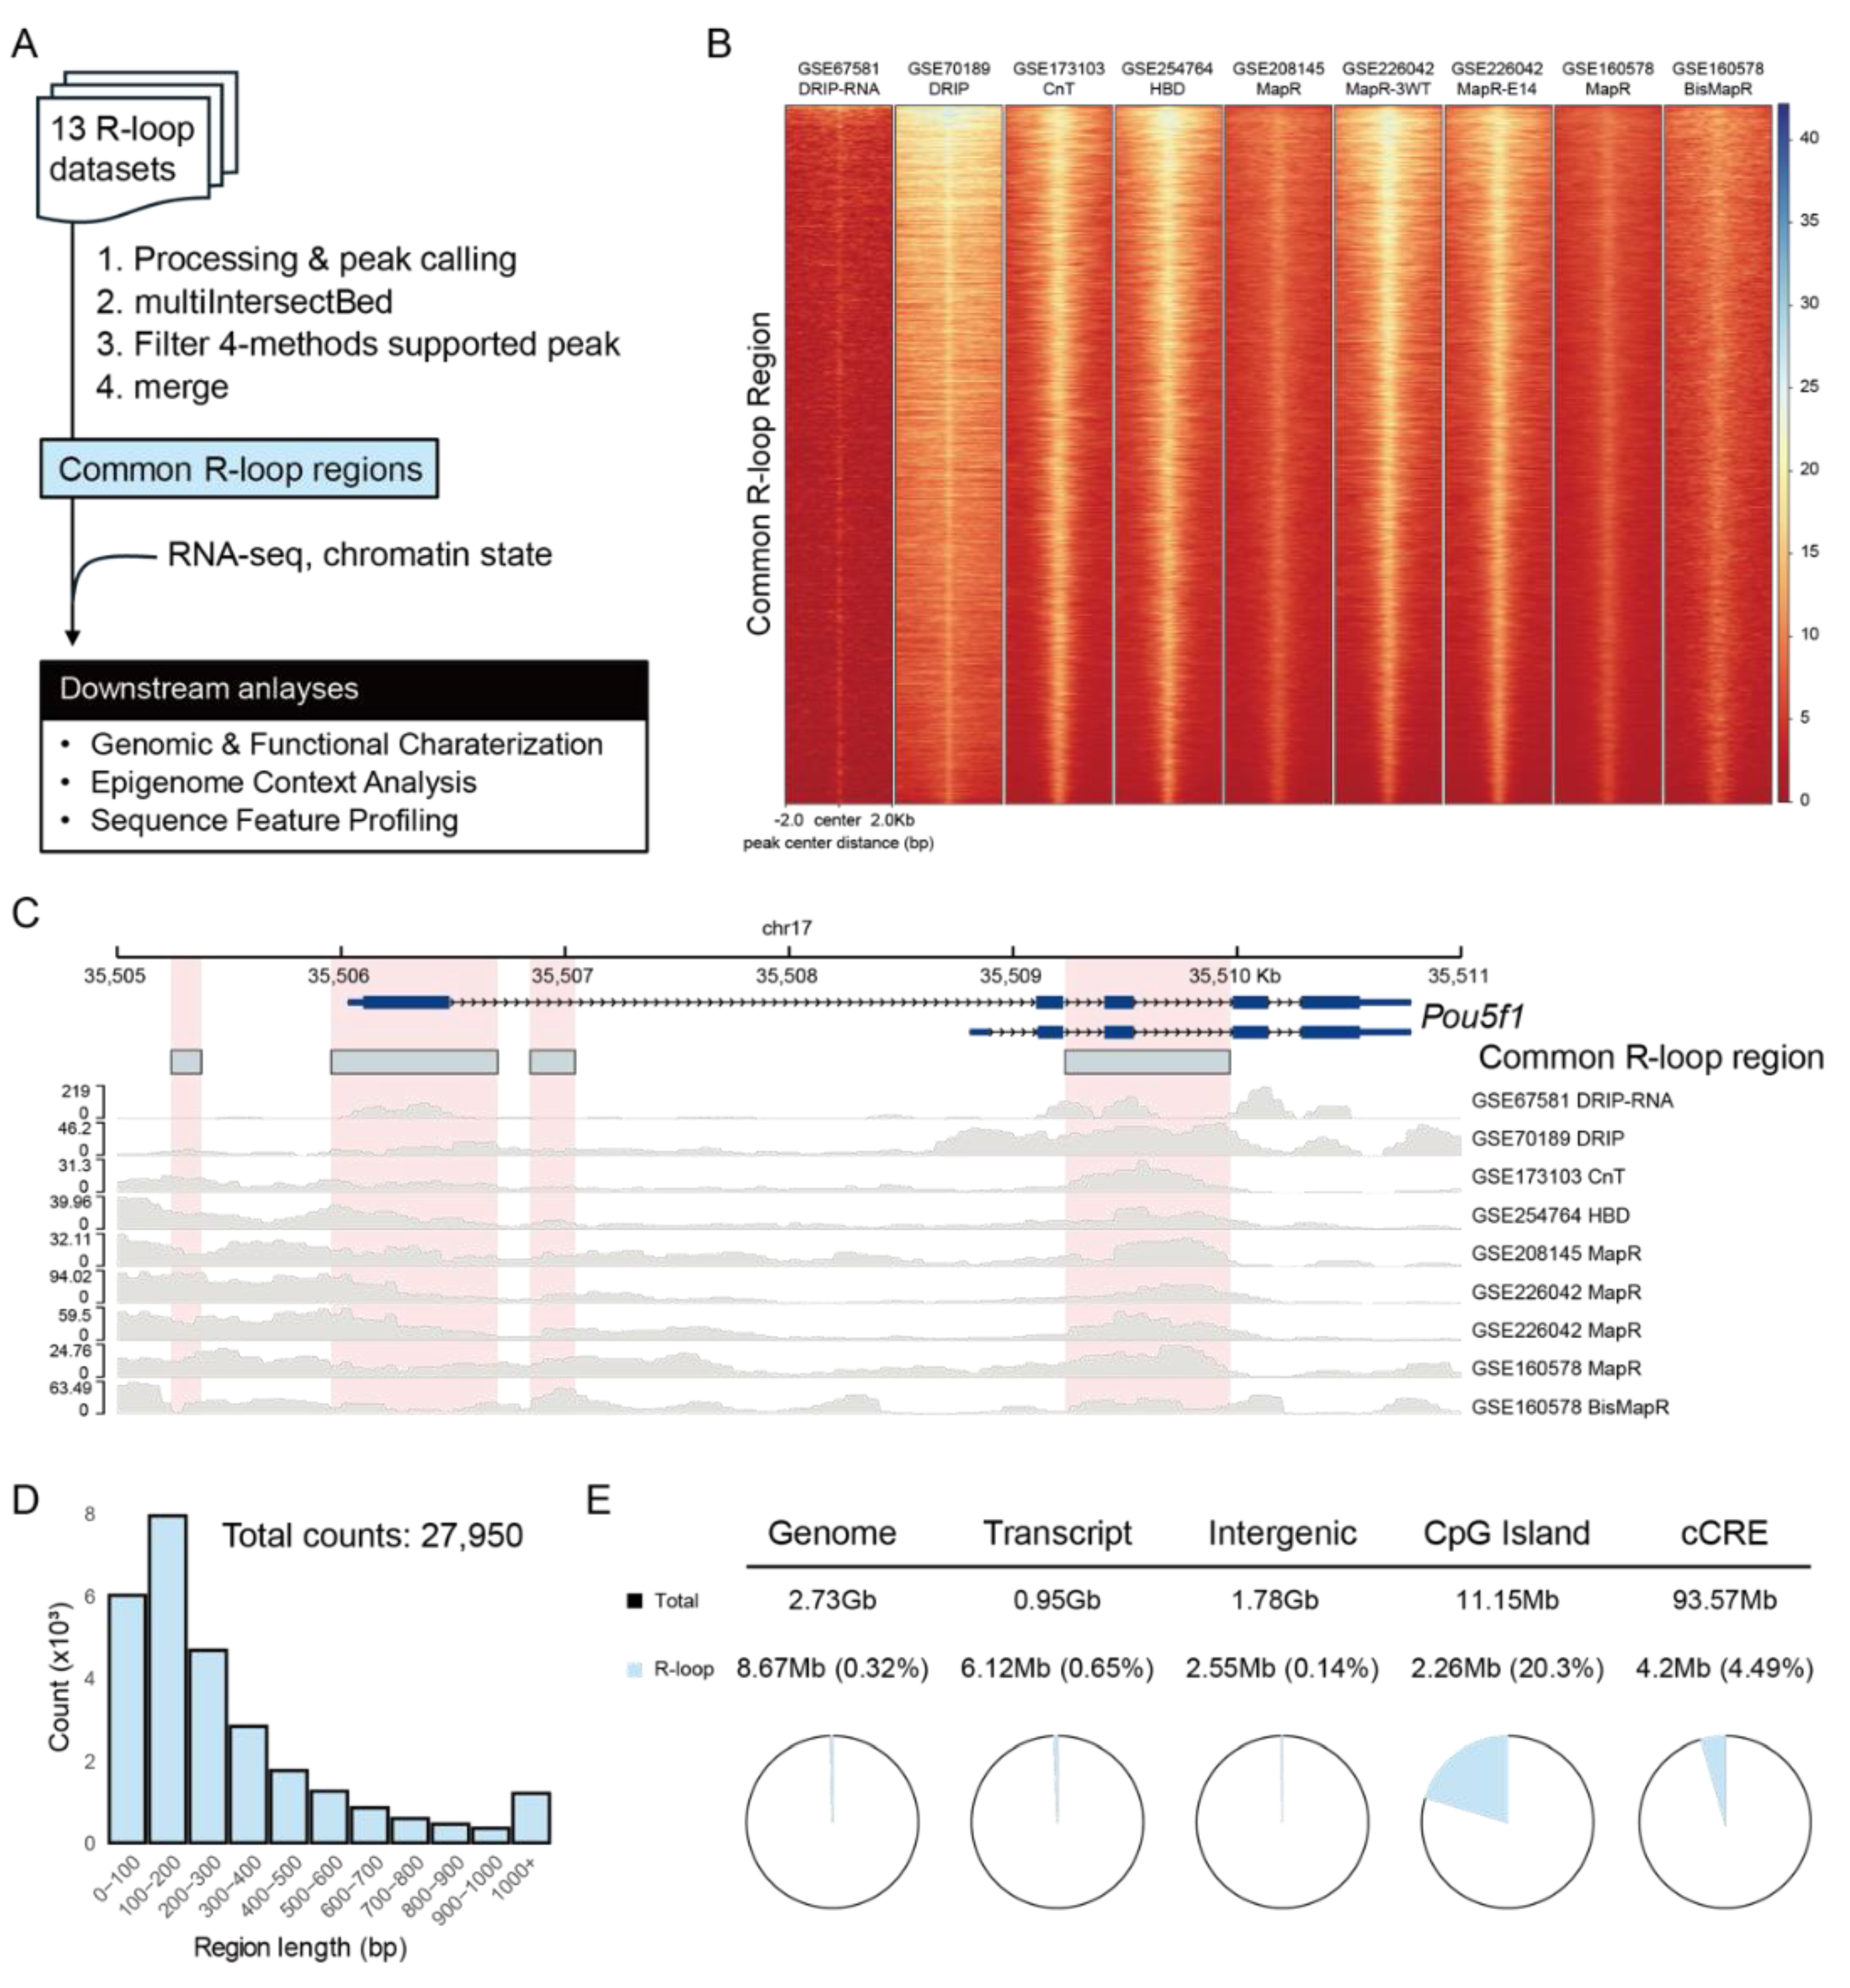
Figure 2.
Common R-loops preferentially enriched at genic regions. (A) Genomic annotation of Common R-loop regions compared with individual datasets. The category “etc” represents low-frequency annotations combined into a single group, including snoRNA, DNA elements, and other minor categories. (B) Genomic feature enrichment of individual R-loop peaks (gray) and Common R-loop regions (red). Enrichment was calculated by comparing the observed distribution of annotations with their expected genomic distribution. CpG island, promoter, 5′UTR, exon and TTSs are strongly enriched, indicating that Common R-loop regions preferentially localized within genic regions. TTS, transcription termination site; LINE, long interspersed nuclear element; SINE, short interspersed nuclear element; LTR, long terminal repeat; ncRNA, non-coding RNA.
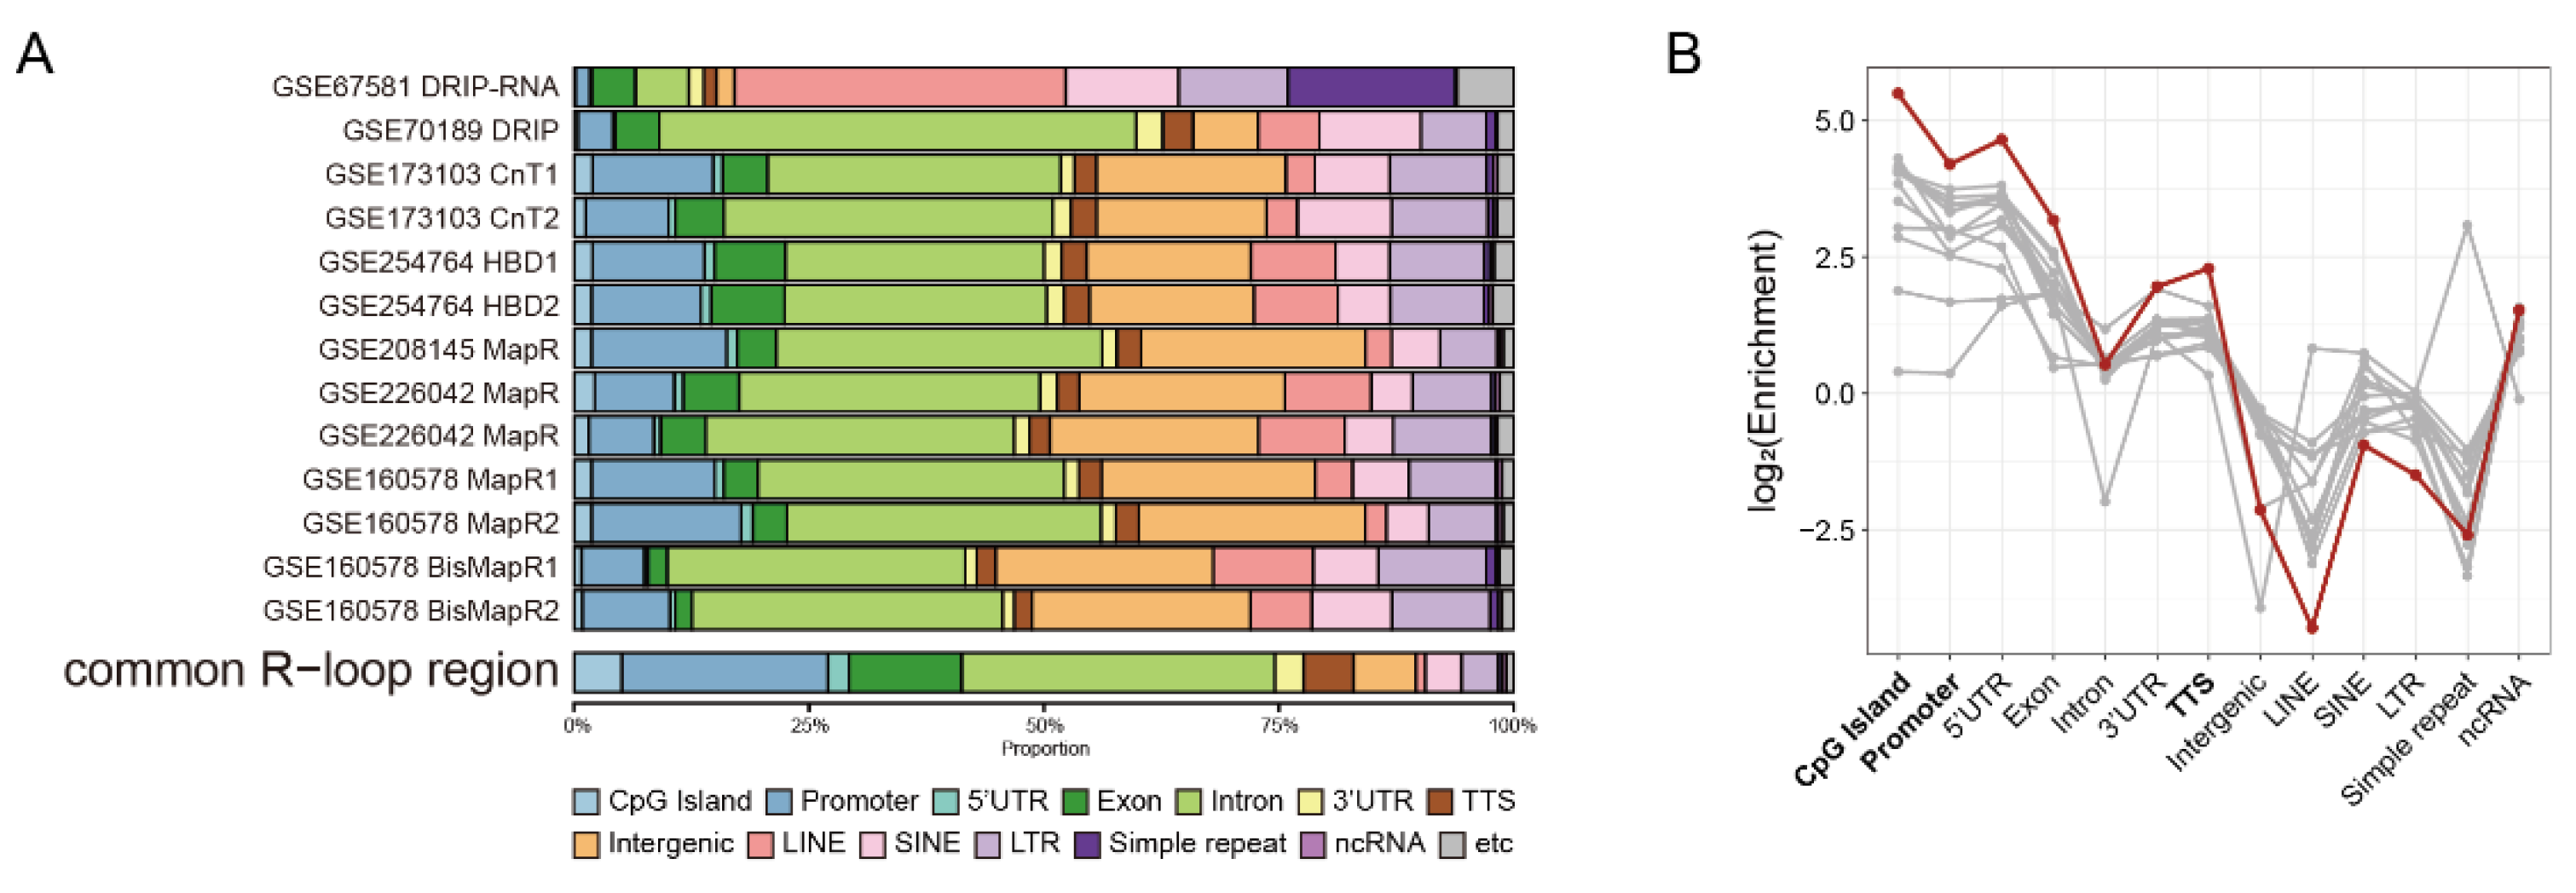
Figure 3.
Common R-loops are associated with highly expressed RNA-regulatory genes (A) Mean expression (log10 TMM-normalized CPM) versus coefficient of variation (CV) of 14,655 genes (gray dots). Genes associated with Common R-loops (n = 7,757) are densely distributed in high expression and low variability region (gradient dots). Representative pluripotency marker (Pou5f1, Sox2, and Nanog) are indicated. TMM, trimmed mean of M-values; CPM, count per million. (B) Top 10 GOBP for Common R-loop-associated genes. (C) Semantic similarity–based network clustering of 166 enriched GOBP. The largest cluster consists predominantly of RNA-related processes, while other clusters include pathways related to essential cellular processes.
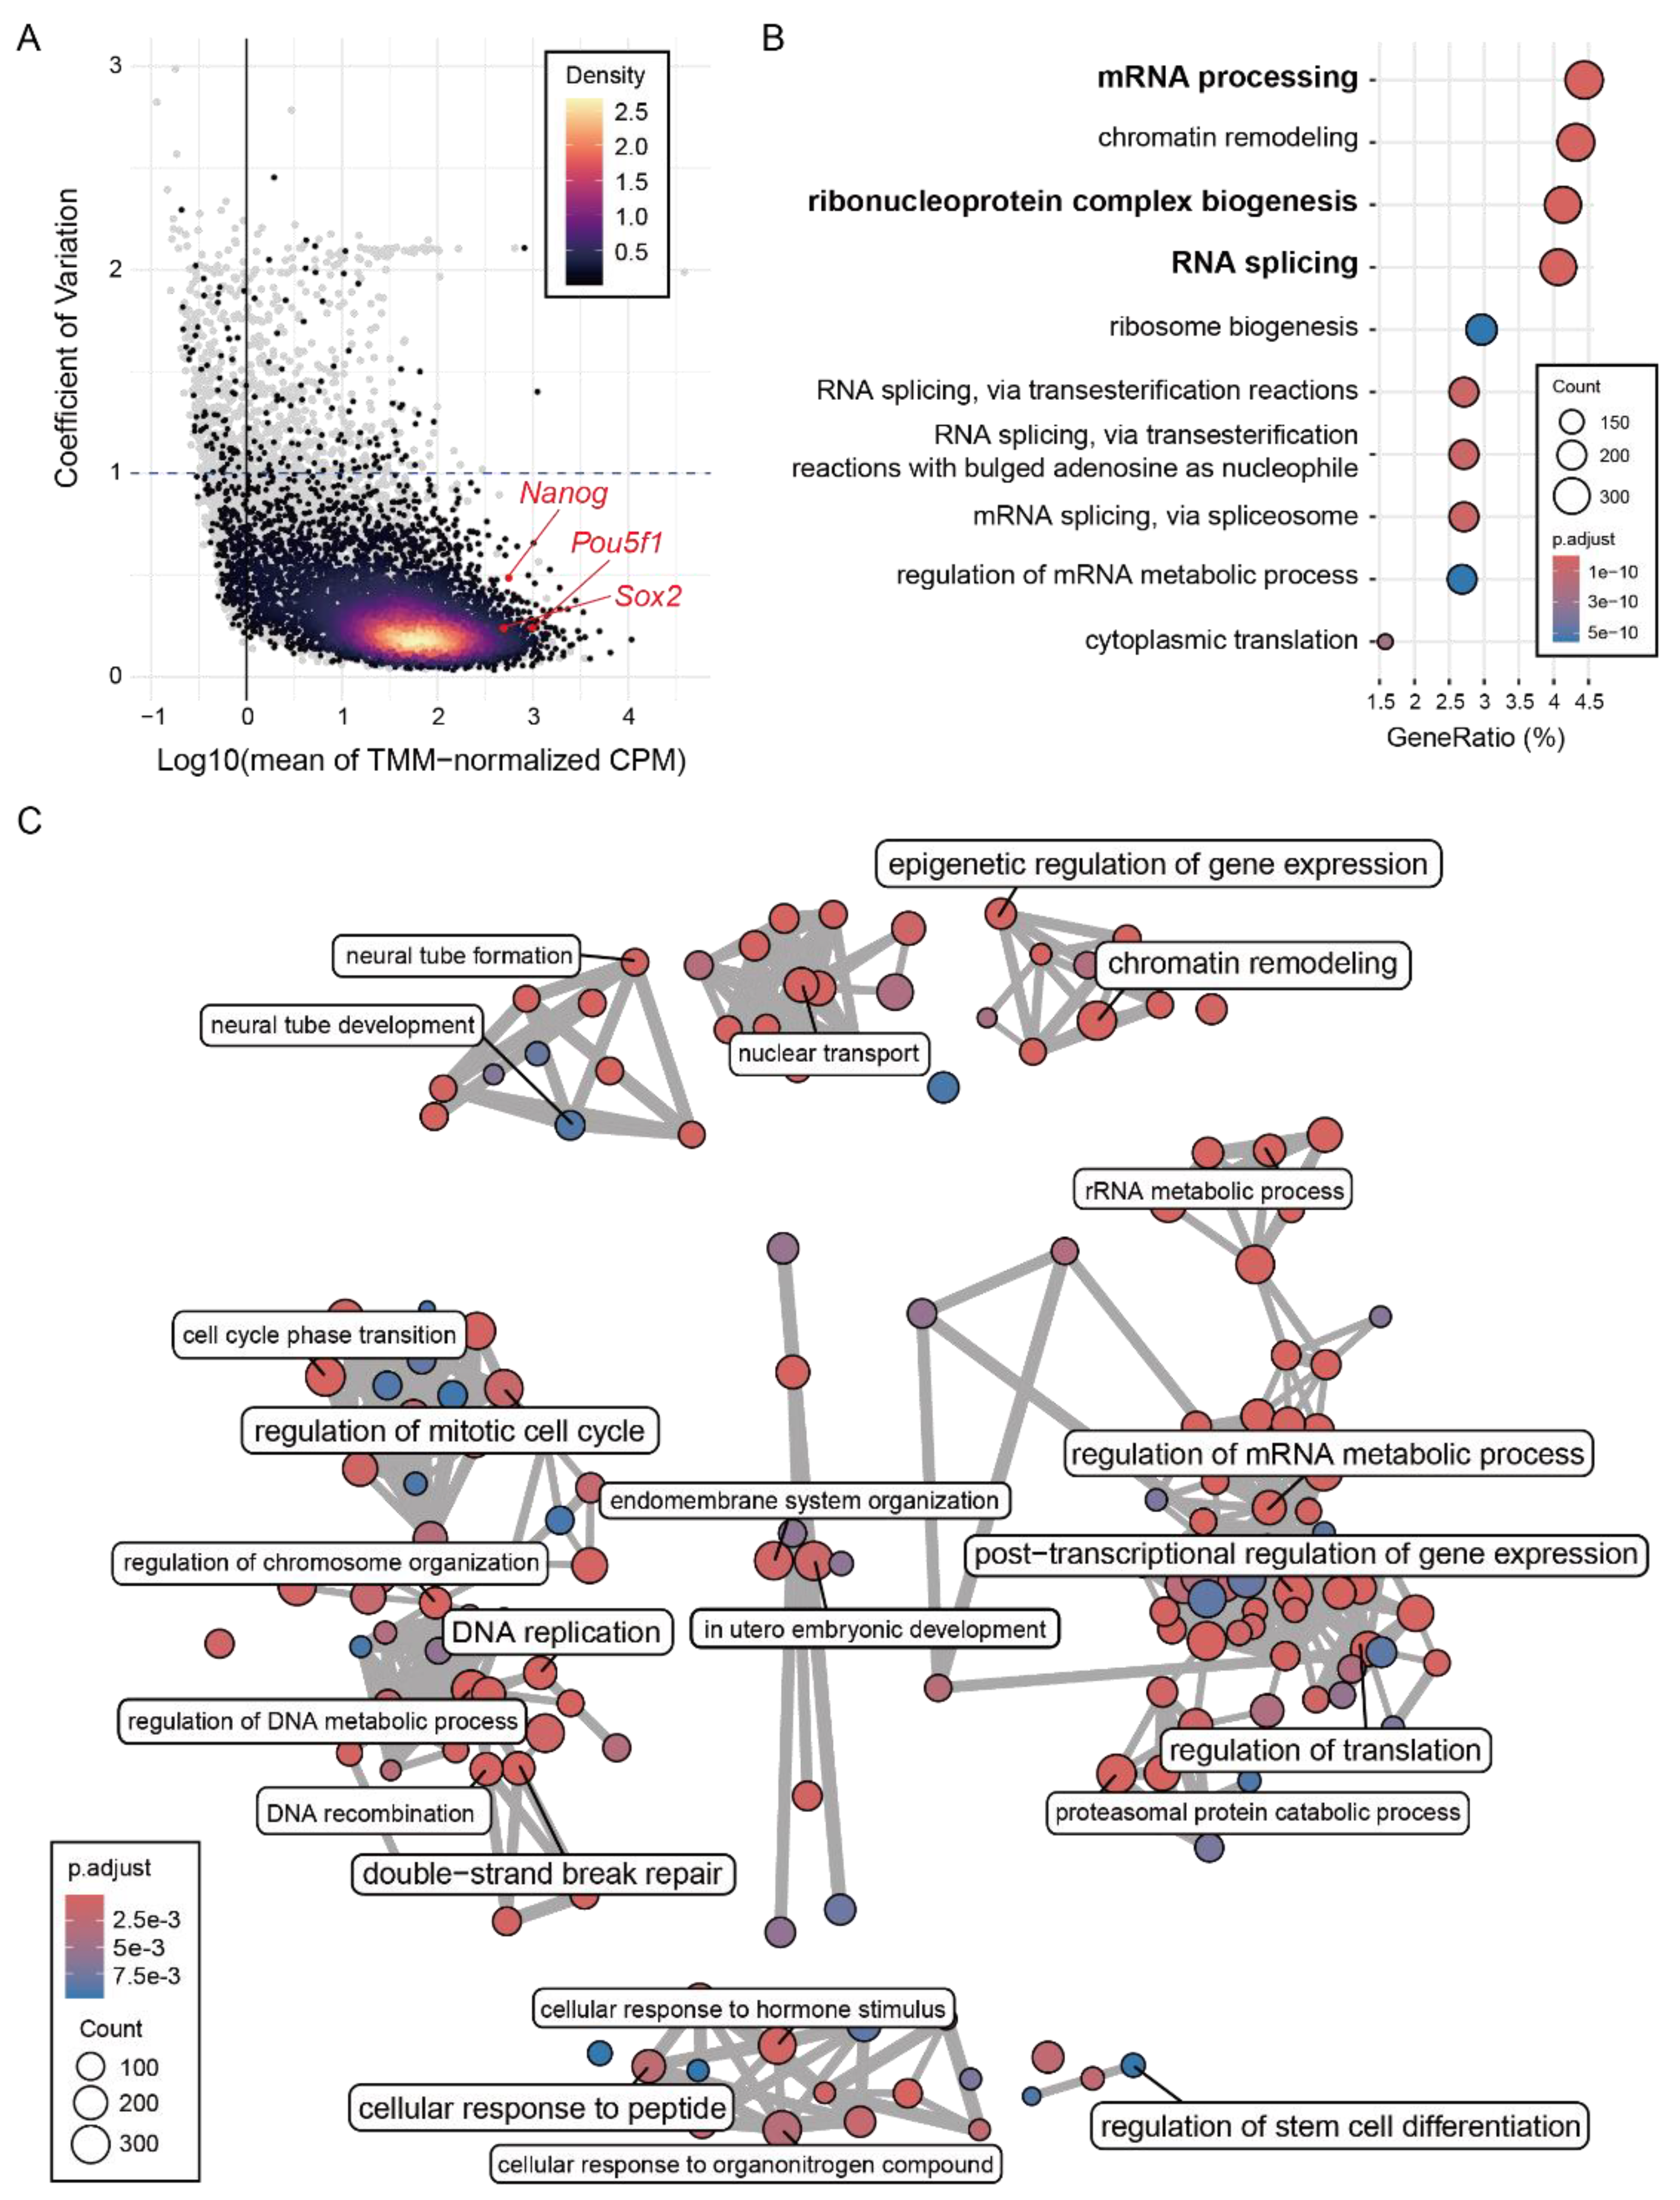
Figure 4.
Chromatin state and sequence features define the landscape of Common R-loops. (A) The 38 significantly enriched chromatin states of Common R-loop regions. TSS, transcription start site; PromF, promoter flank; BivProm, bivalent promoter; TxEx, transcription and exon; Tx, transcription; TxEnh, transcribed enhancer; EnhWk, weak enhancer; EnhA, active enhancer; OpenC, open chromatin; ReprPC openC, polycomb repressed open chromatin; ZNF, zinc finger genes; GapArtf, assembly gaps and artifacts. (B) Log2-transformed enrichment (R-loop/background) of mean GC skew across the chromatin states. (C) Log2-transformed enrichment of predicted G4 structures across the chromatin states. Each lines represent results from three distinct prediction methods: G4Boost (red triangle), G4Hunter (green circle), and quadparser (blue square).
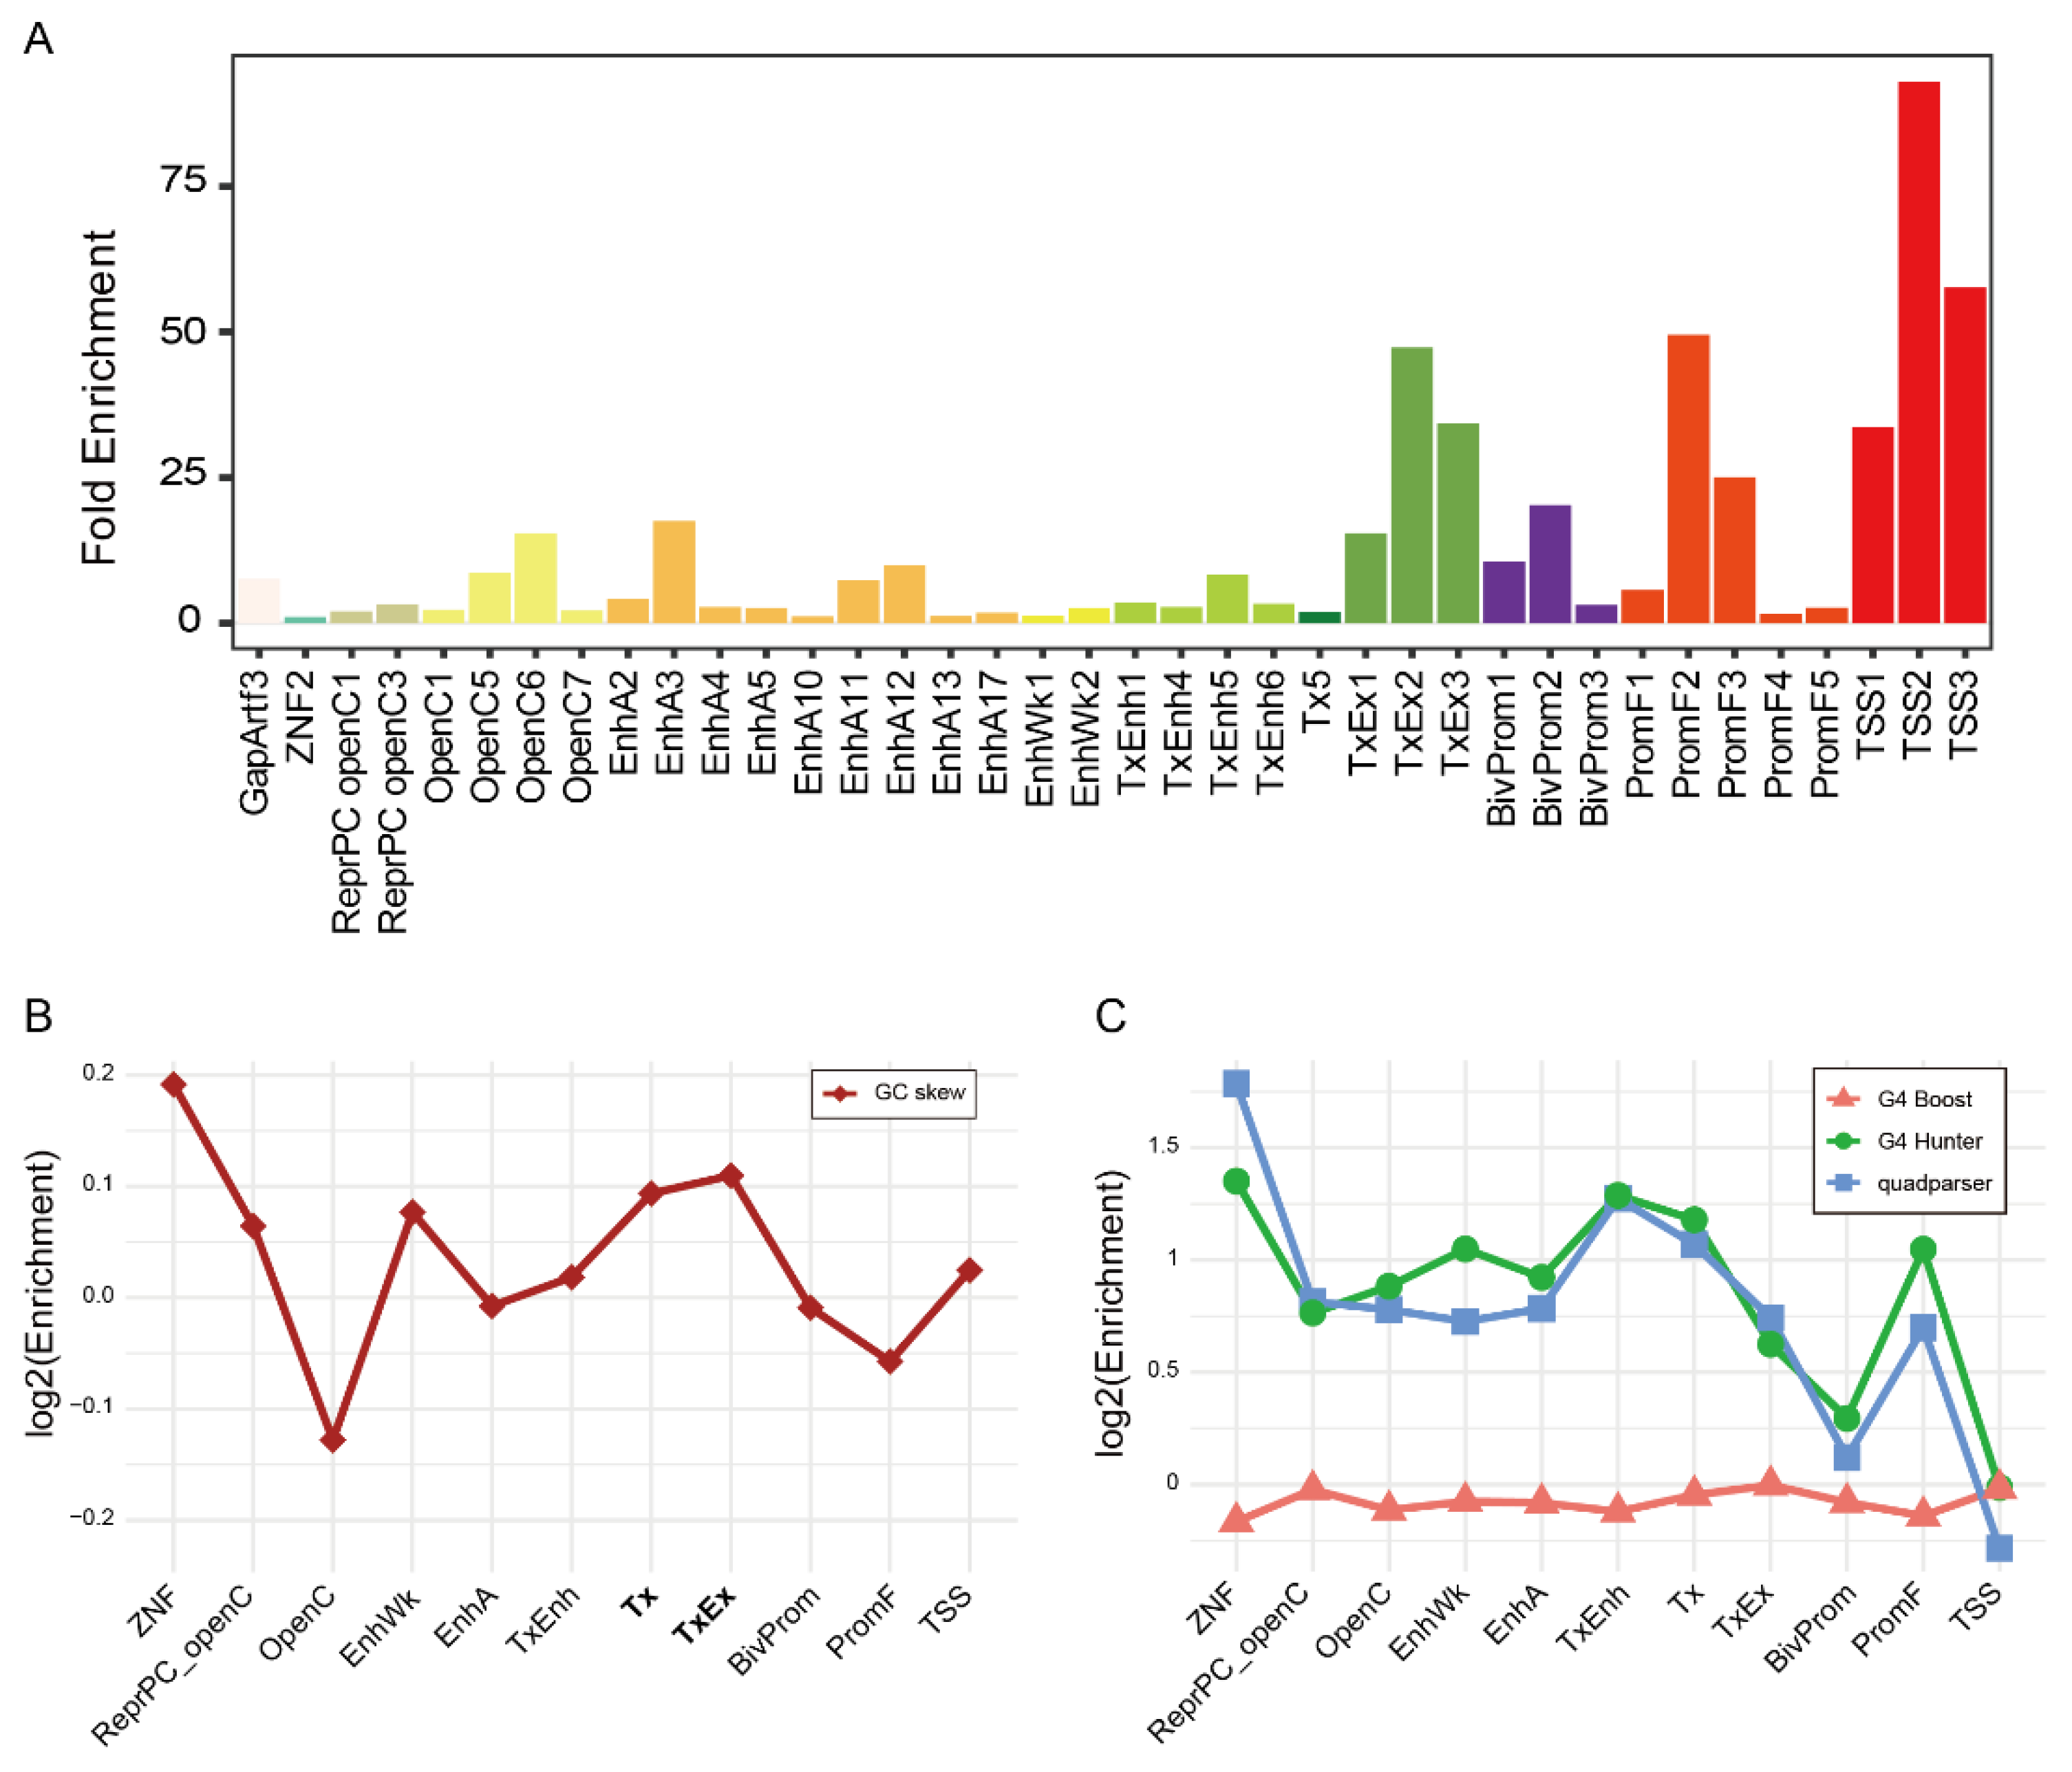
Figure 5.
Chromatin state-specific transcription factor motif patterns reveal regulatory landscape of Common R-loop regions. (A) Heatmap of transcription factor (TF) motif family enrichment across the chromatin states. (B) Consensus sequences and statistical enrichment values of representative motifs, which correspond to the motif highlighted by black boxes in (A). (C) Distance distribution of transcription factor motif loci relative to TSS. (D-F) GOBP enrichment of genes proximal to R-loop regions containing (D) OSTN, (E) CTCF, or (F) YY1 motifs.
Disclaimer/Publisher’s Note: The statements, opinions and data contained in all publications are solely those of the individual author(s) and contributor(s) and not of MDPI and/or the editor(s). MDPI and/or the editor(s) disclaim responsibility for any injury to people or property resulting from any ideas, methods, instructions or products referred to in the content. |
© 2026 by the authors. Licensee MDPI, Basel, Switzerland. This article is an open access article distributed under the terms and conditions of the Creative Commons Attribution (CC BY) license.
Copyright: This open access article is published under a Creative Commons CC BY 4.0 license, which permit the free download, distribution, and reuse, provided that the author and preprint are cited in any reuse.


